UNITED STATES
SECURITIES AND EXCHANGE COMMISSION
Washington, D.C. 20549
CERTIFIED SHAREHOLDER REPORT OF REGISTERED MANAGEMENT INVESTMENT COMPANIES
| | |
| Investment Company Act file number: | | 811-04024 |
| |
| Exact name of registrant as specified in charter: | | Prudential Investment Portfolios 6 |
| |
| Address of principal executive offices: | | 655 Broad Street, 6 th Floor |
| | Newark, New Jersey 07102 |
| |
| Name and address of agent for service: | | Andrew R. French |
| | 655 Broad Street, 6 th Floor |
| | Newark, New Jersey 07102 |
| |
| Registrant’s telephone number, including area code: | | |
| |
| Date of fiscal year end: | | 8/31/2024 |
| |
| Date of reporting period: | | 8/31/ 2024 |
Item 1 – Reports to Stockholders
| | (a) | Report transmitted to stockholders pursuant to Rule 30e-1 under the Act (17 CFR 270.30e-1). |
PGIM California Muni Income Fund
ANNUAL SHAREHOLDER REPORT – August 31,
2024
This annual shareholder report contains important information about the Class A shares of PGIM California Muni Income Fund (the “Fund”) for
the period of September 1, 2023 to August 31, 2024.
You can find additional information about the Fund at
pgim.com/investments/mutual-funds/prospectuses-fact-sheets
. You can also request
this information by contacting us at (800) 225-1852 or (973) 367-3529 from outside the US.
WHAT WERE THE FUND COSTS FOR THE LAST YEAR?
(Based on a hypothetical $10,000 investment)
| Costs of a $10,000 investment | Costs paid as a percentage of a $10,000 investment |
PGIM California Muni Income Fund—Class A | | |
WHAT AFFECTED THE FUND’S PERFORMANCE DURING THE
REPORTING
PERIOD?
■
During the reporting period, the US Federal Reserve held policy rates steady. Meanwhile,
issuance
picked up in the first half of 2024, due to
deferred maintenance and stabilizing project costs amid slowing inflation, moderating economic data, and upcoming elections. Despite
downgraded outlooks for California, strong fundamentals (e.g., healthy tax collections, robust rainy-day funds, and upgrades that outpaced
downgrades) provided a positive backdrop for demand, and spreads tightened.
■
The following contributed most to the Fund’s performance relative to the Index during the period: a significant overweight to the long end of the
yield curve (despite front-end rates rallying more than long-end rates and the portfolio’s yield curve flattener positioning); an underweight to San
Francisco airports subordinated credits; and overweight positioning in housing bonds, particularly Freddie Mac multifamily deals. (A yield curve
is a line graph that illustrates the relationship between the yields and maturities of fixed income securities. It is created by plotting the yields of
different maturities for the same type of bonds. A yield curve flattener is an interest rate environment in which long-term rates are decreasing
more quickly than short-term rates.)
■
The following detracted most from the Fund’s performance relative to the Index during the reporting period: duration positioning as municipal
bond rates rallied, and positioning in specific senior San Francisco airport bonds and special tax assessment bonds. (Duration measures the
sensitivity of the price—the value of principal—of a bond to a change in interest rates.)
■
The Fund uses derivatives when they facilitate implementation of the overall investment approach. During the reporting period, the Fund used
futures to help manage duration positioning and yield curve exposure. The Fund’s
positions
in futures contributed to performance during the
reporting period.
HOW HAS THE FUND PERFORMED OVER THE PAST 10 YEARS?
The Fund’s past performance is not a good predictor of the Fund’s future performance.
The returns do not reflect the deduction of
taxes that a shareholder would pay on Fund distributions or redemption of Fund shares.
Visit
pgim.com/investments/mutual-funds/prospectuses-fact-sheets
or call (800) 225-1852 or (973) 367-3529 from outside the US for more recent performance data.
The line graph reflects a hypothetical $10,000 investment in Class A shares and assumes that all recurring fees (including management fees)
were deducted and dividend and distributions were reinvested. Without waiver of fees and/or expense
reimbursements
, if any, the returns would
have been lower.
Cumulative Performance: August 31, 2014 to August 31, 2024 Initial Investment of $10,000 |
The line graph reflects the return on the Fund's Class A shares with sales charges.
Average Annual Total Returns as of 8/31/2024 |
| | | |
| Class A with sales charges | | | |
| Class A without sales charges | | | |
| Bloomberg California 1-15 Year Municipal Intermediate Index | | | |
Broad-Based Securities Market Index: Bloomberg Municipal Bond Index | | | |
The Fund’s total returns prior to April 1, 2020 as reflected in the line graph and the table are the returns of the Fund when it followed different investment strategies. The table
compares the Fund’s performance to the Bloomberg California 1-15 Year Municipal Intermediate Index, the Fund's benchmark. Since the Bloomberg California 1-15 Year Municipal
Intermediate Index inception date is October 31, 2016, the table also compares the Fund's performance to the Bloomberg Municipal Bond Index.
WHAT ARE SOME KEY FUND STATISTICS AS OF 8/31/2024?
| |
| |
Total advisory fees paid for the year | |
Portfolio turnover rate for the year | |
WHAT ARE SOME CHARACTERISTICS OF THE
FUND’S
HOLDINGS
AS OF 8/31/2024?
Credit Quality expressed as a percentage of total investments as of 8/31/2024 (%) |
| |
| |
| |
| |
| |
| |
| |
| |
Credit ratings reflect the highest rating assigned by a nationally recognized statistical rating organization (NRSRO) such as Moody’s Investors Service, Inc. (Moody’s), S&P Global
Ratings (S&P), or Fitch Ratings, Inc. (Fitch). Credit ratings reflect the common nomenclature used by both S&P and Fitch. Where applicable, ratings are converted to the comparable
S&P/Fitch rating tier nomenclature. The Not Rated category consists of securities that have not been rated by an NRSRO. Credit ratings are subject to change.
You can find additional information at
pgim.com/investments/mutual-funds/prospectuses-fact-sheets
or by scanning the QR code below,
including the Fund’s prospectus, financial information, fund holdings, and proxy voting information. You can also request this information by
contacting us at (800) 225-1852 or (973) 367-3529 from outside the US.
To receive your fund documents online, go to
pgim.com/investments/resource/edelivery
and enroll.
PGIM California Muni Income Fund
PGIM California Muni Income Fund
ANNUAL SHAREHOLDER REPORT – August 31, 2024
This annual shareholder report contains important information about the Class C shares of PGIM California Muni Income Fund (the “Fund”) for
the period of September 1, 2023 to August 31, 2024.
You can find additional information about the Fund at
pgim.com/investments/mutual-funds/prospectuses-fact-sheets
. You can also request
this information by contacting us at (800) 225-1852 or (973) 367-3529 from outside the US.
WHAT WERE THE FUND COSTS FOR THE LAST YEAR?
(Based on a hypothetical $10,000 investment)
| Costs of a $10,000 investment | Costs paid as a percentage of a $10,000 investment |
PGIM California Muni Income Fund—Class C | | |
WHAT AFFECTED THE FUND’S PERFORMANCE DURING THE REPORTING PERIOD?
■
During the reporting period, the US Federal Reserve held policy rates steady. Meanwhile, issuance picked up in the first half of 2024, due to
deferred maintenance and stabilizing project costs amid slowing inflation, moderating economic data, and upcoming elections. Despite
downgraded outlooks for California, strong fundamentals (e.g., healthy tax collections, robust rainy-day funds, and upgrades that outpaced
downgrades) provided a positive backdrop for demand, and spreads tightened.
■
The following contributed most to the Fund’s performance relative to the Index during the period: a significant overweight to the long end of the
yield curve (despite front-end rates rallying more than long-end rates and the portfolio’s yield curve flattener positioning); an underweight to San
Francisco airports subordinated credits; and overweight positioning in housing bonds, particularly Freddie Mac multifamily deals. (A yield curve
is a line graph that illustrates the relationship between the yields and maturities of fixed income securities. It is created by plotting the yields of
different maturities for the same type of bonds. A yield curve flattener is an interest rate environment in which long-term rates are decreasing
more quickly than short-term rates.)
■
The following detracted most from the Fund’s performance relative to the Index during the reporting period: duration positioning as municipal
bond rates rallied, and positioning in specific senior San Francisco airport bonds and special tax assessment bonds. (
Duration
measures the
sensitivity of the price—the value of principal—of a bond to a change in interest rates.)
■
The Fund uses derivatives when they facilitate implementation of the overall investment approach. During the reporting period, the Fund used
futures to help manage duration positioning and yield curve exposure. The Fund’s positions in futures contributed to performance during the
reporting period.
HOW HAS THE FUND PERFORMED OVER THE PAST 10 YEARS?
The Fund’s past performance is not a good predictor of the Fund’s future performance.
The returns do not reflect the deduction of
taxes that a shareholder would pay on Fund distributions or redemption of Fund shares.
Visit
pgim.com/investments/mutual-funds/prospectuses-fact-sheets
or call (800) 225-1852 or (973) 367-3529 from outside the US for more recent performance data.
The line graph reflects a hypothetical $10,000 investment in Class C shares and assumes that all recurring fees (including management fees)
were deducted and dividend and distributions were reinvested. Without waiver of fees and/or expense reimbursements, if any, the returns would
have been lower.
Cumulative Performance: August 31, 2014 to August 31, 2024 Initial Investment of $10,000 |
Average Annual Total Returns as of 8/31/2024 |
| | | |
Class C with sales charges | | | |
Class C without sales charges | | | |
Bloomberg California 1-15 Year Municipal Intermediate Index | | | |
Broad-Based Securities Market Index: Bloomberg Municipal Bond Index | | | |
The Fund’s total returns prior to April 1, 2020 as reflected in the line graph and the table are the returns of the Fund when it followed different investment strategies. The table
compares the Fund’s performance to the Bloomberg California 1-15 Year Municipal Intermediate Index, the Fund's benchmark. Since the Bloomberg California 1-15 Year Municipal
Intermediate Index inception date is October 31, 2016, the table also compares the Fund's performance to the Bloomberg Municipal Bond Index.
WHAT ARE SOME KEY FUND STATISTICS AS OF 8/31/2024?
| |
| |
Total advisory fees paid for the year | |
Portfolio turnover rate for the year | |
WHAT ARE SOME CHARACTERISTICS OF THE FUND’S HOLDINGS AS OF 8/31/2024?
Credit Quality expressed as a percentage of total investments as of 8/31/2024 (%) |
| |
| |
| |
| |
| |
| |
| |
| |
Credit ratings reflect the highest rating assigned by a nationally recognized statistical rating organization (NRSRO) such as Moody’s Investors Service, Inc. (Moody’s), S&P Global
Ratings (S&P), or Fitch Ratings, Inc. (Fitch). Credit ratings reflect the common nomenclature used by both S&P and Fitch. Where applicable, ratings are converted to the comparable
S&P/Fitch rating tier nomenclature. The Not Rated category consists of securities that have not been rated by an NRSRO. Credit ratings are subject to change.
You can find additional information at
pgim.com/investments/mutual-funds/prospectuses-fact-sheets
or by scanning the QR code below,
including the Fund’s prospectus, financial information, fund holdings, and proxy voting information. You can also request this information by
contacting us at (800) 225-1852 or (973) 367-3529 from outside the US.
To receive your fund documents online, go to
pgim.com/investments/resource/edelivery
and enroll.
PGIM California Muni Income Fund
PGIM California Muni Income Fund
ANNUAL SHAREHOLDER REPORT – August 31, 2024
This annual shareholder report contains important information about the Class Z shares of PGIM California Muni Income Fund (the “Fund”) for
the period of September 1, 2023 to August 31, 2024.
You can find additional information about the Fund at
pgim.com/investments/mutual-funds/prospectuses-fact-sheets
. You can also request
this information by contacting us at (800) 225-1852 or (973) 367-3529 from outside the US.
WHAT WERE THE FUND COSTS FOR THE LAST YEAR?
(Based on a hypothetical $10,000 investment)
| Costs of a $10,000 investment | Costs paid as a percentage of a $10,000 investment |
PGIM California Muni Income Fund—Class Z | | |
WHAT AFFECTED THE FUND’S PERFORMANCE DURING THE REPORTING PERIOD?
■
During the reporting period, the US Federal Reserve held policy rates steady. Meanwhile, issuance picked up in the first half of 2024, due to
deferred maintenance and stabilizing project costs amid slowing inflation, moderating economic data, and upcoming elections. Despite
downgraded outlooks for California, strong fundamentals (e.g., healthy tax collections, robust rainy-day funds, and upgrades that outpaced
downgrades) provided a positive backdrop for demand, and spreads tightened.
■
The following contributed most to the Fund’s performance relative to the Index during the period: a significant overweight to the long end of the
yield curve (despite front-end rates rallying more than long-end rates and the portfolio’s yield curve flattener positioning); an underweight to San
Francisco airports subordinated credits; and overweight positioning in housing bonds, particularly Freddie Mac multifamily deals. (A yield curve
is a line graph that illustrates the relationship between the yields and maturities of fixed income securities. It is created by plotting the yields of
different maturities for the same type of bonds. A yield curve flattener is an interest rate environment in which long-term rates are decreasing
more quickly than short-term rates.)
■
The following detracted most from the Fund’s performance relative to the Index during the reporting
period
: duration positioning as municipal
bond rates rallied, and positioning in specific senior San Francisco airport bonds and special tax assessment bonds. (Duration measures the
sensitivity of the price—the value of principal—of a bond to a change in interest rates.)
■
The Fund uses derivatives when they facilitate implementation of the overall investment approach. During the reporting period, the Fund used
futures to help manage duration positioning and yield curve exposure. The Fund’s positions in futures contributed to performance during the
reporting period.
HOW HAS THE FUND PERFORMED OVER THE PAST 10 YEARS?
The Fund’s past performance is not a good predictor of the Fund’s future performance.
The returns do not reflect the deduction of
taxes that a shareholder would pay on Fund distributions or redemption of Fund shares.
Visit
pgim.com/investments/mutual-funds/prospectuses-fact-sheets
or call (800) 225-1852 or (973) 367-3529 from outside the US for more recent performance data.
The line graph reflects a hypothetical $10,000 investment in Class Z shares and assumes that all recurring fees (including management fees)
were deducted and dividend and distributions were reinvested. Without waiver of fees and/or expense reimbursements, if any, the returns would
have been lower.
Cumulative Performance: August 31, 2014 to August 31, 2024 Initial Investment of $10,000 |
Average Annual Total Returns as of 8/31/2024 |
| | | |
| | | |
Bloomberg California 1-15 Year Municipal Intermediate Index | | | |
Broad-Based Securities Market Index: Bloomberg Municipal Bond Index | | | |
The Fund’s total returns prior to April 1, 2020 as reflected in the line graph and the table are the returns of the Fund when it followed different investment strategies. The table
compares the Fund’s performance to the Bloomberg California 1-15 Year Municipal Intermediate Index, the Fund's benchmark. Since the Bloomberg California 1-15 Year Municipal
Intermediate Index inception date is October 31, 2016, the table also compares the Fund's performance to the Bloomberg Municipal Bond Index.
WHAT ARE SOME KEY FUND STATISTICS AS OF 8/31/2024?
| |
| |
Total advisory fees paid for the year | |
Portfolio turnover rate for the year | |
WHAT ARE SOME CHARACTERISTICS OF THE FUND’S HOLDINGS AS OF 8/31/2024?
Credit Quality expressed as a percentage of total investments as of 8/31/2024 (%) |
| |
| |
| |
| |
| |
| |
| |
| |
Credit ratings reflect the highest rating assigned by a nationally recognized statistical rating organization (NRSRO) such as Moody’s Investors Service, Inc. (Moody’s), S&P Global
Ratings (S&P), or Fitch Ratings, Inc. (Fitch). Credit ratings reflect the common nomenclature used by both S&P and Fitch. Where applicable, ratings are converted to the comparable
S&P/Fitch rating tier nomenclature. The Not Rated category consists of securities that have not been rated by an NRSRO. Credit ratings are subject to change.
You can find additional information at
pgim.com/investments/mutual-funds/prospectuses-fact-sheets
or by scanning the QR code below,
including the Fund’s prospectus, financial information, fund holdings, and proxy voting information. You can also request this information by
contacting us at (800) 225-1852 or (973) 367-3529 from outside the US.
To receive your fund documents online, go to
pgim.com/investments/resource/edelivery
and enroll.
PGIM California Muni Income Fund
PGIM California Muni Income Fund
ANNUAL SHAREHOLDER REPORT – August 31, 2024
This annual shareholder report contains important information about the Class R6 shares of PGIM California Muni Income Fund (the “Fund”) for
the period of September 1, 2023 to August 31, 2024.
You can find additional information about the Fund at
pgim.com/investments/mutual-funds/prospectuses-fact-sheets
. You can also request
this information by contacting us at (800) 225-1852 or (973) 367-3529 from outside the US.
WHAT WERE THE FUND COSTS FOR THE LAST YEAR?
(Based on a hypothetical $10,000 investment)
| Costs of a $10,000 investment | Costs paid as a percentage of a $10,000 investment |
PGIM California Muni Income Fund—Class R6 | | |
WHAT AFFECTED THE FUND’S PERFORMANCE DURING THE REPORTING PERIOD?
■
During the reporting period, the US Federal Reserve held policy rates steady. Meanwhile, issuance picked up in the first half of 2024, due to
deferred maintenance and stabilizing project costs amid slowing inflation, moderating economic data, and upcoming elections. Despite
downgraded outlooks for California, strong fundamentals (e.g., healthy tax collections, robust rainy-day funds, and upgrades that outpaced
downgrades) provided a positive backdrop for demand, and spreads tightened.
■
The following contributed most to the Fund’s performance relative to the Index during the period: a significant overweight to the long end of the
yield curve (despite front-end rates rallying more than long-end rates and the portfolio’s yield
curve
flattener positioning); an underweight to San
Francisco airports subordinated credits; and overweight positioning in housing bonds, particularly Freddie Mac multifamily deals. (A yield curve
is a line graph that illustrates the relationship between the yields and maturities of fixed income securities. It is created by plotting the yields of
different maturities for the same type of bonds. A yield curve flattener is an interest rate environment in which long-term rates are decreasing
more quickly than short-term rates.)
■
The following detracted most from the Fund’s performance relative to the Index during the reporting period: duration positioning as municipal
bond rates rallied, and positioning in specific senior San Francisco airport bonds and special tax assessment bonds. (Duration measures the
sensitivity of the price—the value of principal—of a bond to a change in interest rates.)
■
The Fund uses derivatives when they facilitate implementation of the overall investment approach. During the reporting period, the Fund used
futures to help manage duration positioning and yield curve exposure. The Fund’s positions in futures contributed to performance during the
reporting period.
HOW HAS THE FUND PERFORMED OVER THE PAST 10 YEARS?
The Fund’s past performance is not a good predictor of the Fund’s future performance.
The returns do not reflect the deduction of
taxes that a shareholder would pay on Fund distributions or redemption of Fund shares.
Visit
pgim.com/investments/mutual-funds/prospectuses-fact-sheets
or call (800) 225-1852 or (973) 367-3529 from outside the US for more recent performance data.
The line graph reflects a hypothetical $10,000 investment in Class R6 shares and assumes that all recurring fees (including management fees)
were deducted and dividend and distributions were reinvested. Without waiver of fees and/or expense reimbursements, if any, the returns would
have been lower.
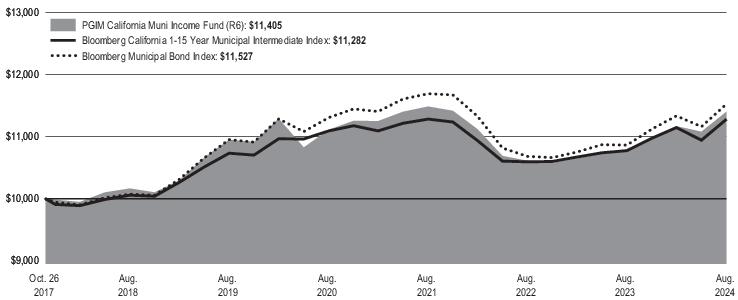
Cumulative Performance: October 26, 2017 to August 31, 2024 Initial Investment of $10,000 |
Average Annual Total Returns as of 8/31/2024 |
| | | |
| | | |
Bloomberg California 1-15 Year Municipal Intermediate Index | | | |
Broad-Based Securities Market Index: Bloomberg Municipal Bond | | | |
The Fund’s total returns prior to April 1, 2020 as reflected in the line graph and the table are the returns of the Fund when it followed different investment strategies.
Since Inception returns are provided for the share class since it has less than 10 fiscal years of returns. Since Inception returns for the Index are measured from the closest
month-end to the class’s inception date.
WHAT ARE SOME KEY FUND STATISTICS AS OF 8/31/2024?
| |
| |
Total advisory fees paid for the year | |
Portfolio turnover rate for the year | |
WHAT ARE SOME CHARACTERISTICS OF THE FUND’S HOLDINGS AS OF 8/31/2024?
Credit Quality expressed as a percentage of total investments as of 8/31/2024 (%) |
| |
| |
| |
| |
| |
| |
| |
| |
Credit ratings reflect the highest rating assigned by a nationally recognized statistical rating organization (NRSRO) such as Moody’s Investors Service, Inc. (Moody’s), S&P Global
Ratings (S&P), or Fitch Ratings, Inc. (Fitch). Credit ratings reflect the common nomenclature used by both S&P and Fitch. Where applicable, ratings are converted to the comparable
S&P/Fitch rating tier nomenclature. The Not Rated category consists of securities that have not been rated by an NRSRO. Credit ratings are subject to change.
You can find additional information at
pgim.com/investments/mutual-funds/prospectuses-fact-sheets
or by scanning the QR code below,
including the Fund’s prospectus, financial information, fund holdings, and proxy voting information. You can also request this information by
contacting us at (800) 225-1852 or (973) 367-3529 from outside the US.
To receive your fund documents online, go to
pgim.com/investments/resource/edelivery
and enroll.
PGIM California Muni Income Fund
| | (b) | Copy of each notice transmitted to stockholders in reliance on Rule 30e-3 under the Act (17 CFR 270.30e-3) that contains disclosures specified by paragraph (c)(3) of that rule – Not applicable. |
| Item 2 – | Code of Ethics – See Exhibit (a) |
As of the end of the period covered by this report, the registrant has adopted a code of ethics (the “Section 406 Standards for Investment Companies – Ethical Standards for Principal Executive and Financial Officers”) that applies to the registrant’s Principal Executive Officer, Principal Financial Officer and Principal Accounting Officer.
The registrant hereby undertakes to provide any person, without charge, upon request, a copy of the code of ethics. To request a copy of the code of ethics, contact the registrant 800-225-1852, and ask for a copy of the Section 406 Standards for Investment Companies - Ethical Standards for Principal Executive and Financial Officers.
| Item 3 – | Audit Committee Financial Expert – |
The registrant’s Board has determined that Ms. Grace C. Torres, member of the Board’s Audit Committee is an “audit committee financial expert,” and that she is “independent,” for purposes of this item.
| Item 4 – | Principal Accountant Fees and Services – |
For the fiscal years ended August 31, 2024 and August 31, 2023, PricewaterhouseCoopers LLP (“PwC”), the Registrant’s principal accountant, billed the Registrant $41,499 and $39,150, respectively, for professional services rendered for the audit of the Registrant’s annual financial statements or services that are normally provided in connection with statutory and regulatory filings.
For the fiscal years ended August 31, 2024 and August 31, 2023: none.
For the fiscal years ended August 31, 2024 and August 31, 2023: none.
For the fiscal years ended August 31, 2024 and August 31, 2023: none.
| | (e) | (1) Audit Committee Pre-Approval Policies and Procedures |
THE PGIM MUTUAL FUNDS
AUDIT COMMITTEE POLICY
on
Pre-Approval of Services Provided by the Independent
Accountants
The Audit Committee of each PGIM Mutual Fund is charged with the responsibility to monitor the independence of the Fund’s independent accountants. As part of this responsibility, the Audit Committee must pre-approve the independent accounting firm’s engagement to render audit and/or permissible non-audit services, as required by law. In evaluating a proposed engagement of the independent accountants, the Audit Committee will assess the effect that the engagement might reasonably be expected to have on the accountant’s independence. The Committee’s evaluation will be based on:
| | • | | a review of the nature of the professional services expected to be provided, |
| | • | | a review of the safeguards put into place by the accounting firm to safeguard independence, and |
| | • | | periodic meetings with the accounting firm. |
Policy for Audit and Non-Audit Services Provided to the Funds
On an annual basis, the scope of audits for each Fund, audit fees and expenses, and audit-related and non-audit services (and fees proposed in respect thereof) proposed to be performed by the Fund’s independent accountants will be presented by the Treasurer and the independent accountants to the Audit Committee for review and, as appropriate, approval prior to the initiation of such services.
Such presentation shall be accompanied by confirmation by both the Treasurer and the independent accountants that the proposed non-audit services will not adversely affect the independence of the independent accountants. Such proposed non-audit services shall be described in sufficient detail to enable the Audit Committee to assess the appropriateness of such services and fees, and the compatibility of the provision of such services with the auditor’s independence. The Committee shall receive periodic reports on the progress of the audit and other services which are approved by the Committee or by the Committee Chair pursuant to authority delegated in this Policy.
The categories of services enumerated under “Audit Services”, “Audit-related Services”, and “Tax Services” are intended to provide guidance to the Treasurer and the independent accountants as to those categories of services which the Committee believes are generally consistent with the independence of the independent accountants and which the Committee (or the Committee Chair) would expect upon the presentation of specific proposals to pre-approve. The enumerated categories are not intended as an exclusive list of audit, audit-related or tax services, which the Committee (or the Committee Chair) would consider for pre-approval.
Audit Services
The following categories of audit services are considered to be consistent with the role of the Fund’s independent accountants:
| | • | | Annual Fund financial statement audits |
| | • | | Seed audits (related to new product filings, as required) |
| | • | | SEC and regulatory filings and consents |
Audit-related Services
The following categories of audit-related services are considered to be consistent with the role of the Fund’s independent accountants:
| | • | | Accounting consultations |
| | • | | Fund merger support services |
| | • | | Agreed Upon Procedure Reports |
| | • | | Other Internal Control Reports |
| | |
Individual audit-related services that fall within one of these categories (except for fund merger support services) and are not presented to the Audit Committee as part of the annual pre-approval process are subject to an authorized pre-approval by the Audit Committee so long as the estimated fee for those services does not exceed $30,000. Any services provided under such pre-approval will be reported to the Audit Committee at its next regular meeting. Should the amount of such services exceed $30,000 any additional fees will be subject to pre-approval by the Committee Chair (or any other Committee member on whom this responsibility has been delegated). Fees related to fund merger support services are subject to a separate authorized pre-approval by the Audit Committee with fees determined on a per occurrence and merger complexity basis. | | |
Tax Services
The following categories of tax services are considered to be consistent with the role of the Fund’s independent accountants:
| | • | | Tax compliance services related to the filing or amendment of the following: |
| | • | | Federal, state and local income tax compliance; and, |
| | • | | Sales and use tax compliance |
| | • | | Timely RIC qualification reviews |
| | • | | Tax distribution analysis and planning |
| | • | | Tax authority examination services |
| | • | | Tax appeals support services |
| | • | | Accounting methods studies |
| | • | | Fund merger support services |
| | • | | Tax consulting services and related projects |
Individual tax services that fall within one of these categories and are not presented to the Audit Committee as part of the annual pre-approval process are subject to an authorized pre-approval by the Audit Committee so long as the estimated fee for those services does not exceed $30,000. Any services provided under such pre-approval will be reported to the Audit Committee at its next regular meeting. Should the amount of such services exceed $30,000 any additional fees will be subject to pre-approval by the Committee Chair (or any other Committee member on whom this responsibility has been delegated).
Other Non-Audit Services
Certain non-audit services that the independent accountants are legally permitted to render will be subject to pre-approval by the Committee or by one or more Committee members to whom the Committee has delegated this authority and who will report to the full Committee any pre-approval decisions made pursuant to this Policy. Non-audit services presented for pre-approval pursuant to this paragraph will be accompanied by a confirmation from both the Treasurer and the independent accountants that the proposed services will not adversely affect the independence of the independent accountants.
Proscribed Services
The Fund’s independent accountants will not render services in the following categories of non-audit services:
| | • | | Bookkeeping or other services related to the accounting records or financial statements of the Fund |
| | • | | Financial information systems design and implementation |
| | • | | Appraisal or valuation services, fairness opinions, or contribution-in-kind reports |
| | • | | Internal audit outsourcing services |
| | • | | Management functions or human resources |
| | • | | Broker or dealer, investment adviser, or investment banking services |
| | • | | Legal services and expert services unrelated to the audit |
| | • | | Any other service that the Public Company Accounting Oversight Board determines, by regulation, is impermissible. |
Pre-approval of Non-Audit Services Provided to Other Entities Within the PGIM Fund Complex
Certain non-audit services provided to PGIM Investments LLC or any of its affiliates that also provide ongoing services to the PGIM Mutual Funds will be subject to pre-approval by the Audit Committee. The only non-audit services provided to these entities that will require pre-approval are those related directly to the operations and financial reporting of the Funds. Individual projects that are not presented to the Audit Committee as part of the annual pre-approval process will be subject to pre-approval by the Committee Chair (or any other Committee member on whom this responsibility has been delegated) so long as the estimated fee for those services does not exceed $30,000. Services presented for pre-approval pursuant to this paragraph will be accompanied by a confirmation from both the Treasurer and the independent accountants that the proposed services will not adversely affect the independence of the independent accountants.
Although the Audit Committee will not pre-approve all services provided to PGIM Investments LLC and its affiliates, the Committee will receive an annual report from the Fund’s independent accounting firm showing the aggregate fees for all services provided to PGIM Investments and its affiliates.
(e) (2) Percentage of services described in each of paragraphs (b) through (d) of this Item that were approved by the audit committee pursuant to paragraph (c)(7)(i)(C) of Rule 2-01 of Regulation S-X –
| | | | | | | | | | | | |
| | | | | | Fiscal Year Ended August 31, 2024 | | | | Fiscal Year Ended August 31, 2023 | | |
| | 4(b) | | | | Not applicable. | | | | Not applicable. | | |
| | 4(c) | | | | Not applicable. | | | | Not applicable. | | |
| | 4(d) | | | | Not applicable. | | | | Not applicable. | | |
(f) Percentage of hours expended attributable to work performed by other than full time employees of principal accountant if greater than 50%.
The percentage of hours expended on the principal accountant’s engagement to audit the registrant’s financial statements for the most recent fiscal year that were attributed to work performed by persons other than the principal accountant’s full-time, permanent employees was 0%.
(g) Non-Audit Fees
The aggregate non-audit fees billed by the Registrant’s principal accountant for services rendered to the registrant’s investment adviser and any entity controlling, controlled by, or under common control with the investment adviser that provides ongoing services to the registrant for the fiscal years ended August 31, 2024 and August 31, 2023 was $0 and $0, respectively.
(h) Principal Accountant’s Independence
Not applicable as the Registrant’s principal accountant has not provided non-audit services to the registrant’s investment adviser and any entity controlling, controlled by, or under common control with the investment adviser that provides ongoing services to the registrant that were not pre-approved pursuant to Rule 2-01(c)(7)(ii) of Regulation S-X.
(i) Not applicable.
(j) Not applicable.
| Item 5 – | Audit Committee of Listed Registrants – Not applicable. |
| Item 6 – | Investments – The registrant’s Schedule of Investments is included in the financial statements filed under Item 7 of this Form. |
Items 7 – 11 (Refer to Report below)

PRUDENTIAL INVESTMENT PORTFOLIOS 6
PGIM California Muni Income Fund
FINANCIAL STATEMENTS AND OTHER INFORMATION
AUGUST 31, 2024

| | | | |
| Table of Contents | | Financial Statements and Other Information | | August 31, 2024 |
Form N-CSR Item 7 - Financial Statements and Financial Highlights for Open-End Management Investment Companies.
Schedule of Investments
as of August 31, 2024
| | | | | | | | | | | | |
| | | | |
| Description | | Interest Rate | | Maturity Date | | Principal Amount (000)# | | | Value | |
| | | | |
LONG-TERM INVESTMENTS 97.4% | | | | | | | | | | | | |
| | | | |
MUNICIPAL BONDS | | | | | | | | | | | | |
Alameda Corridor Trans. Auth. Rev.,
Sr. Lien, Series A, AGM | | 5.000% | | 10/01/43 | | | 1,000 | | | $ | 1,126,008 | |
Anaheim Pub. Fing. Auth. Rev., | | | | | | | | | | | | |
Cap. Apprec., Pub. Impts. Proj., Sub. Series C, AGM, ETM(ee) | | 3.226(t) | | 09/01/36 | | | 1,500 | | | | 1,021,608 | |
Bay Area Toll Auth. Rev., | | | | | | | | | | | | |
San Francisco Bay Area, Series B, Rfdg. (Mandatory put date 04/01/25) | | 2.850(cc) | | 04/01/47 | | | 1,000 | | | | 998,141 | |
Series A, Rfdg. (Mandatory put date 04/01/28) | | 2.000(cc) | | 04/01/56 | | | 750 | | | | 717,739 | |
Beaumont Unif. Sch. Dist., | | | | | | | | | | | | |
Cap. Apprec., Election 2008, Series C, GO, AGM | | 3.898(t) | | 08/01/40 | | | 2,365 | | | | 1,279,214 | |
California Cmnty. Choice Fing. Auth. Rev., | | | | | | | | | | | | |
Green Bond, Clean Energy Proj., Series A (Mandatory put date 12/01/27) | | 4.000(cc) | | 10/01/52 | | | 2,500 | | | | 2,543,465 | |
Green Bond, Clean Energy Proj., Series B-1 (Mandatory put date 08/01/29) | | 5.000(cc) | | 07/01/53 | | | 1,000 | | | | 1,062,308 | |
Green Bond, Series A-1 (Mandatory put date 08/01/28) | | 4.000(cc) | | 05/01/53 | | | 1,905 | | | | 1,929,187 | |
Green Bond, Series B-1 (Mandatory put date 08/01/31) | | 4.000(cc) | | 02/01/52 | | | 3,825 | | | | 3,885,973 | |
Green Bond, Series B-2 (Mandatory put date 08/01/31) | | 3.370(cc) | | 02/01/52 | | | 1,120 | | | | 1,049,305 | |
Green Bonds, Series C | | 5.000 | | 10/01/24 | | | 500 | | | | 500,368 | |
Green Bonds, Series D (Mandatory put date 11/01/28) | | 5.500(cc) | | 05/01/54 | | | 2,150 | | | | 2,315,469 | |
Sustainable Bonds, Clean Energy Proj., Series E-1 (Mandatory put date 03/01/31) | | 5.000(cc) | | 02/01/54 | | | 1,000 | | | | 1,077,619 | |
Sustainable Bonds, Clean Energy Proj., Series G-1 (Mandatory put date 04/01/30) | | 5.250(cc) | | 11/01/54 | | | 2,000 | | | | 2,167,356 | |
California Cnty. Tob. Secur. Agcy. Rev., | | | | | | | | | | | | |
Sonoma Cnty. Secur. Corp., Series A, Rfdg. | | 5.000 | | 06/01/28 | | | 635 | | | | 679,533 | |
Sr. Series A, Rfdg. | | 5.000 | | 06/01/25 | | | 875 | | | | 888,252 | |
Sr. Series A, Rfdg. | | 5.000 | | 06/01/26 | | | 1,220 | | | | 1,263,688 | |
Sr. Series A, Rfdg. | | 5.000 | | 06/01/29 | | | 1,475 | | | | 1,608,958 | |
Sr. Series A, Rfdg. | | 5.000 | | 06/01/31 | | | 1,885 | | | | 2,079,979 | |
California Edl. Facs. Auth. Rev., | | | | | | | | | | | | |
Pepperdine Univ., Rfdg. (Pre-refunded date 04/01/26)(ee) | | 5.000 | | 10/01/49 | | | 2,085 | | | | 2,168,655 | |
California Enterprise Dev. Auth. Rev., | | | | | | | | | | | | |
Pomona Properties LLC Proj., Series A, Rfdg. | | 5.000 | | 01/15/39 | | | 650 | | | | 712,268 | |
Pomona Properties LLC Proj., Series A, Rfdg. | | 5.000 | | 01/15/45 | | | 1,000 | | | | 1,059,959 | |
Riverside Cnty., Mead Valley Wellness Vlg. Proj., | | | | | | | | | | | | |
Series B | | 5.500 | | 11/01/59 | | | 1,000 | | | | 1,052,709 | |
California Hlth. Facs. Fing. Auth. Rev., | | | | | | | | | | | | |
Adventist Hlth. Sys. West, Series A | | 5.250 | | 12/01/42 | | | 1,000 | | | | 1,107,358 | |
Cedars Sinai Med. Ctr., Rfdg. | | 5.000 | | 11/15/25 | | | 1,565 | | | | 1,614,748 | |
Cedars Sinai Med. Ctr., Rfdg. | | 5.000 | | 11/15/33 | | | 1,115 | | | | 1,143,042 | |
Cedars Sinai Med. Ctr., Series A | | 5.000 | | 08/15/25 | | | 535 | | | | 548,431 | |
Children’s Hosp. of Orange Cnty., Series B (Mandatory put date 05/01/31) | | 5.000(cc) | | 11/01/54 | | | 1,500 | | | | 1,706,664 | |
See Notes to Financial Statements.
PGIM California Muni Income Fund 1
Schedule of Investments (continued)
as of August 31, 2024
| | | | | | | | | | | | |
| | | | |
| Description | | Interest Rate | | Maturity Date | | Principal Amount (000)# | | | Value | |
| | | | |
MUNICIPAL BONDS (Continued) | | | | | | | | | | | | |
California Hlth. Facs. Fing. Auth. Rev., (cont’d.) | | | | | | | | | | | | |
Commonspirit Hlth., Series A, Rfdg. | | 5.000% | | 04/01/32 | | | 2,275 | | | $ | 2,499,047 | |
Initial Entrance Fees, Series A | | 3.850 | | 11/15/27 | | | 500 | | | | 505,077 | |
Kaiser Permanente, Series C (Mandatory put date 11/01/29) | | 5.000(cc) | | 06/01/41 | | | 4,365 | | | | 4,857,139 | |
Lucile Salter Packard Chil, Rfdg. | | 5.000 | | 05/15/25 | | | 1,000 | | | | 1,015,436 | |
Providence Hlth. Svcs., Series A, Rfdg. | | 5.000 | | 10/01/27 | | | 330 | | | | 330,418 | |
Rfdg. (Pre-refunded date 10/01/25)(ee) | | 5.000(cc) | | 10/01/39 | | | 1,225 | | | | 1,258,309 | |
Stanford Healthcare, Series A, Rfdg. | | 5.000 | | 11/15/24 | | | 2,140 | | | | 2,150,887 | |
Stanford Healthcare, Series A, Rfdg. (Mandatory put date 08/15/25) | | 3.000(cc) | | 08/15/54 | | | 3,150 | | | | 3,158,180 | |
Sutter Hlth., Series A | | 5.000 | | 11/15/30 | | | 500 | | | | 533,568 | |
Sutter Hlth., Series A | | 5.000 | | 11/15/36 | | | 2,085 | | | | 2,200,299 | |
Sutter Hlth., Series A, Rfdg. | | 5.000 | | 11/15/35 | | | 885 | | | | 935,925 | |
California Hsg. Fin. Agcy. Rev., | | | | | | | | | | | | |
Shoreview Apts., Series T | | 3.750 | | 07/01/34 | | | 1,000 | | | | 1,008,166 | |
Sustainable Bond, All Hallows Apts., Series U | | 3.650 | | 09/01/34 | | | 1,000 | | | | 1,003,844 | |
Sustainable Bond, LA Salle Apts., Series V | | 3.650 | | 09/01/34 | | | 1,000 | | | | 1,004,251 | |
California Infrast. & Econ. Dev. Bank Rev., | | | | | | | | | | | | |
Academy of Motion Picture Arts & Sciences Oblig., Series A, Rfdg. | | 4.000 | | 11/01/41 | | | 1,000 | | | | 1,034,210 | |
Sustainability Bonds, Calif. Academy of Sciences, Series A, Rfdg. | | 3.250 | | 08/01/29 | | | 2,000 | | | | 2,011,432 | |
California Muni. Fin. Auth. Rev., | | | | | | | | | | | | |
American Heritage Ed., Series A, Rfdg. | | 4.000 | | 06/01/26 | | | 270 | | | | 269,329 | |
Catalyst Impact Fund Hsg. Bonds, Class I, 144A | | 6.000 | | 01/01/39 | | | 1,000 | | | | 1,082,990 | |
CHF-Davis I, LLC, West Vlg. Student Hsg. Proj., BAM, TCRs | | 5.000 | | 05/15/29 | | | 760 | | | | 816,520 | |
Green Bond, Orchard Park Student Hsg. Proj., BAM | | 4.000 | | 05/15/46 | | | 1,045 | | | | 1,029,886 | |
Humangood Calif. Oblig. Grp. | | 4.000 | | 10/01/46 | | | 1,000 | | | | 961,956 | |
Humangood Calif. Oblig. Grp. | | 4.000 | | 10/01/49 | | | 1,000 | | | | 941,387 | |
Orange Cnty. Civic Ctr. Infrast. Program Phase 2 | | 5.000 | | 06/01/43 | | | 1,500 | | | | 1,582,971 | |
South Central Los Angeles Regl. Ctr. Proj., Rfdg. | | 4.000 | | 12/01/43 | | | 300 | | | | 297,786 | |
Sr. Lien, Linxs Apm Proj., Series A, P3 Proj., AMT | | 5.000 | | 12/31/25 | | | 285 | | | | 289,170 | |
Sr. Lien, Linxs Apm Proj., Series A, P3 Proj., AMT | | 5.000 | | 06/30/26 | | | 1,385 | | | | 1,410,029 | |
Sr. Lien, Linxs Apm Proj., Series A, P3 Proj., AMT | | 5.000 | | 06/30/31 | | | 320 | | | | 330,965 | |
St. Ignatius Clg. Prep. Sch., Series A | | 5.000 | | 09/01/49 | | | 1,000 | | | | 1,095,591 | |
Temps, 85 Aldersly Proj., Series B-1 | | 4.000 | | 11/15/28 | | | 595 | | | | 595,873 | |
Temps, St. Mary’s Sch., Aliso Viejo, Series B | | 4.650 | | 05/01/30 | | | 1,045 | | | | 1,061,074 | |
UCR North Dist. Phase 1 Student Hsg. Proj., BAM | | 5.000 | | 05/15/27 | | | 750 | | | | 789,883 | |
United Airlines, Inc. Proj., AMT | | 4.000 | | 07/15/29 | | | 2,000 | | | | 2,002,545 | |
Waste Mgmt. Inc. Proj., Rmkt., AMT (Mandatory put date 12/02/24)(hh) | | 3.950(cc) | | 10/01/45 | | | 1,000 | | | | 999,950 | |
California Poll. Ctrl. Fing. Auth. Wtr. Facs. Rev., | | | | | | | | | | | | |
American Wtr. Cap. Corp. Proj., Series 2020, Rmkt., Rfdg. (Mandatory put date 09/01/28) | | 3.700(cc) | | 08/01/40 | | | 1,000 | | | | 1,024,223 | |
Green Bond, Calplant I Proj., AMT, 144A^ | | 7.000 | | 07/01/22(d) | | | 250 | | | | 40,000 | |
Green Bond, Calplant I Proj., AMT, 144A^ | | 8.000 | | 07/01/39(d) | | | 500 | | | | 80,000 | |
California Pub. Fin. Auth. Rev., | | | | | | | | | | | | |
PIH Hlth., Series A, Rfdg. | | 5.000 | | 06/01/25 | | | 875 | | | | 888,179 | |
PIH Hlth., Series A, Rfdg. | | 5.000 | | 06/01/26 | | | 500 | | | | 517,950 | |
California Sch. Fin. Auth. Rev., | | | | | | | | | | | | |
Alliance CLG-Ready Pub. Schs., Series A, 144A | | 5.000 | | 07/01/45 | | | 1,000 | | | | 1,006,101 | |
Alliance CLG-Ready Pub. Schs., Series A, Rfdg., 144A | | 4.000 | | 07/01/26 | | | 300 | | | | 301,784 | |
Green Dot Pub. Sch. Proj., Series A, 144A | | 4.000 | | 08/01/25 | | | 150 | | | | 150,429 | |
See Notes to Financial Statements.
2
| | | | | | | | | | | | |
| | | | |
| Description | | Interest Rate | | Maturity Date | | Principal Amount (000)# | | | Value | |
| | | | |
MUNICIPAL BONDS (Continued) | | | | | | | | | | | | |
California Sch. Fin. Auth. Rev., (cont’d.) | | | | | | | | | | | | |
Green Dot Pub. Sch. Proj., Series A, 144A | | 5.000% | | 08/01/45 | | | 685 | | | $ | 689,227 | |
Green Dot Pub. Schs. Calif. Proj., Series A, Rfdg., 144A | | 5.000 | | 08/01/32 | | | 650 | | | | 686,503 | |
KIPP Socal Pub. Schs., Series A, 144A | | 5.000 | | 07/01/39 | | | 1,000 | | | | 1,044,667 | |
KIPP Socal Pub. Schs., Series A, 144A | | 5.000 | | 07/01/49 | | | 1,500 | | | | 1,532,968 | |
Vista Charter Schs., Series A, 144A | | 4.000 | | 06/01/51 | | | 2,000 | | | | 1,692,922 | |
California St., | | | | | | | | | | | | |
Bid Grp. C, GO | | 4.000 | | 09/01/25 | | | 1,500 | | | | 1,520,789 | |
GO, Rfdg. | | 3.250 | | 04/01/45 | | | 1,000 | | | | 850,251 | |
GO, Rfdg. | | 4.000 | | 09/01/26 | | | 1,500 | | | | 1,543,005 | |
GO, Rfdg. | | 4.000 | | 09/01/34 | | | 1,000 | | | | 1,094,852 | |
GO, Rfdg. | | 5.000 | | 03/01/26 | | | 1,000 | | | | 1,010,410 | |
GO, Rfdg. | | 5.000 | | 11/01/26 | | | 2,075 | | | | 2,182,615 | |
GO, Rfdg. | | 5.000 | | 08/01/28 | | | 2,425 | | | | 2,577,906 | |
GO, Rfdg. | | 5.000 | | 09/01/28 | | | 2,005 | | | | 2,191,183 | |
GO, Rfdg. | | 5.000 | | 04/01/33 | | | 1,000 | | | | 1,094,014 | |
GO, Rfdg.(hh) | | 5.000 | | 08/01/34 | | | 500 | | | | 590,553 | |
GO, Rfdg.(hh) | | 5.000 | | 08/01/39 | | | 1,750 | | | | 2,022,537 | |
GO, Rfdg. | | 5.000 | | 10/01/42 | | | 1,000 | | | | 1,120,198 | |
GO, Rfdg. | | 5.000 | | 09/01/44 | | | 1,905 | | | | 2,152,345 | |
GO, Rfdg. | | 5.000 | | 08/01/46 | | | 2,000 | | | | 2,047,327 | |
GO, Rfdg., AGM | | 5.250 | | 08/01/32 | | | 1,500 | | | | 1,740,227 | |
Unrefunded Balance, GO, Rfdg. | | 5.500 | | 04/01/30 | | | 5 | | | | 5,009 | |
Var. Purp., GO | | 3.000 | | 03/01/28 | | | 2,000 | | | | 2,030,964 | |
Var. Purp., GO, Rfdg. | | 4.000 | | 09/01/34 | | | 1,580 | | | | 1,594,168 | |
Var. Purp., GO, Rfdg., BAM, TCRs | | 5.000 | | 09/01/35 | | | 1,000 | | | | 1,037,705 | |
California St. Pub. Wks. Brd. Lease Rev., | | | | | | | | | | | | |
May Lee St. Off. Complex, Series A | | 5.000 | | 04/01/34 | | | 800 | | | | 949,892 | |
Off. Emerg. Svcs., Series F, Rfdg. | | 5.000 | | 04/01/25 | | | 175 | | | | 177,453 | |
California Statewide Cmntys. Dev. Auth. Rev., | | | | | | | | | | | | |
899 Charleston Proj., Series A, Rfdg., 144A | | 5.250 | | 11/01/44 | | | 250 | | | | 241,668 | |
CHF Irvine LLC, Rfdg. | | 5.000 | | 05/15/27 | | | 685 | | | | 702,612 | |
CHF Irvine LLC, Rfdg. | | 5.000 | | 05/15/28 | | | 2,000 | | | | 2,050,340 | |
John Muir Hlth., Series A, Rfdg. | | 5.250 | | 12/01/42 | | | 1,250 | | | | 1,421,338 | |
Loma Linda Univ. Med. Ctr. Series A, Rfdg. | | 5.500 | | 12/01/54 | | | 1,585 | | | | 1,589,326 | |
Odd Fellows Home of Cali. Proj., Series A, Rfdg. | | 4.000 | | 04/01/43 | | | 1,000 | | | | 1,014,566 | |
Southern Calif. Edison Co., Series B, Rmkt., Rfdg. | | 1.450 | | 04/01/28 | | | 2,000 | | | | 1,826,040 | |
Southern Calif. Edison Co., Series D, Rmkt., Rfdg. | | 4.500 | | 11/01/33 | | | 1,100 | | | | 1,184,720 | |
Coast Cmnty. Clg. Dist.,
CABS, GO, Rfdg. (Pre-refunded date 08/15/25)(ee) | | 2.477(t) | | 08/01/35 | | | 1,600 | | | | 1,012,320 | |
Fontana,
Spl. Tax, Cmnty. Facs. Dist. No. 22 Sierra Hills, Rfdg. | | 5.000 | | 09/01/34 | | | 500 | | | | 503,348 | |
Freddie Mac Multifamily Cert. Rev.,
Series ML-18, Class XCA | | 1.506(cc) | | 09/25/37 | | | 9,841 | | | | 1,039,910 | |
Freddie Mac Multifamily Variable Rate Cert. Rev., | | | | | | | | | | | | |
Sustainability Bonds, Series ML-13, Class XCA | | 0.962(cc) | | 07/25/36 | | | 16,446 | | | | 888,247 | |
Golden St. Tob. Secur. Corp. Rev., | | | | | | | | | | | | |
Tob. Settlement Asset-Backed Bonds, Series A-1, Rfdg. | | 5.000 | | 06/01/51 | | | 1,100 | | | | 1,141,943 | |
Guam Govt. Waterworks Auth. Rev.,
Series A, Rfdg. | | 5.000 | | 07/01/43 | | | 650 | | | | 705,981 | |
Irvine Unif. Sch. Dist.,
Spl. Tax, Series A | | 4.000 | | 09/01/28 | | | 745 | | | | 786,527 | |
See Notes to Financial Statements.
PGIM California Muni Income Fund 3
Schedule of Investments (continued)
as of August 31, 2024
| | | | | | | | | | | | |
| | | | |
| Description | | Interest Rate | | Maturity Date | | Principal Amount (000)# | | | Value | |
| | | | |
MUNICIPAL BONDS (Continued) | | | | | | | | | | | | |
Jurupa Pub. Fing. Auth., | | | | | | | | | | | | |
Spl. Tax, Series A, Rfdg. | | 5.000% | | 09/01/42 | | | 1,250 | | | $ | 1,250,000 | |
Lincoln Pub. Fing. Auth., | | | | | | | | | | | | |
Twelve Bridges, Tax Alloc., Sub. Series B, Rfdg. | | 6.000 | | 09/02/27 | | | 528 | | | | 529,241 | |
Long Beach Bond Fin. Auth. Nat. Gas Pur. Rev., | | | | | | | | | | | | |
Series A | | 5.000 | | 11/15/35 | | | 2,725 | | | | 3,022,804 | |
Series A | | 5.500 | | 11/15/30 | | | 1,475 | | | | 1,631,975 | |
Series A | | 5.500 | | 11/15/32 | | | 440 | | | | 496,548 | |
Los Angeles Calif. Dept. Arpts. Rev., | | | | | | | | | | | | |
Series B, Rfdg., AMT | | 5.000 | | 05/15/31 | | | 1,080 | | | | 1,147,147 | |
Series D, AMT | | 5.000 | | 05/15/26 | | | 1,100 | | | | 1,111,931 | |
Sr. Bonds, Private Activity, Series H, Rfdg., AMT | | 5.000 | | 05/15/29 | | | 1,000 | | | | 1,086,067 | |
Sub. Series A, Rfdg., AMT | | 4.000 | | 05/15/44 | | | 1,000 | | | | 964,974 | |
Sub-P3. Proj., Series A, Rfdg., AMT | | 5.000 | | 05/15/28 | | | 1,250 | | | | 1,332,891 | |
Unrefunded, Sub. Series D, Rfdg., AMT | | 5.000 | | 05/15/35 | | | 1,530 | | | | 1,658,509 | |
Los Angeles Cnty. Rev., | | | | | | | | | | | | |
TRANS | | 5.000 | | 06/30/25 | | | 2,000 | | | | 2,039,322 | |
Los Angeles Dept. Arpts. Rev., | | | | | | | | | | | | |
Series A, AMT | | 5.250 | | 05/15/48 | | | 1,000 | | | | 1,033,881 | |
Los Angeles Dept. of Wtr. & Pwr. Rev., | | | | | | | | | | | | |
Series D | | 5.250 | | 07/01/54 | | | 1,000 | | | | 1,132,837 | |
Los Angeles Dept. of Wtr. & Pwr. Wtr. Sys. Rev., | | | | | | | | | | | | |
Series B, Rfdg. | | 5.000 | | 07/01/43 | | | 1,115 | | | | 1,184,545 | |
Los Angeles Rev., | | | | | | | | | | | | |
TRANS | | 5.000 | | 06/26/25 | | | 3,000 | | | | 3,058,012 | |
Los Angeles Unif. Sch. Dist., | | | | | | | | | | | | |
Series A, GO, Rfdg. | | 5.000 | | 07/01/25 | | | 2,410 | | | | 2,461,437 | |
Series A, GO, Rfdg. | | 5.000 | | 07/01/34 | | | 1,000 | | | | 1,205,774 | |
Metro. Wtr. Dist. of Southern Calif. Rev., | | | | | | | | | | | | |
Series B, Rfdg. | | 3.000 | | 07/01/28 | | | 2,000 | | | | 2,025,659 | |
M-S-R Energy Auth. Rev., | | | | | | | | | | | | |
Series A | | 6.500 | | 11/01/39 | | | 1,000 | | | | 1,292,753 | |
Northern Calif. Tob. Secur. Auth. Rev., | | | | | | | | | | | | |
Sr. Bonds Sacramento Co. Tob. Secur. Corp., Series A, Class 1, Rfdg. | | 5.000 | | 06/01/29 | | | 1,225 | | | | 1,335,863 | |
Sr. Bonds, Series A, Rfdg. | | 5.000 | | 06/01/28 | | | 1,500 | | | | 1,609,305 | |
Northern Calif. Transmn. Agy. Rev., | | | | | | | | | | | | |
Calif.- Oregon Proj., Series A, Rfdg. | | 5.000 | | 05/01/39 | | | 980 | | | | 1,009,385 | |
Orange Cnty. Cmnty. Facs. Dist., | | | | | | | | | | | | |
Spl. Tax, No. 2015-1 Esencia Vlg., Series A | | 5.250 | | 08/15/45 | | | 2,150 | | | | 2,160,787 | |
Spl. Tax, No. 2017-1 Esencia Vlg., Series A | | 5.000 | | 08/15/47 | | | 1,500 | | | | 1,526,647 | |
Orange Cnty. Trans. Auth. Rev., | | | | | | | | | | | | |
I-405 Impt. Proj., BANS, ETM(ee) | | 5.000 | | 10/15/24 | | | 3,175 | | | | 3,181,865 | |
Oxnard Union High Sch. Dist., | | | | | | | | | | | | |
Election 2018, Series C, GO | | 3.500 | | 08/01/45 | | | 1,250 | | | | 1,143,245 | |
Patterson Pub. Fing. Auth., | | | | | | | | | | | | |
Spl. Tax, Rfdg., AGM | | 5.000 | | 09/01/39 | | | 750 | | | | 841,924 | |
Pittsburg Successor Agy. Redev. Agy., | | | | | | | | | | | | |
Los Medanos Cmnty. Dev. Proj., Tax Alloc., AMBAC, CABS | | 2.927(t) | | 08/01/26 | | | 1,585 | | | | 1,499,014 | |
Tax Alloc., Sub. Series A, Rfdg., AGM | | 5.000 | | 09/01/29 | | | 1,750 | | | | 1,818,379 | |
See Notes to Financial Statements.
4
| | | | | | | | | | | | |
| | | | |
| Description | | Interest Rate | | Maturity Date | | Principal Amount (000)# | | | Value | |
| | | | |
MUNICIPAL BONDS (Continued) | | | | | | | | | | | | |
Port of Oakland Rev., | | | | | | | | | | | | |
Inter Lien, Series E, Rfdg. | | 5.000% | | 11/01/26 | | | 750 | | | $ | 789,054 | |
Intermediate Lien, Series H, Rfdg., AMT | | 5.000 | | 05/01/28 | | | 2,345 | | | | 2,495,131 | |
Intermediate Lien, Series H, Rfdg., AMT | | 5.000 | | 05/01/29 | | | 1,215 | | | | 1,306,456 | |
Intermediate Lien, Series H, Rfdg., AMT, ETM(ee) | | 5.000 | | 05/01/28 | | | 30 | | | | 31,970 | |
Intermediate Lien, Series H, Rfdg., AMT, ETM(ee) | | 5.000 | | 05/01/29 | | | 5 | | | | 5,403 | |
Poway Unif. Sch. Dist. Pub. Fing. Auth., | | | | | | | | | | | | |
Spl. Tax, Cmnty. Fasc. Dist. No. 14, Series A, Rfdg. | | 5.000 | | 09/01/35 | | | 1,000 | | | | 1,012,869 | |
Puerto Rico Ind. Tourist Edl. Med. & Envirml. Ctl. Facs. Fing. Auth. Rev., | | | | | | | | | | | | |
San Juan Cruise Terminal Proj., Series 2023, A-1, P3 Proj., AMT | | 6.750 | | 01/01/45 | | | 1,000 | | | | 1,187,771 | |
Puerto Rico Indl. Tourist Edl. Med. & Envirml. Ctl. Facs. Fing. Auth. Rev., | | | | | | | | | | | | |
Hosp. Auxilio Mutuo Oblig. Grp. Proj., Rfdg. | | 5.000 | | 07/01/32 | | | 2,100 | | | | 2,315,949 | |
Hosp. Auxilio Mutuo Oblig. Grp. Proj., Rfdg. | | 5.000 | | 07/01/33 | | | 1,335 | | | | 1,467,086 | |
Puerto Rico Sales Tax Fing. Corp. Sales Tax Rev., | | | | | | | | | | | | |
Restructured, Series A-1, CABS | | 3.899(t) | | 07/01/33 | | | 1,780 | | | | 1,265,375 | |
Series A-1, CABS | | 3.523(t) | | 07/01/27 | | | 2,645 | | | | 2,395,548 | |
Rancho Cucamonga Redev. Agy. Successor Agy., | | | | | | | | | | | | |
Rancho Redev. Proj. Area, Tax Alloc., Rfdg., AGM | | 5.000 | | 09/01/32 | | | 450 | | | | 450,611 | |
Riverside Cnty. Infrast. Fing. Auth. Rev., | | | | | | | | | | | | |
Series A, Rfdg. (Pre-refunded date 11/01/25)(ee) | | 4.000 | | 11/01/37 | | | 190 | | | | 193,411 | |
Riverside Cnty. Pub. Fing. Auth., | | | | | | | | | | | | |
Redev. Proj. Area No.1, Desert Cmntys., Tax Alloc., Series A, Rfdg. AGM | | 5.000 | | 10/01/34 | | | 1,000 | | | | 1,182,182 | |
Riverside Cnty. Pub. Fing. Auth. Rev., | | | | | | | | | | | | |
Cap. Facs. Proj. (Pre-refunded date 11/01/25)(ee) | | 5.250 | | 11/01/45 | | | 1,000 | | | | 1,032,212 | |
Riverside Cnty. Rev.,
TRANS | | 5.000 | | 06/30/25 | | | 2,000 | | | | 2,039,056 | |
Roseville, | | | | | | | | | | | | |
Spl. Tax, WestPark Cmnty. Facs. Dist. No. 1, Pub. Facs., Rfdg. | | 5.000 | | 09/01/28 | | | 300 | | | | 304,779 | |
Spl. Tax, WestPark Cmnty. Facs. Dist. No. 1, Pub. Facs., Rfdg. | | 5.000 | | 09/01/37 | | | 1,165 | | | | 1,178,002 | |
Sacramento Cnty., | | | | | | | | | | | | |
Spl. Tax, Cmnty. Facs. Dist. No. 2004-1, Mcclellan Park, Rfdg. | | 5.000 | | 09/01/40 | | | 1,085 | | | | 1,104,025 | |
San Diego Cnty. Regl. Arpt. Auth. Rev., | | | | | | | | | | | | |
Sub. Series B, AMT | | 5.000 | | 07/01/34 | | | 1,000 | | | | 1,080,509 | |
Sub. Series B, Rfdg., AMT | | 5.000 | | 07/01/28 | | | 1,000 | | | | 1,066,105 | |
Sub. Series B, Rfdg., AMT | | 5.000 | | 07/01/37 | | | 1,400 | | | | 1,478,672 | |
San Diego Pub. Facs. Fing. Auth. Rev., | | | | | | | | | | | | |
Cap. Impt. Projs., Series A | | 5.000 | | 10/15/44 | | | 1,000 | | | | 1,017,189 | |
San Diego Unif. Sch. Dist., | | | | | | | | | | | | |
Election of 2008, Series SR-4C, GO, Rfdg.(hh) | | 5.000 | | 07/01/34 | | | 1,000 | | | | 1,195,566 | |
Election of 2012, Series ZR-5C, GO, Rfdg.(hh) | | 5.000 | | 07/01/40 | | | 1,000 | | | | 1,155,913 | |
San Diego Unif. Sch. Dist. Rev., | | | | | | | | | | | | |
TRANS, Series A | | 5.000 | | 06/30/25 | | | 1,000 | | | | 1,019,544 | |
San Francisco City & Cnty. Arpt. Commn. Rev., | | | | | | | | | | | | |
2nd Series A, Rfdg. | | 5.000 | | 05/01/27 | | | 400 | | | | 414,271 | |
2nd Series A, Rfdg., AMT | | 5.250 | | 05/01/41 | | | 1,000 | | | | 1,116,699 | |
See Notes to Financial Statements.
PGIM California Muni Income Fund 5
Schedule of Investments (continued)
as of August 31, 2024
| | | | | | | | | | | | |
| | | | |
| Description | | Interest Rate | | Maturity Date | | Principal Amount (000)# | | | Value | |
| | | | |
MUNICIPAL BONDS (Continued) | | | | | | | | | | | | |
San Francisco City & Cnty. Arpt. Commn. Rev., (cont’d.) | | | | | | | | | | | | |
2nd Series C, Rfdg., AMT | | 5.500% | | 05/01/39 | | | 1,000 | | | $ | 1,133,809 | |
Series D, Rfdg., AMT | | 5.000 | | 05/01/26 | | | 1,980 | | | | 2,043,444 | |
Unrefunded, 2nd Series G, Rfdg., AMT | | 5.000 | | 05/01/27 | | | 2,330 | | | | 2,441,007 | |
San Leandro Cmnty. Facs. Dist. No. 1, | | | | | | | | | | | | |
Spl. Tax | | 6.500 | | 09/01/25 | | | 815 | | | | 816,862 | |
Sanger Unif. Sch. Dist., | | | | | | | | | | | | |
Unrefunded, COP, Cap. Proj., Rfdg., AGM | | 5.000 | | 06/01/52 | | | 85 | | | | 85,074 | |
Santa Maria Joint Union H.S. Dist., | | | | | | | | | | | | |
Elect. of 2004, CABS, GO, NATL | | 2.656(t) | | 08/01/29 | | | 1,250 | | | | 1,097,849 | |
Santa Monica Cmnty. Clg. Dist., | | | | | | | | | | | | |
Elect. of 2002, Series A, GO, NATL | | 2.594(t) | | 08/01/28 | | | 1,055 | | | | 953,631 | |
Southern Calif. Pub. Pwr. Auth. Rev., | | | | | | | | | | | | |
Clean Energy Proj., Series A (Mandatory put date 09/01/30) | | 5.000(cc) | | 04/01/55 | | | 2,000 | | | | 2,151,119 | |
Southern Calif. Tob. Secur. Auth. Rev., | | | | | | | | | | | | |
San Diego Co., Asset security, Rfdg. | | 5.000 | | 06/01/25 | | | 1,880 | | | | 1,907,124 | |
Territory of Guam. Rev., | | | | | | | | | | | | |
Series F, Rfdg. | | 5.000 | | 01/01/31 | | | 1,525 | | | | 1,656,492 | |
Univ. of California Reg. Med. Ctr. Rev., | | | | | | | | | | | | |
Series L, Rfdg. | | 5.000 | | 05/15/28 | | | 1,000 | | | | 1,040,733 | |
Series P | | 5.000 | | 05/15/36 | | | 1,725 | | | | 1,985,935 | |
Univ. of California Rev., | | | | | | | | | | | | |
Series BE, Rfdg. | | 5.000 | | 05/15/41 | | | 1,195 | | | | 1,312,016 | |
Series BS, Rfdg. | | 5.000 | | 05/15/43 | | | 1,000 | | | | 1,138,559 | |
Series BW, Rfdg. | | 5.000 | | 05/15/40 | | | 1,000 | | | | 1,155,372 | |
Vernon Elec. Sys. Rev., | | | | | | | | | | | | |
Series A | | 5.000 | | 04/01/28 | | | 2,150 | | | | 2,287,806 | |
Walnut Energy Ctr. Auth. Rev., | | | | | | | | | | | | |
Rfdg. | | 5.000 | | 01/01/34 | | | 1,000 | | | | 1,001,614 | |
| | | | | | | | | | | | |
| | | | |
TOTAL LONG-TERM INVESTMENTS
(cost $237,489,292) | | | | | | | | | | | 236,971,864 | |
| | | | | | | | | | | | |
| | | | |
SHORT-TERM INVESTMENT 3.8% | | | | | | | | | | | | |
| | | | |
| | | | | | | Shares | | | | |
| | | | |
AFFILIATED MUTUAL FUND | | | | | | | | | | | | |
PGIM Core Ultra Short Bond Fund
(cost $9,300,840)(wb) | | | | | | | 9,300,840 | | | | 9,300,840 | |
| | | | | | | | | | | | |
| | | | |
TOTAL INVESTMENTS 101.2%
(cost $246,790,132) | | | | | | | | | | | 246,272,704 | |
Liabilities in excess of other assets(z) (1.2)% | | | | | | | | | | | (2,826,661 | ) |
| | | | | | | | | | | | |
| | | | |
NET ASSETS 100.0% | | | | | | | | | | $ | 243,446,043 | |
| | | | | | | | | | | | |
See Notes to Financial Statements.
6
Below is a list of the abbreviation(s) used in the annual report:
USD—US Dollar
144A—Security was purchased pursuant to Rule 144A under the Securities Act of 1933 and, pursuant to the requirements of Rule 144A, may not be resold except to qualified institutional buyers.
AGM—Assured Guaranty Municipal Corp.
AMBAC—American Municipal Bond Assurance Corp.
AMT—Alternative Minimum Tax
BAM—Build America Mutual
BANS—Bond Anticipation Notes
CABS—Capital Appreciation Bonds
CGM—Citigroup Global Markets, Inc.
COP—Certificates of Participation
ETM—Escrowed to Maturity
GO—General Obligation
IDB—Industrial Development Bond
NATL—National Public Finance Guarantee Corp.
OTC—Over-the-counter
PCR—Pollution Control Revenue
Rfdg—Refunding
SOFR—Secured Overnight Financing Rate
TCRs—Transferrable Custodial Receipts
TRANS—Tax and Revenue Anticipation Notes
| # | Principal amount is shown in U.S. dollars unless otherwise stated. |
| ^ | Indicates a Level 3 instrument. The aggregate value of Level 3 instruments is $120,000 and 0.0% of net assets. |
| (cc) | Variable rate instrument. The rate shown is based on the latest available information as of August 31, 2024. Certain variable rate securities are not based on a published reference rate and spread but are determined by the issuer or agent and are based on current market conditions. These securities do not indicate a reference rate and spread in their description. |
| (d) | Represents issuer in default on interest payments and/or principal repayment. Non-income producing security. Such securities may be post-maturity. |
| (ee) | All or partial escrowed to maturity and pre-refunded issues are secured by escrowed cash, a guaranteed investment contract and /or U.S. guaranteed obligations. |
| (hh) | When-issued security. |
| (t) | Represents zero coupon. Rate quoted represents effective yield at August 31, 2024. |
| (wb) | Represents an investment in a Fund affiliated with the Manager. |
| (z) | Includes net unrealized appreciation/(depreciation) and/or market value of the below holdings which are excluded from the Schedule of Investments: |
Futures contracts outstanding at August 31, 2024:
| | | | | | | | | | | | | | | | | | | | |
Number of Contracts | | Type | | Expiration
Date | | | Current
Notional
Amount | | | Value /
Unrealized
Appreciation
(Depreciation) | |
Short Position: | | | | | | | | | | | | | | | |
9 | | 30 Year U.S. Ultra Treasury Bonds | | | Dec. 2024 | | | | $1,187,438 | | | | | | | $26,439 | | | | |
| | | | | | | | | | | | | | | | | | | | |
See Notes to Financial Statements.
PGIM California Muni Income Fund 7
Schedule of Investments (continued)
as of August 31, 2024
Summary of Collateral for Centrally Cleared/Exchange-traded Derivatives:
Cash and securities segregated as collateral, including pending settlement for closed positions, to cover requirements for centrally cleared/exchange-traded derivatives are listed by broker as follows:
| | | | | | | | | | |
Broker | | Cash and/or Foreign Currency | | Securities Market Value |
CGM | | | | $340,000 | | | | | $— | |
| | | | | | | | | | |
Fair Value Measurements:
Various inputs are used in determining the value of the Fund’s investments. These inputs are summarized in the three broad levels listed below.
Level 1—unadjusted quoted prices generally in active markets for identical securities.
Level 2—quoted prices for similar securities, interest rates and yield curves, prepayment speeds, foreign currency exchange rates and other observable inputs.
Level 3—unobservable inputs for securities valued in accordance with Board approved fair valuation procedures.
The following is a summary of the inputs used as of August 31, 2024 in valuing such portfolio securities:
| | | | | | | | | | | | |
| | | Level 1 | | | Level 2 | | | Level 3 | |
| | |
Investments in Securities | | | | | | | | |
Assets | | | | | | | | |
Long-Term Investments | | | | | | | | |
Municipal Bonds | | | | | | | | |
California | | $ | — | | | $ | 225,857,662 | | | $ | 120,000 | |
Guam | | | — | | | | 2,362,473 | | | | — | |
Puerto Rico | | | — | | | | 8,631,729 | | | | — | |
Short-Term Investment | | | | | | | | |
Affiliated Mutual Fund | | | 9,300,840 | | | | — | | | | — | |
| | | | | | | | | | | | |
| | | |
Total | | $ | 9,300,840 | | | $ | 236,851,864 | | | $ | 120,000 | |
| | | | | | | | | | | | |
| | |
Other Financial Instruments* | | | | | | | | |
Assets | | | | | | | | |
Futures Contracts | | $ | 26,439 | | | $ | — | | | $ | — | |
| | | | | | | | | | | | |
| * | Other financial instruments are derivative instruments not reflected in the Schedule of Investments, such as futures, forwards and centrally cleared swap contracts, which are recorded at unrealized appreciation (depreciation) on the instrument, and OTC swap contracts which are recorded at fair value. |
See Notes to Financial Statements.
8
Sector Classification:
The sector classification of investments and liabilities in excess of other assets shown as a percentage of net assets as of August 31, 2024 were as follows:
| | | | |
General Obligation | | | 16.4 | % |
Healthcare | | | 15.4 | |
Transportation | | | 13.6 | |
Pre-pay Gas | | | 10.3 | |
Special Tax/Assessment District | | | 9.2 | |
Development | | | 7.9 | |
Education | | | 7.5 | |
Tobacco Appropriated | | | 5.1 | |
Corporate Backed IDB &PCR | | | 4.2 | |
Affiliated Mutual Fund | | | 3.8 | |
| | | | |
Lease Backed Certificate of Participation | | | 2.5 | % |
Power | | | 2.2 | |
Water &Sewer | | | 1.6 | |
Pre-Refunded | | | 1.4 | |
Solid Waste/Resource Recovery | | | 0.1 | |
| | | | |
| |
| | | 101.2 | |
Liabilities in excess of other assets | | | (1.2 | ) |
| | | | |
| |
| | | 100.0 | % |
| | | | |
Effects of Derivative Instruments on the Financial Statements and Primary Underlying Risk Exposure:
The Fund invested in derivative instruments during the reporting period. The primary type of risk associated with these derivative instruments is interest rate risk. See the Notes to Financial Statements for additional detail regarding these derivative instruments and their risks. The effect of such derivative instruments on the Fund’s financial position and financial performance as reflected in the Statement of Assets and Liabilities and Statement of Operations is presented in the summary below.
Fair values of derivative instruments as of August 31, 2024 as presented in the Statement of Assets and Liabilities:
| | | | | | | | | | |
| | | Asset Derivatives | | | Liability Derivatives |
Derivatives not accounted for as hedging instruments, carried at fair value | | Statement of Assets and Liabilities Location | | Fair
Value | | | Statement of Assets and Liabilities Location | | Fair
Value |
Interest rate contracts | | Due from/to broker-variation margin futures | | $ | 26,439 | * | | — | | $— |
| | | | | | | | | | |
| * | Includes cumulative appreciation (depreciation) as reported in the schedule of open futures and centrally cleared swap contracts. Only unsettled variation margin receivable (payable) is reported within the Statement of Assets and Liabilities. |
The effects of derivative instruments on the Statement of Operations for the year ended August 31, 2024 are as follows:
Amount of Realized Gain (Loss) on Derivatives Recognized in Income
| | | | | |
Derivatives not accounted for as hedging instruments, carried at fair value | | Futures |
| | | |
| |
Interest rate contracts | | | $ | (3,006 | ) |
| | | | | |
See Notes to Financial Statements.
PGIM California Muni Income Fund 9
Schedule of Investments (continued)
as of August 31, 2024
Change in Unrealized Appreciation (Depreciation) on Derivatives Recognized in Income
| | | | | |
Derivatives not accounted for as hedging instruments, carried at fair value | | Futures |
| |
Interest rate contracts | | | $ | 55,683 | |
| | | | | |
For the year ended August 31, 2024, the Fund’s average volume of derivative activities is as follows:
| | |
| |
| Derivative Contract Type | | Average Volume of Derivative Activities* |
| |
Futures Contracts - Short Positions (1) | | $1,323,188 |
| * | Average volume is based on average quarter end balances for the year ended August 31, 2024. |
| (1) | Notional Amount in USD. |
See Notes to Financial Statements.
10
Statement of Assets and Liabilities
as of August 31, 2024
| | | | |
|
Assets | |
| |
Investments at value: | | | | |
Unaffiliated investments (cost $237,489,292) | | $ | 236,971,864 | |
Affiliated investments (cost $9,300,840) | | | 9,300,840 | |
Interest receivable | | | 2,701,017 | |
Receivable for Fund shares sold | | | 556,290 | |
Deposit with broker for centrally cleared/exchange-traded derivatives | | | 340,000 | |
Due from broker—variation margin futures | | | 9,281 | |
Prepaid expenses and other assets | | | 2,743 | |
| | | | |
| |
Total Assets | | | 249,882,035 | |
| | | | |
| |
Liabilities | | | | |
| |
Payable for investments purchased | | | 5,874,693 | |
Payable for Fund shares purchased | | | 384,743 | |
Accrued expenses and other liabilities | | | 84,198 | |
Management fee payable | | | 46,282 | |
Distribution fee payable | | | 25,108 | |
Dividends payable | | | 16,462 | |
Affiliated transfer agent fee payable | | | 2,512 | |
Trustees’ fees payable | | | 1,994 | |
| | | | |
| |
Total Liabilities | | | 6,435,992 | |
| | | | |
| |
Net Assets | | $ | 243,446,043 | |
| | | | |
| | | | |
| |
Net assets were comprised of: | | | | |
Shares of beneficial interest, at par | | $ | 244,924 | |
Paid-in capital in excess of par | | | 247,125,773 | |
Total distributable earnings (loss) | | | (3,924,654 | ) |
| | | | |
| |
Net assets, August 31, 2024 | | $ | 243,446,043 | |
| | | | |
See Notes to Financial Statements.
PGIM California Muni Income Fund 11
Statement of Assets and Liabilities
as of August 31, 2024
| | | | |
| |
Class A | | | | |
| |
Net asset value and redemption price per share, | | | | |
($104,172,307 ÷ 10,481,033 shares of beneficial interest issued and outstanding) | | $ | 9.94 | |
Maximum sales charge (3.25% of offering price) | | | 0.33 | |
| | | | |
| |
Maximum offering price to public | | $ | 10.27 | |
| | | | |
| |
Class C | | | | |
| |
Net asset value, offering price and redemption price per share, | | | | |
($3,980,692 ÷ 400,581 shares of beneficial interest issued and outstanding) | | $ | 9.94 | |
| | | | |
| |
Class Z | | | | |
| |
Net asset value, offering price and redemption price per share, | | | | |
($109,102,287 ÷ 10,975,890 shares of beneficial interest issued and outstanding) | | $ | 9.94 | |
| | | | |
| |
Class R6 | | | | |
| |
Net asset value, offering price and redemption price per share, | | | | |
($26,190,757 ÷ 2,634,908 shares of beneficial interest issued and outstanding) | | $ | 9.94 | |
| | | | |
See Notes to Financial Statements.
12
Statement of Operations
Year Ended August 31, 2024
| | | | |
| |
Net Investment Income (Loss) | | | | |
| |
Income | | | | |
Interest income | | $ | 7,269,906 | |
Affiliated dividend income | | | 270,401 | |
| | | | |
| |
Total income | | | 7,540,307 | |
| | | | |
| |
Expenses | | | | |
Management fee | | | 867,173 | |
Distribution fee(a) | | | 312,811 | |
Transfer agent’s fees and expenses (including affiliated expense of $ 15,694)(a) | | | 138,987 | |
Custodian and accounting fees | | | 45,711 | |
Audit fee | | | 41,499 | |
Professional fees | | | 40,282 | |
Registration fees(a) | | | 35,251 | |
Shareholders’ reports | | | 24,970 | |
Trustees’ fees | | | 12,750 | |
Miscellaneous | | | 29,186 | |
| | | | |
| |
Total expenses | | | 1,548,620 | |
Less: Fee waiver and/or expense reimbursement(a) | | | (288,329 | ) |
Custodian fee credit | | | (4 | ) |
| | | | |
| |
Net expenses | | | 1,260,287 | |
| | | | |
| |
Net investment income (loss) | | | 6,280,020 | |
| | | | |
| |
Realized And Unrealized Gain (Loss) On Investments | | | | |
| |
Net realized gain (loss) on: | | | | |
Investment transactions | | | (1,384,705 | ) |
Futures transactions | | | (3,006 | ) |
| | | | |
| |
| | | (1,387,711 | ) |
| | | | |
Net change in unrealized appreciation (depreciation) on: | | | | |
Investments | | | 6,743,723 | |
Futures | | | 55,683 | |
| | | | |
| |
| | | 6,799,406 | |
| | | | |
| |
Net gain (loss) on investment transactions | | | 5,411,695 | |
| | | | |
| |
Net Increase (Decrease) In Net Assets Resulting From Operations | | $ | 11,691,715 | |
| | | | |
| (a) | Class specific expenses and waivers were as follows: |
| | | | | | | | | | | | | | | | |
| | | Class A | | | Class C | | | Class Z | | | Class R6 | |
Distribution fee | | | 261,258 | | | | 51,553 | | | | — | | | | — | |
Transfer agent’s fees and expenses | | | 45,538 | | | | 3,173 | | | | 89,289 | | | | 987 | |
Registration fees | | | 11,031 | | | | 7,307 | | | | 7,933 | | | | 8,980 | |
Fee waiver and/or expense reimbursement | | | (87,200 | ) | | | (4,302 | ) | | | (166,964 | ) | | | (29,863 | ) |
See Notes to Financial Statements.
PGIM California Muni Income Fund 13
Statements of Changes in Net Assets
| | | | | | | | |
| |
| | | Year Ended
August 31, | |
| | |
| | | 2024 | | | 2023 | |
| | |
Increase (Decrease) in Net Assets | | | | | | | | |
| | |
Operations | | | | | | | | |
Net investment income (loss) | | $ | 6,280,020 | | | $ | 5,352,424 | |
Net realized gain (loss) on investment transactions | | | (1,387,711 | ) | | | (37,721 | ) |
Net change .in unrealized appreciation (depreciation) on investments | | | 6,799,406 | | | | (1,938,421 | ) |
| | | | | | | | |
| | |
Net increase (decrease) in net assets resulting from operations | | | 11,691,715 | | | | 3,376,282 | |
| | | | | | | | |
| | |
Dividends and Distributions | | | | | | | | |
Distributions from distributable earnings | | | | | | | | |
Class A | | | (2,705,222 | ) | | | (2,702,719 | ) |
Class C | | | (86,668 | ) | | | (113,619 | ) |
Class Z | | | (2,731,965 | ) | | | (1,969,843 | ) |
Class R6 | | | (689,164 | ) | | | (534,089 | ) |
| | | | | | | | |
| | |
| | | (6,213,019 | ) | | | (5,320,270 | ) |
| | | | | | | | |
Fund share transactions (Net of share conversions) | | | | | | | | |
Net proceeds from shares sold | | | 91,010,033 | | | | 95,581,387 | |
Net asset value of shares issued in reinvestment of dividends and distributions | | | 6,004,948 | | | | 5,090,316 | |
Cost of shares purchased | | | (86,616,876 | ) | | | (82,353,303 | ) |
| | | | | | | | |
| | |
Net increase (decrease) in net assets from Fund share transactions | | | 10,398,105 | | | | 18,318,400 | |
| | | | | | | | |
| | |
Total increase (decrease) | | | 15,876,801 | | | | 16,374,412 | |
| | |
Net Assets: | | | | | | | | |
| | |
Beginning of year | | | 227,569,242 | | | | 211,194,830 | |
| | | | | | | | |
| | |
End of year | | $ | 243,446,043 | | | $ | 227,569,242 | |
| | | | | | | | |
See Notes to Financial Statements.
14
Financial Highlights
| | | | | | | | | | | | | | | | | | | | |
| |
| Class A Shares | |
| | |
| | | Year Ended August 31, | |
| | | | | | |
| | | 2024 | | | 2023 | | | 2022 | | | 2021 | | | 2020 | |
| | | | | | |
| Per Share Operating Performance(a): | | | | | | | | | | | | | | | | | | | | |
| Net Asset Value, Beginning of Year | | | $9.68 | | | | $9.77 | | | | $10.81 | | | | $10.71 | | | | $10.88 | |
| Income (loss) from investment operations: | | | | | | | | | | | | | | | | | | | | |
| Net investment income (loss) | | | 0.26 | | | | 0.22 | | | | 0.20 | | | | 0.23 | | | | 0.30 | |
| Net realized and unrealized gain (loss) on investment transactions | | | 0.25 | | | | (0.09 | ) | | | (1.05 | ) | | | 0.09 | | | | (0.18 | ) |
| Total from investment operations | | | 0.51 | | | | 0.13 | | | | (0.85 | ) | | | 0.32 | | | | 0.12 | |
| Less Dividends and Distributions: | | | | | | | | | | | | | | | | | | | | |
| Dividends from net investment income | | | (0.25 | ) | | | (0.22 | ) | | | (0.19 | ) | | | (0.22 | ) | | | (0.29 | ) |
| Net asset value, end of year | | | $9.94 | | | | $9.68 | | | | $9.77 | | | | $10.81 | | | | $10.71 | |
| Total Return(b): | | | 5.37 | % | | | 1.37 | % | | | (7.89 | )% | | | 3.05 | % | | | 1.17 | % |
| | | | | | | | | | | | | | | | | | | | | |
| | | | | | |
| Ratios/Supplemental Data: | | | | | | | | | | | | | | | | | | | | |
| Net assets, end of year (000) | | | $104,172 | | | | $114,723 | | | | $124,130 | | | | $142,134 | | | | $124,099 | |
| Average net assets (000) | | | $104,503 | | | | $118,306 | | | | $127,800 | | | | $135,913 | | | | $122,238 | |
| Ratios to average net assets: | | | | | | | | | | | | | | | | | | | | |
| Expenses after waivers and/or expense reimbursement | | | 0.69 | % | | | 0.69 | % | | | 0.69 | % | | | 0.68 | % | | | 0.86 | % |
| Expenses before waivers and/or expense reimbursement | | | 0.77 | % | | | 0.78 | % | | | 0.77 | % | | | 0.77 | % | | | 0.87 | % |
| Net investment income (loss) | | | 2.62 | % | | | 2.30 | % | | | 1.90 | % | | | 2.09 | % | | | 2.77 | % |
| Portfolio turnover rate(c)(d) | | | 75 | % | | | 33 | % | | | 67 | % | | | 27 | % | | | 81 | % |
| (a) | Calculated based on average shares outstanding during the year. |
| (b) | Total return does not consider the effects of sales loads. Total return is calculated assuming a purchase of a share on the first day and a sale on the last day of each year reported and includes reinvestment of dividends and distributions, if any. Total returns may reflect adjustments to conform to GAAP. |
| (c) | The Fund’s portfolio turnover rate is calculated in accordance with regulatory requirements, without regard to transactions involving short-term investments, certain derivatives and in-kind transactions (if any). If such transactions were included, the Fund’s portfolio turnover rate may be higher. |
| (d) | The portfolio turnover rate includes variable rate demand notes. |
See Notes to Financial Statements.
PGIM California Muni Income Fund 15
Financial Highlights (continued)
| | | | | | | | | | | | | | | | | | | | |
| |
| Class C Shares | |
| | |
| | | Year Ended August 31, | |
| | | | | | |
| | | 2024 | | | 2023 | | | 2022 | | | 2021 | | | 2020 | |
| | | | | | |
| Per Share Operating Performance(a): | | | | | | | | | | | | | | | | | | | | |
| Net Asset Value, Beginning of Year | | | $9.68 | | | | $9.77 | | | | $10.81 | | | | $10.71 | | | | $10.88 | |
| Income (loss) from investment operations: | | | | | | | | | | | | | | | | | | | | |
| Net investment income (loss) | | | 0.17 | (b) | | | 0.14 | | | | 0.11 | | | | 0.14 | | | | 0.21 | |
| Net realized and unrealized gain (loss) on investment transactions | | | 0.25 | (c) | | | (0.09 | ) | | | (1.04 | ) | | | 0.10 | | | | (0.17 | ) |
| Total from investment operations | | | 0.42 | | | | 0.05 | | | | (0.93 | ) | | | 0.24 | | | | 0.04 | |
| Less Dividends and Distributions: | | | | | | | | | | | | | | | | | | | | |
| Dividends from net investment income | | | (0.16 | ) | | | (0.14 | ) | | | (0.11 | ) | | | (0.14 | ) | | | (0.21 | ) |
| Net asset value, end of year | | | $9.94 | | | | $9.68 | | | | $9.77 | | | | $10.81 | | | | $10.71 | |
| Total Return(d): | | | 4.43 | % | | | 0.52 | % | | | (8.65 | )% | | | 2.23 | % | | | 0.36 | % |
| | | | | | | | | | | | | | | | | | | | | |
| | | | | | |
| Ratios/Supplemental Data: | | | | | | | | | | | | | | | | | | | | |
| Net assets, end of year (000) | | | $3,981 | | | | $6,808 | | | | $9,183 | | | | $13,962 | | | | $18,005 | |
| Average net assets (000) | | | $5,155 | | | | $7,901 | | | | $11,219 | | | | $15,700 | | | | $19,915 | |
| Ratios to average net assets: | | | | | | | | | | | | | | | | | | | | |
| Expenses after waivers and/or expense reimbursement | | | 1.59 | % | | | 1.53 | % | | | 1.51 | % | | | 1.49 | % | | | 1.67 | % |
| Expenses before waivers and/or expense reimbursement | | | 1.67 | % | | | 1.62 | % | | | 1.59 | % | | | 1.58 | % | | | 1.68 | % |
| Net investment income (loss) | | | 1.71 | % | | | 1.45 | % | | | 1.07 | % | | | 1.30 | % | | | 1.96 | % |
| Portfolio turnover rate(e)(f) | | | 75 | % | | | 33 | % | | | 67 | % | | | 27 | % | | | 81 | % |
| (a) | Calculated based on average shares outstanding during the year. |
| (b) | The per share amount of net investment income (loss) does not directly correlate to the amounts reported in the Statement of Operations due to class specific expenses. |
| (c) | The per share amount of realized and unrealized gain (loss) on investments does not directly correlate to the amounts reported in the Statement of Operations due to the timing of portfolio share transactions in relation to fluctuating market values. |
| (d) | Total return does not consider the effects of sales loads. Total return is calculated assuming a purchase of a share on the first day and a sale on the last day of each year reported and includes reinvestment of dividends and distributions, if any. Total returns may reflect adjustments to conform to GAAP. |
| (e) | The Fund’s portfolio turnover rate is calculated in accordance with regulatory requirements, without regard to transactions involving short-term investments, certain derivatives and in-kind transactions (if any). If such transactions were included, the Fund’s portfolio turnover rate may be higher. |
| (f) | The portfolio turnover rate includes variable rate demand notes. |
See Notes to Financial Statements.
16
| | | | | | | | | | | | | | | | | | | | |
| |
| Class Z Shares | |
| | |
| | | Year Ended August 31, | |
| | | | | | |
| | | 2024 | | | 2023 | | | 2022 | | | 2021 | | | 2020 | |
| | | | | | |
| Per Share Operating Performance(a): | | | | | | | | | | | | | | | | | | | | |
| Net Asset Value, Beginning of Year | | | $9.68 | | | | $9.77 | | | | $10.81 | | | | $10.71 | | | | $10.88 | |
| Income (loss) from investment operations: | | | | | | | | | | | | | | | | | | | | |
| Net investment income (loss) | | | 0.29 | | | | 0.25 | | | | 0.23 | | | | 0.26 | | | | 0.33 | |
| Net realized and unrealized gain (loss) on investment transactions | | | 0.25 | | | | (0.09 | ) | | | (1.05 | ) | | | 0.10 | | | | (0.18 | ) |
| Total from investment operations | | | 0.54 | | | | 0.16 | | | | (0.82 | ) | | | 0.36 | | | | 0.15 | |
| Less Dividends and Distributions: | | | | | | | | | | | | | | | | | | | | |
| Dividends from net investment income | | | (0.28 | ) | | | (0.25 | ) | | | (0.22 | ) | | | (0.26 | ) | | | (0.32 | ) |
| Net asset value, end of year | | | $9.94 | | | | $9.68 | | | | $9.77 | | | | $10.81 | | | | $10.71 | |
| Total Return(b): | | | 5.68 | % | | | 1.67 | % | | | (7.62 | )% | | | 3.35 | % | | | 1.46 | % |
| | | | | | | | | | | | | | | | | | | | | |
| | | | | | |
| Ratios/Supplemental Data: | | | | | | | | | | | | | | | | | | | | |
| Net assets, end of year (000) | | | $109,102 | | | | $84,322 | | | | $57,368 | | | | $58,895 | | | | $45,988 | |
| Average net assets (000) | | | $94,701 | | | | $76,165 | | | | $54,563 | | | | $52,265 | | | | $48,099 | |
| Ratios to average net assets: | | | | | | | | | | | | | | | | | | | | |
| Expenses after waivers and/or expense reimbursement | | | 0.39 | % | | | 0.39 | % | | | 0.39 | % | | | 0.39 | % | | | 0.58 | % |
| Expenses before waivers and/or expense reimbursement | | | 0.57 | % | | | 0.56 | % | | | 0.56 | % | | | 0.57 | % | | | 0.68 | % |
| Net investment income (loss) | | | 2.91 | % | | | 2.60 | % | | | 2.20 | % | | | 2.37 | % | | | 3.05 | % |
| Portfolio turnover rate(c)(d) | | | 75 | % | | | 33 | % | | | 67 | % | | | 27 | % | | | 81 | % |
| (a) | Calculated based on average shares outstanding during the year. |
| (b) | Total return is calculated assuming a purchase of a share on the first day and a sale on the last day of each year reported and includes reinvestment of dividends and distributions, if any. Total returns may reflect adjustments to conform to GAAP. |
| (c) | The Fund’s portfolio turnover rate is calculated in accordance with regulatory requirements, without regard to transactions involving short-term investments, certain derivatives and in-kind transactions (if any). If such transactions were included, the Fund’s portfolio turnover rate may be higher. |
| (d) | The portfolio turnover rate includes variable rate demand notes. |
See Notes to Financial Statements.
PGIM California Muni Income Fund 17
Financial Highlights (continued)
| | | | | | | | | | | | | | | | | | | | |
| |
| Class R6 Shares | |
| | |
| | | Year Ended August 31, | |
| | | | | | |
| | | 2024 | | | 2023 | | | 2022 | | | 2021 | | | 2020 | |
| | | | | | |
| Per Share Operating Performance(a): | | | | | | | | | | | | | | | | | | | | |
| Net Asset Value, Beginning of Year | | | $9.68 | | | | $9.77 | | | | $10.81 | | | | $10.71 | | | | $10.88 | |
| Income (loss) from investment operations: | | | | | | | | | | | | | | | | | | | | |
| Net investment income (loss) | | | 0.29 | | | | 0.25 | | | | 0.23 | | | | 0.25 | | | | 0.32 | |
| Net realized and unrealized gain (loss) on investment transactions | | | 0.25 | | | | (0.09 | ) | | | (1.05 | ) | | | 0.11 | | | | (0.17 | ) |
| Total from investment operations | | | 0.54 | | | | 0.16 | | | | (0.82 | ) | | | 0.36 | | | | 0.15 | |
| Less Dividends and Distributions: | | | | | | | | | | | | | | | | | | | | |
| Dividends from net investment income | | | (0.28 | ) | | | (0.25 | ) | | | (0.22 | ) | | | (0.26 | ) | | | (0.32 | ) |
| Net asset value, end of year | | | $9.94 | | | | $9.68 | | | | $9.77 | | | | $10.81 | | | | $10.71 | |
| Total Return(b): | | | 5.69 | % | | | 1.68 | % | | | (7.61 | )% | | | 3.36 | % | | | 1.46 | % |
| | | | | | | | | | | | | | | | | | | | | |
| | | | | | |
| Ratios/Supplemental Data: | | | | | | | | | | | | | | | | | | | | |
| Net assets, end of year (000) | | | $26,191 | | | | $21,716 | | | | $20,514 | | | | $16,495 | | | | $6,422 | |
| Average net assets (000) | | | $23,844 | | | | $20,642 | | | | $17,433 | | | | $9,908 | | | | $4,756 | |
| Ratios to average net assets: | | | | | | | | | | | | | | | | | | | | |
| Expenses after waivers and/or expense reimbursement | | | 0.38 | % | | | 0.38 | % | | | 0.38 | % | | | 0.38 | % | | | 0.54 | % |
| Expenses before waivers and/or expense reimbursement | | | 0.51 | % | | | 0.51 | % | | | 0.51 | % | | | 0.62 | % | | | 0.85 | % |
| Net investment income (loss) | | | 2.92 | % | | | 2.60 | % | | | 2.21 | % | | | 2.34 | % | | | 3.03 | % |
| Portfolio turnover rate(c)(d) | | | 75 | % | | | 33 | % | | | 67 | % | | | 27 | % | | | 81 | % |
| (a) | Calculated based on average shares outstanding during the year. |
| (b) | Total return is calculated assuming a purchase of a share on the first day and a sale on the last day of each year reported and includes reinvestment of dividends and distributions, if any. Total returns may reflect adjustments to conform to GAAP. |
| (c) | The Fund’s portfolio turnover rate is calculated in accordance with regulatory requirements, without regard to transactions involving short-term investments, certain derivatives and in-kind transactions (if any). If such transactions were included, the Fund’s portfolio turnover rate may be higher. |
| (d) | The portfolio turnover rate includes variable rate demand notes. |
See Notes to Financial Statements.
18
Notes to Financial Statements
1. Organization
Prudential Investment Portfolios 6 (the “Registered Investment Company” or “RIC”) is registered under the Investment Company Act of 1940, as amended (“1940 Act”), as an open-end management investment company. The RIC is organized as a Massachusetts Business Trust and PGIM California Muni Income Fund (the “Fund”) is the sole series of the RIC. The Fund is classified as a diversified fund for purposes of the 1940 Act.
The investment objective of the Fund is to maximize current income that is exempt from California state and federal income taxes, consistent with the preservation of capital.
2. Accounting Policies
The Fund follows the investment company accounting and reporting guidance of the Financial Accounting Standards Board (“FASB”) Accounting Standard Codification (“ASC”) Topic 946 Financial Services — Investment Companies. The following is a summary of significant accounting policies followed by the Fund in the preparation of its financial statements. The policies conform to U.S. generally accepted accounting principles (“GAAP”). The Fund consistently follows such policies in the preparation of its financial statements.
Securities Valuation: The Fund holds securities and other assets and liabilities that are fair valued as of the close of each day (generally, 4:00 PM Eastern time) the New York Stock Exchange (“NYSE”) is open for trading. As described in further detail below, the Fund’s investments are valued daily based on a number of factors, including the type of investment and whether market quotations are readily available. The RIC’s Board of Trustees (the “Board”) has approved the Fund’s valuation policies and procedures for security valuation and designated PGIM Investments LLC (“PGIM Investments” or the “Manager”) as the “Valuation Designee,” as defined by Rule 2a-5(b) under the 1940 Act, to perform the fair value determination relating to all Fund investments. Pursuant to the Board’s oversight, the Valuation Designee has established a Valuation Committee to perform the duties and responsibilities of the Valuation Designee under Rule 2a-5. The valuation procedures permit the Fund to utilize independent pricing vendor services, quotations from market makers, and alternative valuation methods when market quotations are either not readily available or not deemed representative of fair value. Fair value is the estimated price that would be received to sell an asset or paid to transfer a liability in an orderly transaction between market participants on the measurement date.
For the fiscal reporting year-end, securities and other assets and liabilities were fair valued at the close of the last U.S. business day. Trading in certain foreign securities may occur when the NYSE is closed (including weekends and holidays). Because such foreign securities
PGIM California Muni Income Fund 19
Notes to Financial Statements (continued)
trade in markets that are open on weekends and U.S. holidays, the values of some of the Fund’s foreign investments may change on days when investors cannot purchase or redeem Fund shares.
Various inputs determine how the Fund’s investments are valued, all of which are categorized according to the three broad levels (Level 1, 2, or 3) detailed in the Schedule of Investments and referred to herein as the “fair value hierarchy” in accordance with FASB ASC Topic 820 Fair Value Measurement.
Common or preferred stocks, exchange-traded funds (“ETFs”) and derivative instruments, if applicable, that are traded on a national securities exchange are valued at the last sale price as of the close of trading on the applicable exchange where the security principally trades. Securities traded via NASDAQ are valued at the NASDAQ official closing price. To the extent these securities are valued at the last sale price or NASDAQ official closing price, they are classified as Level 1 in the fair value hierarchy. In the event that no sale or official closing price on a valuation date exists, these securities are generally valued at the mean between the last reported bid and ask prices, or at the last bid price in the absence of an ask price. These securities are classified as Level 2 in the fair value hierarchy.
Fixed income securities traded in the OTC market are generally classified as Level 2 in the fair value hierarchy. Such fixed income securities are typically valued using the market approach which generally involves obtaining data from an approved independent third-party vendor source. The Fund utilizes the market approach as the primary method to value securities when market prices of identical or comparable instruments are available. The third-party vendors’ valuation techniques used to derive the evaluated bid price are based on evaluating observable inputs, including but not limited to, yield curves, yield spreads, credit ratings, deal terms, tranche level attributes, default rates, cash flows, prepayment speeds, broker/dealer quotations and reported trades. Certain Level 3 securities are also valued using the market approach when obtaining a single broker quote or when utilizing transaction prices for identical securities that have been used in excess of five business days. During the reporting period, there were no changes to report with respect to the valuation approach and/or valuation techniques discussed above.
Securities and other assets that cannot be priced according to the methods described above are valued based on policies and procedures approved by the Board. In the event that unobservable inputs are used when determining such valuations, the securities will be classified as Level 3 in the fair value hierarchy. Altering one or more unobservable inputs may result in a significant change to a Level 3 security’s fair value measurement.
When determining the fair value of securities, some of the factors influencing the valuation include: the nature of any restrictions on disposition of the securities; assessment of the
20
general liquidity of the securities; the issuer’s financial condition and the markets in which it does business; the cost of the investment; the size of the holding and the capitalization of the issuer; the prices of any recent transactions or bids/offers for such securities or any comparable securities; and any available analyst media or other reports or information deemed reliable by the Valuation Designee regarding the issuer or the markets or industry in which it operates. Using fair value to price securities may result in a value that is different from a security’s most recent closing price and from the price used by other unaffiliated mutual funds to calculate their net asset values.
Financial Futures Contracts: A financial futures contract is an agreement to purchase (long) or sell (short) an agreed amount of securities at a set price for delivery on a future date. Upon entering into a financial futures contract, the Fund is required to pledge to the broker an amount of cash and/or other assets equal to a certain percentage of the contract amount. This amount is known as the “initial margin.” Subsequent payments, known as “variation margin,” are made or received by the Fund each day, depending on the daily fluctuations in the value of the underlying security. Such variation margin is recorded for financial statement purposes on a daily basis as unrealized gain (loss). When the contract expires or is closed, the gain (loss) is realized and is presented in the Statement of Operations as net realized gain (loss) on futures transactions.
The Fund invested in financial futures contracts in order to hedge its existing portfolio securities, or securities the Fund intends to purchase, against fluctuations in value caused by changes in prevailing interest rates. Should interest rates move unexpectedly, the Fund may not achieve the anticipated benefits of the financial futures contracts and may realize a loss. The use of futures transactions involves the risk of imperfect correlation in movements in the price of futures contracts, interest rates and the underlying hedged assets. Since futures contracts are exchange-traded, there is minimal counterparty credit risk to the Fund since the exchanges’ clearinghouse acts as counterparty to all exchange-traded futures and guarantees the futures contracts against default.
Delayed-Delivery Transactions: The Fund purchased or sold securities on a when-issued or delayed-delivery and forward commitment basis, including TBA securities. These transactions involve a commitment by the Fund to purchase or sell securities for a predetermined price or yield, with payment and delivery taking place beyond the customary settlement period. When delayed-delivery purchases are outstanding, the Fund will set aside and maintain an amount of liquid assets sufficient to meet the purchase price in a segregated account until the settlement date. When purchasing a security on a delayed-delivery basis, the Fund assumes the rights and risks of ownership of the security, including the risk of price and yield fluctuations, and takes such fluctuations into account when determining its net asset value. The Fund may dispose of or renegotiate a delayed-delivery transaction subsequent to establishment, and may sell when-issued securities before they are delivered, which may result in a realized gain (loss). When selling a security on a delayed-delivery basis, the Fund forfeits its eligibility to realize future gains (losses)with respect to the security.
PGIM California Muni Income Fund 21
Notes to Financial Statements (continued)
Securities Transactions and Net Investment Income: Securities transactions are recorded on the trade date. Realized gains (losses) from investment and currency transactions are calculated on the specific identification method. Dividend income is recorded on the ex-date, or for certain foreign securities, when the Fund becomes aware of such dividends. Interest income, including amortization of premium and accretion of discount on debt securities, as required, is recorded on the accrual basis. Expenses are recorded on an accrual basis, which may require the use of certain estimates by management that may differ from actual expense amounts. Net investment income or loss (other than class specific expenses and waivers, which are allocated as noted below) and unrealized and realized gains (losses) are allocated daily to each class of shares based upon the relative proportion of adjusted net assets of each class at the beginning of the day. Class specific expenses and waivers, where applicable, are charged to the respective share classes. Such class specific expenses and waivers include distribution fees and distribution fee waivers, shareholder servicing fees, transfer agent’s fees and expenses, registration fees and fee waivers and/or expense reimbursements, as applicable.
Custody Fee Credits: The Fund has an arrangement with its custodian bank, whereby uninvested monies earn credits which reduce the fees charged by the custodian. Such custody fee credits, if any, are presented as a reduction of gross expenses in the accompanying Statement of Operations.
Taxes: It is the Fund’s policy to continue to meet the requirements of the Internal Revenue Code applicable to regulated investment companies and to distribute all of its taxable net investment income and capital gains, if any, to its shareholders. Therefore, no federal income tax provision is required. Withholding taxes on foreign dividends, interest and capital gains, if any, are recorded, net of reclaimable amounts, at the time the related income is earned.
Dividends and Distributions: Dividends and distributions to shareholders, which are determined in accordance with federal income tax regulations and which may differ from GAAP, are recorded on the ex-date. Permanent book/tax differences relating to income and gain (loss) are reclassified between total distributable earnings (loss) and paid-in capital in excess of par, as appropriate. The chart below sets forth the expected frequency of dividend and capital gains distributions to shareholders. Various factors may impact the frequency of dividend distributions to shareholders, including but not limited to adverse market conditions or portfolio holding-specific events.
| | | | |
| | |
Expected Distribution Schedule to Shareholders* | | | Frequency | |
Net Investment Income | | | Monthly | |
Short-Term Capital Gains | | | Annually | |
Long-Term Capital Gains | | | Annually | |
22
| * | Under certain circumstances, the Fund may make more than one distribution of short-term and/or long-term capital gains during a fiscal year. |
Estimates: The preparation of financial statements requires management to make estimates and assumptions that affect the reported amounts and disclosures in the financial statements. Actual results could differ from those estimates.
3. Agreements
The RIC, on behalf of the Fund, has entered into a management agreement with the Manager pursuant to which it has responsibility for all investment advisory services, including supervision of the subadviser’s performance of such services, and for rendering administrative services.
The Manager has entered into a subadvisory agreement with PGIM, Inc. (the “subadviser”), which provides subadvisory services to the Fund through its PGIM Fixed Income unit. The Manager pays for the services of PGIM, Inc.
Fees payable under the management agreement are computed daily and paid monthly. For the reporting period ended August 31, 2024, the contractual and effective management fee rates were as follows:
| | |
| | |
Contractual Management Rate | | Effective Management Fee, before any waivers
and/or expense reimbursements |
0.38% of average daily net assets up to $5 billion; | | 0.38% |
0.37% of average daily net assets over $5 billion. | | |
The Manager has contractually agreed, through December 31, 2025, to limit total annual operating expenses after fee waivers and/or expense reimbursements. This contractual waiver excludes interest, brokerage, taxes (such as income and foreign withholding taxes, stamp duty and deferred tax expenses), acquired fund fees and expenses, extraordinary expenses, and certain other Fund expenses such as dividend and interest expense and broker charges on short sales.
Where applicable, the Manager agrees to waive management fees or shared operating expenses on any share class to the same extent that it waives such expenses on any other share class. In addition, total annual operating expenses for Class R6 shares will not exceed total annual operating expenses for Class Z shares. Fees and/or expenses waived and/or reimbursed by the Manager for the purpose of preventing the expenses from exceeding a certain expense limit may be recouped by the Manager within the same fiscal year during which such waiver and/or reimbursement is made if such recoupment can be realized without exceeding the expense limit in effect at the time of the waiver/reimbursement and/or
PGIM California Muni Income Fund 23
Notes to Financial Statements (continued)
recoupment for that fiscal year, as applicable. The expense limitations attributable to each class are as follows:
| | |
| | |
Class | | Expense
Limitations |
A | | —% |
C | | — |
Z | | 0.39 |
R6 | | 0.38 |
The RIC, on behalf of the Fund, has a distribution agreement with Prudential Investment Management Services LLC (“PIMS”), which acts as the distributor of the Class A, Class C, Class Z and Class R6 shares of the Fund. The Fund compensates PIMS for distributing and servicing the Fund’s Class A and Class C shares, pursuant to the plans of distribution (the “Distribution Plans”), regardless of expenses actually incurred by PIMS.
Pursuant to the Distribution Plans, the Fund compensates PIMS for distribution related activities at an annual rate based on average daily net assets per class. The distribution fees are accrued daily and payable monthly.
The Fund’s annual gross and net distribution rates, where applicable, are as follows:
| | | | |
| | | |
Class | | Gross Distribution Fee | | Net Distribution Fee |
A | | 0.25% | | 0.25% |
C | | 1.00 | | 1.00 |
Z | | N/A | | N/A |
R6 | | N/A | | N/A |
For the year ended August 31, 2024, PIMS received front-end sales charges (“FESL”) resulting from sales of certain class shares and contingent deferred sales charges (“CDSC”) imposed upon redemptions by certain shareholders. From these fees, PIMS paid such sales charges to broker-dealers, who in turn paid commissions to salespersons and incurred other distribution costs. The sales charges are as follows where applicable:
| | | | | | | | |
| | | |
Class | | | FESL | | | | CDSC | |
A | | $ | 44,668 | | | $ | 2,437 | |
C | | | — | | | | — | |
PGIM Investments, PGIM, Inc. and PIMS are indirect, wholly-owned subsidiaries of Prudential Financial, Inc. (“Prudential”).
24
4. Other Transactions with Affiliates
Prudential Mutual Fund Services LLC (“PMFS”), an affiliate of PGIM Investments and an indirect, wholly-owned subsidiary of Prudential, serves as the Fund’s transfer agent and shareholder servicing agent. Transfer agent’s fees and expenses in the Statement of Operations include certain out-of-pocket expenses paid to non-affiliates, where applicable.
The Fund may invest its overnight sweep cash in the PGIM Core Ultra Short Bond Fund (the “Core Fund”), a series of Prudential Investment Portfolios 2, registered under the 1940 Act and managed by PGIM Investments. PGIM Investments and/or its affiliates are paid fees or reimbursed for providing their services to the Core Fund. In addition to the realized and unrealized gains on investments in the Core Fund, earnings from such investments are disclosed on the Statement of Operations as “Affiliated dividend income”.
The Fund may enter into certain securities purchase or sale transactions under Board approved Rule 17a-7 procedures. Rule 17a-7 is an exemptive rule under the 1940 Act, that subject to certain conditions, permits purchase and sale transactions among affiliated investment companies, or between an investment company and a person that is affiliated solely by reason of having a common (or affiliated) investment adviser, common directors/trustees, and/or common officers. For the year ended August 31, 2024, no Rule 17a-7 transactions were entered into by the Fund.
5. Portfolio Securities
The aggregate cost of purchases and proceeds from sales of portfolio securities (excluding short-term investments and U.S. Government securities) for the reporting period ended August 31, 2024, were as follows:
| | |
| | |
Cost of Purchases | | Proceeds from Sales |
$166,088,449 | | $163,431,881 |
A summary of the cost of purchases and proceeds from sales of shares of affiliated mutual funds for the year ended August 31, 2024, is presented as follows:
| | | | | | | | | | | | | | | | | | | | | | |
| | | | | | | | |
Value,
Beginning of Year | | Cost of
Purchases | | Proceeds
from Sales | | Change in
Unrealized Gain (Loss) | |
| Realized
Gain (Loss) |
| |
| Value,
End of Year |
| |
| Shares,
End of Year |
| | | Income | |
| | | | |
Short-Term Investments -Affiliated Mutual Fund: | | | | | | | | | | | | | | | | |
| | | |
PGIM Core Ultra Short Bond Fund(1)(wb) | | | | | | | | | | | | | |
| $81,943 | | $152,735,046 | | $143,516,149 | | $— | | | $— | | | | $9,300,840 | | | | 9,300,840 | | | | $270,401 | |
| (1) | The Fund did not have any capital gain distributions during the reporting period. |
| (wb) | Represents an investment in a Fund affiliated with the Manager. |
PGIM California Muni Income Fund 25
Notes to Financial Statements (continued)
6. Distributions and Tax Information
Distributions to shareholders, which are determined in accordance with federal income tax regulations and which may differ from GAAP, are recorded on the ex-date.
For the year ended August 31, 2024, the tax character of dividends paid as reflected in the Statement of Changes in Net Assets were as follows:
| | | | | | | | |
| | | | | |
Ordinary Income | | Long-Term Capital Gains | | Tax Return of Capital | | Tax-Exempt Income | | Total Dividends and Distributions |
$334,346 | | $— | | $— | | $5,878,673 | | $6,213,019 |
For the year ended August 31, 2023, the tax character of dividends paid as reflected in the Statement of Changes in Net Assets were as follows:
| | | | | | | | |
| | | | | |
Ordinary Income | | Long-Term Capital Gains | | Tax Return of Capital | | Tax-Exempt Income | | Total Dividends and Distributions |
$39,065 | | $— | | $— | | $5,281,205 | | $5,320,270 |
For the year ended August 31, 2024, the Fund had the following amounts of accumulated undistributed earnings on a tax basis:
| | | | |
| | | |
Undistributed Ordinary Income | | Undistributed Long-Term Capital Gains | | Undistributed Tax Exempt Income |
$— | | $— | | $849,157 |
The United States federal income tax basis of the Fund’s investments and the net unrealized depreciation as of August 31, 2024 were as follows:
| | | | | | | | | | | | |
| | | | | | | |
Tax Basis | | | | Gross Unrealized Appreciation | | | | Gross Unrealized Depreciation | | | | Net Unrealized Depreciation |
$246,595,452 | | | | $3,096,223 | | | | $(3,392,532) | | | | $(296,309) |
The difference between GAAP basis and tax basis was primarily attributable to deferred losses on wash sales, differences in the treatment of accreting market discount for book and tax purposes, securities in default and other book to tax differences.
For federal income tax purposes, the Fund had an approximated capital loss carryforward as of August 31, 2024 which can be carried forward for an unlimited period. No capital gains
26
distributions are expected to be paid to shareholders until net gains have been realized in excess of such losses.
| | |
| | |
Capital Loss Carryforward | | Capital Loss Carryforward Utilized |
$4,192,000 | | $— |
The Manager has analyzed the Fund’s tax positions taken on federal, state and local income tax returns for all open tax years and has concluded that no provision for income tax is required in the Fund’s financial statements for the current reporting period. Since tax authorities can examine previously filed tax returns, the Fund’s U.S. federal and state tax returns for each of the four fiscal years up to the most recent fiscal year ended August 31, 2024 are subject to such review.
7. Capital and Ownership
The Fund offers Class A, Class C, Class Z and Class R6 shares. Class A shares are sold with a maximum front-end sales charge of 3.25%. Investors who purchase $500,000 or more of Class A shares and sell those shares within 12 months of purchase are subject to a CDSC of 1% on sales although these purchases are not subject to a front-end sales charge. The Class A CDSC is waived for certain retirement and/or benefit plans. A special exchange privilege is also available for shareholders who qualified to purchase Class A shares at net asset value. Class C shares are sold with a CDSC of 1% on sales made within 12 months of purchase. Class C shares will automatically convert to Class A shares on a monthly basis approximately eight years (ten years prior to January 22, 2021) after purchase. Class Z and Class R6 shares are not subject to any sales or redemption charges and are available exclusively for sale to a limited group of investors.
Under certain circumstances, an exchange may be made from specified share classes of the Fund to one or more other share classes of the Fund as presented in the table of transactions in shares of beneficial interest, below.
The RIC is permitted to issue an unlimited number of full and fractional shares, par value $0.01 per share, in separate series, currently designated as the PGIM California Muni Income Fund. The RIC is authorized to issue an unlimited number of shares, currently divided into five classes, designated Class A, Class B, Class C, Class Z and Class R6. The Fund currently does not have any Class B shares outstanding.
As of August 31, 2024, Prudential, through its affiliated entities, including affiliated funds (if applicable), owned shares of the Fund as follows:
| | | | | | | | |
| | | |
Class | | | Number of Shares | | | | Percentage of Outstanding Shares | |
R6 | | | 1,147 | | | | 0.1% | |
PGIM California Muni Income Fund 27
Notes to Financial Statements (continued)
At the reporting period end, the number of shareholders holding greater than 5% of the Fund are as follows:
| | | | | | | | |
| | | |
| | | | Number of Shareholders | | | | Percentage of Outstanding Shares | |
Affiliated | | | — | | | | —% | |
Unaffiliated | | | 6 | | | | 82.0 | |
Transactions in shares of beneficial interest were as follows:
| | | | | | | | |
| | | |
| Share Class | | Shares | | | Amount | |
| | |
Class A | | | | | | | | |
Year ended August 31, 2024: | | | | | | | | |
Shares sold | | | 2,010,214 | | | $ | 19,715,629 | |
Shares issued in reinvestment of dividends and distributions | | | 263,283 | | | | 2,574,124 | |
Shares purchased | | | (3,446,644 | ) | | | (33,224,351 | ) |
Net increase (decrease) in shares outstanding before conversion | | | (1,173,147 | ) | | | (10,934,598 | ) |
Shares issued upon conversion from other share class(es) | | | 230,714 | | | | 2,255,465 | |
Shares purchased upon conversion into other share class(es) | | | (431,987 | ) | | | (4,263,438 | ) |
Net increase (decrease) in shares outstanding | | | (1,374,420 | ) | | $ | (12,942,571 | ) |
| | |
Year ended August 31, 2023: | | | | | | | | |
Shares sold | | | 2,199,841 | | | $ | 21,301,262 | |
Shares issued in reinvestment of dividends and distributions | | | 262,476 | | | | 2,543,841 | |
Shares purchased | | | (3,334,271 | ) | | | (32,271,276 | ) |
Net increase (decrease) in shares outstanding before conversion | | | (871,954 | ) | | | (8,426,173 | ) |
Shares issued upon conversion from other share class(es) | | | 146,823 | | | | 1,430,975 | |
Shares purchased upon conversion into other share class(es) | | | (125,734 | ) | | | (1,224,146 | ) |
Net increase (decrease) in shares outstanding | | | (850,865 | ) | | $ | (8,219,344 | ) |
| | |
Class C | | | | | | | | |
Year ended August 31, 2024: | | | | | | | | |
Shares sold | | | 18,245 | | | $ | 178,307 | |
Shares issued in reinvestment of dividends and distributions | | | 8,878 | | | | 86,656 | |
Shares purchased | | | (133,811 | ) | | | (1,303,285 | ) |
Net increase (decrease) in shares outstanding before conversion | | | (106,688 | ) | | | (1,038,322 | ) |
Shares purchased upon conversion into other share class(es) | | | (196,383 | ) | | | (1,920,760 | ) |
Net increase (decrease) in shares outstanding | | | (303,071 | ) | | $ | (2,959,082 | ) |
28
| | | | | | | | |
| | | |
| Share Class | | Shares | | | Amount | |
| | |
Year ended August 31, 2023: | | | | | | | | |
Shares sold | | | 95,233 | | | $ | 923,658 | |
Shares issued in reinvestment of dividends and distributions | | | 11,703 | | | | 113,389 | |
Shares purchased | | | (225,418 | ) | | | (2,189,160 | ) |
Net increase (decrease) in shares outstanding before conversion | | | (118,482 | ) | | | (1,152,113 | ) |
Shares purchased upon conversion into other share class(es) | | | (118,029 | ) | | | (1,149,742 | ) |
Net increase (decrease) in shares outstanding | | | (236,511 | ) | | $ | (2,301,855 | ) |
| | |
Class Z | | | | | | | | |
| | |
Year ended August 31, 2024: | | | | | | | | |
Shares sold | | | 6,292,125 | | | $ | 61,255,994 | |
Shares issued in reinvestment of dividends and distributions | | | 271,244 | | | | 2,655,574 | |
Shares purchased | | | (4,709,650 | ) | | | (45,479,628 | ) |
Net increase (decrease) in shares outstanding before conversion | | | 1,853,719 | | | | 18,431,940 | |
Shares issued upon conversion from other share class(es) | | | 443,512 | | | | 4,376,142 | |
Shares purchased upon conversion into other share class(es) | | | (34,331 | ) | | | (334,705 | ) |
Net increase (decrease) in shares outstanding | | | 2,262,900 | | | $ | 22,473,377 | |
| | |
Year ended August 31, 2023: | | | | | | | | |
Shares sold | | | 6,330,510 | | | $ | 61,154,535 | |
Shares issued in reinvestment of dividends and distributions | | | 195,724 | | | | 1,899,196 | |
Shares purchased | | | (3,775,398 | ) | | | (36,486,581 | ) |
Net increase (decrease) in shares outstanding before conversion | | | 2,750,836 | | | | 26,567,150 | |
Shares issued upon conversion from other share class(es) | | | 119,650 | | | | 1,166,103 | |
Shares purchased upon conversion into other share class(es) | | | (29,191 | ) | | | (284,949 | ) |
Net increase (decrease) in shares outstanding | | | 2,841,295 | | | $ | 27,448,304 | |
| | |
Class R6 | | | | | | | | |
| | |
Year ended August 31, 2024: | | | | | | | | |
Shares sold | | | 1,010,919 | | | $ | 9,860,103 | |
Shares issued in reinvestment of dividends and distributions | | | 70,358 | | | | 688,594 | |
Shares purchased | | | (678,855 | ) | | | (6,609,612 | ) |
Net increase (decrease) in shares outstanding before conversion | | | 402,422 | | | | 3,939,085 | |
Shares issued upon conversion from other share class(es) | | | 4,433 | | | | 43,537 | |
Shares purchased upon conversion into other share class(es) | | | (15,957 | ) | | | (156,241 | ) |
Net increase (decrease) in shares outstanding | | | 390,898 | | | $ | 3,826,381 | |
| | |
Year ended August 31, 2023: | | | | | | | | |
Shares sold | | | 1,260,716 | | | $ | 12,201,932 | |
Shares issued in reinvestment of dividends and distributions | | | 55,091 | | | | 533,890 | |
Shares purchased | | | (1,178,067 | ) | | | (11,406,286 | ) |
Net increase (decrease) in shares outstanding before conversion | | | 137,740 | | | | 1,329,536 | |
Shares issued upon conversion from other share class(es) | | | 20,509 | | | | 198,722 | |
Shares purchased upon conversion into other share class(es) | | | (14,048 | ) | | | (136,963 | ) |
Net increase (decrease) in shares outstanding | | | 144,201 | | | $ | 1,391,295 | |
PGIM California Muni Income Fund 29
Notes to Financial Statements (continued)
8. Borrowings
The RIC, on behalf of the Fund, along with other affiliated registered investment companies (the “Participating Funds”), is a party to a Syndicated Credit Agreement (“SCA”) with a group of banks. The purpose of the SCA is to provide an alternative source of temporary funding for capital share redemptions. The table below provides details of the current SCA in effect at the reporting period-end as well as the prior SCA.
| | | | | | |
| | | | |
| | | Current SCA | | | | Prior SCA |
Term of Commitment | | 9/29/2023 - 9/26/2024 | | | | 9/30/2022 – 9/28/2023 |
Total Commitment | | $ 1,200,000,000 | | | | $ 1,200,000,000 |
Annualized Commitment Fee on the Unused Portion of the SCA | | 0.15% | | | | 0.15% |
Annualized Interest Rate on Borrowings | | 1.00% plus the higher of (1) the effective federal funds rate, (2) the daily SOFR rate plus 0.10% or (3) zero percent | | | | 1.00% plus the higher of (1) the effective federal funds rate, (2) the daily SOFR rate plus 0.10% or (3) zero percent |
Subsequent to the reporting period end, the SCA has been renewed and effective September 27, 2024 will provide a commitment of $1,200,000,000 through September 25, 2025. The commitment fee allocated to the Participating Funds will continue to be 0.15% of the unused portion of the SCA. The interest on borrowings under the renewed SCA will be paid monthly and at a per annum interest rate of 1.00% plus the higher of (1) the effective federal funds rate, (2) the daily SOFR rate plus 0.10% or (3) zero percent.
Certain affiliated registered investment companies that are parties to the SCA include portfolios that are subject to a predetermined mathematical formula used to manage certain benefit guarantees offered under variable annuity contracts. The formula may result in large scale asset flows into and out of these portfolios. Consequently, these portfolios may be more likely to utilize the SCA for purposes of funding redemptions. It may be possible for those portfolios to fully exhaust the committed amount of the SCA, thereby requiring the Manager to allocate available funding per a Board-approved methodology designed to treat the Participating Funds in the SCA equitably.
The Fund did not utilize the SCA during the year ended August 31, 2024.
9. Risks of Investing in the Fund
The Fund’s risks include, but are not limited to, some or all of the risks discussed below. For further information on the Fund’s risks, please refer to the Fund’s Prospectus and Statement of Additional Information.
30
California Municipal Bonds Risk: Because the Fund will concentrate its investments in California obligations, the Fund is more susceptible to economic, political and other developments that may adversely affect issuers of California obligations than a municipal bond fund that is not as geographically concentrated. These developments may include state or local legislation or policy changes, voter-passed initiatives, erosion of the tax base or reduction in revenues of the State or one or more local governments, the threat or the effects of terrorist acts, the effects of possible natural disasters (including but limited to the risk of earthquakes, climate change, flooding and wildfires) or other economic or credit problems affecting the State generally or any individual locality (which may directly or indirectly affect the State as a whole, including those described in the SAI under “California Concentration”). By way of illustration, although California has a relatively diversified economy, California has concentrations in the computer services, software design, motion pictures and high technology manufacturing industries. The Fund, therefore, may be more susceptible to developments affecting those industries than a municipal bond fund that invests in obligations of several states.
Credit Risk: This is the risk that the issuer, the guarantor or the insurer of a fixed income security, or the counterparty to a contract, may be unable or unwilling to make timely principal and interest payments, or to otherwise honor its obligations. Additionally, fixed income securities could lose value due to a loss of confidence in the ability of the issuer, guarantor, insurer or counterparty to pay back debt. The lower the credit quality of a bond, the more sensitive it is to credit risk.
Debt Obligations Risk: Debt obligations are fixed income investments that are subject to credit risk, market risk and interest rate risk. The Fund’s holdings, share price, yield and total return may also fluctuate in response to bond market movements. The value of bonds may decline for issuer-related reasons, including management performance, financial leverage and reduced demand for the issuer’s goods and services. Certain types of fixed income obligations also may be subject to “call and redemption risk,” which is the risk that the issuer may call a bond held by the Fund for redemption before it matures and the Fund may not be able to reinvest at the same rate of interest and therefore would earn less income.
Economic and Market Events Risk: Events in the U.S. and global financial markets, including actions taken by the U.S. Federal Reserve or foreign central banks to stimulate or stabilize economic growth or the functioning of the securities markets, or otherwise reduce inflation, may at times result in unusually high market volatility, which could negatively impact performance. Governmental efforts to curb inflation often have negative effects on the level of economic activity. Relatively reduced liquidity in credit and fixed income markets could adversely affect issuers worldwide.
Increase in Expenses Risk: Your actual cost of investing in the Fund may be higher than the expenses shown in the expense table in the Fund’s for a variety of reasons. For example, expense ratios may be higher than those shown if average net assets decrease. Net assets
PGIM California Muni Income Fund 31
Notes to Financial Statements (continued)
are more likely to decrease and Fund expense ratios are more likely to increase when markets are volatile. Active and frequent trading of Fund securities can increase expenses.
Insured Municipal Bonds Risk: The Fund may purchase municipal bonds that are insured to attempt to reduce credit risk. Although insurance coverage reduces credit risk by providing that the insurer will make timely payment of interest and/or principal, it does not provide protection against market fluctuations of insured bonds or fluctuations in the price of the shares of the Fund. An insured municipal bond fluctuates in value largely based on factors relating to the insurer’s creditworthiness or ability to satisfy its obligations. The Fund cannot be certain that any insurance company will make the payments it guarantees.
Interest Rate Risk: The value of your investment may go down when interest rates rise. A rise in rates tends to have a greater impact on the prices of longer term or duration debt securities. Similarly, a rise in interest rates may also have a greater negative impact on the value of equity securities whose issuers expect earnings further out in the future. For example, a fixed income security with a duration of three years is expected to decrease in value by approximately 3% if interest rates increase by 1%. This is referred to as “duration risk.” When interest rates fall, the issuers of debt obligations may prepay principal more quickly than expected, and the Fund may be required to reinvest the proceeds at a lower interest rate. This is referred to as “prepayment risk.” For premium bonds (bonds acquired at prices that exceed their par or principal value) purchased by the Fund, prepayment risk may be enhanced. When interest rates rise, debt obligations may be repaid more slowly than expected, and the value of the Fund’s holdings may fall sharply. This is referred to as “extension risk.” The Fund may lose money if short-term or long-term interest rates rise sharply or in a manner not anticipated by the subadviser.
Junk Bonds Risk: High-yield, high-risk bonds have predominantly speculative characteristics, including particularly high credit risk. Junk bonds tend to have lower market liquidity than higher-rated securities. The liquidity of particular issuers or industries within a particular investment category may shrink or disappear suddenly and without warning. The non-investment grade bond market can experience sudden and sharp price swings and become illiquid due to a variety of factors, including changes in economic forecasts, stock market activity, large sustained sales by major investors, a high profile default or a change in the market’s psychology.
Large Shareholder and Large Scale Redemption Risk: Certain individuals, accounts, funds (including funds affiliated with the Manager) or institutions, including the Manager and its affiliates, may from time to time own or control a substantial amount of the Fund’s shares. There is no requirement that these entities maintain their investment in the Fund. There is a risk that such large shareholders or that the Fund’s shareholders generally may redeem all or a substantial portion of their investments in the Fund in a short period of time, which
32
could have a significant negative impact on the Fund’s NAV, liquidity, and brokerage costs. Large redemptions could also result in tax consequences to shareholders and impact the Fund’s ability to implement its investment strategy. The Fund’s ability to pursue its investment objective after one or more large scale redemptions may be impaired and, as a result, the Fund may invest a larger portion of its assets in cash or cash equivalents.
Liquidity Risk: Liquidity risk is the risk that the Fund could not meet requests to redeem shares issued by the Fund without significant dilution of remaining investors’ interests in the Fund. The Fund may invest in instruments that trade in lower volumes and are more illiquid than other investments. If the Fund is forced to sell these investments to pay redemption proceeds or for other reasons, the Fund may lose money. In addition, when there is no willing buyer and investments cannot be readily sold at the desired time or price, the Fund may have to accept a lower price or may not be able to sell the instrument at all. An inability to sell a portfolio position can adversely affect the Fund’s value or prevent the Fund from being able to take advantage of other investment opportunities.
Management Risk: Actively managed funds are subject to management risk. The subadviser will apply investment techniques and risk analyses in making investment decisions for the Fund, but the subadviser’s judgments about the attractiveness, value or market trends affecting a particular security, industry or sector or about market movements may be incorrect. Additionally, the investments selected for the Fund may underperform the markets in general, the Fund’s benchmark and other funds with similar investment objectives.
Market Disruption and Geopolitical Risks: Market disruption can be caused by economic, financial or political events and factors, including but not limited to, international wars or conflicts (including Russia’s military invasion of Ukraine and the Israel-Hamas war), geopolitical developments (including trading and tariff arrangements, sanctions and cybersecurity attacks), instability in regions such as Asia, Eastern Europe and the Middle East, terrorism, natural disasters and public health epidemics (including the outbreak of COVID-19 globally).
The extent and duration of such events and resulting market disruptions cannot be predicted, but could be substantial and could magnify the impact of other risks to the Fund. These and other similar events could adversely affect the U.S. and foreign financial markets and lead to increased market volatility, reduced liquidity in the securities markets, significant negative impacts on issuers and the markets for certain securities and commodities and/or government intervention. They may also cause short- or long-term economic uncertainties in the United States and worldwide. As a result, whether or not the Fund invests in securities of issuers located in or with significant exposure to the countries directly affected, the value and liquidity of the Fund’s investments may be negatively impacted. Further, due to closures of certain markets and restrictions on trading certain securities, the value of certain securities held by the Fund could be significantly impacted, which could lead to such securities being valued at zero.
PGIM California Muni Income Fund 33
Notes to Financial Statements (continued)
Market Risk: Securities markets may be volatile and the market prices of the Fund’s securities may decline. Securities fluctuate in price based on changes in an issuer’s financial condition and overall market and economic conditions. If the market prices of the securities owned by the Fund fall, the value of your investment in the Fund will decline.
Municipal Bonds Risk: Municipal bonds are subject to credit risk, market risk and interest rate risk. The Fund’s holdings, share price, yield and total return may also fluctuate in response to municipal bond market movements. Municipal bonds are also subject to the risk that potential future legislative changes relating to tax or the rights of municipal bond holders, for example in connection with an insolvency, could affect the market for and value of municipal bonds, which may adversely affect the Fund’s yield or the value of the Fund’s investments in municipal bonds. Certain municipal bonds with principal and interest payments that are made from the revenues of a specific project or facility, and not general tax revenues, may have increased risks. Factors affecting the project or facility, such as local business or economic conditions, could have a significant effect on the project’s ability to make payments of principal and interest on these securities. If the Fund invests a substantial amount of its assets in issuers located in a single region, state or city, there is an increased risk that environmental, economic, political and social conditions in those regions will have a significant impact on the Fund’s investment performance. For example, municipal securities of a particular state are vulnerable to events adversely affecting that state, including economic, political and regulatory occurrences, court decisions, terrorism, public health epidemics, social unrest and catastrophic natural disasters, such as hurricanes or earthquakes. Many municipal bonds are also subject to prepayment risk, which is the risk that when interest rates fall, issuers may redeem a security by repaying it early, which may reduce the Fund’s income if the proceeds are reinvested at a lower interest rate. In addition, income from municipal bonds could be declared taxable because of non-compliant conduct of a bond issuer.
34
Report of Independent Registered Public Accounting Firm
To the Board of Trustees of Prudential Investment Portfolios 6 and Shareholders of PGIM California Muni Income Fund
Opinion on the Financial Statements
We have audited the accompanying statement of assets and liabilities, including the schedule of investments, of PGIM California Muni Income Fund (the “Fund”) as of August 31, 2024, the related statement of operations for the year ended August 31, 2024, the statements of changes in net assets for each of the two years in the period ended August 31, 2024, including the related notes, and the financial highlights for each of the four years in the period ended August 31, 2024 (collectively referred to as the “financial statements”). In our opinion, the financial statements present fairly, in all material respects, the financial position of the Fund as of August 31, 2024, the results of its operations for the year then ended, the changes in its net assets for each of the two years in the period ended August 31, 2024 and the financial highlights for each of the four years in the period ended August 31, 2024 in conformity with accounting principles generally accepted in the United States of America.
The financial statements of the Fund as of and for the year ended August 31, 2020 and the financial highlights for each of the periods ended on or prior to August 31, 2020 (not presented herein, other than the financial highlights) were audited by other auditors whose report dated October 15, 2020 expressed an unqualified opinion on those financial statements and financial highlights.
Basis for Opinion
These financial statements are the responsibility of the Fund’s management. Our responsibility is to express an opinion on the Fund’s financial statements based on our audits. We are a public accounting firm registered with the Public Company Accounting Oversight Board (United States) (PCAOB) and are required to be independent with respect to the Fund in accordance with the U.S. federal securities laws and the applicable rules and regulations of the Securities and Exchange Commission and the PCAOB.
We conducted our audits of these financial statements in accordance with the standards of the PCAOB. Those standards require that we plan and perform the audit to obtain reasonable assurance about whether the financial statements are free of material misstatement, whether due to error or fraud.
Our audits included performing procedures to assess the risks of material misstatement of the financial statements, whether due to error or fraud, and performing procedures that respond to those risks. Such procedures included examining, on a test basis, evidence regarding the amounts and disclosures in the financial statements. Our audits also included evaluating the accounting principles used and significant estimates made by management, as well as evaluating the overall presentation of the financial statements. Our procedures included confirmation of securities owned as of August 31, 2024 by correspondence with the custodian, transfer agent and brokers; when replies were not received from brokers, we performed other auditing procedures. We believe that our audits provide a reasonable basis for our opinion.
/s/PricewaterhouseCoopers LLP
New York, New York
October 22, 2024
We have served as the auditor of one or more investment companies in the PGIM Retail Funds complex since 2020.
PGIM California Muni Income Fund 35
Other Information
Form N-CSR Item 8 - Changes in and Disagreements with Accountants for Open-End Management Investment Companies - None.
Form N-CSR Item 9 - Proxy Disclosures for Open-End Management Investment Companies-None.
Form N-CSR Item 10 - Remuneration Paid to Directors, Officers, and Others of Open-End Management Investment Companies – Included as part of the financial statements filed under Item 7 of this Form.
Form N-CSR Item 11 - Statement Regarding Basis for Approval of Investment Advisory Contract.
Approval of Advisory Agreements
The Fund’s Board of Trustees
The Board of Trustees (the “Board”) of PGIM California Muni Income Fund (the “Fund”)1 consists of ten individuals, eight of whom are not “interested persons” of the Fund, as defined in the Investment Company Act of 1940, as amended (the “1940 Act”) (the “Independent Trustees”). The Board is responsible for the oversight of the Fund and its operations, and performs the various duties imposed on the directors of investment companies by the 1940 Act. The Independent Trustees have retained independent legal counsel to assist them in connection with their duties. The Chair of the Board is an Independent Trustee. The Board has established five standing committees: the Audit Committee, the Nominating and Governance Committee, the Compliance Committee and two Investment Committees. Each committee is chaired by, and composed of, Independent Trustees.
Annual Approval of the Fund’s Advisory Agreements
As required under the 1940 Act, the Board determines annually whether to renew the Fund’s management agreement with PGIM Investments LLC (“PGIM Investments”) and the Fund’s subadvisory agreement with PGIM, Inc. (“PGIM”), on behalf of its PGIM Fixed Income unit (“PGIM Fixed Income”). In considering the renewal of the agreements, the Board, including all of the Independent Trustees, met on May 28 and June 4-6, 2024 (the “Board Meeting”) and approved the renewal of the agreements through July 31, 2025, after concluding that the renewal of the agreements was in the best interests of the Fund and its shareholders.
In advance of the meetings, the Board requested and received materials relating to the agreements, and had the opportunity to ask questions and request further information in connection with its consideration. Among other things, the Board considered comparative fee information from PGIM Investments and PGIM. Also, the Board considered comparisons with other mutual funds in relevant peer universes and peer groups, as is further discussed below.
In approving the agreements, the Board, including the Independent Trustees advised by independent legal counsel, considered the factors it deemed relevant, including the nature, quality and extent of services provided by PGIM Investments and the subadviser, the performance of the Fund, the profitability of PGIM Investments and its affiliates, expenses and fees, and the potential for economies of scale that may be shared with the Fund and its shareholders as the Fund’s assets grow. In their deliberations, the Trustees did not identify any single factor which alone was responsible for the Board’s decision to approve an
| 1 | PGIM California Muni Income Fund is the sole outstanding series of Prudential Investment Portfolios 6. |
PGIM California Muni Income Fund
Approval of Advisory Agreements (continued)
agreement with respect to the Fund. In connection with its deliberations, the Board considered information provided by PGIM Investments throughout the year at regular and special Board meetings, presentations from portfolio managers and other information, as well as information furnished at or in advance of the Board Meeting.
The Trustees determined that the overall arrangements between the Fund and PGIM Investments, which serves as the Fund’s investment manager pursuant to a management agreement with the Fund, and between PGIM Investments and PGIM, which, through its PGIM Fixed Income unit, serves as subadviser pursuant to the terms of a subadvisory agreement with PGIM Investments, are in the best interests of the Fund and its shareholders in light of the services performed, fees charged and such other matters as the Trustees considered relevant in the exercise of their business judgment. The Board considered the approval of the agreements for the Fund as part of its consideration of agreements for multiple funds, but its approvals were made on a fund-by-fund basis.
The material factors and conclusions that formed the basis for the Trustees’ determinations to approve the continuance of the agreements are separately discussed below.
Nature, Quality, and Extent of Services
The Board requested and received information regarding the nature, quality and extent of services provided to the Fund by PGIM Investments and PGIM Fixed Income. The Board noted that PGIM Fixed Income is affiliated with PGIM Investments. The Board considered the services provided by PGIM Investments, including but not limited to the oversight of the subadviser, as well as the provision of accounting oversight, fund recordkeeping, compliance and other services to the Fund, such as PGIM Investments’ role as administrator for the Fund’s liquidity risk management program and as valuation designee. With respect to PGIM Investments’ oversight of the subadviser, the Board noted that PGIM Investments’ Strategic Investment Research Group (“SIRG”), which is a business unit of PGIM Investments, is responsible for monitoring and reporting to PGIM Investments’ senior management on the performance and operations of the subadviser. The Board also considered that PGIM Investments pays the salaries of all of the officers and interested Trustees of the Fund who are part of Fund management. The Board also considered the investment subadvisory services provided by PGIM Fixed Income, including investment research and security selection as well as adherence to the Fund’s investment restrictions and compliance with applicable Fund policies and procedures. The Board considered PGIM Investments’ evaluation of the subadviser as well as PGIM Investments’ recommendation, based on its review of the subadviser, to renew the subadvisory agreement.
The Board considered the qualifications, backgrounds and responsibilities of PGIM Investments’ senior management responsible for the oversight of the Fund and PGIM Fixed
Visit our website at pgim.com/investments
Income, and also considered the qualifications, backgrounds and responsibilities of the subadviser’s portfolio managers who are responsible for the day-to-day management of the Fund’s portfolio. The Board was provided with information pertaining to PGIM Investments’ and PGIM Fixed Income’s organizational structure, senior management, investment operations, and other relevant information pertaining to both PGIM Investments and PGIM Fixed Income. The Board also noted that it received favorable compliance reports from the Fund’s Chief Compliance Officer (“CCO”) as to both PGIM Investments and PGIM Fixed Income.
The Board concluded that it was satisfied with the nature, extent and quality of the investment management services provided by PGIM Investments and the subadvisory services provided to the Fund by PGIM Fixed Income, and that there was a reasonable basis on which to conclude that the Fund benefits from the services provided by PGIM Investments and PGIM Fixed Income under the management and subadvisory agreements.
Costs of Services and Profits Realized by PGIM Investments
The Board was provided with information on the profitability of PGIM Investments and its affiliates in serving as the Fund’s investment manager. The Board discussed with PGIM Investments the methodology utilized in assembling the information regarding profitability and considered its reasonableness. The Board recognized that it is difficult to make comparisons of profitability from fund management contracts because comparative information is not generally publicly available and is affected by numerous factors, including the structure of the particular adviser, the types of funds it manages, its business mix, numerous assumptions regarding allocations of direct and indirect costs, and the adviser’s capital structure and cost of capital. However, the Board considered that the cost of services provided by PGIM Investments during the year ended December 31, 2023 exceeded the management fees paid by the Fund, resulting in an operating loss to PGIM Investments. Taking these factors into account, the Board concluded that the profitability of PGIM Investments and its affiliates in relation to the services rendered was not unreasonable.
Economies of Scale
The Board received and discussed information concerning economies of scale that PGIM Investments may realize as the Fund’s assets grow beyond current levels. The Board noted that the management fee schedule for the Fund includes breakpoints, which have the effect of decreasing the fee rate as assets increase. During the course of time, the Board has considered information regarding the launch date of the Fund, the management fees of the Fund compared to those of similarly managed funds and PGIM Investments’ investment in the Fund over time. The Board noted that economies of scale can be shared with the Fund in other ways, including low management fees from inception, additional technological and personnel investments to enhance shareholder services, and maintaining
PGIM California Muni Income Fund
Approval of Advisory Agreements (continued)
existing expense structures in the face of a rising cost environment. The Board also considered PGIM Investments’ assertion that it continually evaluates the management fee schedule of the Fund and the potential to share economies of scale through breakpoints or fee waivers as asset levels increase.
The Board recognized the inherent limitations of any analysis of economies of scale, stemming largely from the Board’s understanding that most of PGIM Investments’ costs are not specific to individual funds, but rather are incurred across a variety of products and services.
Other Benefits to PGIM Investments and PGIM Fixed Income
The Board considered potential ancillary benefits that might be received by PGIM Investments and PGIM Fixed Income and their affiliates as a result of their relationship with the Fund. The Board concluded that potential benefits to be derived by PGIM Investments included transfer agency fees received by the Fund’s transfer agent (which is affiliated with PGIM Investments), as well as benefits to its reputation or other intangible benefits resulting from PGIM Investments’ association with the Fund. The Board concluded that the potential benefits to be derived by PGIM Fixed Income included those generally resulting from an increase in assets under management, specifically, potential access to additional research resources and benefits to its reputation. The Board concluded that the benefits derived by PGIM Investments and PGIM Fixed Income were consistent with the types of benefits generally derived by investment managers and subadvisers to mutual funds.
Performance of the Fund / Fees and Expenses
The Board considered certain additional factors and made related conclusions relating to the historical performance of the Fund for the one-, three-, five- and ten-year periods ended December 31, 2023.
The Board also considered the Fund’s actual management fee, as well as the Fund’s net total expense ratio, for the fiscal year ended August 31, 2023. The Board considered the management fee for the Fund as compared to the management fee charged by PGIM Investments to other funds and the fee charged by other advisers to comparable mutual funds in a peer group. The actual management fee represents the fee rate actually paid by Fund shareholders and includes any fee waivers or reimbursements. The net total expense ratio for the Fund represents the actual expense ratio incurred by Fund shareholders.
The mutual funds included in the peer universe, which was used to consider performance, and the peer group, which was used to consider expenses and fees, were objectively determined by Broadridge, an independent provider of mutual fund data. In certain circumstances, PGIM Investments also provided supplemental peer universe or peer group
Visit our website at pgim.com/investments
information, for reasons addressed with the Board. The comparisons placed the Fund in various quartiles over various periods, with the first quartile being the best 25% of the mutual funds (for performance, the best performing mutual funds and, for expenses, the lowest cost mutual funds).
The section below summarizes key factors considered by the Board and the Board’s conclusions regarding the Fund’s performance, fees and overall expenses. The table sets forth net performance comparisons (which reflect the impact on performance of fund expenses, or any subsidies, expense caps or waivers that may be applicable) with the peer universe, actual management fees with the peer group (which reflect the impact of any subsidies or fee waivers), and net total expenses with the peer group, each of which were key factors considered by the Board.
| | | | | | | | |
| | | | | |
Net Performance | | 1 Year | | 3 Years | | 5 Years | | 10 Years |
| | 1st Quartile | | 2nd Quartile | | 2nd Quartile | | 1st Quartile |
| |
Actual Management Fees: 1st Quartile |
| |
Net Total Expenses: 1st Quartile |
| · | | The Board noted that the Fund outperformed its benchmark index over the one-year period and underperformed its benchmark index over the three-, and five-year periods and that performance data for the benchmark index over the ten-year period was unavailable. |
| · | | The Board considered that the Fund outperformed its benchmark index for four of the past seven calendar years (gross of fees). |
| · | | The Board and PGIM Investments agreed to retain the existing cap on Fund expenses that (exclusive of certain fees and expenses) caps total annual operating expenses at 0.39% for Class Z shares and 0.38% for Class R6 shares, through December 31, 2024. |
| · | | In addition, PGIM Investments will waive management fees or shared operating expenses on any share class to the same extent that it waives such expenses on any other share class, and has agreed that total annual fund operating expenses for Class R6 shares will not exceed total annual fund operating expenses for Class Z shares. |
| · | | The Board concluded that, in light of the above, it would be in the best interests of the Fund and its shareholders to continue to monitor Fund performance and to renew the agreements. |
| · | | The Board concluded that the management fees (including subadvisory fees) and total expenses were reasonable in light of the services provided. |
* * *
After full consideration of these factors, the Board concluded that the approval of the agreements was in the best interests of the Fund and its shareholders.
PGIM California Muni Income Fund
| Item 12 – | Disclosure of Proxy Voting Policies and Procedures for Closed-End Management Investment Companies – Not applicable. |
| Item 13 – | Portfolio Managers of Closed-End Management Investment Companies – Not applicable. |
| Item 14 – | Purchases of Equity Securities by Closed-End Management Investment Company and Affiliated Purchasers – Not applicable. |
| Item 15 – | Submission of Matters to a Vote of Security Holders – There have been no material changes to the procedures by which shareholders may recommend nominees to the registrant’s board of directors. |
| Item 16 – | Controls and Procedures |
| | (a) | It is the conclusion of the registrant’s principal executive officer and principal financial officer that the effectiveness of the registrant’s current disclosure controls and procedures (such disclosure controls and procedures having been evaluated within 90 days of the date of this filing) provide reasonable assurance that the information required to be disclosed by the registrant has been recorded, processed, summarized and reported within the time period specified in the Commission’s rules and forms and that the information required to be disclosed by the registrant has been accumulated and communicated to the registrant’s principal executive officer and principal financial officer in order to allow timely decisions regarding required disclosure. |
| | (b) | There has been no significant change in the registrant’s internal control over financial reporting (as defined in Rule 30a-3(d) under the Act (17 CFR 270.30a-3(d))) that occurred during the period covered by this report that has materially affected, or is reasonably likely to materially affect, the registrant’s internal control over financial reporting. |
| Item 17 – | Disclosure of Securities Lending Activities for Closed-End Management Investment Companies – Not applicable. |
| Item 18 – | Recovery of Erroneously Awarded Compensation – Not applicable. |
| | (a)(2) | Policy required by the listing standards adopted pursuant to Rule 10D-1 under the Securities Exchange Act of 1934 – Not applicable. |
| | (a)(3)(1) | Any written solicitation to purchase securities under Rule 23c-1 under the Investment Company Act of 1940 – Not applicable. |
| | (a)(3)(2) | Change in the registrant’s independent public accountant – Not applicable. |
SIGNATURES
Pursuant to the requirements of the Securities Exchange Act of 1934 and the Investment Company Act of 1940, the registrant has duly caused this report to be signed on its behalf by the undersigned, thereunto duly authorized.
| | |
| Registrant: | | Prudential Investment Portfolios 6 |
| |
| By: | | /s/ Andrew R. French |
| | Andrew R. French |
| | Secretary |
| |
| Date: | | October 22, 2024 |
Pursuant to the requirements of the Securities Exchange Act of 1934 and the Investment Company Act of 1940, this report has been signed below by the following persons on behalf of the registrant and in the capacities and on the dates indicated.
| | |
| By: | | /s/ Stuart S. Parker |
| | Stuart S. Parker |
| | President and Principal Executive Officer |
| |
| Date: | | October 22, 2024 |
| | |
| By: | | /s/ Christian J. Kelly |
| | Christian J. Kelly |
| | Chief Financial Officer (Principal Financial Officer) |
| |
| Date: | | October 22, 2024 |