UNITED STATES
SECURITIES AND EXCHANGE COMMISSION
WASHINGTON, D.C. 20549
FORM N-CSR
CERTIFIED SHAREHOLDER REPORT OF REGISTERED MANAGEMENT
INVESTMENT COMPANIES
Investment Company Act file number 811-1810
Oppenheimer Global Fund
(Exact name of registrant as specified in charter)
6803 South Tucson Way, Centennial, Colorado 80112-3924
(Address of principal executive offices) (Zip code)
Cynthia Lo Bessette
OFI Global Asset Management, Inc.
225 Liberty Street, New York, New York 10281-1008
(Name and address of agent for service)
Registrant’s telephone number, including area code: (303) 768-3200
Date of fiscal year end: September 30
Date of reporting period: 9/30/2016
Item 1. Reports to Stockholders.
Table of Contents
Class A Shares
AVERAGE ANNUAL TOTAL RETURNS AT 9/30/16
| | | | | | |
| | | Class A Shares of the Fund | | |
| | | Without Sales Charge | | With Sales Charge | | MSCI All Country (AC) World Index |
| 1-Year | | 5.62% | | -0.46% | | 11.96% |
| 5-Year | | 11.56 | | 10.25 | | 10.63 |
| 10-Year | | 4.93 | | 4.31 | | 4.34 |
Performance data quoted represents past performance, which does not guarantee future results. The investment return and principal value of an investment in the Fund will fluctuate so that an investor’s shares, when redeemed, may be worth more or less than their original cost. Fund returns include changes in share price, reinvested distributions, and a 5.75% maximum applicable sales charge except where “without sales charge” is indicated. Current performance may be lower or higher than the performance quoted. Returns do not consider capital gains or income taxes on an individual’s investment. For performance data current to the most recent month-end, visit oppenheimerfunds.com or call 1.800.CALL OPP (225.5677). See Fund prospectuses and summary prospectuses for more information on share classes and sales charges.
2 OPPENHEIMER GLOBAL FUND
Fund Performance Discussion
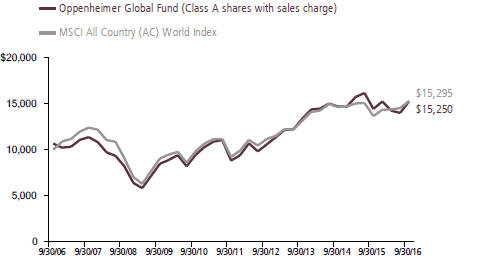
For the period ended September 30, 2016 the Fund returned 5.62% versus the MSCI All Country World Index, its benchmark, which returned 11.96%.
After a reasonable 2015, where the Fund meaningfully outperformed its benchmark, the first half of 2016 proved to be completely the opposite. Virtually all the Fund’s underperformance occurred during the first half of 2016. During that time, the market dislocation that resulted from expectations of the Federal Reserve (the “Fed”) raising rates this year led to a severe underperformance of all things growth related. Perceived safety and stability were sought after as were the dogs of the previous year. This meant that the best performing segments of the market were utilities, commodities and all things with bond-like characteristics. Oil rebounded from its year end lows and brought hope to some
that we were in for a return to prices seen in early 2015. Our orientation towards long-term growth companies was not the flavor of the market during this time. The political season too hurt some of our companies, particularly in health care where the posturing over price controls and eagerness to demonstrate populist rhetoric has particularly hurt the biotechnology sector. We did not help ourselves either by our choice of European financials, which were hit hard during the first half of 2016, as European policy makers seemed not to be able to get out of their own way and exacerbated the crisis in financials that has continued for the better part of this decade.
COMPARISON OF CHANGE IN VALUE OF $10,000 HYPOTHETICAL INVESTMENTS IN:
|
| 3 OPPENHEIMER GLOBAL FUND |
However, the environment shifted over the third quarter of 2016. Market results were good in the third quarter, and our results were good as well, with the Fund’s Class A shares (without sales charge) returning 8.89% over the third quarter. The benchmark returned 5.30% over that same period. Cyclicals performed better during the third quarter, especially among the consumer discretionary and information technology sectors. The performance of bond proxies in the consumer staples, telecommunication services, and utilities sectors, which surged in the first half of the year were relatively weak in the third quarter. Financials bounced back from the Brexit swoon late in the second quarter, despite the controversy created by the U.S. Department of Justice’s decision to fine Deutsche Bank $14 billion over residential mortgage backed securities sales. This is an amount that no other financial institution has come anywhere close to paying. Despite this, many European financials were nicely up in price over the third quarter of 2016. Though this has been a bumpy path, we continue to believe that the valuations assigned to many of the world’s largest banks reflect an unreasonable amount of pessimism that the current state of affairs will be permanent. We have a different view. Pensions, savers, insurance companies, and banks are all significant economic actors, and stripping them of their economic vitality, as the current monetary policy does in the developed world is, in our view, no longer an effective policy.
FUND OVERVIEW
Top detractors from performance during the reporting period were Financials and Health Care. Over the first half of 2016, our pivot to cheap European financials was met with a hefty smack upside the head. Our confidence in the scientific prowess of the drug discovery engines of the 21st century was trampled on by the stampede to the exit door with the hearing of the murmurs of Fed rate rises and the increased eagerness to promise free products and services, even life preserving high cost medicines upon which billions of dollars of risk capital have been ventured. In addition, our structural bet against commodities, which helped in 2015, had the opposite impact for much of 2016. Quality and growth orientation seemed to attract opprobrium not salutes. We compounded these headwinds with a couple of stand-out poor performing investments especially with SunEdison, which stumbled its way towards bankruptcy. We exited our position. We also had disappointing results in Phase III drug trials in two of our Pharma companies: Circassia Pharmaceuticals plc and Celldex Therapeutics. The Fund’s performance improved over the third quarter of 2016, during which time both the Financials and Health Care sectors rebounded and were outperformers versus the benchmark.
Top contributors to performance this reporting period included our exposure to S&P Global, Inc. (the renamed McGraw Hill Financial), and several information technology holdings, including Alphabet, Inc., Keyence Corp. and Facebook, Inc.
|
| 4 OPPENHEIMER GLOBAL FUND |
S&P Global continues to perform well. Its second quarter results exceeded most expectations, largely driven by the performance of its ratings group, Standard & Poor’s. The company has also been careful about costs, and divested lower return businesses. Given the restructuring and de-risking taking place in global banking, we have expected that capital markets would play a more important role in capital formation. We continue to hold this view and believe S&P Global will be an ongoing beneficiary.
Alphabet remains the largest individual holding in the portfolio after combining both classes of shares we own. We continue to see Alphabet as an attractive investment. The core businesses are doing well with monetization rates advancing nicely. In addition, we see plenty of optionality in the years to come.
Keyence develops, produces and sells factory automation solutions, such as image processing equipment, control and measuring equipment, as well as sensors. The company reported strong operating results at the close of April for their fiscal third quarter. Keyence’s sales have grown at a more than 11% compound annual growth rate for more than 20 years.
Facebook has been in the portfolio since the 2012 IPO. Despite investor pessimism over the company’s ability to navigate successfully the shift from desktop to mobile, we had confidence that the management team would be able to monetize its 1 billion users. Today,
1.2 billion users are on Facebook, 1 billion are on WhatsApp, and 800 million are on Messenger. The increasing penetration of broadband and ubiquity of mobile devices have fueled the move toward mobile Internet usage and social networking. Facebook uses and monetizes data more effectively than any of the other global players in the industry and presents optionality for future growth, especially with video and Instagram. We believe its leadership position will endure, allowing the company to sustainably grow earnings for the foreseeable future.
OUTLOOK AND POSITIONING
Our thematic, long-term, investment style leads us towards quality businesses with sustainability of both enterprise and advantage. We hope to buy these at prices that do not fully reflect their future value, usually because the current understanding of that value by the market is misestimated for a reason that is temporary. For that we have to be willing to go against the market’s current beliefs and invest with deep conviction in the correctness of our view. Unpopularity is a price we are willing to incur for a while, though it is never comfortable.
We continue to see risk of higher interest rates over time. This is not something that financial markets seem to believe is a possibility. We see pessimism and a loss of confidence in global trade structures that have delivered increasing prosperity for over half a century, which we think is unreasonable. To that end, we are invested
|
| 5 OPPENHEIMER GLOBAL FUND |
greatly in businesses that connect the world—both physically and virtually, such as Facebook, Google (Alphabet), United Parcel Service and Airbus; businesses that connect savers with investors and lenders, such as the banks and S&P Global; businesses that cure intractable diseases and make it more affordable and rational, such as Vertex Pharmaceuticals, Gilead Sciences, Aetna and Anthem; businesses that allow people to spend their hard earned money on things that give them pleasure like Walt Disney and LVMH Moet Hennessy Louis Vuitton and on daily necessities like Unilever and Colgate-Palmolive. Where we believe we are
advantaged is in seeing these connections and their global scalability.
We believe deeply in being diversified across a range of businesses across industries and geographies that are the source of opportunity and stability. Our perspective that this should be a fund for all seasons, and although the performance during the reporting period is below our standards, we believe the economic logic of our investments is sound and their prices sufficiently attractive that there is good potential for an above average return outcome.
| | |
 | | 
Rajeev Bhaman, CFA Portfolio Manager |
|
| 6 OPPENHEIMER GLOBAL FUND |
Top Holdings and Allocations
TOP TEN COMMON STOCK HOLDINGS
| | | | |
| S&P Global, Inc. | | | 3.7 | % |
| Aetna, Inc. | | | 2.9 | |
| Colgate-Palmolive Co. | | | 2.6 | |
| Alphabet, Inc., Cl. C | | | 2.6 | |
| Alphabet, Inc., Cl. A | | | 2.6 | |
| Murata Manufacturing Co. Ltd. | | | 2.5 | |
| SAP SE | | | 2.5 | |
| Airbus Group SE | | | 2.4 | |
| Facebook, Inc., Cl. A | | | 2.4 | |
| Citigroup, Inc. | | | 2.3 | |
Portfolio holdings and allocations are subject to change. Percentages are as of September 30, 2016, and are based on net assets. For more current Fund holdings, please visit oppenheimerfunds.com.
TOP TEN GEOGRAPHICAL HOLDINGS
| | | | |
| United States | | | 46.6 | % |
| Japan | | | 14.3 | |
| Germany | | | 9.0 | |
| France | | | 8.2 | |
| United Kingdom | | | 4.7 | |
| Switzerland | | | 4.0 | |
| India | | | 3.8 | |
| Spain | | | 3.6 | |
| Sweden | | | 1.6 | |
| China | | | 1.3 | |
Portfolio holdings and allocation are subject to change. Percentages are as of September 30, 2016, and are based on total market value of investments.
REGIONAL ALLOCATION
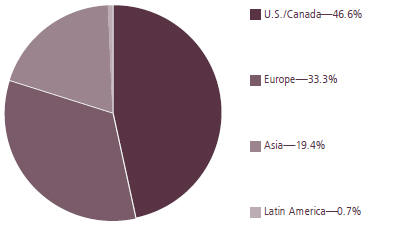
Portfolio holdings and allocations are subject to change. Percentages are as of September 30, 2016, and are based on the total market value of investments.
|
| 7 OPPENHEIMER GLOBAL FUND |
Share Class Performance
AVERAGE ANNUAL TOTAL RETURNS WITHOUT SALES CHARGE AS OF 9/30/16
| | | | | | | | | | |
| | | Inception Date | | 1-Year | | 5-Year | | 10-Year | | |
| Class A (OPPAX) | | 12/22/69 | | 5.62% | | 11.56% | | 4.93% | | |
| Class B (OGLBX) | | 8/17/93 | | 4.80 | | 10.66 | | 4.41 | | |
| Class C (OGLCX) | | 10/2/95 | | 4.80 | | 10.74 | | 4.15 | | |
| Class I (OGLIX) | | 1/27/12 | | 6.05 | | 10.14* | | N/A | | |
| Class R (OGLNX) | | 3/1/01 | | 5.33 | | 11.25 | | 4.60 | | |
| Class Y (OGLYX) | | 11/17/98 | | 5.87 | | 11.85 | | 5.25 | | |
AVERAGE ANNUAL TOTAL RETURNS WITH SALES CHARGE AS OF 9/30/16
| | | | | | | | | | |
| | | Inception Date | | 1-Year | | 5-Year | | 10-Year | | |
| Class A (OPPAX) | | 12/22/69 | | -0.46% | | 10.25% | | 4.31% | | |
| Class B (OGLBX) | | 8/17/93 | | -0.19 | | 10.39 | | 4.41 | | |
| Class C (OGLCX) | | 10/2/95 | | 3.80 | | 10.74 | | 4.15 | | |
| Class I (OGLIX) | | 1/27/12 | | 6.05 | | 10.14* | | N/A | | |
| Class R (OGLNX) | | 3/1/01 | | 5.33 | | 11.25 | | 4.60 | | |
| Class Y (OGLYX) | | 11/17/98 | | 5.87 | | 11.85 | | 5.25 | | |
* Shows performance since inception.
Performance data quoted represents past performance, which does not guarantee future results. The investment return and principal value of an investment in the Fund will fluctuate so that an investor’s shares, when redeemed, may be worth more or less than their original cost. Current performance may be lower or higher than the performance quoted. Returns do not consider capital gains or income taxes on an individual’s investment. For performance data current to the most recent month-end, visit oppenheimerfunds.com or call 1.800. CALL OPP (225.5677). Fund returns include changes in share price, reinvested distributions, and the applicable sales charge: for Class A shares, the current maximum initial sales charge of 5.75%; for Class B shares, the contingent deferred sales charge of 5% (1-year) and 2% (5-year); and for Class C shares, the contingent deferred sales charge (“CDSC”) of 1% for the 1-year period. There is no sales charge for Class I, Class R and Class Y shares. Because Class B shares convert to Class A shares 72 months after purchase, the 10-year return for Class B shares uses Class A performance for the period after conversion. See Fund prospectuses and summary prospectuses for more information on share classes and sales charges.
The Fund’s performance is compared to the performance of the MSCI All Country (AC) World Index, a free float-adjusted market capitalization weighted index that is designed to measure the equity market performance of developed and emerging markets. The Index is unmanaged and cannot be purchased directly by investors. While index comparisons may be useful to provide a benchmark for the Fund’s performance, it must be noted that the Fund’s investments are not limited to the investments comprising the Index. Index performance includes reinvestment of income, but does not reflect transaction costs, fees, expenses or taxes. Index performance is shown for illustrative purposes only as a benchmark for the Fund’s
|
| 8 OPPENHEIMER GLOBAL FUND |
performance, and does not predict or depict performance of the Fund. The Fund’s performance reflects the effects of the Fund’s business and operating expenses.
The Fund’s investment strategy and focus can change over time. The mention of specific fund holdings does not constitute a recommendation by OppenheimerFunds, Inc. or its affiliates.
Before investing in any of the Oppenheimer funds, investors should carefully consider a fund’s investment objectives, risks, charges and expenses. Fund prospectuses and summary prospectuses contain this and other information about the funds, and may be obtained by asking your financial advisor, visiting oppenheimerfunds.com, or calling 1.800.CALL OPP (225.5677). Read prospectuses and summary prospectuses carefully before investing.
Shares of Oppenheimer funds are not deposits or obligations of any bank, are not guaranteed by any bank, are not insured by the FDIC or any other agency, and involve investment risks, including the possible loss of the principal amount invested.
|
| 9 OPPENHEIMER GLOBAL FUND |
Fund Expenses
Fund Expenses. As a shareholder of the Fund, you incur two types of costs: (1) transaction costs, which may include sales charges (loads) on purchase payments and/or contingent deferred sales charges on redemptions; and (2) ongoing costs, including management fees; distribution and service fees; and other Fund expenses. These examples are intended to help you understand your ongoing costs (in dollars) of investing in the Fund and to compare these costs with the ongoing costs of investing in other mutual funds.
The examples are based on an investment of $1,000.00 invested at the beginning of the period and held for the entire 6-month period ended September 30, 2016.
Actual Expenses. The first section of the table provides information about actual account values and actual expenses. You may use the information in this section for the class of shares you hold, together with the amount you invested, to estimate the expense that you paid over the period. Simply divide your account value by $1,000.00 (for example, an $8,600.00 account value divided by $1,000.00 = 8.60), then multiply the result by the number in the first section under the heading entitled “Expenses Paid During 6 Months Ended September 30, 2016” to estimate the expenses you paid on your account during this period.
Hypothetical Example for Comparison Purposes. The second section of the table provides information about hypothetical account values and hypothetical expenses based on the Fund’s actual expense ratio for each class of shares, and an assumed rate of return of 5% per year for each class before expenses, which is not the Fund’s actual return. The hypothetical account values and expenses may not be used to estimate the actual ending account balance or expenses you paid for the period. You may use this information to compare the ongoing costs of investing in the Fund and other funds. To do so, compare this 5% hypothetical example for the class of shares you hold with the 5% hypothetical examples that appear in the shareholder reports of the other funds.
Please note that the expenses shown in the table are meant to highlight your ongoing costs only and do not reflect any transactional costs, such as front-end or contingent deferred sales charges (loads). Therefore, the “hypothetical” section of the table is useful in comparing ongoing costs only, and will not help you determine the relative total costs of owning different funds. In addition, if these transactional costs were included, your costs would have been higher.
|
| 10 OPPENHEIMER GLOBAL FUND |
| | | | | | |
| Actual | | Beginning Account Value April 1, 2016 | | Ending Account Value September 30, 2016 | | Expenses Paid During 6 Months Ended September 30, 2016 |
| Class A | | $ 1,000.00 | | $ 1,069.60 | | $ 5.91 |
| Class B | | 1,000.00 | | 1,065.60 | | 9.91 |
| Class C | | 1,000.00 | | 1,065.60 | | 9.86 |
| Class I | | 1,000.00 | | 1,072.00 | | 3.68 |
| Class R | | 1,000.00 | | 1,068.20 | | 7.26 |
| Class Y | | 1,000.00 | | 1,071.00 | | 4.67 |
| | | |
Hypothetical (5% return before expenses) | | | | | | |
| Class A | | 1,000.00 | | 1,019.30 | | 5.77 |
| Class B | | 1,000.00 | | 1,015.45 | | 9.67 |
| Class C | | 1,000.00 | | 1,015.50 | | 9.62 |
| Class I | | 1,000.00 | | 1,021.45 | | 3.59 |
| Class R | | 1,000.00 | | 1,018.00 | | 7.09 |
| Class Y | | 1,000.00 | | 1,020.50 | | 4.56 |
Expenses are equal to the Fund’s annualized expense ratio for that class, multiplied by the average account value over the period, multiplied by 183/366 (to reflect the one-half year period). Those annualized expense ratios, excluding indirect expenses from affiliated funds, based on the 6-month period ended September 30, 2016 are as follows:
| | | | |
| Class | | Expense Ratios | |
| Class A | | | 1.14% | |
| Class B | | | 1.91 | |
| Class C | | | 1.90 | |
| Class I | | | 0.71 | |
| Class R | | | 1.40 | |
| Class Y | | | 0.90 | |
The expense ratios reflect voluntary and/or contractual waivers and/or reimbursements of expenses by the Fund’s Manager. Some of these undertakings may be modified or terminated at any time, as indicated in the Fund’s prospectus. The “Financial Highlights” tables in the Fund’s financial statements, included in this report, also show the gross expense ratios, without such waivers or reimbursements and reduction to custodian expenses, if applicable.
|
| 11 OPPENHEIMER GLOBAL FUND |
STATEMENT OF INVESTMENTS September 30, 2016
| | | | | | | | |
| | | Shares | | | Value | |
| Common Stocks—97.9% | | | | | | | | |
| Consumer Discretionary—14.5% | |
| Automobiles—0.8% | |
| Suzuki Motor Corp. | | | 2,079,100 | | | $ | 69,601,628 | |
| | | | | | | | | |
Hotels, Restaurants & Leisure—0.8% | | | | | |
| International Game Technology plc | | | 3,020,170 | | | | 73,631,744 | |
| Internet & Direct Marketing Retail—1.7% | |
| JD.com, Inc., ADR1 | | | 4,365,018 | | | | 113,883,320 | |
| Rakuten, Inc. | | | 3,434,700 | | | | 44,678,961 | |
| | | | | | | 158,562,281 | |
| | | | | | | | | |
| Leisure Products—0.6% | |
Nintendo Co. Ltd. | | | 202,800 | | | | 53,662,140 | |
| | | | | | | | | |
| Media—2.7% | |
| Walt Disney Co. (The) | | | 1,802,030 | | | | 167,336,506 | |
| Zee Entertainment Enterprises Ltd. | | | 10,041,245 | | | | 82,423,020 | |
| | | | | | | 249,759,526 | |
| | | | | | | | | |
| Specialty Retail—3.5% | |
| Industria de Diseno Textil SA | | | 5,555,845 | | | | 205,958,226 | |
| Tiffany & Co. | | | 1,514,018 | | | | 109,963,127 | |
| | | | | | | 315,921,353 | |
| | | | | | | | | |
| Textiles, Apparel & Luxury Goods—4.4% | |
| Brunello Cucinelli SpA | | | 1,690,117 | | | | 32,851,898 | |
| Kering | | | 707,941 | | | | 142,657,128 | |
| LVMH Moet Hennessy Louis Vuitton SE | | | 1,158,110 | | | | 197,432,049 | |
| Tod’s SpA | | | 444,481 | | | | 23,467,350 | |
| | | | | | | 396,408,425 | |
| | | | | | | | | |
| Consumer Staples—5.4% | |
| Food Products—2.8% | |
| Nestle SA | | | 1,065,400 | | | | 83,946,732 | |
| Unilever plc | | | 3,664,099 | | | | 173,704,015 | |
| | | | | | | 257,650,747 | |
| | | | | | | | | |
Household Products—2.6% | |
Colgate-Palmolive Co. | | | 3,202,128 | | | | 237,405,770 | |
| | | | | | | | | |
| Energy—1.6% | |
| Energy Equipment & Services—1.0% | |
Technip SA | | | 1,411,307 | | | | 86,673,364 | |
| | | | | | | | | |
| Oil, Gas & Consumable Fuels—0.6% | |
| Repsol SA | | | 4,175,847 | | | | 56,672,470 | |
| | | | | | | | |
| | | Shares | | | Value | |
| Financials—20.3% | |
Capital Markets—7.1% | |
| Credit Suisse Group AG1 | | | 2,431,397 | | | $ | 31,809,630 | |
| Goldman Sachs Group, Inc. (The) | | | 731,868 | | | | 118,028,352 | |
| S&P Global, Inc. | | | 2,659,639 | | | | 336,603,912 | |
| UBS Group AG | | | 12,131,018 | | | | 164,723,029 | |
| | | | | | | 651,164,923 | |
| | | | | | | | | |
Commercial Banks—6.1% | |
| Banca Monte dei Paschi di Siena SpA1 | | | 23,820,659 | | | | 4,985,912 | |
| Banco Bilbao Vizcaya Argentaria SA | | | 11,309,987 | | | | 68,378,707 | |
| Citigroup, Inc. | | | 4,478,440 | | | | 211,516,721 | |
| ICICI Bank Ltd., Sponsored ADR | | | 15,133,639 | | | | 113,048,283 | |
| Societe Generale SA | | | 2,715,646 | | | | 93,718,579 | |
| Sumitomo Mitsui Financial Group, Inc. | | | 1,917,100 | | | | 64,611,903 | |
| | | | | | | 556,260,105 | |
| | | | | | | | | |
Insurance—5.4% | |
| Allianz SE | | | 1,001,936 | | | | 148,720,184 | |
| Dai-ichi Life Insurance Co. Ltd. (The) | | | 7,721,600 | | | | 105,981,219 | |
| FNF Group | | | 2,208,660 | | | | 81,521,641 | |
| Prudential plc | | | 8,555,450 | | | | 151,846,250 | |
| | | | | | | 488,069,294 | |
| | | | | | | | | |
Real Estate Management & Development—1.7% | |
DLF Ltd. | | | 67,962,890 | | | | 150,199,961 | |
| | | | | | | | | |
| Health Care—15.6% | |
Biotechnology—6.1% | |
| ACADIA Pharmaceuticals, Inc.1 | | | 2,296,479 | | | | 73,050,997 | |
| Biogen, Inc.1 | | | 350,220 | | | | 109,629,367 | |
| BioMarin Pharmaceutical, Inc.1 | | | 779,354 | | | | 72,105,832 | |
| Bluebird Bio, Inc.1 | | | 409,679 | | | | 27,768,043 | |
| Circassia Pharmaceuticals plc1,2 | | | 16,970,348 | | | | 20,786,329 | |
| Gilead Sciences, Inc. | | | 1,271,540 | | | | 100,604,245 | |
| Ionis Pharmaceuticals, Inc.1 | | | 1,140,346 | | | | 41,782,277 | |
|
| 12 OPPENHEIMER GLOBAL FUND |
| | | | | | | | |
| | | Shares | | | Value | |
| Biotechnology (Continued) | |
| MacroGenics, Inc.1 | | | 1,567,284 | | | $ | 46,877,464 | |
| Sage Therapeutics, Inc.1 | | | 917,199 | | | | 42,237,014 | |
| Vertex Pharmaceuticals, Inc.1 | | | 276,547 | | | | 24,117,664 | |
| | | | | | | 558,959,232 | |
| | | | | | | | | |
Health Care Equipment & Supplies—2.0% | |
| Swiss Medical SA1,2,3 | | | 526,084,560 | | | | 47,945,242 | |
| Zimmer Biomet Holdings, Inc. | | | 1,047,054 | | | | 136,137,961 | |
| | | | | | | 184,083,203 | |
| | | | | | | | | |
Health Care Providers & Services—4.6% | |
| Aetna, Inc. | | | 2,265,689 | | | | 261,573,795 | |
| Anthem, Inc. | | | 1,219,995 | | | | 152,877,574 | |
| | | | | | | 414,451,369 | |
| | | | | | | | | |
Pharmaceuticals—2.9% | |
| Bayer AG | | | 1,166,182 | | | | 117,135,879 | |
| Roche Holding AG | | | 341,103 | | | | 84,503,524 | |
| Shire plc | | | 934,432 | | | | 60,396,867 | |
| | | | | | | 262,036,270 | |
| | | | | | | | | |
| Industrials—12.5% | |
Aerospace & Defense—2.6% | |
| Airbus Group SE | | | 3,561,898 | | | | 215,454,878 | |
| Embraer SA, Sponsored ADR | | | 1,129,914 | | | | 19,502,316 | |
| | | | | | | 234,957,194 | |
| | | | | | | | | |
Air Freight & Couriers—1.6% | |
United Parcel Service, Inc., Cl. B | | | 1,327,640 | | | | 145,190,710 | |
| | | | | | | | | |
Building Products—1.5% | |
Assa Abloy AB, Cl. B | | | 6,858,131 | | | | 139,252,477 | |
| | | | | | | | | |
Construction & Engineering—0.3% | |
FLSmidth & Co. AS | | | 797,893 | | | | 30,012,258 | |
| | | | | | | | | |
Electrical Equipment—3.5% | |
| Emerson Electric Co. | | | 1,405,310 | | | | 76,603,448 | |
| Nidec Corp. | | | 2,081,216 | | | | 191,474,166 | |
| Prysmian SpA | | | 1,920,464 | | | | 50,322,960 | |
| | | | | | | 318,400,574 | |
| | | | | | | | | |
Industrial Conglomerates—2.3% | |
| 3M Co. | | | 848,380 | | | | 149,510,007 | |
| Siemens AG | | | 504,583 | | | | 59,068,009 | |
| | | | | | | 208,578,016 | |
| | | | | | | | |
| | | Shares | | | Value | |
Machinery—0.7% | |
FANUC Corp. | | | 399,800 | | | $ | 67,664,894 | |
| | | | | | | | | |
| Information Technology—25.2% | |
Communications Equipment—0.1% | |
| Telefonaktiebolaget LM Ericsson, Cl. B | | | 970,000 | | | | 7,000,504 | |
Electronic Equipment, Instruments, & Components—6.0% | |
| Keyence Corp. | | | 286,253 | | | | 208,339,868 | |
| Kyocera Corp. | | | 2,387,300 | | | | 114,530,087 | |
| Murata Manufacturing Co. Ltd. | | | 1,738,704 | | | | 226,786,152 | |
| | | | | | | 549,656,107 | |
| | | | | | | | | |
Internet Software & Services—9.1% | |
| Alphabet, Inc., Cl. A1 | | | 290,790 | | | | 233,812,608 | |
| Alphabet, Inc., Cl. C1 | | | 301,603 | | | | 234,432,996 | |
| eBay, Inc.1 | | | 1,917,178 | | | | 63,075,156 | |
| Facebook, Inc., Cl. A1 | | | 1,676,160 | | | | 215,001,043 | |
| Twitter, Inc.1 | | | 3,659,440 | | | | 84,350,092 | |
| | | | | | | 830,671,895 | |
| | | | | | | | | |
IT Services—1.3% | |
| Earthport plc1,2 | | | 46,902,132 | | | | 8,823,623 | |
| PayPal Holdings, Inc.1 | | | 2,697,218 | | | | 110,505,021 | |
| | | | | | | 119,328,644 | |
| | | | | | | | | |
Semiconductors & Semiconductor Equipment—2.2% | |
Maxim Integrated Products, Inc. | | | 4,885,605 | | | | 195,082,208 | |
| | | | | | | | | |
Software—6.5% | |
| Adobe Systems, Inc.1 | | | 1,448,354 | | | | 157,204,343 | |
| Intuit, Inc. | | | 1,916,840 | | | | 210,871,569 | |
| SAP SE | | | 2,490,722 | | | | 226,625,860 | |
| | | | | | | 594,701,772 | |
| | | | | | | | | |
| Materials—1.0% | |
Chemicals—1.0% | |
Linde AG | | | 548,625 | | | | 93,236,172 | |
|
| 13 OPPENHEIMER GLOBAL FUND |
STATEMENT OF INVESTMENTS Continued
| | | | | | | | |
| | | Shares | | | Value | |
| Telecommunication Services—1.8% | | | | | |
Wireless Telecommunication Services—1.8% | |
| KDDI Corp. | | | 5,322,100 | | | $ | 163,774,657 | |
Total Common Stocks
(Cost $4,975,079,330) | | | | 8,918,681,887 | |
| | |
| | | | | | | | | |
| Preferred Stocks—1.8% | |
| Bayerische Motoren Werke (BMW) AG, Preference | | | 2,197,141 | | | | 161,963,948 | |
| Zee Entertainment Enterprises Ltd., 6% Cum. Non-Cv. | | | 29,407,492 | | | | 4,178,355 | |
Total Preferred Stocks
(Cost $73,922,192) | | | | 166,142,303 | |
| | | | | | | | |
| | | Shares | | | Value | |
| Investment Company—0.3% | |
Oppenheimer Institutional Government Money Market Fund, Cl. E, 0.28%2,4
(Cost $28,107,943) | | | 28,107,943 | | | $ | 28,107,943 | |
| | | | | | | | | |
Total Investments, at Value
(Cost $5,077,109,465) | | | 100.0% | | | | 9,112,932,133 | |
| Net Other Assets (Liabilities) | | | (0.0) | | | | (2,837,932 | ) |
Net Assets | | | 100.0% | | | $ | 9,110,094,201 | |
| | | | | | | | |
| | | | | | | | |
Footnotes to Statement of Investments
1. Non-income producing security.
2. Is or was an affiliate, as defined in the Investment Company Act of 1940, as amended, at or during the reporting period, by virtue of the Fund owning at least 5% of the voting securities of the issuer or as a result of the Fund and the issuer having the same investment adviser. Transactions during the reporting period in which the issuer was an affiliate are as follows:
| | | | | | | | | | | | | | | | |
| | | Shares September 30, 2015 | | | Gross Additions | | | Gross Reductions | | | Shares September 30, 2016 | |
| Circassia Pharmaceuticals plc | | | 16,970,348 | | | | — | | | | — | | | | 16,970,348 | |
| Earthport plc | | | 26,209,011 | | | | 20,693,121 | | | | — | | | | 46,902,132 | |
| Oppenheimer Institutional Government Money Market Fund, Cl. Ea | | | 121,734,074 | | | | 614,345,751 | | | | 707,971,882 | | | | 28,107,943 | |
| Swiss Medical SA | | | 182,400,000 | | | | 343,684,560b | | | | — | | | | 526,084,560 | |
| | | | | | | | |
| | | Value | | | Income | |
| Circassia Pharmaceuticals plc | | $ | 20,786,329 | | | $ | — | |
| Earthport plc | | | 8,823,623 | | | | — | |
| Oppenheimer Institutional Government Money Market Fund, Cl. Ea | | | 28,107,943 | | | | 145,172 | |
Swiss Medical SA | | | 47,945,242 | | | | — | |
| | | | |
Total | | $ | 105,663,137 | | | $ | 145,172 | |
| | | | |
a. Prior to September 28, 2016, this fund was named Oppenheimer Institutional Money Market Fund.
b. All or a portion is the result of a corporate action.
3. Restricted security. The aggregate value of restricted securities at period end was $47,945,242, which represents 0.53% of the Fund’s net assets. See Note 4 of the accompanying Notes. Information concerning restricted securities is as follows:
| | | | | | | | | | | | | | | | |
| Security | | Acquisition
Dates | | | Cost | | | Value | | | Unrealized
Appreciation | |
Swiss Medical SA | | | 5/16/94-7/10/02 | | | $ | 30,390,000 | | | $ | 47,945,242 | | | $ | 17,555,242 | |
|
| 14 OPPENHEIMER GLOBAL FUND |
Footnotes to Statement of Investments (Continued)
4. Rate shown is the 7-day yield at period end.
Distribution of investments representing geographic holdings, as a percentage of total investments at value, is as follows:
| | | | | | | | |
| Geographic Holdings (Unaudited) | | Value | | | Percent | |
United States | | $ | 4,254,885,406 | | | | 46.6% | |
Japan | | | 1,311,105,674 | | | | 14.3 | |
Germany | | | 806,750,053 | | | | 9.0 | |
France | | | 735,935,997 | | | | 8.2 | |
United Kingdom | | | 428,791,962 | | | | 4.7 | |
Switzerland | | | 364,982,915 | | | | 4.0 | |
India | | | 349,849,619 | | | | 3.8 | |
Spain | | | 331,009,403 | | | | 3.6 | |
Sweden | | | 146,252,981 | | | | 1.6 | |
China | | | 113,883,320 | | | | 1.3 | |
Italy | | | 111,628,120 | | | | 1.2 | |
Ireland | | | 60,396,867 | | | | 0.7 | |
Argentina | | | 47,945,242 | | | | 0.5 | |
Denmark | | | 30,012,258 | | | | 0.3 | |
| Brazil | | | 19,502,316 | | | | 0.2 | |
| | | | |
| Total | | $ | 9,112,932,133 | | | | 100.0% | |
| | | | |
See accompanying Notes to Financial Statements.
|
| 15 OPPENHEIMER GLOBAL FUND |
STATEMENT OF ASSETS AND LIABILITIES September 30, 2016
| | | | |
| |
| Assets | | | | |
| Investments, at value—see accompanying statement of investments: | | | | |
| Unaffiliated companies (cost $4,909,775,507) | | $ | 9,007,268,996 | |
| Affiliated companies (cost 167,333,958) | | | 105,663,137 | |
| | | | |
| | | 9,112,932,133 | |
| |
| Cash | | | 7,000,007 | |
| |
| Receivables and other assets: | | | | |
| Dividends | | | 26,401,408 | |
| Shares of beneficial interest sold | | | 4,882,868 | |
| Other | | | 1,014,226 | |
| | | | |
| Total assets | | | 9,152,230,642 | |
|
| |
| Liabilities | | | | |
| Payables and other liabilities: | | | | |
| Shares of beneficial interest redeemed | | | 32,386,962 | |
| Investments purchased | | | 4,618,917 | |
| Trustees’ compensation | | | 2,006,095 | |
| Distribution and service plan fees | | | 1,498,394 | |
| Foreign capital gains tax | | | 768,567 | |
| Shareholder communications | | | 36,250 | |
| Other | | | 821,256 | |
| | | | |
| Total liabilities | | | 42,136,441 | |
|
| |
Net Assets | | $ | 9,110,094,201 | |
| | | | |
|
| |
| Composition of Net Assets | | | | |
| Paid-in capital | | $ | 5,088,698,582 | |
| |
| Accumulated net investment income | | | 51,879,943 | |
| |
| Accumulated net realized loss on investments and foreign currency transactions | | | (64,192,682) | |
| |
| Net unrealized appreciation on investments and translation of assets and liabilities denominated in foreign currencies | | | 4,033,708,358 | |
| | | | |
Net Assets | | $ | 9,110,094,201 | |
| | | | |
|
| 16 OPPENHEIMER GLOBAL FUND |
| | | | |
| |
Net Asset Value Per Share | | | | |
| Class A Shares: | | | | |
| |
| Net asset value and redemption price per share (based on net assets of $6,391,710,654 and 85,078,875 shares of beneficial interest outstanding) | | $ | 75.13 | |
| |
| Maximum offering price per share (net asset value plus sales charge of 5.75% of offering price) | | $ | 79.71 | |
| |
| |
| Class B Shares: | | | | |
| |
| Net asset value, redemption price (excludes applicable contingent deferred sales charge) and offering price per share (based on net assets of $36,721,784 and 536,828 shares of beneficial interest outstanding) | | $ | 68.41 | |
| |
| |
| Class C Shares: | | | | |
| |
| Net asset value, redemption price (excludes applicable contingent deferred sales charge) and offering price per share (based on net assets of $626,045,271 and 9,022,400 shares of beneficial interest outstanding) | | $ | 69.39 | |
| |
| |
| Class I Shares: | | | | |
| |
| Net asset value, redemption price and offering price per share (based on net assets of $663,292,650 and 8,797,039 shares of beneficial interest outstanding) | | $ | 75.40 | |
| |
| |
| Class R Shares: | | | | |
| |
| Net asset value, redemption price (excludes applicable contingent deferred sales charge) and offering price per share (based on net assets of $210,141,005 and 2,813,557 shares of beneficial interest outstanding) | | $ | 74.69 | |
| |
| |
| Class Y Shares: | | | | |
| |
| Net asset value, redemption price and offering price per share (based on net assets of $1,182,182,837 and 15,695,017 shares of beneficial interest outstanding) | | $ | 75.32 | |
See accompanying Notes to Financial Statements.
|
| 17 OPPENHEIMER GLOBAL FUND |
STATEMENT OF OPERATIONS For the Year Ended September 30, 2016
| | | | |
|
| |
| Investment Income | | | | |
| |
| Dividends: | | | | |
| Unaffiliated companies (net of foreign withholding taxes of $12,493,872) | | $ | 166,983,796 | |
| Affiliated companies | | | 145,172 | |
| |
| Interest | | | 12,644 | |
| |
| Total investment income | | | 167,141,612 | |
|
| |
| Expenses | | | | |
| Management fees | | | 61,965,324 | |
| |
| Distribution and service plan fees: | | | | |
| Class A | | | 15,672,339 | |
| Class B | | | 498,883 | |
| Class C | | | 6,527,126 | |
| Class R | | | 1,081,338 | |
| |
| Transfer and shareholder servicing agent fees: | | | | |
| Class A | | | 14,633,055 | |
| Class B | | | 110,155 | |
| Class C | | | 1,439,100 | |
| Class I | | | 170,215 | |
| Class R | | | 477,878 | |
| Class Y | | | 2,749,969 | |
| |
| Shareholder communications: | | | | |
| Class A | | | 79,124 | |
| Class B | | | 3,637 | |
| Class C | | | 13,005 | |
| Class I | | | 2,391 | |
| Class R | | | 302 | |
| Class Y | | | 14,752 | |
| |
| Custodian fees and expenses | | | 555,658 | |
| |
| Borrowing fees | | | 170,329 | |
| |
| Trustees’ compensation | | | 156,464 | |
| |
| Other | | | 652,036 | |
| | | | |
| Total expenses | | | 106,973,080 | |
| Less reduction to custodian expenses | | | (3,472) | |
| Less waivers and reimbursements of expenses | | | (54,958) | |
| | | | |
| Net expenses | | | 106,914,650 | |
|
| |
| Net Investment Income | | | 60,226,962 | |
|
| 18 OPPENHEIMER GLOBAL FUND |
| | | | |
|
| |
| Realized and Unrealized Gain (Loss) | | | | |
| Net realized loss on: | | | | |
| Investments from unaffiliated companies | | $ | (23,107,701) | |
| Foreign currency transactions | | | (68,876) | |
| | | | |
| Net realized loss | | | (23,176,577) | |
| |
| Net change in unrealized appreciation/depreciation on: | | | | |
| Investments | | | 337,314,982 | |
| Translation of assets and liabilities denominated in foreign currencies | | | 114,299,131 | |
| | | | |
| Net change in unrealized appreciation/depreciation | | | 451,614,113 | |
|
| |
Net Increase in Net Assets Resulting from Operations | | $ | 488,664,498 | |
| | | | |
| | | | |
See accompanying Notes to Financial Statements.
|
| 19 OPPENHEIMER GLOBAL FUND |
STATEMENTS OF CHANGES IN NET ASSETS
| | | | | | | | |
| | | Year Ended
September 30, 2016 | | | Year Ended
September 30, 20151 | |
| |
| Operations | | | | | | | | |
| Net investment income | | $ | 60,226,962 | | | $ | 76,003,288 | |
| |
| Net realized gain (loss) | | | (23,176,577) | | | | 495,968,013 | |
| |
| Net change in unrealized appreciation/depreciation | | | 451,614,113 | | | | (763,902,286) | |
| | | | |
| Net increase (decrease) in net assets resulting from operations | | | 488,664,498 | | | | (191,930,985) | |
|
| |
| Dividends and/or Distributions to Shareholders | | | | | | | | |
| Dividends from net investment income: | | | | | | | | |
| Class A | | | (47,850,321) | | | | (61,467,668) | |
| Class B | | | — | | | | — | |
| Class C | | | — | | | | (1,022,368) | |
| Class I | | | (6,154,999) | | | | (4,518,661) | |
| Class R | | | (875,701) | | | | (1,345,485) | |
| Class Y | | | (12,388,557) | | | | (12,695,076) | |
| | | | |
| | | (67,269,578) | | | | (81,049,258) | |
| Distributions from net realized gain: | | | | | | | | |
| Class A | | | (309,442,134) | | | | (353,319,441) | |
| Class B | | | (2,938,010) | | | | (5,047,235) | |
| Class C | | | (32,627,906) | | | | (34,937,537) | |
| Class I | | | (23,658,105) | | | | (16,921,008) | |
| Class R | | | (9,795,265) | | | | (11,142,468) | |
| Class Y | | | (57,383,411) | | | | (58,127,450) | |
| | | | |
| | | (435,844,831) | | | | (479,495,139) | |
|
| |
| Beneficial Interest Transactions | | | | | | | | |
| Net increase (decrease) in net assets resulting from beneficial interest transactions: | |
| Class A | | | (532,401,982) | | | | 120,168,473 | |
| Class B | | | (29,844,040) | | | | (36,598,059) | |
| Class C | | | (44,216,356) | | | | 35,375,972 | |
| Class I | | | 155,596,799 | | | | 192,534,324 | |
| Class R | | | (15,159,836) | | | | 5,430,958 | |
| Class Y | | | (68,276,710) | | | | (122,351,861) | |
| | | | |
| | | (534,302,125) | | | | 194,559,807 | |
|
| |
| Net Assets | | | | | | | | |
| Total decrease | | | (548,752,036) | | | | (557,915,575) | |
| |
| Beginning of period | | | 9,658,846,237 | | | | 10,216,761,812 | |
| | | | |
| End of period (including accumulated net investment income of $51,879,943 and $65,609,1651, respectively) | | $ | 9,110,094,201 | | | $ | 9,658,846,237 | |
| | | | |
1. Net investment income, net change in unrealized appreciation/depreciation and accumulated net investment income for the year ended September 30, 2015 includes an adjustment for a prior period reclassification. Please see Note 10 of the accompanying Notes to Financial Statements.
See accompanying Notes to Financial Statements.
|
| 20 OPPENHEIMER GLOBAL FUND |
FINANCIAL HIGHLIGHTS
| | | | | | | | | | |
| Class A | | Year Ended
September
30, 2016 | | Year Ended September 30, 2015 | | Year Ended
September
30, 2014 | | Year Ended
September
30, 2013 | | Year Ended
September
28, 20121 |
| Per Share Operating Data | | | | | | | | | | |
| Net asset value, beginning of period | | $74.79 | | $80.61 | | $76.06 | | $60.82 | | $51.78 |
| Income (loss) from investment operations: |
| Net investment income2 | | 0.47 | | 0.613 | | 0.623 | | 0.643 | | 0.56 |
| Net realized and unrealized gain (loss) | | 3.75 | | (1.95)3 | | 6.833 | | 15.333 | | 9.56 |
| | |
| Total from investment operations | | 4.22 | | (1.34) | | 7.45 | | 15.97 | | 10.12 |
| Dividends and/or distributions to shareholders: | | | | | | | | | | |
| Dividends from net investment income | | (0.52) | | (0.66) | | (0.61) | | (0.63) | | (1.06) |
| Distributions from net realized gain | | (3.36) | | (3.82) | | (2.29) | | (0.10) | | (0.02) |
| | |
| Total dividends and/or distributions to shareholders | | (3.88) | | (4.48) | | (2.90) | | (0.73) | | (1.08) |
|
| Net asset value, end of period | | $75.13 | | $74.79 | | $80.61 | | $76.06 | | $60.82 |
| | |
| | |
|
|
| Total Return, at Net Asset Value4 | | 5.62% | | (1.87)% | | 10.01% | | 26.52% | | 19.80% |
|
|
| Ratios/Supplemental Data | | | | | | | | | | |
| Net assets, end of period (in thousands) | | $6,391,711 | | $6,935,324 | | $7,351,617 | | $7,497,366 | | $6,509,607 |
|
| Average net assets (in thousands) | | $6,645,501 | | $7,558,014 | | $7,648,870 | | $7,017,280 | | $6,551,108 |
|
| Ratios to average net assets:5 | | | | | | | | | | |
| Net investment income | | 0.64% | | 0.76%3 | | 0.78%3 | | 0.93%3 | | 0.99% |
| Expenses excluding specific expenses listed below | | 1.13% | | 1.13% | | 1.14% | | 1.19% | | 1.22% |
| Interest and fees from borrowings | | 0.00%6 | | 0.00%6 | | 0.00% | | 0.00% | | 0.00% |
| | |
| Total expenses7 | | 1.13% | | 1.13% | | 1.14% | | 1.19% | | 1.22% |
| Expenses after payments, waivers and/or reimbursements and reduction to custodian expenses | | 1.13% | | 1.13% | | 1.14% | | 1.19% | | 1.22% |
|
| Portfolio turnover rate | | 6% | | 11% | | 11% | | 11% | | 12% |
|
| 21 OPPENHEIMER GLOBAL FUND |
FINANCIAL HIGHLIGHTS Continued
1. September 28, 2012 represents the last business day of the Fund’s reporting period.
2. Per share amounts calculated based on the average shares outstanding during the period.
3. Net investment income (loss) per share, net realized and unrealized gain (loss) per share and the net investment income (loss) ratio include an adjustment for a prior period reclassification for the years ended September 30, 2013, 2014 and 2015. Please see Note 10 of the accompanying Notes to Financial Statements.
4. Assumes an initial investment on the business day before the first day of the fiscal period, with all dividends and distributions reinvested in additional shares on the reinvestment date, and redemption at the net asset value calculated on the last business day of the fiscal period. Sales charges are not reflected in the total returns. Total returns are not annualized for periods less than one full year. Returns do not reflect the deduction of taxes that a shareholder would pay on fund distributions or the redemption of fund shares.
5. Annualized for periods less than one full year.
6. Less than 0.005%.
7. Total expenses including indirect expenses from affiliated fund fees and expenses were as follows:
| | | | | | | | |
| Year Ended September 30, 2016 | | | 1.13% | | | | | |
| Year Ended September 30, 2015 | | | 1.13% | | | | | |
| Year Ended September 30, 2014 | | | 1.14% | | | | | |
| Year Ended September 30, 2013 | | | 1.19% | | | | | |
| Year Ended September 28, 2012 | | | 1.22% | | | | | |
See accompanying Notes to Financial Statements.
|
| 22 OPPENHEIMER GLOBAL FUND |
| | | | | | | | | | |
| Class B | | Year Ended
September
30, 2016 | | Year Ended
September
30, 2015 | | Year Ended
September
30, 2014 | | Year Ended
September
30, 2013 | | Year Ended
September
28, 20121 |
|
| Per Share Operating Data | | | | | | | | | | |
| Net asset value, beginning of period | | $68.44 | | $74.03 | | $70.04 | | $56.03 | | $47.59 |
|
| Income (loss) from investment operations: | | | | | | | | | | |
| Net investment income (loss)2 | | (0.13) | | (0.02)3 | | (0.04)3 | | 0.013 | | 0.06 |
| Net realized and unrealized gain (loss) | | 3.46 | | (1.75)3 | | 6.323 | | 14.183 | | 8.84 |
| | |
| Total from investment operations | | 3.33 | | (1.77) | | 6.28 | | 14.19 | | 8.90 |
|
| Dividends and/or distributions to shareholders: | | | | | | | | | | |
| Dividends from net investment income | | 0.00 | | 0.00 | | 0.00 | | (0.08) | | (0.44) |
| Distributions from net realized gain | | (3.36) | | (3.82) | | (2.29) | | (0.10) | | (0.02) |
| | |
| Total dividends and/or distributions to shareholders | | (3.36) | | (3.82) | | (2.29) | | (0.18) | | (0.46) |
|
| Net asset value, end of period | | $68.41 | | $68.44 | | $74.03 | | $70.04 | | $56.03 |
| | |
| | |
|
|
| Total Return, at Net Asset Value4 | | 4.80% | | (2.62)% | | 9.14% | | 25.39% | | 18.81% |
|
|
| Ratios/Supplemental Data | | | | | | | | | | |
| Net assets, end of period (in thousands) | | $36,722 | | $67,560 | | $109,495 | | $144,206 | | $163,538 |
|
| Average net assets (in thousands) | | $49,931 | | $89,091 | | $128,588 | | $152,754 | | $182,874 |
|
| Ratios to average net assets:5 | | | | | | | | | | |
| Net investment income (loss) | | (0.20)% | | (0.03)%3 | | (0.06)%3 | | 0.01%3 | | 0.11% |
| Expenses excluding specific expenses listed below | | 1.90% | | 1.90% | | 1.98% | | 2.20% | | 2.24% |
| Interest and fees from borrowings | | 0.00%6 | | 0.00%6 | | 0.00% | | 0.00% | | 0.00% |
| | |
| Total expenses7 | | 1.90% | | 1.90% | | 1.98% | | 2.20% | | 2.24% |
| Expenses after payments, waivers and/or reimbursements and reduction to custodian expenses | | 1.90% | | 1.90% | | 1.95% | | 2.10% | | 2.07% |
|
| Portfolio turnover rate | | 6% | | 11% | | 11% | | 11% | | 12% |
|
| 23 OPPENHEIMER GLOBAL FUND |
FINANCIAL HIGHLIGHTS Continued
1. September 28, 2012 represents the last business day of the Fund’s reporting period.
2. Per share amounts calculated based on the average shares outstanding during the period.
3. Net investment income (loss) per share, net realized and unrealized gain (loss) per share and the net investment income (loss) ratio include an adjustment for a prior period reclassification for the years ended September 30, 2013, 2014 and 2015. Please see Note 10 of the accompanying Notes to Financial Statements.
4. Assumes an initial investment on the business day before the first day of the fiscal period, with all dividends and distributions reinvested in additional shares on the reinvestment date, and redemption at the net asset value calculated on the last business day of the fiscal period. Sales charges are not reflected in the total returns. Total returns are not annualized for periods less than one full year. Returns do not reflect the deduction of taxes that a shareholder would pay on fund distributions or the redemption of fund shares.
5. Annualized for periods less than one full year.
6. Less than 0.005%.
7. Total expenses including indirect expenses from affiliated fund fees and expenses were as follows:
| | | | | | | | |
| Year Ended September 30, 2016 | | | 1.90% | | | | | |
| Year Ended September 30, 2015 | | | 1.90% | | | | | |
| Year Ended September 30, 2014 | | | 1.98% | | | | | |
| Year Ended September 30, 2013 | | | 2.20% | | | | | |
| Year Ended September 28, 2012 | | | 2.24% | | | | | |
See accompanying Notes to Financial Statements.
|
| 24 OPPENHEIMER GLOBAL FUND |
| | | | | | | | | | |
| Class C | | Year Ended
September 30, 2016 | | Year Ended
September 30, 2015 | | Year Ended
September 30, 2014 | | Year Ended
September 30, 2013 | | Year Ended
September 28, 20121 |
|
| Per Share Operating Data | | | | | | | | | | |
| Net asset value, beginning of period | | $69.37 | | $75.10 | | $71.11 | | $56.93 | | $48.46 |
|
| Income (loss) from investment operations: | | | | | | | | | | |
| Net investment income (loss)2 | | (0.08) | | (0.01)3 | | 0.033 | | 0.143 | | 0.14 |
| Net realized and unrealized gain (loss) | | 3.46 | | (1.79)3 | | 6.403 | | 14.383 | | 8.96 |
| | |
| Total from investment operations | | 3.38 | | (1.80) | | 6.43 | | 14.52 | | 9.10 |
|
| Dividends and/or distributions to shareholders: | | | | | | | | | | |
| Dividends from net investment income | | 0.00 | | (0.11) | | (0.15) | | (0.24) | | (0.61) |
| Distributions from net realized gain | | (3.36) | | (3.82) | | (2.29) | | (0.10) | | (0.02) |
| | |
| Total dividends and/or distributions to shareholders | | (3.36) | | (3.93) | | (2.44) | | (0.34) | | (0.63) |
|
| Net asset value, end of period | | $69.39 | | $69.37 | | $75.10 | | $71.11 | | $56.93 |
| | |
| | |
|
|
| Total Return, at Net Asset Value4 | | 4.80% | | (2.60)% | | 9.20% | | 25.62% | | 18.93% |
|
|
| Ratios/Supplemental Data | | | | | | | | | | |
| Net assets, end of period (in thousands) | | $626,045 | | $674,573 | | $695,102 | | $666,584 | | $580,390 |
|
| Average net assets (in thousands) | | $653,577 | | $715,064 | | $699,835 | | $623,949 | | $591,634 |
|
| Ratios to average net assets:5 | | | | | | | | | | |
| Net investment income (loss) | | (0.12)% | | (0.01)%3 | | 0.04%3 | | 0.22%3 | | 0.26% |
| Expenses excluding specific expenses listed below | | 1.90% | | 1.90% | | 1.88% | | 1.90% | | 1.94% |
| Interest and fees from borrowings | | 0.00%6 | | 0.00%6 | | 0.00% | | 0.00% | | 0.00% |
| | |
| Total expenses7 | | 1.90% | | 1.90% | | 1.88% | | 1.90% | | 1.94% |
| Expenses after payments, waivers and/or reimbursements and reduction to custodian expenses | | 1.90% | | 1.90% | | 1.88% | | 1.90% | | 1.94% |
|
| Portfolio turnover rate | | 6% | | 11% | | 11% | | 11% | | 12% |
|
| 25 OPPENHEIMER GLOBAL FUND |
FINANCIAL HIGHLIGHTS Continued
1. September 28, 2012 represents the last business day of the Fund’s reporting period.
2. Per share amounts calculated based on the average shares outstanding during the period.
3. Net investment income (loss) per share, net realized and unrealized gain (loss) per share and the net investment income (loss) ratio include an adjustment for a prior period reclassification for the years ended September 30, 2013, 2014 and 2015. Please see Note 10 of the accompanying Notes to Financial Statements.
4. Assumes an initial investment on the business day before the first day of the fiscal period, with all dividends and distributions reinvested in additional shares on the reinvestment date, and redemption at the net asset value calculated on the last business day of the fiscal period. Sales charges are not reflected in the total returns. Total returns are not annualized for periods less than one full year. Returns do not reflect the deduction of taxes that a shareholder would pay on fund distributions or the redemption of fund shares.
5. Annualized for periods less than one full year.
6. Less than 0.005%.
7. Total expenses including indirect expenses from affiliated fund fees and expenses were as follows:
| | | | | | | | |
| Year Ended September 30, 2016 | | | 1.90% | | | | | |
| Year Ended September 30, 2015 | | | 1.90% | | | | | |
| Year Ended September 30, 2014 | | | 1.88% | | | | | |
| Year Ended September 30, 2013 | | | 1.90% | | | | | |
| Year Ended September 28, 2012 | | | 1.94% | | | | | |
See accompanying Notes to Financial Statements.
|
| 26 OPPENHEIMER GLOBAL FUND |
| | | | | | | | | | |
| Class I | | Year Ended
September
30, 2016 | | Year Ended
September
30, 2015 | | Year Ended September 30, 2014 | | Year Ended
September
30, 2013 | | Period Ended September 28, 20121,2 |
|
| Per Share Operating Data | | | | | | | | | | |
| Net asset value, beginning of period | | $75.07 | | $80.92 | | $76.36 | | $61.08 | | $57.08 |
|
| Income (loss) from investment operations: | | | | | | | | | | |
| Net investment income3 | | 0.80 | | 0.954 | | 1.124 | | 1.014 | | 0.53 |
| Net realized and unrealized gain (loss) | | 3.77 | | (1.96)4 | | 6.704 | | 15.334 | | 3.47 |
| | |
| Total from investment operations | | 4.57 | | (1.01) | | 7.82 | | 16.34 | | 4.00 |
| Dividends and/or distributions to shareholders: | | | | | | | | | | |
| Dividends from net investment income | | (0.88) | | (1.02) | | (0.97) | | (0.96) | | 0.00 |
| Distributions from net realized gain | | (3.36) | | (3.82) | | (2.29) | | (0.10) | | 0.00 |
| | |
| Total dividends and/or distributions to shareholders | | (4.24) | | (4.84) | | (3.26) | | (1.06) | | 0.00 |
|
| Net asset value, end of period | | $75.40 | | $75.07 | | $80.92 | | $76.36 | | $61.08 |
| | |
| | |
|
|
| Total Return, at Net Asset Value5 | | 6.05% | | (1.44)% | | 10.49% | | 27.12% | | 7.01% |
|
|
| Ratios/Supplemental Data | | | | | | | | | | |
| Net assets, end of period (in thousands) | | $663,292 | | $499,965 | | $343,373 | | $60,732 | | $12,762 |
|
| Average net assets (in thousands) | | $567,921 | | $433,479 | | $252,001 | | $41,484 | | $6,763 |
|
| Ratios to average net assets:6 | | | | | | | | | | |
| Net investment income | | 1.11% | | 1.18%4 | | 1.40%4 | | 1.44%4 | | 1.37% |
| Expenses excluding specific expenses listed below | | 0.71% | | 0.71% | | 0.70% | | 0.71% | | 0.73% |
| Interest and fees from borrowings | | 0.00%7 | | 0.00%7 | | 0.00% | | 0.00% | | 0.00% |
| | |
| Total expenses8 | | 0.71% | | 0.71% | | 0.70% | | 0.71% | | 0.73% |
| Expenses after payments, waivers and/or reimbursements and reduction to custodian expenses | | 0.71% | | 0.71% | | 0.70% | | 0.71% | | 0.73% |
|
| Portfolio turnover rate | | 6% | | 11% | | 11% | | 11% | | 12% |
|
| 27 OPPENHEIMER GLOBAL FUND |
FINANCIAL HIGHLIGHTS Continued
1. September 28, 2012 represents the last business day of the Fund’s reporting period.
2. For the period from January 27, 2012 (inception of offering) to September 28, 2012.
3. Per share amounts calculated based on the average shares outstanding during the period.
4. Net investment income (loss) per share, net realized and unrealized gain (loss) per share and the net investment income (loss) ratio include an adjustment for a prior period reclassification for the years ended September 30, 2013, 2014 and 2015. Please see Note 10 of the accompanying Notes to Financial Statements.
5. Assumes an initial investment on the business day before the first day of the fiscal period, with all dividends and distributions reinvested in additional shares on the reinvestment date, and redemption at the net asset value calculated on the last business day of the fiscal period. Sales charges are not reflected in the total returns. Total returns are not annualized for periods less than one full year. Returns do not reflect the deduction of taxes that a shareholder would pay on fund distributions or the redemption of fund shares.
6. Annualized for periods less than one full year.
7. Less than 0.005%.
8. Total expenses including indirect expenses from affiliated fund fees and expenses were as follows:
| | | | | | | | |
| Year Ended September 30, 2016 | | | 0.71% | | | | | |
| Year Ended September 30, 2015 | | | 0.71% | | | | | |
| Year Ended September 30, 2014 | | | 0.70% | | | | | |
| Year Ended September 30, 2013 | | | 0.71% | | | | | |
| Period Ended September 28, 2012 | | | 0.73% | | | | | |
See accompanying Notes to Financial Statements.
|
| 28 OPPENHEIMER GLOBAL FUND |
| | | | | | | | | | |
| Class R | | Year Ended
September
30, 2016 | | Year Ended
September
30, 2015 | | Year Ended
September
30, 2014 | | Year Ended
September
30, 2013 | | Year Ended
September
28, 20121 |
|
| Per Share Operating Data | | | | | | | | | | |
| Net asset value, beginning of period | | $74.35 | | $80.17 | | $75.68 | | $60.47 | | $51.46 |
|
| Income (loss) from investment operations: | | | | | | | | | | |
| Net investment income2 | | 0.28 | | 0.393 | | 0.413 | | 0.443 | | 0.38 |
| Net realized and unrealized gain (loss) | | 3.72 | | (1.93)3 | | 6.813 | | 15.273 | | 9.49 |
| | |
| Total from investment operations | | 4.00 | | (1.54) | | 7.22 | | 15.71 | | 9.87 |
|
| Dividends and/or distributions to shareholders: | | | | | | | | | | |
| Dividends from net investment income | | (0.30) | | (0.46) | | (0.44) | | (0.40) | | (0.84) |
| Distributions from net realized gain | | (3.36) | | (3.82) | | (2.29) | | (0.10) | | (0.02) |
| | |
| Total dividends and/or distributions to shareholders | | (3.66) | | (4.28) | | (2.73) | | (0.50) | | (0.86) |
|
| Net asset value, end of period | | $74.69 | | $74.35 | | $80.17 | | $75.68 | | $60.47 |
| | |
| | |
|
|
| Total Return, at Net Asset Value4 | | 5.33% | | (2.13)% | | 9.73% | | 26.16% | | 19.40% |
|
|
| Ratios/Supplemental Data | | | | | | | | | | |
| Net assets, end of period (in thousands) | | $210,141 | | $224,577 | | $236,838 | | $214,310 | | $192,647 |
|
| Average net assets (in thousands) | | $217,020 | | $240,784 | | $232,983 | | $200,060 | | $203,213 |
|
| Ratios to average net assets:5 | | | | | | | | | | |
| Net investment income | | 0.39% | | 0.49%3 | | 0.52%3 | | 0.64%3 | | 0.67% |
| Expenses excluding specific expenses listed below | | 1.39% | | 1.40% | | 1.40% | | 1.47% | | 1.55% |
| Interest and fees from borrowings | | 0.00%6 | | 0.00%6 | | 0.00% | | 0.00% | | 0.00% |
| | |
| Total expenses7 | | 1.39% | | 1.40% | | 1.40% | | 1.47% | | 1.55% |
| Expenses after payments, waivers and/or reimbursements and reduction to custodian expenses | | 1.39% | | 1.40% | | 1.40% | | 1.47% | | 1.55% |
|
| Portfolio turnover rate | | 6% | | 11% | | 11% | | 11% | | 12% |
|
| 29 OPPENHEIMER GLOBAL FUND |
FINANCIAL HIGHLIGHTS Continued
1. September 28, 2012 represents the last business day of the Fund’s reporting period.
2. Per share amounts calculated based on the average shares outstanding during the period.
3. Net investment income (loss) per share, net realized and unrealized gain (loss) per share and the net investment income (loss) ratio include an adjustment for a prior period reclassification for the years ended September 30, 2013, 2014 and 2015. Please see Note 10 of the accompanying Notes to Financial Statements.
4. Assumes an initial investment on the business day before the first day of the fiscal period, with all dividends and distributions reinvested in additional shares on the reinvestment date, and redemption at the net asset value calculated on the last business day of the fiscal period. Sales charges are not reflected in the total returns. Total returns are not annualized for periods less than one full year. Returns do not reflect the deduction of taxes that a shareholder would pay on fund distributions or the redemption of fund shares.
5. Annualized for periods less than one full year.
6. Less than 0.005%.
7. Total expenses including indirect expenses from affiliated fund fees and expenses were as follows:
| | | | | | | | |
| Year Ended September 30, 2016 | | | 1.39% | | | | | |
| Year Ended September 30, 2015 | | | 1.40% | | | | | |
| Year Ended September 30, 2014 | | | 1.40% | | | | | |
| Year Ended September 30, 2013 | | | 1.47% | | | | | |
| Year Ended September 28, 2012 | | | 1.55% | | | | | |
See accompanying Notes to Financial Statements.
|
| 30 OPPENHEIMER GLOBAL FUND |
| | | | | | | | | | |
| Class Y | | Year Ended
September 30, 2016 | | Year Ended
September 30, 2015 | | Year Ended
September 30, 2014 | | Year Ended
September 30, 2013 | | Year Ended
September 28, 20121 |
|
| Per Share Operating Data | | | | | | | | | | |
| Net asset value, beginning of period | | $75.00 | | $80.81 | | $76.25 | | $61.00 | | $51.95 |
|
| Income (loss) from investment operations: | | | | | | | | | | |
| Net investment income2 | | 0.65 | | 0.783 | | 0.833 | | 0.833 | | 0.72 |
| Net realized and unrealized gain (loss) | | 3.76 | | (1.94)3 | | 6.843 | | 15.353 | | 9.58 |
| | |
| Total from investment operations | | 4.41 | | (1.16) | | 7.67 | | 16.18 | | 10.30 |
|
| Dividends and/or distributions to shareholders: | | | | | | | | | | |
| Dividends from net investment income | | (0.73) | | (0.83) | | (0.82) | | (0.83) | | (1.23) |
| Distributions from net realized gain | | (3.36) | | (3.82) | | (2.29) | | (0.10) | | (0.02) |
| | |
| Total dividends and/or distributions to shareholders | | (4.09) | | (4.65) | | (3.11) | | (0.93) | | (1.25) |
|
| Net asset value, end of period | | $75.32 | | $75.00 | | $80.81 | | $76.25 | | $61.00 |
| | |
| | |
|
|
| Total Return, at Net Asset Value4 | | 5.87% | | (1.64)% | | 10.30% | | 26.85% | | 20.15% |
|
|
| Ratios/Supplemental Data | | | | | | | | | | |
| Net assets, end of period (in thousands) | | $1,182,183 | | $1,256,847 | | $1,480,337 | | $1,330,188 | | $977,716 |
|
| Average net assets (in thousands) | | $1,248,978 | | $1,302,957 | | $1,454,338 | | $1,147,539 | | $839,762 |
|
| Ratios to average net assets:5 | | | | | | | | | | |
| Net investment income | | 0.90% | | 0.96%3 | | 1.04%3 | | 1.21%3 | | 1.26% |
| Expenses excluding specific expenses listed below | | 0.90% | | 0.90% | | 0.89% | | 0.92% | | 0.93% |
| Interest and fees from borrowings | | 0.00%6 | | 0.00%6 | | 0.00% | | 0.00% | | 0.00% |
| | |
| Total expenses7 | | 0.90% | | 0.90% | | 0.89% | | 0.92% | | 0.93% |
| Expenses after payments, waivers and/or reimbursements and reduction to custodian expenses | | 0.90% | | 0.90% | | 0.89% | | 0.92% | | 0.93% |
|
| Portfolio turnover rate | | 6% | | 11% | | 11% | | 11% | | 12% |
|
| 31 OPPENHEIMER GLOBAL FUND |
FINANCIAL HIGHLIGHTS Continued
1. September 28, 2012 represents the last business day of the Fund’s reporting period.
2. Per share amounts calculated based on the average shares outstanding during the period.
3. Net investment income (loss) per share, net realized and unrealized gain (loss) per share and the net investment income (loss) ratio include an adjustment for a prior period reclassification for the years ended September 30, 2013, 2014 and 2015. Please see Note 10 of the accompanying Notes to Financial Statements.
4. Assumes an initial investment on the business day before the first day of the fiscal period, with all dividends and distributions reinvested in additional shares on the reinvestment date, and redemption at the net asset value calculated on the last business day of the fiscal period. Sales charges are not reflected in the total returns. Total returns are not annualized for periods less than one full year. Returns do not reflect the deduction of taxes that a shareholder would pay on fund distributions or the redemption of fund shares.
5. Annualized for periods less than one full year.
6. Less than 0.005%.
7. Total expenses including indirect expenses from affiliated fund fees and expenses were as follows:
| | | | | | | | |
| Year Ended September 30, 2016 | | | 0.90% | | | | | |
| Year Ended September 30, 2015 | | | 0.90% | | | | | |
| Year Ended September 30, 2014 | | | 0.89% | | | | | |
| Year Ended September 30, 2013 | | | 0.92% | | | | | |
| Year Ended September 28, 2012 | | | 0.93% | | | | | |
See accompanying Notes to Financial Statements.
|
| 32 OPPENHEIMER GLOBAL FUND |
NOTES TO FINANCIAL STATEMENTS September 30, 2016
1. Organization
Oppenheimer Global Fund (the “Fund”) is a diversified open-end management investment company registered under the Investment Company Act of 1940 (“1940 Act”), as amended. The Fund’s investment objective is to seek capital appreciation. The Fund’s investment adviser is OFI Global Asset Management, Inc. (“OFI Global” or the “Manager”), a wholly-owned subsidiary of OppenheimerFunds, Inc. (“OFI” or the “Sub-Adviser”). The Manager has entered into a sub-advisory agreement with OFI.
The Fund offers Class A, Class C, Class I, Class R and Class Y shares, and previously offered Class B shares for new purchase through June 29, 2012. Subsequent to that date, no new purchases of Class B shares are permitted, however reinvestment of dividend and/or capital gain distributions and exchanges of Class B shares into and from other Oppenheimer funds are allowed. As of July 1, 2014, Class N shares were renamed Class R shares. Class N shares subject to a contingent deferred sales charge (“CDSC”) on July 1, 2014, continue to be subject to a CDSC after the shares were renamed. Purchases of Class R shares occurring on or after July 1, 2014, are not subject to a CDSC upon redemption. Class A shares are sold at their offering price, which is normally net asset value plus a front-end sales charge. Class C and Class R shares are sold, and Class B shares were sold, without a front-end sales charge but may be subject to a CDSC. Class R shares are sold only through retirement plans. Retirement plans that offer Class R shares may impose charges on those accounts. Class I and Class Y shares are sold to certain institutional investors or intermediaries without either a front-end sales charge or a CDSC, however, the intermediaries may impose charges on their accountholders who beneficially own Class I and Class Y shares. All classes of shares have identical rights and voting privileges with respect to the Fund in general and exclusive voting rights on matters that affect that class alone. Earnings, net assets and net asset value per share may differ due to each class having its own expenses, such as transfer and shareholder servicing agent fees and shareholder communications, directly attributable to that class. Class A, B, C and R shares have separate distribution and/or service plans under which they pay fees. Class I and Class Y shares do not pay such fees. Class B shares will automatically convert to Class A shares 72 months after the date of purchase.
The following is a summary of significant accounting policies followed in the Fund’s preparation of financial statements in accordance with accounting principles generally accepted in the United States (“U.S. GAAP”).
2. Significant Accounting Policies
Security Valuation. All investments in securities are recorded at their estimated fair value, as described in Note 3.
Foreign Currency Translation. The Fund’s accounting records are maintained in U.S. dollars. The values of securities denominated in foreign currencies and amounts related to the purchase and sale of foreign securities and foreign investment income are translated into U.S. dollars as of the close of the New York Stock Exchange (the “Exchange”), normally 4:00 P.M. Eastern time, on each day the Exchange is open for trading. Foreign exchange rates may be
|
| 33 OPPENHEIMER GLOBAL FUND |
NOTES TO FINANCIAL STATEMENTS Continued
2. Significant Accounting Policies (Continued)
valued primarily using a reliable bank, dealer or service authorized by the Board of Trustees.
Reported net realized gains and losses from foreign currency transactions arise from sales of portfolio securities, sales and maturities of short-term securities, sales of foreign currencies, exchange rate fluctuations between the trade and settlement dates on securities transactions, and the difference between the amounts of dividends, interest, and foreign withholding taxes recorded on the Fund’s books and the U.S. dollar equivalent of the amounts actually received or paid. Net unrealized appreciation and depreciation on the translation of assets and liabilities denominated in foreign currencies arise from changes in the values of assets and liabilities, including investments in securities at fiscal period end, resulting from changes in exchange rates.
The effect of changes in foreign currency exchange rates on investments is separately identified from the fluctuations arising from changes in market values of securities held and reported with all other foreign currency gains and losses in the Fund’s Statement of Operations.
Allocation of Income, Expenses, Gains and Losses. Income, expenses (other than those attributable to a specific class), gains and losses are allocated on a daily basis to each class of shares based upon the relative proportion of net assets represented by such class. Operating expenses directly attributable to a specific class are charged against the operations of that class.
Dividends and Distributions to Shareholders. Dividends and distributions to shareholders, which are determined in accordance with income tax regulations and may differ from U.S. GAAP, are recorded on the ex-dividend date. Income and capital gain distributions, if any, are declared and paid annually or at other times as deemed necessary by the Manager.
Investment Income. Dividend income is recorded on the ex-dividend date or upon ex-dividend notification in the case of certain foreign dividends where the ex-dividend date may have passed. Non-cash dividends included in dividend income, if any, are recorded at the fair market value of the securities received. Interest income is recognized on an accrual basis. Discount and premium, which are included in interest income on the Statement of Operations, are amortized or accreted daily.
Custodian Fees. “Custodian fees and expenses” in the Statement of Operations may include interest expense incurred by the Fund on any cash overdrafts of its custodian account during the period. Such cash overdrafts may result from the effects of failed trades in portfolio securities and from cash outflows resulting from unanticipated shareholder redemption activity. The Fund pays interest to its custodian on such cash overdrafts, to the extent they are not offset by positive cash balances maintained by the Fund, at a rate equal to the Federal Funds Rate plus 0.50%. The “Reduction to custodian expenses” line item, if applicable, represents earnings on cash balances maintained by the Fund during the period. Such interest expense and other custodian fees may be paid with these earnings.
|
| 34 OPPENHEIMER GLOBAL FUND |
2. Significant Accounting Policies (Continued)
Security Transactions. Security transactions are recorded on the trade date. Realized gains and losses on securities sold are determined on the basis of identified cost.
Indemnifications. The Fund’s organizational documents provide current and former Trustees and officers with a limited indemnification against liabilities arising in connection with the performance of their duties to the Fund. In the normal course of business, the Fund may also enter into contracts that provide general indemnifications. The Fund’s maximum exposure under these arrangements is unknown as this would be dependent on future claims that may be made against the Fund. The risk of material loss from such claims is considered remote.
Federal Taxes. The Fund intends to comply with provisions of the Internal Revenue Code applicable to regulated investment companies and to distribute substantially all of its investment company taxable income, including any net realized gain on investments not offset by capital loss carryforwards, if any, to shareholders. Therefore, no federal income or excise tax provision is required. The Fund files income tax returns in U.S. federal and applicable state jurisdictions. The statute of limitations on the Fund’s tax return filings generally remains open for the three preceding fiscal reporting period ends. The Fund has analyzed its tax positions for the fiscal year ended September 30, 2016, including open tax years, and does not believe there are any uncertain tax positions requiring recognition in the Fund’s financial statements.
The tax components of capital shown in the following table represent distribution requirements the Fund must satisfy under the income tax regulations, losses the Fund may be able to offset against income and gains realized in future years and unrealized appreciation or depreciation of securities and other investments for federal income tax purposes.
| | | | | | | | | | | | |
Undistributed Net Investment Income | | Undistributed Long-Term Gain | | | Accumulated Loss Carryforward1,2,3 | | | Net Unrealized Appreciation Based on cost of Securities and Other Investments for Federal Income Tax Purposes | |
| |
| $61,041,221 | | | $— | | | | $33,547,144 | | | | $3,995,869,741 | |
1. At period end, the Fund had $33,547,144 of net capital loss carryforward available to offset future realized capital gains, if any, and thereby reduce future taxable gain distributions. Details of the capital loss carryforwards are included in the table below. Capital loss carryovers with no expiration, if any, must be utilized prior to those with expiration dates.
| | | | |
| Expiring | | | |
| |
| No expiration | | $ | 33,547,144 | |
2. During the reporting period, the Fund did not utilize any capital loss carryforward.
3. During the previous reporting period, the Fund did not utilize any capital loss carryforward.
Net investment income (loss) and net realized gain (loss) may differ for financial statement and tax purposes. The character of dividends and distributions made during the fiscal year
|
| 35 OPPENHEIMER GLOBAL FUND |
NOTES TO FINANCIAL STATEMENTS Continued
2. Significant Accounting Policies (Continued)
from net investment income or net realized gains are determined in accordance with federal income tax requirements, which may differ from the character of net investment income or net realized gains presented in those financial statements in accordance with U.S. GAAP. Also, due to timing of dividends and distributions, the fiscal year in which amounts are distributed may differ from the fiscal year in which the income or net realized gain was recorded by the Fund.
Accordingly, the following amounts have been reclassified for the reporting period. Net assets of the Fund were unaffected by the reclassifications.
| | | | | | |
Increase to Paid-in Capital | | Reduction to Accumulated Net Investment Income | | Reduction to Accumulated Net Realized Loss on Investments | |
| |
| $12,150,503 | | $15,807,917 | | | $3,657,414 | |
The tax character of distributions paid during the reporting periods:
| | | | | | | | |
| | | Year Ended
September 30, 2016 | | | Year Ended
September 30, 2015 | |
| |
| Distributions paid from: | | | | | | | | |
| Ordinary income | | $ | 73,842,557 | | | $ | 81,049,258 | |
| Long-term capital gain | | | 429,271,852 | | | | 479,495,139 | |
| | | | |
| Total | | $ | 503,114,409 | | | $ | 560,544,397 | |
| | | | |
The aggregate cost of securities and other investments and the composition of unrealized appreciation and depreciation of securities and other investments for federal income tax purposes at period end are noted in the following table. The primary difference between book and tax appreciation or depreciation of securities and other investments, if applicable, is attributable to the tax deferral of losses or tax realization of financial statement unrealized gain or loss.
| | | | |
| Federal tax cost of securities | | $ | 5,114,948,082 | |
| | | | |
| Gross unrealized appreciation | | $ | 4,392,357,862 | |
| Gross unrealized depreciation | | | (396,488,121) | |
| | | | |
| Net unrealized appreciation | | $ | 3,995,869,741 | |
| | | | |
Use of Estimates. The preparation of financial statements in conformity with U.S. GAAP requires management to make estimates and assumptions that affect the reported amounts of assets and liabilities and disclosure of contingent assets and liabilities at the date of the financial statements and the reported amounts of increases and decreases in net assets from operations during the reporting period. Actual results could differ from those estimates.
3. Securities Valuation
The Fund calculates the net asset value of its shares as of 4:00 P.M. Eastern time, on each day the New York Stock Exchange (the “Exchange”) is open for trading, except in the case of a
|
| 36 OPPENHEIMER GLOBAL FUND |
3. Securities Valuation (Continued)
scheduled early closing of the Exchange, in which case the Fund will calculate net asset value of the shares as of the scheduled early closing time of the Exchange.
The Fund’s Board has adopted procedures for the valuation of the Fund’s securities and has delegated the day-to-day responsibility for valuation determinations under those procedures to the Manager. The Manager has established a Valuation Committee which is responsible for determining a “fair valuation” for any security for which market quotations are not “readily available.” The Valuation Committee’s fair valuation determinations are subject to review, approval and ratification by the Fund’s Board at its next regularly scheduled meeting covering the calendar quarter in which the fair valuation was determined.
Valuation Methods and Inputs
Securities are valued using unadjusted quoted market prices, when available, as supplied primarily by third party pricing services or dealers.
The following methodologies are used to determine the market value or the fair value of the types of securities described below:
Securities traded on a registered U.S. securities exchange (including exchange-traded derivatives other than futures and futures options) are valued based on the last sale price of the security reported on the principal exchange on which it is traded, prior to the time when the Fund’s assets are valued. In the absence of a sale, the security is valued at the mean between the bid and asked price on the principal exchange or, if not available from the principal exchange, obtained from two dealers. If bid and asked prices are not available from either the exchange or two dealers, the security is valued by using one of the following methodologies (listed in order of priority): (1) a bid from the principal exchange, (2) the mean between the bid and asked price as provided by a single dealer, or (3) a bid from a single dealer. A security of a foreign issuer traded on a foreign exchange, but not listed on a registered U.S. securities exchange, is valued based on the last sale price on the principal exchange on which the security is traded, as identified by the third party pricing service used by the Manager, prior to the time when the Fund’s assets are valued. If the last sale price is unavailable, the security is valued at the most recent official closing price on the principal exchange on which it is traded. If the last sales price or official closing price for a foreign security is not available, the security is valued at the mean between the bid and asked price per the exchange or, if not available from the exchange, obtained from two dealers. If bid and asked prices are not available from either the exchange or two dealers, the security is valued by using one of the following methodologies (listed in order of priority): (1) a bid from the exchange, (2) the mean between the bid and asked price as provided by a single dealer, or (3) a bid from a single dealer.
Shares of a registered investment company that are not traded on an exchange are valued at that investment company’s net asset value per share.
Corporate and government debt securities (of U.S. or foreign issuers) and municipal debt securities, event-linked bonds, loans, mortgage-backed securities, collateralized mortgage obligations, and asset-backed securities are valued at the mean between the “bid” and “asked” prices utilizing evaluated prices obtained from third party pricing services or
|
| 37 OPPENHEIMER GLOBAL FUND |
NOTES TO FINANCIAL STATEMENTS Continued
3. Securities Valuation (Continued)
broker-dealers who may use matrix pricing methods to determine the evaluated prices.
Short-term money market type debt securities with a remaining maturity of sixty days or less are valued at cost adjusted by the amortization of discount or premium to maturity (amortized cost), which approximates market value. Short-term debt securities with a remaining maturity in excess of sixty days are valued at the mean between the “bid” and “asked” prices utilizing evaluated prices obtained from third party pricing services or broker-dealers.
A description of the standard inputs that may generally be considered by the third party pricing vendors in determining their evaluated prices is provided below.
| | |
| Security Type | | Standard inputs generally considered by third-party pricing vendors |
|
| Corporate debt, government debt, municipal, mortgage-backed and asset-backed securities | | Reported trade data, broker-dealer price quotations, benchmark yields, issuer spreads on comparable securities, the credit quality, yield, maturity, and other appropriate factors. |
|
| Loans | | Information obtained from market participants regarding reported trade data and broker-dealer price quotations. |
|
| Event-linked bonds | | Information obtained from market participants regarding reported trade data and broker-dealer price quotations. |
If a market value or price cannot be determined for a security using the methodologies described above, or if, in the “good faith” opinion of the Manager, the market value or price obtained does not constitute a “readily available market quotation,” or a significant event has occurred that would materially affect the value of the security, the security is fair valued either (i) by a standardized fair valuation methodology applicable to the security type or the significant event as previously approved by the Valuation Committee and the Fund’s Board or (ii) as determined in good faith by the Manager’s Valuation Committee. The Valuation Committee considers all relevant facts that are reasonably available, through either public information or information available to the Manager, when determining the fair value of a security. Fair value determinations by the Manager are subject to review, approval and ratification by the Fund’s Board at its next regularly scheduled meeting covering the calendar quarter in which the fair valuation was determined. Those fair valuation standardized methodologies include, but are not limited to, valuing securities at the last sale price or initially at cost and subsequently adjusting the value based on: changes in company specific fundamentals, changes in an appropriate securities index, or changes in the value of similar securities which may be further adjusted for any discounts related to security-specific resale restrictions. When possible, such methodologies use observable market inputs such as unadjusted quoted prices of similar securities, observable interest rates, currency rates and yield curves. The methodologies used for valuing securities are not necessarily an indication of the risks associated with investing in those securities nor can it be assured that the Fund can obtain the fair value assigned to a security if it were to sell the security.
To assess the continuing appropriateness of security valuations, the Manager, or its third party service provider who is subject to oversight by the Manager, regularly compares prior day prices, prices on comparable securities, and sale prices to the current day prices and challenges
|
| 38 OPPENHEIMER GLOBAL FUND |
3. Securities Valuation (Continued)
those prices exceeding certain tolerance levels with the third party pricing service or broker source. For those securities valued by fair valuations, whether through a standardized fair valuation methodology or a fair valuation determination, the Valuation Committee reviews and affirms the reasonableness of the valuations based on such methodologies and fair valuation determinations on a regular basis after considering all relevant information that is reasonably available.
Classifications
Each investment asset or liability of the Fund is assigned a level at measurement date based on the significance and source of the inputs to its valuation. Various data inputs are used in determining the value of each of the Fund’s investments as of the reporting period end. These data inputs are categorized in the following hierarchy under applicable financial accounting standards:
1) Level 1-unadjusted quoted prices in active markets for identical assets or liabilities (including securities actively traded on a securities exchange)
2) Level 2-inputs other than unadjusted quoted prices that are observable for the asset or liability (such as unadjusted quoted prices for similar assets and market corroborated inputs such as interest rates, prepayment speeds, credit risks, etc.)
3) Level 3-significant unobservable inputs (including the Manager’s own judgments about assumptions that market participants would use in pricing the asset or liability).
The inputs used for valuing securities are not necessarily an indication of the risks associated with investing in those securities.
The Fund classifies each of its investments in investment companies which are publicly offered as Level 1. Investment companies that are not publicly offered are measured using net asset value as a practical expedient, and are not classified in the fair value hierarchy.
The table below categorizes amounts that are included in the Fund’s Statement of Assets and Liabilities at period end based on valuation input level:
| | | | | | | | | | | | | | | | |
| | | Level 1—
Unadjusted Quoted Prices | | | Level 2— Other Significant Observable Inputs | | | Level 3— Significant Unobservable Inputs | | | Value | |
| |
Assets Table | �� | | | | | | | | | | | | | | | |
Investments, at Value: | | | | | | | | | | | | | | | | |
Common Stocks | | | | | | | | | | | | | | | | |
Consumer Discretionary | | $ | 464,814,697 | | | $ | 852,732,400 | | | $ | — | | | $ | 1,317,547,097 | |
Consumer Staples | | | 237,405,770 | | | | 257,650,747 | | | | — | | | | 495,056,517 | |
Energy | | | — | | | | 143,345,834 | | | | — | | | | 143,345,834 | |
Financials | | | 860,718,909 | | | | 984,975,374 | | | | — | | | | 1,845,694,283 | |
Health Care | | | 1,088,762,233 | | | | 282,822,599 | | | | 47,945,242 | | | | 1,419,530,074 | |
Industrials | | | 390,806,481 | | | | 753,249,642 | | | | — | | | | 1,144,056,123 | |
Information Technology | | | 1,504,335,036 | | | | 792,106,094 | | | | — | | | | 2,296,441,130 | |
Materials | | | — | | | | 93,236,172 | | | | — | | | | 93,236,172 | |
Telecommunication Services | | | — | | | | 163,774,657 | | | | — | | | | 163,774,657 | |
|
| 39 OPPENHEIMER GLOBAL FUND |
NOTES TO FINANCIAL STATEMENTS Continued
3. Securities Valuation (Continued)
| | | | | | | | | | | | | | | | |
| | | Level 1—
Unadjusted Quoted Prices | | | Level 2— Other Significant Observable Inputs | | | Level 3— Significant Unobservable Inputs | | | Value | |
| |
Common Stocks (Continued) | | | | | | | | | | | | | | | | |
Preferred Stocks | | $ | 4,178,355 | | | $ | 161,963,948 | | | $ | — | | | $ | 166,142,303 | |
Investment Company | | | 28,107,943 | | | | — | | | | — | | | | 28,107,943 | |
| | | | |
Total Assets | | $ | 4,579,129,424 | | | $ | 4,485,857,467 | | | $ | 47,945,242 | | | $ | 9,112,932,133 | |
| | | | |
Forward currency exchange contracts and futures contracts, if any, are reported at their unrealized appreciation/depreciation at measurement date, which represents the change in the contract’s value from trade date. All additional assets and liabilities included in the above table are reported at their market value at measurement date.
4. Investments and Risks
Risks of Foreign Investing. The Fund may invest in foreign securities which are subject to special risks. Securities traded in foreign markets may be less liquid and more volatile than those traded in U.S. markets. Foreign issuers are usually not subject to the same accounting and disclosure requirements that U.S. companies are subject to, which may make it difficult for the Fund to evaluate a foreign company’s operations or financial condition. A change in the value of a foreign currency against the U.S. dollar will result in a change in the U.S. dollar value of investments denominated in that foreign currency and in the value of any income or distributions the Fund may receive on those investments. The value of foreign investments may be affected by exchange control regulations, foreign taxes, higher transaction and other costs, delays in the settlement of transactions, changes in economic or monetary policy in the United States or abroad, expropriation or nationalization of a company’s assets, or other political and economic factors. In addition, due to the inter-relationship of global economies and financial markets, changes in political and economic factors in one country or region could adversely affect conditions in another country or region. Investments in foreign securities may also expose the Fund to time-zone arbitrage risk. Foreign securities may trade on weekends or other days when the Fund does not price its shares. At times, the Fund may emphasize investments in a particular country or region and may be subject to greater risks from adverse events that occur in that country or region. Foreign securities and foreign currencies held in foreign banks and securities depositories may be subject to limited or no regulatory oversight.
Investments in Affiliated Funds. The Fund is permitted to invest in other mutual funds advised by the Manager (“Affiliated Funds”). Affiliated Funds are open-end management investment companies registered under the 1940 Act, as amended. The Manager is the investment adviser of, and the Sub-Adviser provides investment and related advisory services to, the Affiliated Funds. When applicable, the Fund’s investments in Affiliated Funds are included in the Statement of Investments. Shares of Affiliated Funds are valued at their net asset value per share. As a shareholder, the Fund is subject to its proportional share of the
|
| 40 OPPENHEIMER GLOBAL FUND |
4. Investments and Risks (Continued)
Affiliated Funds’ expenses, including their management fee. The Manager will waive fees and/ or reimburse Fund expenses in an amount equal to the indirect management fees incurred through the Fund’s investment in the Affiliated Funds.
Each of the Affiliated Funds in which the Fund invests has its own investment risks, and those risks can affect the value of the Fund’s investments and therefore the value of the Fund’s shares. To the extent that the Fund invests more of its assets in one Affiliated Fund than in another, the Fund will have greater exposure to the risks of that Affiliated Fund.
Investments in Money Market Instruments. The Fund is permitted to invest its free cash balances in money market instruments to provide liquidity or for defensive purposes. The Fund may invest in money market instruments by investing in Class E shares of Oppenheimer Institutional Government Money Market Fund (“IGMMF”), formerly known as Oppenheimer Institutional Money Market Fund, which is an Affiliated Fund. IGMMF is regulated as a money market fund under the 1940 Act, as amended. The Fund may also invest in money market instruments directly or in other affiliated or unaffiliated money market funds.
Restricted Securities. At period end, investments in securities included issues that are restricted. A restricted security may have a contractual restriction on its resale and is valued under methods approved by the Board of Trustees as reflecting fair value. Securities that are restricted are marked with an applicable footnote on the Statement of Investments. Restricted securities are reported on a schedule following the Statement of Investments.
Equity Security Risk. Stocks and other equity securities fluctuate in price. The value of the Fund’s portfolio may be affected by changes in the equity markets generally. Equity markets may experience significant short-term volatility and may fall sharply at times. Different markets may behave differently from each other and U.S. equity markets may move in the opposite direction from one or more foreign stock markets. Adverse events in any part of the equity or fixed-income markets may have unexpected negative effects on other market segments.
The prices of individual equity securities generally do not all move in the same direction at the same time and a variety of factors can affect the price of a particular company’s securities. These factors may include, but are not limited to, poor earnings reports, a loss of customers, litigation against the company, general unfavorable performance of the company’s sector or industry, or changes in government regulations affecting the company or its industry.
5. Market Risk Factors
The Fund’s investments in securities and/or financial derivatives may expose the Fund to various market risk factors:
Commodity Risk. Commodity risk relates to the change in value of commodities or commodity indexes as they relate to increases or decreases in the commodities market. Commodities are physical assets that have tangible properties. Examples of these types of assets are crude oil, heating oil, metals, livestock, and agricultural products.
|
| 41 OPPENHEIMER GLOBAL FUND |
NOTES TO FINANCIAL STATEMENTS Continued
5. Market Risk Factors (Continued)
Credit Risk. Credit risk relates to the ability of the issuer of debt to meet interest and principal payments, or both, as they come due. In general, lower-grade, higher-yield debt securities are subject to credit risk to a greater extent than lower-yield, higher-quality securities.
Equity Risk. Equity risk relates to the change in value of equity securities as they relate to increases or decreases in the general market.
Foreign Exchange Rate Risk. Foreign exchange rate risk relates to the change in the U.S. dollar value of a security held that is denominated in a foreign currency. The U.S. dollar value of a foreign currency denominated security will decrease as the dollar appreciates against the currency, while the U.S. dollar value will increase as the dollar depreciates against the currency.
Interest Rate Risk. Interest rate risk refers to the fluctuations in value of fixed-income securities resulting from the inverse relationship between price and yield. For example, an increase in general interest rates will tend to reduce the market value of already issued fixed-income investments, and a decline in general interest rates will tend to increase their value. In addition, debt securities with longer maturities, which tend to have higher yields, are subject to potentially greater fluctuations in value from changes in interest rates than obligations with shorter maturities.
Volatility Risk. Volatility risk refers to the magnitude of the movement, but not the direction of the movement, in a financial instrument’s price over a defined time period. Large increases or decreases in a financial instrument’s price over a relative time period typically indicate greater volatility risk, while small increases or decreases in its price typically indicate lower volatility risk.
6. Shares of Beneficial Interest
The Fund has authorized an unlimited number of no par value shares of beneficial interest of each class. Transactions in shares of beneficial interest were as follows:
| | | | | | | | | | | | | | | | |
| | | Year Ended September 30, 2016 | | | Year Ended September 30, 2015 | |
| | | Shares | | | Amount | | | Shares | | | Amount | |
Class A | | | | | | | | | | | | | | | | |
Sold | | | 7,054,917 | | | $ | 516,194,905 | | | | 13,404,323 | | | $ | 1,084,689,669 | |
Dividends and/or distributions reinvested | | | 4,539,051 | | | | 343,197,662 | | | | 5,126,002 | | | | 398,495,367 | |
Redeemed | | | (19,247,791) | | | | (1,391,794,549) | | | | (16,996,203) | | | | (1,363,016,563) | |
| | | | |
Net increase (decrease) | | | (7,653,823) | | | $ | (532,401,982) | | | | 1,534,122 | | | $ | 120,168,473 | |
| | | | |
| | | | | | | | | | | | | | | | | |
Class B | | | | | | | | | | | | | | | | |
Sold | | | 14,020 | | | $ | 952,647 | | | | 50,844 | | | $ | 3,808,399 | |
Dividends and/or distributions reinvested | | | 41,799 | | | | 2,895,865 | | | | 69,299 | | | | 4,961,093 | |
Redeemed | | | (506,136) | | | | (33,692,552) | | | | (612,010) | | | | (45,367,551) | |
| | | | |
Net decrease | | | (450,317) | | | $ | (29,844,040) | | | | (491,867) | | | $ | (36,598,059) | |
| | | | |
|
| 42 OPPENHEIMER GLOBAL FUND |
6. Shares of Beneficial Interest (Continued)
| | | | | | | | | | | | | | | | |
| | | Year Ended September 30, 2016 | | | Year Ended September 30, 2015 | |
| | | Shares | | | Amount | | | Shares | | | Amount | |
Class C | | | | | | | | | | | | | | | | |
Sold | | | 928,198 | | | $ | 63,094,417 | | | | 1,441,343 | | | $ | 109,275,130 | |
Dividends and/or distributions reinvested | | | 430,982 | | | | 30,285,086 | | | | 457,857 | | | | 33,222,077 | |
Redeemed | | | (2,060,616) | | | | (137,595,859) | | | | (1,431,357) | | | | (107,121,235) | |
| | | | |
Net increase (decrease) | | | (701,436) | | | $ | (44,216,356) | | | | 467,843 | | | $ | 35,375,972 | |
| | | | |
| | | | | | | | | | | | | | | | | |
Class I | | | | | | | | | | | | | | | | |
Sold | | | 3,756,886 | | | $ | 271,777,309 | | | | 3,358,833 | | | $ | 269,082,961 | |
Dividends and/or distributions reinvested | | | 391,971 | | | | 29,640,837 | | | | 275,603 | | | | 21,433,640 | |
Redeemed | | | (2,011,509) | | | | (145,821,347) | | | | (1,218,110) | | | | (97,982,277) | |
| | | | |
Net increase | | | 2,137,348 | | | $ | 155,596,799 | | | | 2,416,326 | | | $ | 192,534,324 | |
| | | | |
| | | | | | | | | | | | | | | | | |
Class R | | | | | | | | | | | | | | | | |
Sold | | | 551,910 | | | $ | 39,800,414 | | | | 672,602 | | | $ | 53,966,036 | |
Dividends and/or distributions reinvested | | | 137,608 | | | | 10,366,008 | | | | 157,235 | | | | 12,179,437 | |
Redeemed | | | (896,305) | | | | (65,326,258) | | | | (763,660) | | | | (60,714,515) | |
| | | | |
Net increase (decrease) | | | (206,787) | | | $ | (15,159,836) | | | | 66,177 | | | $ | 5,430,958 | |
| | | | |
| | | | | | | | | | | | | | | | | |
Class Y | | | | | | | | | | | | | | | | |
Sold | | | 4,770,281 | | | $ | 348,168,692 | | | | 5,552,098 | | | $ | 450,960,081 | |
Dividends and/or distributions reinvested | | | 869,115 | | | | 65,757,225 | | | | 857,366 | | | | 66,711,676 | |
Redeemed | | | (6,702,907) | | | | (482,202,627) | | | | (7,970,138) | | | | (640,023,618) | |
| | | | |
Net decrease | | | (1,063,511) | | | $ | (68,276,710) | | | | (1,560,674) | | | $ | (122,351,861) | |
| | | | |
7. Purchases and Sales of Securities
The aggregate cost of purchases and proceeds from sales of securities, other than short-term obligations and investments in IGMMF, for the reporting period were as follows:
| | | | | | | | | | | | |
| | | Purchases | | | | | | Sales | |
Investment securities | | $ | 566,060,801 | | | | | | | $ | 1,436,752,215 | |
8. Fees and Other Transactions with Affiliates
Management Fees. Under the investment advisory agreement, the Fund pays the Manager a management fee based on the daily net assets of the Fund at an annual rate as shown in the following table:
|
| 43 OPPENHEIMER GLOBAL FUND |
NOTES TO FINANCIAL STATEMENTS Continued
8. Fees and Other Transactions with Affiliates (Continued)
| | |
| Fee Schedule | | |
Up to $250 million | | 0.80% |
Next $250 million | | 0.77 |
Next $500 million | | 0.75 |
Next $1.0 billion | | 0.69 |
Next $1.5 billion | | 0.67 |
Next $2.5 billion | | 0.65 |
Next $2.5 billion | | 0.63 |
Next $2.5 billion | | 0.60 |
Next $4.0 billion | | 0.58 |
Next $8.0 billion | | 0.56 |
Over $23.0 billion | | 0.54 |
The Fund’s effective management fee for the reporting period was 0.66% of average annual net assets before any applicable waivers.
Sub-Adviser Fees. The Manager has retained the Sub-Adviser to provide the day-to-day portfolio management of the Fund. Under the Sub-Advisory Agreement, the Manager pays the Sub-Adviser an annual fee in monthly installments, equal to a percentage of the investment management fee collected by the Manager from the Fund, which shall be calculated after any investment management fee waivers. The fee paid to the Sub-Adviser is paid by the Manager, not by the Fund.
Transfer Agent Fees. OFI Global (the “Transfer Agent”) serves as the transfer and shareholder servicing agent for the Fund. The Fund pays the Transfer Agent a fee based on annual net assets. Fees incurred and average net assets for each class with respect to these services are detailed in the Statement of Operations and Financial Highlights, respectively.
Sub-Transfer Agent Fees. The Transfer Agent has retained Shareholder Services, Inc., a wholly-owned subsidiary of OFI (the “Sub-Transfer Agent”), to provide the day-to-day transfer agent and shareholder servicing of the Fund. Under the Sub-Transfer Agency Agreement, the Transfer Agent pays the Sub-Transfer Agent an annual fee in monthly installments, equal to a percentage of the transfer agent fee collected by the Transfer Agent from the Fund, which shall be calculated after any applicable fee waivers. The fee paid to the Sub-Transfer Agent is paid by the Transfer Agent, not by the Fund.
Trustees’ Compensation. The Fund has adopted an unfunded retirement plan (the “Plan”) for the Fund’s Independent Trustees. Benefits are based on years of service and fees paid to each Trustee during their period of service. The Plan was frozen with respect to adding new participants effective December 31, 2006 (the “Freeze Date”) and existing Plan Participants as of the Freeze Date will continue to receive accrued benefits under the Plan. Active Independent Trustees as of the Freeze Date have each elected a distribution method with respect to their benefits under the Plan. During the reporting period, the Fund’s projected benefit obligations, payments to retired Trustees and accumulated liability were as follows:
|
| 44 OPPENHEIMER GLOBAL FUND |
8. Fees and Other Transactions with Affiliates (Continued)
| | | | |
Projected Benefit Obligations Increased | | $ | — | |
Payments Made to Retired Trustees | | | 146,278 | |
Accumulated Liability as of September 30, 2016 | | | 1,007,174 | |
The Fund’s Board of Trustees (“Board”) has adopted a compensation deferral plan for Independent Trustees that enables Trustees to elect to defer receipt of all or a portion of the annual compensation they are entitled to receive from the Fund. For purposes of determining the amount owed to the Trustee under the plan, deferred amounts are treated as though equal dollar amounts had been invested in shares of the Fund or in other Oppenheimer funds selected by the Trustee. The Fund purchases shares of the funds selected for deferral by the Trustee in amounts equal to his or her deemed investment, resulting in a Fund asset equal to the deferred compensation liability. Such assets are included as a component of “Other” within the asset section of the Statement of Assets and Liabilities. Deferral of Trustees’ fees under the plan will not affect the net assets of the Fund and will not materially affect the Fund’s assets, liabilities or net investment income per share. Amounts will be deferred until distributed in accordance with the compensation deferral plan.
Distribution and Service Plan (12b-1) Fees. Under its General Distributor’s Agreement with the Fund, OppenheimerFunds Distributor, Inc. (the “Distributor”) acts as the Fund’s principal underwriter in the continuous public offering of the Fund’s classes of shares.
Service Plan for Class A Shares. The Fund has adopted a Service Plan (the “Plan”) for Class A shares pursuant to Rule 12b-1 under the 1940 Act. Under the Plan, the Fund reimburses the Distributor for a portion of its costs incurred for services provided to accounts that hold Class A shares. Reimbursement is made periodically at an annual rate of up to 0.25% of the daily net assets of Class A shares of the Fund. The Distributor currently uses all of those fees to pay dealers, brokers, banks and other financial institutions periodically for providing personal service and maintenance of accounts of their customers that hold Class A shares. Any unreimbursed expenses the Distributor incurs with respect to Class A shares in any fiscal year cannot be recovered in subsequent periods. Fees incurred by the Fund under the Plan are detailed in the Statement of Operations.
Distribution and Service Plans for Class B, Class C and Class R Shares. The Fund has adopted Distribution and Service Plans (the “Plans”) for Class B, Class C and Class R shares pursuant to Rule 12b-1 under the 1940 Act to compensate the Distributor for distributing those share classes, maintaining accounts and providing shareholder services. Under the Plans, the Fund pays the Distributor an annual asset-based sales charge of 0.75% on Class B and Class C shares’ daily net assets and 0.25% on Class R shares’ daily net assets. The Fund also pays a service fee under the Plans at an annual rate of 0.25% of daily net assets. The Plans continue in effect from year to year only if the Fund’s Board of Trustees votes annually to approve their continuance at an in person meeting called for that purpose. Fees incurred by the Fund under the Plans are detailed in the Statement of Operations.
|
| 45 OPPENHEIMER GLOBAL FUND |
NOTES TO FINANCIAL STATEMENTS Continued
8. Fees and Other Transactions with Affiliates (Continued)
Sales Charges. Front-end sales charges and CDSC do not represent expenses of the Fund. They are deducted from the proceeds of sales of Fund shares prior to investment or from redemption proceeds prior to remittance, as applicable. The sales charges retained by the Distributor from the sale of shares and the CDSC retained by the Distributor on the redemption of shares is shown in the following table for the period indicated.
| | | | | | | | | | | | | | | | | | | | |
| | | | | | Class A | | | Class B | | | Class C | | | Class R | |
| | | Class A | | | Contingent | | | Contingent | | | Contingent | | | Contingent | |
| | | Front-End | | | Deferred | | | Deferred | | | Deferred | | | Deferred | |
| | | Sales Charges | | | Sales Charges | | | Sales Charges | | | Sales Charges | | | Sales Charges | |
| | | Retained by | | | Retained by | | | Retained by | | | Retained by | | | Retained by | |
| Year Ended | | Distributor | | | Distributor | | | Distributor | | | Distributor | | | Distributor | |
September 30, 2016 | | | $671,276 | | | | $13,610 | | | | $40,811 | | | | $50,971 | | | | $— | |
Waivers and Reimbursements of Expenses. The Manager will waive fees and/or reimburse Fund expenses in an amount equal to the indirect management fees incurred through the Fund’s investment in IGMMF. During the reporting period, the Manager waived fees and/or reimbursed the Fund $54,958 for IGMMF management fees.
Waivers and/or reimbursements may be modified or terminated as set forth according to the terms in the prospectus.
9. Borrowings and Other Financing
Joint Credit Facility. A number of mutual funds managed by the Manager participate in a $1.3 billion revolving credit facility (the “Facility”) intended to provide short-term financing, if necessary, subject to certain restrictions in connection with atypical redemption activity. Expenses and fees related to the Facility are paid by the participating funds and are disclosed separately or as other expenses on the Statement of Operations. The Fund did not utilize the Facility during the reporting period.
10. Prior Period Reclassification
An adjustment to reflect a prior period reclassification between net investment income and net change in unrealized appreciation (depreciation) on investments and/or net realized gain (loss) on investments during the years ending September 30, 2013, 2014 and 2015 has been made to properly reflect income distributions received by the Fund from two of its investments.
The following adjustments are reflected in the respective fiscal years in the Statements of Changes in Net Assets and the Financial Highlights:
| | | | | | | | | | | | | | | | | | | | |
| | | 2013 | | | | | | 2014 | | | | | | 2015 | |
Net investment income (loss) | | $ | 3,724,100 | | | | | | | $ | 5,397,233 | | | | | | | $ | 6,584,912 | |
Net realized gain (loss) | | | — | | | | | | | | (1,416,825) | | | | | | | | — | |
Net change in unrealized appreciation/depreciation | | | (3,724,100) | | | | | | | | (3,980,408) | | | | | | | | (6,584,912) | |
|
| 46 OPPENHEIMER GLOBAL FUND |
10. Prior Period Reclassification (Continued)
The cumulative impact of these adjustments also are reflected in the respective component of net assets on the Statement of Assets and liabilities and had no impact on total net assets or net asset values per share of the Fund.
11. Pending Litigation
In 2009, several putative class action lawsuits were filed and later consolidated before the U.S. District Court for the District of Colorado against OppenheimerFunds, Inc. (“OFI”), OppenheimerFunds Distributor, Inc. (“OFDI”), and Oppenheimer Rochester California Municipal Fund, a fund advised by OFI Global Asset Management, Inc. and distributed by the Distributor (the “California Fund”), in connection with the California Fund’s investment performance. The plaintiffs asserted claims against OFI, OFDI and certain present and former trustees and officers of the California Fund under the federal securities laws, alleging, among other things, that the disclosure documents of the California Fund contained misrepresentations and omissions and the investment policies of the California Fund were not followed. Plaintiffs in the suit filed an amended complaint and defendants filed a motion to dismiss. In 2011, the court issued an order which granted in part and denied in part the defendants’ motion to dismiss. In 2012, plaintiffs filed a motion, which defendants opposed, to certify a class and appoint class representatives and class counsel. In March 2015, the court granted plaintiffs’ motion for class certification. In May 2015, the U.S. Court of Appeals for the Tenth Circuit vacated the class certification order and remanded the matter to the district court for further proceedings. In October 2015, the district court reaffirmed its order and determined that the suit will proceed as a class action. In December 2015, the Tenth Circuit denied defendants’ petition to appeal the district court’s reaffirmed class certification order.
OFI and OFDI believe the suit is without merit; that it is premature to render any opinion as to the likelihood of an outcome unfavorable to them in the suit; and that no estimate can yet be made as to the amount or range of any potential loss. Furthermore, OFI believes that the suit should not impair the ability of OFI or OFDI to perform their respective duties to the Fund and that the outcome of the suit should not have any material effect on the operations of any of the Oppenheimer funds.
|
| 47 OPPENHEIMER GLOBAL FUND |
REPORT OF INDEPENDENT REGISTERED PUBLIC ACCOUNTING FIRM
The Board of Trustees and Shareholders of Oppenheimer Global Fund:
We have audited the accompanying statement of assets and liabilities of Oppenheimer Global Fund, including the statement of investments, as of September 30, 2016, and the related statement of operations for the year then ended, the statements of changes in net assets for each of the years in the two-year period then ended, and the financial highlights for each of the years or periods in the five-year period then ended. These financial statements and financial highlights are the responsibility of the Fund’s management. Our responsibility is to express an opinion on these financial statements and financial highlights based on our audits.
We conducted our audits in accordance with the standards of the Public Company Accounting Oversight Board (United States). Those standards require that we plan and perform the audit to obtain reasonable assurance about whether the financial statements and financial highlights are free of material misstatement. An audit includes examining, on a test basis, evidence supporting the amounts and disclosures in the financial statements. Our procedures included confirmation of securities owned as of September 30, 2016, by correspondence with the custodian, transfer agent and brokers, or by other appropriate auditing procedures where replies from brokers were not received. An audit also includes assessing the accounting principles used and significant estimates made by management, as well as evaluating the overall financial statement presentation. We believe that our audits provide a reasonable basis for our opinion.
In our opinion, the financial statements and financial highlights referred to above present fairly, in all material respects, the financial position of Oppenheimer Global Fund as of September 30, 2016, the results of its operations for the year then ended, the changes in its net assets for each of the years in the two-year period then ended, and the financial highlights for each of the years or periods in the five-year period then ended, in conformity with U.S. generally accepted accounting principles.
KPMGLLP
Denver, Colorado
November 28, 2016
|
| 48 OPPENHEIMER GLOBAL FUND |
FEDERAL INCOME TAX INFORMATION Unaudited
In early 2016, if applicable, shareholders of record received information regarding all dividends and distributions paid to them by the Fund during calendar year 2015.
Capital gain distributions of $3.31246 per share were paid to Class A, Class B, Class C, Class I, Class R and Class Y shareholders, respectively, on December 7, 2015. Whether received in stock or in cash, the capital gain distribution should be treated by shareholders as a gain from the sale of the capital assets held for more than one year (long-term capital gains).
Dividends, if any, paid by the Fund during the reporting period which are not designated as capital gain distributions should be multiplied by the maximum amount allowable but not less than 66.98% to arrive at the amount eligible for the corporate dividend-received deduction.
A portion, if any, of the dividends paid by the Fund during the reporting period which are not designated as capital gain distributions are eligible for lower individual income tax rates to the extent that the Fund has received qualified dividend income as stipulated by recent tax legislation. The maximum amount allowable but not less than $170,913,420 of the Fund’s fiscal year taxable income may be eligible for the lower individual income tax rates. In early 2016, shareholders of record received information regarding the percentage of distributions that are eligible for lower individual income tax rates.
Recent tax legislation allows a regulated investment company to designate distributions not designated as capital gain distributions, as either interest related dividends or short-term capital gain dividends, both of which are exempt from the U.S. withholding tax applicable to non U.S. taxpayers. For the reporting period, the maximum amount allowable but not less than $63,193 of the ordinary distributions to be paid by the Fund qualifies as an interest related dividend to be paid by the Fund qualifies as a short-term capital gain dividend.
The Fund has elected the application of Section 853 of the Internal Revenue Code to permit shareholders to take a federal income tax credit or deduction, at their option, on a per share basis. The maximum amount allowable but not less than $12,478,949 of foreign income taxes were paid by the Fund during the reporting period. A separate notice will be mailed to each shareholder, which will reflect the proportionate share of such foreign taxes which must be treated by shareholders as gross income for federal income tax purposes.
Gross income of the maximum amount allowable but not less than $57,320,310 was derived from sources within foreign countries or possessions of the United States.
The foregoing information is presented to assist shareholders in reporting distributions received from the Fund to the Internal Revenue Service. Because of the complexity of the federal regulations which may affect your individual tax return and the many variations in state and local tax regulations, we recommend that you consult your tax advisor for specific guidance.
|
| 49 OPPENHEIMER GLOBAL FUND |
BOARD APPROVAL OF THE FUND’S INVESTMENT ADVISORY
AND SUB-ADVISORY AGREEMENTS Unaudited
The Fund has entered into an investment advisory agreement with OFI Global Asset Management, Inc. (“OFI Global” or the “Adviser”), a wholly-owned subsidiary of OppenheimerFunds, Inc. (“OFI” or the “Sub-Adviser”) (“OFI Global” and “OFI” together the “Managers”) and OFI Global has entered into a sub-advisory agreement with OFI whereby OFI provides investment sub-advisory services to the Fund (collectively, the “Agreements”). Each year, the Board of Trustees (the “Board”), including a majority of the independent Trustees, is required to determine whether to approve the terms of the Agreements and the renewal thereof. The Investment Company Act of 1940, as amended, requires that the Board request and evaluate, and that the Managers provide, such information as may be reasonably necessary to evaluate the terms of the Agreements. The Board employs an independent consultant to prepare a report that provides information, including comparative information that the Board requests for that purpose. In addition to in-person meetings focused on this evaluation, the Board receives information throughout the year regarding Fund services, fees, expenses and performance.
The Managers and the independent consultant provided information to the Board on the following factors: (i) the nature, quality and extent of the Managers’ services, (ii) the comparative investment performance of the Fund and the Managers, (iii) the fees and expenses of the Fund, including comparative fee and expense information, (iv) the profitability of the Managers and their affiliates, including an analysis of the cost of providing services, (v) whether economies of scale are realized as the Fund grows and whether fee levels reflect these economies of scale for Fund investors and (vi) other benefits to the Managers from their relationship with the Fund. The Board was aware that there are alternatives to retaining the Managers.
Outlined below is a summary of the principal information considered by the Board as well as the Board’s conclusions.
Nature, Quality and Extent of Services. The Board considered information about the nature, quality and extent of the services provided to the Fund and information regarding the Managers’ key personnel who provide such services. The Managers’ duties include providing the Fund with the services of the portfolio manager and the Sub-Adviser’s investment team, who provide research, analysis and other advisory services in regard to the Fund’s investments; and securities trading services. OFI Global is responsible for oversight of third-party service providers; monitoring compliance with applicable Fund policies and procedures and adherence to the Fund’s investment restrictions; risk management; and oversight of the Sub-Adviser. OFI Global is also responsible for providing certain administrative services to the Fund. Those services include providing and supervising all administrative and clerical personnel who are necessary in order to provide effective corporate administration for the Fund; compiling and maintaining records with respect to the Fund’s operations; preparing and filing reports required by the U.S. Securities and Exchange Commission; preparing periodic reports regarding the operations of the Fund for its shareholders; preparing proxy materials for shareholder meetings; and preparing the registration statements required by federal and state securities laws for the sale of the Fund’s shares. OFI Global also provides the Fund with office space, facilities and equipment.
|
| 50 OPPENHEIMER GLOBAL FUND |
The Board also considered the quality of the services provided and the quality of the Managers’ resources that are available to the Fund. The Board took account of the fact that the Sub-Adviser has over fifty years of experience as an investment adviser and that its assets under management rank it among the top mutual fund managers in the United States. The Board evaluated the Managers’ advisory, administrative, accounting, legal, compliance and risk management services, and information the Board has received regarding the experience and professional qualifications of the Managers’ key personnel and the size and functions of its staff. In its evaluation of the quality of the portfolio management services provided, the Board considered the experience of Rajeev Bhaman, the portfolio manager for the Fund, and the Sub-Adviser’s investment team and analysts. The Board members also considered the totality of their experiences with the Managers as directors or trustees of the Fund and other funds advised by the Managers. The Board considered information regarding the quality of services provided by affiliates of the Managers, which the Board members have become knowledgeable about through their experiences with the Managers and in connection with the renewal of the Fund’s service agreements. The Board concluded, in light of the Managers’ experience, reputation, personnel, operations and resources that the Fund benefits from the services provided under the Agreements.
Investment Performance of the Managers and the Fund. Throughout the year, the Managers provided information on the investment performance of the Fund, the Adviser and the Sub-Adviser, including comparative performance information. The Board also reviewed information, prepared by the Managers and by the independent consultant, comparing the Fund’s historical performance to relevant benchmarks or market indices and to the performance of other retail funds in the world stock category. The Board noted that the Fund’s one-year, three-year, five-year and ten-year performance was better than its category median.
Fees and Expenses of the Fund. The Board reviewed the fees paid to the Adviser and the other expenses borne by the Fund. The Board also considered the comparability of the fees charged and the services provided to the Fund to the fees and services for other clients or accounts advised by the Adviser. The independent consultant provided comparative data in regard to the fees and expenses of the Fund and other retail front-end load world stock funds with comparable asset levels and distribution features. The Board noted that the Fund’s contractual management fees and total expenses were lower than its peer group median and category median.
Economies of Scale and Profits Realized by the Managers. The Board considered information regarding the Managers’ costs in serving as the Fund’s investment adviser and sub-adviser, including the costs associated with the personnel and systems necessary to manage the Fund, and information regarding the Managers’ profitability from their relationship with the Fund. The Board also considered that the Managers must be able to pay and retain experienced professional personnel at competitive rates to provide quality services to the Fund. The Board reviewed whether the Managers may realize economies of scale in managing and supporting the Fund. The Board noted that the Fund currently has management fee breakpoints, which are intended to share with Fund shareholders economies of scale that may exist as the Fund’s assets grow.
|
| 51 OPPENHEIMER GLOBAL FUND |
BOARD APPROVAL OF THE FUND’S INVESTMENT ADVISORY
AND SUB-ADVISORY AGREEMENTS Unaudited / Continued
Other Benefits to the Managers. In addition to considering the profits realized by the Managers, the Board considered information that was provided regarding the direct and indirect benefits the Managers receive as a result of their relationship with the Fund, including compensation paid to the Managers’ affiliates and research provided to the Adviser in connection with permissible brokerage arrangements (soft dollar arrangements).
Conclusions. These factors were also considered by the independent Trustees meeting separately from the full Board, assisted by experienced counsel to the Fund and to the independent Trustees. Fund counsel and the independent Trustees’ counsel are independent of the Managers within the meaning and intent of the Securities and Exchange Commission Rules.
Based on its review of the information it received and its evaluations described above, the Board, including a majority of the independent Trustees, decided to continue the Agreements through September 30, 2017. In arriving at its decision, the Board did not identify any factor or factors as being more important than others, but considered all of the above information, and considered the terms and conditions of the Agreements, including the management fees, in light of all the surrounding circumstances.
|
| 52 OPPENHEIMER GLOBAL FUND |
PORTFOLIO PROXY VOTING POLICIES AND GUIDELINES;
UPDATES TO STATEMENTS OF INVESTMENTS Unaudited
The Fund has adopted Portfolio Proxy Voting Policies and Guidelines under which the Fund votes proxies relating to securities (“portfolio proxies”) held by the Fund. A description of the Fund’s Portfolio Proxy Voting Policies and Guidelines is available (i) without charge, upon request, by calling the Fund toll-free at 1.800.CALL OPP (225.5677), (ii) on the Fund’s website at www.oppenheimerfunds.com, and (iii) on the SEC’s website at www.sec.gov. In addition, the Fund is required to file Form N-PX, with its complete proxy voting record for the 12 months ended June 30th, no later than August 31st of each year. The Fund’s voting record is available (i) without charge, upon request, by calling the Fund toll-free at 1.800.CALL OPP (225.5677), and (ii) in the Form N-PX filing on the SEC’s website at www.sec.gov.
The Fund files its complete schedule of portfolio holdings with the SEC for the first quarter and the third quarter of each fiscal year on Form N-Q. The Fund’s Form N-Q filings are available on the SEC’s website at www.sec.gov. Those forms may be reviewed and copied at the SEC’s Public Reference Room in Washington, D.C. Information on the operation of the Public Reference Room may be obtained by calling 1-800-SEC-0330.
Householding—Delivery of Shareholder Documents
This is to inform you about OppenheimerFunds’ “householding” policy. If more than one member of your household maintains an account in a particular fund, OppenheimerFunds will mail only one copy of the fund’s prospectus (or, if available, the fund’s summary prospectus), annual and semiannual report and privacy policy. The consolidation of these mailings, called householding, benefits your fund through reduced mailing expense, and benefits you by reducing the volume of mail you receive from OppenheimerFunds. Householding does not affect the delivery of your account statements.
Please note that we will continue to household these mailings for as long as you remain an OppenheimerFunds shareholder, unless you request otherwise. If you prefer to receive multiple copies of these materials, please call us at 1.800.CALL-OPP (225-5677). You may also notify us in writing or via email. We will begin sending you individual copies of the prospectus (or, if available, the summary prospectus), reports and privacy policy within 30 days of receiving your request to stop householding.
|
| 53 OPPENHEIMER GLOBAL FUND |
TRUSTEES AND OFFICERS Unaudited
| | |
| Name, Position(s) Held with the Fund, Length of Service, Year of Birth | | Principal Occupation(s) During the Past 5 Years; Other Trusteeships/ Directorships Held; Number of Portfolios in the Fund Complex Currently Overseen |
| |
| INDEPENDENT TRUSTEES | | The address of each Trustee in the chart below is 6803 S. Tucson Way, Centennial, Colorado 80112-3924. Each Trustee serves for an indefinite term, or until his or her resignation, retirement, death or removal. |
| |
Brian F. Wruble, Chairman of the Board of Trustees (since 2007), Trustee (since 2005) Year of Birth: 1943 | | Governor and Vice Chairman of Community Foundation of the Florida Keys (non-profit) (since July 2012); Trustee of the Board of Trustees, The Jackson Laboratory (non-profit) (1991-2011 and since May 2014); Chairman Emeritus (since August 2011) of The Jackson Laboratory (non-profit); Member of Zurich Insurance Group’s Investment Management Advisory Council (insurance) (since 2004); Treasurer (since 2007) and Trustee of the Institute for Advanced Study (non-profit educational institute) (since May 1992); Director of Special Value Opportunities Fund, LLC (registered investment company) (affiliate of the Sub-Adviser’s parent company) (September 2004-June 2015); General Partner of Odyssey Partners, L.P. (hedge fund) (September 1995-December 2007); Special Limited Partner of Odyssey Investment Partners, LLC (private equity investment) (January 1999-September 2004). Oversees 55 portfolios in the OppenheimerFunds complex. Mr. Wruble has served on the Boards of certain Oppenheimer funds since April 2001, during which time he has become familiar with the Fund’s (and other Oppenheimer funds’) financial, accounting, regulatory and investment matters and has contributed to the Boards’ deliberations. |
| |
Beth Ann Brown, Trustee (since 2016) Year of Birth: 1968 | | Advisor, Board of Advisors of Caron Engineering Inc. (since December 2014); Independent Consultant (since September 2012); held the following positions at Columbia Management Investment Advisers LLC: Head of Intermediary Distribution (2008-2012), Managing Director, Strategic Relations (2005-2008), Managing Director, Head of National Accounts (2004-2005); Senior Vice President, National Account Manager (2002-2004), Senior Vice President, Key Account Manager (1999-2002) and Vice President, Key Account Manager (1996-1999) of Liberty Funds Distributor, Inc.; President and Director, of Acton Shapleigh Youth Conservation Corps (non-profit) (since 2012); and Vice President and Director of Grahamtastic Connection (non-profit) (since May 2013). Ms. Brown has served on the Boards of certain Oppenheimer funds since January 2016, during which time she has become familiar with the Fund’s (and other Oppenheimer funds’) financial, accounting, regulatory and investment matters and has contributed to the Boards’ deliberations. |
| |
Matthew P. Fink, Trustee (since 2005) Year of Birth: 1941 | | Trustee of the Committee for Economic Development (policy research foundation) (2005-2011); Director of ICI Education Foundation (education foundation) (October 1991-August 2006); President of the Investment Company Institute (trade association) (October 1991-June 2004); Director of ICI Mutual Insurance Company (insurance company) (October 1991-June 2004); Author of The Rise of Mutual Funds: An Insider’s View published by Oxford University Press (second edition 2011). Oversees 55 portfolios in the OppenheimerFunds complex. Mr. Fink has served on the Boards of certain Oppenheimer funds since January 2005, during which time he has become familiar with the Fund’s (and other Oppenheimer funds’) financial, accounting, regulatory and investment matters and has contributed to the Boards’ deliberations. |
|
| 54 OPPENHEIMER GLOBAL FUND |
| | |
| |
Edmund P. Giambastiani, Jr., Trustee (since 2013) Year of Birth: 1948 | | Advisory Board Member of the Maxwell School of Citizenship and Public Affairs of Syracuse University (since April 2012); Director of Mercury Defense Systems Inc. (information technology) (August 2011-February 2013); Trustee of the U.S. Naval Academy Foundation (since November 2010); Advisory Board Member of the Massachusetts Institute of Technology Lincoln Laboratory (federally-funded research development center) (since May 2010); Director of The Boeing Company (aerospace and defense) (since October 2009); Trustee of MITRE Corporation (federally-funded research development center) (since September 2008); Independent Director of QinetiQ Group Plc (defense technology and security) (February 2008-August 2011); Chairman of Monster Worldwide, Inc. (on-line career services) (since March 2015), Lead Director (June 2011-March 2015); Chairman of Alenia North America, Inc. (military and defense products) (January 2008-October 2009); Director of SRA International, Inc. (information technology and services) (January 2008-July 2011); President of Giambastiani Group LLC (national security and energy consulting) (since October 2007); United States Navy, career nuclear submarine officer (June 1970-October 2007), Vice Chairman of the Joint Chiefs of Staff (2005-October 2007), Supreme Allied Commander of NATO Commander Transformation (2003-2005), Commander, U.S. Joint Forces Command (2002-2005). Since his retirement from the U.S. Navy in October 2007, Admiral Giambastiani has also served on numerous U.S. Government advisory boards, investigations and task forces for the Secretaries of Defense, State and Interior and the Central Intelligence Agency. He currently serves as a federal commissioner on the Military Compensation and Retirement Modernization Commission. Oversees 55 portfolios in the OppenheimerFunds complex. Admiral Giambastiani has served on the Boards of certain Oppenheimer funds since February 2013, including as an Advisory Board Member for certain Oppenheimer funds, during which time he has become familiar with the Fund’s (and other Oppenheimer funds’) financial, accounting, regulatory and investment matters and has contributed to the Boards’ deliberations. For purposes of this report, Admiral Giambastiani is identified as a Trustee. |
| |
Elizabeth Krentzman, Trustee (since 2014) Year of Birth: 1959 | | Advisory Board Member of the University of Florida Law Center Association (since 2016) and the Securities and Exchange Commission Historical Society (since 2007); held the following positions at Deloitte & Touche LLP: Principal and Chief Regulatory Advisor for Asset Management Services (2007-2014) and U.S. Mutual Fund Leader (2011-2014); General Counsel of the Investment Company Institute (trade association) (June 2004-April 2007); held the following positions at Deloitte & Touche LLP: National Director of the Investment Management Regulatory Consulting Practice (1997-2004), Principal (2003-2004), Director (1998-2003) and Senior Manager (1997-1998); Assistant Director of the Division of Investment Management – Office of Disclosure and Investment Adviser Regulation (1996- 1997) and various positions with the Division of Investment Management – Office of Regulatory Policy (1991-1996) of the U.S. Securities and Exchange Commission; Associate at Ropes & Gray (1987-1991). Oversees 55 portfolios in the OppenheimerFunds complex. Ms. Krentzman has served on the Boards of certain Oppenheimer funds since August 2014, during which time she has become familiar with the Fund’s (and other Oppenheimer funds’) financial, accounting, regulatory and investment matters and has contributed to the Boards’ deliberations. |
|
| 55 OPPENHEIMER GLOBAL FUND |
TRUSTEES AND OFFICERS Unaudited / Continued
| | |
| |
Mary F. Miller, Trustee (since 2004) Year of Birth: 1942 | | Trustee of International House (not-for-profit) (since June 2007); Trustee of the American Symphony Orchestra (not-for-profit) (October 1998-November 2011); and Senior Vice President and General Auditor of American Express Company (financial services company) (July 1998-February 2003). Oversees 55 portfolios in the OppenheimerFunds complex. Ms. Miller has served on the Boards of certain Oppenheimer funds since August 2004, during which time she has become familiar with the Fund’s (and other Oppenheimer funds’) financial, accounting, regulatory and investment matters and has contributed to the Boards’ deliberations. |
| |
Joel W. Motley, Trustee (since 2002) Year of Birth: 1952 | | Director of Greenwall Foundation (since October 2013); Member of Board and Investment Committee of The Greenwall Foundation (since April 2013); Member of the Vestry of Trinity Wall Street (since April 2012); Director of Southern Africa Legal Services Foundation (since March 2012); Board Member of Pulitzer Center for Crisis Reporting (non-profit journalism) (since March 2011); Managing Director of Public Capital Advisors, LLC (privately-held financial advisor) (since January 2006); Managing Director of Carmona Motley, Inc. (privately-held financial advisor) (since January 2002); Director of Columbia Equity Financial Corp. (privately-held financial advisor) (2002-2007); Managing Director of Carmona Motley Hoffman Inc. (privately-held financial advisor) (January 1998-December 2001); Member of the Finance and Budget Committee of the Council on Foreign Relations, Member of the Investment Committee and Board of Human Rights Watch (since July 2000) and Member of the Investment Committee and Board of Historic Hudson Valley (since February 2010). Oversees 55 portfolios in the OppenheimerFunds complex. Mr. Motley has served on the Boards of certain Oppenheimer funds since October 2002, during which time he has become familiar with the Fund’s (and other Oppenheimer funds’) financial, accounting, regulatory and investment matters and has contributed to the Boards’ deliberations. |
| |
Joanne Pace, Trustee (since 2012) Year of Birth: 1958 | | Advisory Board Director of Massey Quick and Company, LLC (since October 2014); Board Director of Horizon Blue Cross Blue Shield of New Jersey (since November 2012); Advisory Board Director of The Alberleen Group LLC (since March, 2012); Board Member (since January 2015), Advisory Council Member (December 2012-December 2014) of 100 Women in Hedge Funds (non-profit) (since December, 2012); Advisory Council Member of Morgan Stanley Children’s Hospital (non-profit) (since May, 2012); Board Director of The Komera Project (non-profit) (since April, 2012); New York Advisory Board Director of Peace First (non-profit) (2010-2015); Senior Advisor of SECOR Asset Management, LP (2010-2011); Managing Director and Chief Operating Officer of Morgan Stanley Investment Management (2006-2010); Partner and Chief Operating Officer of FrontPoint Partners, LLC (hedge fund) (2005-2006); held the following positions at Credit Suisse: Managing Director (2003-2005); Global Head of Human Resources and member of Executive Board and Operating Committee (2004-2005), Global Head of Operations and Product Control (2003-2004); held the following positions |
|
| 56 OPPENHEIMER GLOBAL FUND |
| | |
| |
Joanne Pace, Continued | | at Morgan Stanley: Managing Director (1997-2003), Controller and Principal Accounting Officer (1999-2003); Chief Financial Officer (temporary assignment) for the Oversight Committee, Long Term Capital Management (1998-1999). Lead Independent Director and Chair of the Audit and Nominating Committee of The Global Chartist Fund, LLC of Oppenheimer Asset Management (2011-2012); Board Director of Managed Funds Association (2008-2010); Board Director of Morgan Stanley Foundation (2007-2010) and Investment Committee Chair (2008-2010). Oversees 55 portfolios in the OppenheimerFunds complex. Ms. Pace has served on the Boards of certain Oppenheimer funds since November 2012, including as an Advisory Board Member for certain Oppenheimer funds, during which time she has become familiar with the Fund’s (and other Oppenheimer funds’) financial, accounting, regulatory and investment matters and has contributed to the Board’s deliberations. For purposes of this report, Ms. Pace is identified as a Trustee. |
| |
Daniel Vandivort, Trustee (since 2014) Year of Birth: 1954 | | Chairman and Lead Independent Director/Trustee (March 2010-September 2014), Chairman of the Audit Committee (March 2009-September 2014) and Director/ Trustee (December 2008-September 2014) of the Board of Directors/Trustees of Value Line Funds; Trustee, Board of Trustees of Huntington Disease Foundation of America (since January 2015 and June 2007-December 2013): Trustee, Board of Trustees, RIM Retirement Savings Plan (2005-2007); President and Chief Investment Officer, Robeco Investment Management, formerly known as Weiss Peck and Greer (January 2005-June 2007); Member, Management Committee of Robeco Investment Management (2001-2007); Chairman and Trustee of the Board of Trustees of Weiss, Peck and Greer Funds (2004-2005); Managing Director and Head of Fixed Income, Weiss, Peck and Greer (November 1994-January 2005); Managing Director and Head of Fixed Income, CS First Boston Investment Management (January 1992-November 1994); Director, Global Product Development, First Boston Asset Management (November 1989 to January 1992); Vice President, Fixed Income Sales, First Boston Corp. (May 1984-November 1989). Oversees 55 portfolios in the OppenheimerFunds complex. Mr. Vandivort has served on the Boards of certain Oppenheimer funds since 2014, during which time he has become familiar with the Fund’s (and other Oppenheimer funds’) financial, accounting, regulatory and investment matters and has contributed to the Boards’ deliberations. |
| | |
| INTERESTED TRUSTEE AND OFFICER | | Mr. Steinmetz is an “Interested Trustee” because he is affiliated with the Manager and the Sub-Adviser by virtue of his positions as Chairman of the Sub-Adviser and officer and director of the Manager. Both as a Trustee and as an officer, Mr. Steinmetz serves for an indefinite term, or until his resignation, retirement, death or removal. Mr. Steinmetz’s address is 225 Liberty Street, New York, New York 10281-1008. |
| |
Arthur P. Steinmetz, Trustee (since 2015), President and Principal Executive Officer (since 2014) Year of Birth: 1958 | | Chairman of the Sub-Adviser (since January 2015); CEO and Chairman of the Manager (since July 2014), President of the Manager (since May 2013), a Director of the Manager (since January 2013), Director of the Sub-Adviser (since July 2014), President, Management Director and CEO of Oppenheimer Acquisition Corp. (the Sub-Adviser’s parent holding company) (since July 2014), and President and Director of OFI SteelPath, Inc. (since January 2013). Chief Investment Officer of the OppenheimerFunds advisory entities from (January 2013-December 2013); Executive Vice President of the Manager (January 2013-May 2013); Chief Investment Officer of the Sub-Adviser (October 2010-December 2012); Chief Investment Officer, Fixed-Income, of the Sub-Adviser (April 2009-October 2010); Executive Vice President of the Sub-Adviser (October 2009-December 2012); Director of Fixed Income of the Sub-Adviser (January 2009-April 2009); and a Senior Vice President of the Sub-Adviser (March 1993-September 2009). An officer of 100 portfolios in the OppenheimerFunds complex. |
|
| 57 OPPENHEIMER GLOBAL FUND |
TRUSTEES AND OFFICERS Unaudited / Continued
| | |
| | |
| OTHER OFFICERS OF THE FUND | | The addresses of the Officers in the chart below are as follows: for Mr.Bhaman, Mss. Lo Bessette, Foxson and Picciotto, 225 Liberty Street, New York, New York 10281-1008, for Mr. Petersen, 6803 S. Tucson Way, Centennial, Colorado 80112-3924. Each Officer serves for an indefinite term or until his or her resignation, retirement, death or removal. |
| |
Rajeev Bhaman, Vice President (since 2004) Year of Birth: 1963 | | Director of Global Equities of the Sub-Adviser (since January 2013); Senior Vice President of the Sub-Adviser (since May 2006); Vice President of the Sub-Adviser (January 1997-May 2006). An officer of other portfolios in the OppenheimerFunds complex. |
| |
Cynthia Lo Bessette, Secretary and Chief Legal Officer (since 2016) Year of Birth: 1969 | | Senior Vice President and Deputy General Counsel (March 2015-February 2016) and Executive Vice President, General Counsel and Secretary of the Manager (since February 2016); Chief Legal Officer of the Sub-Adviser and the Distributor (since February 2016); Vice President, General Counsel and Secretary of Oppenheimer Acquisition Corp. (since February 2016); General Counsel of OFI SteelPath, Inc., VTL Associates, LLC and Index Management Solutions, LLC (since February 2016); Chief Legal Officer of OFI Global Institutional, Inc., HarbourView Asset Management Corporation, OFI Global Trust Company, Oppenheimer Real Asset Management, Inc., OFI Private Investments Inc., Shareholder Services, Inc. and Trinity Investment Management Corporation (since February 2016); Vice President, Corporate Counsel (February 2012-March 2015) and Deputy Chief Legal Officer (April 2013-March 2015) of Jennison Associates LLC; Assistant General Counsel (April 2008-September 2009) and Deputy General Counsel (October 2009-February 2012) of Lord Abbett & Co. LLC. An officer of 100 portfolios in the OppenheimerFunds complex. |
| |
Jennifer Foxson, Vice President and Chief Business Officer (since 2014) Year of Birth: 1969 | | Senior Vice President of OppenheimerFunds Distributor, Inc. (since June 2014); Vice President of OppenheimerFunds Distributor, Inc. (April 2006-June 2014); Vice President of the Sub-Adviser (January 1998-March 2006); Assistant Vice President of the Sub-Adviser (October 1991-December 1998). An officer of 100 portfolios in the OppenheimerFunds complex. |
| |
Mary Ann Picciotto, Chief Compliance Officer and Chief Anti-Money Laundering Officer (since 2014) Year of Birth: 1973 | | Senior Vice President and Chief Compliance Officer of the Manager (since March 2014); Chief Compliance Officer of the Sub-Adviser, OFI SteelPath, Inc., OFI Global Trust Company, OFI Global Institutional, Inc., Oppenheimer Real Asset Management, Inc., OFI Private Investments, Inc., Harborview Asset Management Corporation, Trinity Investment Management Corporation, and Shareholder Services, Inc. (since March 2014); Managing Director of Morgan Stanley Investment Management Inc. and certain of its various affiliated entities; Chief Compliance Officer of various Morgan Stanley Funds (May 2010-January 2014); Chief Compliance Officer of Morgan Stanley Investment Management Inc. (April 2007-January 2014). An officer of 100 portfolios in the OppenheimerFunds complex. |
| |
Brian S. Petersen, Treasurer and Principal Financial & Accounting Officer (since 2016) Year of Birth: 1970 | | Vice President of the Manager (since January 2013); Vice President of the Sub-Adviser (February 2007-December 2012); Assistant Vice President of the Sub- Adviser (August 2002-2007). An officer of 100 portfolios in the OppenheimerFunds complex. |
The Fund’s Statement of Additional Information contains additional information about the Fund’s Trustees and Officers and is available without charge upon request by calling 1.800.CALL OPP (225.5677).
|
| 58 OPPENHEIMER GLOBAL FUND |
OPPENHEIMER GLOBAL FUND
| | |
| Manager | | OFI Global Asset Management, Inc. |
| |
| Sub-Adviser | | OppenheimerFunds, Inc. |
| |
| Distributor | | OppenheimerFunds Distributor, Inc. |
| |
| Transfer and Shareholder Servicing Agent | | OFI Global Asset Management, Inc. |
| |
| Sub-Transfer Agent | | Shareholder Services, Inc. |
| | DBA OppenheimerFunds Services |
| |
| Independent Registered Public Accounting Firm | | KPMG LLP |
| |
| Legal Counsel | | Kramer Levin Naftalis & Frankel LLP |
© 2016 OppenheimerFunds, Inc. All rights reserved.
|
| 59 OPPENHEIMER GLOBAL FUND |
PRIVACY POLICY NOTICE
As an Oppenheimer fund shareholder, you are entitled to know how we protect your personal information and how we limit its disclosure.
Information Sources
We obtain nonpublic personal information about our shareholders from the following sources:
| ● | | Applications or other forms |
| ● | | When you create a user ID and password for online account access |
| ● | | When you enroll in eDocs Direct, our electronic document delivery service |
| ● | | Your transactions with us, our affiliates or others |
| ● | | A software program on our website, often referred to as a “cookie,” which indicates which parts of our site you’ve visited |
| ● | | When you set up challenge questions to reset your password online |
If you visit oppenheimerfunds.com and do not log on to the secure account information areas, we do not obtain any personal information about you. When you do log on to a secure area, we do obtain your user ID and password to identify you. We also use this information to provide you with products and services you have requested, to inform you about products and services that you may be interested in and assist you in other ways.
We do not collect personal information through our website unless you willingly provide it to us, either directly by email or in those areas of the website that request information. In order to update your personal information (including your mailing address, email address and phone number) you must first log on and visit your user profile.
If you have set your browser to warn you before accepting cookies, you will receive the warning message with each cookie. You can refuse cookies by turning them off in your browser. However, doing so may limit your access to certain sections of our website.
We use cookies to help us improve and manage our website. For example, cookies help us recognize new versus repeat visitors to the site, track the pages visited, and enable some special features on the website. This data helps us provide a better service for our website visitors.
Protection of Information
We do not disclose any non-public personal information (such as names on a customer list) about current or former customers to anyone, except as permitted by law.
Disclosure of Information
Copies of confirmations, account statements and other documents reporting activity in your fund accounts are made available to your financial advisor (as designated by you). We may also use details about you and your investments to help us, our financial service affiliates, or firms that jointly market their financial products and services with ours, to better serve your investment needs or suggest financial services or educational material that may be of interest to you. If this requires us to provide you with an opportunity to “opt in” or “opt out” of such information sharing with a firm not affiliated with us, you will receive notification on how to do so, before any such sharing takes place.
Right of Refusal
We will not disclose your personal information to unaffiliated third parties (except as permitted by law), unless we first offer you a reasonable opportunity to refuse or “opt out” of such disclosure.
|
| 60 OPPENHEIMER GLOBAL FUND |
Internet Security and Encryption
In general, the email services provided by our website are encrypted and provide a secure and private means of communication with us. To protect your own privacy, confidential and/or personal information should only be communicated via email when you are advised that you are using a secure website. As a security measure, we do not include personal or account information in non-secure emails, and we advise you not to send such information to us in non-secure emails. Instead, you may take advantage of the secure features of our website to encrypt your email correspondence. To do this, you will need to use a browser that supports Secure Sockets Layer (SSL) protocol.
We do not guarantee or warrant that any part of our website, including files available for download, are free of viruses or other harmful code. It is your responsibility to take appropriate precautions, such as use of an anti-virus software package, to protect your computer hardware and software.
| ● | | All transactions, including redemptions, exchanges and purchases, are secured by SSL and 256-bit encryption. SSL is used to establish a secure connection between your PC and OppenheimerFunds’ server. It transmits information in an encrypted and scrambled format. |
| ● | | Encryption is achieved through an electronic scrambling technology that uses a “key” to code and then decode the data. Encryption acts like the cable converter box you may have on your television set. It scrambles data with a secret code so that no one can make sense of it while it is being transmitted. When the data reaches its destination, the same software unscrambles the data. |
| ● | | You can exit the secure area by either closing your browser, or for added security, you can use the Log Out button before you close your browser. |
Other Security Measures
We maintain physical, electronic and procedural safeguards to protect your personal account information. Our employees and agents have access to that information only so that they may offer you products or provide services, for example, when responding to your account questions.
How You Can Help
You can also do your part to keep your account information private and to prevent unauthorized transactions. If you obtain a user ID and password for your account, do not allow it to be used by anyone else. Also, take special precautions when accessing your account on a computer used by others.
Who We Are
This joint notice describes the privacy policies of the Oppenheimer funds, OppenheimerFunds, Inc., each of its investment adviser subsidiaries, OppenheimerFunds Distributor, Inc. and OFI Global Trust Co. It applies to all Oppenheimer fund accounts you presently have, or may open in the future, using your Social Security number—whether or not you remain a shareholder of our funds. This notice was last updated March 2015. In the event it is updated or changed, we will post an updated notice on our website at oppenheimerfunds.com. If you have any questions about this privacy policy, write to us at P.O. Box 5270, Denver, CO 80217-5270, email us by clicking on the Contact Us section of our website at oppenheimerfunds.com or call us at 1.800.CALL OPP (225.5677).
|
| 61 OPPENHEIMER GLOBAL FUND |
THIS PAGE INTENTIONALLY LEFT BLANK.
|
| 62 OPPENHEIMER GLOBAL FUND |
THIS PAGE INTENTIONALLY LEFT BLANK.
|
| 63 OPPENHEIMER GLOBAL FUND |

Visit us at oppenheimerfunds.com for 24-hr access to account information and transactions or call us at 800.CALL OPP (800.225.5677) for 24-hr automated information and automated transactions. Representatives also available Mon–Fri 8am-8pm ET.
| | |
Visit Us oppenheimerfunds.com Call Us 800 225 5677 | | |
| |
Follow Us 
| | Oppenheimer funds are distributed by OppenheimerFunds Distributor, Inc. 225 Liberty Street, New York, NY 10281-1008 © 2016 OppenheimerFunds Distributor, Inc. All rights reserved. RA0330.001.0916 November 22, 2016 |
Item 2. Code of Ethics.
The registrant has adopted a code of ethics that applies to the registrant’s principal executive officer, principal financial officer, principal accounting officer or controller or persons performing similar functions.
Item 3. Audit Committee Financial Expert.
The Board of Trustees of the registrant has determined that Joanne Pace, the Board’s Audit Committee Chairwoman, is an audit committee financial expert and that Ms. Pace is “independent” for purposes of this Item 3.
Item 4. Principal Accountant Fees and Services.
The principal accountant for the audit of the registrant’s annual financial statements billed $38,600 in fiscal 2016 and $36,800 in fiscal 2015.
The principal accountant for the audit of the registrant’s annual financial statements billed $3,754 in fiscal 2016 and no such fees in fiscal 2015.
The principal accountant for the audit of the registrant’s annual financial statements billed $598,285 in fiscal 2016 and $185,479 in fiscal 2015 to the registrant’s investment adviser or any entity controlling, controlled by, or under common control with the adviser that provides ongoing services to the registrant.
Such services include: Internal control reviews, GIPS attestation procedures, system conversion testing, custody audits, and additional audit services
The principal accountant for the audit of the registrant’s annual financial statements billed $4,770 in fiscal 2016 and $13,755 in fiscal 2015.
The principal accountant for the audit of the registrant’s annual financial statements billed $45,432 in fiscal 2016 and $628,126 in fiscal 2015 to the registrant’s investment adviser or any entity controlling, controlled by, or under common control with the adviser that provides ongoing services to the registrant.
Such services include: tax compliance, tax planning and tax advice. Tax compliance generally involves preparation of original and amended tax returns, claims for a refund and tax payment-planning services. Tax planning and tax advice includes assistance with tax audits and appeals, tax advice related to mergers and acquisitions and requests for rulings or technical advice from taxing authorities.
The principal accountant for the audit of the registrant’s annual financial statements billed no such fees in fiscal 2016 and no such fees in fiscal 2015.
The principal accountant for the audit of the registrant’s annual financial statements billed no such fees in fiscal 2016 and no such fees in fiscal 2015 to the registrant’s investment adviser or any entity controlling, controlled by, or under common control with the adviser that provides ongoing services to the registrant.
Such fees would include the cost to the principal accountant of attending audit committee meetings and consultations regarding the registrant’s retirement plan with respect to its Trustees.
| (e) | (1) During its regularly scheduled periodic meetings, the registrant’s audit committee will pre-approve all audit, audit-related, tax and other services to be provided by the principal accountants of the registrant. |
The audit committee has delegated pre-approval authority to its Chairwoman for any subsequent new engagements that arise between regularly scheduled meeting dates provided that any fees such pre-approved are presented to the audit committee at its next regularly scheduled meeting.
Under applicable laws, pre-approval of non-audit services may be waived provided that: 1) the aggregate amount of all such services provided constitutes no more than five percent of the total amount of fees paid by the registrant to its principal accountant during the fiscal year in which services are provided 2) such services were not recognized by the registrant at the time of engagement as non-audit services and 3) such services are promptly brought to the attention of the audit committee of the registrant and approved prior to the completion of the audit.
(2) 0%
| (f) | Not applicable as less than 50%. |
| (g) | The principal accountant for the audit of the registrant’s annual financial statements billed $652,241 in fiscal 2016 and $827,360 in fiscal 2015 to the registrant and the registrant’s investment adviser or any entity controlling, controlled by, or under common control with the adviser that provides ongoing services to the registrant related to non-audit fees. Those billings did not include any prohibited non-audit services as defined by the Securities Exchange Act of 1934. |
| (h) | The registrant’s audit committee of the board of Trustees has considered whether the provision of non-audit services that were rendered to the registrant’s investment adviser, and any entity controlling, controlled by, or under common control with the investment adviser that provides ongoing services to the registrant that were not pre-approved pursuant to paragraph (c)(7)(ii) of Rule 2-01 of Regulation S-X is compatible with maintaining the principal accountant’s independence. No such services were rendered. |
Item 5. Audit Committee of Listed Registrants
Not applicable.
Item 6. Schedule of Investments.
a) Not applicable. The complete schedule of investments is included in Item 1 of this Form N-CSR.
b) Not applicable.
Item 7. Disclosure of Proxy Voting Policies and Procedures for Closed-End Management Investment Companies.
Not applicable.
Item 8. Portfolio Managers of Closed-End Management Investment Companies.
Not applicable.
Item 9. Purchases of Equity Securities by Closed-End Management Investment Company and Affiliated Purchasers.
Not applicable.
Item 10. Submission of Matters to a Vote of Security Holders.
The Fund’s Governance Committee Provisions with Respect to Nominations of Directors/Trustees to the Respective Boards
None
Item 11. Controls and Procedures.
Based on their evaluation of the registrant’s disclosure controls and procedures (as defined in rule 30a-3(c) under the Investment Company Act of 1940 (17 CFR 270.30a-3(c)) as of 9/30/2016, the registrant’s principal executive officer and principal financial officer found the registrant’s disclosure controls and procedures to provide reasonable assurances that information required to be disclosed by the registrant in the reports that it files under the Securities Exchange Act of 1934 (a) is accumulated and communicated to registrant’s management, including its principal executive officer and principal financial officer, to allow timely decisions regarding required disclosure, and (b) is recorded, processed, summarized and reported, within the time periods specified in the rules and forms adopted by the U.S. Securities and Exchange Commission.
There have been no changes in the registrant’s internal controls over financial reporting that occurred during the registrant’s second fiscal quarter of the period covered by this report that have materially affected, or are reasonably likely to materially affect, the registrant’s internal control over financial reporting.
Item 12. Exhibits.
| (a) | (1) Exhibit attached hereto. |
(2) Exhibits attached hereto.
(3) Not applicable.
| (b) | Exhibit attached hereto. |
SIGNATURES
Pursuant to the requirements of the Securities Exchange Act of 1934 and the Investment Company Act of 1940, the registrant has duly caused this report to be signed on its behalf by the undersigned, thereunto duly authorized.
Oppenheimer Global Fund
| | |
| By: | | /s/ Arthur P. Steinmetz |
| | Arthur P. Steinmetz |
| | Principal Executive Officer |
Date: | | 11/21/2016 |
Pursuant to the requirements of the Securities Exchange Act of 1934 and the Investment Company Act of 1940, this report has been signed below by the following persons on behalf of the registrant and in the capacities and on the dates indicated.
| | |
| By: | | /s/ Arthur P. Steinmetz |
| | Arthur P. Steinmetz |
| | Principal Executive Officer |
Date: | | 11/21/2016 |
| |
| By: | | /s/ Brian S. Petersen |
| | Brian S. Petersen |
| | Principal Financial Officer |
Date: | | 11/21/2016 |