
F’14 Investor Day September 19, 2013 F’14 INVESTOR & ANALYST DAY September 19, 2013 WE IDENTIFY AND PROTECT PREMISES, PRODUCTS, AND PEOPLE. 1
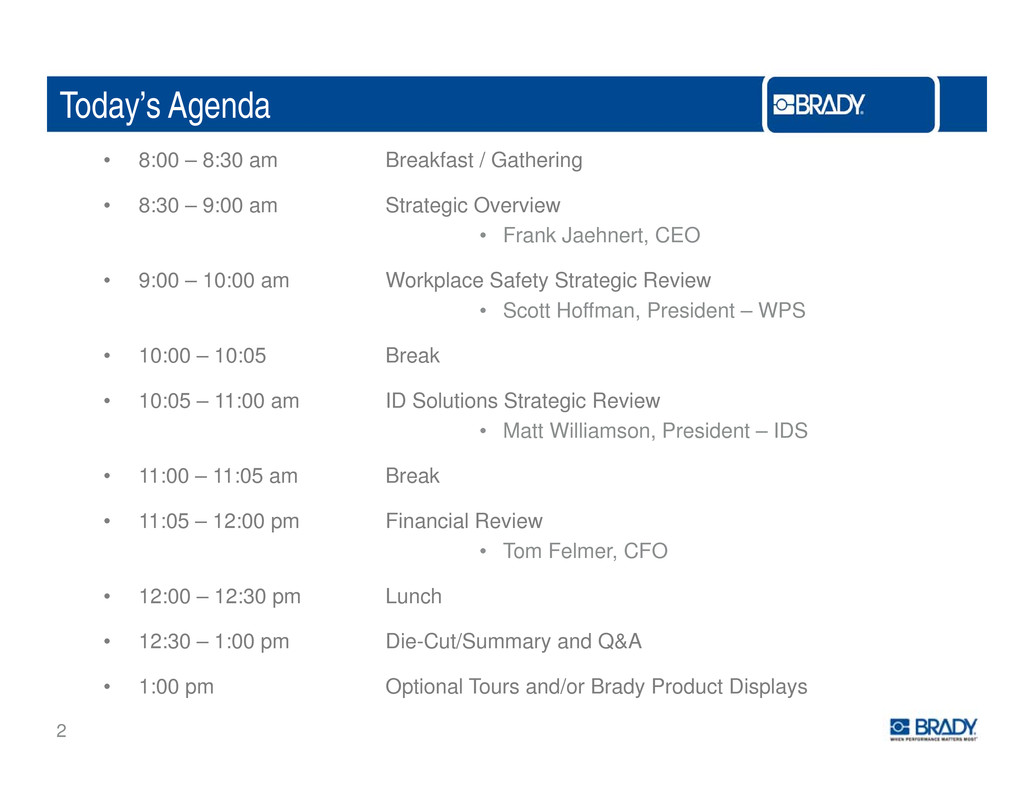
Today’s Agenda • 8:00 – 8:30 am Breakfast / Gathering • 8:30 – 9:00 am Strategic Overview • Frank Jaehnert, CEO • 9:00 – 10:00 am Workplace Safety Strategic Review • Scott Hoffman, President – WPS 10 00 10 05 B k• : – : rea • 10:05 – 11:00 am ID Solutions Strategic Review • Matt Williamson, President – IDS • 11:00 – 11:05 am Break • 11:05 – 12:00 pm Financial Review • Tom Felmer CFO , • 12:00 – 12:30 pm Lunch • 12:30 – 1:00 pm Die-Cut/Summary and Q&A 2 • 1:00 pm Optional Tours and/or Brady Product Displays
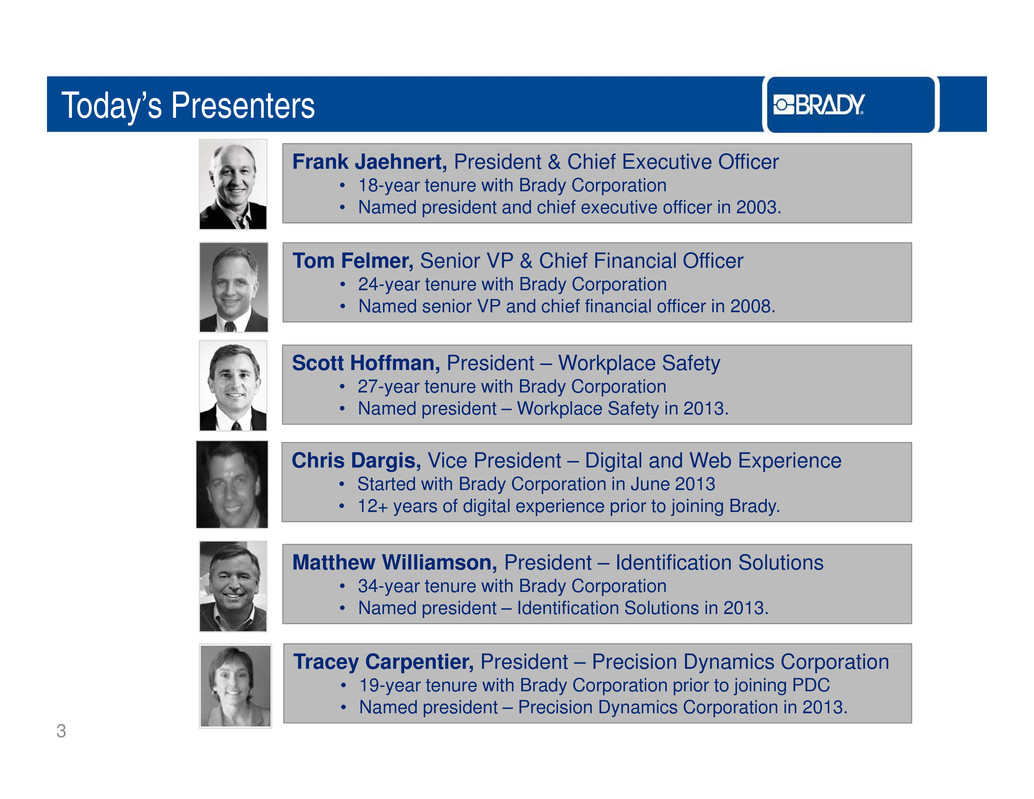
Today’s Presenters Frank Jaehnert, President & Chief Executive Officer • 18-year tenure with Brady Corporation • Named president and chief executive officer in 2003. Tom Felmer, Senior VP & Chief Financial Officer • 24-year tenure with Brady Corporation • Named senior VP and chief financial officer in 2008. Scott Hoffman, President – Workplace Safety • 27-year tenure with Brady Corporation • Named president – Workplace Safety in 2013. Chris Dargis, Vice President – Digital and Web Experience • Started with Brady Corporation in June 2013 • 12+ years of digital experience prior to joining Brady. Matthew Williamson, President – Identification Solutions • 34-year tenure with Brady Corporation • Named president – Identification Solutions in 2013. 3 Tracey Carpentier, President – Precision Dynamics Corporation • 19-year tenure with Brady Corporation prior to joining PDC • Named president – Precision Dynamics Corporation in 2013.
Forward-Looking Statements In this presentation, statements that are not reported financial results or other historic information are “forward- looking statements.” These forward-looking statements relate to, among other things, the Company’s future financial position, business strategy, targets, projected sales, costs, earnings, capital expenditures, debt levels and cash flows, and plans and objectives of management for future operations. The use of words such as “may,” “will,” “expect,” “intend,” “estimate,” “anticipate,” “believe,” “should,” “project” or “plan” or similar terminology are generally intended to identify forward-looking statements. These forward-looking statements by their nature address matters that are, to different degrees, uncertain and are subject to risks, assumptions, and other factors, some of which are beyond Brady’s control, that could cause actual results to differ materially from those expressed or implied by such forward-looking statements. For Brady, uncertainties arise from: the length or severity of the current worldwide economic downturn or timing or strength of a subsequent recovery; increased usage of e-commerce allowing for ease of price transparency; future financial performance of major markets Brady serves, which include, without limitation, telecommunications, hard disk drive, manufacturing, electrical, construction, laboratory, education, governmental, public utility, computer, and transportation; future competition; changes in the supply of, or price for, parts and components; increased price pressure from suppliers and customers; Brady’s ability to retain significant contracts and customers; fluctuations in currency rates versus the U.S. dollar; risks associated with international operations; difficulties associated with exports; risks associated with obtaining governmental approvals and maintaining regulatory compliance; Brady’s ability to develop and successfully market new products; difficulties in making and integrating acquisitions; risks associated with newly acquired businesses; risks associated with divestitures, risks associated with restructuring plans; environmental, health and safety compliance costs and liabilities; technology changes and potential security violations to the Company’s information technology systems; Brady’s ability to maintain compliance with its debt covenants; increase in our level of debt; potential write-offs of Brady’s substantial intangible assets; unforeseen tax consequences; and numerous other matters of national, regional and global scale, including those of a political, economic, business, competitive, and regulatory nature contained from time to time in Brady’s U S Securities and Exchange Commission filings including but not limited to those factors 4 Brad . . filing , , limite , listed in the “Risk Factors” section within Item 1A of Part I of Brady’s Form 10-K for the year ended July 31, 2012. These uncertainties may cause Brady’s actual future results to be materially different than those expressed in its forward-looking statements. Brady does not undertake to update its forward-looking statements except as required by law.
BRADY’S TRANSFORMATION Frank Jaehnert Chief Executive Officer 5
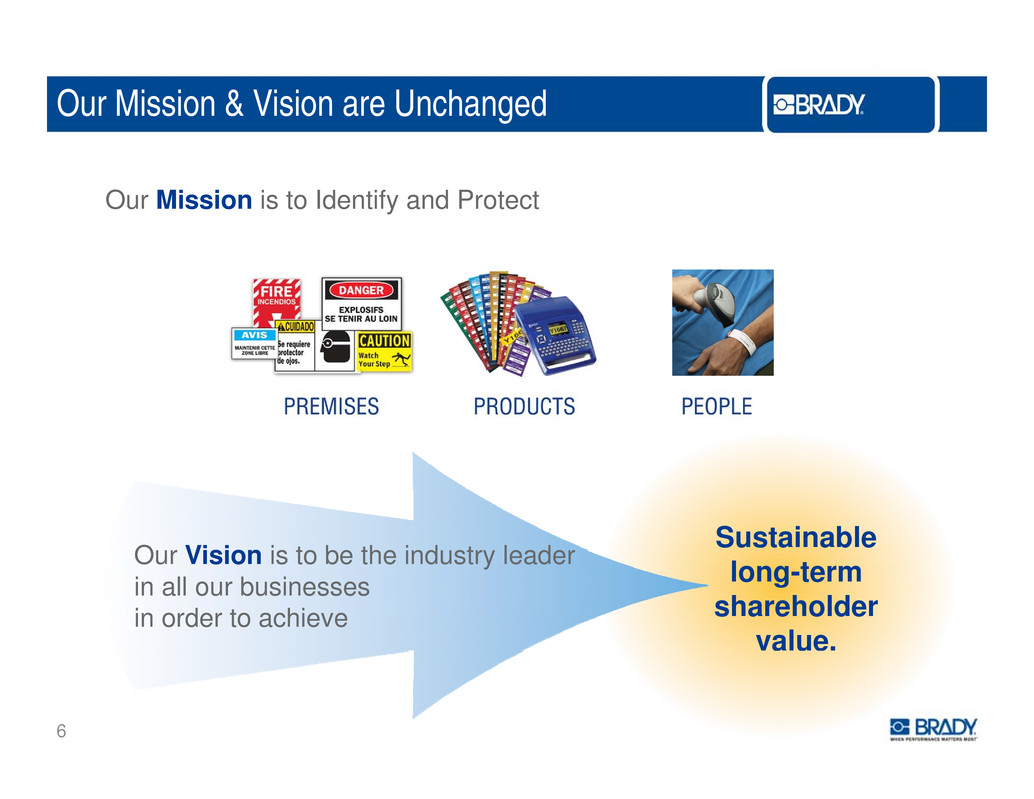
Our Mission & Vision are Unchanged Our Mission is to Identify and Protect O r Vision is to be the ind str leader Sustainable u u y in all our businesses in order to achieve long-term shareholder value. 6
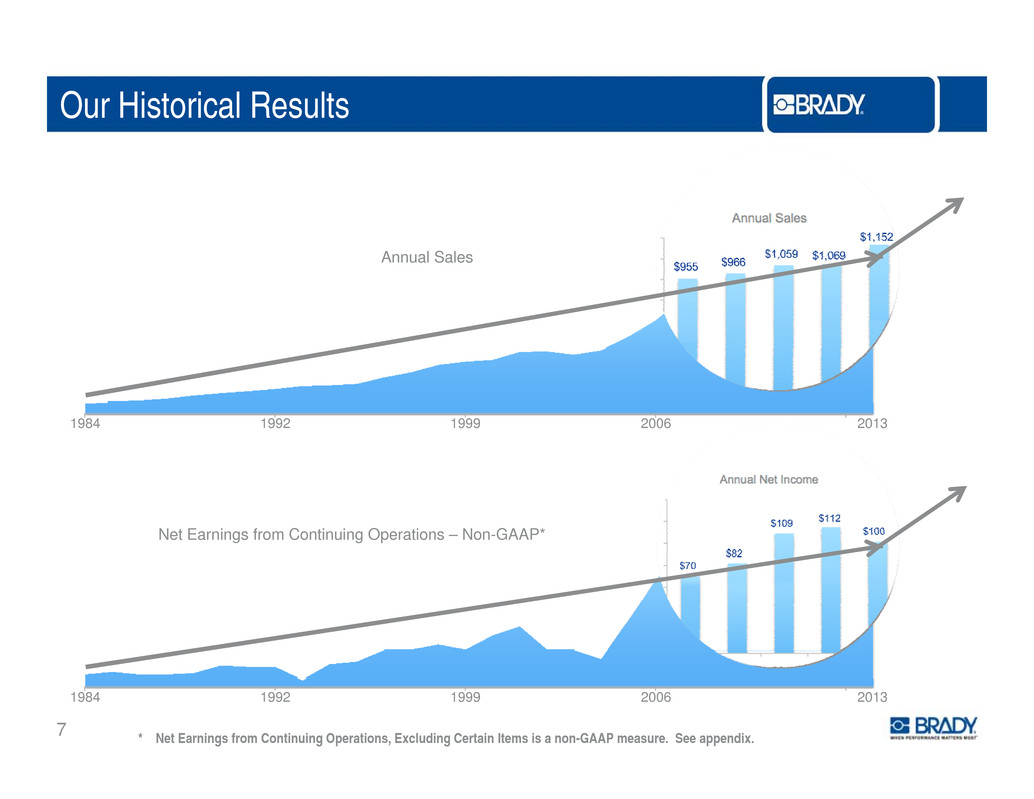
Our Historical Results Annual Sales 1984 1991 1998 2005 20121984 1992 1999 2006 2013 Net Earnings from Continuing Operations – Non-GAAP* 1984 1991 1998 2005 20121984 1992 1999 2006 2013 7 * Net Earnings from Continuing Operations, Excluding Certain Items is a non-GAAP measure. See appendix.
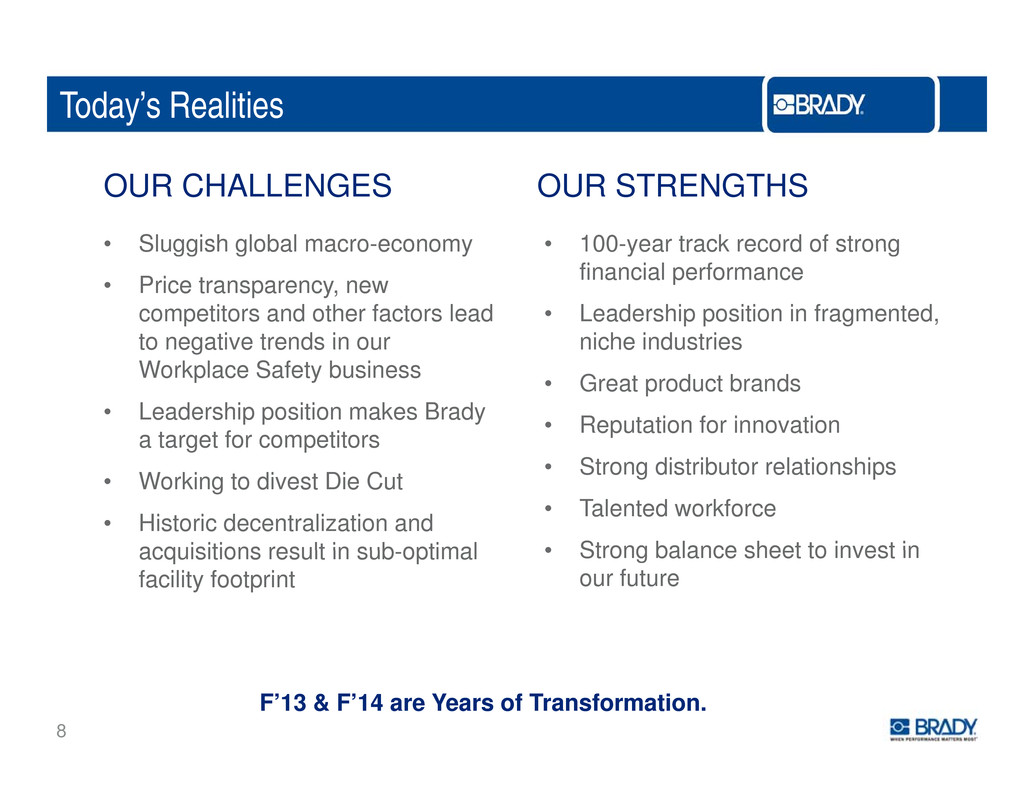
Today’s Realities OUR CHALLENGES • Sluggish global macro-economy OUR STRENGTHS • 100-year track record of strong • Price transparency, new competitors and other factors lead to negative trends in our financial performance • Leadership position in fragmented, niche industries Workplace Safety business • Leadership position makes Brady a target for competitors • Great product brands • Reputation for innovation • Working to divest Die Cut • Historic decentralization and acquisitions result in sub optimal • Strong distributor relationships • Talented workforce • Strong balance sheet to invest in - facility footprint our future 8 F’13 & F’14 are Years of Transformation.
F’13 Actions and F’14 Priorities F’13 – REALINGED FOR GROWTH: • Reorganized around global business platforms. • Sold 3 businesses last year and announced plans to sell Die Cut. • Purchased PDC in Q2 of F’13. • Executed business simplification. F’14 – PRIORITIES: R t WPS b i t i th• e urn us ness o organ c grow . • Increase organic sales growth in IDS and continue portfolio shift into faster- growing industries and geographies. C l t th l f Di C t• omp e e e sa e o e u . • Continue to review cost structure, including facility consolidation activities. 9
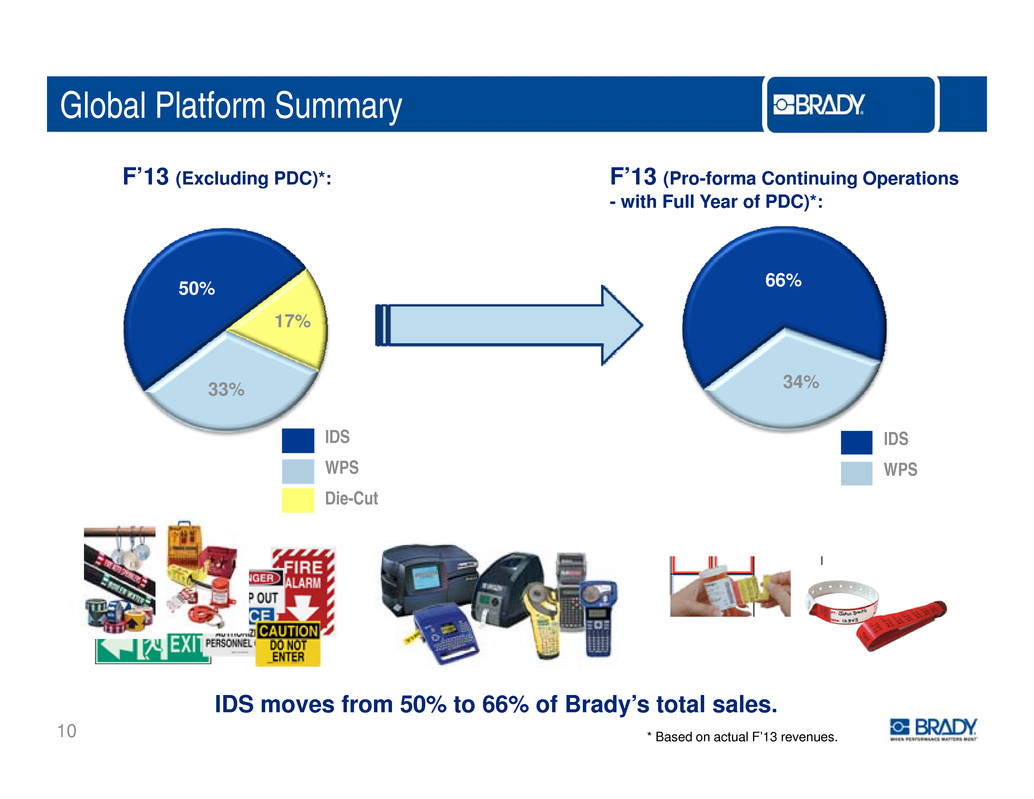
Global Platform Summary F’13 (Excluding PDC)*: F’13 (Pro-forma Continuing Operations - with Full Year of PDC)*: 50% 17% 66% 33% IDS 34% IDS WPSWPS Die-Cut 10 IDS moves from 50% to 66% of Brady’s total sales. * Based on actual F’13 revenues.
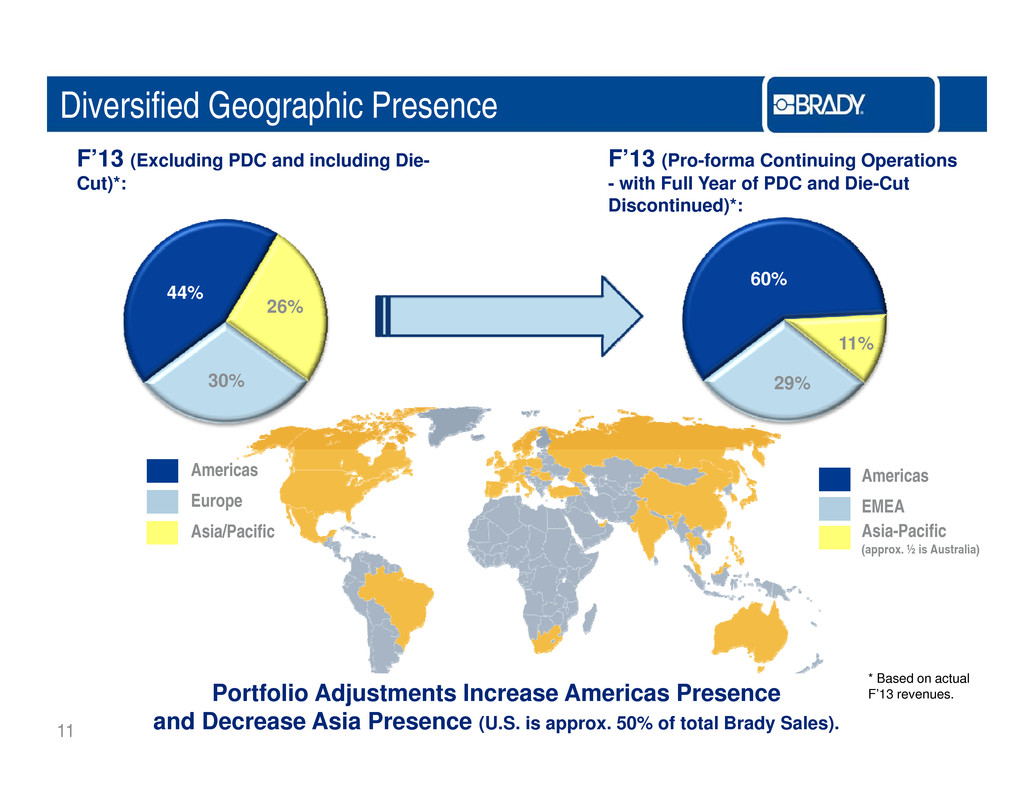
Diversified Geographic Presence F’13 (Excluding PDC and including Die- Cut)*: F’13 (Pro-forma Continuing Operations - with Full Year of PDC and Die-Cut Discontinued)*: 44% 26% 60% 11% 30% 29% Americas Europe Asia/Pacific Americas EMEA Asia-Pacific (approx ½ is Australia). 11 Portfolio Adjustments Increase Americas Presence and Decrease Asia Presence (U.S. is approx. 50% of total Brady Sales). * Based on actual F’13 revenues.
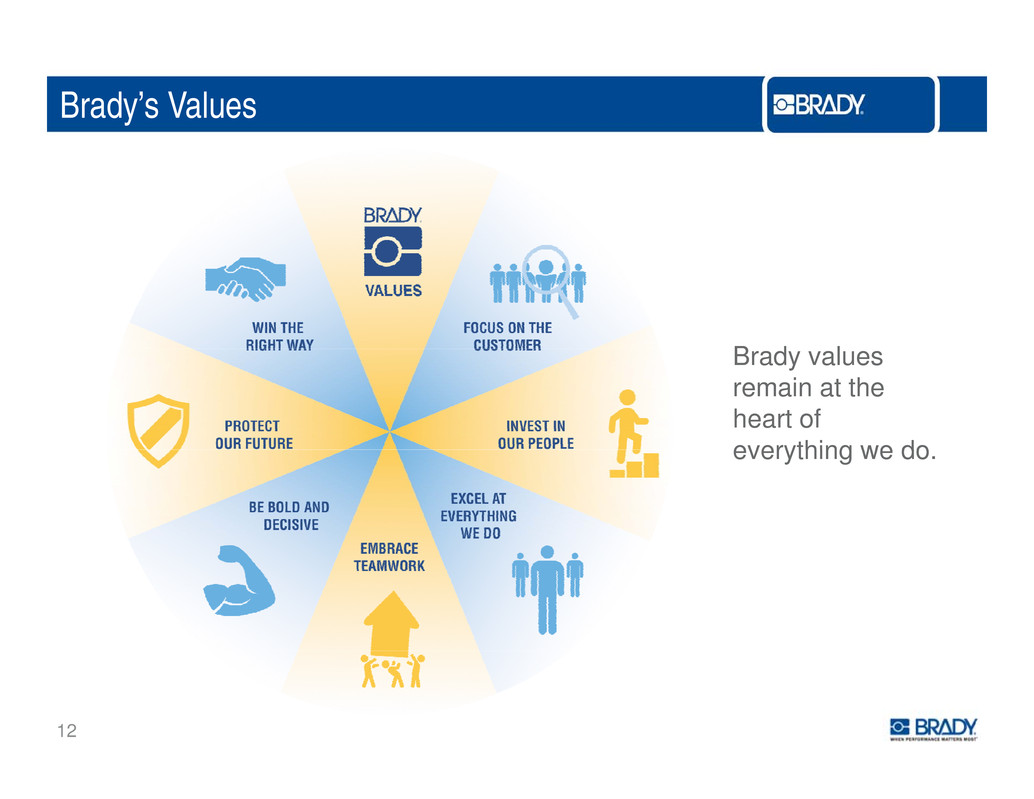
Brady’s Values B d lra y va ues remain at the heart of everything we do . 12
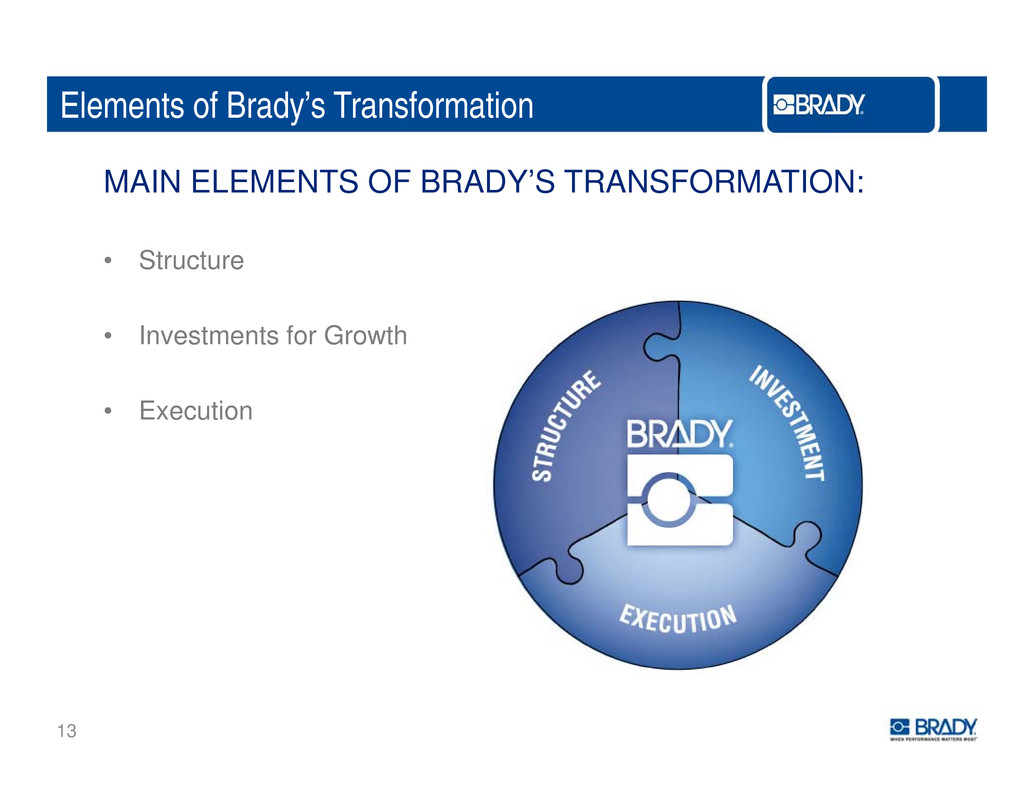
Elements of Brady’s Transformation MAIN ELEMENTS OF BRADY’S TRANSFORMATION: • Structure • Investments for Growth • Execution 13
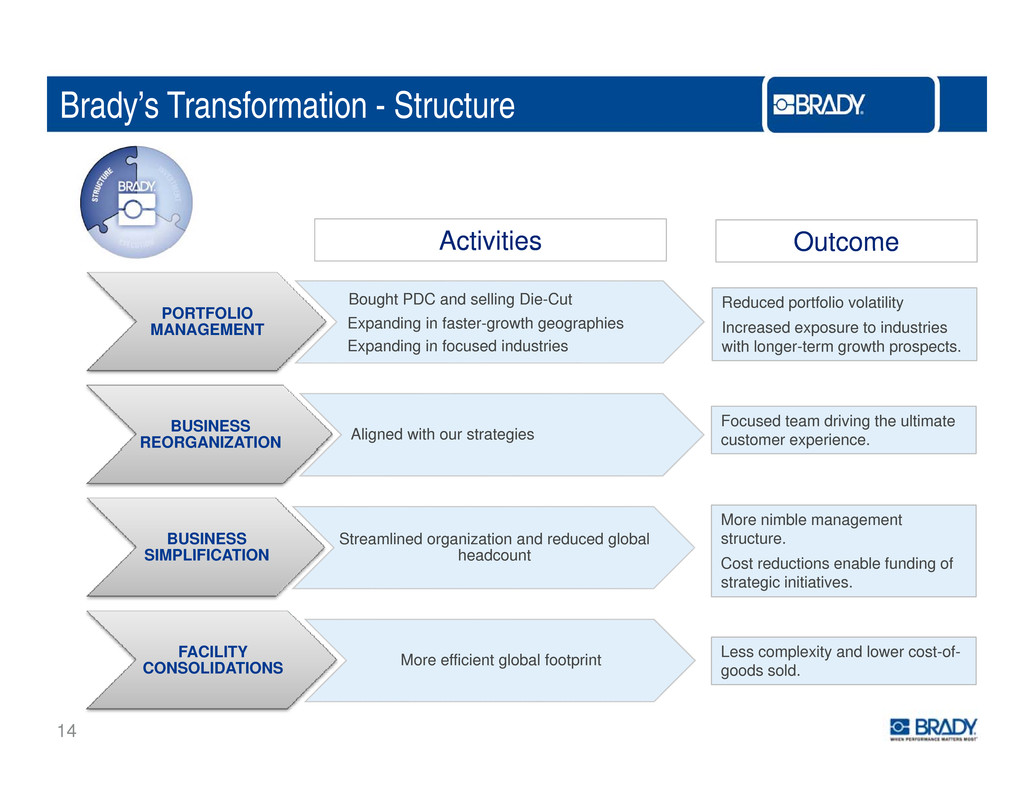
Brady’s Transformation - Structure Activities Outcome PORTFOLIO MANAGEMENT Bought PDC and selling Die-Cut Expanding in faster-growth geographies Expanding in focused industries Reduced portfolio volatility Increased exposure to industries with longer-term growth prospects BUSINESS REORGANIZATION Aligned with our strategies . Focused team driving the ultimate customer experience. BUSINESS SIMPLIFICATION Streamlined organization and reduced global h d t More nimble management structure. ea coun FACILITY Cost reductions enable funding of strategic initiatives. Less complexity and lower cost of 14 CONSOLIDATIONS More efficient global footprint - - goods sold.
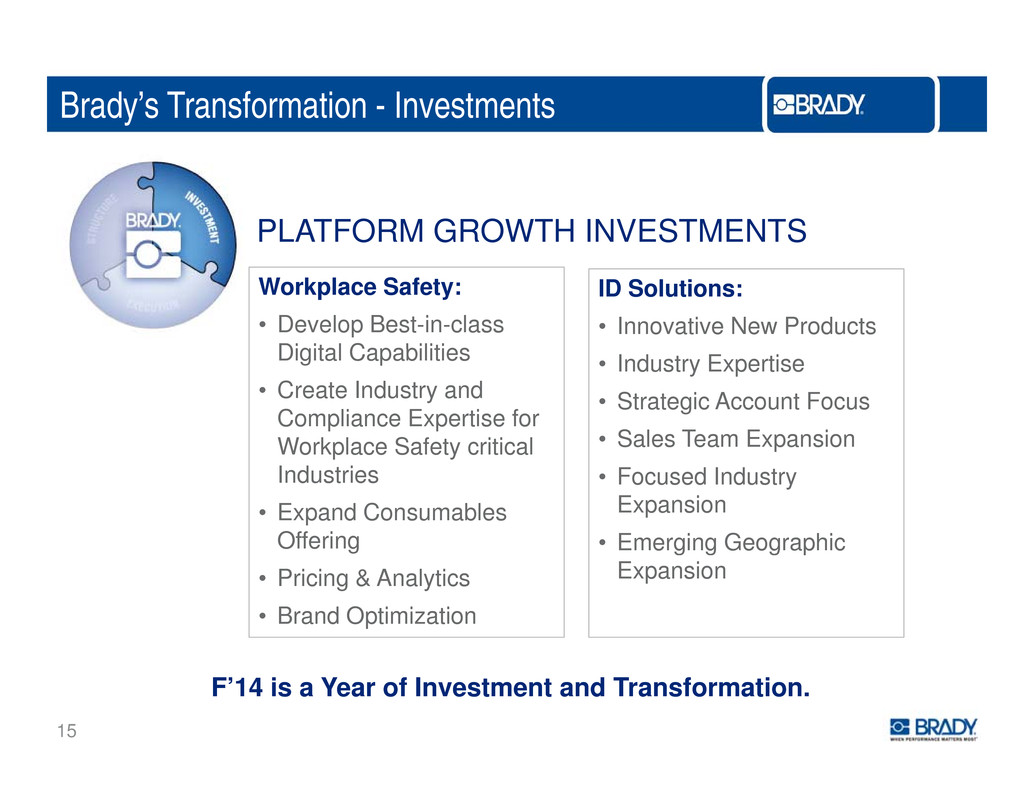
Brady’s Transformation - Investments PLATFORM GROWTH INVESTMENTS Workplace Safety: • Develop Best-in-class Digital Capabilities ID Solutions: • Innovative New Products • Create Industry and Compliance Expertise for Workplace Safety critical • Industry Expertise • Strategic Account Focus • Sales Team Expansion Industries • Expand Consumables Offering • Focused Industry Expansion • Emerging Geographic • Pricing & Analytics • Brand Optimization Expansion 15 F’14 is a Year of Investment and Transformation.
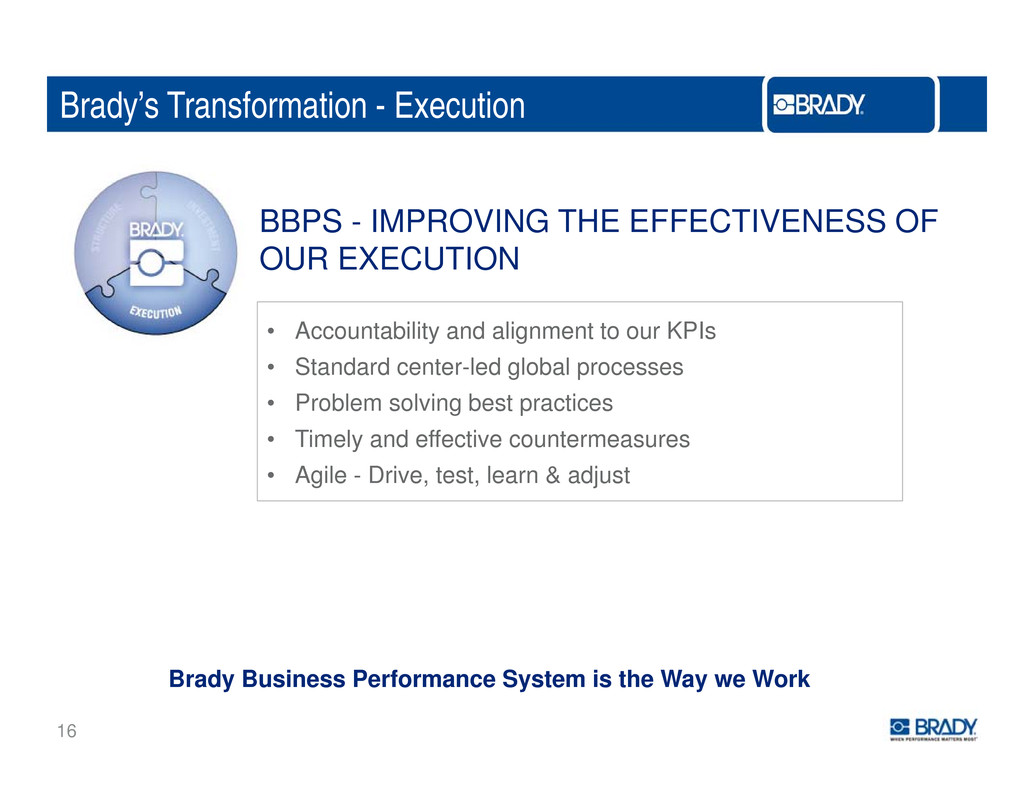
Brady’s Transformation - Execution BBPS - IMPROVING THE EFFECTIVENESS OF OUR EXECUTION • Accountability and alignment to our KPIs • Standard center-led global processes • Problem solving best practices • Timely and effective countermeasures • Agile - Drive, test, learn & adjust 16 Brady Business Performance System is the Way we Work
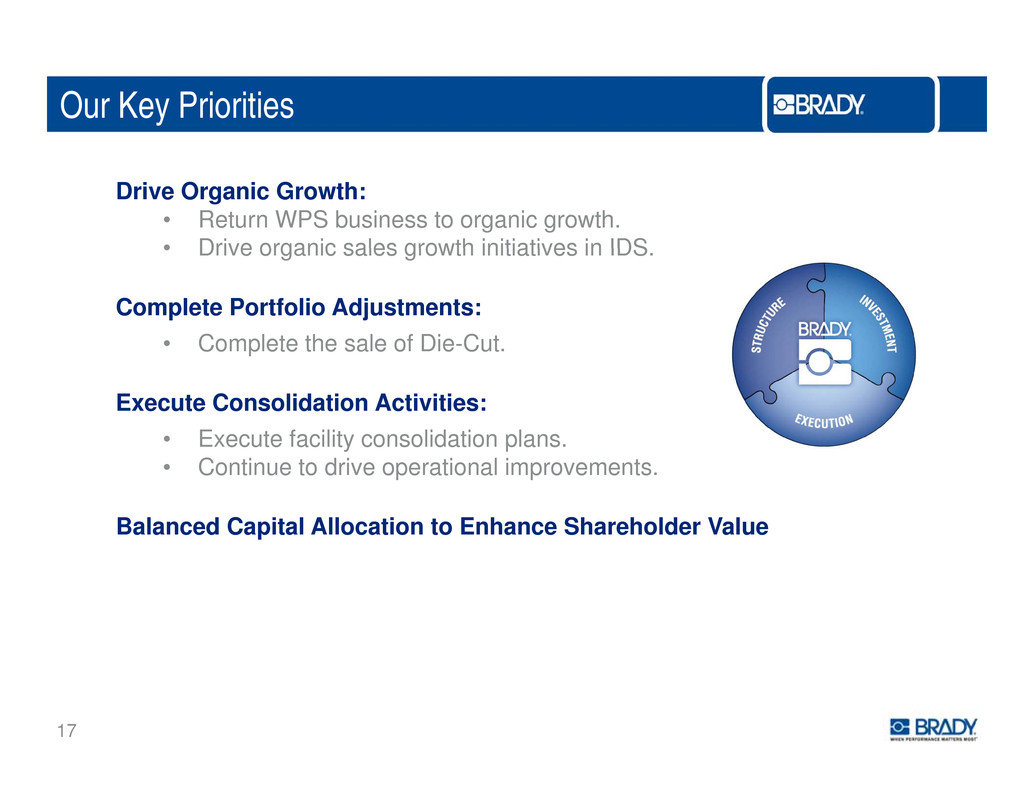
Our Key Priorities Drive Organic Growth: • Return WPS business to organic growth. • Drive organic sales growth initiatives in IDS growt ID . Complete Portfolio Adjustments: • Complete the sale of Die-Cut. Execute Consolidation Activities: • Execute facility consolidation plans. • Continue to drive operational improvements. Balanced Capital Allocation to Enhance Shareholder Value 17
WORKPLACE SAFETY Scott Hoffman President – Workplace Safety 18
WPS Global Platform Summary Products: • Vast offering of workplace safety products (signs, tags, labels, safety equipment and related Channels: Multi-channel model (internet, catalogs, telesales, e-business) Business Drivers: CHANNELS & DRIVERSPRODUCTS & CUSTOMERS products) • Approx. 50% of products are manufactured Brands: • Major brands – Seton and Emed • Historical correlation with industrial production, ISM, & non-res construction, unemployment and regulatory changes • Performance will be more a function of internal Customers: • Large and diverse customer base • Small average order size changes than external indicators • Refined strategy and increased investment in digital expertise to return to growth V l D i Industries Served: • Sell into nearly all business sectors / SIC codes • Industries served include construction, general a ue r vers: • High quality, fast service • Regulatory compliance specialists • Relevancy to our customers manufacturing, and other workplace-safety critical industries. • Specialized in customized products 19
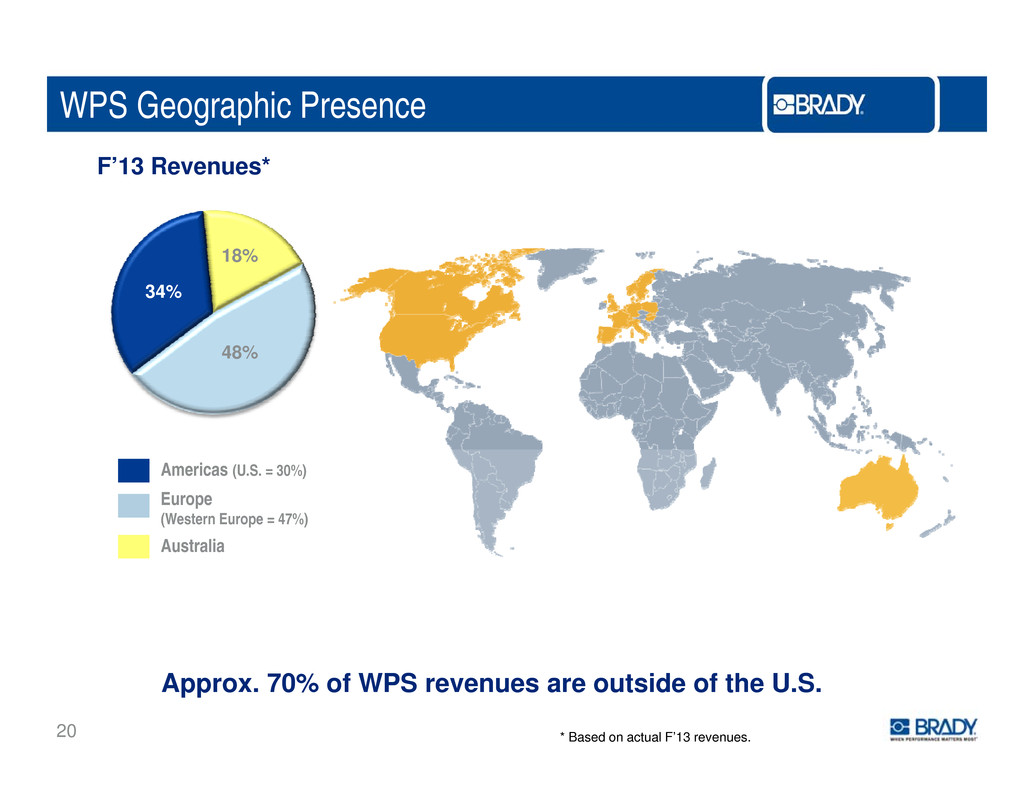
WPS Geographic Presence F’13 Revenues* 34% 48% 18% Americas (U.S. = 30%) Europe (Western Europe = 47%) Australia 20 Approx. 70% of WPS revenues are outside of the U.S. * Based on actual F’13 revenues.
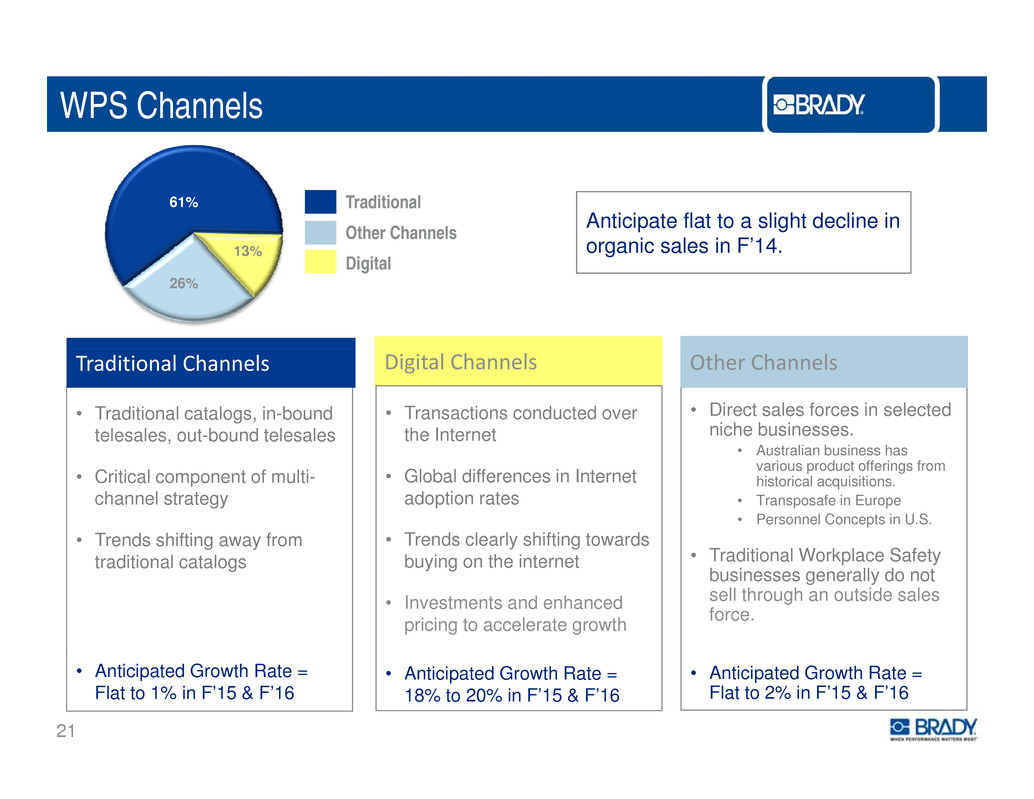
WPS Channels 61% 13% Traditional Other Channels Anticipate flat to a slight decline in organic sales in F’14 26% Digital . • Traditional catalogs, in-bound telesales, out-bound telesales Traditional Channels Digital Channels • Transactions conducted over the Internet • Direct sales forces in selected niche businesses. • Australian business has Other Channels • Critical component of multi- channel strategy • Trends shifting away from • Global differences in Internet adoption rates • Trends clearly shifting towards various product offerings from historical acquisitions. • Transposafe in Europe • Personnel Concepts in U.S. T diti l W k l S f ttraditional catalogs buying on the internet • Investments and enhanced pricing to accelerate growth • ra ona or p ace a e y businesses generally do not sell through an outside sales force. 21 • Anticipated Growth Rate = Flat to 1% in F’15 & F’16 • Anticipated Growth Rate = 18% to 20% in F’15 & F’16 • Anticipated Growth Rate = Flat to 2% in F’15 & F’16
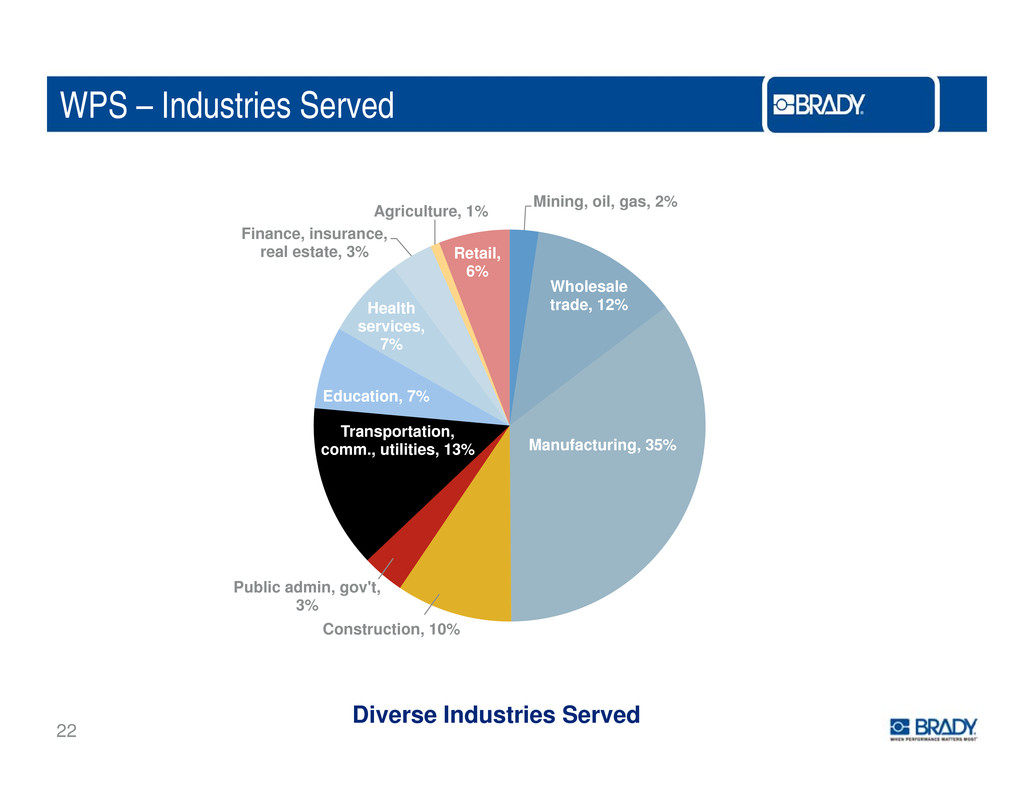
WPS – Industries Served Mining, oil, gas, 2% Finance, insurance, l t t 3% Agriculture, 1% R t il Industry Breakdown Wholesale trade, 12%Health services, 7% rea es a e, e a , 6% Manufacturing, 35% Transportation, comm utilities 13% Education, 7% ., , Construction, 10% Public admin, gov't, 3% 22 Diverse Industries Served
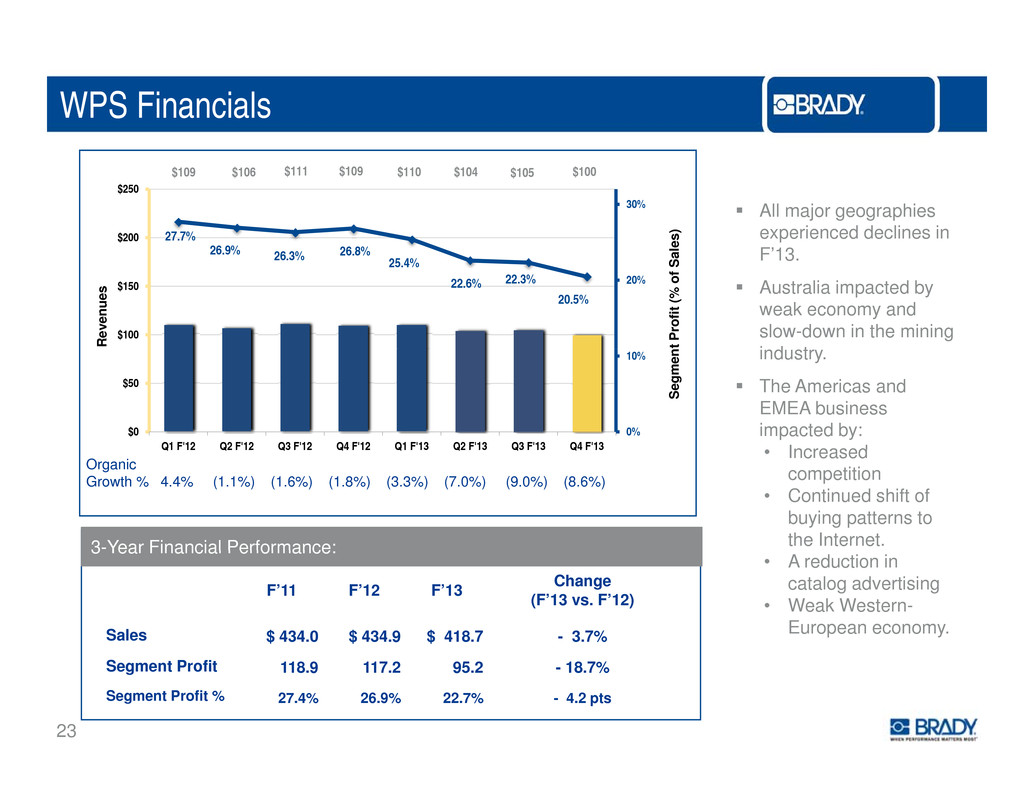
WPS Financials $109 $106 $111 $109 $110 $104 $105 $100 27.7% 26 9% 26 8% 30% $200 $250 e s ) All major geographies experienced declines in F’13. 26.3% . 25.4% 22.6% 22.3% 20.5% 20% $100 $150 R e v e n u e s t P r o f i t ( % o f S a l . Australia impacted by weak economy and slow-down in the mining i d t 0% 10% $0 $50 Q1 F'12 Q2 F'12 Q3 F'12 Q4 F'12 Q1 F'13 Q2 F'13 Q3 F'13 Q4 F'13 S e g m e n n us ry. The Americas and EMEA business impacted by: • Increased 3-Year Financial Performance: competition • Continued shift of buying patterns to the Internet. Organic Growth % 4.4% (1.1%) (1.6%) (1.8%) (3.3%) (7.0%) (9.0%) (8.6%) F’11 F’12 F’13 Change(F’13 vs. F’12) Sales $ 434.0 $ 434.9 $ 418.7 - 3.7% • A reduction in catalog advertising • Weak Western- European economy. 23 Segment Profit 118.9 117.2 95.2 - 18.7% Segment Profit % 27.4% 26.9% 22.7% - 4.2 pts
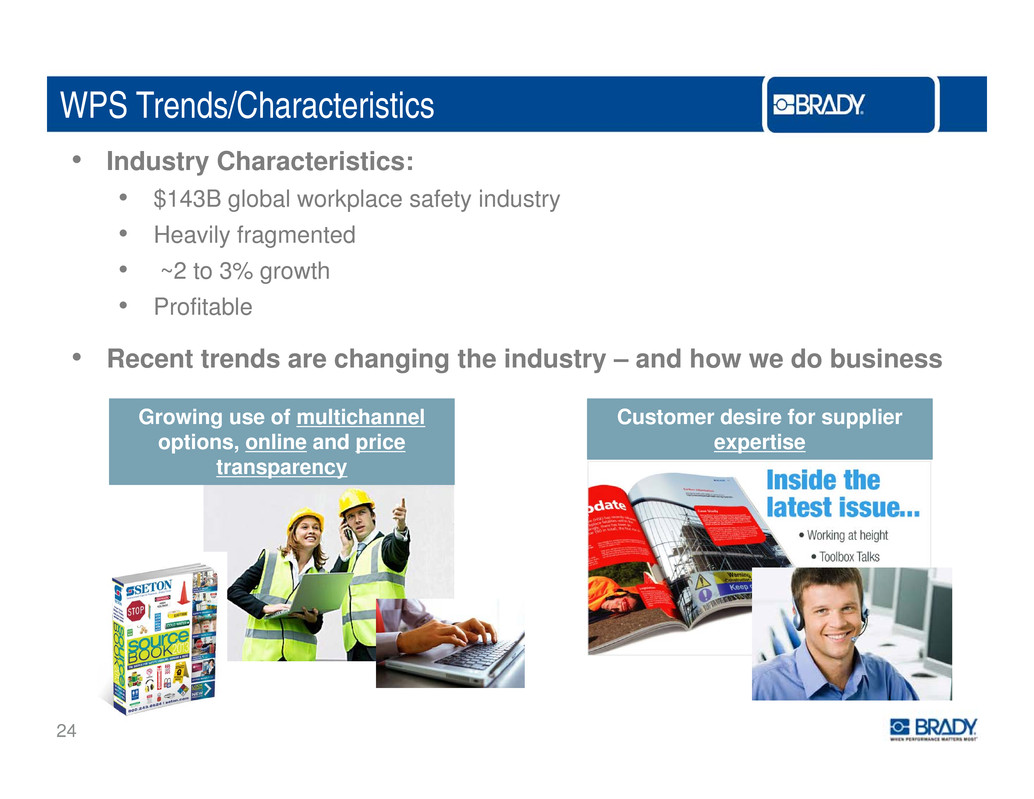
WPS Trends/Characteristics • Industry Characteristics: • $143B global workplace safety industry • Heavily fragmented • ~2 to 3% growth • Profitable R d h i h i d d h d b i• ecent tren s are c ang ng t e n ustry – an ow we o us ness Customer desire for supplier expertise Growing use of multichannel options, online and price transparency 24
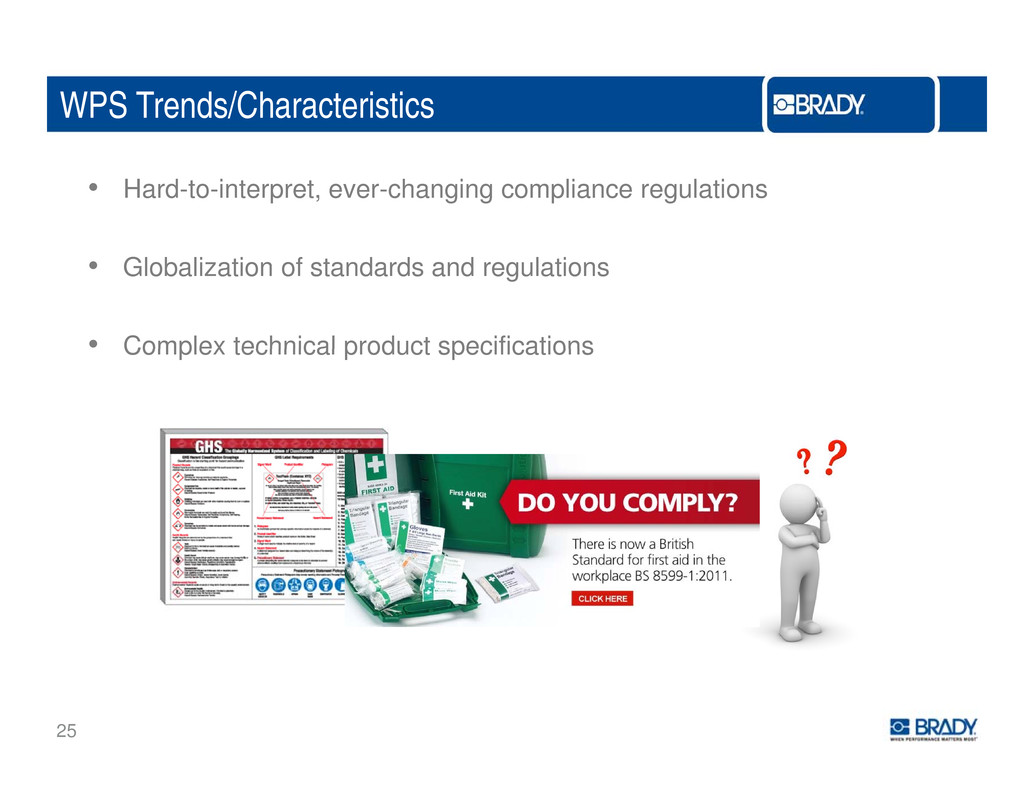
WPS Trends/Characteristics • Hard-to-interpret, ever-changing compliance regulations • Globalization of standards and regulations • Complex technical product specificationsComple echnica roduc pecification 25
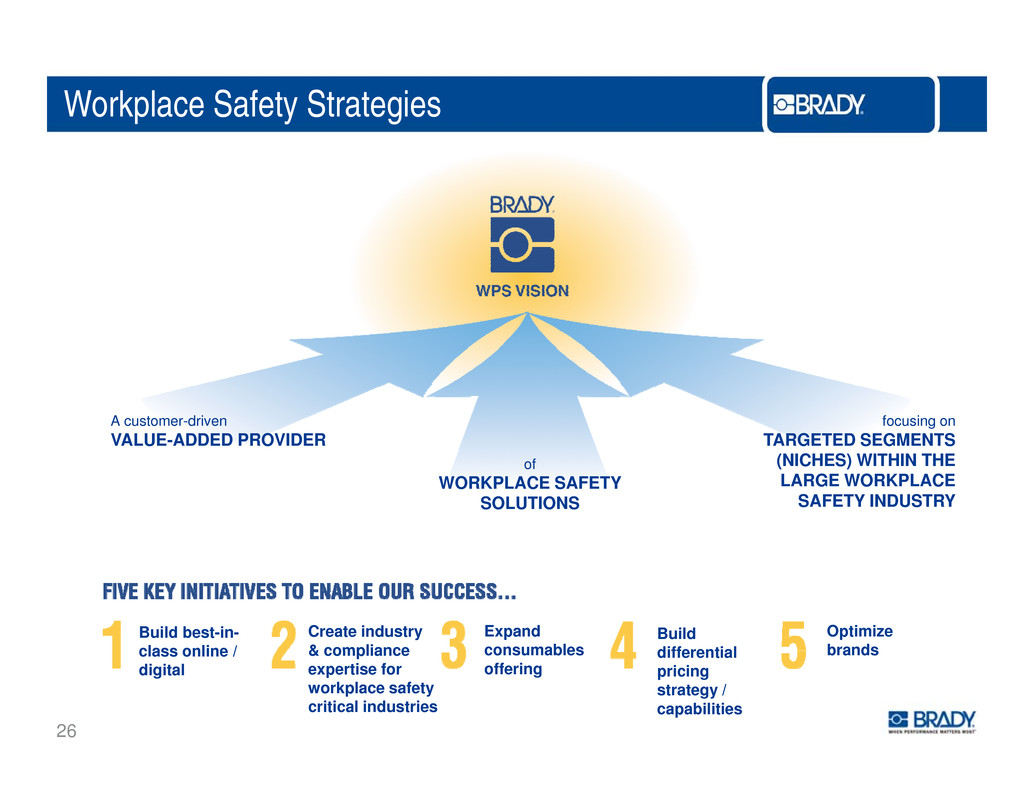
Workplace Safety Strategies A customer-driven VALUE-ADDED PROVIDER focusing on TARGETED SEGMENTS (NICHES) WITHIN THE LARGE WORKPLACE SAFETY INDUSTRY of WORKPLACE SAFETY SOLUTIONS Build best-in- class online / Create industry & compliance Expand consumables Build differential Optimize brands 26 digital expertise for workplace safety critical industries offering pricing strategy / capabilities
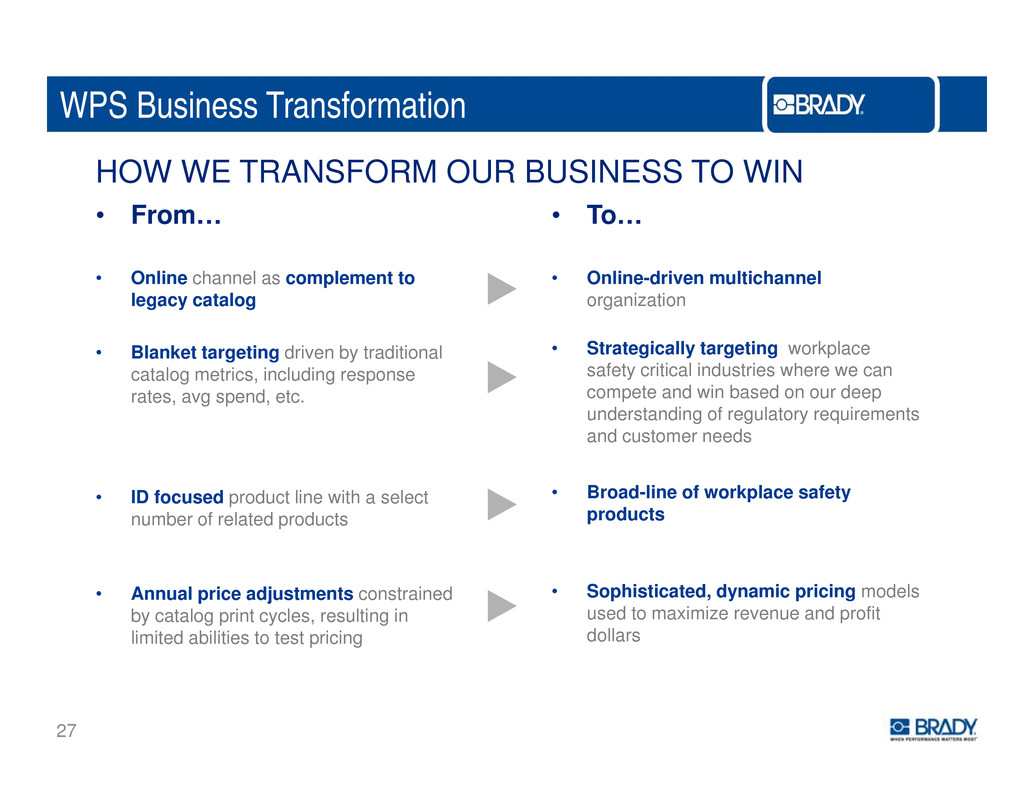
WPS Business Transformation • From… • To… HOW WE TRANSFORM OUR BUSINESS TO WIN • Online channel as complement to legacy catalog Blanket targeting dri en b traditional • Online-driven multichannel organization • Strategically targeting workplace• v y catalog metrics, including response rates, avg spend, etc. Strategicall safety critical industries where we can compete and win based on our deep understanding of regulatory requirements and customer needs • ID focused product line with a select number of related products • Broad-line of workplace safety products • Annual price adjustments constrained by catalog print cycles, resulting in limited abilities to test pricing • Sophisticated, dynamic pricing models used to maximize revenue and profit dollars 27
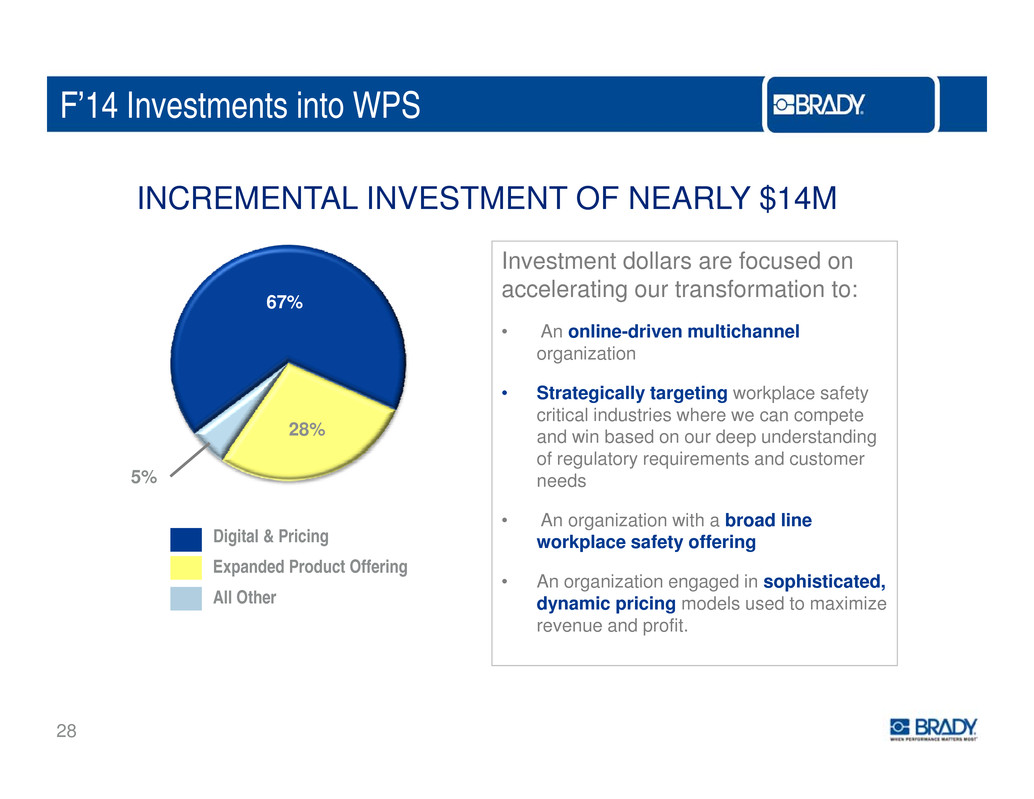
F’14 Investments into WPS INCREMENTAL INVESTMENT OF NEARLY $14M Investment dollars are focused on accelerating our transformation to: • An online-driven multichannel i ti 67% organ za on • Strategically targeting workplace safety critical industries where we can compete and win based on our deep understanding 28% of regulatory requirements and customer needs • An organization with a broad line workplace safety offering 5% Digital & Pricing • An organization engaged in sophisticated, dynamic pricing models used to maximize revenue and profit. Expanded Product Offering All Other 28
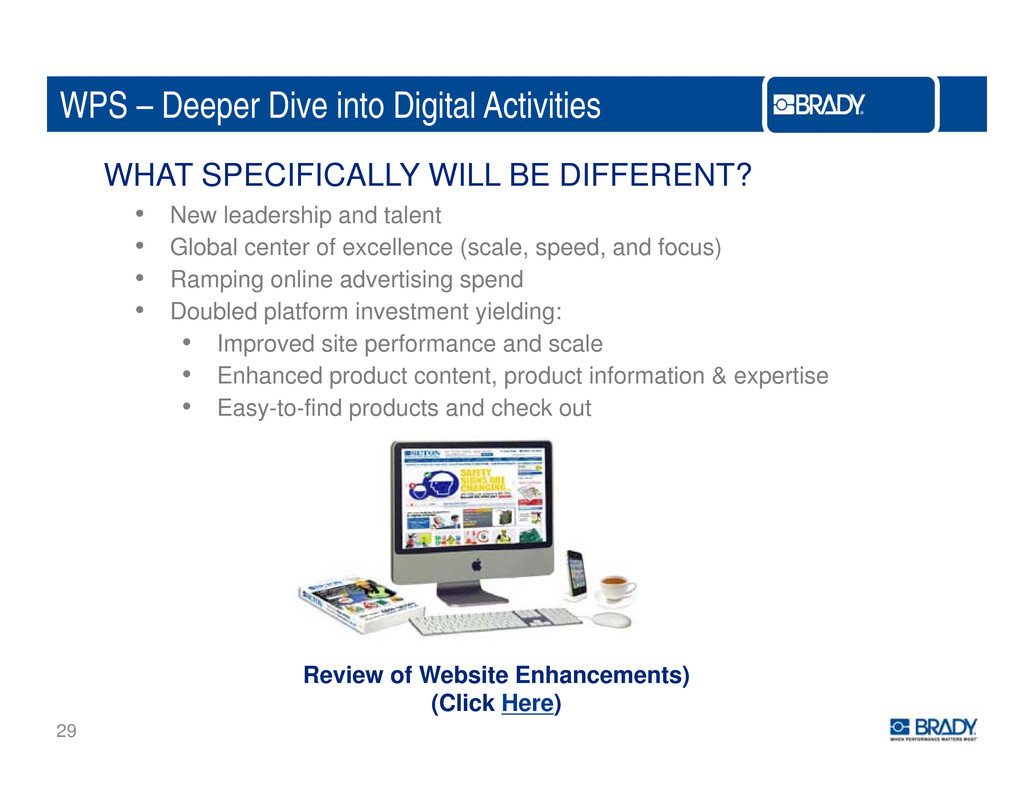
WPS – Deeper Dive into Digital Activities • New leadership and talent • Global center of excellence (scale speed and focus) WHAT SPECIFICALLY WILL BE DIFFERENT? , , focus • Ramping online advertising spend • Doubled platform investment yielding: • Improved site performance and scale • Enhanced product content, product information & expertise • Easy-to-find products and check out 29 Review of Website Enhancements) (Click Here)
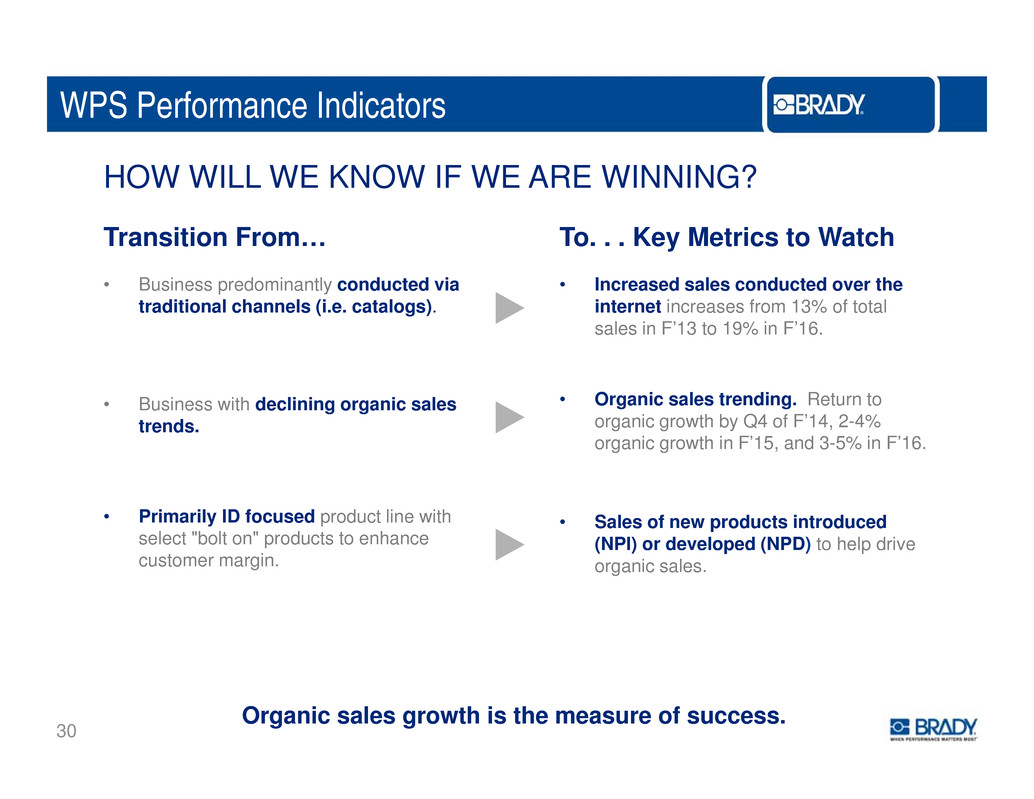
WPS Performance Indicators Transition From… To. . . Key Metrics to Watch HOW WILL WE KNOW IF WE ARE WINNING? • Business predominantly conducted via traditional channels (i.e. catalogs). • Increased sales conducted over the internet increases from 13% of total sales in F’13 to 19% in F’16. • Business with declining organic sales trends. • Organic sales trending. Return to organic growth by Q4 of F’14, 2-4% organic growth in F’15, and 3-5% in F’16. • Primarily ID focused product line with select "bolt on" products to enhance • Sales of new products introduced (NPI) or developed (NPD) to help drive customer margin. organic sales. 30 Organic sales growth is the measure of success.
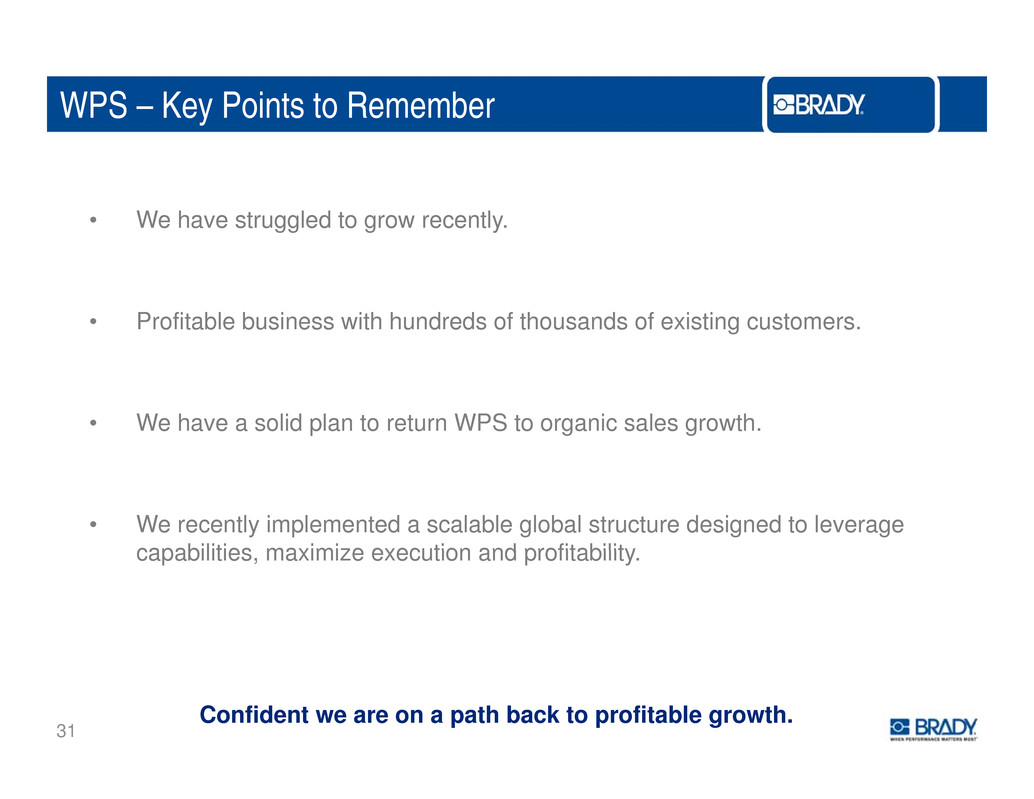
WPS – Key Points to Remember • We have struggled to grow recently. • Profitable business with hundreds of thousands of existing customers. • We have a solid plan to return WPS to organic sales growth. • We recently implemented a scalable global structure designed to leverage capabilities maximize execution and profitability, . 31 Confident we are on a path back to profitable growth.
Q&A 32
B krea 33
IDENTIFICATION SOLUTIONS Matt Williamson President – Identification Solutions 34

IDS – Major Product Offerings • The IDS global platform is engaged in the following major product categories: • Safety & Facility ID • Wire ID • Product ID • People ID H lth ID• ealt care Wire ID SFID 35% 17% 18% Product ID 9%21% Healthcare ID People ID 35
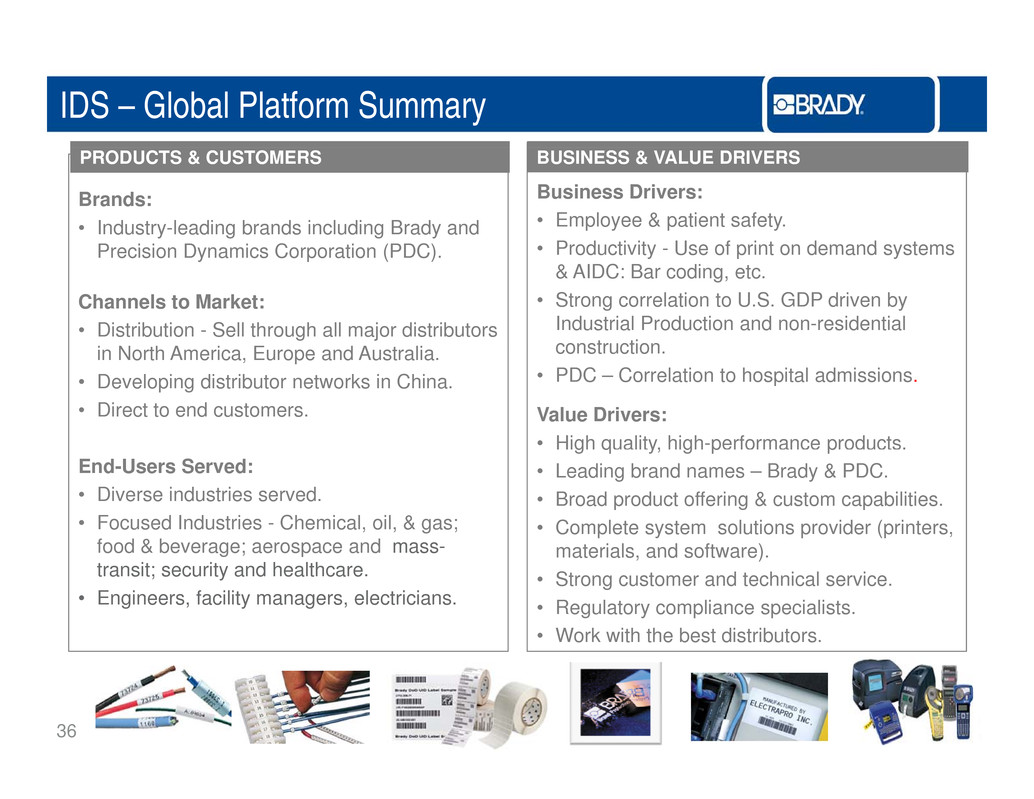
IDS – Global Platform Summary Brands: • Industry-leading brands including Brady and Precision Dynamics Corporation (PDC) Business Drivers: • Employee & patient safety. • Productivity Use of print on demand systems BUSINESS & VALUE DRIVERSPRODUCTS & CUSTOMERS . Channels to Market: • Distribution - Sell through all major distributors i N th A i E d A t li - & AIDC: Bar coding, etc. • Strong correlation to U.S. GDP driven by Industrial Production and non-residential constructionn or mer ca, urope an us ra a. • Developing distributor networks in China. • Direct to end customers. . • PDC – Correlation to hospital admissions. Value Drivers: • High quality, high-performance products. End-Users Served: • Diverse industries served. • Focused Industries - Chemical, oil, & gas; food & beverage; aerospace and mass- • Leading brand names – Brady & PDC. • Broad product offering & custom capabilities. • Complete system solutions provider (printers, materials and software) transit; security and healthcare. • Engineers, facility managers, electricians. , . • Strong customer and technical service. • Regulatory compliance specialists. • Work with the best distributors. 36
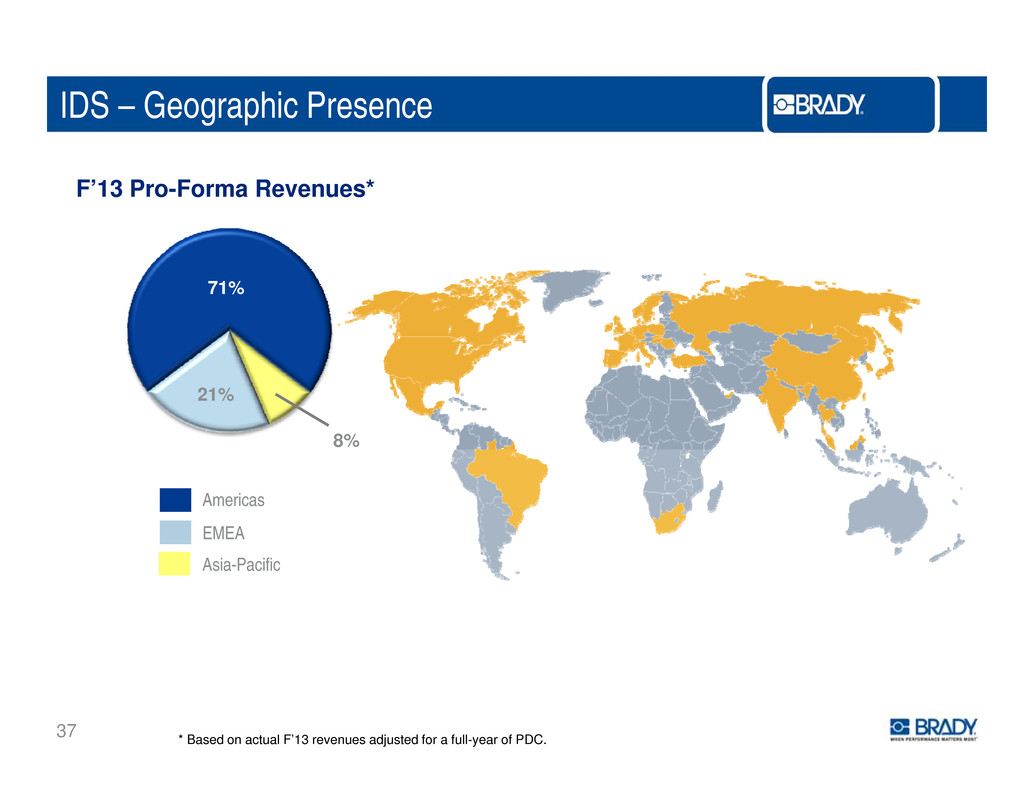
IDS – Geographic Presence F’13 Pro-Forma Revenues* 71% 21% 8% Americas EMEA Asia-Pacific 37 * Based on actual F’13 revenues adjusted for a full-year of PDC.
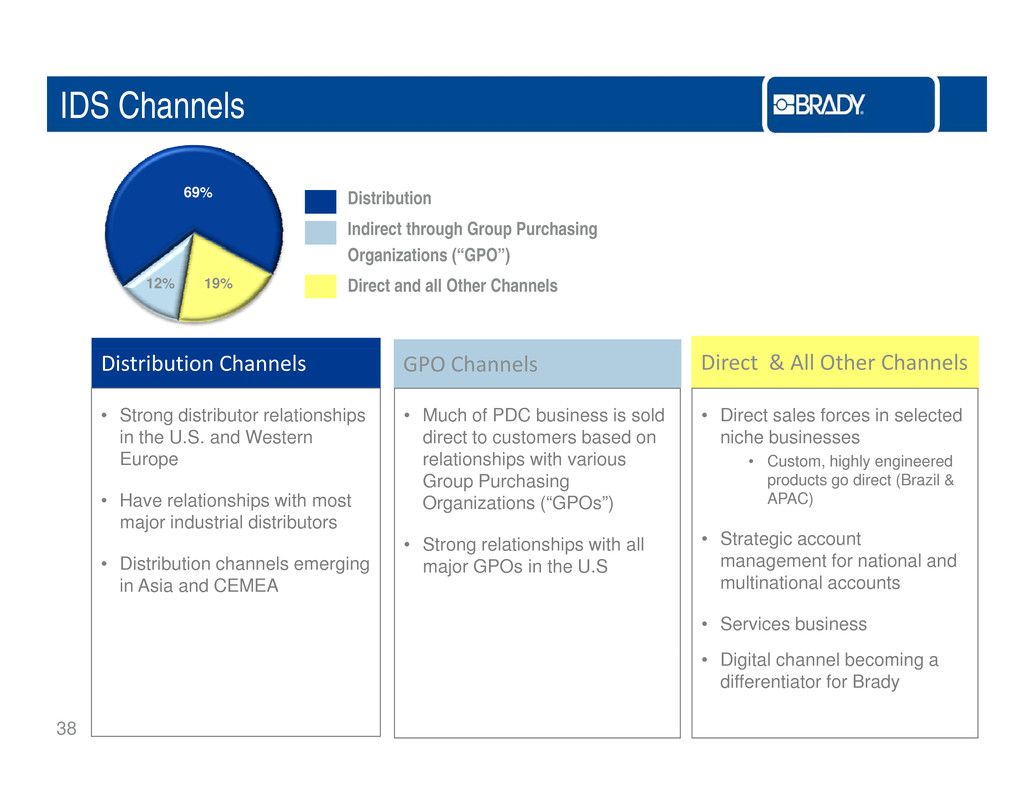
IDS Channels 69% Distribution Indirect through Group Purchasing O i i (“GPO”) 12% 19% rgan zat ons Direct and all Other Channels • Strong distributor relationships in the U.S. and Western Distribution Channels GPO Channels • Much of PDC business is sold direct to customers based on • Direct sales forces in selected niche businesses Direct & All Other Channels Europe • Have relationships with most major industrial distributors relationships with various Group Purchasing Organizations (“GPOs”) • Strong relationships with all • Custom, highly engineered products go direct (Brazil & APAC) • Strategic account • Distribution channels emerging in Asia and CEMEA major GPOs in the U.S management for national and multinational accounts • Services business 38 • Digital channel becoming a differentiator for Brady
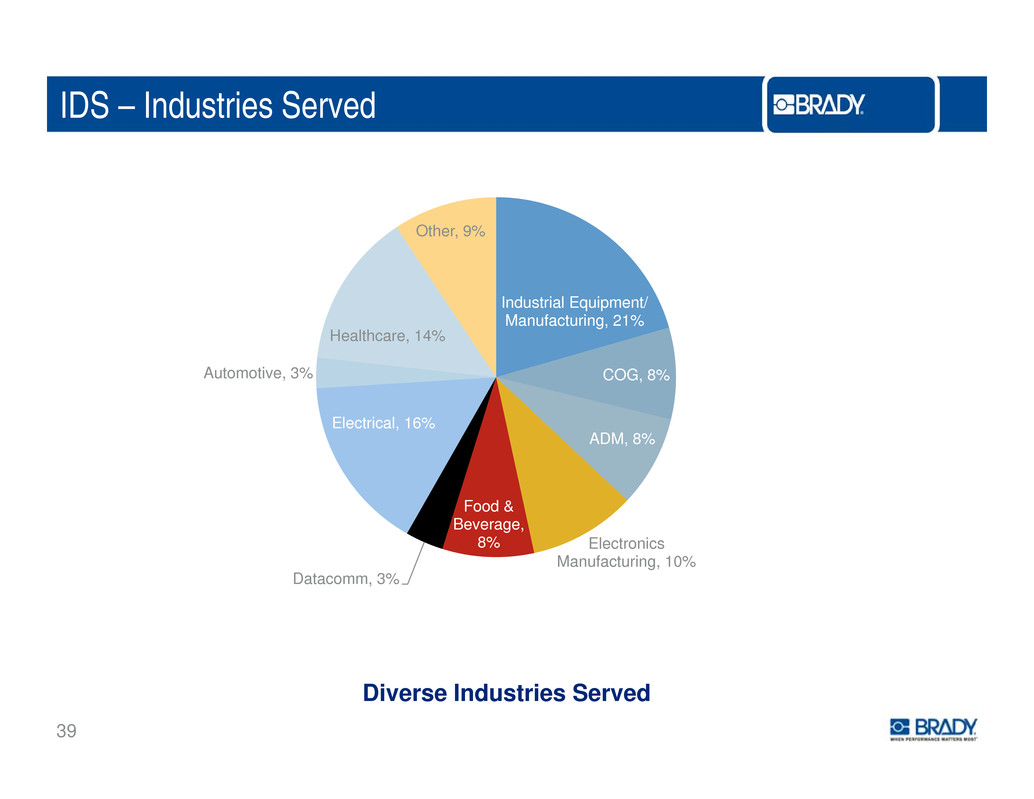
IDS – Industries Served Other, 9% Industry Breakdown Industrial Equipment/ Manufacturing, 21% Healthcare, 14% COG, 8% ADM, 8% Electrical, 16% Automotive, 3% Electronics Food & Beverage, 8% Manufacturing, 10% Datacomm, 3% 39 Diverse Industries Served
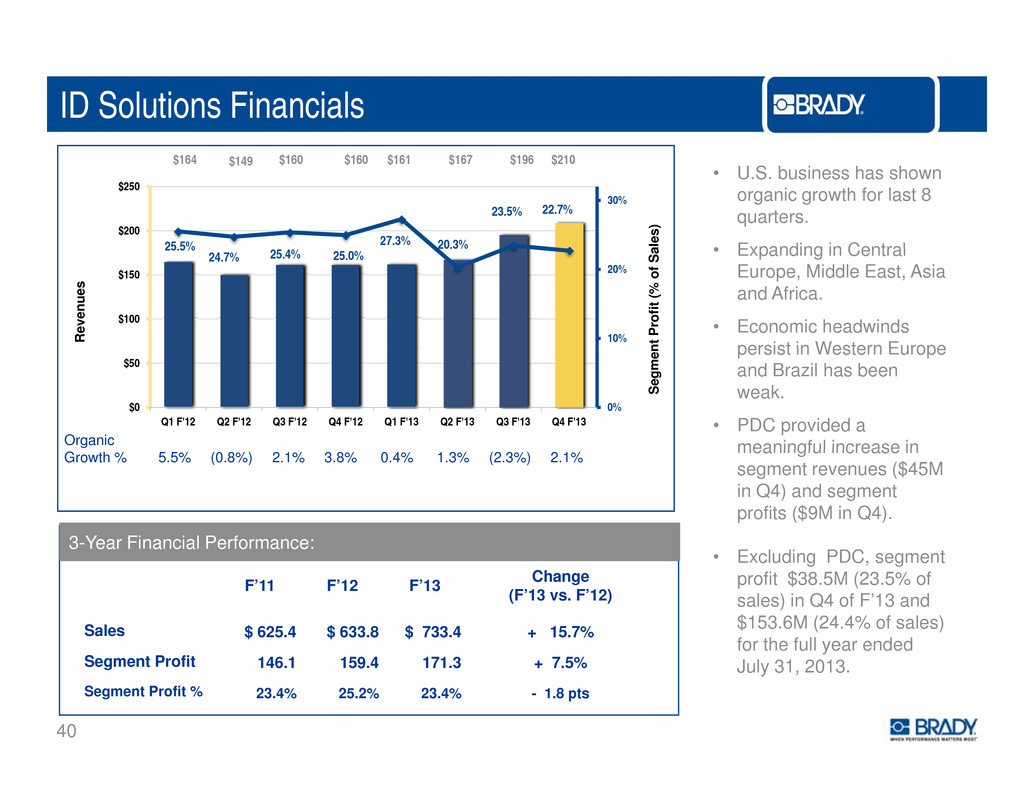
ID Solutions Financials a l e s ) • U.S. business has shown organic growth for last 8 quarters. • Expanding in Central $164 $149 $160 $160 $161 $167 $196 $210 25 5% 27.3% 20.3% 23.5% 22.7% 30% $200 $250 R e v e n u e s n t P r o f i t ( % o f S a Europe, Middle East, Asia and Africa. • Economic headwinds persist in Western Europe . 24.7% 25.4% 25.0% 10% 20% $100 $150 S e g m e n and Brazil has been weak. • PDC provided a meaningful increase inOrganic 0%$0 $50 Q1 F'12 Q2 F'12 Q3 F'12 Q4 F'12 Q1 F'13 Q2 F'13 Q3 F'13 Q4 F'13 3-Year Financial Performance: meaningfu segment revenues ($45M in Q4) and segment profits ($9M in Q4). E l di PDC t Growth % 5.5% (0.8%) 2.1% 3.8% 0.4% 1.3% (2.3%) 2.1% F’11 F’12 F’13 Change(F’13 vs. F’12) Sales $ 625.4 $ 633.8 $ 733.4 + 15.7% • xc u ng , segmen profit $38.5M (23.5% of sales) in Q4 of F’13 and $153.6M (24.4% of sales) for the full year ended 40 Segment Profit 146.1 159.4 171.3 + 7.5% Segment Profit % 23.4% 25.2% 23.4% - 1.8 pts July 31, 2013.
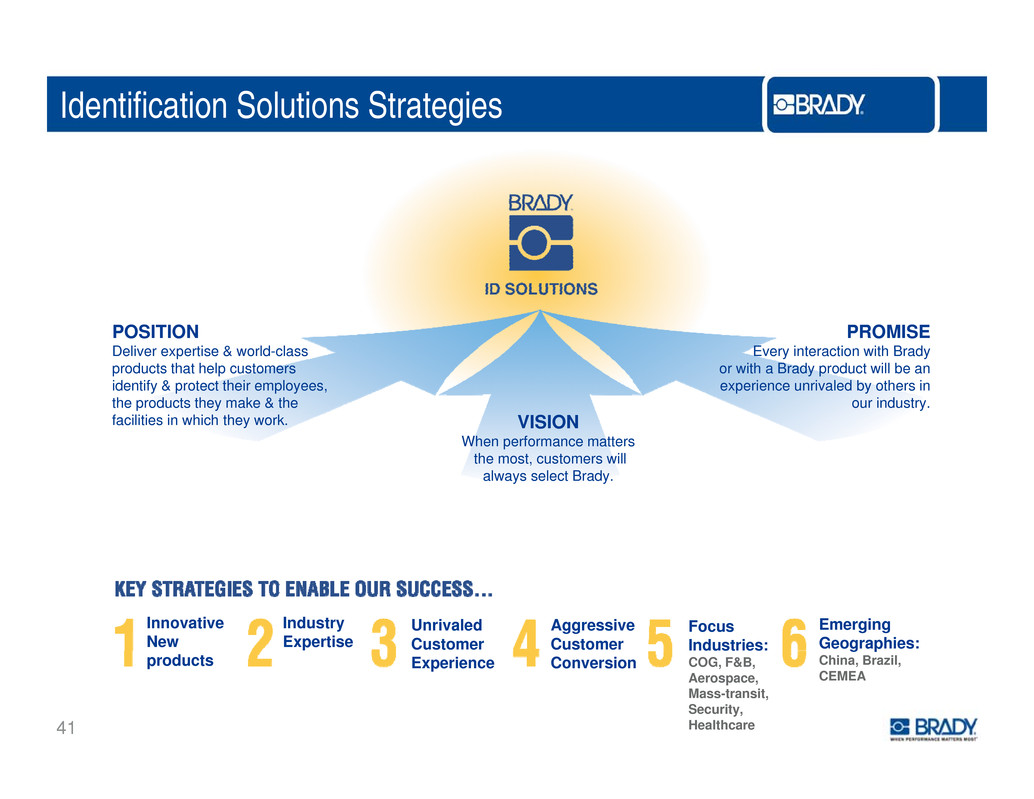
Identification Solutions Strategies POSITION Deliver expertise & world class PROMISE Every interaction with Brady - products that help customers identify & protect their employees, the products they make & the facilities in which they work. or with a Brady product will be an experience unrivaled by others in our industry. VISION When performance matters the most, customers will always select Brady. Innovative New Industry Expertise Focus Industries: Unrivaled Customer Aggressive Customer Emerging Geographies: products COG, F&B, Aerospace, Mass-transit, Security, Healthcare Experience Conversion China, Brazil, CEMEA 41
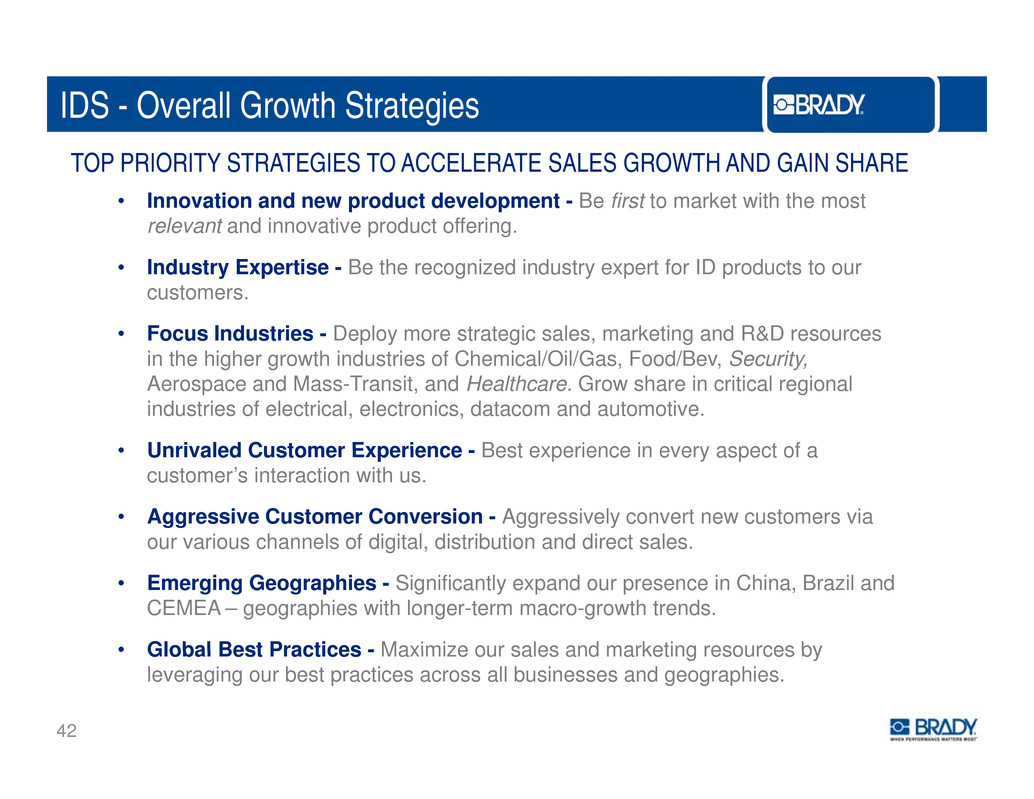
IDS - Overall Growth Strategies TOP PRIORITY STRATEGIES TO ACCELERATE SALES GROWTH AND GAIN SHARE • Innovation and new product development - Be first to market with the most relevant and innovative product offering. • Industry Expertise - Be the recognized industry expert for ID products to our customers. • Focus Industries - Deploy more strategic sales, marketing and R&D resources in the higher growth industries of Chemical/Oil/Gas, Food/Bev, Security, Aerospace and Mass-Transit, and Healthcare. Grow share in critical regional industries of electrical, electronics, datacom and automotive. • Unrivaled Customer Experience Best experience in every aspect of a - customer’s interaction with us. • Aggressive Customer Conversion - Aggressively convert new customers via our various channels of digital, distribution and direct sales. • Emerging Geographies - Significantly expand our presence in China, Brazil and CEMEA – geographies with longer-term macro-growth trends. • Global Best Practices - Maximize our sales and marketing resources by 42 leveraging our best practices across all businesses and geographies.
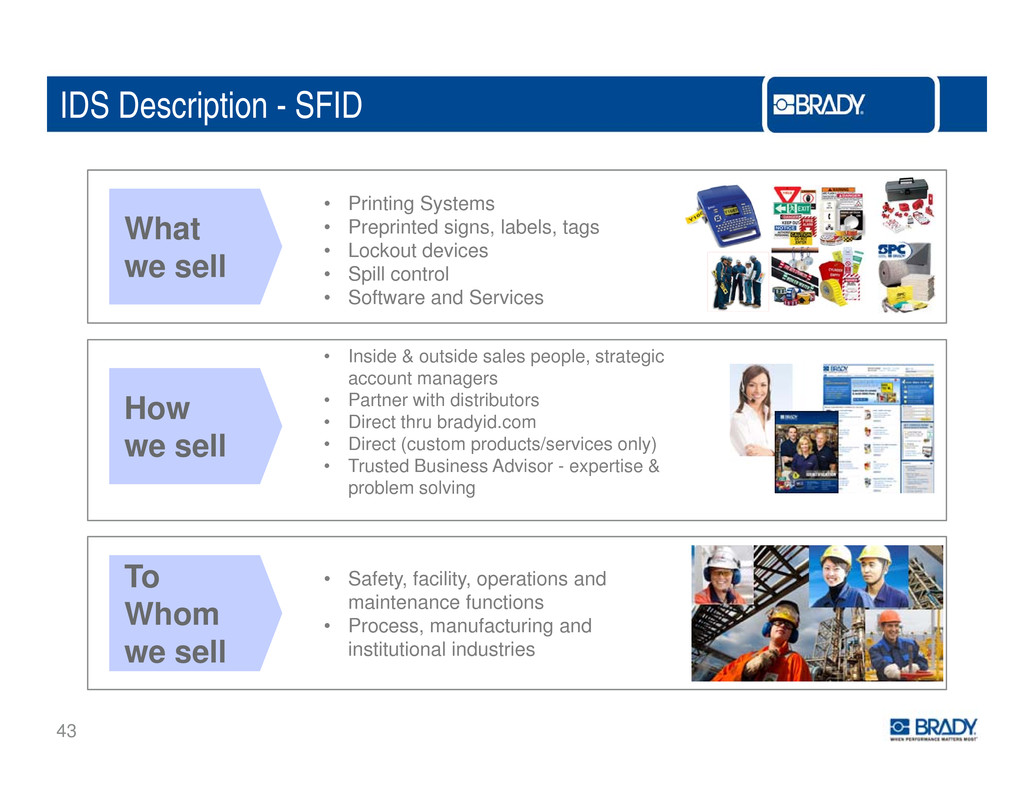
IDS Description - SFID What • Printing Systems • Preprinted signs, labels, tags • Lockout devices we sell • Spill control • Software and Services & How we sell • Inside outside sales people, strategic account managers • Partner with distributors • Direct thru bradyid.com • Direct (custom products/services only) products/service • Trusted Business Advisor - expertise & problem solving To Whom we sell • Safety, facility, operations and maintenance functions • Process, manufacturing and institutional industries 43

SFID Growth Strategy WHAT HOW Be the leading expert for specific workplace safety issues in focus Gaining Expertise: • Expand Industry Marketing, Global Product industries and geographies Marketing, Strategic Acct Managers • Customer Councils • Build a Global Knowledge Center Demonstrating Expertise globally: • Expand bradyid.com • Add & train distribution • Strategic Accounts in all regions Innovative Product Offering Execute on Localized Products… • NPI (synergies with WPS ID products, PCM & Production Capabilities) and NPD • SKU rich website & catalog Scale Software and Services: • Comprehensive solutions on customers critical business issues 44
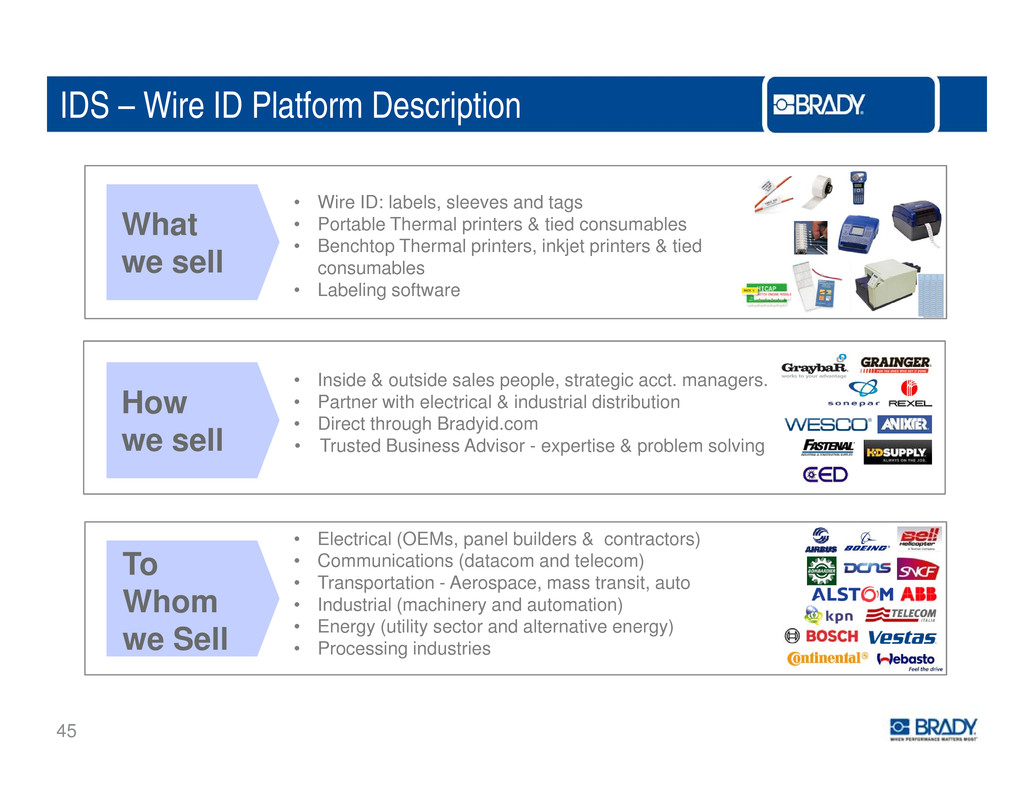
IDS – Wire ID Platform Description What • Wire ID: labels, sleeves and tags • Portable Thermal printers & tied consumables • Benchtop Thermal printers inkjet printers & tied we sell , consumables • Labeling software How we sell • Inside & outside sales people, strategic acct. managers. • Partner with electrical & industrial distribution • Direct through Bradyid.com • Trusted Business Advisor - expertise & problem solving • Electrical (OEMs, panel builders & contractors) • Communications (datacom and telecom) • Transportation - Aerospace, mass transit, auto • Industrial (machinery and automation) • Energy (utility sector and alternative energy) • Processing industries To Whom we Sell 45
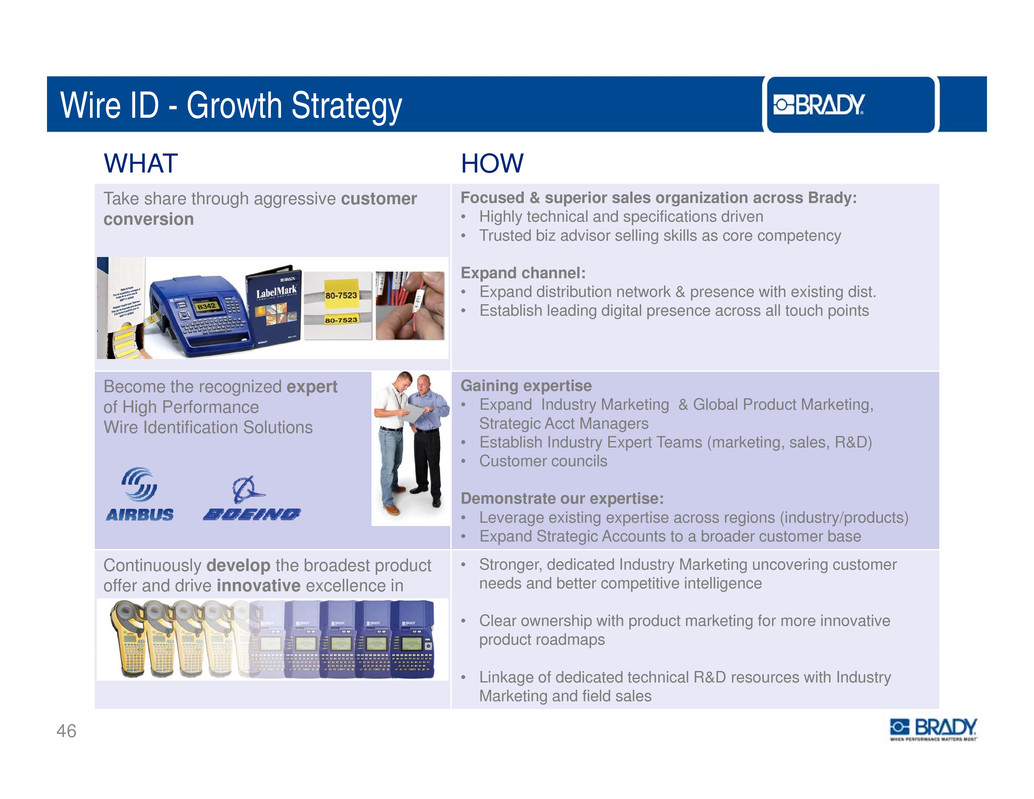
Wire ID - Growth Strategy WHAT HOW Take share through aggressive customer conversion Focused & superior sales organization across Brady: • Highly technical and specifications driven • Trusted biz advisor selling skills as core competency Expand channel: • Expand distribution network & presence with existing dist. • Establish leading digital presence across all touch points Become the recognized expert of High Performance Wire Identification Solutions Gaining expertise • Expand Industry Marketing & Global Product Marketing, Strategic Acct Managers • Establish Industry Expert Teams (marketing, sales, R&D) • Customer councils Demonstrate our expertise: • Leverage existing expertise across regions (industry/products) • Expand Strategic Accounts to a broader customer base Continuously develop the broadest product offer and drive innovative excellence in hassle free printing systems • Stronger, dedicated Industry Marketing uncovering customer needs and better competitive intelligence • Clear ownership with product marketing for more innovative product roadmaps 46 • Linkage of dedicated technical R&D resources with Industry Marketing and field sales

IDS – Product ID Platform Description • Traceability ID - Print on demand (“POD”): High performance film labels and printing systems, incorporating barcodes, serialization or RFID S it ID S l d l b l f ti t f iti What we sell • ecur y - ea s an a e s or an -coun er e ng and supply chain control (includes brand protection) • Inform ID - Pre-printed labels/nameplates (used to identify, promote, brand or inform), and dynamic/sensing that are functional (i.e. moisture, water, etc.). Di t S l F I id & t id l l St t i A t How we sell • rec a es orce - ns e ou s e sa es peop e, ra eg c ccoun Managers selling to design and mfg. engineers, global brand owners • Channels - Distribution, direct • Trusted Business Advisor - Expertise & problem solving • OEMs - Industrial, electrical, electronic, auto, medical & aerospace/mass- transit.To Whom we 47 • Labs - Research, clinical, governmentSell

Product ID Growth Strategy WHAT HOW Take share in the traceability segment and grow brand protection to emerge as the global leader • Align commercial organization: • Dedicated experts in sales, marketing and customer service • Expand offering to include new technology such as RFID • Establish leading digital presence across all touch points Breakthrough innovation around print on demand materials and hassle free printing systems • Localize existing products in emerging geo’s & develop breakthrough innovation around: • Durable solutions (i e ribbonless) . . • Active ID (ie. RFID, sensing) • High speed print-cut-on-demand • Mobile/cloud & software A highly efficient label printer and convertor for the Inform segment. • Selectively invest in world-class mfg capabilities: • Customization • High-performing printing • Color matching 48 • Prototyping

IDS – Strategic Initiatives Summary DRIVING STRATEGIC INITIATIVES • Innovation and New Product Development ACTIONS • Improve front-end marketing, plus R&D processes to commercialize more • Digital innovative products faster. Increase new product pipeline & sales. • Increase the ability to find & buy Brady products for end users, ease of doing P i i t t d d t iti i business for distributors. Increased direct digital sales & by Brady’s distributors. • Provide consistent market-based pricing & • r c ng s ra egy an pro uc pos on ng • Strategic accounts implement common processes to maximize share & organic sales. • Implement a comprehensive program to an expanded set of OEM and MRO accounts to • Client Services increase sales to strategic accounts. • Expand services offering to customers globally, focused on critical business & 49 safety issues. Increased sale of services sales & improved customer satisfaction.

P l ID d PDCeop e an 50
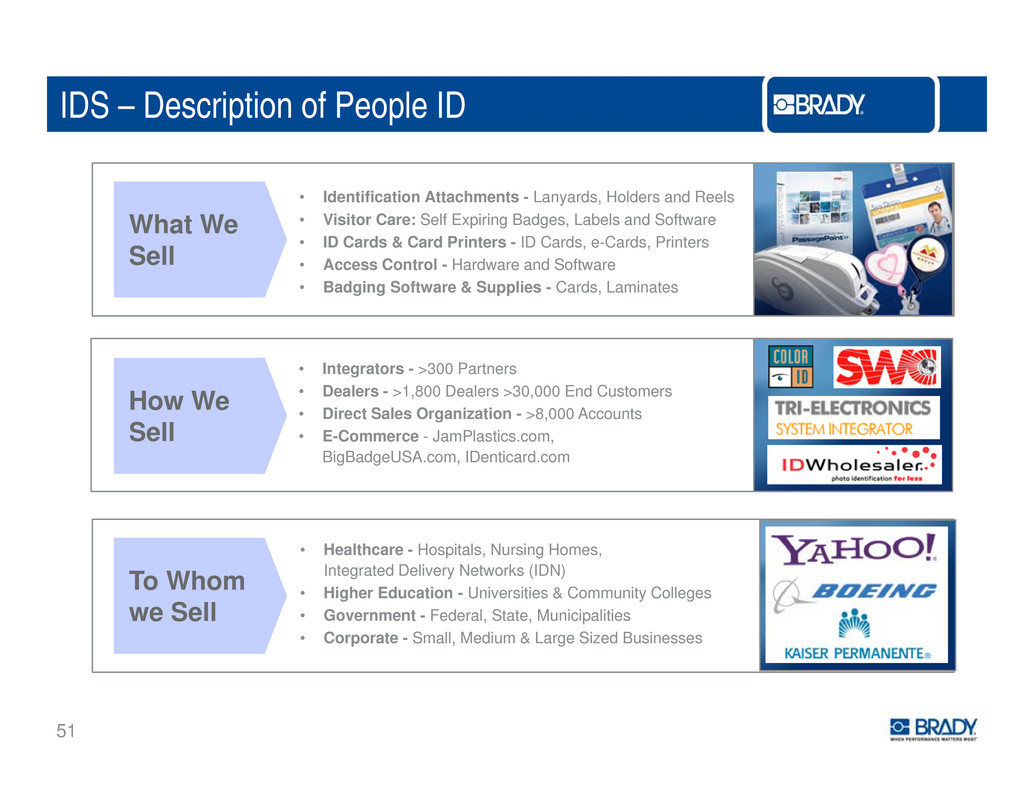
IDS – Description of People ID What We S ll • Identification Attachments - Lanyards, Holders and Reels • Visitor Care: Self Expiring Badges, Labels and Software • ID Cards & Card Printers - ID Cards, e-Cards, Printers e • Access Control - Hardware and Software • Badging Software & Supplies - Cards, Laminates How We Sell • Integrators - >300 Partners • Dealers - >1,800 Dealers >30,000 End Customers • Direct Sales Organization - >8,000 Accounts • E-Commerce - JamPlastics.com, BigBadgeUSA.com, IDenticard.com • Healthcare - Hospitals Nursing Homes To Whom we Sell , , Integrated Delivery Networks (IDN) • Higher Education - Universities & Community Colleges • Government - Federal, State, Municipalities • Corporate - Small, Medium & Large Sized Businesses 51
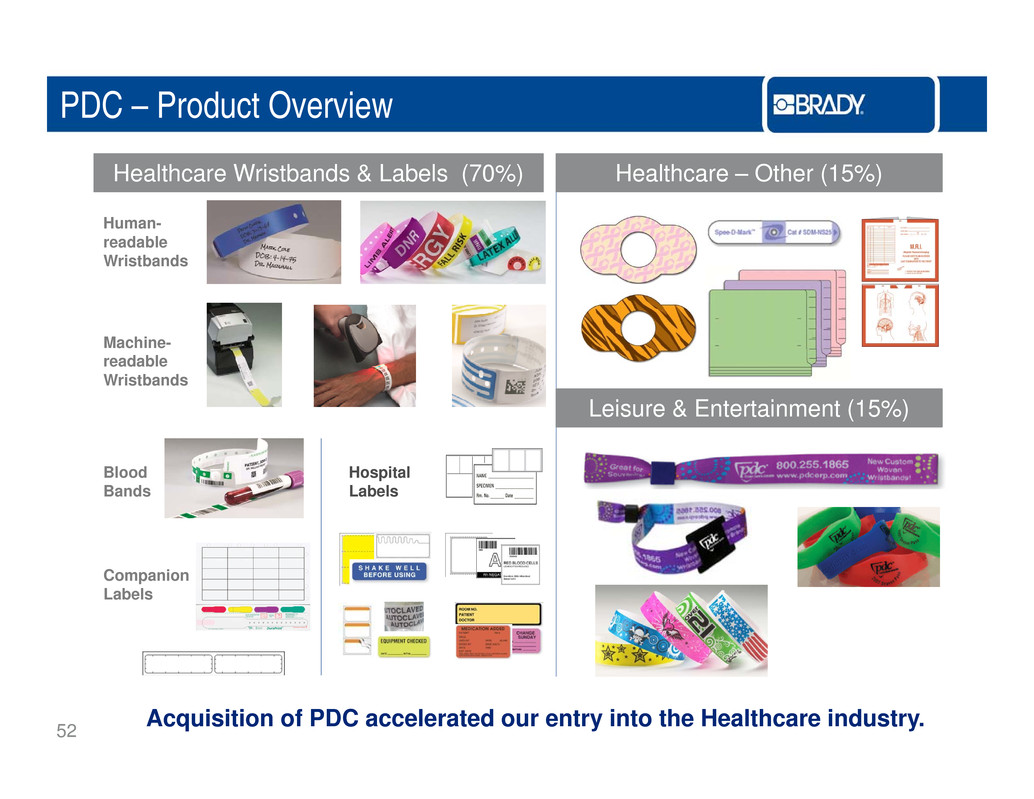
PDC – Product Overview Human- readable Healthcare Wristbands & Labels (70%) Healthcare – Other (15%) Wristbands Machine- readable Wristbands Leisure & Entertainment (15%) Blood Bands Hospital Labels Companion Labels 52 Acquisition of PDC accelerated our entry into the Healthcare industry.
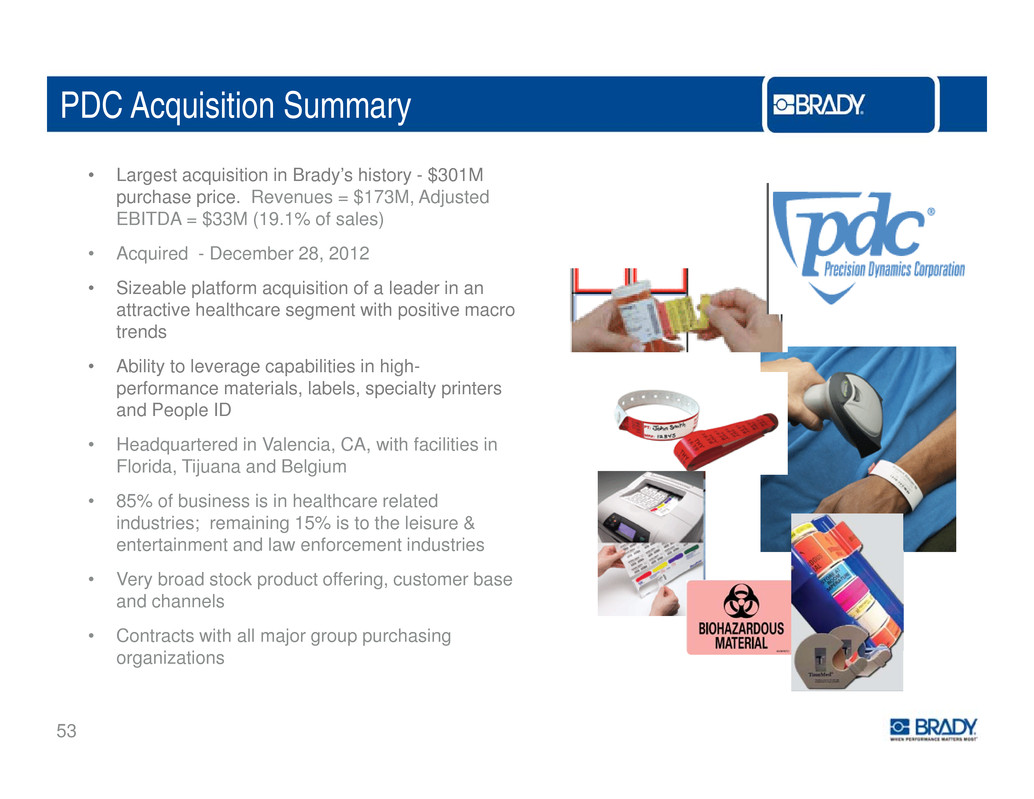
PDC Acquisition Summary • Largest acquisition in Brady’s history - $301M purchase price. Revenues = $173M, Adjusted EBITDA = $33M (19.1% of sales) A i d D b 28 2012• cqu re - ecem er , • Sizeable platform acquisition of a leader in an attractive healthcare segment with positive macro trends • Ability to leverage capabilities in high- performance materials, labels, specialty printers and People ID • Headquartered in Valencia, CA, with facilities in Florida, Tijuana and Belgium • 85% of business is in healthcare related industries; remaining 15% is to the leisure & entertainment and law enforcement industries enforcemen • Very broad stock product offering, customer base and channels • Contracts with all major group purchasing i ti 53 organ za ons
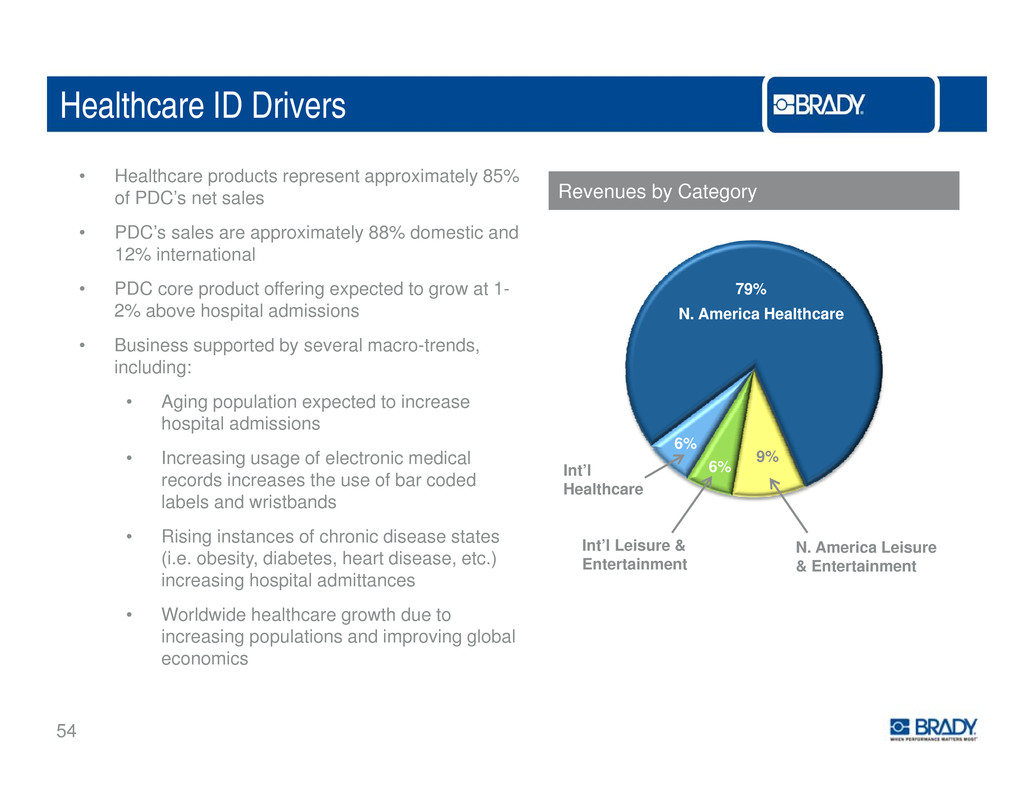
Healthcare ID Drivers • Healthcare products represent approximately 85% of PDC’s net sales • PDC’s sales are approximately 88% domestic and 12% i t ti l Revenues by Category n erna ona • PDC core product offering expected to grow at 1- 2% above hospital admissions • Business supported by several macro-trends 79% N. America Healthcare , including: • Aging population expected to increase hospital admissions 6% • Increasing usage of electronic medical records increases the use of bar coded labels and wristbands • Rising instances of chronic disease states 9% 6%Int’l Healthcare N America LeisureInt’l Leisure & (i.e. obesity, diabetes, heart disease, etc.) increasing hospital admittances • Worldwide healthcare growth due to increasing populations and improving global . & Entertainment Entertainment 54 economics
Healthcare ID Growth Strategies • PDC/Brady Acquisition – Acquisition by Brady provides growth opportunities for PDC. • Moderate opportunities in the Americas • Expansion opportunities in Europe and Asia • New Products – Reinvigorating new product development • Digital – Opportunities to reach customers with new web platform, custom-product configuration and search optimization. • Business Development – Opportunities to work with partners and other healthcare products/services companies to drive new products and incremental revenue. • External Focus – Following multiple internally-focused efforts (previous acquisition, Brady integration & implementing a new ERP in May), now focusing externally. • How are we Improving Profitability? • Integration savings achieved in the last 8 months Sit lid ti i Tij i F’14 d F’15• e conso a on n uana n an • Site consolidation / leverage in Europe and Asia should enable cost savings from scale, but also drive revenue through local production and custom capabilities 55 PDC is expected to deliver at the high-end of original EPS range.
Q&A 56
B krea 57
FINANCIAL UPDATE Tom Felmer Senior Vice President 58 Chief Financial Officer
Financial Overview • In business nearly 100 years • Sustainable history of strong financial results. • Consistent free cash flow in excess of net income. Long-Term Stability Strong Balance Sheet & Capital Allocation • Debt/EBITDA of 1.7x at July 31, 2013. • Reorganized & investing to accelerate organic growth. • F’14 is the 28th consecutive year of dividend increases. • Opportunistic share buybacks. • Acquisitions are a tool to drive our IDS & WPS strategies. St L T R lt • Revenues have doubled since F’03. • Net earnings* up 3.5x since F’03. = rong ong- erm esu s • -2.6% organic sales decline in F’13. • WPS organic sales down 7.0%. • F’14 guidance effectively flat with F’13 results HOWEVER, There are Near-Term Challenges 59 . • F’14 is a year of transition and transformation. * F’13 represents non-GAAP net income. See non-GAAP reconciliations in appendix.
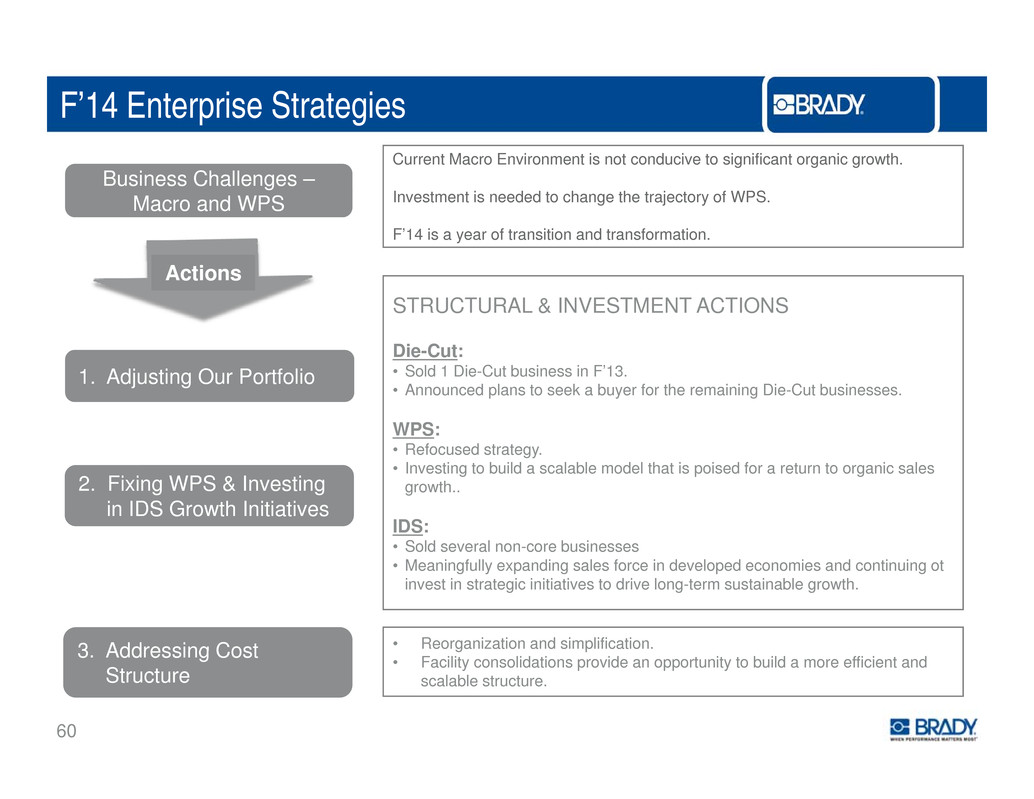
F’14 Enterprise Strategies Business Challenges – Macro and WPS Current Macro Environment is not conducive to significant organic growth. Investment is needed to change the trajectory of WPS. F’14 is a year of transition and transformation. STRUCTURAL & INVESTMENT ACTIONS Die Cut: Actions - • Sold 1 Die-Cut business in F’13. • Announced plans to seek a buyer for the remaining Die-Cut businesses. WPS: • Refocused strategy 1. Adjusting Our Portfolio . • Investing to build a scalable model that is poised for a return to organic sales growth.. IDS: • Sold several non-core businesses 2. Fixing WPS & Investing in IDS Growth Initiatives • Meaningfully expanding sales force in developed economies and continuing ot invest in strategic initiatives to drive long-term sustainable growth. • Reorganization and simplification.3 Addressing Cost 60 • Facility consolidations provide an opportunity to build a more efficient and scalable structure. . Structure
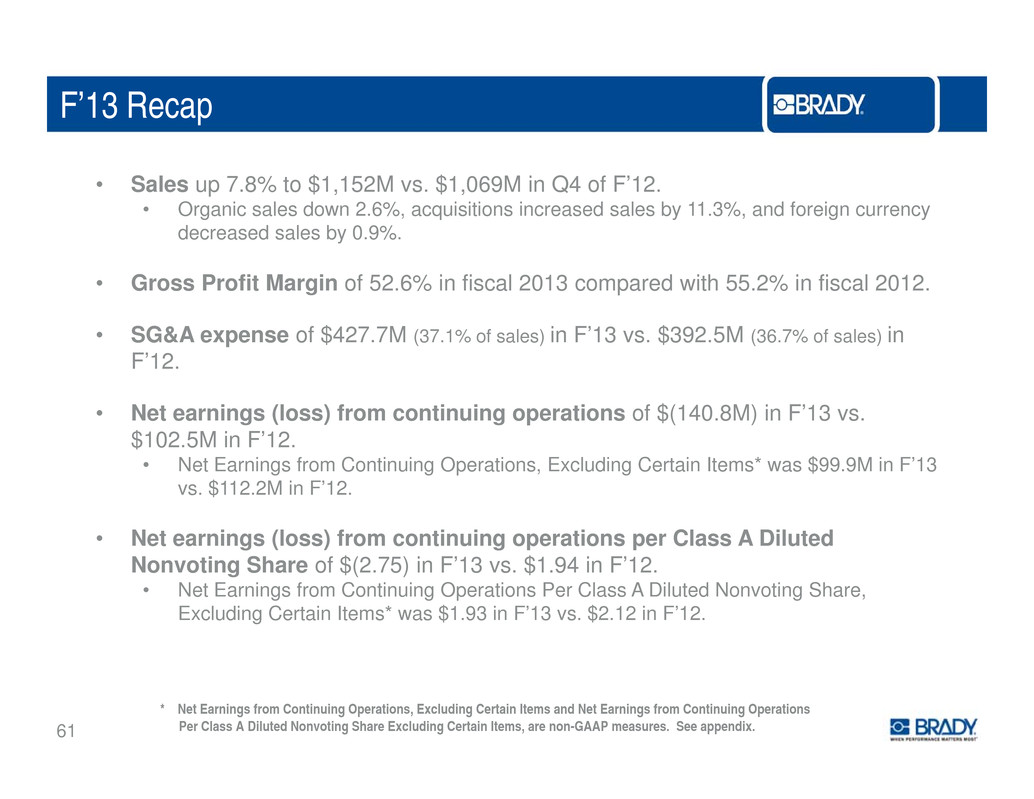
F’13 Recap • Sales up 7.8% to $1,152M vs. $1,069M in Q4 of F’12. • Organic sales down 2.6%, acquisitions increased sales by 11.3%, and foreign currency decreased sales by 0.9%. • Gross Profit Margin of 52.6% in fiscal 2013 compared with 55.2% in fiscal 2012. • SG&A expense of $427.7M (37.1% of sales) in F’13 vs. $392.5M (36.7% of sales) in F’12. • Net earnings (loss) from continuing operations of $(140.8M) in F’13 vs. $102.5M in F’12. • Net Earnings from Continuing Operations, Excluding Certain Items* was $99.9M in F’13 vs. $112.2M in F’12. • Net earnings (loss) from continuing operations per Class A Diluted Nonvoting Share of $(2.75) in F’13 vs. $1.94 in F’12. • Net Earnings from Continuing Operations Per Class A Diluted Nonvoting Share, Excluding Certain Items* was $1.93 in F’13 vs. $2.12 in F’12. 61 * Net Earnings from Continuing Operations, Excluding Certain Items and Net Earnings from Continuing Operations Per Class A Diluted Nonvoting Share Excluding Certain Items, are non-GAAP measures. See appendix.
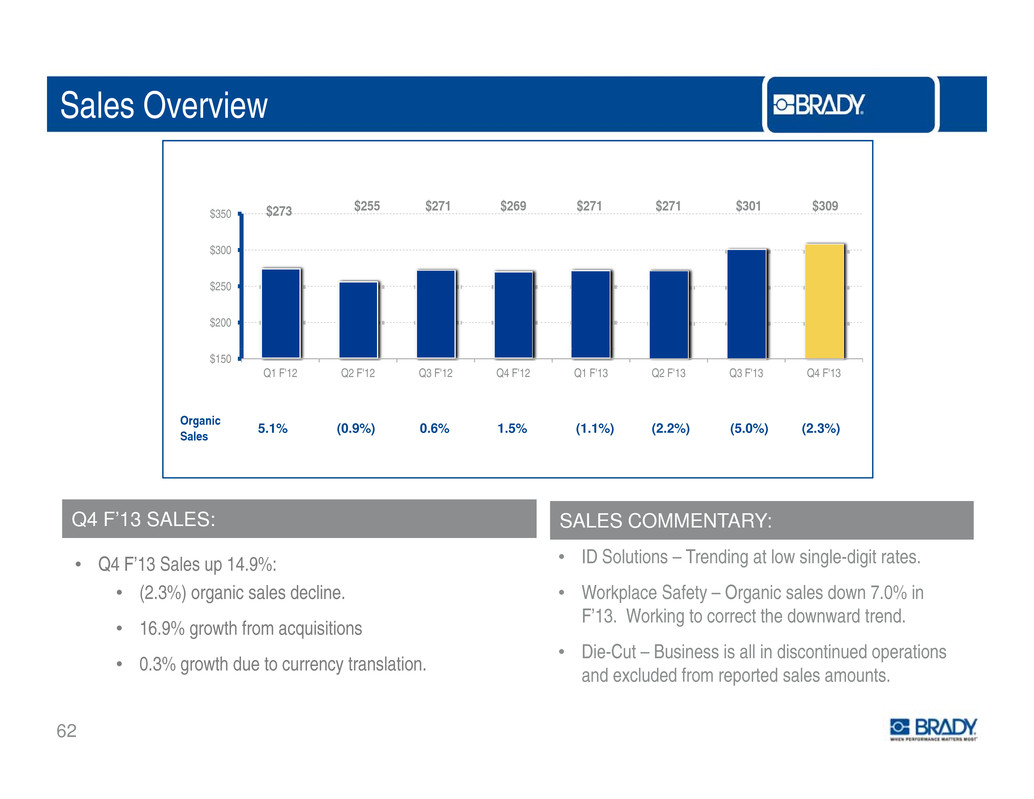
Sales Overview $273 $255 $271 $269 $271 $271 $301 $309 $300 $350 $200 $250 $150 Q1 F'12 Q2 F'12 Q3 F'12 Q4 F'12 Q1 F'13 Q2 F'13 Q3 F'13 Q4 F'13 Organic Sales 5.1% (0.9%) 0.6% 1.5% (1.1%) (2.2%) (5.0%) (2.3%) ID S l ti T di t l i l di it t Q4 F’13 SALES: SALES COMMENTARY: • Q4 F’13 Sales up 14.9%: • (2.3%) organic sales decline. • 16.9% growth from acquisitions • o u ons – ren ng at ow s ng e- g ra es. • Workplace Safety – Organic sales down 7.0% in F’13. Working to correct the downward trend. • Die Cut Business is all in discontinued operations 62 • 0.3% growth due to currency translation. - –and excluded from reported sales amounts.
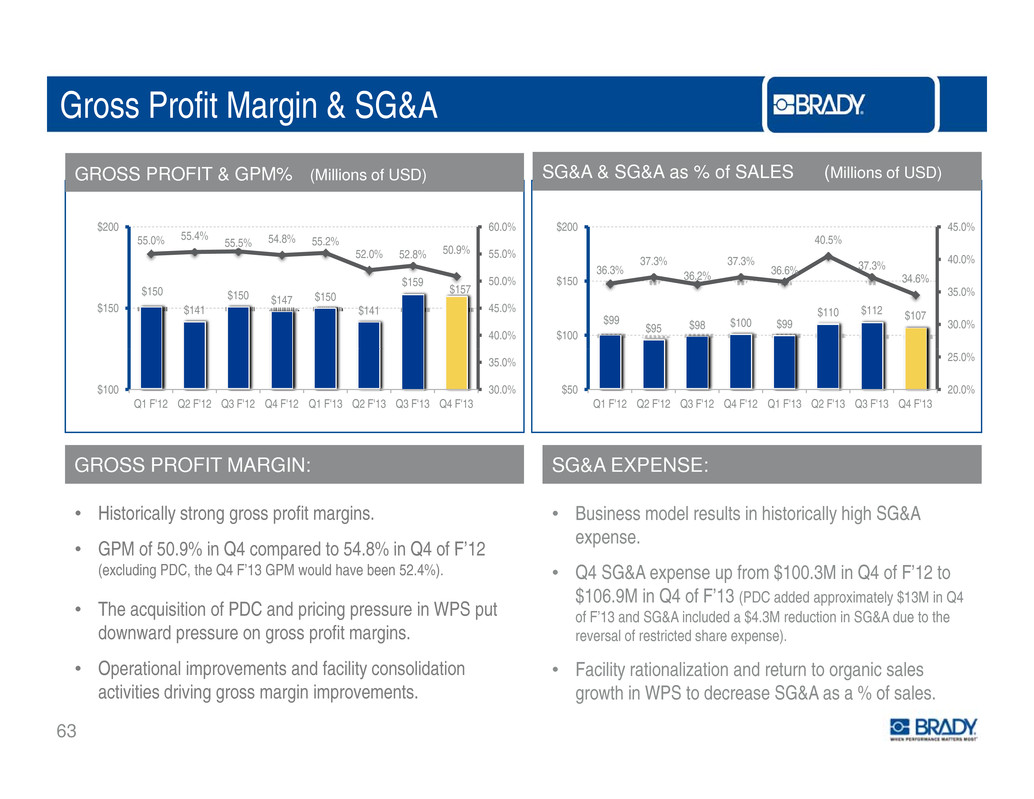
Gross Profit Margin & SG&A 40.5% 45.0%$200 GROSS PROFIT & GPM% (Millions of USD) SG&A & SG&A as % of SALES (Millions of USD) 55.0% 55.4% 55.5% 54.8% 55.2% 50 9% 60.0%$200 $99 $95 $98 $100 $99 $110 $112 $107 36.3% 37.3% 36.2% 37.3% 36.6% 37.3% 34.6% 30.0% 35.0% 40.0% $100 $150 $150 $141 $150 $147 $150 $141 $159 $157 52.0% 52.8% . 40.0% 45.0% 50.0% 55.0% $150 20.0% 25.0% $50 Q1 F'12 Q2 F'12 Q3 F'12 Q4 F'12 Q1 F'13 Q2 F'13 Q3 F'13 Q4 F'13 30.0% 35.0% $100 Q1 F'12 Q2 F'12 Q3 F'12 Q4 F'12 Q1 F'13 Q2 F'13 Q3 F'13 Q4 F'13 • Historically strong gross profit margins. • GPM of 50 9% in Q4 compared to 54 8% in Q4 of F’12 GROSS PROFIT MARGIN: • Business model results in historically high SG&A expense. SG&A EXPENSE: . in Q4 compared to .8% in Q4 of (excluding PDC, the Q4 F’13 GPM would have been 52.4%). • The acquisition of PDC and pricing pressure in WPS put downward pressure on gross profit margins. • Q4 SG&A expense up from $100.3M in Q4 of F’12 to $106.9M in Q4 of F’13 (PDC added approximately $13M in Q4 of F’13 and SG&A included a $4.3M reduction in SG&A due to the reversal of restricted share expense). 63 • Operational improvements and facility consolidation activities driving gross margin improvements. • Facility rationalization and return to organic sales growth in WPS to decrease SG&A as a % of sales.

Net Earnings & EPS $ $ $29 $29 $26 15%$60 $0.53 $0.50 $0.55 $0.56 $0.50 $0.38 $0.54 $0.53 NET EARNINGS FROM CONTINUING OPERATION,S EXCLUDING CERTAIN ITEMS* (Millions of USD) NET EARNINGS FROM CONTINUING OPERATIONS PER CLASS A DILUTED NONVOTING SHARE, EXCLUDING CERTAIN ITEMS* 28 26 $19 $27 $28 10% 10% 11% 11% 9% 7% 9% 9% 9% 12% $30 $45 $0.60 0% 3% 6% $0 $15 $0 20 $0.40 Q1 F'12 Q2 F'12 Q3 F'12 Q4 F'12 Q1 F'13 Q2 F'13 Q3 F'13 Q4 F'13 . Q1 F'12 Q2 F'12 Q3 F'12 Q4 F'12 Q1 F'13 Q2 F'13 Q3 F'13 Q4 F'13 Q4 F’13 – Non-GAAP Earnings* Q4 F’13 – Non-GAAP EPS* • Q4 F’13 net earnings from continuing operations, excluding certain items* of $27.9M compared to $29.3M in Q4 of F’12. Both Q4 of F’12 and Q4 of F’13 benefited from low income • Q4 F’13 diluted EPS from continuing operations, excluding certain items* of $0.53 compared to $0.56 in Q4 of F’12. 64 • tax rates of 14% and 17%, respectively.
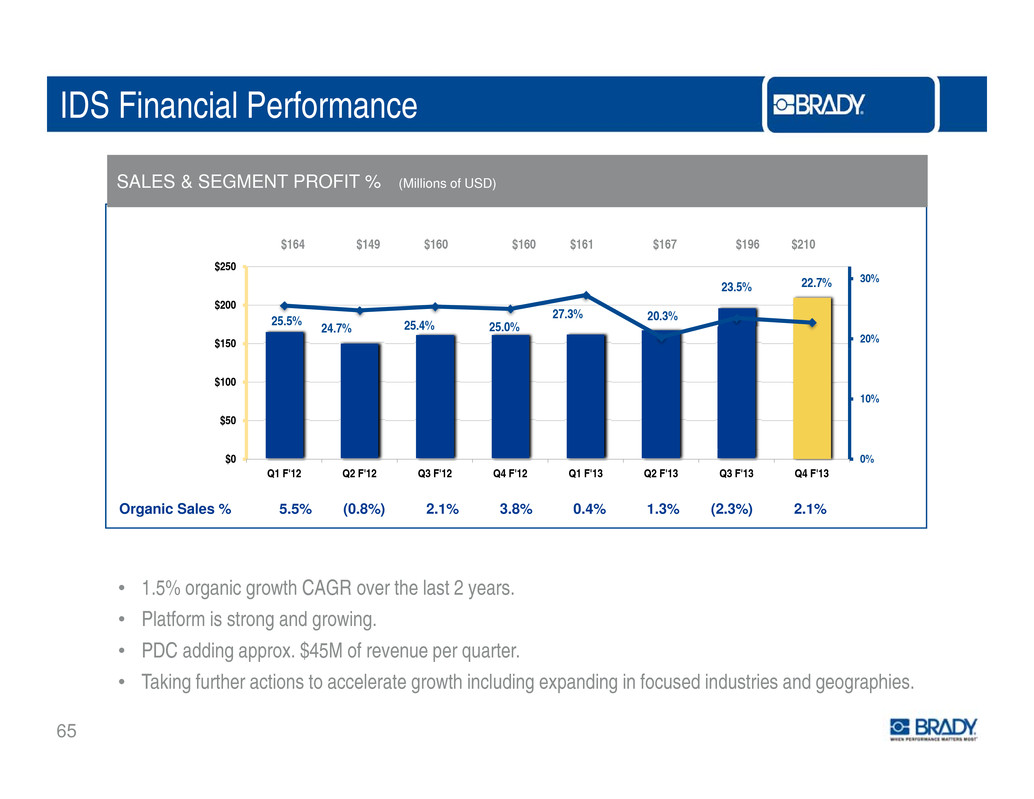
IDS Financial Performance $164 $149 $160 $160 $161 $167 $196 $210 SALES & SEGMENT PROFIT % (Millions of USD) 25.5% 24.7% 25.4% 25.0% 27.3% 20.3% 23.5% 22.7% 20% 30% $150 $200 $250 10% $50 $100 0%$0 Q1 F'12 Q2 F'12 Q3 F'12 Q4 F'12 Q1 F'13 Q2 F'13 Q3 F'13 Q4 F'13 Organic Sales % 5.5% (0.8%) 2.1% 3.8% 0.4% 1.3% (2.3%) 2.1% • 1.5% organic growth CAGR over the last 2 years. • Platform is strong and growing. • PDC adding approx $45M of revenue per quarter 65 . . • Taking further actions to accelerate growth including expanding in focused industries and geographies.

WPS Financial Performance SALES & SEGMENT PROFIT % (Millions of USD) $112 $106 $111 $109 $110 $104 $105 $100 30% 27.0% 26.9% 26.3% 26.8% 25.4% 22.6% 22.3% 20.5% 20% $150 10% $100 0%$50 Q1 F'12 Q2 F'12 Q3 F'12 Q4 F'12 Q1 F'13 Q2 F'13 Q3 F'13 Q4 F'13 Organic Sales % 4.4% (1.1%) (1.6%) (1.8%) (3.3%) (7.0%) (9.0%) (8.6%) • -3.6% organic decline CAGR over the last 2 years. • Accelerating rates of organic sales decline. • Segment profit as a % of sales declining due to economic weakness in key geographies reduced 66 ng due to economic weakness in key geographie , sales volumes, shift of customer buying patterns, and increased competition. • Actions are in progress and investments have been and will be made to turn this business around.
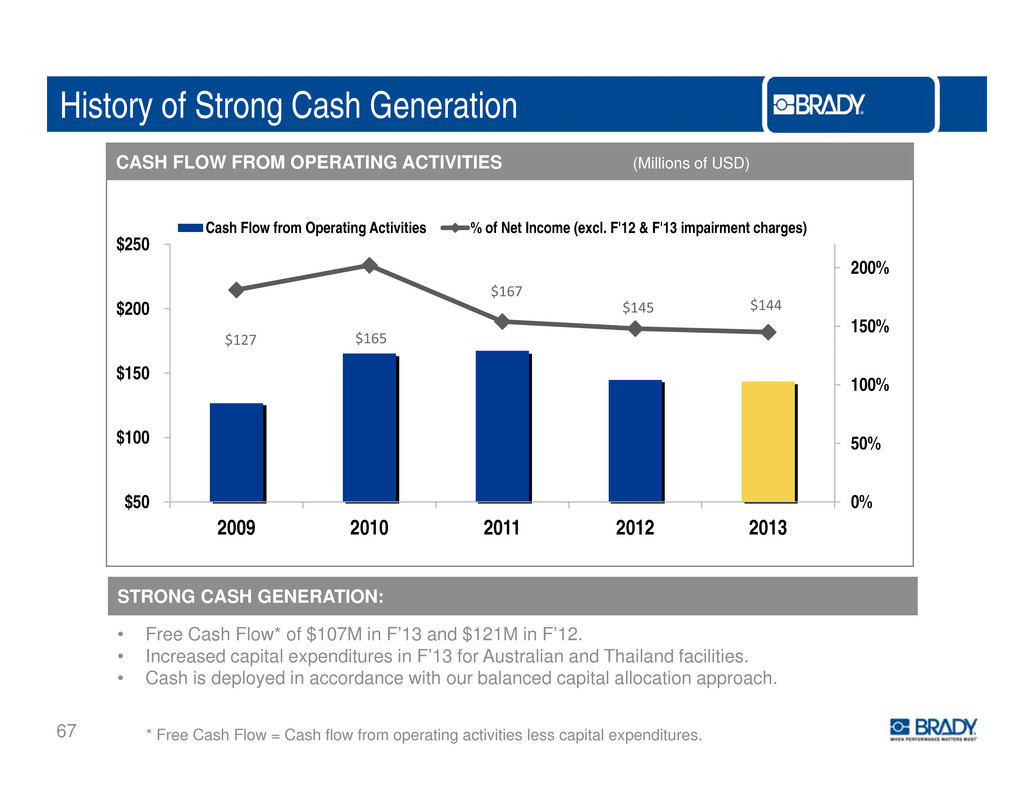
History of Strong Cash Generation $250 Cash Flow from Operating Activities % of Net Income (excl. F'12 & F'13 impairment charges) CASH FLOW FROM OPERATING ACTIVITIES (Millions of USD) $127 $165 $167 $145 $144 150% 200% $200 50% 100% $100 $150 0%$50 2009 2010 2011 2012 2013 • Free Cash Flow* of $107M in F’13 and $121M in F’12. I d it l dit i F’13 f A t li d Th il d f iliti STRONG CASH GENERATION: 67 • ncrease cap a expen ures n or us ra an an a an ac es. • Cash is deployed in accordance with our balanced capital allocation approach. * Free Cash Flow = Cash flow from operating activities less capital expenditures.
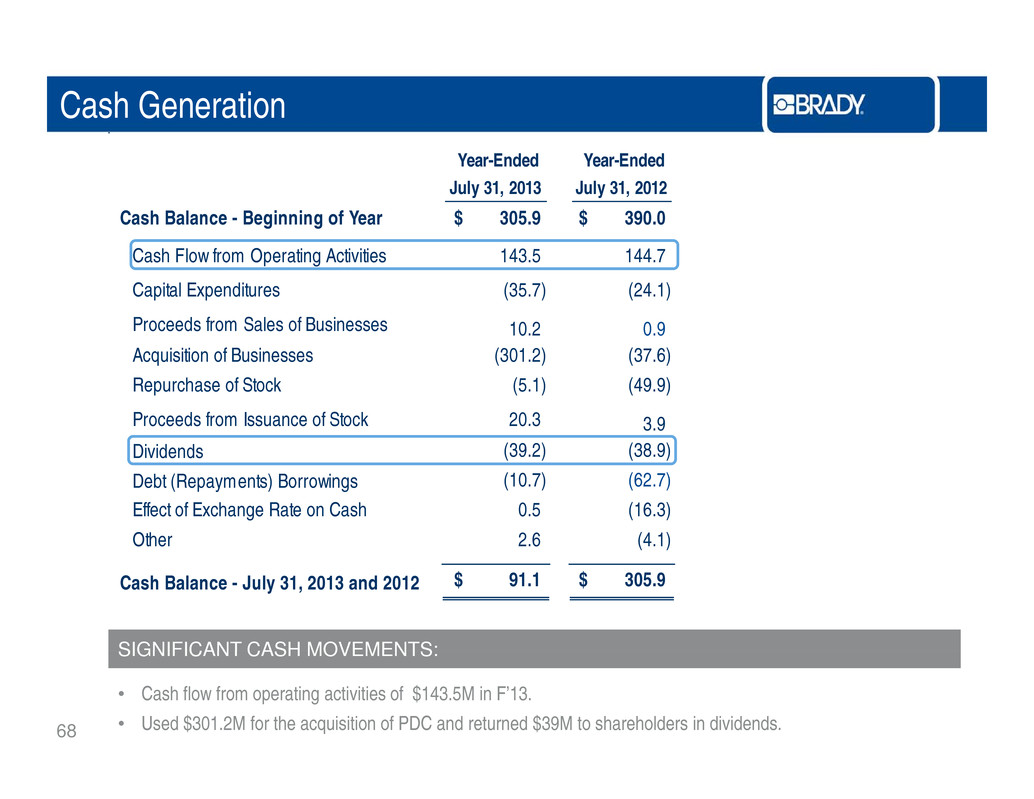
Cash Generation Year-Ended July 31, 2013 Year-Ended July 31, 2012 Cash Balance - Beginning of Year 305.9$ 390.0$ C f O 1 3 1ash Flow rom perating Activities 4 .5 44.7 Capital Expenditures (35.7) (24.1) Proceeds from Sales of Businesses 10.2 0.9 A i iti f B i (301 2) (37 6) cqu s on o us nesses . . Repurchase of Stock (5.1) (49.9) Proceeds from Issuance of Stock 20.3 3.9 Dividends (39 2) (38 9) . . Debt (Repayments) Borrowings (10.7) (62.7) Effect of Exchange Rate on Cash 0.5 (16.3) Other 2.6 (4.1) Cash Balance - July 31, 2013 and 2012 91.1$ 305.9$ SIGNIFICANT CASH MOVEMENTS: 68 • Cash flow from operating activities of $143.5M in F’13. • Used $301.2M for the acquisition of PDC and returned $39M to shareholders in dividends.
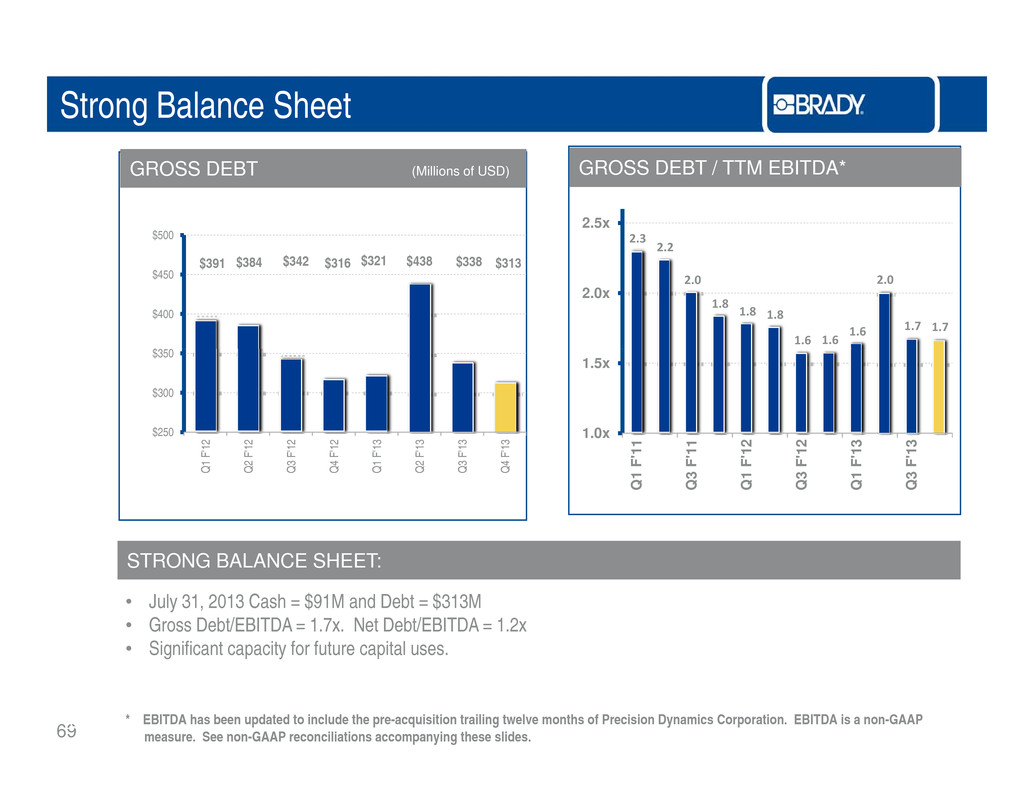
Strong Balance Sheet 2.3 2 2 2.5x GROSS DEBT / TTM EBITDA*GROSS DEBT (Millions of USD) $500 . 2.0 1.8 1.8 1.8 1.6 1.6 1.6 2.0 1.7 1.7 2.0x $391 $384 $342 $316 $321 $438 $338 $313 $3 0 $400 $450 1.0x 1.5x 1 1 1 1 1 2 1 2 1 3 1 3 $250 $300 5 1 2 1 2 1 2 1 2 1 3 1 3 1 3 1 3 Q 1 F ' 1 Q 3 F ' 1 Q 1 F ' 1 Q 3 F ' 1 Q 1 F ' 1 Q 3 F ' 1 Q 1 F ' Q 2 F ' Q 3 F ' Q 4 F ' Q 1 F ' Q 2 F ' Q 3 F ' Q 4 F ' • July 31, 2013 Cash = $91M and Debt = $313M • Gross Debt/EBITDA = 1.7x. Net Debt/EBITDA = 1.2x • Significant capacity for future capital uses STRONG BALANCE SHEET: 6969 . * EBITDA has been updated to include the pre-acquisition trailing twelve months of Precision Dynamics Corporation. EBITDA is a non-GAAP measure. See non-GAAP reconciliations accompanying these slides.
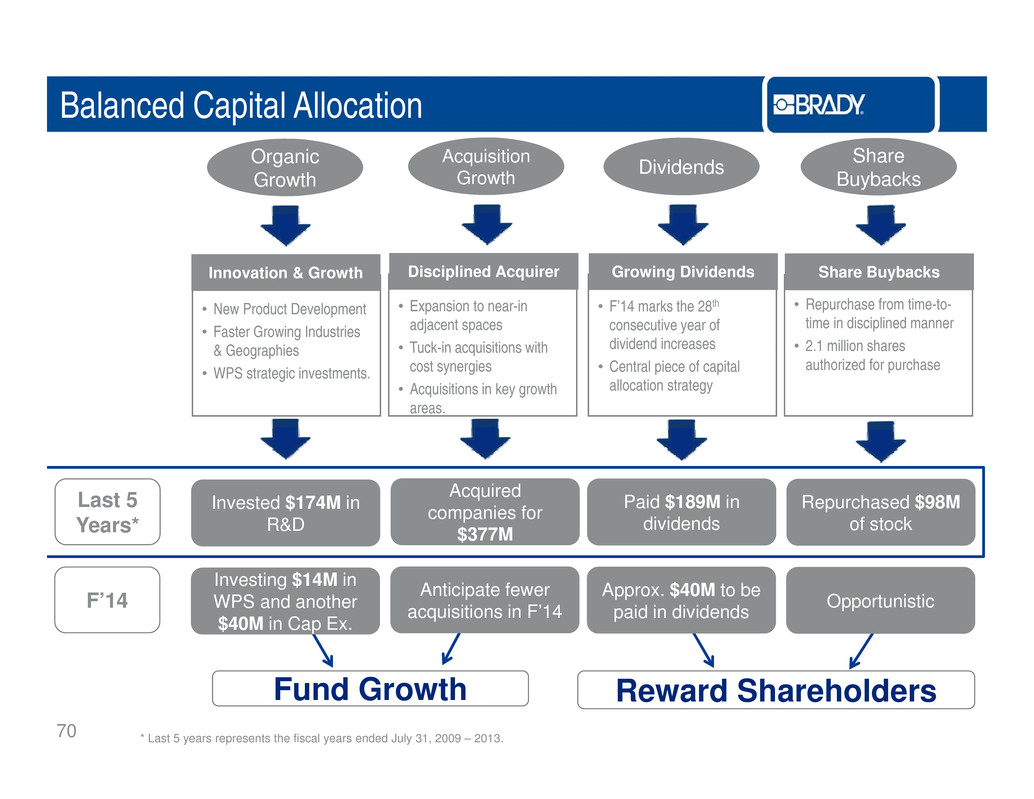
Balanced Capital Allocation Organic Growth Acquisition Growth Dividends Share Buybacks • New Product Development • Faster Growing Industries & Geographies Innovation & Growth • Expansion to near-in adjacent spaces • Tuck-in acquisitions with Disciplined Acquirer • F’14 marks the 28th consecutive year of dividend increases Growing Dividends • Repurchase from time-to- time in disciplined manner • 2 1 million shares Share Buybacks • WPS strategic investments. cost synergies • Acquisitions in key growth areas. • Central piece of capital allocation strategy . authorized for purchase Invested $174M in R&D Acquired companies for $377M Paid $189M in dividends Repurchased $98M of stock Last 5 Years* Investing $14M in WPS and another $40M in Cap Ex. Anticipate fewer acquisitions in F’14 Approx. $40M to be paid in dividends OpportunisticF’14 70 Fund Growth Reward Shareholders * Last 5 years represents the fiscal years ended July 31, 2009 – 2013.
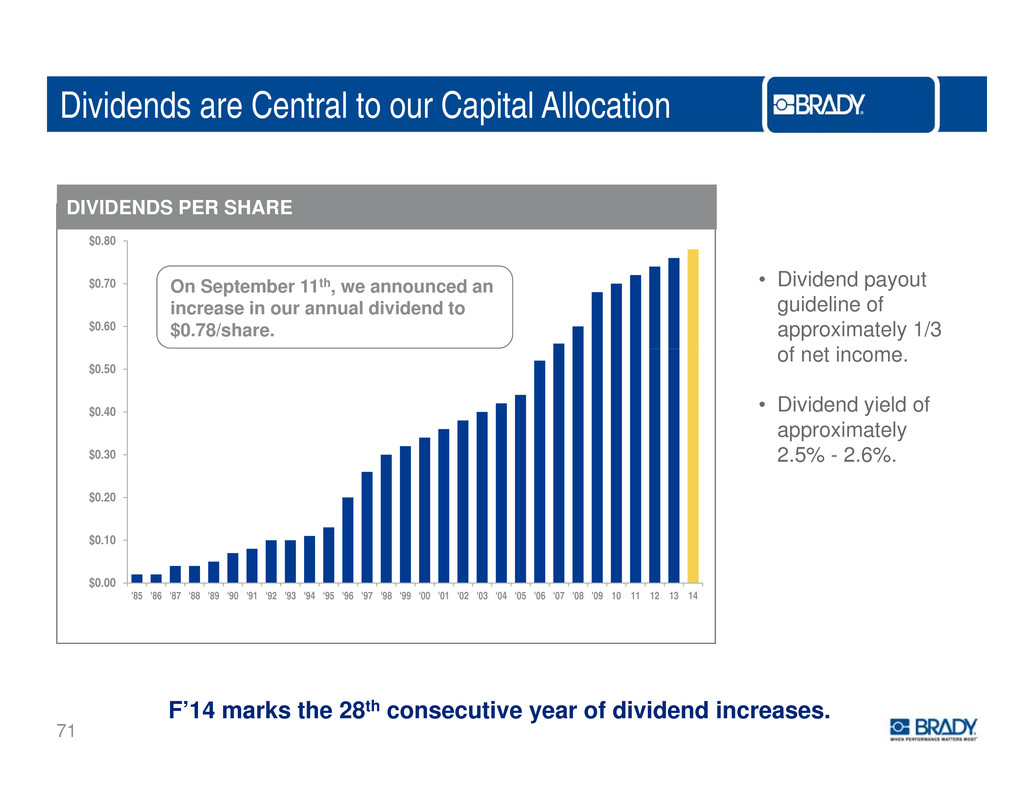
Dividends are Central to our Capital Allocation DIVIDENDS PER SHARE $0.80 $0.60 $0.70 On September 11th, we announced an increase in our annual dividend to $0.78/share. • Dividend payout guideline of approximately 1/3 f t i $0 30 $0.40 $0.50 o ne ncome. • Dividend yield of approximately 2 5% 2 6% $0.10 $0.20 . . - . . $0.00 '85 '86 '87 '88 '89 '90 '91 '92 '93 '94 '95 '96 '97 '98 '99 '00 '01 '02 '03 '04 '05 '06 '07 '08 '09 10 11 12 13 14 71 F’14 marks the 28th consecutive year of dividend increases.
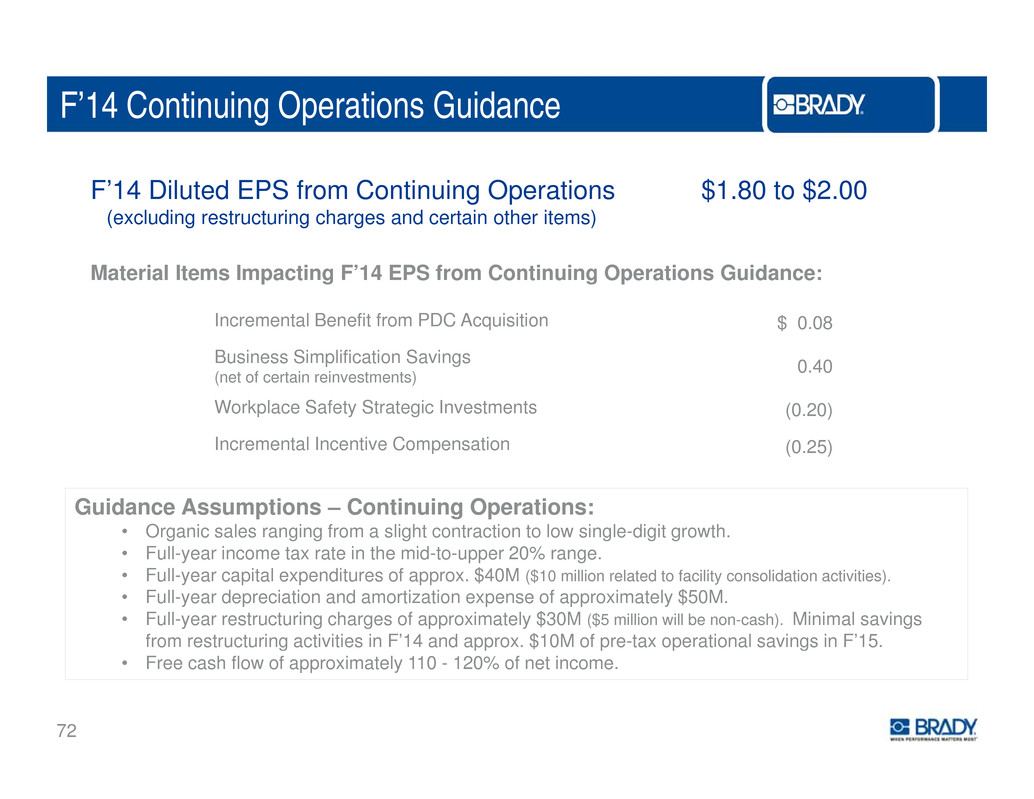
F’14 Continuing Operations Guidance F’14 Diluted EPS from Continuing Operations $1.80 to $2.00 (excluding restructuring charges and certain other items) Material Items Impacting F’14 EPS from Continuing Operations Guidance: Incremental Benefit from PDC Acquisition $ 0.08 Business Simplification Savings (net of certain reinvestments) 0.40 Workplace Safety Strategic Investments (0.20) Incremental Incentive Compensation (0 25) Guidance Assumptions – Continuing Operations: • Organic sales ranging from a slight contraction to low single-digit growth. Full year income tax rate in the mid to upper 20% range . • - - - . • Full-year capital expenditures of approx. $40M ($10 million related to facility consolidation activities). • Full-year depreciation and amortization expense of approximately $50M. • Full-year restructuring charges of approximately $30M ($5 million will be non-cash). Minimal savings from restructuring activities in F’14 and approx. $10M of pre-tax operational savings in F’15. 72 • Free cash flow of approximately 110 - 120% of net income.

F’14 Continuing Operations Guidance Build-Up (millions of USD, except EPS amounts) Diluted Earnings per Share, Excluding Certain Items* Guidance Range Low‐End High‐End F'13 (EPS, excluding certain items)* 1.93$ 1.93$ PDC ‐ Annualized Results 0.08 0.08 Simplification Savings, net of selected strategic add‐backs 0.40 0.40 Strategic Investments ‐ WPS (0.20) (0.20) Incentive Compensation (0.25) (0.25) WPS ‐ Gross Margin Degredation (0.05) (0.05) Organic Sales (‐1% to +2%) & Other (0.11) 0.09 F'14 (EPS, excluding certain items)* 1.80$ 2.00$ 73 * Diluted Net Earnings per Share, excluding certain items, is a non-GAAP measure. See non- GAAP reconciliations in appendix.
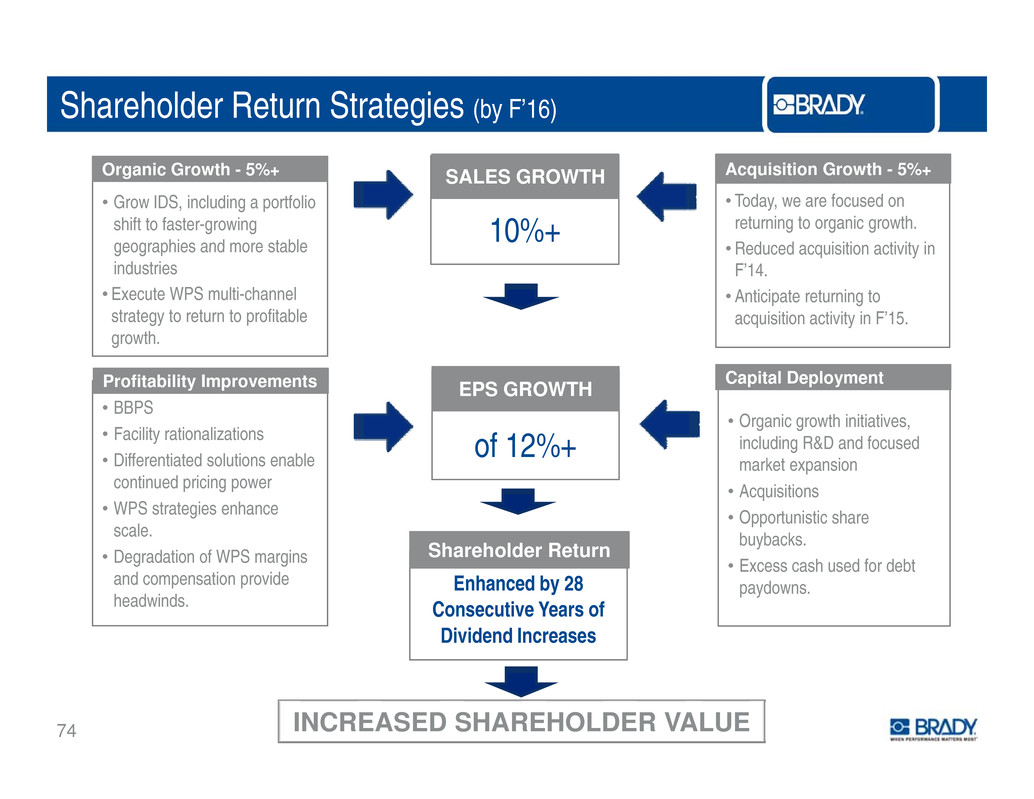
Shareholder Return Strategies (by F’16) • Grow IDS, including a portfolio shift to faster-growing geographies and more stable • Today, we are focused on returning to organic growth. • Reduced acquisition activity in 10%+ SALES GROWTH Acquisition Growth - 5%+Organic Growth - 5%+ industries • Execute WPS multi-channel strategy to return to profitable growth. F’14. • Anticipate returning to acquisition activity in F’15. • BBPS • Facility rationalizations • Organic growth initiatives, including R&D and focused of 12%+ Profitability Improvements Capital DeploymentEPS GROWTH • Differentiated solutions enable continued pricing power • WPS strategies enhance scale. D d ti f WPS i market expansion • Acquisitions • Opportunistic share buybacks.Shareholder Return• egra a on o marg ns and compensation provide headwinds. • Excess cash used for debt paydowns.Enhanced by 28 Consecutive Years of Dividend Increases 74 INCREASED SHAREHOLDER VALUE
Q&A 75
Company Video 76

DIE CUT Frank Jaehnert President & Chief Executive Officer 77
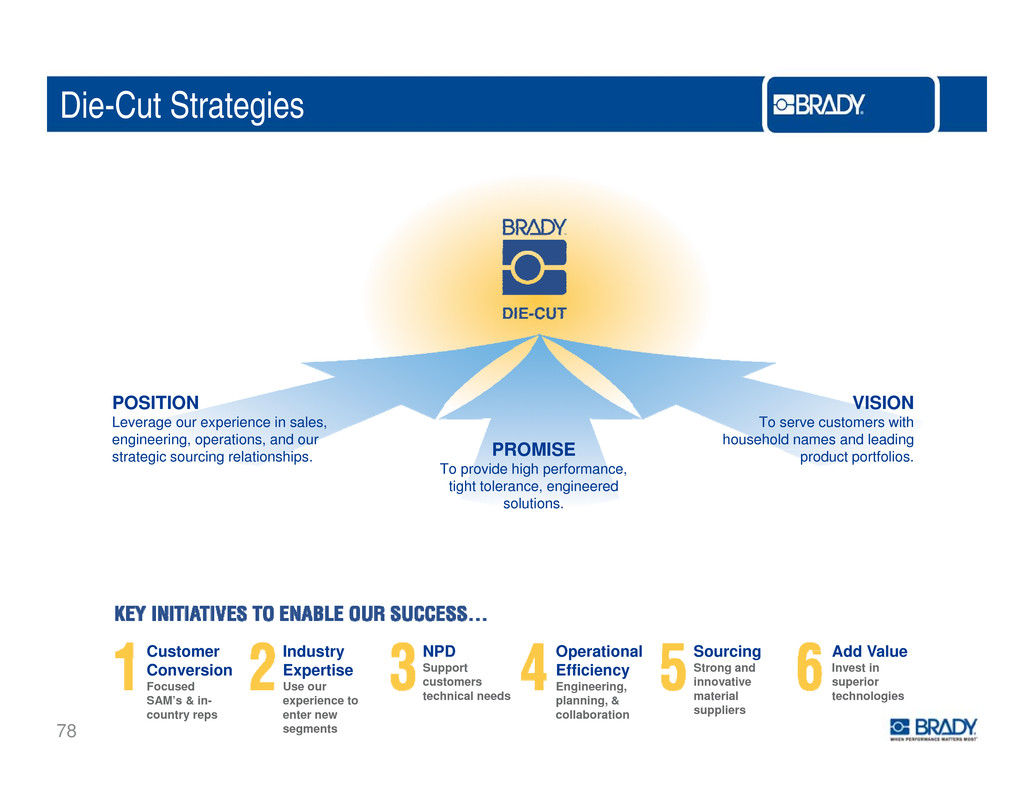
Die-Cut Strategies POSITION Leverage our experience in sales, engineering, operations, and our VISION To serve customers with household names and leading PROMISEstrategic sourcing relationships. product portfolios. To provide high performance, tight tolerance, engineered solutions. Customer Industry NPD Operational Sourcing Add Value Conversion Focused SAM’s & in- country reps Expertise Use our experience to enter new segments Support customers technical needs Efficiency Engineering, planning, & collaboration Strong and innovative material suppliers Invest in superior technologies 78

Die-Cut Priorities • Focus on our Customers: OUR DIE-CUT PRIORITIES ARE SIMPLE • Exceed expectations on quality, product performance, and delivery. R i f th B d t li Wh P f M tt• e n orce e ra y ag ne en er ormance a ers Most. • Continue to drive improvements in operational efficiencyContinu operationa ficienc , productivity, and material yield. • Execute the sale of this business. We must continue to execute on these strategies to ensure sustainable 79 mus continu execut thes strategie ensur business success.
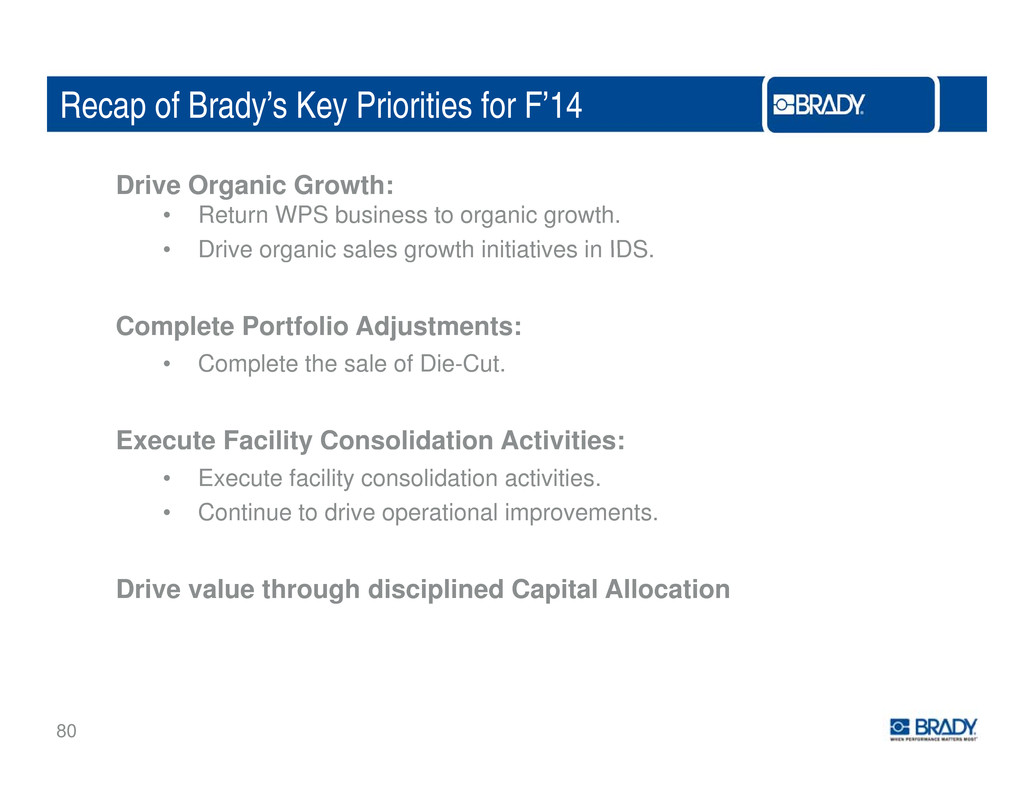
Recap of Brady’s Key Priorities for F’14 Drive Organic Growth: • Return WPS business to organic growth. • Drive organic sales growth initiatives in IDS growt ID . Complete Portfolio Adjustments: • Complete the sale of Die-Cut. Execute Facility Consolidation Activities: • Execute facility consolidation activities. • Continue to drive operational improvements. Drive value through disciplined Capital Allocation 80
CLOSING REMARKS Frank Jaehnert President & Chief Executive Officer 81
Our Commitment to You, Our Shareholders. . . We will. . . I t i WPS t t t i l• nves n o re urn o organ c sa es growth. • Focus on driving organic sales growth in our IDS business by continuing the portfolio shift into faster-growing industries and geographies. • Work to complete the sale of Die Cut. • Review our structure and continuously drive t t i l di th h f ilitou cos s, nc u ng roug ac y consolidations. • Deploy capital in a disciplined manner to drive 82 long-term shareholder value.

Thank You 83

Q&A 84

LUNCH, TOURS, & PRODUCT DISPLAYS 85
APPENDIX NON-GAAP RECONCILIATIONS 86
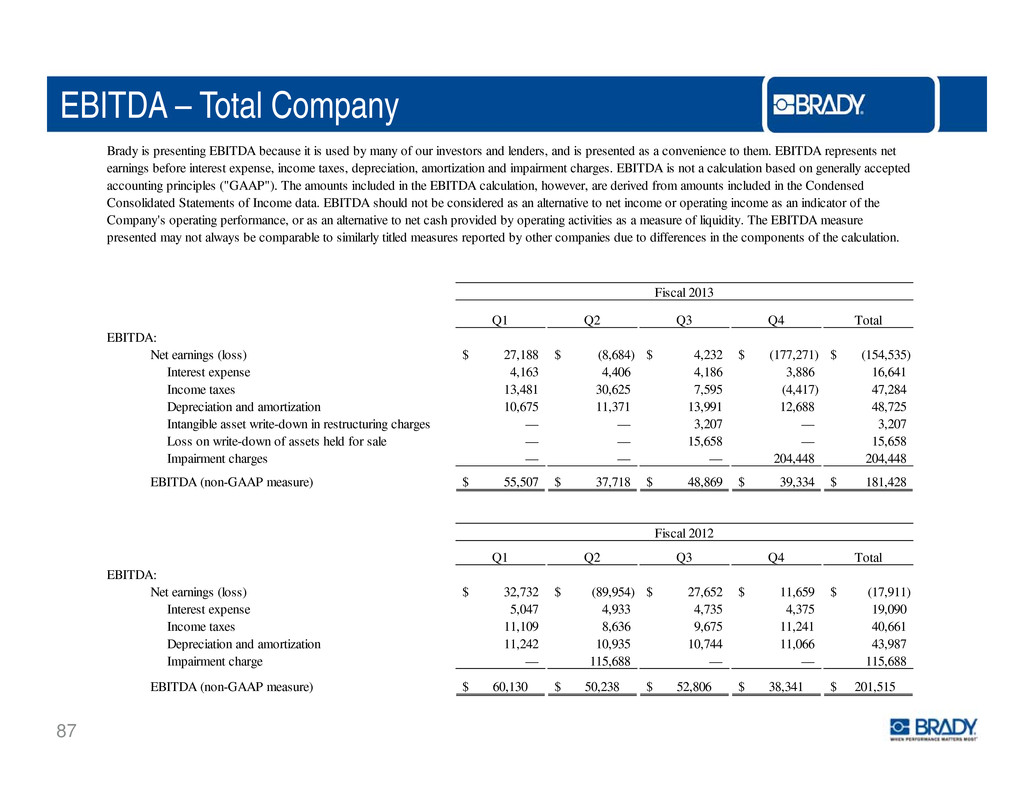
EBITDA – Total Company B d i ti EBITDA b it i d b f i t d l d d i t d i t th EBITDA t tra y s presen ng ecause s use y many o our nves ors an en ers, an s presen e as a conven ence o em. represen s ne earnings before interest expense, income taxes, depreciation, amortization and impairment charges. EBITDA is not a calculation based on generally accepted accounting principles ("GAAP"). The amounts included in the EBITDA calculation, however, are derived from amounts included in the Condensed Consolidated Statements of Income data. EBITDA should not be considered as an alternative to net income or operating income as an indicator of the Company's operating performance, or as an alternative to net cash provided by operating activities as a measure of liquidity. The EBITDA measure presented may not always be comparable to similarly titled measures reported by other companies due to differences in the components of the calculation. Q1 Q2 Q3 Q4 Total Fiscal 2013 EBITDA: 27,188$ (8,684)$ 4,232$ (177,271)$ (154,535)$ Interest expense 4,163 4,406 4,186 3,886 16,641 Income taxes 13,481 30,625 7,595 (4,417) 47,284 Depreciation and amortization 10,675 11,371 13,991 12,688 48,725 Intangible asset write-down in restructuring charges — — 3,207 — 3,207 Loss on write-down of assets held for sale — — 15,658 — 15,658 Net earnings (loss) Impairment charges — — — 204,448 204,448 55,507$ 37,718$ 48,869$ 39,334$ 181,428$ EBITDA (non-GAAP measure) Fiscal 2012 Q1 Q2 Q3 Q4 Total 32,732$ (89,954)$ 27,652$ 11,659$ (17,911)$ Interest expense 5,047 4,933 4,735 4,375 19,090 Income taxes 11,109 8,636 9,675 11,241 40,661 Depreciation and amortization 11,242 10,935 10,744 11,066 43,987 EBITDA: Net earnings (loss) 87 Impairment charge — 115,688 — — 115,688 60,130$ 50,238$ 52,806$ 38,341$ 201,515$ EBITDA (non-GAAP measure)
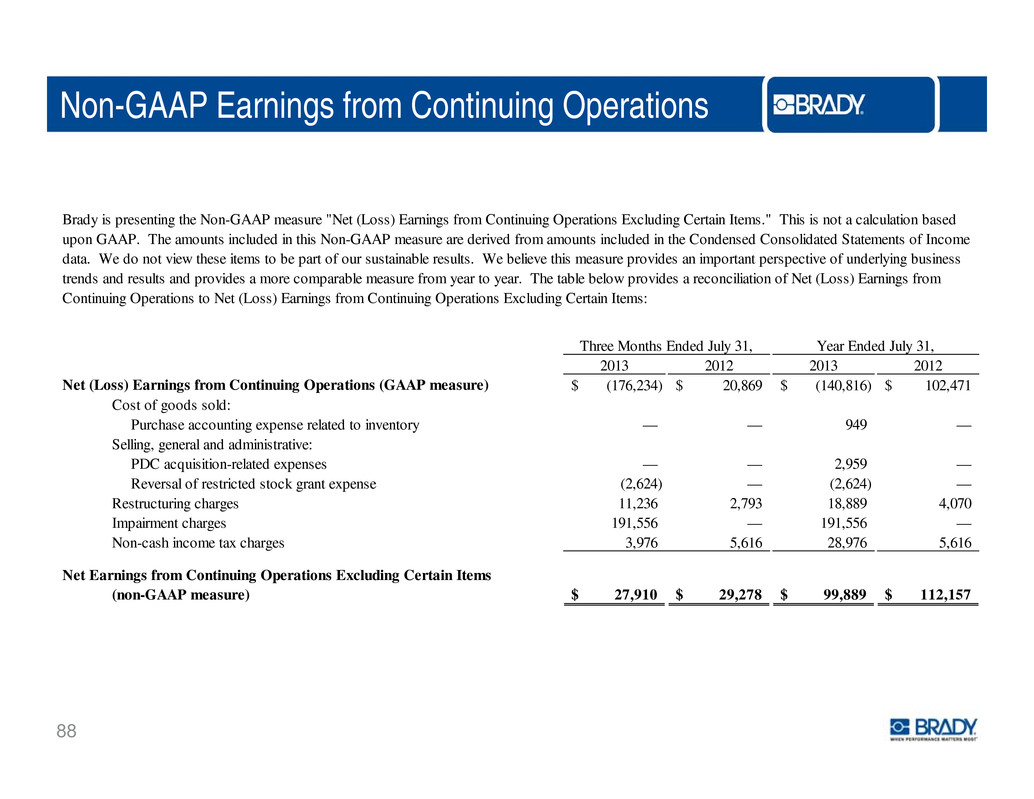
Non-GAAP Earnings from Continuing Operations Brady is presenting the Non-GAAP measure "Net (Loss) Earnings from Continuing Operations Excluding Certain Items." This is not a calculation based upon GAAP. The amounts included in this Non-GAAP measure are derived from amounts included in the Condensed Consolidated Statements of Income data. We do not view these items to be part of our sustainable results. We believe this measure provides an important perspective of underlying business trends and results and provides a more comparable measure from year to year. The table below provides a reconciliation of Net (Loss) Earnings from Continuing Operations to Net (Loss) Earnings from Continuing Operations Excluding Certain Items: Three Months Ended July 31 Year Ended July 31 2013 2012 2013 2012 (176,234)$ 20,869$ (140,816)$ 102,471$ — — 949 — Selling, general and administrative: Purchase accounting expense related to inventory , , Cost of goods sold: Net (Loss) Earnings from Continuing Operations (GAAP measure) PDC acquisition-related expenses — — 2,959 — Reversal of restricted stock grant expense (2,624) — (2,624) — 11,236 2,793 18,889 4,070 Impairment charges 191,556 — 191,556 — 3,976 5,616 28,976 5,616 Restructuring charges Non-cash income tax charges 27,910$ 29,278$ 99,889$ 112,157$ Net Earnings from Continuing Operations Excluding Certain Items (non-GAAP measure) 88
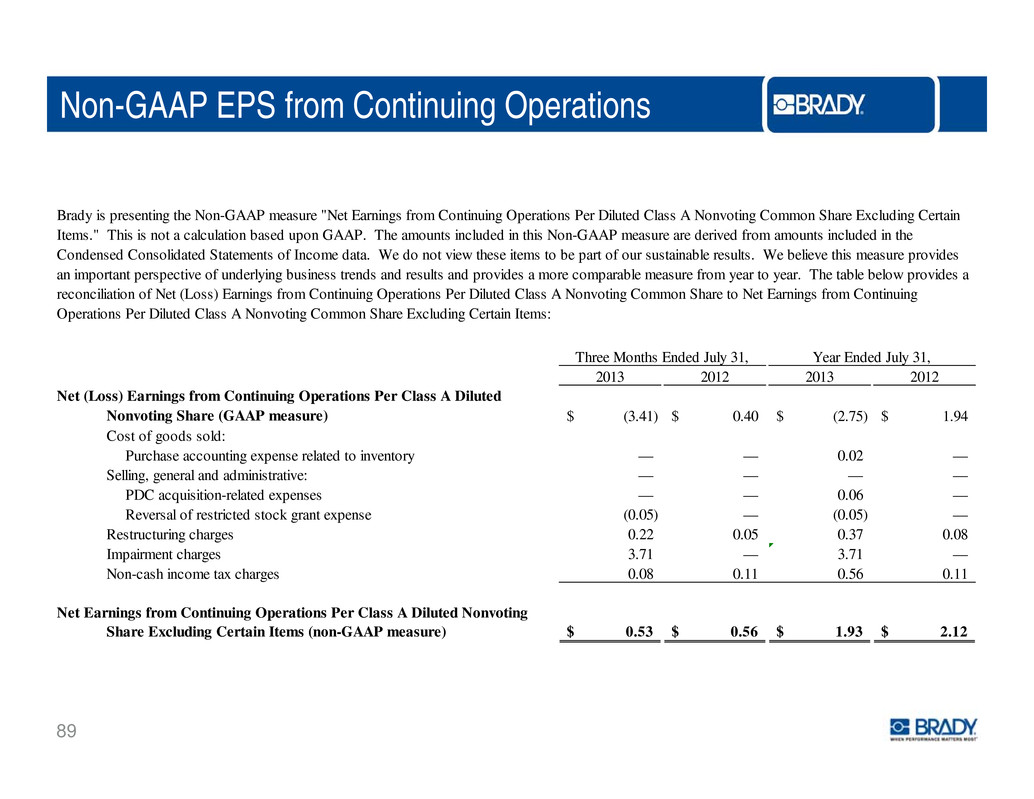
Non-GAAP EPS from Continuing Operations Brady is presenting the Non-GAAP measure "Net Earnings from Continuing Operations Per Diluted Class A Nonvoting Common Share Excluding Certain Items." This is not a calculation based upon GAAP. The amounts included in this Non-GAAP measure are derived from amounts included in the Condensed Consolidated Statements of Income data. We do not view these items to be part of our sustainable results. We believe this measure provides an important perspective of underlying business trends and results and provides a more comparable measure from year to year. The table below provides a reconciliation of Net (Loss) Earnings from Continuing Operations Per Diluted Class A Nonvoting Common Share to Net Earnings from Continuing Operations Per Diluted Class A Nonvoting Common Share Excluding Certain Items: 2013 2012 2013 2012 Nonvoting Share (GAAP measure) (3.41)$ 0.40$ (2.75)$ 1.94$ Cost of goods sold: Net (Loss) Earnings from Continuing Operations Per Class A Diluted Three Months Ended July 31, Year Ended July 31, — — 0.02 — — — — — PDC acquisition-related expenses — — 0.06 — Reversal of restricted stock grant expense (0.05) — (0.05) — 0.22 0.05 0.37 0.08 I i t h 3 71 3 71 Selling, general and administrative: Restructuring charges Purchase accounting expense related to inventory mpa rmen c arges . — . — 0.08 0.11 0.56 0.11 Share Excluding Certain Items (non-GAAP measure) 0.53$ 0.56$ 1.93$ 2.12$ Net Earnings from Continuing Operations Per Class A Diluted Nonvoting Non-cash income tax charges 89

Quarterly Financial Statements Q1 Q2 Q3 Q4 Q1 Q2 Q3 Q4 Sales 273.4$ 255.1$ 271.2$ 269.1$ 270.9$ 271.2$ 301.0$ 309.1$ F'12 F'13 Gross margin 150.5 141.2 150.4 147.5 149.5 141.0 158.5 157.0 % of Sa les 55.0% 55.4% 55.5% 54.8% 55.2% 52.0% 52.7% 50.8% Research and development (8.5) (8.8) (8.2) (9.0) (7.9) (8.2) (8.1) (9.4) Selling, general and administrative (99.2) (95.0) (98.0) (100.3) (99.0) (109.9) (111.8) (106.9) % of Sa les (36.3%) (37.3%) (36.2%) (37.3%) (36.6%) (40.5%) (37.2%) (34.6%) Restructuring charges ‐ ‐ (2.0) (4.1) ‐ (1.9) (8.5) (15.6) Operating income 42.7 37.4 42.2 34.1 42.6 21.0 30.1 (179.3) Earnings (loss) from continuing operations 27.9$ 26.4$ 27.3$ 20.9$ 25.8$ (11.4)$ 21.0$ (176.2)$ Earnings (loss) from continuing operations per Class A Nonvoting Common Share (GAAP measure) 0.53$ 0.50$ 0.52$ 0.40$ 0.50$ (0.22)$ 0.40$ (3.41)$ Restructuring charges ‐ ‐ 0.03 0.05 ‐ 0.03 0.13 0.22 PDC i iti l t d 0 08 acqu s on‐re a e expenses ‐ ‐ ‐ ‐ ‐ . ‐ ‐ Non‐cash income tax charges ‐ ‐ ‐ 0.11 ‐ 0.49 ‐ 0.08 Impairment charges ‐ ‐ ‐ ‐ ‐ ‐ ‐ 3.71 Reversal of restricted stock grant expense ‐ ‐ ‐ ‐ ‐ ‐ ‐ (0.05) Earnings (loss) from continuing operations per Class 90 A Nonvoting Common Share (Non‐GAAP measure) 0.53$ 0.50$ 0.55$ 0.56$ 0.50$ 0.38$ 0.54$ 0.53$


