
February 18, 2021 Brady Corporation F’21 Q2 Financial Results
2Forward-Looking Statements In this presentation, statements that are not reported financial results or other historic information are “forward-looking statements.” These forward-looking statements relate to, among other things, the Company's future financial position, business strategy, targets, projected sales, costs, earnings, capital expenditures, debt levels and cash flows, and plans and objectives of management for future operations. The use of words such as “may,” “will,” “expect,” “intend,” “estimate,” “anticipate,” “believe,” “should,” “project,” “continue” or “plan” or similar terminology are generally intended to identify forward-looking statements. These forward-looking statements by their nature address matters that are, to different degrees, uncertain and are subject to risks, assumptions, and other factors, some of which are beyond Brady’s control, that could cause actual results to differ materially from those expressed or implied by such forward-looking statements. For Brady, uncertainties arise from: adverse impacts of the novel coronavirus (“COVID-19”) pandemic or other pandemics; decreased demand for our products; our ability to compete effectively or to successfully execute our strategy; Brady’s ability to develop technologically advanced products that meet customer demands; raw material and other cost increases; difficulties in protecting our websites, networks, and systems against security breaches; extensive regulations by U.S. and non-U.S. governmental and self-regulatory entities; risks associated with the loss of key employees; divestitures and contingent liabilities from divestitures; Brady’s ability to properly identify, integrate, and grow acquired companies; litigation, including product liability claims; foreign currency fluctuations; potential write-offs of Brady’s goodwill and other intangible assets; changes in tax legislation and tax rates; differing interests of voting and non-voting shareholders; numerous other matters of national, regional and global scale, including major public health issues and those of a political, economic, business, competitive, and regulatory nature contained from time to time in Brady’s U.S. Securities and Exchange Commission filings, including, but not limited to, those factors listed in the “Risk Factors” section within Item 1A of Part I of Brady’s Form 10-K for the year ended July 31, 2020 and subsequent Form 10-Q filings. These uncertainties may cause Brady's actual future results to be materially different than those expressed in its forward-looking statements. Brady does not undertake to update its forward-looking statements except as required by law.

3Managing Through the Pandemic Managing Through the Pandemic: • Thank you to all of the Brady employees and front- line workers. • Brady’s products are helping in the fight of COVID- 19. Key Messages: • Workplace Safety is growing its customer base, but gross margins were impacted by mix. • ID Solutions continues to grow profit as a percent of sales. • SG&A continues to trend downwards, boding well for strong earnings growth as markets improve. • Strong balance sheet and cash generation.

4Q2 F’21 Financial Summary • Sales were $265.8M in Q2 of F’21 compared with $276.7M in Q2 of F’20. – Organic sales declined 6.3%. – Foreign currency translation increased sales 2.4%. • Gross profit margin of 48.7% in Q2 of F’21 compared with 50.3% in Q2 of F’20. • SG&A expense of $82.2M (30.9% of sales) in Q2 of F’21 compared with $87.4M (31.6% of sales) in Q2 of F’20. • R&D expense of $9.9M (3.7% of sales) in Q2 of F’21 compared with $10.5M (3.8% of sales) in Q2 of F’20. • Income before income taxes and losses of unconsolidated affiliate declined 7.0% to $39.4M in Q2 of F’21 compared with $42.4M in Q2 of F’20. • Net income per Class A Diluted Nonvoting Common Share was $0.59 in Q2 of F’21 compared with $0.62 in Q2 of F’20. • Net cash provided by operating activities increased 153% to $36.1M in Q2 of F’21 compared to $14.3M in Q2 of F’20.
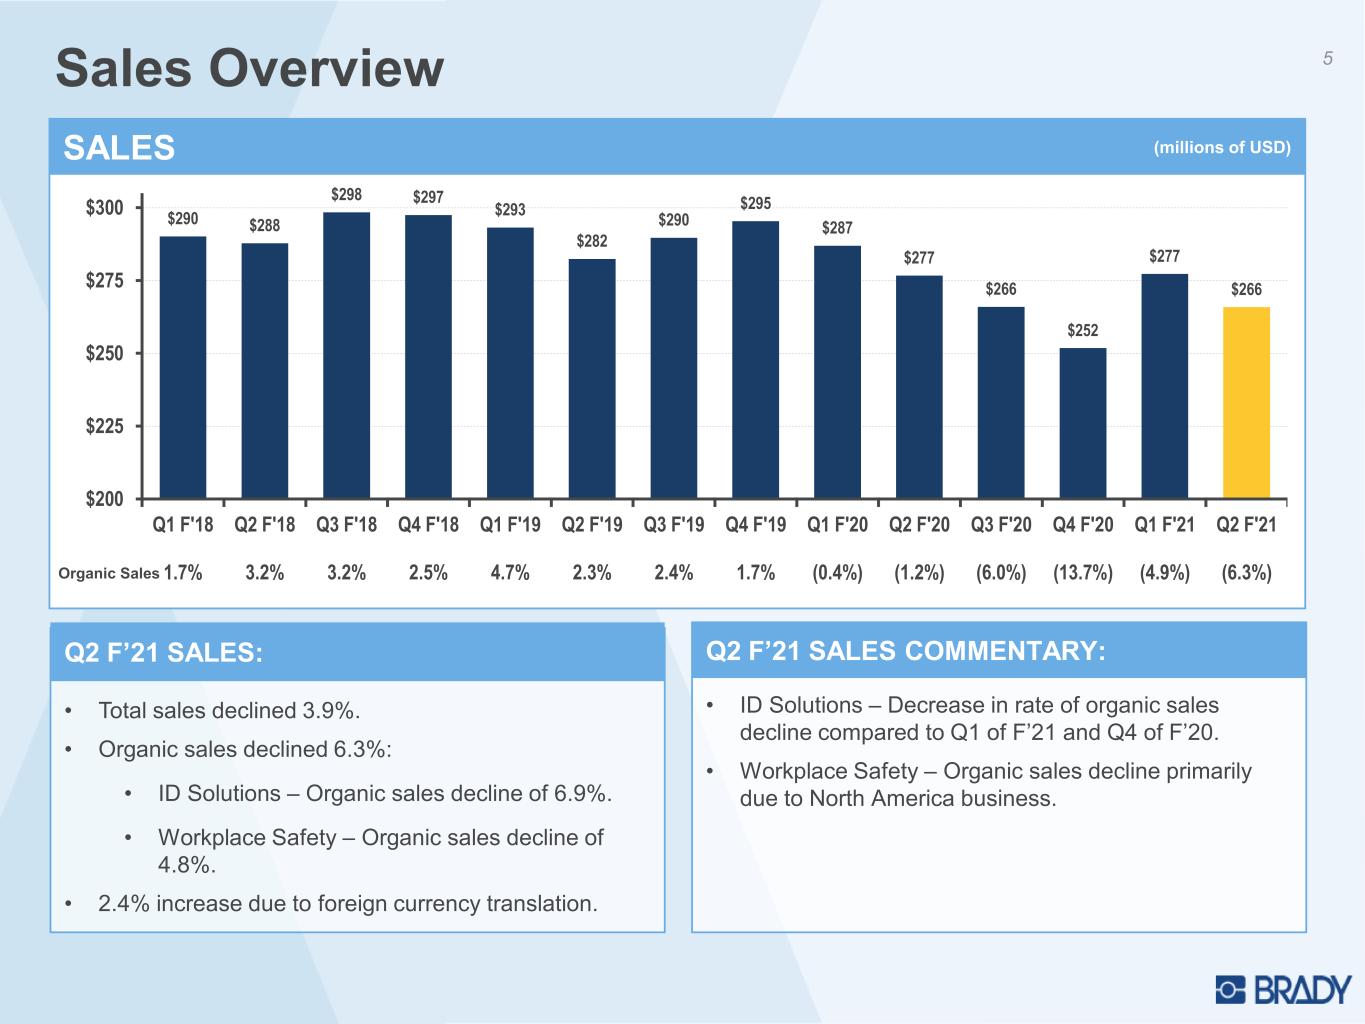
5Sales Overview • Total sales declined 3.9%. • Organic sales declined 6.3%: • ID Solutions – Organic sales decline of 6.9%. • Workplace Safety – Organic sales decline of 4.8%. • 2.4% increase due to foreign currency translation. Q2 F’21 SALES: • ID Solutions – Decrease in rate of organic sales decline compared to Q1 of F’21 and Q4 of F’20. • Workplace Safety – Organic sales decline primarily due to North America business. Q2 F’21 SALES COMMENTARY: $290 $288 $298 $297 $293 $282 $290 $295 $287 $277 $266 $252 $277 $266 $200 $225 $250 $275 $300 Q1 F'18 1.7% Q2 F'18 3.2% Q3 F'18 3.2% Q4 F'18 2.5% Q1 F'19 4.7% Q2 F'19 2.3% Q3 F'19 2.4% Q4 F'19 1.7% Q1 F'20 (0.4%) Q2 F'20 (1.2%) Q3 F'20 (6.0%) Q4 F'20 (13.7%) Q1 F'21 (4.9%) Q2 F'21 (6.3%)Organic Sales SALES (millions of USD)
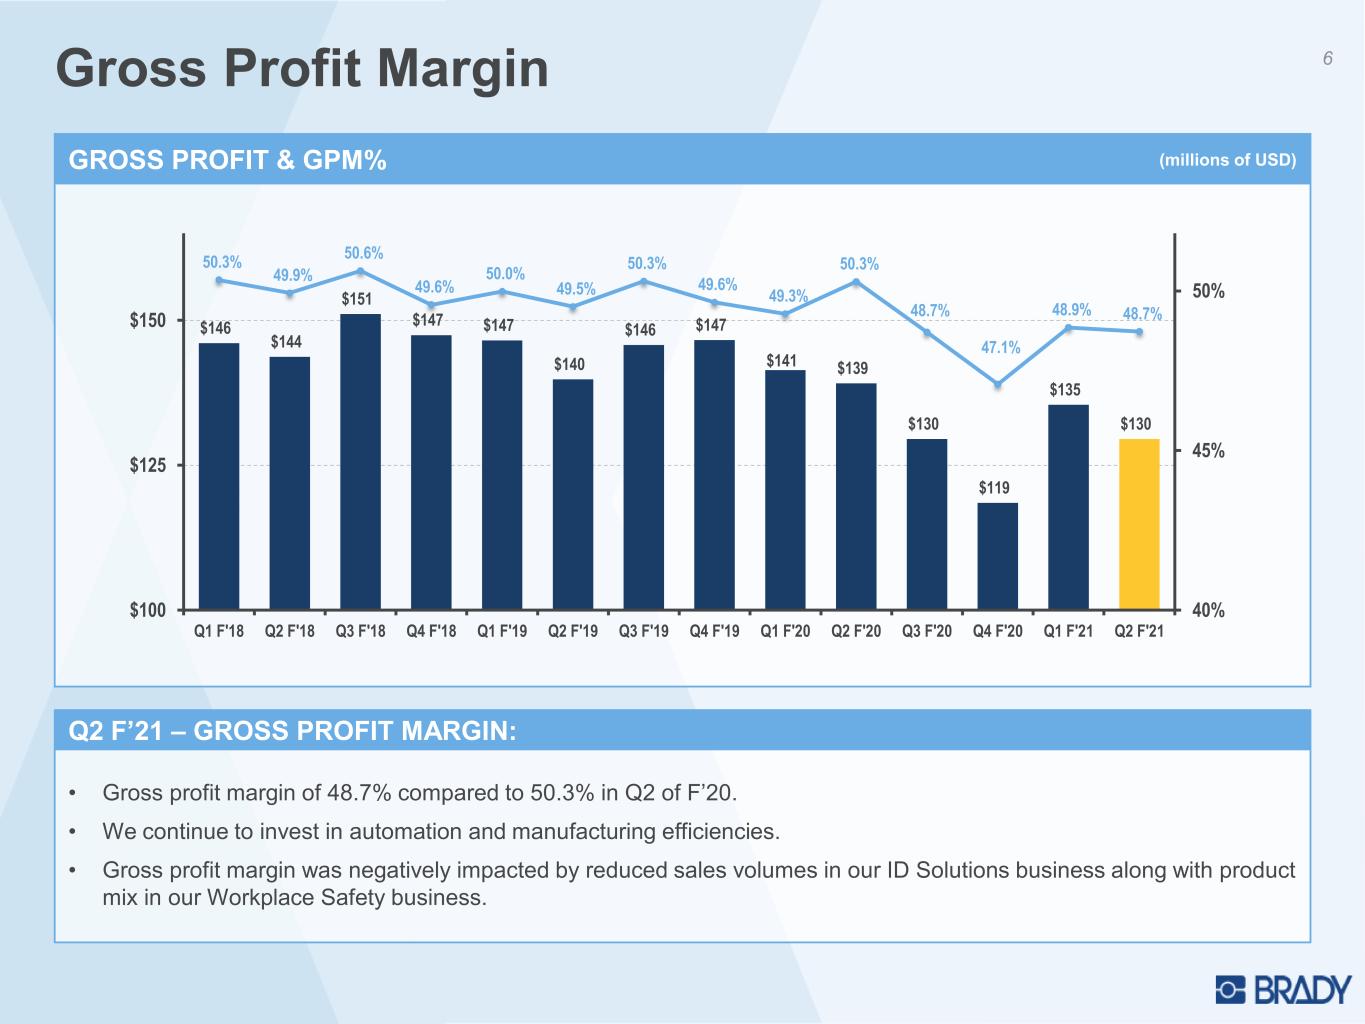
Gross Profit Margin 6 • Gross profit margin of 48.7% compared to 50.3% in Q2 of F’20. • We continue to invest in automation and manufacturing efficiencies. • Gross profit margin was negatively impacted by reduced sales volumes in our ID Solutions business along with product mix in our Workplace Safety business. Q2 F’21 – GROSS PROFIT MARGIN: $146 $144 $151 $147 $147 $140 $146 $147 $141 $139 $130 $119 $135 $130 50.3% 49.9% 50.6% 49.6% 50.0% 49.5% 50.3% 49.6% 49.3% 50.3% 48.7% 47.1% 48.9% 48.7% 40% 45% 50% $100 $125 $150 Q1 F'18 Q2 F'18 Q3 F'18 Q4 F'18 Q1 F'19 Q2 F'19 Q3 F'19 Q4 F'19 Q1 F'20 Q2 F'20 Q3 F'20 Q4 F'20 Q1 F'21 Q2 F'21 GROSS PROFIT & GPM% (millions of USD)

SG&A Expense 7 • The $5.1M reduction in SG&A expense compared to Q2 of F’20 was due to ongoing benefits from efficiency actions combined with a reduction in discretionary spend. • Sequentially, SG&A expense was down $0.8M compared to the first quarter of this year. This decrease was primarily due to benefits from efficiency actions partially offset by foreign currency translation. Q2 F’21 – SG&A EXPENSE: $100 $98 $102 $91 $95 $93 $95 $89 $90 $87 $83 $76 $83 $82 34.5% 33.9% 34.1% 30.6% 32.3% 32.8% 32.7% 30.2% 31.2% 31.6% 31.3% 30.2% 30.0% 30.9% 10% 15% 20% 25% 30% 35% $60 $70 $80 $90 $100 $110 Q1 F'18 Q2 F'18 Q3 F'18 Q4 F'18 Q1 F'19 Q2 F'19 Q3 F'19 Q4 F'19 Q1 F'20 Q2 F'20 Q3 F'20 Q4 F'20 Q1 F'21 Q2 F'21 SG&A EXPENSE AND SG&A EXPENSE AS A % of SALES (millions of USD)
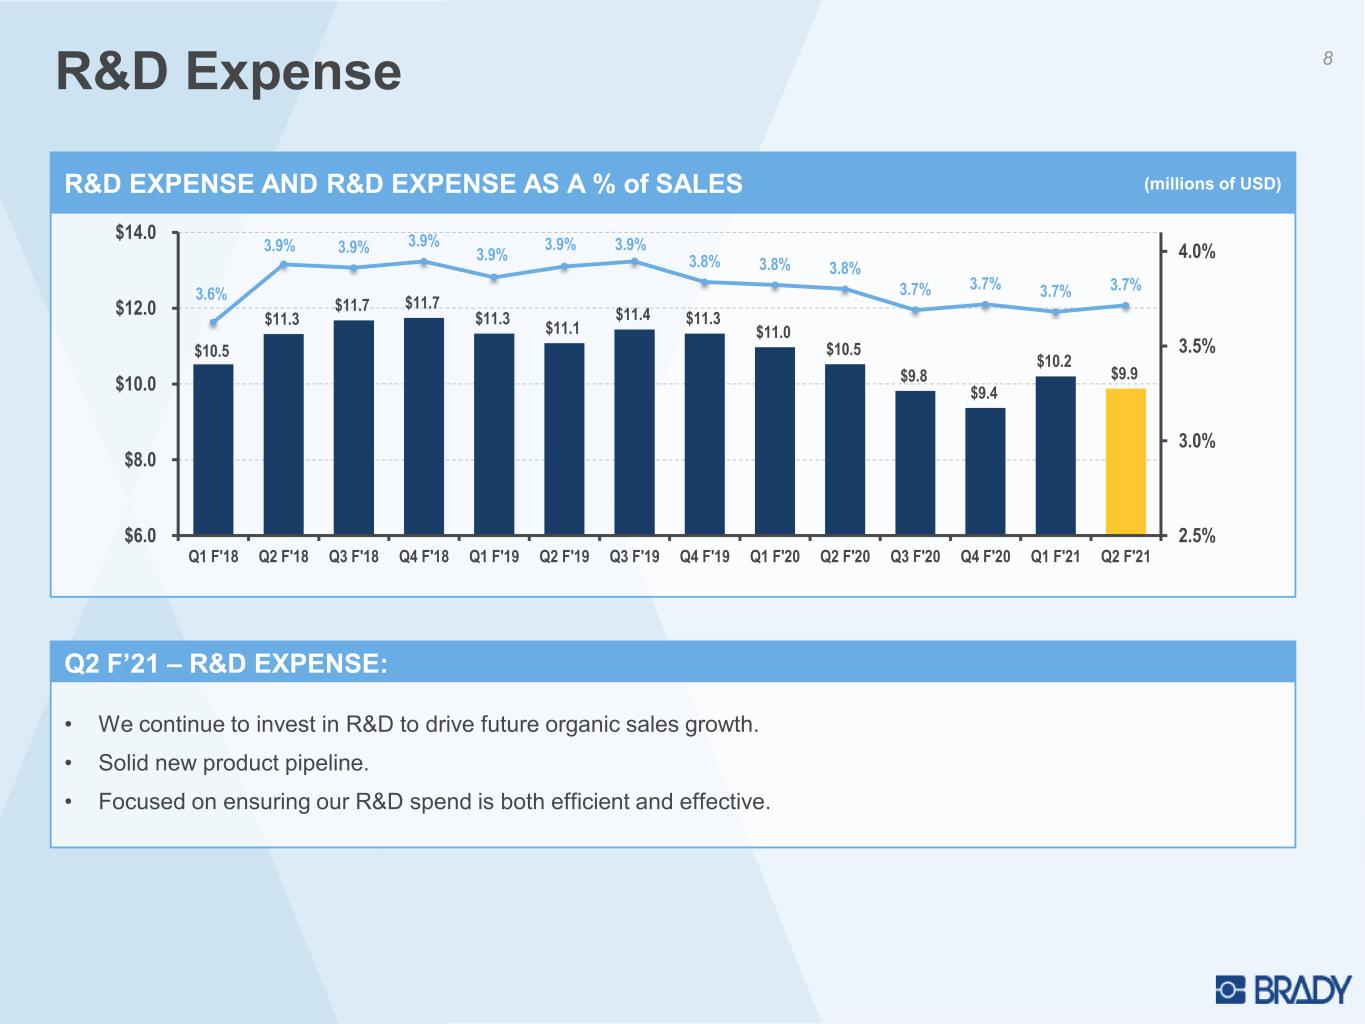
R&D Expense 8 $10.5 $11.3 $11.7 $11.7 $11.3 $11.1 $11.4 $11.3 $11.0 $10.5 $9.8 $9.4 $10.2 $9.9 3.6% 3.9% 3.9% 3.9% 3.9% 3.9% 3.9% 3.8% 3.8% 3.8% 3.7% 3.7% 3.7% 3.7% 2.5% 3.0% 3.5% 4.0% $6.0 $8.0 $10.0 $12.0 $14.0 Q1 F'18 Q2 F'18 Q3 F'18 Q4 F'18 Q1 F'19 Q2 F'19 Q3 F'19 Q4 F'19 Q1 F'20 Q2 F'20 Q3 F'20 Q4 F'20 Q1 F'21 Q2 F'21 R&D EXPENSE AND R&D EXPENSE AS A % of SALES (millions of USD) • We continue to invest in R&D to drive future organic sales growth. • Solid new product pipeline. • Focused on ensuring our R&D spend is both efficient and effective. INCREASING OUR INVESTMENT IN RESEARCH & DEVELOPMENT:Q2 F’21 – R&D EXPENSE:

9Income Before Income Taxes • Income before income taxes and losses of unconsolidated affiliate decreased 7.0% to $39.4M in Q2 of F’21 compared to $42.4M in Q2 of F’20. Q2 F’21 - INCOME BEFORE INCOME TAXES AND LOSSES OF UNCONSOLIDATED AFFILIATE: INCOME BEFORE INCOME TAXES AND LOSSES OF UNCONSOLIDATED AFFILIATE (millions of USD) $34.8 $35.0 $37.0 $45.2 $39.9 $36.7 $41.0 $47.1 $41.6 $42.4 $22.2 $34.9 $42.2 $39.4 $10 $20 $30 $40 $50 Q1 F'18 12.2% Q2 F'18 20.4% Q3 F'18 20.7% Q4 F'18 26.0% Q1 F'19 14.8% Q2 F'19 4.8% Q3 F'19 10.8% Q4 F'19 4.1% Q1 F'20 4.2% Q2 F'20 15.4% Q3 F'20 (45.9%) Q4 F'20 (26.0%) Q1 F'21 1.6% Q2 F'21 (7.0%) Year on Year Growth

10Net Income & Diluted EPS • Net income was $30.9M in Q2 of F’21 compared to $33.6M in Q2 of F’20. • Diluted EPS was $0.59 in Q2 of F’21 compared to $0.62 in Q2 of F’20. Q2 F’21 – NET INCOME & DILUTED EPS: $0.49 $0.08 $0.49 $0.66 $0.58 $0.55 $0.65 $0.68 $0.70 $0.62 $0.26 $0.53 $0.64 $0.59 $0.00 $0.20 $0.40 $0.60 Q1 F'18 Q2 F'18 Q3 F'18 Q4 F'18 Q1 F'19 Q2 F'19 Q3 F'19 Q4 F'19 Q1 F'20 Q2 F'20 Q3 F'20 Q4 F'20 Q1 F'21 Q2 F'21 NET INCOME PER CLASS A DILUTED SHARE $25.8 $4.3 $26.0 $35.0 $30.6 $29.2 $34.8 $36.6 $37.5 $33.6 $13.6 $27.7 $33.5 $30.9 $0 $10 $20 $30 $40 Q1 F'18 Q2 F'18 Q3 F'18 Q4 F'18 Q1 F'19 Q2 F'19 Q3 F'19 Q4 F'19 Q1 F'20 Q2 F'20 Q3 F'20 Q4 F'20 Q1 F'21 Q2 F'21 NET INCOME (millions of USD)
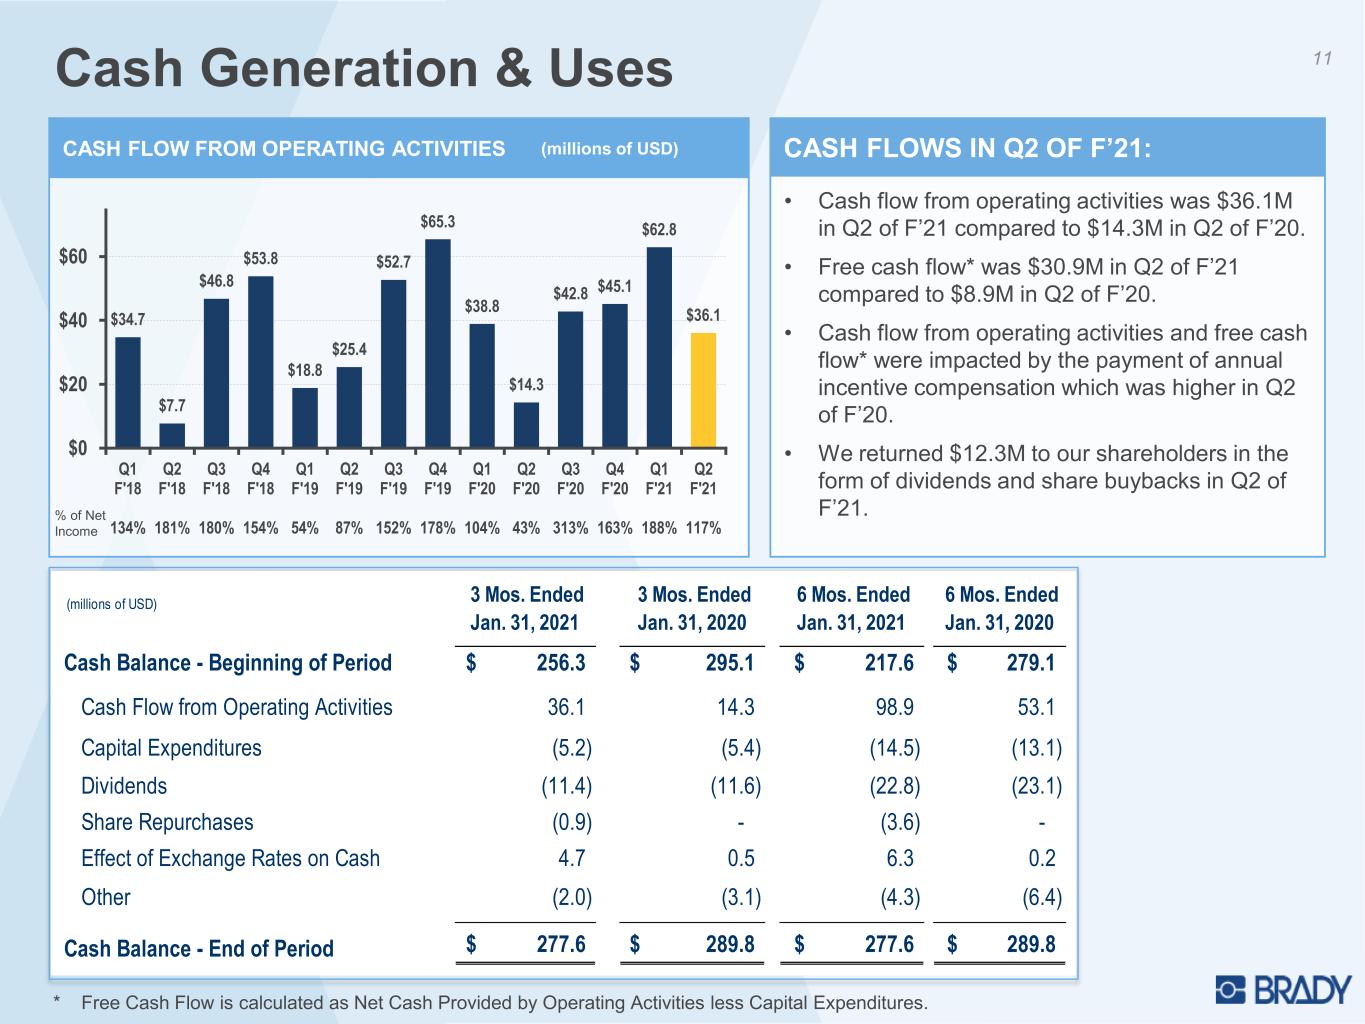
11Cash Generation & Uses • Cash flow from operating activities was $36.1M in Q2 of F’21 compared to $14.3M in Q2 of F’20. • Free cash flow* was $30.9M in Q2 of F’21 compared to $8.9M in Q2 of F’20. • Cash flow from operating activities and free cash flow* were impacted by the payment of annual incentive compensation which was higher in Q2 of F’20. • We returned $12.3M to our shareholders in the form of dividends and share buybacks in Q2 of F’21. CASH FLOWS IN Q2 OF F’21: * Free Cash Flow is calculated as Net Cash Provided by Operating Activities less Capital Expenditures. CASH FLOW FROM OPERATING ACTIVITIES (millions of USD) $34.7 $7.7 $46.8 $53.8 $18.8 $25.4 $52.7 $65.3 $38.8 $14.3 $42.8 $45.1 $62.8 $36.1 $0 $20 $40 $60 Q1 F'18 134% Q2 F'18 181% Q3 F'18 180% Q4 F'18 154% Q1 F'19 54% Q2 F'19 87% Q3 F'19 152% Q4 F'19 178% Q1 F'20 104% Q2 F'20 43% Q3 F'20 313% Q4 F'20 163% Q1 F'21 188% Q2 F'21 117% % of Net Income (millions of USD) 3 Mos. Ended Jan. 31, 2021 3 Mos. Ended Jan. 31, 2020 6 Mos. Ended Jan. 31, 2021 6 Mos. Ended Jan. 31, 2020 Cash Balance - Beginning of Period 256.3$ 295.1$ 217.6$ 279.1$ Cash Flow from Operating Activities 36.1 14.3 98.9 53.1 Capital Expenditures (5.2) (5.4) (14.5) (13.1) Dividends (11.4) (11.6) (22.8) (23.1) Share Repurchases (0.9) - (3.6) - Effect of Exchange Rates on Cash 4.7 0.5 6.3 0.2 Other (2.0) (3.1) (4.3) (6.4) Cash Balance - End of Period 277.6$ 289.8$ 277.6$ 289.8$

Net Cash 12 • January 31, 2021 cash = $277.6M. • Brady has no outstanding debt. • Balance sheet provides flexibility for future organic and inorganic investments. STRONG BALANCE SHEET: $48 $44 $73 $129 $138 $151 $188 $229 $245 $240 $190 $218 $256 $278 $0 $50 $100 $150 $200 $250 $300 $350 Q1 F'18 Q2 F'18 Q3 F'18 Q4 F'18 Q1 F'19 Q2 F'19 Q3 F'19 Q4 F'19 Q1 F'20 Q2 F'20 Q3 F'20 Q4 F'20 Q1 F'21 Q2 F'21 NET CASH (millions of USD)

13F’21 Diluted EPS Guidance Diluted EPS Guidance for the Year Ending July 31, 2021 $2.48 to $2.58 Diluted EPS Guidance for the Second $1.25 to $1.35 Half of the Year Ending July 31, 2021 (compares to $0.79 in second half of F’20) Guidance Assumptions: • Continued economic improvement and the successful roll-out of vaccines around the globe. • Mid-single digit organic sales growth in the second half of the year ending July 31, 2021.
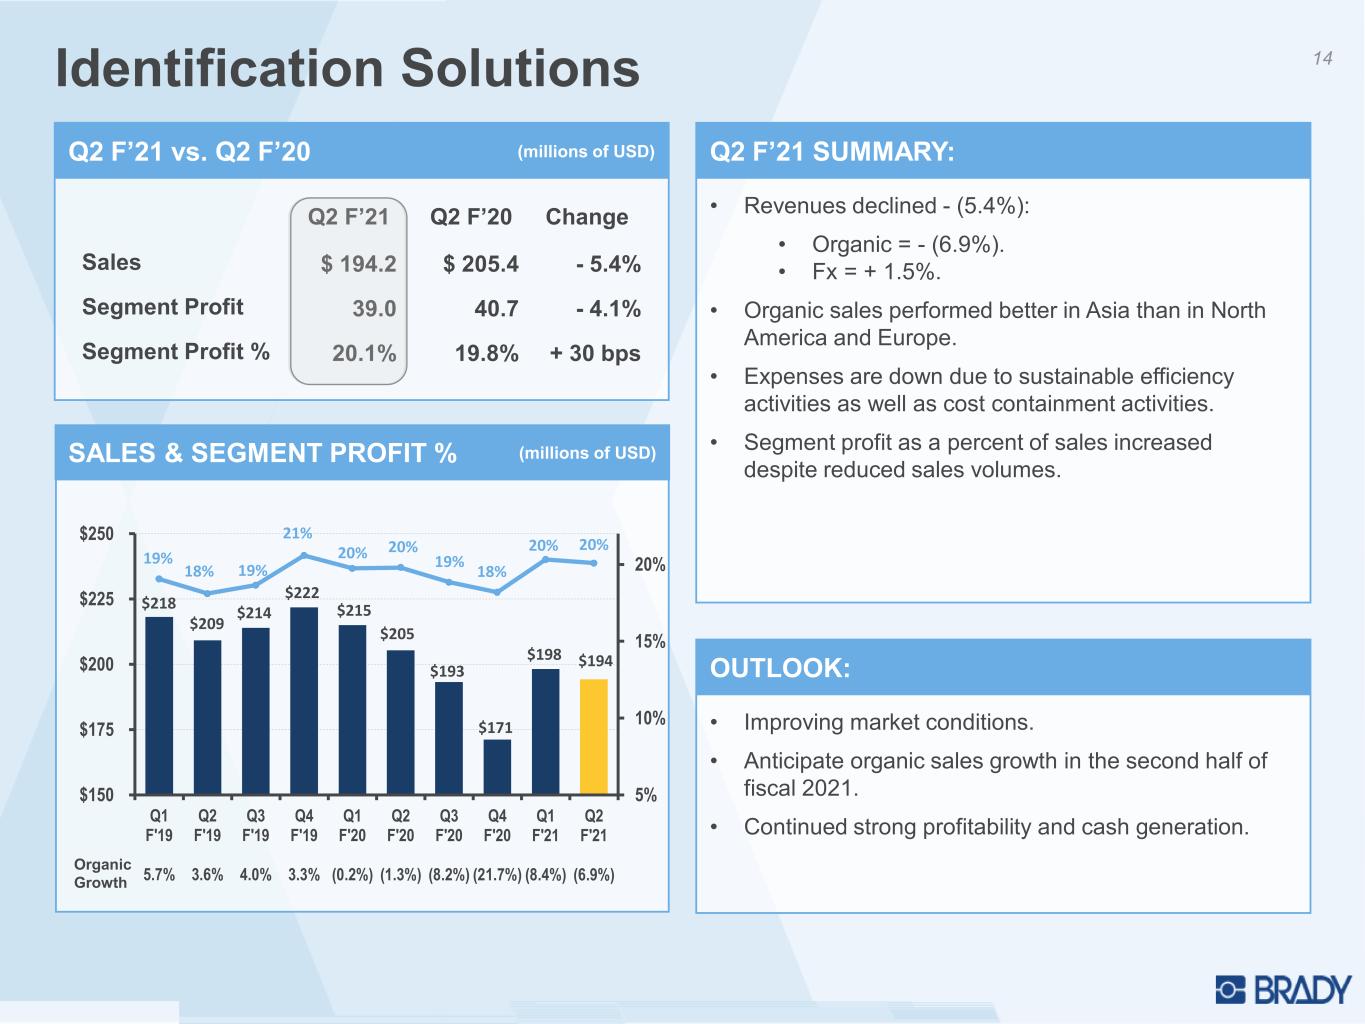
Q2 F’21 vs. Q2 F’20 (millions of USD) 14Identification Solutions • Revenues declined - (5.4%): • Organic = - (6.9%). • Fx = + 1.5%. • Organic sales performed better in Asia than in North America and Europe. • Expenses are down due to sustainable efficiency activities as well as cost containment activities. • Segment profit as a percent of sales increased despite reduced sales volumes. Q2 F’21 SUMMARY: Q2 F’21 Q2 F’20 Change Sales $ 194.2 $ 205.4 - 5.4% Segment Profit 39.0 40.7 - 4.1% Segment Profit % 20.1% 19.8% + 30 bps $218 $209 $214 $222 $215 $205 $193 $171 $198 $194 19% 18% 19% 21% 20% 20% 19% 18% 20% 20% 5% 10% 15% 20% $150 $175 $200 $225 $250 Q1 F'19 5.7% Q2 F'19 3.6% Q3 F'19 4.0% Q4 F'19 3.3% Q1 F'20 (0.2%) Q2 F'20 (1.3%) Q3 F'20 (8.2%) Q4 F'20 (21.7%) Q1 F'21 (8.4%) Q2 F'21 (6.9%)OrganicGrowth SALES & SEGMENT PROFIT % (millions of USD) • Improving market conditions. • Anticipate organic sales growth in the second half of fiscal 2021. • Continued strong profitability and cash generation. OUTLOOK:

Q2 F’21 vs. Q2 F’20 (millions of USD) 15Workplace Safety • Revenues increased + 0.4%: • Organic = - (4.8%). • Fx = + 5.2%. • Organic sales declined due to the North American business and Australia. • Europe experienced low-single digit organic sales growth in the quarter. • Segment profit and segment profit as a percent of sales decreased due to reduced sales volumes and product mix. Q2 F’21 SUMMARY: Q2 F’21 Q2 F’20 Change Sales $ 71.6 $ 71.3 + 0.4% Segment Profit 3.5 5.5 - 36.5% Segment Profit % 4.8% 7.7% - 290 bps Organic Growth $75 $73 $76 $73 $72 $71 $73 $81 $79 $72 7% 6% 8% 9% 7% 8% 6% 7% 10% 5% 0% 2% 4% 6% 8% 10% $50 $75 $100 Q1 F'19 2.2% Q2 F'19 (0.9%) Q3 F'19 (1.6%) Q4 F'19 (2.6%) Q1 F'20 (0.8%) Q2 F'20 (1.0%) Q3 F'20 0.2% Q4 F'20 10.8% Q1 F'21 5.5% Q2 F'21 (4.8%) SALES & SEGMENT PROFIT % (millions of USD) • Challenging comparables in the second half of F’21 due to strong Covid-related product sales last year. • Anticipate a continued slowdown in Covid-related product sales to be partially offset by increased core product sales. OUTLOOK:

16Investor Relations Brady Contact: Ann Thornton Investor Relations 414-438-6887 Ann_Thornton@bradycorp.com See our web site at www.bradycorp.com/investors


