UNITED STATES
SECURITIES AND EXCHANGE COMMISSION
Washington, D.C. 20549
FORM N-CSR
CERTIFIED SHAREHOLDER REPORT OF REGISTERED
MANAGEMENT INVESTMENT COMPANIES
Investment Company Act file number: 811-04995
Sit U.S. Government Securities Fund, Inc.
(Exact name of registrant as specified in charter)
3300 IDS Center
80 South Eighth Street
Minneapolis, MN 55402
(Address of principal executive offices)
Paul E. Rasmussen, VP Treasurer
Sit Mutual Funds, Inc.
3300 IDS Center
80 South Eighth Street
Minneapolis, MN 55402
(Name and address of agent for service)
Copy to:
Mike Radmer, Esq.
Dorsey & Whitney
Suite 1500
50 South Sixth Street
Minneapolis, MN 55402-1498
Registrant’s telephone number, including area code:
(612) 334-5888
Date of fiscal year end: March 31, 2006
Date of reporting period: September 30, 2005
Item 1: Reports to Stockholders
UNITED STATES
SECURITIES AND EXCHANGE COMMISSION
Washington, D.C. 20549
FORM N-CSR
CERTIFIED SHAREHOLDER REPORT OF REGISTERED
MANAGEMENT INVESTMENT COMPANIES
Investment Company Act file number: 811-04032
Sit Money Market Fund, Inc.
(Exact name of registrant as specified in charter)
3300 IDS Center
80 South Eighth Street
Minneapolis, MN 55402
(Address of principal executive offices)
Paul E. Rasmussen, VP Treasurer
Sit Mutual Funds, Inc.
3300 IDS Center
80 South Eighth Street
Minneapolis, MN 55402
(Name and address of agent for service)
Copy to:
Mike Radmer, Esq.
Dorsey & Whitney
Suite 1500
50 South Sixth Street
Minneapolis, MN 55402-1498
Registrant’s telephone number, including area code:
(612) 334-5888
Date of fiscal year end: March 31, 2006
Date of reporting period: September 30, 2005
Item 1: Reports to Stockholders
UNITED STATES
SECURITIES AND EXCHANGE COMMISSION
Washington, D.C. 20549
FORM N-CSR
CERTIFIED SHAREHOLDER REPORT OF REGISTERED
MANAGEMENT INVESTMENT COMPANIES
Investment Company Act file number: 811-04033
Sit Mutual Funds II, Inc.
(Exact name of registrant as specified in charter)
3300 IDS Center
80 South Eighth Street
Minneapolis, MN 55402
(Address of principal executive offices)
Paul E. Rasmussen, VP Treasurer
Sit Mutual Funds, Inc.
3300 IDS Center
80 South Eighth Street
Minneapolis, MN 55402
(Name and address of agent for service)
Copy to:
Mike Radmer, Esq.
Dorsey & Whitney
Suite 1500
50 South Sixth Street
Minneapolis, MN 55402-1498
Registrant’s telephone number, including area code:
(612) 334-5888
Date of fiscal year end: March 31, 2006
Date of reporting period: September 30, 2005
Item 1: Reports to Stockholders
UNITED STATES
SECURITIES AND EXCHANGE COMMISSION
Washington, D.C. 20549
FORM N-CSR
CERTIFIED SHAREHOLDER REPORT OF REGISTERED
MANAGEMENT INVESTMENT COMPANIES
Investment Company Act file number: 811-21447
Sit Mutual Funds Trust
(Exact name of registrant as specified in charter)
3300 IDS Center
80 South Eighth Street
Minneapolis, MN 55402
(Address of principal executive offices)
Paul E. Rasmussen, VP Treasurer
Sit Mutual Funds, Inc.
3300 IDS Center
80 South Eighth Street
Minneapolis, MN 55402
(Name and address of agent for service)
Copy to:
Mike Radmer, Esq.
Dorsey & Whitney
Suite 1500
50 South Sixth Street
Minneapolis, MN 55402-1498
Registrant’s telephone number, including area code:
(612) 334-5888
Date of fiscal year end: March 31, 2006
Date of reporting period: September 30, 2005
Item 1: Reports to Stockholders

Sit Mutual Funds
Bond Funds
Semi-Annual Report
September 30, 2005
Money Market Fund
U.S. Government Securities Fund
Tax-Free Income Fund
Minnesota Tax-Free Income Fund
Florida Tax-Free Income Fund
| Sit Mutual Funds |
| | BOND FUNDS SEMI-ANNUAL REPORT |
| TABLE OF CONTENTS |
| | Page
|
| Chairman’s Letter | 2 |
| Performance Summary | 4 |
| Average Annual Total Returns | 6 |
| Fund Reviews and Portfolios of Investments |
| Money Market Fund | 8 |
| U.S. Government Securities Fund | 12 |
| Tax-Free Income Fund | 24 |
| Minnesota Tax-Free Income Fund | 42 |
| Florida Tax-Free Income Fund | 58 |
| Notes to Portfolios of Investments | 62 |
| Statements of Assets and Liabilities | 64 |
| Statements of Operations | 66 |
| Statements of Changes in Net Assets | 68 |
| Notes to Financial Statements | 70 |
| Financial Highlights | 75 |
| Expense Example | 80 |
| Additional Information | 84 |
| A Look at Sit Mutual Funds | 85 |
This document must be preceded or accompanied by a Prospectus.
1
Dear fellow shareholders:
Short and intermediate interest rates rose, and longer-term rates fell during the 6 months ended September 30, 2005. The Federal Reserve raised the federal funds rate by 0.25% at each of its four meetings over the period, which left the rate target at 3.75% at the end of September. Market participants thought that the Fed might refrain from raising rates at its September 20th meeting, so it could assess the impact of the hurricanes. However, the Fed demonstrated its conviction to contain inflation by raising rates another 0.25% at that meeting. The Fed also indicated that it will continue to raise rates at a “measured pace”.
Recent economic data have begun to show the effects of Hurricane Katrina. High energy costs are having an impact on consumer spending, particularly at lower income levels. Personal consumption expenditures dropped in the month of August, but the decline was mostly the result of a reduction in durable goods spending, which was boosted in July by vehicle sales incentives. The consumer will continue to play a large role in the economy, as two-thirds of GDP is comprised by the consumer sector. Real personal consumption for August was still up +3.5% year over year, but down from +4.5% in June.
Employment, another determinant of future consumer spending, has remained healthy. Reported payrolls declined 8,000 in September, but would have increased around 200,000 after adjusting for hurricane-related payroll losses, in line with the prior twelve months’ average. Job creation has averaged 196,000 per month this year, on top of a strong 183,000 per month rate in 2004. In addition to strong employment, the latest measures of manufacturing activity have also been remarkably strong.
With respect to pricing trends, as expected, higher energy prices are making their way into inflation measures. The Consumer Price Index (CPI) rose +0.5% for the second consecutive month in August as gasoline prices jumped +7.7%. Year over year the CPI is up +3.6%. There may be more to come in terms of higher energy prices, as the CPI and PPI inflation measures have not yet captured much of the effects of Hurricane Katrina. The Bureau of Labor Statistics stated that, “Over 90% of the prices for August were collected prior to August 29th, the date when Hurricane Katrina struck the Gulf Coast.” An early warning sign may be the ISM prices paid index, which surged again in September to 78.0 from 62.5 in August and 48.5 in July, as 60 percent of supply executives reported paying higher prices.
The Congressional Budget Office (CBO) estimates that real GDP will grow about 0.5 percentage points slower over the second half of 2005 due to the hurricanes, with most of that slowing occurring in the third quarter. The CBO also anticipates that with private and government support for recovery and rebuilding, GDP growth will not be much affected in the fourth quarter. The CBO expects GDP to return to its previous trend by early 2006 and to accelerate subsequently as rebuilding raises overall economic activity.
The cumulative budget deficit has been $352.6 billion through eleven months of fiscal year 2005, an $84.9 billion improvement over last year. However this year’s budget deficit improvement will likely be short lived. Congress has already approved more than $60 billion in emergency spending related to Hurricane Katrina, which could ultimately increase to $150 billion to $200 billion.
In summary, based on a slightly weaker outlook for consumer spending in the third quarter, but a more optimistic viewpoint regarding other effects of the hurricanes on second half growth, we now expect +3.5% real GDP growth in the third quarter and +3.8% growth in the fourth quarter. Depending on the speed of the
2
rebuilding process, we forecast stronger growth will emerge in 2006. Our full-year 2005 real GDP growth forecast remains approximately +3.6%, which compares with +4.2% in 2004.
Strategy Summary
We expect the yield curve to continue to flatten, with short rates rising more than rates for longer maturities. It appears likely that the Fed will maintain its tightening stance as long as economic growth is solidly above +3.0% and signs of inflation are evident. It seems the Fed has discounted the effects of Hurricane Katrina as having a short-term impact and that it will continue its course of increasing rates at a “measured pace.” Fed policy is complicated by higher energy costs acting both as a drag on the economy, and a source of inflationary pressure. Because the CPI has edged higher to +3.6% year over year, we expect the Fed will raise its rate target a further +0.25% at two of the next three meetings (meetings in November, December and the end of January) to bring the Fed Funds target to 4.25%. By the March 28th, 2006 meeting, there should be more clarity on the direction of the economy, inflation, and the recovery efforts following the hurricanes. Long-term rates will likely move inversely with the direction of oil prices for the near term. Another factor weighing on the market is the uncertainty surrounding the appointment of Ben Bernanke, who will replace longtime Fed Chairman Alan Greenspan in early 2006.
We continue to monitor these issues and invest accordingly. We are focusing on securities whose structures offer higher current yields at the expense of reduced price appreciation potential. The rise in interest rates should help slow refinancing activity in the mortgage sector, and the expectation of more stable prepayment rates should result in increased investor demand.
Municipal portfolios also remain focused on securities that provide incremental yield, and remain defensively positioned with durations shorter than their benchmarks. We believe our focus on income will contribute to attractive relative returns, and as interest rates move higher, our short durations will allow us to reinvest at higher levels.
Fixed income investments are an important component of a well-diversified long-term portfolio. We believe that the Sit bond funds, with their dual objectives of high income and stability of principal, offer an attractive risk/reward profile to complement equity holdings. We appreciate your continued interest and investment in Sit Mutual Funds and look forward to assisting you in achieving your long-term investment goals.
With best wishes,

Eugene C. Sit, CFA
Chairman and Chief Investment Officer
3
| Sit Mutual Funds
Six Months Ended September 30, 2005
Performance Summary – Bond Funds
|  |
The U.S. Treasury yield curve continued to flatten during the six-month period as shorter maturity yields rose and longer maturity yields declined. The Federal Reserve increased its rate target by 25 basis points at each of its four meetings during the period, bringing the federal funds rate to 3.75%. Treasury bill yields rose more than 75 basis points during the period while 2-year Treasury yields rose only 39 basis points. 10-year and 30-year yields fell 16 and 19 basis points, respectively, as investors continued to react to long-term inflation expectations. As short-term rates and oil prices have continued to rise, long-term bondholders have reduced economic growth and long-term inflation expectations, leading to the decrease in long-term yields over the period.
The flattening yield curve caused intermediate maturity taxable bonds to perform worse than longer maturity bonds. With regard to taxable market sectors, asset backed securities provided the worst returns, reflecting concerns about how a weaker economy and high energy costs could impact consumers and lead to higher delinquencies. There was little dispersion in returns among other sectors as Treasuries and corporates posted similar returns for the six-month period.
The municipal yield curve flattened somewhat during the period as short yields increased only slightly and intermediate term and longer term yields dropped. Despite the flattening yield curve environment over the last year, the municipal yield curve remains quite positively sloped, with approximately 125 basis points greater yield differential between 2-year and 30-year maturity AAA general obligation issues than between comparable maturity Treasuries. Investors have continued to seek out yield, which drove demand for tobacco settlement revenue bonds, and other high yield bonds, making industrial development bonds the best performing sector over the past six months. The hospital sector was the next best performing sector, and housing bonds lagged.
Fixed income funds remain defensively positioned, with durations shorter than respective benchmarks in anticipation of more attractive, higher-yielding reinvestment opportunities as interest rates move higher. Our focus on securities that provide high levels of income and relative price stability should continue to provide attractive relative returns in the months ahead.
| TOTAL RETURNS – CALENDAR YEAR | | |
|---|
| 1996 | | 1997 | | 1998 | | 1999 | | 2000 | | 2001 | | 2002 | | 2003 | | 2004 | | YTD
2005 | | 30-Day
SEC Yield
as of
9/30/05 | Distribution
Rate (2) |
|---|
|
|
| Sit Money Market Fund | | | | 5.08 | % | | 5.22 | % | | 5.17 | % | | 4.79 | % | | 6.03 | % | | 3.67 | % | | 1.25 | % | | 0.65 | % | | 0.88 | % | | 1.87 | % | | 3.26 | %(3) | | | |
|
| Sit U.S. Gov’t. Securities Fund | | | | 4.99 | | | 8.19 | | | 6.52 | | | 1.37 | | | 9.15 | | | 8.56 | | | 5.79 | | | 1.19 | | | 3.35 | | | 1.93 | | | 4.07 | | | 3.74 | % |
|
| Sit Tax-Free Income Fund | | | | 5.69 | | | 9.87 | | | 6.29 | | | -4.01 | | | 8.32 | | | 5.84 | | | 5.69 | | | 2.87 | | | 3.96 | | | 2.44 | | | 4.36 | (4) | | 3.75 | |
|
Sit Minnesota Tax-Free
Income Fund | | | | 5.89 | | | 8.19 | | | 6.14 | | | -3.82 | | | 8.09 | | | 5.85 | | | 7.06 | | | 4.42 | | | 3.68 | | | 3.40 | | | 4.31 | (5) | | 4.21 | |
|
Sit Florida Tax-Free
Income Fund | | | | — | | | — | | | — | | | — | | | — | | | — | | | — | | | — | | | 2.58 | | | 2.36 | | | 4.18 | (6) | | 3.06 | |
|
| 3-Month U.S. Treasury Bill | | | | 5.27 | | | 5.32 | | | 5.01 | | | 4.88 | | | 6.16 | | | 3.50 | | | 1.67 | | | 1.03 | | | 1.41 | | | 2.26 | |
| Lehman Inter. Government Bond Index | | | | 4.06 | | | 7.72 | | | 8.49 | | | 0.49 | | | 10.47 | | | 8.42 | | | 9.64 | | | 2.29 | | | 2.33 | | | 1.08 | |
| Lehman 5-Year Municipal Bond Index | | | | 4.22 | | | 6.38 | | | 5.84 | | | 0.74 | | | 7.72 | | | 6.21 | | | 9.27 | | | 4.13 | | | 2.72 | | | 0.64 | |
| | | Total Returns | | Average Annual Total Returns for the
Periods Ended September 30, 2005 |
|---|
| NASDAQ
Symbol | | Inception | | Quarter
Ended
9/30/05 | | Six Months
Ended
9/30/05 | | 1 Year | | 5 Years | | 10 Years | | Since
Inception |
|---|
|
|
| Sit Money Market Fund(1) | | | SNIXX | | | 11/01/93 | | | | 0.75 | % | | 1.37 | % | | 2.25 | % | | 1.97 | % | | 3.58 | % | | 3.72 | % |
|
| Sit U.S. Gov’t. Securities Fund | | | SNGVX | | | 06/02/87 | | | | -0.17 | | | 1.80 | | | 2.45 | | | 4.83 | | | 5.37 | | | 6.81 | |
|
| Sit Tax-Free Income Fund | | | SNTIX | | | 09/29/88 | | | | 0.54 | | | 2.12 | | | 3.18 | | | 4.73 | | | 4.98 | | | 6.07 | |
|
| Sit Minnesota Tax-Free Income Fund | | | SMTFX | | | 12/01/93 | | | | 0.51 | | | 2.78 | | | 4.80 | | | 5.42 | | | 5.16 | | | 5.26 | |
|
| Sit Florida Tax-Free Income Fund | | | SFLIX | | | 12/31/03 | | | | 0.53 | | | 2.00 | | | 3.21 | | | — | | | — | | | 2.83 | |
|
| 3-Month U.S. Treasury Bill | | | | | | 11/01/93 | | | | 0.86 | | | 1.60 | | | 2.78 | | | 2.28 | | | 3.77 | | | 3.95 | |
| Lehman Inter. Government Bond Index | | | | | | 05/31/87 | | | | -0.52 | | | 1.77 | | | 1.31 | | | 5.51 | | | 5.78 | | | 6.99 | |
| Lehman 5-Year Municipal Bond Index | | | | | | 09/30/88 | | | | -0.10 | | | 1.81 | | | 1.45 | | | 5.13 | | | 4.96 | | | 6.02 | |
| (1) | Converted from Sit Investment Reserve Fund to Sit Money Market Fund on 11/1/93. |
| (2) | Based on the last 12 monthly distributions of net investment income and average NAV as of 9/30/05. |
| (3) | Figure represents 7-day compound effective yield. The 7-day simple yield as of 9/30/05 was 3.21%. |
| (4) | For individuals in the 25%, 28%, 33%, and 35% federal tax brackets, the federal tax equivalent yields are 5.81%, 6.06%, 6.51% and 6.71%, respectively (income subject to state tax, if any). |
| (5) | For Minnesota residents in the 25%, 28%, 33% and 35% federal tax brackets, the double exempt tax equivalent yields are 6.24%, 6.50%, 6.98% and 7.20%, respectively (assumes the maximum Minnesota tax bracket of 7.85%). |
| (6) | For individuals in the 25%, 28%, 33%, and 35% federal tax brackets, the tax equivalent yields are 5.57%, 5.81%, 6.24% and 6.43%, respectively (income subject to state tax, if any). |
Performance figures are historical and do not guarantee future results. Investment returns and principal value will vary, and you may have a gain or loss when you sell shares. Average annual total returns include changes in share price as well as reinvestment of all dividends and capital gains.
| Sit Mutual Funds
Average Annual Total Returns for Periods Ended December 31, 2004
|
The tables on the next page show the Funds’ average annual total returns (before and after taxes) and the change in value of a broad-based market index over various periods ended December 31, 2004. The index information is intended to permit you to compare each Fund’s performance to a broad measure of market performance. The after-tax returns are intended to show the impact of federal income taxes on an investment in a Fund. The highest individual federal marginal income tax rate in effect during the specified period is assumed, and the state and local tax impact is not reflected.
A Fund’s “Return After Taxes on Distributions” shows the effect of taxable distributions (dividends and capital gain distributions), but assumes that you still hold the fund shares at the end of the period and so do not have any taxable gain or loss on your investment in the Fund.
A Fund’s “Return After Taxes on Distributions and Sale of Fund Shares” shows the effect of both taxable distributions and any taxable gain or loss that would be realized if the Fund shares were purchased at the beginning and sold at the end of the specified period.
The Funds’ past performance, before and after taxes, is not an indication of how the Funds will perform in the future. Your actual after-tax returns depend on your own tax situation and may differ from those shown. After-tax returns reflect past tax effects and are not predictive of future tax effects. After-tax returns are not relevant to investors who hold their Fund shares in a tax-deferred account (including a 401(k) or IRA account).
6
|
| |
|
| Sit U. S. Government Securities Fund | | | 1 Year | | | 5 Years | | | 10 Years | | |
| Return Before Taxes | | | 3.4% | | | 5.6% | | | 6.0% | | |
| Return After Taxes on Distributions | | | 2.1% | | | 3.8% | | | 3.9% | | |
| Return After Taxes on Distributions and Sale of Fund Shares | | | 2.2% | | | 2.9% | | | 3.4% | | |
| Lehman Intermediate Government Bond Index | | | 2.3% | | | 6.6% | | | 6.8% | | |
|
| |
| |
|
| Sit Tax-Free Income Fund | | | 1 Year | | | 5 Years | | | 10 Years | | |
| Return Before Taxes | | | 4.0% | | | 5.3% | | | 5.6% | | |
| Return After Taxes on Distributions | | | 4.0% | | | 5.3% | | | 5.6% | | |
| Return After Taxes on Distributions and Sale of Fund Shares | | | 4.0% | | | 5.2% | | | 5.6% | | |
| Lehman 5-Year Municipal Bond Index | | | 2.7% | | | 6.0% | | | 5.8% | | |
|
| |
| |
|
| Sit Minnesota Tax-Free Income Fund | | | 1 Year | | | 5 Years | | | 10 Years | | |
| Return Before Taxes | | | 3.7% | | | 5.8% | | | 5.7% | | |
| Return After Taxes on Distributions | | | 3.7% | | | 5.8% | | | 5.7% | | |
| Return After Taxes on Distributions and Sale of Fund Shares | | | 3.9% | | | 5.7% | | | 5.6% | | |
| Lehman 5-Year Municipal Bond Index | | | 2.7% | | | 6.0% | | | 5.8% | | |
|
| |
| |
|
| Sit Florida Tax-Free Income Fund | | | 1 Year | | | 5 Years | | | Since Inception* | | |
| Return Before Taxes | | | 2.6% | | | n/a | | | 2.6% | | |
| Return After Taxes on Distributions | | | 2.6% | | | n/a | | | 2.6% | | |
| Return After Taxes on Distributions and Sale of Fund Shares | | | 2.6% | | | n/a | | | 2.6% | | |
| Lehman 5-Year Municipal Bond Index | | | 2.7% | | | n/a | | | 2.7% | | |
|
*Inception date 12/31/03.
| Notes: |
| (1) | After-tax returns are calculated using the historical highest individual federal marginal income tax rates and do not reflect the impact of state and local taxes. |
| (2) | Actual after-tax returns depend on an investor’s tax situation and may differ from those shown, and after-tax returns shown are not relevant to investors who hold their shares through tax-deferred arrangements, such as 401(k) plans or individual retirement accounts. |
| (3) | Indices reflect no deduction for fees, expenses, or taxes. |
7
| Sit Money Market Fund
Six Months Ended September 30, 2005
Michael C. Brilley, Senior Portfolio Manager
Mark H. Book, CFA, Portfolio Manager
|
The Sit Money Market Fund returned +1.37% for the six months ended September 30, 2005 compared to +1.60% for the 3-month U.S. Treasury Bill. As of September 30th, the Fund’s 7-day compound yield was 3.26% and its average maturity was 24 days.
The Federal Reserve increased its rate target by 25 basis points at each of its four meetings during the period, bringing the federal funds rate to 3.75%. Market participants thought that the Fed might refrain from raising rates at its September 20th meeting, so it could assess the impact of the hurricanes. However, the Fed demonstrated its conviction to contain inflation by raising rates another 0.25% at that meeting. The Fed also indicated that it will continue to raise rates at a “measured pace.” Because inflation has begun to edge higher, we expect that the Federal Reserve will continue on the path of raising interest rates. We believe the Fed will most likely increase the federal funds target by 25 basis points at two of the next three FOMC meetings (meetings in November, December, and late January) to bring the target rate to 4.25%. By the March 28th, 2006 meeting, there should be more clarity on the direction of the economy, inflation, and the recovery efforts following the hurricanes.
The Fund has maintained its average maturity near the short end of its customary 20-40 day range as the 3-Month Treasury Bill yield increased 77 basis points over the past six months. The Fund will maintain its rather short average maturity in anticipation of earning higher yields as the Fed continues to raise short-term rates. If the pace of tightening slows or ceases, we expect to extend the average maturity to the middle or longer end of its customary range. The Fund continues to invest in companies with top-tier credit quality.
| INVESTMENT OBJECTIVE AND STRATEGY |
|---|
The objective of the Fund is to achieve maximum current income to the extent consistent with the preservation of capital and maintenance of liquidity. The Fund pursues this objective by investing in short-term debt instruments which mature in 397 days or less and by maintaining a dollar-weighted portfolio maturity of 90 days or less.
An investment in the Fund is neither insured nor guaranteed by the U.S. Government and there can be no assurance that the Fund will be able to maintain a stable net asset value of $1.00 per share.
| | Net Asset Value 9/30/05: | | $1.00 Per Share | | |
| | 3/31/05: | | $1.00 Per Share | | |
| |
| | Total Net Assets: | | $58.6 Million | | |
PORTFOLIO STRUCTURE
(% OF TOTAL NET ASSETS) |
|---|
8
| AVERAGE ANNUAL TOTAL RETURNS* |
|---|
| Sit Money
Market
Fund
| | 3-Month
U.S. Treasury
Bill
| | Lipper
Money
Market Index
|
|---|
| 3 Month** | | | 0.75% | | | 0.86% | | | 0.73% | | |
| 6 Month** | | | 1.37 | | | 1.60 | | | n/a | | |
| 1 Year | | | 2.25 | | | 2.78 | | | 2.11 | | |
| 5 Years | | | 1.97 | | | 2.28 | | | 1.96 | | |
| 10 Years | | | 3.58 | | | 3.77 | | | 3.54 | | |
| Inception | | | 3.72 | | | 3.95 | | | 3.67 | | |
| (11/1/93) | | |
| CUMULATIVE TOTAL RETURNS* |
|---|
| Sit Money
Market
Fund
| | 3-Month
U.S. Treasury
Bill
| | Lipper
Money
Market Index
|
|---|
| 1 Year | | | 2.25% | | | 2.78% | | | 2.11% | | |
| 5 Year | | | 10.23 | | | 11.93 | | | 10.18 | | |
| 10 Year | | | 42.14 | | | 44.82 | | | 41.61 | | |
| Inception | | | 54.49 | | | 58.78 | | | 53.70 | | |
| (11/1/93) | | |
*As of 9/30/05 | **Not annualized. |
Performance is historical and assumes reinvestment of all dividends and capital gains. Money funds are neither insured nor guaranteed by the U.S. Government. There is no assurance that a fund will maintain a $1 share value. Yield fluctuates. Past performance is not a guarantee of future results. Management fees and administrative expenses are included in the Fund’s performance; however, fees and expenses are not incorporated in the 3-Month U.S. Treasury Bill. The Lipper returns are obtained from Lipper Analytical Services, Inc., a large independent evaluator of mutual funds.
The sum of $10,000 invested at inception (11/1/93) and held until 9/30/05 would have grown to $15,449 in the Fund or $15,878 in the 3-Month U.S. Treasury Bill assuming reinvestment of all dividends and capital gains.
| Sit Money Market Maturity Ranges |
|---|
9
| Sit Money Market Fund
September 30, 2005
Portfolio of Investments (Unaudited)
|
|
| Quantity ($) | | Name of Issuer | Market Value ($)(1) |
|---|
|
Commercial Paper (95.8%)(2)
Asset-Backed (16.6%) |
| | | | Daimler-Chrysler Auto Conduit: | | | | | |
| | 1,163,000 | | 3.62%, 10/11/2005 | | | | 1,161,831 | |
| | 1,400,000 | | 3.78%, 10/19/2005 | | | | 1,397,354 | |
| | 2,500,000 | | FCAR Owner Trust Series I, | | |
| | | | 3.79%, 11/9/2005 | | | | 2,489,735 | |
| | 2,200,000 | | Mortgage Interest Networking Trust, | | |
| | | | 3.67%, 10/18/2005 | | | | 2,196,187 | |
| | | | New Center Asset Trust: | | |
| | 1,100,000 | | 3.73%, 10/17/2005 | | | | 1,098,176 | |
| | 1,405,000 | | 3.73%, 10/20/2005 | | | | 1,402,234 | |
| |
| |
| | | | | | | | 9,745,517 | |
| |
| |
| Captive Auto Finance (4.2%) |
| | 2,500,000 | | Toyota Motor Credit Corp., | | |
| | | | 3.77%, 11/14/2005 | | | | 2,488,481 | |
| |
| |
| Captive Equipment Finance (4.3%) |
| | 2,500,000 | | Caterpillar Financial Services Corp., | | |
| | | | 3.70%, 10/11/2005 | | | | 2,497,431 | |
| |
| |
| Communications (7.3%) |
| | 2,200,000 | | Bellsouth Corp., | | |
| | | | 3.56%, 10/7/2005 | | | | 2,198,695 | |
| | 2,100,000 | | Verizon Global Funding Corp., | | |
| | | | 3.64%, 10/12/2005 (5) | | | | 2,097,664 | |
| |
| |
| | | | | | | | 4,296,359 | |
| |
| |
| Consumer Durables (3.8%) |
| | | | American Honda Finance: | | |
| | 1,100,000 | | 3.56%, 10/5/2005 | | | | 1,099,565 | |
| | 1,100,000 | | 3.61%, 10/25/2005 | | | | 1,097,353 | |
| |
| |
| | | | | | | | 2,196,918 | |
| |
| |
| Consumer Loan Finance (7.3%) |
| | 2,100,000 | | American Express Credit Corp., | | |
| | | | 3.67%, 10/31/2005 | | | | 2,093,577 | |
| | 2,200,000 | | American General Financial Corp., | | |
| | | | 3.64%, 10/24/2005 | | | | 2,194,884 | |
| |
| |
| | | | | | | | 4,288,461 | |
| |
| |
| Consumer Non-Durables (12.3%) |
| | | | Coca Cola Co.: | | |
| | 1,350,000 | | 3.56%, 10/17/2005 | | | | 1,347,864 | |
| | 850,000 | | 3.58%, 11/1/2005 | | | | 847,380 | |
| | 2,500,000 | | Coca Cola Enterprises, | | |
| | | | 3.75%, 10/5/2005 (5) | | | | 2,498,958 | |
|
| Quantity ($) | | Name of Issuer | Market Value ($)(1) |
|---|
|
| | | | Procter & Gamble: | | | | | |
| | 1,200,000 | | 3.49%, 10/19/2005 | | | | 1,197,906 | |
| | 1,300,000 | | 3.72%, 11/16/2005 | | | | 1,293,821 | |
| |
| |
| | | | | | | | 7,185,929 | |
| |
| |
| Consumer Servives (3.2%) |
| | 1,891,000 | | United Parcel Service, | | |
| | | | 3.50%, 10/3/2005 | | | | 1,890,632 | |
| |
| |
| Diversified Finance (12.2%) |
| | 2,500,000 | | CIT Group Holdings, | | |
| | | | 3.83%, 12/7/2005 | | | | 2,482,180 | |
| | 2,500,000 | | GE Capital Corp., | | |
| | | | 3.73%, 11/14/2005 | | | | 2,488,603 | |
| | 2,200,000 | | GE Capital Services, | | |
| | | | 3.66%, 10/26/2005 | | | | 2,194,408 | |
| |
| |
| | | | | | | | 7,165,191 | |
| |
| |
| Energy (4.3%) |
| | 2,500,000 | | Chevron Texaco Funding Corp., | | |
| | | | 3.70%, 10/28/2005 | | | | 2,493,063 | |
| |
| |
| Financial Services (7.2%) |
| | 2,500,000 | | Citigroup, Inc., | | |
| | | | 3.70%, 10/21/2005 | | | | 2,494,861 | |
| | | | UBS Finance Corp.: | | |
| | 1,200,000 | | 3.61%, 10/14/2005 | | | | 1,198,436 | |
| | 556,000 | | 3.70%, 10/19/2005 | | | | 554,971 | |
| |
| |
| | | | | | | | 4,248,268 | |
| |
| |
| Health Technology (3.8%) |
| | 2,200,000 | | Pfizer, Inc., | | |
| | | | 3.56%, 10/6/2005 (5) | | | | 2,198,912 | |
| |
| |
| Insurance (1.4%) |
| | 800,000 | | American Family Financial, | | |
| | | | 3.72%, 11/23/2005 | | | | 795,619 | |
| |
| |
| Producer Manuafactoring (4.2%) |
| | | | Siemens Capital: | | |
| | 1,100,000 | | 3.58%, 10/13/2005 | | | | 1,098,687 | |
| | 1,400,000 | | 3.80%, 11/28/2005 | | | | 1,391,429 | |
| |
| |
| | | | | | | | 2,490,116 | |
| |
| |
| Retail Trade (3.7%) |
| | 2,200,000 | | Wal-Mart Stores, Inc., | | |
| | | | 3.65%, 11/10/2005 | | | | 2,191,078 | |
| |
| |
See accompanying notes to portfolios of investments on page 62.
10
|
| Quantity ($) | | Name of Issuer | Market Value ($)(1) |
|---|
|
Total Commercial Paper
(cost: $56,171,975) | | | 56,171,975 | |
| |
| |
| |
| U.S. Government Securities (4.5%)(2) | |
| | 2,613,000 | | FHLMC Discount Note, 3.2%, 10/3/05 | | | | 2,612,535 | |
| |
| |
| |
Total U.S. Government Securities
(cost: $2,612,535) | | | 2,612,535 | |
| |
| |
| |
Total investments in securities
(cost:$58,784,510)(7) | | $ | 58,784,510 | |
| |
| |
11
| Sit U.S. Government Securities Fund
Six Months Ended September 30, 2005
Senior Portfolio Managers, Michael C. Brilley and Bryce A. Doty, CFA
Portfolio Manager, Mark H. Book, CFA
|
The Sit U.S. Government Securities Fund provided investors with a +1.80% return during the past six months while the Lehman Intermediate Government Bond Index returned +1.77%. The Fund’s 30-day SEC yield was 4.07% and its 12-month distribution rate was 3.74%.
The yield curve flattened during the period as the Federal Reserve continued raising short-term interest rates. The Fed increased its federal funds target level 0.25% to 3.75% on September 20, 2005. This was the eleventh consecutive 0.25% increase since June of last year, when the Fed began raising its target rate. Despite the higher short-term rates, longer maturity U.S. Treasury yields declined, reflecting the market’s belief that the Fed’s actions will be successful in containing inflation. As a result, longer maturity securities performed better than shorter maturity securities. The Fund’s allocation to U.S. Treasuries was the strongest performing sector, as it had a longer average maturity than the other sectors. The Fund’s collateralized mortgage obligations (CMO’s) also outperformed the benchmark as this sector generated higher levels of income than the benchmark. Despite the high levels of income generated by the agency mortgage pass-throughs, the returns from this sector just matched that of the benchmark.
The bond market has recently been driven by oil prices and the Fed. While higher energy costs resulting from the recent hurricanes have produced significant inflationary pressures, data suggests that the economy continues to grow at relatively strong levels. We expect that this combination of economic growth and higher inflation will result in higher interest rates overall, with shorter term rates rising faster than longer term rates. Within this interest rate environment, we continue to emphasize securities that provide both high levels of income and low levels of price sensitivity to changes in interest rates. Within the Fund, we accomplish this focus through ownership of high coupon mortgage pass-through securities, as has consistently been the case since the Fund’s inception. These securities continue to provide a strong track record of providing attractive income return regardless of changes in underlying interest rates.
| INVESTMENT OBJECTIVE AND STRATEGY |
|---|
The objective of the U.S. Government Securities Fund is to provide high current income and safety of principal, which it seeks to attain by investing solely in debt obligations issues, guaranteed or insured by the U.S. government or its agencies or its instrumentalities.
Agency mortgage securities and U.S. Treasury securities will be the principal holdings in the Fund. The mortgage securities that the Fund will purchase consist of pass-through securities including those issued by Government National Mortgage Association (GNMA), Federal National Mortgage Asociation (FNMA), and Federal Home Loan Mortgage Corporation (FHLMC).
| | Net Asset Value 9/30/05: | | $10.61 Per Share | | |
| | 3/31/05: | | $10.62 Per Share | | |
| | Total Net Assets: | | $262.9 Million | | |
| | 30-day SEC Yield: | | 4.07% | | |
| | 12-Month Distribution Rate: | | 3.74% | | |
| | Average Maturity: | | 20.7 Years | | |
| | Effective Duration: | | 2.9 Years(1) | | |
| |
| (1) Effective duration is a measure which reflects estimated price sensitivity to a given change in interest rates. For example, for an interest rate change of 1.0%, a portfolio with a duration of 5 years would be expected to experience a price change of 5%. Effective duration is based on current interest rates and the Adviser’s assumptions regarding the expected average life of individual securities held in the portfolio. |
PORTFOLIO STRUCTURE
(% OF TOTAL NET ASSETS) |
|---|
12
| AVERAGE ANNUAL TOTAL RETURNS* |
|---|
| Sit
U.S. Gov’t.
Securities
Fund
| | Lehman
Inter. Gov’t.
Bond Index
| | Lipper
U.S. Gov’t.
Fund Index
|
|---|
| 3 Month** | | | -0.17% | | | -0.52% | | | -0.63% | | |
| 6 Month** | | | 1.80 | | | 1.77 | | | n/a | | |
| 1 Year | | | 2.45 | | | 1.31 | | | 2.72 | | |
| 5 Year | | | 4.83 | | | 5.51 | | | 5.66 | | |
| 10 Year | | | 5.37 | | | 5.78 | | | 5.55 | | |
| Inception | | | 6.81 | | | 6.99 | | | 6.59 | | |
| (6/2/87) | | |
| CUMULATIVE TOTAL RETURNS* |
|---|
| Sit
U.S. Gov't.
Securities
Fund
| | Lehman
Inter. Gov't.
Bond Index
| | Lipper
U.S. Gov't.
Fund Index
|
|---|
| 1 Year | | | 2.45% | | | 1.31% | | | 2.72% | | |
| 5 Year | | | 26.63 | | | 30.76 | | | 31.71 | | |
| 10 Year | | | 68.74 | | | 75.46 | | | 71.59 | | |
| Inception | | | 234.84 | | | 245.70 | | | 222.60 | | |
| (6/2/87) | | |
*As of 9/30/05 | **Not annualized. |
Performance figures are historical and do not guarantee future results. Investment returns and principal value will vary, and you may have a gain or loss when you sell shares. Average annual total returns include changes in share price as well as reinvestment of all dividends and capital gains. Management fees and administrative expenses are included in the Fund’s performance; however, fees and expenses are not incorporated in the Lehman Intermediate Government Bond Index. The Lipper returns are obtained from Lipper Analytical Services, Inc., a large independent evaluator of mutual funds.
The sum of $10,000 invested at inception (6/2/87) and held until 9/30/05 would have grown to $33,484 in the Fund or $34,570 in the Lehman Intermediate Government Bond Index assuming reinvestment of all dividends and capital gains.
| ESTIMATED AVERAGE LIFE PROFILE |
|---|
13
| Sit U.S. Government Securities Fund
September 30, 2005
Portfolio of Investments (Unaudited)
|
Mortgage Pass-Through Securities (62.7%) (2)
Federal Home Loan Mortgage Corporation (17.6%):
| Par ($) | Coupon | Maturity | Market Value ($)(1) |
|---|
| 2,322,357 | 3.08% | 5/1/2034 | 2,277,312 |
| 65,889 | 5.50% | 8/1/2017 | 67,445 |
| 283,288 | 6.38% | 12/1/2026 | 289,667 |
| 79,215 | 6.38% | 8/1/2027 | 81,536 |
| 137,994 | 6.38% | 12/1/2027 | 142,037 |
| 739,830 | 6.50% | 8/1/2029 | 760,822 |
| 128,033 | 7.00% | 7/1/2024 | 134,409 |
| 85,570 | 7.00% | 2/1/2029 | 89,800 |
| 1,927,495 | 7.00% | 10/1/2031 | 2,014,433 |
| 4,627,207 | 7.00% | 7/1/2032 | 4,834,561 |
| 438,683 | 7.38% | 12/17/2024 | 468,916 |
| 101,102 | 7.50% | 10/1/2012 | 105,811 |
| 67,210 | 7.50% | 4/1/2021 | 71,322 |
| 214,679 | 7.50% | 5/1/2026 | 227,587 |
| 38,986 | 7.50% | 2/1/2027 | 41,414 |
| 193,614 | 7.50% | 4/1/2027 | 205,672 |
| 1,483,523 | 7.50% | 7/1/2029 | 1,572,720 |
| 210,764 | 7.50% | 3/1/2030 | 223,436 |
| 1,664,363 | 7.50% | 1/1/2031 | 1,764,606 |
| 1,894,225 | 7.50% | 10/1/2031 | 2,017,941 |
| 214,812 | 7.50% | 2/1/2032 | 227,728 |
| 3,348,374 | 7.50% | 4/1/2032 | 3,549,695 |
| 2,283,610 | 7.50% | 7/1/2032 | 2,421,219 |
| 97,042 | 8.00% | 10/1/2016 | 103,787 |
| 742,579 | 8.00% | 12/1/2016 | 793,427 |
| 43,837 | 8.00% | 5/1/2017 | 46,683 |
| 545,876 | 8.00% | 12/1/2023 | 579,574 |
| 229,809 | 8.00% | 7/1/2024 | 245,790 |
| 261,942 | 8.00% | 9/1/2024 | 280,159 |
| 452,754 | 8.00% | 9/15/2024 | 481,739 |
| 163,711 | 8.00% | 11/1/2025 | 174,982 |
| 91,940 | 8.00% | 12/1/2026 | 98,187 |
| 119,895 | 8.00% | 1/1/2027 | 128,161 |
| 138,855 | 8.00% | 10/1/2027 | 148,435 |
| 1,618,252 | 8.00% | 10/17/2027 | 1,723,236 |
| 147,924 | 8.00% | 1/1/2028 | 158,123 |
| 75,738 | 8.00% | 7/1/2028 | 80,765 |
| 293,117 | 8.00% | 6/1/2030 | 313,061 |
| 130,948 | 8.00% | 11/1/2030 | 139,696 |
| 172,456 | 8.00% | 11/1/2030 | 183,976 |
| 153,414 | 8.00% | 2/1/2032 | 163,593 |
| 35,458 | 8.25% | 12/1/2008 | 36,544 |
| 52,736 | 8.25% | 12/1/2017 | 56,732 |
| 351,555 | 8.50% | 1/1/2016 | 377,145 |
| 662,023 | 8.50% | 5/1/2016 | 710,737 |
| 7,574 | 8.50% | 1/1/2017 | 8,194 |
| 83,393 | 8.50% | 5/1/2017 | 90,218 |
| Par ($) | Coupon | Maturity | Market Value ($)(1) |
|---|
| 160,693 | 8.50% | 10/1/2019 | 174,520 |
| 189,838 | 8.50% | 8/1/2023 | 205,455 |
| 21,296 | 8.50% | 7/1/2024 | 23,200 |
| 92,623 | 8.50% | 1/1/2025 | 100,395 |
| 130,015 | 8.50% | 4/1/2025 | 140,924 |
| 91,194 | 8.50% | 5/1/2025 | 98,846 |
| 40,768 | 8.50% | 6/1/2025 | 44,188 |
| 58,088 | 8.50% | 10/1/2026 | 63,288 |
| 616,778 | 8.50% | 12/1/2029 | 668,531 |
| 521,900 | 8.50% | 8/1/2030 | 568,592 |
| 23,360 | 8.50% | 12/1/2030 | 25,402 |
| 852,360 | 8.50% | 2/1/2031 | 923,880 |
| 162,340 | 8.50% | 4/1/2031 | 176,320 |
| 24,840 | 8.50% | 8/1/2031 | 26,979 |
| 33,660 | 8.75% | 1/1/2017 | 35,698 |
| 16,917 | 9.00% | 5/1/2009 | 17,654 |
| 7,136 | 9.00% | 6/1/2009 | 7,810 |
| 25,353 | 9.00% | 7/1/2009 | 26,458 |
| 30,072 | 9.00% | 7/1/2009 | 31,414 |
| 84,864 | 9.00% | 12/1/2009 | 88,564 |
| 18,666 | 9.00% | 10/1/2013 | 20,072 |
| 163,646 | 9.00% | 11/1/2015 | 179,175 |
| 13,484 | 9.00% | 5/1/2016 | 14,622 |
| 320,457 | 9.00% | 5/1/2016 | 350,867 |
| 99,265 | 9.00% | 7/1/2016 | 107,643 |
| 91,858 | 9.00% | 10/1/2016 | 98,947 |
| 22,019 | 9.00% | 11/1/2016 | 23,878 |
| 15,575 | 9.00% | 1/1/2017 | 16,867 |
| 10,485 | 9.00% | 1/1/2017 | 11,370 |
| 172,160 | 9.00% | 2/1/2017 | 186,690 |
| 20,292 | 9.00% | 2/1/2017 | 22,004 |
| 51,964 | 9.00% | 2/1/2017 | 54,665 |
| 7,095 | 9.00% | 4/1/2017 | 7,616 |
| 63,752 | 9.00% | 4/1/2017 | 64,908 |
| 36,046 | 9.00% | 6/1/2017 | 39,176 |
| 30,772 | 9.00% | 6/1/2017 | 33,400 |
| 7,847 | 9.00% | 9/1/2017 | 8,528 |
| 92,884 | 9.00% | 10/1/2017 | 100,949 |
| 60,644 | 9.00% | 6/1/2018 | 65,213 |
| 194,044 | 9.00% | 6/1/2019 | 209,927 |
| 22,445 | 9.00% | 10/1/2019 | 24,271 |
| 86,927 | 9.00% | 10/1/2019 | 94,844 |
| 97,132 | 9.00% | 10/1/2019 | 105,980 |
| 404,377 | 9.00% | 3/1/2020 | 439,515 |
| 207,035 | 9.00% | 9/1/2020 | 216,796 |
| 505,297 | 9.00% | 6/1/2021 | 535,265 |
| 28,465 | 9.00% | 7/1/2021 | 31,182 |
| 84,835 | 9.00% | 7/1/2021 | 92,774 |
| 55,185 | 9.00% | 10/1/2021 | 58,311 |
14
|
| |
| Par ($) | Coupon | Maturity | Market Value ($)(1) |
|---|
| 33,391 | 9.00% | 3/1/2022 | 36,374 |
| 71,346 | 9.00% | 4/1/2025 | 77,364 |
| 241,353 | 9.00% | 11/1/2025 | 265,863 |
| 1,268,612 | 9.00% | 5/1/2031 | 1,400,067 |
| 10,769 | 9.25% | 7/1/2008 | 11,301 |
| 26,325 | 9.25% | 8/1/2008 | 27,626 |
| 14,725 | 9.25% | 8/1/2009 | 15,304 |
| 63,764 | 9.25% | 7/1/2010 | 64,989 |
| 25,697 | 9.25% | 3/1/2011 | 26,680 |
| 42,051 | 9.25% | 6/1/2016 | 45,918 |
| 20,939 | 9.25% | 3/1/2017 | 22,864 |
| 367,778 | 9.25% | 2/1/2018 | 394,129 |
| 16,397 | 9.25% | 1/1/2019 | 17,023 |
| 94,517 | 9.25% | 3/1/2019 | 101,800 |
| 165,281 | 9.25% | 3/1/2019 | 175,365 |
| 1,550 | 9.50% | 10/1/2005 | 1,550 |
| 37,349 | 9.50% | 10/1/2008 | 39,301 |
| 60,533 | 9.50% | 2/1/2010 | 63,622 |
| 25,358 | 9.50% | 5/1/2010 | 25,509 |
| 21,672 | 9.50% | 6/1/2010 | 22,778 |
| 21,672 | 9.50% | 1/1/2011 | 23,323 |
| 135,676 | 9.50% | 6/1/2011 | 141,481 |
| 37,861 | 9.50% | 6/1/2016 | 41,569 |
| 10,300 | 9.50% | 7/1/2016 | 11,309 |
| 14,748 | 9.50% | 9/1/2016 | 15,700 |
| 46,720 | 9.50% | 10/1/2016 | 51,296 |
| 80,148 | 9.50% | 6/1/2017 | 88,258 |
| 41,323 | 9.50% | 9/1/2017 | 45,444 |
| 49,276 | 9.50% | 4/1/2018 | 54,393 |
| 13,519 | 9.50% | 10/1/2018 | 14,887 |
| 132,091 | 9.50% | 12/1/2018 | 144,937 |
| 11,554 | 9.50% | 6/1/2019 | 12,300 |
| 424,663 | 9.50% | 6/17/2019 | 465,382 |
| 110,606 | 9.50% | 7/1/2020 | 119,312 |
| 50,901 | 9.50% | 8/1/2020 | 55,851 |
| 3,283 | 9.50% | 9/1/2020 | 3,612 |
| 242,877 | 9.50% | 8/1/2021 | 266,937 |
| 1,590,620 | 9.50% | 12/17/2021 | 1,750,064 |
| 11,886 | 9.75% | 12/1/2008 | 12,495 |
| 40,950 | 9.75% | 12/1/2008 | 43,049 |
| 51,052 | 9.75% | 11/1/2009 | 53,669 |
| 15,793 | 9.75% | 6/1/2011 | 16,603 |
| 288,880 | 9.75% | 12/1/2016 | 312,737 |
| 43,584 | 9.75% | 6/1/2017 | 48,150 |
| 263,154 | 9.75% | 12/1/2017 | 288,899 |
| 16,000 | 9.85% | 5/1/2016 | 17,660 |
| 67,043 | 10.00% | 11/1/2010 | 70,671 |
| 65,254 | 10.00% | 11/1/2011 | 72,953 |
| 240,645 | 10.00% | 6/1/2020 | 271,203 |
| Par ($) | Coupon | Maturity | Market Value ($)(1) |
|---|
| 206,628 | 10.00% | 9/1/2020 | 230,535 |
| 142,213 | 10.00% | 3/1/2021 | 156,919 |
| 66,536 | 10.00% | 10/1/2021 | 73,113 |
| 24,483 | 10.25% | 6/1/2010 | 26,131 |
| 36,216 | 10.25% | 2/1/2017 | 38,654 |
| 61,293 | 10.29% | 9/1/2016 | 66,053 |
| 62,222 | 10.50% | 10/1/2013 | 68,382 |
| 109,637 | 10.50% | 5/1/2014 | 117,404 |
| 28,794 | 10.50% | 9/1/2015 | 32,012 |
| 24,425 | 10.50% | 1/1/2019 | 27,535 |
| 466,569 | 10.50% | 6/1/2019 | 520,345 |
| 868 | 10.50% | 7/1/2020 | 979 |
| 9,368 | 11.00% | 12/1/2011 | 10,316 |
| 42,916 | 11.00% | 6/1/2015 | 46,846 |
| 42,578 | 11.00% | 2/1/2016 | 46,997 |
| 20,567 | 11.00% | 5/1/2019 | 22,381 |
| 48,337 | 11.00% | 7/1/2019 | 53,820 |
| 13,105 | 11.25% | 10/1/2009 | 14,146 |
| 45,843 | 11.25% | 8/1/2011 | 50,258 |
| 27,852 | 13.00% | 5/1/2017 | 31,195 |
| | |
|
| 46,360,198 |
| | |
|
Federal National Mortgage Association (30.9%):
| Par ($) | Coupon | Maturity | Market Value ($)(1) |
|---|
| 2,252,962 | 4.03% | 4/1/2033 | 2,229,680 |
| 4,680,872 | 5.00% | 11/1/2010 | 4,705,606 |
| 78,490 | 5.76% | 3/1/2033 | 79,268 |
| 858,788 | 6.00% | 9/1/2017 | 886,756 |
| 31,963 | 6.49% | 3/1/2019 | 32,310 |
| 91,853 | 6.49% | 2/1/2032 | 94,620 |
| 74,279 | 6.49% | 4/1/2032 | 76,516 |
| 65,202 | 6.91% | 11/1/2026 | 68,657 |
| 218,497 | 6.91% | 8/1/2027 | 230,076 |
| 504,746 | 6.95% | 8/1/2021 | 521,788 |
| 270,064 | 7.00% | 7/1/2026 | 282,673 |
| 127,778 | 7.00% | 3/1/2027 | 134,004 |
| 24,963 | 7.00% | 4/1/2027 | 26,403 |
| 501,769 | 7.00% | 5/1/2028 | 525,195 |
| 862,195 | 7.00% | 1/1/2029 | 902,448 |
| 2,617,777 | 7.00% | 11/1/2029 | 2,741,107 |
| 493,309 | 7.00% | 2/1/2032 | 516,340 |
| 103,762 | 7.00% | 5/1/2032 | 108,614 |
| 489,267 | 7.00% | 6/1/2032 | 514,459 |
| 1,897,284 | 7.00% | 6/1/2032 | 1,986,009 |
| 192,320 | 7.00% | 7/1/2032 | 201,314 |
| 688,446 | 7.00% | 9/1/2032 | 720,641 |
| 344,768 | 7.00% | 10/1/2032 | 360,904 |
| 492,912 | 7.00% | 11/1/2032 | 515,924 |
| 329,584 | 7.00% | 11/1/2032 | 344,971 |
See accompanying notes to portfolios of investments on page 62.
15
| Sit U.S. Government Securities Fund
September 30, 2005
Portfolio of Investments (Unaudited)
|
| Par ($) | Coupon | Maturity | Market Value ($)(1) |
|---|
| 1,406,244 | 7.00% | 4/1/2034 | 1,471,897 |
| 576,575 | 7.50% | 11/1/2012 | 584,900 |
| 741,937 | 7.50% | 3/1/2016 | 787,992 |
| 1,215,517 | 7.50% | 6/1/2022 | 1,287,481 |
| 1,680,094 | 7.50% | 10/1/2022 | 1,777,959 |
| 461,713 | 7.50% | 9/1/2023 | 488,608 |
| 1,186,353 | 7.50% | 5/1/2024 | 1,255,458 |
| 431,460 | 7.50% | 6/1/2025 | 457,730 |
| 4,977 | 7.50% | 3/1/2027 | 5,278 |
| 16,663 | 7.50% | 9/1/2027 | 17,839 |
| 1,217,013 | 7.50% | 5/1/2029 | 1,287,904 |
| 86,979 | 7.50% | 11/1/2029 | 92,296 |
| 32,324 | 7.50% | 1/1/2030 | 34,213 |
| 355,211 | 7.50% | 1/1/2031 | 375,902 |
| 979,686 | 7.50% | 1/1/2031 | 1,037,613 |
| 303,545 | 7.50% | 10/1/2031 | 321,255 |
| 236,550 | 7.50% | 3/1/2032 | 250,339 |
| 695,230 | 7.50% | 6/1/2032 | 738,397 |
| 966,352 | 7.50% | 12/1/2034 | 1,022,642 |
| 1,209,205 | 7.54% | 6/1/2016 | 1,311,987 |
| 1,302,703 | 7.87% | 12/15/2025 | 1,391,206 |
| 64,867 | 8.00% | 8/1/2009 | 67,682 |
| 281,190 | 8.00% | 4/1/2016 | 301,466 |
| 76,290 | 8.00% | 11/1/2016 | 81,804 |
| 64,447 | 8.00% | 6/1/2018 | 67,420 |
| 615,786 | 8.00% | 7/1/2021 | 659,998 |
| 215,509 | 8.00% | 1/1/2022 | 230,917 |
| 24,978 | 8.00% | 2/1/2023 | 26,727 |
| 124,211 | 8.00% | 5/1/2023 | 132,695 |
| 80,028 | 8.00% | 9/1/2023 | 85,583 |
| 522,000 | 8.00% | 7/1/2024 | 558,372 |
| 189,837 | 8.00% | 8/1/2024 | 203,488 |
| 24,269 | 8.00% | 4/1/2025 | 26,009 |
| 151,735 | 8.00% | 6/1/2027 | 162,617 |
| 97,968 | 8.00% | 7/1/2027 | 104,971 |
| 489,050 | 8.00% | 9/1/2027 | 523,893 |
| 160,536 | 8.00% | 9/1/2027 | 172,540 |
| 52,879 | 8.00% | 10/1/2027 | 56,681 |
| 251,322 | 8.00% | 6/1/2028 | 268,906 |
| 217,602 | 8.00% | 9/1/2028 | 232,827 |
| 971,169 | 8.00% | 5/1/2029 | 1,038,058 |
| 207,709 | 8.00% | 9/1/2029 | 223,034 |
| 67,088 | 8.00% | 12/1/2029 | 71,547 |
| 18,650 | 8.00% | 2/1/2030 | 19,979 |
| 271,626 | 8.00% | 2/1/2031 | 290,418 |
| 561,493 | 8.00% | 2/1/2031 | 600,166 |
| 280,173 | 8.00% | 3/1/2031 | 301,918 |
| 758,433 | 8.00% | 12/1/2031 | 810,670 |
| 141,536 | 8.00% | 3/1/2032 | 150,488 |
| Par ($) | Coupon | Maturity | Market Value ($)(1) |
|---|
| 1,098,847 | 8.00% | 9/1/2032 | 1,177,385 |
| 474,078 | 8.00% | 8/1/2034 | 506,730 |
| 54,793 | 8.25% | 4/1/2022 | 58,688 |
| 974,246 | 8.29% | 7/20/2030 | 1,060,528 |
| 778,852 | 8.33% | 7/15/2020 | 863,208 |
| 400,109 | 8.38% | 7/20/2028 | 435,155 |
| 3,959,015 | 8.45% | 5/31/2035 | 4,324,356 |
| 6,755 | 8.50% | 8/1/2006 | 6,872 |
| 69,146 | 8.50% | 11/1/2010 | 72,738 |
| 545,903 | 8.50% | 9/1/2013 | 556,529 |
| 722,400 | 8.50% | 2/1/2016 | 774,077 |
| 38,020 | 8.50% | 4/1/2017 | 41,041 |
| 133,096 | 8.50% | 6/1/2017 | 135,893 |
| 38,916 | 8.50% | 9/1/2017 | 41,524 |
| 141,085 | 8.50% | 8/1/2018 | 153,489 |
| 410,656 | 8.50% | 5/1/2022 | 444,106 |
| 145,064 | 8.50% | 7/1/2022 | 158,577 |
| 81,149 | 8.50% | 11/1/2023 | 88,336 |
| 19,655 | 8.50% | 5/1/2024 | 21,527 |
| 217,317 | 8.50% | 2/1/2025 | 235,018 |
| 64,950 | 8.50% | 9/1/2025 | 70,603 |
| 477,828 | 8.50% | 12/1/2025 | 520,269 |
| 317,201 | 8.50% | 1/1/2026 | 345,424 |
| 479,845 | 8.50% | 1/1/2026 | 522,539 |
| 236,499 | 8.50% | 7/1/2026 | 254,828 |
| 459,473 | 8.50% | 9/1/2026 | 500,284 |
| 1,173,983 | 8.50% | 11/1/2026 | 1,278,580 |
| 42,993 | 8.50% | 12/1/2026 | 46,824 |
| 247,390 | 8.50% | 5/1/2027 | 269,363 |
| 340,665 | 8.50% | 6/1/2027 | 370,975 |
| 774,725 | 8.50% | 11/1/2028 | 843,781 |
| 1,358,499 | 8.50% | 12/1/2028 | 1,479,535 |
| 265,454 | 8.50% | 12/1/2029 | 289,033 |
| 393,522 | 8.50% | 1/1/2030 | 424,028 |
| 73,190 | 8.50% | 8/1/2030 | 78,863 |
| 28,580 | 8.50% | 11/1/2030 | 31,075 |
| 174,843 | 8.50% | 11/1/2030 | 188,169 |
| 87,169 | 8.50% | 12/1/2030 | 94,778 |
| 22,197 | 8.50% | 1/1/2031 | 23,906 |
| 164,682 | 8.50% | 6/1/2032 | 179,334 |
| 463,851 | 8.52% | 9/15/2030 | 503,277 |
| 158,412 | 8.87% | 12/15/2025 | 176,452 |
| 128,614 | 9.00% | 1/1/2009 | 135,109 |
| 49,882 | 9.00% | 5/1/2009 | 51,821 |
| 25,502 | 9.00% | 5/1/2009 | 26,633 |
| 89,506 | 9.00% | 5/1/2009 | 92,671 |
| 59,269 | 9.00% | 5/1/2009 | 61,899 |
| 17,347 | 9.00% | 4/1/2010 | 18,278 |
| 69,286 | 9.00% | 3/1/2011 | 73,365 |
16
|
| |
| Par ($) | Coupon | Maturity | Market Value ($)(1) |
|---|
| 170,834 | 9.00% | 8/1/2016 | 185,378 |
| 180,595 | 9.00% | 11/1/2016 | 195,970 |
| 15,250 | 9.00% | 6/1/2017 | 15,547 |
| 71,807 | 9.00% | 6/1/2017 | 77,722 |
| 17,328 | 9.00% | 7/1/2017 | 18,755 |
| 38,841 | 9.00% | 9/1/2017 | 42,331 |
| 65,603 | 9.00% | 12/1/2017 | 71,008 |
| 42,665 | 9.00% | 2/1/2018 | 46,499 |
| 12,881 | 9.00% | 9/1/2019 | 13,572 |
| 24,411 | 9.00% | 10/1/2019 | 25,366 |
| 80,630 | 9.00% | 12/15/2019 | 87,337 |
| 74,288 | 9.00% | 3/1/2021 | 80,408 |
| 3,797 | 9.00% | 9/1/2021 | 4,158 |
| 65,607 | 9.00% | 4/1/2025 | 72,133 |
| 353,882 | 9.00% | 6/15/2025 | 387,501 |
| 499,939 | 9.00% | 11/1/2025 | 544,689 |
| 39,512 | 9.00% | 12/1/2026 | 42,503 |
| 269,933 | 9.00% | 5/1/2027 | 293,501 |
| 68,488 | 9.00% | 5/1/2030 | 75,357 |
| 146,318 | 9.00% | 8/15/2030 | 160,589 |
| 48,403 | 9.00% | 11/1/2030 | 53,367 |
| 95,195 | 9.00% | 4/1/2031 | 104,877 |
| 87,578 | 9.00% | 6/1/2031 | 96,528 |
| 29,894 | 9.00% | 7/1/2031 | 32,480 |
| 65,970 | 9.25% | 10/1/2009 | 69,294 |
| 29,869 | 9.25% | 7/1/2010 | 31,648 |
| 3,633 | 9.25% | 4/1/2012 | 3,659 |
| 56,773 | 9.25% | 10/1/2016 | 62,021 |
| 64,769 | 9.25% | 12/1/2016 | 70,757 |
| 187,900 | 9.25% | 2/1/2017 | 204,713 |
| 6,766 | 9.25% | 3/1/2017 | 7,392 |
| 347,482 | 9.34% | 8/20/2027 | 395,492 |
| 21,730 | 9.50% | 9/1/2008 | 22,201 |
| 69,082 | 9.50% | 12/1/2009 | 73,344 |
| 16,480 | 9.50% | 1/1/2011 | 17,358 |
| 15,015 | 9.50% | 10/1/2013 | 16,074 |
| 21,944 | 9.50% | 5/1/2014 | 22,419 |
| 6,600 | 9.50% | 4/1/2016 | 7,066 |
| 80,967 | 9.50% | 4/1/2016 | 87,189 |
| 32,339 | 9.50% | 9/1/2016 | 35,522 |
| 35,175 | 9.50% | 9/1/2017 | 36,981 |
| 90,779 | 9.50% | 11/1/2018 | 100,868 |
| 64,166 | 9.50% | 12/1/2018 | 70,689 |
| 49,605 | 9.50% | 5/1/2019 | 55,255 |
| 78,101 | 9.50% | 10/1/2019 | 86,014 |
| 58,123 | 9.50% | 12/1/2019 | 64,342 |
| 1,050,929 | 9.50% | 3/1/2020 | 1,145,512 |
| 27,622 | 9.50% | 3/1/2020 | 29,909 |
| 91,830 | 9.50% | 6/1/2020 | 102,036 |
| Par ($) | Coupon | Maturity | Market Value ($)(1) |
|---|
| 176,164 | 9.50% | 9/1/2020 | 195,010 |
| 186,816 | 9.50% | 9/1/2020 | 205,860 |
| 205,039 | 9.50% | 10/15/2020 | 224,486 |
| 185,586 | 9.50% | 12/15/2020 | 204,255 |
| 38,558 | 9.50% | 12/15/2020 | 42,306 |
| 63,189 | 9.50% | 3/1/2021 | 70,004 |
| 50,454 | 9.50% | 4/15/2021 | 55,741 |
| 207,216 | 9.50% | 7/1/2021 | 226,955 |
| 218,290 | 9.50% | 4/1/2025 | 240,481 |
| 296,226 | 9.50% | 4/1/2025 | 330,317 |
| 561,654 | 9.50% | 11/1/2025 | 624,809 |
| 365,722 | 9.50% | 3/1/2026 | 407,812 |
| 446,794 | 9.50% | 9/1/2026 | 498,213 |
| 344,264 | 9.50% | 10/1/2026 | 384,262 |
| 102,579 | 9.50% | 8/1/2030 | 113,946 |
| 1,765,205 | 9.55% | 8/20/2025 | 1,945,866 |
| 158,806 | 9.75% | 1/15/2013 | 173,589 |
| 124,211 | 9.75% | 1/1/2021 | 137,991 |
| 317,876 | 9.75% | 10/1/2021 | 355,654 |
| 327,873 | 9.75% | 4/1/2025 | 366,839 |
| 8,468 | 10.00% | 3/1/2011 | 8,936 |
| 67,570 | 10.00% | 5/1/2011 | 71,992 |
| 113,573 | 10.00% | 7/1/2013 | 121,379 |
| 84,971 | 10.00% | 6/1/2014 | 88,530 |
| 730,477 | 10.00% | 2/1/2015 | 803,451 |
| 888,300 | 10.00% | 3/1/2015 | 992,616 |
| 75,892 | 10.00% | 11/1/2016 | 83,792 |
| 43,708 | 10.00% | 3/1/2018 | 48,367 |
| 468,319 | 10.00% | 7/1/2019 | 515,104 |
| 63,545 | 10.00% | 9/1/2019 | 70,676 |
| 92,132 | 10.00% | 12/1/2019 | 100,015 |
| 209,797 | 10.00% | 6/1/2020 | 234,442 |
| 16,753 | 10.00% | 11/1/2020 | 18,805 |
| 37,089 | 10.00% | 1/1/2021 | 41,802 |
| 26,641 | 10.00% | 2/1/2021 | 29,564 |
| 189,535 | 10.00% | 10/1/2021 | 211,225 |
| 96,018 | 10.00% | 5/1/2022 | 108,219 |
| 159,638 | 10.00% | 5/1/2022 | 177,152 |
| 121,246 | 10.00% | 1/1/2024 | 135,121 |
| 653,859 | 10.00% | 2/1/2028 | 733,382 |
| 171,426 | 10.00% | 7/1/2028 | 192,444 |
| 338,989 | 10.25% | 8/15/2013 | 371,518 |
| 11,803 | 10.50% | 5/1/2009 | 12,512 |
| 45,525 | 10.50% | 5/1/2015 | 49,057 |
| 287,778 | 10.50% | 1/1/2016 | 323,403 |
| 91,344 | 10.50% | 12/1/2017 | 102,587 |
| 16,690 | 10.75% | 11/1/2010 | 17,764 |
| 5,714 | 11.00% | 4/1/2014 | 6,353 |
| 41,282 | 11.00% | 8/1/2015 | 44,592 |
See accompanying notes to portfolios of investments on page 62.
17
| Sit U.S. Government Securities Fund
September 30, 2005
Portfolio of Investments (Unaudited)
|
| Par ($) | Coupon | Maturity | Market Value ($)(1) |
| | | |
|---|
| 20,548 | 11.00% | 4/1/2017 | 22,323 |
| 472,241 | 11.27% | 8/15/2020 | 524,612 |
| 295,485 | 11.75% | 10/20/2022 | 336,849 |
| | |
|
| 81,331,837 |
| | |
|
| |
| Government National Mortgage Association (14.2%) (3): |
| |
| Par ($) | Coupon | Maturity | Market Value ($)(1) |
| 242,837 | 5.76% | 3/20/2033 | 246,234 |
| 112,570 | 5.76% | 3/20/2033 | 114,145 |
| 84,041 | 5.76% | 3/20/2033 | 85,217 |
| 117,677 | 5.76% | 5/20/2033 | 119,324 |
| 447,431 | 5.76% | 5/20/2033 | 453,691 |
| 109,935 | 5.76% | 6/20/2033 | 111,473 |
| 96,195 | 5.76% | 6/20/2033 | 97,541 |
| 75,375 | 6.00% | 9/15/2018 | 77,233 |
| 84,176 | 6.05% | 3/20/2033 | 86,040 |
| 340,083 | 6.25% | 5/15/2013 | 352,088 |
| 236,660 | 6.38% | 12/15/2027 | 246,014 |
| 307,443 | 6.38% | 4/15/2028 | 319,533 |
| 165,448 | 6.49% | 9/20/2031 | 171,319 |
| 345,030 | 6.49% | 11/20/2031 | 357,273 |
| 49,854 | 6.49% | 12/20/2031 | 51,623 |
| 360,121 | 6.49% | 4/20/2032 | 372,790 |
| 75,941 | 6.49% | 6/20/2032 | 78,612 |
| 56,303 | 6.49% | 6/20/2032 | 58,284 |
| 89,802 | 6.49% | 12/20/2032 | 92,962 |
| 2,732,342 | 6.50% | 5/15/2023 | 2,843,018 |
| 40,624 | 6.57% | 9/20/2032 | 42,054 |
| 116,731 | 6.57% | 11/20/2032 | 120,840 |
| 84,944 | 6.57% | 12/20/2032 | 87,934 |
| 179,884 | 6.57% | 1/20/2033 | 186,188 |
| 85,514 | 6.57% | 3/20/2033 | 88,511 |
| 131,524 | 6.75% | 9/15/2015 | 138,732 |
| 68,243 | 6.75% | 8/15/2028 | 71,407 |
| 465,137 | 6.75% | 8/15/2028 | 486,704 |
| 227,710 | 6.75% | 6/15/2029 | 238,123 |
| 135,956 | 6.75% | 6/15/2029 | 142,173 |
| 618,025 | 6.91% | 7/20/2026 | 647,260 |
| 38,998 | 7.00% | 9/20/2016 | 40,954 |
| 513,061 | 7.00% | 2/15/2028 | 539,455 |
| 396,822 | 7.00% | 1/15/2030 | 417,402 |
| 400,022 | 7.00% | 1/15/2031 | 420,717 |
| 417,519 | 7.00% | 10/15/2031 | 438,998 |
| 788,808 | 7.00% | 11/15/2032 | 829,546 |
| 29,067 | 7.05% | 2/15/2023 | 30,748 |
| 45,359 | 7.25% | 8/15/2010 | 47,303 |
| 107,205 | 7.25% | 10/15/2028 | 113,297 |
| 67,994 | 7.27% | 7/20/2022 | 71,950 |
| 461,140 | 7.38% | 3/15/2031 | 463,183 |
| Par ($) | Coupon | Maturity | Market Value ($)(1) |
| 8,712 | 7.50% | 3/15/2007 | 8,926 |
| 130,502 | 7.50% | 5/15/2016 | 139,946 |
| 396,300 | 7.50% | 12/15/2022 | 423,684 |
| 831,117 | 7.50% | 2/15/2027 | 883,983 |
| 73,369 | 7.55% | 7/20/2022 | 77,344 |
| 168,216 | 7.55% | 10/20/2022 | 177,329 |
| 110,083 | 7.65% | 10/20/2021 | 116,335 |
| 107,252 | 7.65% | 7/20/2022 | 113,341 |
| 212,719 | 7.75% | 6/15/2020 | 226,407 |
| 271,369 | 7.75% | 7/15/2020 | 288,831 |
| 297,173 | 7.75% | 8/15/2020 | 316,295 |
| 217,759 | 7.75% | 8/15/2020 | 231,771 |
| 112,393 | 7.75% | 11/15/2020 | 119,625 |
| 601,618 | 7.75% | 10/15/2022 | 646,063 |
| 2,735 | 7.90% | 11/20/2020 | 2,908 |
| 46,600 | 7.90% | 1/20/2021 | 49,548 |
| 38,627 | 7.90% | 1/20/2021 | 41,070 |
| 31,043 | 7.90% | 4/20/2021 | 33,007 |
| 224,125 | 7.95% | 2/15/2020 | 239,691 |
| 91,031 | 7.99% | 2/20/2021 | 97,002 |
| 63,401 | 7.99% | 4/20/2021 | 67,559 |
| 161,834 | 7.99% | 7/20/2021 | 172,449 |
| 164,331 | 7.99% | 9/20/2021 | 175,109 |
| 108,854 | 7.99% | 10/20/2021 | 115,994 |
| 247,320 | 7.99% | 1/20/2022 | 263,562 |
| 458,620 | 7.99% | 6/20/2022 | 488,739 |
| 37,327 | 8.00% | 10/15/2012 | 39,721 |
| 783,679 | 8.00% | 10/15/2014 | 840,016 |
| 91,584 | 8.00% | 5/15/2016 | 98,709 |
| 285,030 | 8.00% | 6/15/2016 | 307,205 |
| 143,621 | 8.00% | 9/15/2016 | 154,794 |
| 138,124 | 8.00% | 11/20/2016 | 146,867 |
| 99,345 | 8.00% | 7/15/2017 | 106,370 |
| 48,330 | 8.00% | 7/20/2023 | 51,516 |
| 24,412 | 8.00% | 8/15/2023 | 26,143 |
| 48,227 | 8.00% | 12/20/2023 | 51,405 |
| 18,335 | 8.00% | 2/20/2024 | 19,546 |
| 173,916 | 8.00% | 2/20/2026 | 185,592 |
| 37,330 | 8.00% | 12/15/2026 | 40,022 |
| 34,069 | 8.00% | 12/20/2026 | 36,356 |
| 284,601 | 8.00% | 4/15/2028 | 304,620 |
| 53,159 | 8.00% | 4/15/2028 | 56,959 |
| 53,690 | 8.00% | 9/15/2029 | 57,515 |
| 279,416 | 8.10% | 5/20/2019 | 301,161 |
| 68,167 | 8.10% | 6/20/2019 | 73,472 |
| 134,079 | 8.10% | 7/20/2019 | 144,513 |
| 86,737 | 8.10% | 9/20/2019 | 93,487 |
| 177,835 | 8.10% | 9/20/2019 | 191,675 |
| 87,171 | 8.10% | 10/20/2019 | 93,955 |
| | | |
18
|
| |
| Par ($) | Coupon | Maturity | Market Value ($)(1) |
| 122,671 | 8.10% | 1/20/2020 | 132,417 |
| 79,804 | 8.10% | 4/20/2020 | 86,144 |
| 136,039 | 8.10% | 7/20/2020 | 146,846 |
| 152,750 | 8.25% | 12/15/2011 | 163,358 |
| 36,386 | 8.25% | 1/15/2012 | 39,095 |
| 60,728 | 8.25% | 8/15/2015 | 65,943 |
| 533,827 | 8.25% | 4/15/2019 | 579,588 |
| 187,064 | 8.25% | 2/15/2020 | 203,414 |
| 20,150 | 8.25% | 4/15/2027 | 21,783 |
| 87,018 | 8.25% | 6/15/2027 | 94,069 |
| 93,098 | 8.38% | 10/15/2019 | 101,370 |
| 157,415 | 8.40% | 2/15/2019 | 171,525 |
| 33,615 | 8.40% | 4/15/2019 | 36,628 |
| 125,795 | 8.40% | 6/15/2019 | 137,071 |
| 43,259 | 8.40% | 9/15/2019 | 47,137 |
| 58,951 | 8.40% | 9/15/2019 | 64,235 |
| 58,595 | 8.40% | 2/15/2020 | 63,950 |
| 46,361 | 8.50% | 12/15/2011 | 49,793 |
| 168,701 | 8.50% | 1/15/2012 | 182,098 |
| 35,249 | 8.50% | 4/15/2015 | 38,482 |
| 72,744 | 8.50% | 4/15/2015 | 79,416 |
| 215,953 | 8.50% | 9/15/2016 | 236,450 |
| 186,838 | 8.50% | 1/15/2017 | 205,097 |
| 143,380 | 8.50% | 12/15/2021 | 157,112 |
| 18,746 | 8.50% | 7/20/2022 | 20,489 |
| 130,922 | 8.50% | 10/20/2022 | 143,094 |
| 61,363 | 8.50% | 9/20/2024 | 67,208 |
| 132,730 | 8.50% | 3/20/2025 | 145,340 |
| 311,813 | 8.50% | 12/20/2026 | 338,118 |
| 26,934 | 8.50% | 8/15/2030 | 29,261 |
| 59,013 | 8.60% | 5/15/2018 | 63,811 |
| 98,083 | 8.60% | 6/15/2018 | 106,058 |
| 78,113 | 8.63% | 10/15/2018 | 84,391 |
| 3,819 | 8.75% | 5/15/2006 | 3,889 |
| 4,038 | 8.75% | 5/15/2006 | 4,112 |
| 7,536 | 8.75% | 10/15/2006 | 7,674 |
| 12,612 | 8.75% | 11/15/2006 | 12,843 |
| 9,064 | 8.75% | 2/15/2007 | 9,543 |
| 3,961 | 8.75% | 3/15/2007 | 4,170 |
| 39,633 | 8.75% | 11/15/2009 | 42,461 |
| 49,253 | 8.75% | 6/15/2011 | 53,315 |
| 208,186 | 8.75% | 11/15/2011 | 225,357 |
| 44,760 | 8.75% | 12/15/2011 | 48,452 |
| 8,825 | 9.00% | 4/15/2006 | 8,995 |
| 12,320 | 9.00% | 4/15/2006 | 12,558 |
| 7,938 | 9.00% | 5/15/2006 | 8,092 |
| 15,346 | 9.00% | 5/15/2006 | 15,643 |
| 5,958 | 9.00% | 6/15/2006 | 6,073 |
| 50,775 | 9.00% | 6/15/2006 | 51,758 |
| Par ($) | Coupon | Maturity | Market Value ($)(1) |
| 30,024 | 9.00% | 7/15/2006 | 30,605 |
| 5,719 | 9.00% | 10/15/2006 | 5,830 |
| 28,033 | 9.00% | 10/15/2006 | 28,576 |
| 7,055 | 9.00% | 6/15/2007 | 7,442 |
| 25,200 | 9.00% | 10/15/2007 | 26,583 |
| 22,891 | 9.00% | 9/15/2008 | 23,978 |
| 8,986 | 9.00% | 9/15/2008 | 9,413 |
| 3,201 | 9.00% | 10/15/2008 | 3,353 |
| 12,038 | 9.00% | 11/15/2008 | 12,610 |
| 27,293 | 9.00% | 12/15/2008 | 28,590 |
| 3,271 | 9.00% | 2/15/2009 | 3,454 |
| 1,463 | 9.00% | 3/15/2009 | 1,545 |
| 13,390 | 9.00% | 4/15/2009 | 14,138 |
| 15,109 | 9.00% | 4/15/2009 | 15,997 |
| 5,058 | 9.00% | 5/15/2009 | 5,340 |
| 21,706 | 9.00% | 8/15/2009 | 22,981 |
| 18,300 | 9.00% | 9/15/2009 | 19,376 |
| 11,377 | 9.00% | 10/15/2009 | 12,013 |
| 26,548 | 9.00% | 11/15/2009 | 28,535 |
| 7,092 | 9.00% | 12/15/2009 | 7,509 |
| 103,252 | 9.00% | 7/15/2010 | 109,707 |
| 115,880 | 9.00% | 5/15/2011 | 125,964 |
| 42,541 | 9.00% | 5/15/2011 | 46,243 |
| 73,780 | 9.00% | 6/15/2011 | 80,200 |
| 97,026 | 9.00% | 7/15/2011 | 105,470 |
| 57,555 | 9.00% | 8/15/2011 | 61,844 |
| 100,470 | 9.00% | 8/15/2011 | 109,213 |
| 63,452 | 9.00% | 9/15/2011 | 68,974 |
| 98,126 | 9.00% | 9/15/2011 | 106,665 |
| 106,563 | 9.00% | 9/15/2011 | 115,836 |
| 64,152 | 9.00% | 10/15/2011 | 69,734 |
| 40,675 | 9.00% | 1/15/2012 | 44,422 |
| 49,950 | 9.00% | 5/20/2015 | 53,960 |
| 181,957 | 9.00% | 7/15/2015 | 197,295 |
| 37,051 | 9.00% | 8/15/2015 | 40,174 |
| 103,765 | 9.00% | 12/20/2015 | 112,097 |
| 20,277 | 9.00% | 5/20/2016 | 21,957 |
| 27,834 | 9.00% | 7/20/2016 | 30,140 |
| 139,943 | 9.00% | 1/15/2017 | 155,099 |
| 15,108 | 9.00% | 3/20/2017 | 16,397 |
| 533,462 | 9.00% | 6/15/2017 | 591,234 |
| 421,214 | 9.00% | 7/15/2017 | 466,830 |
| 270,657 | 9.00% | 8/20/2017 | 293,745 |
| 18,653 | 9.00% | 5/15/2018 | 20,596 |
| 288,774 | 9.00% | 12/15/2019 | 315,763 |
| 6,598 | 9.00% | 12/15/2019 | 7,215 |
| 212,658 | 9.00% | 6/15/2021 | 233,269 |
| 3,204 | 9.00% | 7/20/2021 | 3,501 |
| 3,125 | 9.00% | 10/20/2021 | 3,416 |
See accompanying notes to portfolios of investments on page 62.
19
| Sit U.S. Government Securities Fund
September 30, 2005
Portfolio of Investments (Unaudited)
|
| Par ($) | Coupon | Maturity | Market Value ($)(1) |
| 364,928 | 9.00% | 11/15/2024 | 399,341 |
| 48,070 | 9.00% | 7/20/2025 | 52,754 |
| 178,472 | 9.00% | 4/15/2026 | 196,458 |
| 24,484 | 9.10% | 5/15/2018 | 26,838 |
| 94,588 | 9.25% | 11/15/2009 | 102,689 |
| 43,848 | 9.25% | 1/15/2010 | 47,918 |
| 38,868 | 9.25% | 4/15/2010 | 42,476 |
| 44,702 | 9.25% | 11/15/2010 | 48,851 |
| 72,451 | 9.25% | 11/15/2011 | 79,600 |
| 16,342 | 9.25% | 4/15/2012 | 18,047 |
| 1,518 | 9.50% | 1/15/2006 | 1,551 |
| 9,688 | 9.50% | 7/15/2009 | 10,315 |
| 35,999 | 9.50% | 8/15/2009 | 38,328 |
| 12,468 | 9.50% | 8/15/2009 | 13,275 |
| 16,929 | 9.50% | 9/15/2009 | 17,971 |
| 24,945 | 9.50% | 9/15/2009 | 26,559 |
| 5,074 | 9.50% | 9/15/2009 | 5,402 |
| 43,764 | 9.50% | 10/15/2009 | 46,459 |
| 7,452 | 9.50% | 10/15/2009 | 7,911 |
| 116,685 | 9.50% | 10/15/2009 | 123,872 |
| 12,203 | 9.50% | 10/15/2009 | 12,993 |
| 3,454 | 9.50% | 10/15/2009 | 3,677 |
| 9,755 | 9.50% | 10/15/2009 | 10,386 |
| 9,055 | 9.50% | 10/15/2009 | 9,641 |
| 9,663 | 9.50% | 10/15/2009 | 10,288 |
| 32,278 | 9.50% | 11/15/2009 | 35,157 |
| 94,931 | 9.50% | 1/15/2010 | 104,133 |
| 36,760 | 9.50% | 2/15/2010 | 39,309 |
| 89,598 | 9.50% | 4/15/2010 | 96,121 |
| 29,017 | 9.50% | 8/15/2010 | 31,830 |
| 39,983 | 9.50% | 11/15/2010 | 43,859 |
| 24,771 | 9.50% | 1/15/2011 | 27,329 |
| 111,321 | 9.50% | 3/15/2011 | 122,813 |
| 16,237 | 9.50% | 3/20/2016 | 17,802 |
| 14,801 | 9.50% | 6/15/2016 | 16,286 |
| 45,690 | 9.50% | 10/15/2016 | 50,275 |
| 44,274 | 9.50% | 10/15/2016 | 48,717 |
| 38,270 | 9.50% | 11/15/2016 | 42,111 |
| 46,678 | 9.50% | 11/20/2016 | 51,176 |
| 16,339 | 9.50% | 1/15/2017 | 18,032 |
| 38,288 | 9.50% | 8/15/2017 | 42,256 |
| 4,031 | 9.50% | 8/20/2017 | 4,433 |
| 30,075 | 9.50% | 9/15/2017 | 33,193 |
| 17,594 | 9.50% | 9/15/2017 | 19,418 |
| 186,393 | 9.50% | 12/15/2017 | 204,964 |
| 25,021 | 9.50% | 12/15/2017 | 27,532 |
| 82,748 | 9.50% | 12/15/2017 | 91,033 |
| 76,807 | 9.50% | 12/15/2017 | 84,382 |
| 6,497 | 9.50% | 12/20/2017 | 7,145 |
| Par ($) | Coupon | Maturity | Market Value ($)(1) |
| 6,267 | 9.50% | 4/15/2018 | 6,933 |
| 7,752 | 9.50% | 4/20/2018 | 8,546 |
| 3,153 | 9.50% | 5/20/2018 | 3,476 |
| 93,679 | 9.50% | 6/15/2018 | 103,646 |
| 68,231 | 9.50% | 6/20/2018 | 75,218 |
| 32,665 | 9.50% | 7/20/2018 | 36,010 |
| 13,213 | 9.50% | 8/15/2018 | 14,619 |
| 25,376 | 9.50% | 8/20/2018 | 27,975 |
| 47,347 | 9.50% | 9/15/2018 | 52,385 |
| 68,794 | 9.50% | 9/15/2018 | 76,114 |
| 122,797 | 9.50% | 9/20/2018 | 135,371 |
| 13,170 | 9.50% | 9/20/2018 | 14,518 |
| 45,643 | 9.50% | 9/20/2018 | 50,316 |
| 37,076 | 9.50% | 10/15/2018 | 40,850 |
| 18,153 | 9.50% | 1/15/2019 | 20,130 |
| 28,189 | 9.50% | 4/15/2019 | 31,258 |
| 6,090 | 9.50% | 8/15/2019 | 6,753 |
| 92,868 | 9.50% | 8/20/2019 | 102,610 |
| 30,727 | 9.50% | 9/15/2019 | 34,073 |
| 4,929 | 9.50% | 10/20/2019 | 5,446 |
| 9,031 | 9.50% | 12/15/2019 | 10,014 |
| 3,280 | 9.50% | 1/15/2020 | 3,645 |
| 8,401 | 9.50% | 10/15/2020 | 9,333 |
| 14,965 | 9.50% | 1/15/2021 | 16,653 |
| 41,215 | 9.50% | 8/15/2021 | 45,865 |
| 275,590 | 9.50% | 8/15/2022 | 307,116 |
| 1,927 | 9.75% | 1/15/2006 | 1,971 |
| 1,821 | 9.75% | 2/15/2006 | 1,862 |
| 94,199 | 9.75% | 8/15/2009 | 102,814 |
| 54,384 | 9.75% | 9/15/2009 | 59,357 |
| 158,711 | 9.75% | 8/15/2010 | 174,676 |
| 37,968 | 9.75% | 11/15/2010 | 41,788 |
| 224,703 | 9.75% | 12/15/2010 | 247,307 |
| 192,975 | 9.75% | 1/15/2011 | 214,089 |
| 105,963 | 9.75% | 1/15/2011 | 117,557 |
| 17,394 | 9.75% | 10/15/2012 | 19,427 |
| 29,263 | 9.75% | 10/15/2012 | 32,683 |
| 17,925 | 9.75% | 10/15/2012 | 20,019 |
| 40,535 | 9.75% | 11/15/2012 | 45,272 |
| 29,116 | 9.75% | 11/15/2012 | 32,518 |
| 19,800 | 9.75% | 11/15/2012 | 22,114 |
| 44,759 | 9.75% | 11/15/2012 | 49,990 |
| 35,899 | 10.00% | 11/15/2008 | 38,906 |
| 1,804 | 10.00% | 11/15/2009 | 1,931 |
| 87,516 | 10.00% | 6/15/2010 | 96,681 |
| 5,509 | 10.00% | 6/15/2010 | 6,086 |
| 25,374 | 10.00% | 7/15/2010 | 28,031 |
| 10,929 | 10.00% | 7/15/2010 | 12,074 |
| 14,071 | 10.00% | 10/15/2010 | 15,544 |
20
|
| |
| Par ($) | Coupon | Maturity | Market Value ($)(1) |
| 81,915 | 10.00% | 11/15/2010 | 90,493 |
| 6,579 | 10.00% | 1/15/2011 | 7,329 |
| 34,030 | 10.00% | 3/20/2016 | 37,888 |
| 19,143 | 10.00% | 11/15/2017 | 21,391 |
| 33,445 | 10.00% | 2/15/2019 | 37,393 |
| 26,711 | 10.00% | 2/20/2019 | 29,758 |
| 43,784 | 10.00% | 3/20/2019 | 48,778 |
| 23,902 | 10.00% | 5/15/2019 | 26,724 |
| 30,454 | 10.00% | 5/20/2019 | 33,927 |
| 279,337 | 10.00% | 10/15/2019 | 319,130 |
| 43,740 | 10.00% | 11/15/2019 | 48,904 |
| 8,293 | 10.00% | 7/15/2020 | 9,285 |
| 32,948 | 10.00% | 12/15/2020 | 36,888 |
| 115,063 | 10.00% | 6/15/2021 | 128,968 |
| 11,895 | 10.00% | 10/15/2030 | 13,408 |
| 36,937 | 10.25% | 5/15/2009 | 39,976 |
| 28,440 | 10.25% | 11/15/2011 | 31,313 |
| 31,035 | 10.25% | 1/15/2012 | 34,418 |
| 33,844 | 10.25% | 2/15/2012 | 37,534 |
| 3,086 | 10.25% | 2/15/2012 | 3,423 |
| 18,325 | 10.25% | 7/15/2012 | 20,323 |
| 36,859 | 10.50% | 6/15/2009 | 40,023 |
| 7,705 | 10.50% | 7/15/2010 | 8,446 |
| 10,324 | 10.50% | 9/15/2015 | 11,533 |
| 13,457 | 10.50% | 11/15/2015 | 15,033 |
| 21,197 | 10.50% | 8/20/2017 | 23,719 |
| 52,975 | 10.50% | 11/15/2018 | 59,610 |
| 62,355 | 10.50% | 6/15/2019 | 70,286 |
| 305,504 | 10.50% | 2/15/2020 | 343,376 |
| 241,600 | 10.50% | 8/15/2021 | 276,060 |
| 3,877 | 10.75% | 1/15/2010 | 4,248 |
| 1,638 | 10.75% | 7/15/2011 | 1,800 |
| 67,544 | 11.00% | 1/15/2010 | 73,438 |
| 42,488 | 11.00% | 1/15/2010 | 46,195 |
| 78,815 | 11.00% | 1/15/2010 | 85,691 |
| 36,139 | 11.00% | 3/15/2010 | 39,292 |
| 11,516 | 11.00% | 6/15/2010 | 12,520 |
| 28,179 | 11.00% | 9/15/2010 | 30,638 |
| 39,661 | 11.25% | 6/15/2010 | 43,809 |
| 46,589 | 11.25% | 9/15/2010 | 51,461 |
| 5,709 | 11.25% | 9/15/2010 | 6,306 |
| 8,003 | 11.25% | 2/15/2011 | 8,875 |
| 2,688 | 11.25% | 2/15/2011 | 2,981 |
| 21,229 | 11.25% | 3/15/2011 | 23,543 |
| 11,837 | 11.25% | 3/15/2011 | 13,126 |
| 47,933 | 11.25% | 4/15/2011 | 53,156 |
| 11,434 | 11.25% | 5/15/2011 | 12,680 |
| 35,214 | 11.25% | 7/15/2011 | 39,051 |
| 16,974 | 11.25% | 7/15/2011 | 18,823 |
| Par ($) | Coupon | Maturity | Market Value ($)(1) |
| 7,709 | 11.25% | 7/15/2011 | 8,549 |
| 33,822 | 11.25% | 9/15/2011 | 37,507 |
| 15,549 | 11.25% | 10/15/2011 | 17,243 |
| 4,141 | 11.25% | 11/15/2011 | 4,593 |
| | |
|
| 37,241,922 |
| | |
|
| |
| Total mortgage pass-through securities | 164,933,957 |
| (cost: $164,964,400) |
|
|
| Quantity ($) | | Name of Issuer | Market Value ($)(1) |
|---|
|
| |
| Taxable Municipal Securities (0.3%) (2) |
| | 229,000 | | Bernalillo Multifamily Rev. Series | | | | | |
| | | | 1998A, 7.50%, 9/20/20 | | | | 247,757 | |
| | 55,000 | | Cuyahoga County Multifamily Rev. | | | | | |
| | | | Series 2000B, 7.00%, 1/20/08 | | | | 57,186 | |
| | 5,000 | | Dakota Multifamily Rev. Series | | | | | |
| | | | 1999A, 6.50%, 12/20/05 | | | | 5,021 | |
| | 95,000 | | Louisiana Comm. Dev. Auth Rev. | | | | | |
| | | | Series 2002B, 5.25%, 12/20/07 | | | | 95,044 | |
| | 415,000 | | Maplewood Multifamily Rev. | | | | | |
| | | | Series 1998B, 6.75%, 7/20/15 | | | | 424,495 | |
| | 27,000 | | Nortex Multifamily Rev. Series | | | | | |
| | | | 1999T, 6.50%, 3/20/06 | | | | 27,255 | |
| |
| |
| |
| Total taxable municipal securities | 856,758 |
| (cost: $826,000) |
|
| |
| U.S. Treasury / Federal Agency Securities (9.6%) (2) |
| | | | Federal Home Loan Bank: | | | | | |
| | 5,000,000 | | 2.50%, 6/30/09 | | | | 4,891,425 | |
| | 2,170,000 | | 5.62%, 8/6/18 | | | | 2,141,319 | |
| | 5,000,000 | | FNMA Strip, zero coupon, | | | | | |
| | | | 4.88% effective yield, 11/15/30 | | | | 1,449,900 | |
| | | | U.S. Treasury Strips, zero coupon: | | | | | |
| | 9,800,000 | | 3.80% effective yield, 8/15/11 | | | | 7,674,929 | |
| | 25,000,000 | | 4.80% effective yield, 11/15/27 | | | | 8,986,650 | |
| |
| |
| |
| Total U.S. Treasury / Federal Agency securities | 25,144,223 |
| (cost: $25,060,889) |
|
See accompanying notes to portfolios of investments on page 62.
21
| Sit U.S. Government Securities Fund
September 30, 2005
Portfolio of Investments (Unaudited)
|
| Collateralized Mortgage Obligations (25.1%) (2) |
| |
| Federal Home Loan Mortgage Corp.: |
| |
| Par ($) | Coupon | Maturity | Market Value ($)(1) |
| 754,621 | 3.00% | 2/15/2023 | 705,119 |
| 4,598,510 | 3.25% | 4/15/2032 | 4,303,168 |
| 897,871 | 3.50% | 5/15/2029 | 868,864 |
| 716,480 | 4.00% | 11/15/2014 | 700,352 |
| 3,000,000 | 4.00% | 5/31/2025 | 2,757,136 |
| 491,814 | 4.00% | 12/15/2032 | 474,640 |
| 2,147,215 | 4.25% | 11/15/2017 | 2,101,968 |
| 2,890,125 | 6.50% | 5/15/2029 | 2,959,665 |
| 702,349 | 7.50% | 6/15/2017 | 744,539 |
| 423,899 | 7.50% | 9/15/2030 | 438,003 |
| 28,708 | 7.75% | 3/18/2025 | 29,559 |
| 52,173 | 9.15% | 10/15/2020 | 54,377 |
| 2,000,476 | 9.50% | 2/15/2020 | 2,145,954 |
| |
| Federal National Mortgage Association: |
| |
| Par ($) | Coupon | Maturity | Market Value ($)(1) |
| 4,226,189 | 3.50% | 2/25/2033 | 3,967,465 |
| 1,254,707 | 3.50% | 3/25/2033 | 1,215,097 |
| 1,304,112 | 3.75% | 5/25/2033 | 1,224,440 |
| 1,727,766 | 4.00% | 11/25/2032 | 1,690,661 |
| 501,533 | 4.00% | 1/25/2033 | 473,863 |
| 2,031,671 | 4.00% | 3/25/2033 | 1,938,107 |
| 304,429 | 5.00% | 8/25/2022 | 303,528 |
| 125,567 | 6.85% | 12/18/2027 | 130,181 |
| 137,942 | 7.00% | 1/25/2021 | 141,804 |
| 744,147 | 7.00% | 1/25/2022 | 763,738 |
| 66,046 | 7.70% | 3/25/2023 | 69,485 |
| 383,032 | 8.00% | 7/25/2022 | 396,550 |
| 663,458 | 8.00% | 7/25/2044 | 702,229 |
| 154,942 | 8.20% | 4/25/2025 | 164,260 |
| 54,562 | 8.50% | 1/25/2021 | 58,232 |
| 82,949 | 8.50% | 4/25/2021 | 86,802 |
| 397,332 | 8.50% | 9/25/2021 | 424,177 |
| 141,693 | 8.50% | 1/25/2025 | 150,621 |
| 101,066 | 8.75% | 9/25/2020 | 106,081 |
| 260,206 | 8.95% | 10/25/2020 | 280,224 |
| 765,375 | 9.00% | 7/25/2019 | 820,874 |
| 464,171 | 9.00% | 12/25/2019 | 499,206 |
| 160,267 | 9.00% | 5/25/2020 | 170,627 |
| 99,890 | 9.00% | 6/25/2020 | 107,499 |
| 251,582 | 9.00% | 6/25/2020 | 269,430 |
| 38,687 | 9.00% | 7/25/2020 | 41,701 |
| 250,620 | 9.00% | 9/25/2020 | 269,931 |
| 156,068 | 9.00% | 10/25/2020 | 167,837 |
| 304,504 | 9.00% | 3/1/2024 | 331,408 |
| Par ($) | Coupon | Maturity | Market Value ($)(1) |
| 1,704,835 | 9.00% | 11/25/2028 | 1,867,882 |
| 237,894 | 9.25% | 1/25/2020 | 257,066 |
| 237,794 | 9.50% | 12/25/2018 | 258,392 |
| 456,835 | 9.50% | 3/25/2020 | 497,756 |
| 96,700 | 9.50% | 4/25/2020 | 103,703 |
| 268,328 | 9.50% | 5/25/2020 | 290,646 |
| 358,957 | 9.50% | 11/25/2020 | 390,779 |
| 115,780 | 9.50% | 11/25/2031 | 124,012 |
| 514,180 | 9.60% | 3/25/2020 | 559,351 |
Government National Mortgage Association:
| Par ($) | Coupon | Maturity | Market Value ($)(1) |
| 871,028 | 4.00% | 10/17/2029 | 847,443 |
| 2,000,000 | 5.00% | 5/16/2030 | 2,003,997 |
| 2,445,254 | 7.00% | 1/20/2032 | 2,612,814 |
| 613,702 | 8.00% | 1/16/2030 | 644,614 |
Vendee Mortgage Trust:
| Par ($) | Coupon | Maturity | Market Value ($)(1) |
| 1,000,000 | 5.00% | 8/15/2028 | 982,346 |
| 1,000,000 | 5.00% | 7/15/2030 | 973,905 |
| 142,605 | 5.63% | 2/15/2024 | 142,662 |
| 2,000,000 | 6.00% | 4/15/2027 | 2,024,977 |
| 2,000,000 | 6.00% | 2/15/2030 | 2,058,050 |
| 122,172 | 6.50% | 10/15/2025 | 122,814 |
| 8,025,474 | 6.50% | 12/15/2028 | 8,254,325 |
| 5,000,000 | 7.00% | 9/15/2027 | 5,193,968 |
| 556,673 | 8.29% | 12/15/2026 | 579,671 |
| | |
|
| |
| Total collateralized mortgage obligations | 66,040,575 |
| (cost: $67,539,030) |
|
Short-Term Securities (2.8%) (2)
| | |
|---|
| 2,000,000 | FFCB, 3.25%, 10/4/05 | 1,997,633 |
| 2,500,000 | FHLB, 3.55%, 10/13/05 | 2,499,323 |
| 2,795,539 | Dreyfus Cash Mgmt. Fund, 3.40% | 2,795,539 |
| |
|
| |
| Total short-term securities | 7,292,495 |
| (cost: $7,292,495) |
|
| |
| Total investments in securities | $264,268,008 |
| (cost: $265,682,814) (7) |
|
See accompanying notes to portfolios of investments on page 62.
22
This page has been left blank intentionally.
23
| Sit Tax-Free Income Fund
Six Months Ended September 30, 2005
Senior Portfolio Managers
Michael C. Brilley • Debra A. Sit, CFA • Paul J. Jungquist, CFA
|
The Sit Tax-Free Income Fund provided a +2.12% return for the six months ended September 30, 2005, compared with a return of +1.81% for the Lehman 5-Year Municipal Bond Index. The Fund’s 30-day SEC yield was 4.36% and its 12-month distribution rate was 3.75%, compared with 4.43% and 3.83%, respectively, six months ago.
Despite four Federal funds rate increases totaling 100 basis points, municipal yields were fairly stable during the period. Short term tax-exempt yields rose approximately 0.30%, longer term yields fell approximately 0.20% and intermediate yields were little changed. The Fund benefited from its investments in callable, high coupon securities that provided above average income. The Fund also benefited from its holdings in several distinct sectors, including the hospital, industrial revenue, multifamily housing, and other revenue sectors, which includes tax increment bonds. These sectors saw price stability or gains as investors continued to seek yield. Sectors which underperformed totaled less than 5.0% of portfolio holdings.
The Fund’s structure was little changed during the period with the greatest sector shifts being a 1.1% decrease in multifamily housing to 16.2% and a 1.1% increase in utilities to 3.7%. In addition, escrowed to maturity and prerefunded bonds increased from 1.1% to 2.9% as several issues were advance refunded during the period. Securities rated less than A increased slightly from 34.8% to 37.0%, reflecting the addition of shorter duration BBB rated securities at attractive yields. A significant portion of the Fund’s investments is invested in AAA rated insured bonds, and the average credit quality of the Fund remains A.
We expect interest rates to move higher in 2006 as economic growth remains solid with rebuilding from Hurricane Katrina and inflation concerns increase as higher energy prices work their way into the system. The Fund’s implied duration of 3.6 years, which was little changed from six months ago, is relatively short to reduce the risk of price depreciation as interest rates rise. In addition, this short duration will allow the Fund to take advantage of attractive reinvestment opportunities at higher yield levels in the coming year.
| INVESTMENT OBJECTIVE AND STRATEGY |
|---|
The objective of the Tax-Free Income Fund is to provide a high level of current income that is exempt from federal income tax, consistent with preservation of capital, by investing primarily in investment-grade municipal securities.
Such municipal securities generate interest income that is exempt from both regular federal income tax and federal alternative minimum tax. During normal market conditions, the Fund invests 100% of its net assets in such tax-exempt municipal securities.
| | Net Asset Value 9/30/05: | | $9.79 Per Share | | |
| | 3/31/05: | | $9.77 Per Share | | |
| | Total Net Assets: | | $350.6 Million | | |
| | 30-day SEC Yield: | | 4.36% | | |
| | Tax Equivalent Yield: | | 6.71%(1) | | |
| | 12-Month Distribution Rate: | | 3.75% | | |
| | Average Maturity: | | 12.9 Years | | |
| | Duration to Estimated Avg. Life: | | 3.3 Years(2) | | |
| | Implied Duration: | | 3.6 Years(2) | | |
| |
(1) For individuals in the 35.0% federal tax bracket.
(2) See next page. |
PORTFOLIO STRUCTURE
(% OF TOTAL NET ASSETS) |
|---|

24
| AVERAGE ANNUAL TOTAL RETURNS* |
|---|
| Sit
Tax-Free
Income
Fund
| | Lehman
5-Year Muni.
Bond Index
| | Lipper
General
Muni. Bond
Fund Index
|
|---|
| 3 Month** | | | 0.54% | | | -0.10% | | | -0.05% | | |
| 6 Month** | | | 2.12 | | | 1.81 | | | n/a | | |
| 1 Year | | | 3.18 | | | 1.45 | | | 4.29 | | |
| 5 Year | | | 4.73 | | | 5.13 | | | 5.91 | | |
| 10 Year | | | 4.98 | | | 4.96 | | | 5.49 | | |
| Inception | | | 6.07 | | | 6.02 | | | 6.56 | | |
| (9/29/88) | | |
| CUMULATIVE TOTAL RETURNS* |
|---|
| Sit
Tax-Free
Income
Fund
| | Lehman
5-Year Muni.
Bond Index
| | Lipper
General
Muni. Bond
Fund Index
|
|---|
| 1 Year | | | 3.18% | | | 1.45% | | | 4.29% | | |
| 5 Year | | | 25.97 | | | 28.40 | | | 33.24 | | |
| 10 Year | | | 62.56 | | | 62.34 | | | 70.71 | | |
| Inception | | | 172.32 | | | 170.29 | | | 194.77 | | |
| (9/29/88) | | |
| *As of 9/30/05. | **Not annualized. |
Performance figures are historical and do not guarantee future results. Investment returns and principal value will vary, and you may have a gain or loss when you sell shares. Average annual total returns include changes in share price as well as reinvestment of all dividends and capital gains. Management fees and administrative expenses are included in the Fund’s performance; however, fees and expenses are not incorporated in the Lehman 5-Year Muni. Bond Index. The Lipper returns are obtained from Lipper Analytical Services, Inc., a large independent evaluator of mutual funds.
(2) Duration is a measure which reflects estimated price sensitivity to a given change in interest rates. For example, for an interest rate change of 1%, a portfolio with a duration of 5 years would be expected to experience a price change of 5%. Estimated average life duration is based on current interest rates and the Adviser’s assumptions regarding the expected average life of individual securities held in the portfolio. Implied duration is calculated based on historical price changes of securities held by the Fund. The Adviser believes that the portfolio’s implied duration is a more accurate estimate of price sensitivity provided interest rates remain within their historical range. If interest rates exceed the historical range, the estimated average life duration may be a more accurate estimate of price sensitivity.
The sum of $10,000 invested at inception (9/29/88) and held until 9/30/05 would have grown to $27,232 in the Fund or $27,029 in the Lehman 5-Year Municipal Bond Index assuming reinvestment of all dividends and capital gains.
QUALITY RATINGS
(% OF TOTAL NET ASSETS) |
|---|
Lower of Moody’s, S&P, Fitch or Duff & Phelps ratings used.
25
| Sit Tax-Free Income Fund
September 30, 2005
Portfolio of Investments (Unaudited)
|
|
| Quantity ($) | | Name of Issuer | | Market Value ($)(1) |
|---|
|
| |
| Municipal Bonds (98.3%) (2) |
| Alabama (0.9%) |
| | 1,000,000 | | Birmingham Baptist Med. Ctr. Special Care Facs. Financing Auth. Rev. Series 1993A, | | | | | |
| | | | (Baptist Med. Ctr. Proj.) (MBIA insured), 5.50%, 8/15/23 | | | | 1,001,710 | |
| | 675,000 | | Birmingham-Southern College Private Educ. Bldg. Rev. Series 1997, 5.35%, 12/1/19 | | | | 679,752 | |
| | 750,000 | | Montgomery Special Care Facs. Fin. Auth. Rev. Series 1997C (Baptist Med. Ctr. Proj.), 5.375%, 9/1/22 | | | | 788,175 | |
| | | | Montgomery Med. Clinic Board Hlth. Care Fac. Rev. Series 1991: | | | | | |
| | 530,000 | | 7.00%, 3/1/15 | | | | 531,203 | |
| | 115,000 | | 7.375%, 3/1/06 | | | | 115,233 | |
| |
| |
| | 3,116,073 | |
| |
| |
| |
| Alaska (2.9%) |
| | 12,505,000 | | Alaska HFC Gen. Mtg. Rev. 1997 Series A, zero coupon, 6.15% effective yield on purchase date, 12/1/17 | | | | 6,200,729 | |
| | 450,000 | | Anchorage Elec. Util. Rev. Sr. Lien Series 1996B (MBIA insured), 5.50%, 2/1/26 | | | | 460,710 | |
| | | | Northern Alaska Tobacco Securitization Corp. Asset-Backed Rev.: | | | | | |
| | 2,070,000 | | Series 2000, 6.20%, 6/1/22 | | | | 2,188,901 | |
| | 1,205,000 | | Series 2001, 4.75%, 6/1/15 | | | | 1,221,545 | |
| |
| |
| | 10,071,885 | |
| |
| |
| |
| Arizona (1.4%) |
| | 230,000 | | Bullhead City Special Assessment Impt. Dist. Series 1993 (Bullhead Pkwy. Proj.), 6.10%, 1/1/10 | | | | 231,461 | |
| | 1,000,000 | | Maricopa Co. Pollution Ctrl. Corp. Rev. Refunding Series 2005-A (El Paso Elec. Proj.) | | | | | |
| | | | (FGIC insured), 4.80%, 8/1/40 | | | | 1,003,880 | |
| | 730,000 | | Phoenix Indus. Dev. Auth. Rev. Refunding Series 1995A (Christian Care Apts. Proj.), 6.25%, 1/1/16 | | | | 753,703 | |
| | 700,000 | | Phoenix Street & Hwy. User Rev. Refunding Jr. Lien Series 1992, 6.25%, 7/1/11 | | | | 701,764 | |
| | | | Pima Co. Industrial Dev. Auth. Educ. Rev.: | | | | | |
| | 295,000 | | Series 2004I (AZ Charter Schools Proj.), 5.00%, 7/1/12 | | | | 296,150 | |
| | 250,000 | | Series 2004A (Noah Webster Basic School Proj.), 5.25%, 12/15/16 | | | | 251,795 | |
| | 210,000 | | Series 2005M (AZ Charter Schools Proj.), 5.70%, 7/1/23 | | | | 212,430 | |
| | 1,250,000 | | Salt River Proj. Agric. Impt. & Pwr. Dist. Elec. Sys. Rev. Refunding Series 1993C, 4.90%, 1/1/08 | | | | 1,256,025 | |
| |
| |
| | 4,707,208 | |
| |
| |
| |
| Arkansas (0.9%) |
| | 1,000,000 | | Bentonville Co. ISD No. 6 Refunding & Construction G.O. Series 2003-A | | | | | |
| | | | (Ambac insured), 4/75%, 6/1/24 | | | | 1,012,850 | |
| | 44,578 | | Drew Co. Public Fac. Bd. Single Family Mtg. Rev. Refunding Series 1993-A2 | | | | | |
| | | | (FNMA backed), 7.90%, 8/1/11 | | | | 45,149 | |
| | 826 | | Jacksonville Res. Hsg. Fac. Bd. Single Family Mtg. Rev. Refunding Series 1993-B, 7.75%, 1/1/11 | | | | 834 | |
| | 845,000 | | Maumelle HDC First Lien Rev. Refunding 1992 Series A (Section 8), 7.875%, 7/1/09 | | | | 846,546 | |
| | | | North Little Rock Hlth. Facs. Bd. Health Care Rev. Series 2001 (Baptist Health Proj.): | | | | | |
| | 555,000 | | 5.00%, 7/1/06 | | | | 561,804 | |
| | 300,000 | | 5.00%, 7/1/07 | | | | 307,518 | |
| | 490,000 | | 5.00%, 7/1/08 | | | | 507,277 | |
| |
| |
| | 3,281,978 | |
| |
| |
| |
| California (10.7%) |
| | 230,000 | | ABAG Fin. Auth. For Nonprofit Corp. Rev Series 2002 (Redwood Sr. Homes & Svcs. Proj.), 4.10%, 11/15/07 | | | | 231,518 | |
| | 500,000 | | Bay Area Govt. Assoc. Rapid Transit Rev. Series 2001-A (FTA Cap Grant Proj.), 4.875%, 6/15/09 | | | | 500,825 | |
| | 120,000 | | Bay Area Govt. Assoc. Tax Allocation Rev. Series 1994-A (FSA insured), 6.00%, 12/15/14 | | | | 121,972 | |
| | 1,000,000 | | Bell Cmty. Hsg. Auth. Rev. Series 1995-A (Mobilehomes Park Acquisition Proj.), 6.40%, 10/1/15 | | | | 1,020,990 | |
| | 250,000 | | Blythe Redev. Agy. Tax Allocation Refunding Series 1997 (Proj. No. 1), 5.80%, 5/1/28 | | | | 263,825 | |
26
|
| |
|
| Quantity ($) | | Name of Issuer | | Market Value ($)(1) |
|---|
|
| |
| | 200,000 | | Calexico Cmnty. Redev. Agy. Tax Allocation Series 2000 (Merged Central Bus. District Redev. Proj.) | | | | | |
| | | | (Ambac insured), 5.375%, 8/1/26 | | | | 213,814 | |
| | 3,835,000 | | CA Co. Tobacco Securitization Agy. Asset-Backed Rev. Series 2002 (Alameda Co.), 4.75%, 6/1/19 | | | | 3,896,130 | |
| | 925,000 | | CA Cmnty. College Fin. Auth. Student Hsg. Rev. Series 2003-A (Feather River Cmnty. District Proj.), | | | | | |
| | | | 4.625%, 7/1/13 | | | | 937,154 | |
| | 750,000 | | CA Dept. Water Resources Rev. Series 1972 (Central Valley Proj.), 5.25%, 7/1/22 | | | | 754,523 | |
| | 220,000 | | CA Dept. Water Resources Rev. Series 1996-Q (Central Valley Proj.) (MBIA insured), 5.375%, 12/1/27 | | | | 228,111 | |
| | | | CA Educ. Facs. Auth. Rev.: | | | | | |
| | 125,000 | | Series 1995-A (Pooled College & Univ. Proj.), 5.60%, 12/1/14 | | | | 127,811 | |
| | 520,000 | | Series 1996 (Chapman Univ. Proj.), 5.125%, 10/1/26 | | | | 538,626 | |
| | 165,000 | | CA G.O. Series 1996 (Ambac insured), 5.25%, 6/1/21 | | | | 168,747 | |
| | 770,000 | | CA G.O. Rev. Refunding Series 5.125%, 10/1/17 | | | | 777,369 | |
| | 35,000 | | CA Prerefunded G.O. Series 1996 (Ambac insured), 5.25%, 6/1/21 | | | | 35,897 | |
| | 495,000 | | CA Govt. Fin. Auth. Lease Rev. Series 2003-A (Placer Co. Transportation Proj.), 6.00%, 12/1/28 | | | | 499,401 | |
| | 500,000 | | CA Hlth. Facs. Fin. Auth. Rev. Series 1997-B (Cedars-Sinai Med. Ctr. Proj.), 5.125%, 8/1/27 | | | | 523,895 | |
| | 4,300,000 | | CA Public Works Board Lease Rev. Series 1996-A (Dept. of Corrections Proj.), 5.50%, 1/1/17 | | | | 4,412,230 | |
| | 300,000 | | CA Public Works Board Lease Rev. Series 1993-A (Various CA State Univ. Proj.), 5.25%, 12/1/13 (5) | | | | 301,056 | |
| | | | CA Statewide Cmntys. Dev. Auth. Rev. Series 2005 (Daughters of Charity Hlth. Proj.): | | | | | |
| | 500,000 | | 5.00%, 7/1/06 | | | | 505,980 | |
| | 500,000 | | 5.00%, 7/1/07 | | | | 512,615 | |
| | 530,000 | | 5.25%, 7/1/11 | | | | 563,289 | |
| | 500,000 | | CA Statewide Cmntys. Dev. Auth. C.O.P. Series 1994 (Motion Picture & TV Fund), 5.35%, 1/1/24 | | | | 502,550 | |
| | 400,000 | | Del Mar Race Track Auth. Rev. Series 2005, 4.00%, 8/15/06 | | | | 402,640 | |
| | 235,000 | | Garden Grove C.O.P Series 1993 (Bahia Village/Emerald Isle Proj.) (FSA insured), 5.70%, 8/1/23 | | | | 236,713 | |
| | | | Golden State Tobacco Securitization Corp. Asset-Backed Rev. Series 2005-A: | | | | | |
| | 1,015,000 | | 5.00%, 6/1/16 | | | | 1,026,754 | |
| | 3,000,000 | | 5.00%, 6/1/19 | | | | 3,110,610 | |
| | 1,250,000 | | Interest Appreciation Bonds, 6/1/22 | | | | 1,004,837 | |
| | 750,000 | | Intercommunity Hosp. Fin. Auth. C.O.P Series 1998 (ACA insured), 5.25%, 11/1/19 | | | | 775,290 | |
| | 165,000 | | Loma Linda Hosp. Rev. Refunding Series 1993-C (Loma Linda Univ. Med. Ctr.) (MBIA insured), 5.375%, 12/1/22 | | | | 169,316 | |
| | 400,000 | | Los Angeles Water & Power Rev. Series 2001-A-A3, 5.25%, 7/1/18 | | | | 403,972 | |
| | 3,175,000 | | Northern CA Power Agy. Rev. Series 1987-A, 5.00%, 7/1/09 | | | | 3,178,588 | |
| | 125,000 | | Northern CA Tobacco Securitization Auth. Asset-Backed Senior Rev. Series 2001-B, 4.375%, 6/1/21 | | | | 126,301 | |
| | 1,100,000 | | Orange Co. Recovery C.O.P Series 1996-A (MBIA insured), 6.00%, 7/1/26 | | | | 1,147,696 | |
| | 1,000,000 | | Rancho Cucamonga Redev. Agy. Tax Allocation Series 1996 (MBIA insured), 5.25%, 9/1/16 | | | | 1,038,570 | |
| | | | Ridgecrest Refunding C.O.P. Series 1999 (Ridgecrest Civic Center Proj.): | | | | | |
| | 275,000 | | 5.55%, 3/1/09 | | | | 290,403 | |
| | 290,000 | | 5.65%, 3/1/10 | | | | 308,592 | |
| | 350,000 | | 6.00%, 3/1/14 | | | | 370,339 | |
| | 2,500,000 | | Sacramento District Fing. Auth. Rev. Series 2000-A, 5.875%, 12/1/27 | | | | 2,536,800 | |
| | 1,000,000 | | South Tahoe Powers Fin. Auth. Rev. Refunding Series 1995-B, 6.00%, 10/1/28 | | | | 1,020,090 | |
| | | | Southern CA Tobacco Securitization Auth. Asset-Backed Senior Rev: | | | | | |
| | 1,400,000 | | Series 2001-B, 6.00%, 5/15/22 | | | | 1,499,736 | |
| | 445,000 | | Series 2002-A, 5.25%, 6/1/27 | | | | 459,151 | |
| | 570,000 | | Turlock Hlth. Fac. Rev. C.O.P. Series 2004 (Emanuel Med. Ctr., Inc. Proj.), 3.00%, 10/15/05 | | | | 569,897 | |
| |
| |
| | 37,314,623 | |
| |
| |
See accompanying notes to portfolios of investments on page 62.
27
| Sit Tax-Free Income Fund
September 30, 2005
Portfolio of Investments (Unaudited)
|
|
| Quantity ($) | | Name of Issuer | | Market Value ($)(1) |
|---|
|
| |
| Colorado (2.6%) |
| | | | Aurora Golf Course Enterprise Sys. Rev. Refunding Series 2005: | | | | | |
| | 200,000 | | 3.375%, 12/1/05 | | | | 199,992 | |
| | 385,000 | | 4.00%, 12/1/08 | | | | 387,572 | |
| | 250,000 | | Beacon Met. Dist. Rev. Series 2005B, 4.375%, 12/1/15 | | | | 248,708 | |
| | 285,000 | | CO Educ. & Cultural Fac. Rev. Refunding Series 2003C (Cheyenne Mtn. Charter Sch. Proj.), 4.625%, 6/15/12 | | | | 278,285 | |
| | 1,250,000 | | CO Hlth. Fac. Auth. Rev. Series 1995 (Covenant Retirement Cmty. Proj.), 6.75%, 12/1/15 | | | | 1,279,550 | |
| | | | CO HFA Single Family Program Senior Series: | | | | | |
| | 125,000 | | 1996B-2, 7.45%, 11/1/27 | | | | 128,453 | |
| | 75,000 | | 1997B-3, 6.80%, 11/1/28 | | | | 75,177 | |
| | 1,005,000 | | CO Hlth. Fac. Auth. Rev. Unrefunded Balance Series 1995 (Parkview Proj.), 6.125%, 9/1/25 | | | | 1,026,175 | |
| | | | CO Hlth. Fac. Auth. Rev.: | | | | | |
| | 250,000 | | Series 1995 (Covenant Retirement Cmntys. Proj.), 6.20%, 12/1/07 | | | | 256,010 | |
| | 350,000 | | Series 2000A (Porter Place Proj.) (GNMA collateralized), 5.10%, 1/20/11 | | | | 372,869 | |
| | 1,000,000 | | Series 2000 (Evangelical Lutheran Proj.), 6.25%, 12/1/10 | | | | 1,103,730 | |
| | 1,000,000 | | Series 2002 (Evangelical Lutheran Proj.), 5.90%, 10/1/27 | | | | 1,076,580 | |
| | 350,000 | | Series 2004 (Vail Med. Ctr. Proj.), 4.00%, 1/15/06 | | | | 350,612 | |
| | 250,000 | | Series 2005 (Covenant Retirement Cmntys. Proj.), 4.50%, 12/1/07 | | | | 254,460 | |
| | 400,000 | | Series 2005 (Covenant Retirement Cmntys. Proj.), 4.50%, 12/1/08 | | | | 408,244 | |
| | 600,000 | | Denver Hsg. Corp. Multifamily Rev. Refunding Series 1997A (Section 8), 5.35%, 10/1/12 | | | | 615,636 | |
| | 255,000 | | Denver West Met. Dist. Refunding G.O. Series 2005, 3.40%, 12/1/07 | | | | 254,531 | |
| | 160,000 | | Eagle Bend Met. District No. 2 G.O. Refunding Series 2004, 2.25%, 12/1/05 | | | | 159,685 | |
| | 250,000 | | Jefferson Co. C.O.P. Refunding Series 1995 (MBIA insured), 5.25%, 12/1/09 | | | | 253,470 | |
| | | | SBC Met. Dist. G.O. Refunding Series 2005 (ACA insured): | | | | | |
| | 150,000 | | 3.125%, 12/1/06 | | | | 149,754 | |
| | 205,000 | | 3.00%, 12/1/07 | | | | 202,968 | |
| | 30,000 | | Thornton Single Family Mtg. Rev. Refunding 1992 Series A, 8.05%, 8/1/09 | | | | 30,020 | |
| |
| |
| | 9,112,481 | |
| |
| |
| |
| Connecticut (0.6%) |
| | | | Mashantucket Western Pequot Tribe Subordinated Special Rev.: | | | | | |
| | 100,000 | | Series 1997B, 5.75%, 9/1/18 | | | | 104,219 | |
| | 1,850,000 | | Series 1999B, zero coupon, 5.05% effective yield, 9/1/09 | | | | 1,559,680 | |
| | 500,000 | | Series 1999B, zero coupon, 5.12% effective yield, 9/1/26 | | | | 281,825 | |
| |
| |
| | 1,945,724 | |
| |
| |
| |
| Delaware (0.3%) |
| | 250,000 | | DE Hlth. Fac. Auh. Rev. Series 2005-A (Beebe Med. Ctr. Proj.), 5.00%, 6/1/07 | | | | 256,002 | |
| | 650,000 | | Quaker Hill Hsg. Corp., Inc. Multifamily Rev. Refunding Series 1990-A (FNMA collateralized), 7.55%, 8/1/21 | | | | 657,735 | |
| |
| |
| | 913,737 | |
| |
| |
| |
| District of Columbia (0.4%) |
| | 1,500,000 | | DC Rev. Series 1996 (Carnegie Endowment Proj.), 5.75%, 11/15/26 | | | | 1,551,705 | |
| |
| |
| |
| Florida (4.1%) |
| | 600,000 | | Capital Trust Agy. Multifamily Rev. Sr. Series 2003-A (Golf Villas, Rivermill, and Village Square Apts. Proj.), 4.75%, 6/1/13 | | | | 584,724 | |
| | 600,000 | | Collier Co. HFA Multifamily Hsg. Rev. Series 2002-C (Goodlette Arms Proj.), 5.25%, 8/15/15 | | | | 624,468 | |
| | 330,000 | | Dade Co. Public Facs. Rev. Series 1993 (Jackson Mem. Hosp. Proj.), 5.25%, 6/1/23 | | | | 330,624 | |
| | 385,000 | | Dade Co. Hlth. Fac. Auth. Hosp. Rev. Refunding Series 1993-A (Baptist Hosp. Miami Proj.) | | | | | |
| | | | (MBIA insured), 5.25%, 5/15/21 | | | | 385,547 | |
28
|
| |
|
| Quantity ($) | | Name of Issuer | | Market Value ($)(1) |
|---|
|
| |
| | 500,000 | | Dade Co. School Dist. G.O. Series 1997 (MBIA insured), 5.00%, 2/15/15 | | | | 516,685 | |
| | 385,000 | | Escambia Co. Hlth. Facs. Auth. Rev. Series 1998 (Baptist Hosp. Proj.), 5.125%, 10/1/19 | | | | 393,940 | |
| | 100,000 | | FL Dept. Gen. Svcs. Div. Facs. Mgmt. Rev. Series 1996-A (Ambac insured), 5.375%, 9/1/18 | | | | 101,071 | |
| | 500,000 | | FL Div. Bd. Fin. Dept. Gen. Svcs. Rev. Series 1997-A, 5.00%, 7/1/11 | | | | 520,275 | |
| | 750,000 | | FL HFC Hsg. Rev. Hsg. Series 2000-D-1 (Augustine Club Apts. Proj.)(MBIA insured), 5.75%, 10/1/30 | | | | 787,860 | |
| | 1,950,000 | | FL University Cap. Impt. Rev. Series 2004, 5.125%, 9/1/33 | | | | 2,022,345 | |
| | 425,000 | | Highlands Co. Hlth. Fac. Auth. Hosp. Rev. Refunding Series 2005-B (Adventist Hlth. Proj.), 5.00%, 11/15/30 | | | | 434,125 | |
| | 545,000 | | Lee Co. Indus. Dev. Auth. Hlth. Care Fac. Rev. Series 1999-A (ShellPoint Village Proj.), 5.50%, 11/15/08 | | | | 566,217 | |
| | 405,000 | | Martin Co. Hlth. Fac. Auth. Hosp. Rev. Refunding Series 2002-B (Martin Memorial Med. Ctr. Proj.), 4.875%, 11/15/12 | | | | 416,587 | |
| | 585,000 | | Marion Co. Hosp. Dist. Rev. Refunding Series 1999 (Munroe Regl. Med. Ctr. Proj), 5.25%, 10/1/10 | | | | 624,850 | |
| | 680,000 | | Miami Beach Water & Sewer Rev. Series 1995 (FSA insured), 5.375%, 9/1/15 | | | | 694,797 | |
| | 400,000 | | Miami - Dade Co. Special Oblig. Rev. Series 1997-B, zero coupon, 4.79% effective yield, 10/1/35 | | | | 344,352 | |
| | 190,000 | | Miami-Dade Co. Special Hsg. Rev. Refunding Series 1998 (Section 8), 5.30%, 10/1/05 | | | | 189,996 | |
| | | | North Broward Hosp. Dist. Rev. Series 1997 (MBIA insured): | | | | | |
| | 100,000 | | Prerefunded Series, 5.375%, 1/15/24 | | | | 103,964 | |
| | 160,000 | | Unrefunded Balance Series, 5.375%, 1/15/24 | | | | 165,194 | |
| | | | Palm Beach Co. Hlth. Fac. Auth. Rev. Refunding: | | | | | |
| | 125,000 | | Series 1996 (Retirement Cmnty. Proj.), 5.625%, 11/15/20 | | | | 128,966 | |
| | 200,000 | | Series 2003 (Abbey Delray South Proj.), 5.15%, 10/1/12 | | | | 210,124 | |
| | 75,000 | | Plantation Water & Sewer Rev. Series 1989 (MBIA insured), zero coupon, 5.45% effective yield on purchase date (MBIA insured), 3/1/07 | | | | 70,155 | |
| | 3,105,000 | | Port Everglades Auth. Rev. Refunding Series 1989-A (FSA insured), 5.00%, 9/1/16 | | | | 3,118,755 | |
| | | | South Lake Co. Hosp. Dist. Rev. Series 2003 (South Lake Hosp. Inc.): | | | | | |
| | 370,000 | | 4.25%, 10/1/08 | | | | 372,020 | |
| | 700,000 | | 5.50%, 10/1/13 | | | | 741,202 | |
| |
| |
| | 14,448,843 | |
| |
| |
| |
| Georgia (0.2%) |
| | 500,000 | | Atlanta Dev. Auth. Rev. Series 2005-C (Tuff ATDC Proj.), 5.00%, 1/1/31 | | | | 509,610 | |
| | 750,000 | | Private Colleges & Univ. Auth. Rev. Refunding Series 1999-A (Mercer Univ. Proj.), 5.25%, 10/1/14 | | | | 776,115 | |
| |
| |
| | 1,285,725 | |
| |
| |
| |
| Illinois (14.9%) |
| | | | Broadview Village of Cook Co. Tax Increment Rev. Series 1999: | | | | | |
| | 750,000 | | 4.90%, 7/1/06 | | | | 756,413 | |
| | 1,410,000 | | 5.00%, 7/1/07 | | | | 1,437,622 | |
| | 1,085,000 | | 5.05%, 7/1/08 | | | | 1,116,346 | |
| | 2,030,000 | | 5.10%, 7/1/09 | | | | 2,104,826 | |
| | 805,000 | | Series 2000-B, 4.75%, 3/1/30 | | | | 832,781 | |
| | 2,670,000 | | Chicago G.O. Series 1996-B (FGIC insured), Unrefunded, 5.125%, 1/1/25 | | | | 2,732,878 | |
| | 210,000 | | Chicago Metro Hsg. Dev. Corp. Mtg. Rev. Refunding Series 1992-A (FHA insured) (Section 8), 6.85%, 7/1/22 | | | | 211,604 | |
| | | | Chicago O'Hare Intl. Airport Rev. Refunding (MBIA insured): | | | | | |
| | 100,000 | | Series 1994-A Sr. Lien, 5.00%, 1/1/13 | | | | 100,454 | |
| | 225,000 | | Series 1993-A Sr. Lien, 5.00%, 1/1/16 | | | | 225,884 | |
| | 4,620,000 | | Series 1993-C 2nd Lien, 5.00%, 1/1/18 | | | | 4,643,331 | |
| | 450,000 | | IL DFA Rev. Series 2002-A (Chicago Charter School Fdn. Proj.), 5.25%, 12/1/12 | | | | 458,302 | |
| | | | IL DFA Pollution Ctrl. Rev. Refunding: | | | | | |
| | 300,000 | | Series 1993-C2 (Central IL Public Svc. Co. Proj.), 5.70%, 8/15/26 | | | | 300,522 | |
See accompanying notes to portfolios of investments on page 62.
29
| Sit Tax-Free Income Fund
September 30, 2005
Portfolio of Investments (Unaudited)
|
|
| Quantity ($) | | Name of Issuer | | Market Value ($)(1) |
|---|
|
| |
| | 2,500,000 | | Series 2000-A (Ameren CIPS Proj.), 5.50%, 3/1/14 | | | | 2,572,025 | |
| | 1,250,000 | | Series 1993-C1 (Central IL Pub. Svc. Co.), 5.95%, 8/15/26 | | | | 1,280,100 | |
| | | | IL DFA Refunding & New Money Rev. (Cmty. Rehab. Providers Fac. Acquisition Program): | | | | | |
| | 1,740,000 | | Series 1997-A, 5.80%, 7/1/08 | | | | 1,796,237 | |
| | 2,635,000 | | Series 1997-A, 6.05%, 7/1/19 | | | | 2,724,722 | |
| | 300,000 | | Series 1997-A, 5.90%, 7/1/09 | | | | 309,672 | |
| | 4,610,000 | | Series 1997-A, 6.00%, 7/1/15 | | | | 4,758,119 | |
| | 1,240,000 | | Series 1997-C, 5.65%, 7/1/19 | | | | 1,284,144 | |
| | 805,000 | | Series 1998-A, 5.50%, 7/1/12 | | | | 834,592 | |
| | 225,000 | | Series 1998-A, 5.70%, 7/1/19 | | | | 233,298 | |
| | 20,000 | | IL HDA Multifamily Rev. Series 1994-5 (Section 8), 6.75%, 9/1/23 | | | | 20,214 | |
| | 310,000 | | IL Fin. Auth. Rev. Series 2005-A (Depaul Univ. Proj.), 5.00%, 10/1/05 | | | | 310,015 | |
| | 500,000 | | IL Fin. Auth. Multifamily Rev. Series 2005-A (Senior Living-Bethel Terrace Apt. Proj.) | | | | 492,025 | |
| | | | (Section 8), 4.75%, 9/1/15 | | | | | |
| | | | IL Hlth. Fac. Auth. Rev.: | | | | | |
| | 500,000 | | Series 1993 (Rush-Presbyterian-St. Lukes Proj.), 5.50%, 11/15/25 | | | | 501,205 | |
| | 1,250,000 | | Refunding Series 1994 (Passavant Memorial Area Hospital Assn.) (MBIA insured), 5.95%, 10/1/11 | | | | 1,331,063 | |
| | 2,595,000 | | Refunding Series 1993-A (Edward Hosp. Proj.), 6.00%, 2/15/19 | | | | 2,619,341 | |
| | 55,000 | | Unrefunded Balance Series 1996 (MBIA insured), 5.80%, 8/15/16 | | | | 58,634 | |
| | 195,000 | | Refunding Series 1996 (Advocate Hlth. Care Network Proj.) (MBIA insured), 5.80%, 8/15/16 | | | | 208,340 | |
| | 200,000 | | Refunding Series 1996-B (Sarah Bush Lincoln Hlth. Ctr. Proj.), 5.50%, 2/15/16 | | | | 206,688 | |
| | 360,000 | | Refunding Series 1999 (Silver Cross Hosp. Proj.), 5.25%, 8/15/15 | | | | 369,248 | |
| | 970,000 | | Refunding Series 2001 (Decatur Memorial Hospital Proj.), 4.625%, 10/1/08 | | | | 997,917 | |
| | 500,000 | | Series 2000 (IA Health System Proj.), 6.75%, 2/15/13 | | | | 570,750 | |
| | 200,000 | | IL Sales Tax Rev. Series 1994-U, 5.00%, 6/15/10 | | | | 202,340 | |
| | | | Lombard Pub. Facs. Corp. Rev. (Conference Ctr. & Hotel Proj.): | | | | | |
| | | | First Tier Series 2005-A2 (ACA insured): | | | | | |
| | 750,000 | | 5.50%, 1/1/25 | | | | 799,575 | |
| | 1,000,000 | | 5.50%, 1/1/30 | | | | 1,063,580 | |
| | 795,000 | | Second Tier Series 2005-B, 4.00%, 1/1/16 | | | | 777,287 | |
| | 250,000 | | Melrose Park Tax Increment G.O. Series 1999-A (FSA insured), 5.25%, 12/15/15 | | | | 264,010 | |
| | 2,000,000 | | Onterie Ctr. Hsg. Fin. Corp. Mtg. Rev. Refunding Series 1992 (Onterie Ctr. Proj.) | | | | | |
| | | | (MBIA - FHA insured), 7.05%, 7/1/27 | | | | 2,014,900 | |
| | 1,850,000 | | Roselle Multifamily Hsg. Rev. Refunding Series 1994-A (GNMA collateralized) | | | | | |
| | | | (Waterbury Apts.) (FHA insured), 7.00%, 1/1/25 | | | | 1,889,627 | |
| | | | Southwestern IL Dev. Auth. Rev. Series 1999 (Anderson Hosp. Proj.): | | | | | |
| | 750,000 | | 5.375%, 8/15/15 | | | | 776,745 | |
| | 2,625,000 | | 5.625%, 8/15/29 | | | | 2,703,645 | |
| | 2,800,000 | | Southwestern IL Dev. Auth. Local Govt. Prog. Rev. Series 1998-A (City of East St. Louis Tax Increment Financing Proj.), 6.00%, 4/1/10 | | | | 2,759,988 | |
| | 445,000 | | Upper Illinois River Valley Dev. Auth. Rev. Series 2001 (Morris Hosp. Proj.), 6.05%, 12/1/11 | | | | 488,597 | |
| | 500,000 | | Will Co. Student Hsg. Rev. Series 2002-A (Joliet Junior College Proj.), 6.375%, 9/1/13 (8)(9) | | | | 260,235 | |
| |
| |
| | 52,399,841 | |
| |
| |
30
|
| |
|
| Quantity ($) | | Name of Issuer | | Market Value ($)(1) |
|---|
|
| |
| Indiana (3.6%) |
| | 1,975,000 | | IN Bond Bank Special Prgm. Series 1997C (Pittsboro Wastewater Treatment Plant Proj.), 5.70%, 8/1/17 | | | | 2,058,365 | |
| | | | IN Hlth. Fac. Fin. Auth. Hosp. Rev.: | | | | | |
| | | | Series 1993 (Community Hosp. of Anderson Proj.)(MBIA insured): | | | | | |
| | 135,000 | | 6.00%, 1/1/14 | | | | 135,325 | |
| | 650,000 | | 6.00%, 1/1/23 | | | | 650,721 | |
| | | | Refunding Series 1998 (Floyd Memorial Hosp. & Hlth. Svcs. Proj.): | | | | | |
| | 505,000 | | 4.85%, 2/15/06 | | | | 508,136 | |
| | 600,000 | | 5.25%, 2/15/18 | | | | 617,658 | |
| | | | Series 2001A (Community Foundation Northwest IN): | | | | | |
| | 1,100,000 | | 5.50%, 8/1/06 | | | | 1,115,444 | |
| | 1,000,000 | | 6.00%, 8/1/07 | | | | 1,036,530 | |
| | 1,000,000 | | 6.00%, 8/1/08 | | | | 1,051,190 | |
| | 1,320,000 | | 5.50%, 8/1/13 | | | | 1,387,571 | |
| | 340,000 | | 6.375%, 8/1/21 | | | | 368,264 | |
| | 300,000 | | Series 2004A (Community Foundation Northwest IN), 4.75%, 3/1/14 | | | | 300,816 | |
| | 500,000 | | IN HFA Single Family Mtg. Rev. Refunding Series 1992A, 6.80%, 1/1/17 | | | | 500,790 | |
| | | | IN Hlth. Fac. Fin. Auth. Rev. Refunding Series 1998: | | | | | |
| | | | (Greenwood Village South Proj.): | | | | | |
| | 150,000 | | 5.25%, 5/15/06 | | | | 150,131 | |
| | 170,000 | | 5.35%, 5/15/08 | | | | 170,121 | |
| | 1,875,000 | | (Marquette Manor Proj.), 5.00%, 8/15/18 | | | | 1,871,363 | |
| | 340,000 | | St. Joseph Co. Ind. Hosp. Auth. Facs. Rev. Series 2005 (Madison Ctr. Oblig. Group. Proj.), 4.25%, 2/15/07 | | | | 342,336 | |
| | 240,000 | | South Knox Ind. Sch. Bldg. Corp. First Mtg. Rev. Series 1998, 4.80%, 7/15/17 | | | | 245,239 | |
| |
| |
| | 12,510,000 | |
| |
| |
| |
| Iowa (0.5%) |
| | 1,130,000 | | IA Fin. Auth. Multifamily Hsg. Rev. Refunding Series 1997A (Kingswood Apts. Proj.) | | | | | |
| | | | (GNMA-collateralized), 6.15%, 5/1/32 | | | | 1,173,765 | |
| | | | IA Fin. Auth Single Family Rev. Series 2000D (GNMA/FNMA Mtg. Backed Securities Proj.): | | | | | |
| | 110,000 | | 5.65%, 7/1/07 | | | | 112,848 | |
| | 125,000 | | 5.75%, 7/1/09 | | | | 129,619 | |
| | 200,000 | | Scott Co. Rev. Refunding Series 2004 (Ridgecrest Village Proj.), 3.25%, 11/15/05 | | | | 199,892 | |
| |
| |
| | 1,616,124 | |
| |
| |
| |
| Kansas (0.1%) |
| | 75,000 | | Olathe & Labette Cos. Mtg. Loan Rev. 1991 Series B (GNMA collateralized) zero coupon, 7.56% effective yield on purchase date, 2/1/23 | | | | 22,078 | |
| | 300,000 | | Wyandotte Co. Govt. Special Oblig. Rev. Refunding Sales Tax-First Lien Series 2005-B | | | | | |
| | | | (LOC Citibank), 3.75%, 12/1/12 | | | | 302,517 | |
| |
| |
| | 324,595 | |
| |
| |
| |
| Louisiana (1.4%) |
| | | | East Baton Rouge Single Family Mtg. Rev. Refunding: | | | | | |
| | 400,000 | | Series 1997C-3 Subordinate Bonds, 5.65%, 10/1/18 | | | | 400,032 | |
| | 7,200,000 | | Capital Appreciation Series 2000D1 (GNMA & FNMA collateralized) zero coupon, | | | | | |
| | | | 6.46% effective yield on purchase date, 4/1/34 | | | | 1,192,536 | |
| | 500,000 | | LA HFA Multifamily Mtg. Rev. Series 2003A (Section 8-202 Proj)(FSA insured), 4.40%, 6/1/33 | | | | 502,545 | |
| | 500,000 | | LA Public Facs. Auth. Rev. Series 1995A (Glen Retirement Sys. Proj.), 6.50%, 12/1/15 | | | | 510,580 | |
| | 200,000 | | LA Stadium & Expo Dist. Rev. Series 1995-B (Hotel Occupancy Tax & Stadium Rev. Proj.) | | | | | |
| | | | (FGIC insured), 5.25%, 7/1/15 | | | | 203,838 | |
See accompanying notes to portfolios of investments on page 62.
31
| Sit Tax-Free Income Fund
September 30, 2005
Portfolio of Investments (Unaudited)
|
|
| Quantity ($) | | Name of Issuer | | Market Value ($)(1) |
|---|
|
| |
| | 1,325,000 | | New Orleans Sewer Svc. Rev. Bond Antic Notes Series 2005, 3.00%, 7/26/06 | | | | 1,308,491 | |
| | 400,000 | | Orleans Levee Dist. Rev. Series 1995A (Tr. Rcpts.) (FSA insured), 5.95%, 11/1/14 | | | | 413,700 | |
| | 450,000 | | South LA Port Common Rev. Refunding Series 1997 (Cargill, Inc. Proj.), 5.85%, 4/1/17 | | | | 464,715 | |
| |
| |
| | 4,996,437 | |
| |
| |
| |
| Maine (0.7%) |
| | 385,000 | | ME Hlth. & Hgr. Educ. Fac. Auth. Rev. Unrefunded Balance Series 1995-C (FSA insured), 5.375%, 7/1/06 | | | | 392,084 | |
| | 1,000,000 | | Skowhegan Pollution Ctrl. Rev. Refunding Series 1993 (Scott Paper Co. Proj.), 5.90%, 11/1/13 | | | | 1,002,550 | |
| | 1,000,000 | | South Berwick Educ. Rev. Series 1998 (Berwick Academy Issue), 5.25%, 8/1/13 | | | | 1,027,970 | |
| |
| |
| | 2,422,604 | |
| |
| |
| |
| Massachusetts (0.9%) |
| | | | MA Hlth. & Educ. Fac. Auth. Rev., | | | | | |
| | | | Series 1998-B (Cape Cod Healthcare Obligated Group Issue): | | | | | |
| | 320,000 | | 5.00%, 11/15/05 | | | | 320,384 | |
| | 900,000 | | 5.25%, 11/15/13 | | | | 925,767 | |
| | 255,000 | | Series 2001-E (Berkshire Health Sys.), 4.50%, 10/1/05 | | | | 255,000 | |
| | 350,000 | | Series 2005-E (Emerson Hosp.) (Radian insured), 3.50%, 8/15/07 | | | | 351,032 | |
| | | | MA Dev. Fin. Agy. Rev. Series 2005 (Evergreen Ctr., Inc.): | | | | | |
| | 185,000 | | 4.00%, 1/1/07 | | | | 184,789 | |
| | 195,000 | | 4.00%, 1/1/08 | | | | 194,284 | |
| | 200,000 | | 4.00%, 1/1/09 | | | | 198,246 | |
| | 600,000 | | MA Indus. Fin. Agy. Rev. Series 1995 (St. Mark's School Issue), 6.00%, 1/1/15 | | | | 616,230 | |
| |
| |
| | 3,045,732 | |
| |
| |
| |
| Michigan (2.8%) |
| | 520,000 | | Central Wayne Co. Sanitation Auth. Incinerator Rev. Series 2003VII, 4.375%, 7/1/06 | | | | 521,134 | |
| | | | Chandler Park Academy Public School Rev. Series 2005: | | | | | |
| | 80,000 | | 3.60%, 11/1/07 | | | | 79,777 | |
| | 125,000 | | 4.00%, 11/1/09 | | | | 125,034 | |
| | 500,000 | | 5.00%, 11/1/22 | | | | 496,010 | |
| | 225,000 | | MI Hosp. Fin. Auth. Rev. Refunding Series 1994 (Mercy Mem. Hosp. Proj.) (MBIA insured), 5.25%, 6/1/21 | | | | 227,475 | |
| | 200,000 | | MI Hosp. Fin. Auth. Rev. Refunding Series 1997A (Detroit Medical Group), 5.25%, 8/15/27 | | | | 209,220 | |
| | 1,150,000 | | MI Strategic Fund Ltd. Obligation Rev. Refunding Series 2001A (Ford Motor Co. Proj.), 7.10%, 2/1/06 | | | | 1,151,656 | |
| | 2,500,000 | | MI Strategic Fund Ltd. Obligation Rev. Refunding Series 2003 (Dow Chemical Proj.) | | | | | |
| | | | (Mandatory Put 6/1/08), 4.60%, 6/1/14 | | | | 2,567,025 | |
| | 2,095,000 | | Southfield Econ. Dev. Corp. Ltd. Obligation Rev. Series 1998A (Lawrence Tech. Univ. Proj.), 5.25%, 2/1/13 | | | | 2,143,876 | |
| | 1,873,912 | | Suburban Mobility Auth. Regl. Transportation C.O.P. Series 2002, 4.90%, 2/15/09 (5) | | | | 1,882,944 | |
| | | | Summit Academy North Public School C.O.P. Series 2001: | | | | | |
| | 135,000 | | 5.70%, 7/1/06 | | | | 137,442 | |
| | 145,000 | | 5.95%, 7/1/07 | | | | 151,181 | |
| |
| |
| | 9,692,774 | |
| |
| |
| |
| Minnesota (1.9%) |
| | 3,410,000 | | Dakota Co. HRA Multifamily Mtg. Rev. Refunding Series 1997A (Park Place Apts. Proj.) (GNMA Collateralized), 6.875%, 2/20/32 | | | | 3,646,006 | |
| | 740,000 | | Hopkins Multifamily Hsg. Rev. Series 1996 (Hopkins Renaissance Proj.)(Section 8), 6.375%, 4/1/20 | | | | 766,388 | |
| | 2,315,000 | | Plymouth Multifamily Hsg. Dev. Rev. Refunding Series 1996A (GNMA collateralized) | | | | | |
| | | | (Fox Forest Apts. Proj.), 8.05%, 6/20/31 | | | | 2,423,226 | |
| |
| |
| | 6,835,620 | |
| |
| |
32
|
| |
|
| Quantity ($) | | Name of Issuer | | Market Value ($)(1) |
|---|
|
| |
| Mississippi (0.3%) |
| | 1,000,000 | | MS Hosp. Equip. & Facs. Auth. Rev. Series 1997A (Rush Med. Fdn. Proj.), 6.00%, 1/1/16 | | | | 1,023,560 | |
| |
| |
| |
| Missouri (2.5%) |
| | 380,000 | | Brentwood Tax Increment Rev. Refunding Series 2005, 3.625%, 5/1/09 | | | | 379,635 | |
| | 1,000,000 | | Cameron Industrial Dev. Auth. Rev. Refunding Series 2000 (Cameron Cmnty. Hosp. Proj.) | | | | | |
| | | | (ACA Insured), 5.80%, 12/1/09 | | | | 1,044,490 | |
| | 390,000 | | Chesterfield Rev. Refunding & Impt. Series 2002 (Chesterfield Vy. Projs.), 4.50%, 4/15/16 | | | | 390,277 | |
| | 205,000 | | Greene Co. C.O.P. Series 2000 (Law Enforcement Proj.), 5.50%, 7/1/09 | | | | 213,924 | |
| | | | MO Dev. Finance Board Infrastructure Fac. Rev.: | | | | | |
| | | | Series 2000A (Eastland Ctr. Proj. Phase 1): | | | | | |
| | 905,000 | | 5.75%, 4/1/09 | | | | 945,879 | |
| | 550,000 | | 5.75%, 4/1/12 | | | | 579,332 | |
| | 1,000,000 | | Series 2000B (Eastland Ctr. Proj. Phase 2), 6.00%, 4/1/15 | | | | 1,071,520 | |
| | 450,000 | | Series 2005A (Public Safety Proj.), 4.00%, 3/1/08 | | | | 454,095 | |
| | 260,000 | | Joplin Dev. Auth. Hlth. Facs. Rev. Series 2004 (Freeman Hlts. Sys. Proj.), 3.875%, 2/15/07 | | | | 260,770 | |
| | 500,000 | | Kansas City Port Auth. Facs. Rev. Series 1995A (Riverfront Park Proj.), 5.75%, 10/1/05 | | | | 500,015 | |
| | 895,000 | | MO Hlth. & Educ. Fac. Auth. Educ. Fac. Rev. Series 1999 (Park College Proj.), 5.55%, 6/1/09 | | | | 900,728 | |
| | | | MO Environmental Impt. & Energy Res. Auth. Water Fac. Rev. Refunding: | | | | | |
| | 825,000 | | Series 1996, 5.25%, 12/1/09 | | | | 853,842 | |
| | 150,000 | | Series 1999 (Tri-Co. Water Auth. Proj.)(Radian insured), 5.50%, 4/1/07 | | | | 154,866 | |
| | 5,000 | | St. Louis Co. Single Family Res. Mtg. Series 1984 (MBIA insured), 6.75%, 4/1/10 | | | | 5,051 | |
| | 1,000,000 | | St. Louis Industrial Dev. Auth. Tax-Exempt Impt. Rev. Series 1998 (St. Louis Zoo Fdn.) | | | | | |
| | | | (LOC Nationsbank), 5.10%, 8/15/12 | | | | 1,035,320 | |
| |
| |
| | 8,789,744 | |
| |
| |
| |
| Montana (0.4%) |
| | 1,135,000 | | Crow Finance Auth. Tribal Purpose Revenue Series 1997A, 5.70%, 10/1/27 | | | | 1,179,776 | |
| | | | Forsyth Pollution Ctrl. Rev. Refunding Series 1993 (Montana Power Co. Proj.): | | | | | |
| | 130,000 | | (Ambac insured), 5.90%, 12/1/23 | | | | 130,980 | |
| | 85,000 | | (MBIA insured), 6.125%, 5/1/23 | | | | 85,210 | |
| |
| |
| | 1,395,966 | |
| |
| |
| |
| Nevada (2.5%) |
| | 2,500,000 | | Clark Co. Industrial Dev. Rev. Refunding Series 1992C (Nevada Pwr. Co.)(Ambac insured), 7.20%, 10/1/22 | | | | 2,552,150 | |
| | 2,750,000 | | Clark Co. Pollution Ctrl. Rev. Refunding Series 1992B (Nevada Pwr. Co. Proj.)(FGIC insured), 6.60%, 6/1/19 | | | | 2,776,235 | |
| | 600,000 | | Las Vegas Paiute Tribe Rev. Series 2002A (ACA insured), 6.625%, 11/1/17 | | | | 670,716 | |
| | | | NV Hsg. Dev. SF Mtg. Program: | | | | | |
| | 255,000 | | Mezzanine Series 1998B-1, 5.30%, 4/1/16 | | | | 263,922 | |
| | 400,000 | | 6.00%, 6/1/08 | | | | 400,776 | |
| | 1,000,000 | | 6.125%, 6/1/12 | | | | 1,004,220 | |
| | 1,000,000 | | Washoe Co. Gas & Water Fac. Rev. Refunding Series 1987 (AMBAC insured), 6.30%, 12/1/14 | | | | 1,020,340 | |
| |
| |
| | 8,688,359 | |
| |
| |
| |
| New Hampshire (1.2%) |
| | | | Manchester Hsg. & Redev. Auth. Rev.: | | | | | |
| | 300,000 | | Series 2000B (Radian insured) zero coupon, 5.25% effective yield on purchase date, 1/1/19 | | | | 154,707 | |
| | 875,000 | | Sereis 2000B (ACA insured), zero coupon, 6.00% effective yield on purchase date, 1/1/21 | | | | 377,956 | |
| | 890,000 | | Series 2000A (ACA insured), 6.75%, 1/1/15 | | | | 957,542 | |
See accompanying notes to portfolios of investments on page 62.
33
| Sit Tax-Free Income Fund
September 30, 2005
Portfolio of Investments (Unaudited)
|
|
| Quantity ($) | | Name of Issuer | | Market Value ($)(1) |
|---|
|
| |
| | 500,000 | | NH Hlth. & Educ. Fac. Auth. Rev. Series 2004 (Covenant Hlth. Proj.), 5.00%, 7/1/14 | | | | 518,990 | |
| | | | NH Hlth. & Educ. Facs. Auth. Hosp. Rev. Series 2004 (Speare Mem. Hosp. Proj.): | | | | | |
| | 155,000 | | 5.00%, 7/1/10 | | | | 158,272 | |
| | 500,000 | | 5.00%, 7/1/16 | | | | 502,645 | |
| | 690,000 | | NH Higher Educ. & Hlth. Fac. Auth. Rev. Series 1997 (Catholic Charities Proj.), 5.75%, 8/1/12 | | | | 709,141 | |
| | 390,000 | | NH Higher Educ. & Hlth. Fac. Auth. Rev. Series 1997 (Monadnock Cmnty. Hosp.), 5.25%, 10/1/07 | | | | 398,026 | |
| | 510,000 | | NH Higher Educ. & Hlth. Fac. Auth. Rev. Series 1998 (New Hampton School), 5.00%, 10/1/08 | | | | 524,734 | |
| |
| |
| | 4,302,013 | |
| |
| |
| |
| New Jersey (0.3%) |
| | 1,060,000 | | NJ Tobacco Settlement Financing Corp. Asset-Backed Rev. Series 2003, 4.375%, 6/1/19 | | | | 1,073,038 | |
| |
| |
| |
| New Mexico (0.5%) |
| | 970,000 | | NM MFA Forward Mortgage-Backed Series 1995E (GNMA collateralized), 6.95%, 1/1/26 | | | | 1,004,241 | |
| | 500,000 | | NM Hsg. Auth. Region III Multifamily Hsg. Rev. Series 2003A (Villa Del Oso Apts. Proj.), 6.00%, 7/1/17 | | | | 501,705 | |
| | 160,000 | | Taos Co. Gross Receipts Tax Rev. Series 2004 (Co. Education Improvement Proj.), 3.25%, 10/1/08 | | | | 156,282 | |
| |
| |
| | 1,662,228 | |
| |
| |
| |
| New York (1.4%) |
| | 170,000 | | Monroe Co. Industrial Dev. Agy. Student Hsg. Rev. Series 1999-A (Collegiate Hsg. Fdn. - Rochester Institute of Technology Proj.), 4.90%, 4/1/09 | | | | 171,824 | |
| | 1,230,000 | | NY Dorm Auth. Rev. Series 1996-A (Maimonides Med. Ctr. Proj.), 5.75%, 8/1/24 | | | | 1,265,178 | |
| | 85,000 | | NY Dorm Auth. Rev. Series 2002 (FHA insured), 4.00%, 2/1/12 | | | | 84,734 | |
| | 950,000 | | NY Cos. Tobacco Trust IV Settlement Pass-Thru Rev. Series 2005-A, 4.25%, 6/1/21 | | | | 940,301 | |
| | 505,000 | | NY Unrefunded Balance G.O. Series 1996-G, 5.75%, 2/1/17 | | | | 516,463 | |
| | | | NY Tobacco Settlement Fing. Corp Asset-Backed Rev.: | | | | | |
| | 500,000 | | Series 2003-B1, 4.00%, 6/1/07 | | | | 506,840 | |
| | 160,000 | | Series 2003-C1, 5.00%, 6/1/11 | | | | 162,045 | |
| | 250,000 | | Series 2003-C1, 5.25%, 6/1/13 | | | | 262,347 | |
| | 500,000 | | Series 2003-C1, 5.50%, 6/1/14 | | | | 533,420 | |
| | 500,000 | | Westchester Tobacco Settlement Fing. Corp Asset-Backed Rev. Series 2005, 4.50%, 6/1/21 | | | | 499,525 | |
| |
| |
| | 4,942,677 | |
| |
| |
| |
| North Carolina (0.3%) |
| | 270,000 | | Mecklenburg Co. Indus. Facs. & Pollution Ctrl. Fin. Auth. Rev. Series 1993 (Fluor Corp. Proj.), 5.25%, 12/1/09 | | | | 270,435 | |
| | 250,000 | | NC Med. Care Commission Hosp. Rev. Series 1995 (Gaston Memorial Hsop. Proj.), 5.50%, 2/15/19 | | | | 256,707 | |
| | 500,000 | | NC Med. Care Commission Hlth. Care Hsg. Rev. Series 2004-A (The ARC of NC Proj.), 4.65%, 10/1/14 | | | | 498,215 | |
| |
| |
| | 1,025,357 | |
| |
| |
| |
| Ohio (2.4%) |
| | 2,780,000 | | Akron C.O.P. Series 1996 (Akron Baseball Stadium Proj.), 6.90%, 12/1/16 (5) | | | | 2,955,891 | |
| | 75,000 | | Akron Waterworks Rev. Refunding Series 1996 (MBIA insured), 4.80%, 3/1/07 | | | | 76,601 | |
| | 1,235,000 | | Bellefontaine Hosp. Rev. Refunding Series 1993 (Mary Rutan Hlth. Assoc.), 6.00%, 12/1/13 | | | | 1,239,001 | |
| | 295,000 | | Cleveland-Cuyahoga Port. Auth. Dev. Rev. Series 1999A (Port of Cleveland Bond Fund Capital | | | | | |
| | | | Imprv. Proj.), 5.375%, 5/15/19 | | | | 298,044 | |
| | | | Cleveland-Cuyahoga Port. Auth. Dev. Rev. : | | | | | |
| | 700,000 | | Series 2004D (Garfield Heights Proj.), 5.25%, 5/15/23 | | | | 701,652 | |
| | 610,000 | | Series 2004E (Meyers Univ. Proj.), 4.65%, 5/15/14 | | | | 610,872 | |
| | 530,000 | | Series 2004E (Meyers Univ. Proj.), 5.60%, 5/15/25 | | | | 537,902 | |
| | 275,000 | | Series 2005B (Fairmount Proj.), 5.125%, 5/15/25 | | | | 271,799 | |
| | 550,000 | | Dayton Airport Rev. Refunding Series 1995 (Cox-Dayton Intl. Proj.)(Ambac insured), 5.25%, 12/1/15 | | | | 557,233 | |
| | 1,000,000 | | Dayton Special Facs. Rev. Refunding Series 1998A (Emery Air Freight Proj.), 5.625%, 2/1/18 | | | | 1,060,310 | |
| |
| |
| | 8,309,305 | |
| |
| |
34
|
| |
|
| Quantity ($) | | Name of Issuer | | Market Value ($)(1) |
|---|
|
| |
| Oklahoma (2.7%) |
| | | | Citizen Potawatomi Nation Tax Rev. Series 2004A: | | | | | |
| | 660,000 | | 5.00%, 9/1/08 | | | | 662,284 | |
| | 500,000 | | 6.50%, 9/1/16 | | | | 520,840 | |
| | | | Langston Econ. Dev. Auth. Rev. Series 2005A (Langston Univ. Proj.) (ACA insured): | | | | | |
| | 1,000,000 | | 5.00%, 5/1/30 | | | | 1,003,740 | |
| | 250,000 | | 5.00%, 5/1/35 | | | | 249,490 | |
| | | | Comanche Co. Hosp. Auth. Rev.: | | | | | |
| | 415,000 | | Series 1993A (Connie Lee insured), 5.375%, 7/1/23 | | | | 421,540 | |
| | 200,000 | | Refunding Series 2004 (Radian insured), 3.75%, 7/1/06 | | | | 200,774 | |
| | | | Norman Regl. Hosp. Auth. Rev. Refunding Series 1996A (MBIA insured): | | | | | |
| | 1,500,000 | | 5.625%, 9/1/16 | | | | 1,561,095 | |
| | 250,000 | | 5.625%, 9/1/21 | | | | 259,810 | |
| | | | OK Dev. Fin. Auth. Hosp. Rev. Series 2003A (Duncan Regl. Hosp. Proj.): | | | | | |
| | 670,000 | | 4.00%, 12/1/05 | | | | 670,965 | |
| | 800,000 | | 4.00%, 12/1/06 | | | | 805,448 | |
| | 200,000 | | 5.00%, 10/1/05 | | | | 200,008 | |
| | 335,000 | | Stillwater Med. Ctr. Auth. Rev. Series 2005, 4.50%, 5/15/07 | | | | 339,365 | |
| | 1,345,000 | | Tulsa Industrial Auth. Educ. Fac. Rev. Refunding Series 1999B (Holland Hall School Proj.), 5.00%, 12/1/14 | | | | 1,389,479 | |
| | 995,000 | | Valley View Hosp. Auth. Rev. Refunding Series 1996, 6.00%, 8/15/14 | | | | 1,030,352 | |
| |
| |
| | 9,315,190 | |
| |
| |
| |
| Oregon (1.0%) |
| | 3,005,000 | | Cow Creek Band Umpqua Tribe of Indians Rev. Series 1998B (Ambac insured), 5.10%, 7/1/12 | | | | 3,040,008 | |
| | 200,000 | | Klamath Falls Intercmnty. Hosp. Auth. Rev. Refunding Series 2002 (Merle West Med. Ctr. Proj.), | | | | | |
| | | | 5.20%, 9/1/09 | | | | 205,912 | |
| | 310,000 | | OR Hsg. & Cmty. Svcs. Dept. Mtg. Rev. Series 2000K, 5.70%, 7/1/22 | | | | 313,918 | |
| |
| |
| | 3,559,838 | |
| |
| |
| |
| Pennsylvania (5.4%) |
| | 200,000 | | Abington Co. School Dist. G.O. Series 1997 (FGIC insured), 5.125%, 5/15/26 | | | | 204,856 | |
| | | | Allegheny Co. Hosp. Dev. Auth. Rev. Series 2003-A (Ohio Valley Gen. Hosp. Proj.): | | | | | |
| | 245,000 | | 3.30%, 4/1/08 | | | | 241,440 | |
| | 135,000 | | 3.875%, 4/1/10 | | | | 134,310 | |
| | 115,000 | | Allegheny Co. Redev. Auth. Tax Alloc. Rev. Series 2000-B (Waterfront Proj.), 5.75%, 12/15/05 | | | | 115,536 | |
| | 500,000 | | Beaver Co. Area School Dist. G.O. Series 2001, (FGIC insured), 4.85%, 1/15/19 | | | | 507,820 | |
| | | | Beaver Co. Indus. Dev. Auth. Pollution Ctrl. Rev.: | | | | | |
| | 240,000 | | Series 1977 (St. Joe Minerals Corp. Proj.), 6.00%, 5/1/07 | | | | 244,296 | |
| | 300,000 | | Series 1995-A (Ambac insured) (OH Edison Beaver Valley Proj.), 7.05%, 10/1/20 | | | | 306,954 | |
| | 1,150,000 | | Refunding Series 1995A (Toledo Edison Proj.), 7.75%, 5/1/20 | | | | 1,178,244 | |
| | 565,000 | | Chartiers Valley Industrial & Commercial Dev. Auth. Rev. Refuning Series 2003-A | | | | | |
| | | | (Friendship Village South Proj.), 4.75%, 8/15/11 | | | | 571,859 | |
| | 85,000 | | Delaware Co. Auth. Hosp. Rev. Series 1994 (Crozer-Chester Proj.)(MBIA insured), 5.30%, 12/15/20 | | | | 85,301 | |
| | 2,750,000 | | Grove City Area Hosp. Auth. Rev. Series 1998 (United Cmnty. Hosp. Proj.), 5.25%, 7/1/12 | | | | 2,764,437 | |
| | | | Horizon Hosp. System Auth. Hosp. Rev. Series 1996 (Horizon Hosp. Sys.): | | | | | |
| | 715,000 | | 6.15%, 5/15/08 | | | | 740,161 | |
| | 710,000 | | 6.25%, 5/15/09 | | | | 734,900 | |
| | 1,145,000 | | 6.30%, 5/15/11 | | | | 1,185,350 | |
See accompanying notes to portfolios of investments on page 62.
35
| Sit Tax-Free Income Fund
September 30, 2005
Portfolio of Investments (Unaudited)
|
|
| Quantity ($) | | Name of Issuer | | Market Value ($)(1) |
|---|
|
| |
| | | | Lehigh Co. General Purpose Auth.: | | | | | |
| | 500,000 | | Rev. Refunding Series 1996-B (Cedar Crest College), 6.65%, 4/1/17 | | | | 514,305 | |
| | 610,000 | | Rev. Series 2004-A (Good Shepherd Group), 4.00%, 11/1/09 | | | | 615,941 | |
| | 500,000 | | McKean Co. Hosp. Auth. Rev. Refunding Series 1994 (Bradford Hosp. Proj.) (ACA insured), 6.00%, 10/1/13 | | | | 505,045 | |
| | 250,000 | | Montgomery Co. Indus. Dev. Auth. Retirement Cmnty. Rev. Series 1998, 5.25%, 11/15/28 | | | | 254,248 | |
| | | | PA Hgr. Educ. Fac. Auth. Hlth. Svcs. Rev. Series 1996-A (Allegheny Delaware Valley Obligated Group, Inc.) (MBIA insured): | | | | | |
| | 150,000 | | 5.500%, 11/15/08 | | | | 159,006 | |
| | 3,890,000 | | 5.875%, 11/15/16 | | | | 4,077,226 | |
| | | | PA Higher Educ. Fac. Auth. Rev. Series (Widener Univ. Proj.): | | | | | |
| | 100,000 | | 3.00%, 7/15/07 | | | | 99,476 | |
| | 190,000 | | 3.10%, 7/15/08 | | | | 188,149 | |
| | 590,000 | | PA Hgr. Educ. Fac. Auth. Rev. Series 2000 (Univ. of the Arts Proj.) (Radian insured), 5.75%, 3/15/30 | | | | 631,766 | |
| | 650,000 | | PA Water Auth. Rev. Series 1999 (FGIC insured), 4.85%, 11/1/22 | | | | 650,670 | |
| | 1,000,000 | | Philadelphia Hosp. & Hgr. Educ. Fac. Auth. Hosp. Rev. Series 1993-A (Temple Univ. Hosp. Proj.), 6.50%, 11/15/08 | | | | 1,048,400 | |
| | 1,200,000 | | Washington Co. Auth. Rev. Series 1999, 6.15%, 12/1/29 | | | | 1,278,948 | |
| |
| |
| | 19,038,644 | |
| |
| |
| |
| Puerto Rico (0.4%) |
| | 1,250,000 | | Puerto Rico Aqueduct & Swr. Auth. Rev. Refunding Series 1995, 5.00%, 7/1/19 | | | | 1,283,238 | |
| |
| |
| |
| Rhode Island (0.5%) |
| | 995,000 | | RI Hsg. & Mtg. Fin. Corp. Rental Hsg. Program Rev. Series 1993A (Section 8), 5.65%, 10/1/08 | | | | 996,264 | |
| | 260,000 | | RI Clean Water Protection Fin. Agy. Pooled Lien Rev. Series 1995A (MBIA insured), 5.375%, 10/1/15 | | | | 265,655 | |
| | 260,000 | | RI Hlth. & Educ. Bldg. Corp. Rev. Series 1997 (Steere House Proj.), 5.375%, 7/1/07 | | | | 264,423 | |
| | 280,000 | | RI Hlth. & Educ. Bldg. Corp. Rev. Series 1996 (Roger Williams Univ.)(Connie Lee insured), 5.375%, 11/15/24 | | | | 291,206 | |
| |
| |
| | 1,817,548 | |
| |
| |
| |
| South Carolina (0.7%) |
| | | | Newberry Investing Children’s Educ. Installment Rev. Series 2005 (Newberry Co. School Dist. Proj.): | | | | | |
| | 500,000 | | 3.50%, 12/1/07 | | | | 499,850 | |
| | 245,000 | | 4.00%, 12/1/08 | | | | 247,514 | |
| | 1,000,000 | | 5.25%, 12/1/21 | | | | 1,043,990 | |
| | 650,000 | | SC Educ. Facs. Auth. Rev. Series 1996A (Furman Univ. Proj.)(MBIA insured), 5.50%, 10/1/26 | | | | 676,260 | |
| |
| |
| | 2,467,614 | |
| |
| |
| |
| South Dakota (0.5%) |
| | 1,350,000 | | SD Hlth. & Educ. Fac. Auth. Rev Series 2001C (Sioux Valley Hosp. & Health Sys. Proj.) (LOC US Bank) (Mandatory Put 11/1/06), 4.85%, 11/1/19 | | | | 1,362,447 | |
| | 400,000 | | SD Hlth. & Educ. Fac. Auth. Rev. Series 1994 (Huron Regional Med. Ctr. Proj.), 7.25%, 4/1/20 | | | | 404,964 | |
| |
| |
| | 1,767,411 | |
| |
| |
| |
| Tennessee (2.5%) |
| | 750,000 | | Johnson City Power Board Elec. Sys. Rev. Sub Antic Notes Series 2005, 3.50%, 9/1/10 | | | | 741,833 | |
| | 240,000 | | Metro Govt. Nashville & Davidson Co. Indus. Dev. Brd. Rev. Refunding Series 2001A (GNMA collateralized), 6.625%, 3/20/36 | | | | 264,924 | |
| | | | Shelby Co. Hlth, Educ. & Hsg. Fac. Board Multifamily Hsg. Rev.: (CME Memphis Apts. Proj.): | | | | | |
| | | | (CME Memphis Apts. Proj.): | | | | | |
| | 1,850,000 | | Senior Series 1998A, 5.35%, 1/1/19 (8) (9) | | | | 933,677 | |
| | 7,875,000 | | Senior Series 1998A, 5.55%, 1/1/29 (8) (9) | | | | 3,915,056 | |
| | 1,630,000 | | Subordinate Series 1998C, 6.00%, 1/1/29 (8) (9) | | | | 28,525 | |
36
|
| |
|
| Quantity ($) | | Name of Issuer | | Market Value ($)(1) |
|---|
|
| |
| | | | (Eastwood Park Apts. Proj.): | | | | | |
| | 1,000,000 | | Senior Series 1995 A2, 6.40%, 9/1/25 (8) (9) | | | | 694,680 | |
| | 405,000 | | Subordinate Series 1995C, 7.50%, 9/1/25 (8) (9) | | | | 40,500 | |
| | | | (Raleigh Forest & Sherwood Apts. Proj.): | | | | | |
| | 2,670,000 | | Senior Series 1996A, 6.60%, 1/1/26 (8) (9) | | | | 2,250,677 | |
| | 610,000 | | Subordinate Series 1996C, 7.25%, 1/1/26 (8) (9) | | | | 61,000 | |
| |
| |
| | | 8,930,872 | |
| |
| |
| |
| Texas (13.2%) |
| | 2,500,000 | | Arlington Special Oblig. Rev. Series 2005-A (Special Tax-Dallas Cowboys Proj.), 5.00%, 8/15/34 | | | | 2,704,425 | |
| | | | Austin Convention Enterprises, Inc. (Convention Ctr.) Revenue: | | | | | |
| | 750,000 | | Series 2001-A (Convention Center), 6.375%, 1/1/16 | | | | 792,090 | |
| | 850,000 | | Series 2001-B (ZC Specialty Ins. Co.), 5.75%, 1/1/16 | | | | 908,242 | |
| | 500,000 | | Series 2001-B (ZC Specialty Ins. Co.), 6.00%, 1/1/23 | | | | 534,075 | |
| | 20,000 | | Austin Utilities System Rev. Refunding Series 1993 (MBIA insured), 5.25%, 5/15/18 | | | | 20,032 | |
| | 1,000,000 | | Bell Co. Hlth. Fac. Dev. Corp. Retirement Fac. Rev. Series 1998 (Buckner Retirement Services, Inc. Obligated Group, Proj.), 5.00%, 11/15/11 | | | | 1,034,130 | |
| | | | Beaumont HA Multifamily Mtg. Rev. Series 1993-A (Section 8): | | | | | |
| | 385,000 | | 6.65%, 11/1/07 | | | | 375,729 | |
| | 590,000 | | 6.75%, 11/1/10 | | | | 554,476 | |
| | 1,500,000 | | Bexar Co. Hlth. Fac. Dev. Corp. Rev. Refunding Series 1993 (Incarnate Word Hlth. Svcs. Proj.) (FSA insured), 6.10%, 11/15/23 | | | | 1,569,720 | |
| | | | Bexar Co. HFC Multifamily Hsg. Rev.: | | | | | |
| | 570,000 | | Subordinated Series 2000-C (Honey Creek Apts. Proj.), 8.00%, 4/1/30 | | | | 571,425 | |
| | 170,000 | | Subordinated Series 2001-B (American Oppty. Hsg. Dublin Kingswood & Waterford Apts. Proj.), 7.50%, 12/1/14 | | | | 175,836 | |
| | 545,000 | | Bexar Co. Rev. Series 2000 (Venue Proj.)(MBIA insured), 5.75%, 8/15/22 | | | | 585,041 | |
| | 650,000 | | Brazos River Hbr. Nav. Dist Rev. Series 2002-B-2 (Dow Chemical Co. Proj.), 4.75%, 5/15/33 | | | | 665,359 | |
| | 6,268,000 | | Dallas HFC Multifamily Mtg. Rev. Series 1998-A (GNMA collateralized) (Towne Ctr. Apts. Proj.), 6.75%, 10/20/32 | | | | 6,797,709 | |
| | 200,000 | | Denison Hosp. Rev. Series 1997 (Texoma Med. Ctr., Inc. Proj.), 6.125%, 8/15/17 | | | | 203,910 | |
| | 200,000 | | Fort Bend Co. Utility Dist. No. 30 G.O. Refunding Series 1996 (Radian insured), 5.90%, 9/1/15 | | | | 200,404 | |
| | 500,000 | | Harris Co. Rev. Refunding Sr. Lien Series 2005-A (Toll Road Proj.) (FSA insured), 5.25%, 8/15/35 | | | | 524,045 | |
| | | | Hidalgo Co. Hlth. Svcs. Rev. Series 2005 (Mission Hosp., Inc. Proj.): | | | | | |
| | 255,000 | | 4.00%, 8/15/06 | | | | 255,706 | |
| | 515,000 | | 4.00%, 2/15/07 | | | | 516,828 | |
| | 700,000 | | 5.00%, 8/15/19 | | | | 706,636 | |
| | 750,000 | | Houston Cmnty. College G.O. Refunding Series 2005, 5.00%, 2/15/12 | | | | 767,587 | |
| | 500,000 | | Lewisville Combination Contract Rev. Refunding Series 2004 (ACA insured), 5.75%, 9/1/12 | | | | 547,230 | |
| | 71,421 | | Midland HFC Single Family Mtg. Rev. Refunding Series 1992 A-2, 8.45%, 12/1/11 | | | | 73,652 | |
| | | | Mesquite Hlth. Fac. Dev. Corp. Retirement Fac. Rev. (Christian Care Ctr. Proj.): | | | | | |
| | 1,000,000 | | Series 1996-A, 6.30%, 2/15/12 | | | | 1,014,170 | |
| | 755,000 | | Series 2000-A, 7.00%, 2/15/10 | | | | 805,562 | |
| | 500,000 | | North Central Hlth. Fac. Dev. Corp. Rev. Refunding Series 1995 (Baylor Hlth. Care Sys.), 5.50%, 5/15/13 | | | | 516,540 | |
| | 7,272,000 | | Nortex Hsg. Fin. Corp. Multifamily Hsg. Rev. Series 1999 (GNMA collateralized) (Highland Oaks Apts. Proj.), 6.75%, 9/20/32 | | | | 7,846,852 | |
| | 266,760 | | Odessa HFC Single Family Mtg. Rev. Refunding Series 1992-B Class B-2, 8.125%, 11/1/11 | | | | 275,960 | |
| | 500,000 | | Red River Auth. Pollution Ctrl. Rev. Refunding Series 1991 (AMBAC insured), 5.20%, 7/1/11 | | | | 510,915 | |
| | | | Richardson Hosp. Auth. Rev. Refunding Series 1998 (Baylor/Richardson Proj.): | | | | | |
| | 500,000 | | 5.50%, 12/1/18 | | | | 517,575 | |
| | 1,375,000 | | 5.625%, 12/1/28 | | | | 1,415,631 | |
See accompanying notes to portfolios of investments on page 62.
37
| Sit Tax-Free Income Fund
September 30, 2005
Portfolio of Investments (Unaudited)
|
|
| Quantity ($) | | Name of Issuer | | Market Value ($)(1) |
|---|
|
| |
| | 315,000 | | Tarrant Co. Hlth. Facs. Dev. Corp. Rev. Series 1997-A (So. Central Nursing Proj.), 6.00%, 1/1/37 | | | | 346,169 | |
| | 515,000 | | Tarrant Co. Hlth. Fac. Dev. Corp. Hosp. Rev. Series 2000 (Adventist Hlth. Sys. Proj.), 5.80%, 11/15/05 | | | | 516,895 | |
| | | | Tarrant Co. HFC Multifamily Hsg. Rev: | | | | | |
| | 530,000 | | Senior Series 2001-A (Westridge Apts. Proj.), 5.50%, 6/1/11 | | | | 241,230 | |
| | 490,000 | | Subordinate Series 2001-C (Crossroads Apt. Proj.), 7.25%, 12/1/36 (8)(9) | | | | 146,682 | |
| | 2,000,000 | | Tomball Hosp. Auth. Rev. Refunding Series 1993, 6.125%, 7/1/23 | | | | 2,026,400 | |
| | | | TX Affordable Hsg. Corp. Multifamily Hsg. Rev: | | | | | |
| | 845,000 | | Senior Series 2001-A (NHT / GTEX Proj.)(MBIA insured), 4.10%, 10/1/08 | | | | 865,077 | |
| | 740,000 | | Junior Series 2001-B (NHT / GTEX Proj.), 6.75%, 10/1/16 (8)(9) | | | | 148,052 | |
| | | | TX Dept. Hsg. & Cmnty. Affairs Multifamily Hsg. Rev.: | | | | | |
| | 850,000 | | Senior Series 1996-A (Harbors & Plumtree Apts. Proj.), 6.35%, 7/1/16 | | | | 873,460 | |
| | 3,610,000 | | Senior Series 1996-A (Harbors & Plumtree Apts. Proj.), 6.45%, 7/1/26 | | | | 3,707,434 | |
| | 855,000 | | Subordinate Series 1996-C (Harbors & Plumtree Apts. Proj.), 7.375%, 7/1/26 | | | | 873,630 | |
| | 730,000 | | TX Public Property Fin. Corp. Mental Hlth. & Mental Retardation Rev. Series 1996, 6.20%, 9/1/16 | | | | 749,666 | |
| | 695,000 | | TX Turnnpike Auth. Rev. Series 1995 (George Bush Turnpike Proj.)(FGIC insured), 5.00%, 1/1/25 | | | | 704,695 | |
| | | | TX Water Dev. Brd. State Revolving Fund Sr. Lien Rev.: | | | | | |
| | 500,000 | | Series 1996-A, 5.25%, 7/15/17 | | | | 507,805 | |
| | 250,000 | | Series 1996-B, 5.125%, 7/15/18 | | | | 255,580 | |
| | 295,000 | | Tyler Hlth. Facs. Dev. Corp. Rev. Series 1997-B (East TX Med. Ctr. Proj.), 5.60%, 11/1/27 | | | | 311,762 | |
| |
| |
| | | 46,262,029 | |
| |
| |
| |
| Utah (0.7%) |
| | 725,000 | | Eagle Mountain Water & Sewer Rev. Refunding Series 2000 (ACA insured), 5.60%, 11/15/13 | | | | 775,039 | |
| | | | Salt Lake Co. College Rev. (Westminster College Proj.): | | | | | |
| | 1,000,000 | | Series 1997, 5.75%, 10/1/27 | | | | 1,042,420 | |
| | | | Series 1999: | | | | | |
| | 120,000 | | 5.15%, 10/1/11 | | | | 126,492 | |
| | 125,000 | | 5.20%, 10/1/12 | | | | 131,139 | |
| | 130,000 | | 5.25%, 10/1/13 | | | | 135,983 | |
| | 240,000 | | UT Hsg. Finance Agy. Multifamily Refunding Rev. Series 1996A (Section 8) (FHA insured), 6.10%, 7/1/22 | | | | 248,501 | |
| |
| |
| | | 2,459,574 | |
| |
| |
| |
| Vermont (0.3%) |
| | | | VT Educ. & Hlth. Bldgs. Financing Agency Rev.: | | | | | |
| | 420,000 | | Series 1998 (Norwich Univ. Proj.), 5.13%, 7/1/09 | | | | 437,392 | |
| | 150,000 | | Series 2002A (Developmental & Mental Hlth. Proj.), 4.375%, 6/15/07 | | | | 149,660 | |
| | 400,000 | | Series 2003A (Vermont Law School Proj.), 5.00%, 1/1/13 | | | | 411,068 | |
| |
| |
| | | 998,120 | |
| |
| |
| |
| Virginia (1.0%) |
| | 415,000 | | Alexandria Industrial Dev. Auth. Rev. Pollution Control Refunding Series 1994 (Potomac Electric Proj.) (MBIA insured), 5.375%, 2/15/24 | | | | 418,112 | |
| | 650,000 | | Chesapeake Hosp. Auth. Fac. Rev. Refunding Series 2004A (Chesapeake Gen. Hosp. Proj.), 4.25%, 7/1/16 | | | | 623,896 | |
| | 250,000 | | Chesterfield Co. Industrial Dev. Auth. Pollution Ctrl. Rev. Series 1987A Rmktg. (VA Elec. & Power Co. Proj.), 5.875%, 6/1/17 | | | | 272,145 | |
| | 385,000 | | Hanover Co. Indus. Dev. Auth. Rev. Series 1995 (Bon Secours Hlth. Sys. Proj.), 5.50%, 8/15/25 | | | | 393,485 | |
38
|
| |
|
| Quantity ($) | | Name of Issuer | | Market Value ($)(1) |
|---|
|
| |
| | | | Prince William Co. Indus. Dev. Auth. Educ. Fac. Rev. Series 2003 (Catholic Diocese Arlington): | | | | | |
| | 1,000,000 | | 4.375%, 10/1/13 | | | | 1,000,670 | |
| | 100,000 | | 5.00%, 10/1/18 | | | | 101,814 | |
| | | | VA Tobacco Settlement Fing. Corp Asset-Backed Rev. Series 2005: | | | | | |
| | 500,000 | | 5.25%, 6/1/19 | | | | 518,385 | |
| | 250,000 | | 5.50%, 6/1/26 | | | | 260,252 | |
| |
| |
| | | 3,588,759 | |
| |
| |
| |
| Washington (0.7%) |
| | 200,000 | | Energy Northwest Wind Proj. Rev. Series 2001B, 4.55%, 7/1/06 | | | | 201,284 | |
| | 350,000 | | Skagit Co. Public Hosp. Rev Refunding Series 2003, 3.75%, 12/1/05 | | | | 350,070 | |
| | 500,000 | | Skagit Co. Public Hosp. Dist. No. 001 Rev. Series 2005 (Skagit Valley Hosp. Proj.), 5.50%, 12/1/13 | | | | 534,610 | |
| | 125,000 | | Sumner Impt. Dist. No. 70 Special Assessment Series 2005, 2.75%, 1/15/22 | | | | 124,768 | |
| | 500,000 | | WA HFC Nonprofit Hsg. Rev. Refunding Series 1995A (Horizon House Proj.), 6.125%, 7/1/27 | | | | 513,215 | |
| | 260,000 | | WA Hgr. Educ. Fac. Auth. Rev. Refunding Series 1998 (Univ. Puget Sound Proj.) (MBIA insured), 5.375%, 10/1/30 | | | | 273,073 | |
| | 400,000 | | WA Tobacco Settlement Fing. Corp Asset-Backed Rev. Series 2002, 5.00%, 6/1/08 | | | | 411,032 | |
| |
| |
| | | 2,408,052 | |
| |
| |
| |
| West Virginia (1.0%) |
| | 3,500,000 | | Pleasants Co. Pollution Ctrl. Rev. Series 1995C (Monongahela Pwr. Co.), 6.15%, 5/1/15 | | | | 3,574,795 | |
| |
| |
| |
| Wisconsin (3.9%) |
| | 30,000 | | WI Hsg. & Econ. Dev. Auth. Home Ownership Rev. Series 1997A, 6.00%, 3/1/17 | | | | 31,124 | |
| | 1,000,000 | | WI HEDA Hsg. Rev. Series 1993C (MBIA insured)(Section 8), 5.80%, 11/1/13 | | | | 1,014,340 | |
| | | | WI Hlth. & Educ. Fac. Auth. Rev.: | | | | | |
| | 550,000 | | Series 1995 (Franciscan Sisters Proj.)(Connie Lee insured), 5.50%, 2/15/14 | | | | 562,067 | |
| | 335,000 | | Series 1996 (Meriter Hosp., Inc. Proj.), 6.00%, 12/1/06 | | | | 338,387 | |
| | 750,000 | | Refunding Series 1997B, (United Hlth. Grp., Inc. Proj.), 5.50%, 12/15/20 | | | | 795,810 | |
| | 195,000 | | Series 1998 (Lawrence Univ. Proj.), 5.125%, 4/15/28 | | | | 195,312 | |
| | 520,000 | | Series 1999 (FH Hlth. Care Dev. Inc Proj.), 5.625%, 11/15/09 | | | | 540,124 | |
| | | | Series 1999 (Kenosha Hosp. & Med. Ctr., Inc. Proj.): | | | | | |
| | 670,000 | | 5.00%, 5/15/06 | | | | 677,383 | |
| | 705,000 | | 5.10%, 5/15/07 | | | | 724,395 | |
| | 740,000 | | 5.15%, 5/15/08 | | | | 770,207 | |
| | 820,000 | | 5.35%, 5/15/10 | | | | 871,357 | |
| | 865,000 | | 5.45%, 5/15/11 | | | | 917,367 | |
| | 1,510,000 | | Series 1999A (Aurora Hlth. Care Proj), 5.60%, 2/15/29 | | | | 1,549,638 | |
| | 200,000 | | Series 1999B (Aurora Hlth. Care Proj), 5.50%, 2/15/15 | | | | 207,192 | |
| | 500,000 | | Series 1999B (Aurora Hlth. Care Proj)(ACA insured), 5.625%, 2/15/29 | | | | 512,705 | |
| | 780,000 | | Series 1999 (FH Hlth. Care Dev., Inc. Proj.), 6.25%, 11/15/28 | | | | 864,162 | |
| | 900,000 | | Series 1999 (Divine Savior, Inc. Proj.)(ACA insured), 5.70%, 6/1/28 | | | | 933,381 | |
| | | | Series 2001 (Agnesian Healthcare, Inc. Proj.): | | | | | |
| | 150,000 | | 5.00%, 7/1/06 | | | | 151,918 | |
| | 550,000 | | 6.00%, 7/1/17 | | | | 591,652 | |
| | 340,000 | | 6.00%, 7/1/21 | | | | 362,906 | |
| | 105,000 | | Series 2004A (Three Pillars Sr. Living Proj.), 4.15%, 8/15/11 | | | | 103,601 | |
| | 450,000 | | Series 2004 (Blood Ctr. Southeastern Proj.), 5.50%, 6/1/24 | | | | 473,071 | |
| | 600,000 | | Series 2005 (Vernon Mem. Hlth. Care Inc. Proj.), 4.65%, 3/1/15 | | | | 598,032 | |
| |
| |
| | | 13,786,131 | |
| |
| |
See accompanying notes to portfolios of investments on page 62.
39
| Sit Tax-Free Income Fund
September 30, 2005
Portfolio of Investments (Unaudited)
|
|
| Quantity ($) | | Name of Issuer | | Market Value ($)(1) |
|---|
|
| |
| Wyoming (0.2%) |
| | 615,000 | | Sweetwater Co. Pollution Ctrl. Rev. Refunding Series 1996A (Idaho Pwr. Co. Proj.), 6.05%, 7/15/26 | | | | 637,195 | |
| |
| |
| |
| Total municipal bonds (cost: $350,075,146) | 344,700,966 |
| |
| |
| |
| Closed-end Mutual Funds (0.6%) (2) |
| | 98,000 | | Blackrock Insured Municipal Term Trust 2008 | | | | 1,544,480 | |
| | 18,000 | | Blackrock NY Insured Municipal Term Trust 2008 | | | | 280,260 | |
| | 20,000 | | Van Kampen Muni Income Trust | | | | 175,400 | |
| | 20,000 | | Van Kampen Sector Muni Trust | | | | 253,600 | |
| |
| |
| |
| Total closed-end mutual funds (cost: $2,283,221) | 2,253,740 |
| |
| |
| |
| Short-term Securities (2.6%) (2) |
| | 4,660,416 | | Dreyfus Tax-Exempt Cash Management Fund, 2.37% | | | | 4,660,416 | |
| | 2,250,000 | | SD Hlth. & Educ. Facs. Auth. Rev. Series 2004 (Avera Hlth. Proj.), variable rate, 7/1/24 | | | | 2,250,000 | |
| | 2,100,000 | | SD Hlth. & Educ. Facs. Auth. Rev. Series 2004 (Avera Hlth. Proj.), variable rate, 7/1/30 | | | | 2,100,000 | |
| |
| |
| |
| Total short-term securities (cost: $9,010,415) | 9,010,416 |
| |
| |
| |
| Total investments in securities (cost: $361,368,782) (7) | $355,965,122 |
| |
| |
See accompanying notes to portfolios of investments on page 62.
40
This page has been left blank intentionally.
41
| Sit Minnesota Tax-Free Income Fund
Six Months Ended September 30, 2005
Senior Portfolio Managers
Michael C. Brilley • Debra A. Sit, CFA • Paul J. Jungquist, CFA
|
The Sit Minnesota Tax-Free Income Fund provided a +2.78% return for the six months ended September 30, 2005, compared with a return of +1.81% for the Lehman 5-Year Municipal Bond Index. The Fund’s 30-day SEC yield was 4.31% and its 12-month distribution rate was 4.21%, compared with 4.49% and 4.33%, respectively, six months ago.
Despite four federal funds rate increases totaling 100 basis points, municipal yields were fairly stable during the period. Short term tax-exempt yields rose approximately 0.30%, longer term yields fell approximately 0.20% and intermediate yields were little changed. The Fund benefited from its holdings in several distinct sectors, including the multifamily housing, hospital, industrial revenue, lease, and other revenue sectors, the latter which includes tax increment bonds. These sectors saw price stability or gains as investors continued to seek yield. Sectors which underperformed included the single family housing sector, as prepayment fears offset the potential for price gains, and the Fund’s lower yielding general obligation bond holdings.
During the period, several issues held by the Fund were refunded or advance refunded. Multifamily sector holdings decreased by 8.7% to 23.2%, industrial revenue bonds decreased by 1.5% to 6.2%, and general obligation and education issues both decreased by about 1.0%. A number of prerefunded holdings were sold, taking advantage of price gains. Nonetheless, the Fund held a 5.7% weighting in that sector at the end of September, compared to 0.6% six months ago. Purchases focused on securities that provided attractive risk-adjusted yields. Hospital and lease holdings both increased by just over 2.0% to 21.6% and 4.1%, respectively, while single family bonds increased by 3.0% to 5.8%. Along with the refunding activity and sales, nonrated holdings decreased by 5.9% to 31.4%. The Fund’s average credit quality remains A.
We expect interest rates to move higher in 2006 as economic growth remains solid with rebuilding from Hurricane Katrina and inflation concerns increase as higher energy prices work their way into the system. The Fund’s implied duration was 4.1 years, which was little changed from six months ago, and is relatively short to reduce the risk of price depreciation as interest rates rise. In addition, this short duration will allow the Fund to take advantage of attractive reinvestment opportunities at higher yield levels in the coming year.
| INVESTMENT OBJECTIVE AND STRATEGY |
|---|
The investment objective of the Minnesota Tax-Free Income Fund is to provide a high level of current income exempt from federal regular income tax and Minnesota regular personal income tax as is consistent with the preservation of capital.
During normal market conditions, the Fund invests 100% of its net assets in municipal securities that generate interest income that is exempt from regular federal income tax and Minnesota regular personal income tax. The Fund anticipates that substantially all of its distributions to its shareholders will be exempt as such. For investors subject to the alternative minimum tax (“AMT”), up to 20% of the Fund’s income may be alternative minimum taxable income.
| Net Asset Value 9/30/05: | | $10.16 Per Share | | |
| 3/31/05: | | $10.09 Per Share | |
| Total Net Assets: | | $251.0 Million | |
| 30-day SEC Yield: | | 4.31 | |
| Tax Equivalent Yield: | | 7.20(1) | |
| 12-Month Distribution Rate: | | 4.21 | |
| Average Maturity: | | 12.5 Years | |
| Duration to Estimated Avg. Life: | | 3.7 Years(2) | |
| Implied Duration: | | 4.1 Years(2) | |
| |
(1) For individuals in the 35.0% federal tax and 7.85% MN tax brackets
(2) See next page. |
PORTFOLIO STRUCTURE
(% OF TOTAL NET ASSETS) |
|---|
42
| AVERAGE ANNUAL TOTAL RETURNS* |
|---|
| Sit
MN Tax-Free
Income Fund | | Lehman
5-Year Muni.
Bond Index | | Lipper
MN Muni. Bond
Fund Index |
|---|
|
| |
| |
| |
| 3 Month** | | | 0.51% | | | -0.10% | | | -0.14% | | |
| 6 Month** | | | 2.78 | | | 1.81 | | | n/a | | |
| 1 Year | | | 4.80 | | | 1.45 | | | 3.88 | | |
| 5 Years | | | 5.42 | | | 5.13 | | | 5.72 | | |
| 10 Years | | | 5.16 | | | 4.96 | | | 5.21 | | |
| Inception | | | 5.26 | | | 4.99 | | | 5.00 | | |
| (12/1/93) | | |
| CUMULATIVE TOTAL RETURNS* |
|---|
| Sit
MN Tax-Free
Income Fund | | Lehman
5-Year Muni.
Bond Index | | Lipper
MN Muni. Bond
Fund Index |
|---|
|
| |
| |
| |
| 1 Year | | | 4.80% | | | 1.45% | | | 3.88% | | |
| 5 Years | | | 30.21 | | | 28.40 | | | 32.07 | | |
| 10 Years | | | 65.35 | | | 62.34 | | | 66.17 | | |
| Inception | | | 83.44 | | | 77.89 | | | 78.19 | | |
| (12/1/93) | | |
| |
| *As of 9/30/05. | **Not annualized. |
|
| Performance figures are historical and do not guarantee future results. Investment returns and principal value will vary, and you may have a gain or loss when you sell shares. Average annual total returns include changes in share price as well as reinvestment of all dividends and capital gains. Management fees and administrative expenses are included in the Fund’s performance; however, fees and expenses are not incorporated in the Lehman 5-Year Municipal Bond Index. The Lipper returns are obtained from Lipper Analytical Services, Inc., a large independent evaluator of mutual funds. |
(2) Duration is a measure which reflects estimated price sensitivity to a given change in interest rates. For example, for an interest rate change of 1%, a portfolio with a duration of 5 years would be expected to experience a price change of 5%. Estimated average life duration is based on current interest rates and the Adviser’s assumptions regarding the expected average life of individual securities held in the portfolio. Implied duration is calculated based on historical price changes of securities held by the Fund. The Adviser believes that the portfolio’s implied duration is a more accurate estimate of price sensitivity provided interest rates remain within their historical range. If interest rates exceed the historical range, the estimated average life duration may be a more accurate estimate of price sensitivity.
The sum of $10,000 invested at inception (12/1/93) and held until 9/30/05 would have grown to $18,344 in the Fund or $17,789 in the Lehman 5-Year Municipal Bond Index assuming reinvestment of all dividends and capital gains.
QUALITY RATINGS
(% OF TOTAL NET ASSETS) |
|---|
43
| Sit Minnesota Tax-Free Income Fund
September 30, 2005
Portfolio of Investments (Unaudited)
|
|
| Quantity ($) | | Name of Issuer | | Market Value ($)(1) |
|---|
|
| |
| Municipal Bonds (93.1%) (2) |
| Education/Student Loan (3.5%) |
| | 1,000,000 | | Minneapolis Rev. Series 1997-A (Univ. Gateway Proj.), 5.25%, 12/1/17 | | | | 1,040,710 | |
| | | | Minnesota Higher Educ. Fac. Auth. Rev.: | | | | | |
| | 750,000 | | Series 1998-4T (College of St. Benedict), 5.35%, 3/1/20 | | | | 757,755 | |
| | 100,000 | | Series 1998-4R (St. Olaf College), 5.25%, 10/1/23 | | | | 101,766 | |
| | 458,000 | | Lease Rev. Series 1999-5A (Concordia University), 5.25%, 4/25/14 | | | | 459,896 | |
| | 700,000 | | Series 1999-4Y (Augsburg College), 5.05%, 10/1/13 | | | | 721,063 | |
| | 150,000 | | Series 1999-4Y (Augsburg College), 5.20%, 10/1/16 | | | | 154,138 | |
| | 75,000 | | Series 1999-4Y (Augsburg College), 5.30%, 10/1/27 | | | | 76,855 | |
| | 700,000 | | Series 2005-6C (Augsburg College), 5.00%, 5/1/23 | | | | 723,667 | |
| | 100,000 | | Series 1999-4Z (Northwestern Hlth. Services University), 4.875%, 10/1/09 | | | | 101,799 | |
| | 275,000 | | Series 1999-4Z (Northwestern Hlth. Services University), 5.20%, 10/1/13 | | | | 279,067 | |
| | 100,000 | | Series 2000-5D (College Art & Design), 5.75%, 5/1/08 | | | | 105,134 | |
| | 50,000 | | Series 1998-4T (St. Benedict College), 5.125%, 3/1/13 | | | | 50,526 | |
| | 110,000 | | Series 1996-4A1 (University of St. Thomas), 5.625%, 10/1/21 | | | | 112,142 | |
| | | | Series 2004-5U (St. Mary's Univ.): | | | | | |
| | 200,000 | | 2.00%, 10/1/05 | | | | 199,994 | |
| | 270,000 | | 3.75%, 10/1/13 | | | | 263,879 | |
| | 310,000 | | Northfield Lease Rev. Series 1999-A (Village School Proj.), 7.50%, 12/1/24 | | | | 246,754 | |
| | 550,000 | | Ramsey Lease Rev. Series 2004-A (Pact Charter School Proj.), 5.65%, 12/1/13 | | | | 556,044 | |
| | | | St. Paul Hsg. & Redev. Auth. Lease Rev.: | | | | | |
| | 120,000 | | Series 1999 (St. Paul Academy & Summit School Proj.), 5.50%, 10/1/24 | | | | 125,288 | |
| | 825,000 | | Series 2001-A (Cmty. of Peace Academy Proj.), 6.375%, 12/1/11 | | | | 830,544 | |
| | 750,000 | | Series 2001-A (Cmty. of Peace Academy Proj.), 7.00%, 12/1/15 | | | | 765,540 | |
| | 350,000 | | Series 2001-A (Cmty. of Peace Academy Proj.), 7.375%, 12/1/19 | | | | 360,622 | |
| | 415,000 | | Series 2002-A (New Spirit Charter School Proj.), 6.50%, 12/1/12 | | | | 420,636 | |
| | 100,000 | | Victoria Private School Fac. Rev. Series 1999-A (Holy Family Catholic H.S. Proj.), 5.20%, 9/1/11 | | | | 101,107 | |
| | | | Winona Port. Auth. Lease Rev. Series 1999-A (Bluffview Montessori School Proj.): | | | | | |
| | 80,000 | | 5.80%, 12/1/06 | | | | 81,959 | |
| | 85,000 | | 5.90%, 12/1/07 | | | | 88,631 | |
| | 165,000 | | 8.00%, 12/1/24 | | | | 174,012 | |
| |
| |
| | 8,899,528 | |
| |
| |
| |
| Escrowed to Maturity/Prerefunded (5.7%) |
| | 515,000 | | Carver Co. Hsg. & Redev. Auth. Hsg. & Dev. Gross Rev. Ltd.Tax G.O. (Chanhassen Apts. Proj.), 7.00%, 1/1/25 | | | | 530,677 | |
| | | | Cloquet Multifamily Hsg. Rev. Refunding Series 2001-A (HADC Proj.): | | | | | |
| | 60,000 | | 6.25%, 2/1/06 | | | | 60,610 | |
| | 60,000 | | 6.50%, 2/1/07 | | | | 62,430 | |
| | 75,000 | | 7.10%, 2/1/10 | | | | 79,337 | |
| | 180,000 | | Dakota Co. Hsg. & Redev. Auth. Multifamily Hsg. Rev. Refunding (Walnut Trails Apts. Proj.), Subordinate Series 1995-C, 9.00%, 1/20/15 (4) | | | | 196,333 | |
| | 225,000 | | Goodhue Co. Econ. Dev. Auth. Rev. Series 1997-A (Courts Bldg. Proj.), 5.75%, 2/1/13 | | | | 227,180 | |
| | | | Inver Grove Heights Senior Hsg. Rev. (PHM/Inver Grove, Inc Proj): | | | | | |
| | 105,000 | | Series 2001-A, 5.50%, 5/1/08 | | | | 106,257 | |
| | 110,000 | | Series 2001-A, 5.50%, 11/1/08 | | | | 111,317 | |
| | 65,000 | | Series 2001-B, 5.00%, 5/1/06 | | | | 65,751 | |
| | 70,000 | | Series 2001-B, 5.25%, 5/1/07 | | | | 70,823 | |
| | 75,000 | | Series 2001-B, 5.50%, 5/1/08 | | | | 75,898 | |
| | 80,000 | | Series 2001-B, 5.60%, 5/1/09 | | | | 80,965 | |
44
|
| |
|
| Quantity ($) | | Name of Issuer | | Market Value ($)(1) |
|---|
|
| |
| | 70,000 | | Series 2001-B, 5.00%, 11/1/06 | | | | 70,808 | |
| | 75,000 | | Series 2001-B, 5.50%, 11/1/08 | | | | 75,898 | |
| | 80,000 | | Series 2001-B, 5.60%, 11/1/09 | | | | 80,965 | |
| | 100,000 | | Series 2001-B, 7.00%, 11/1/31 | | | | 101,325 | |
| | | | Lake Crystal Public Utilities Comm. Electric Rev. Series 1998: | | | | | |
| | 40,000 | | 4.80%, 12/1/06 | | | | 40,123 | |
| | 130,000 | | 5.45%, 12/1/13 | | | | 130,542 | |
| | 120,000 | | 5.50%, 12/1/16 | | | | 120,510 | |
| | 3,035,000 | | Little Canada Multifamily Hsg. Rev. Series 1997-A (Hsg. Alt. Dev. Co. Proj.), 6.10%, 12/1/17 | | | | 3,168,024 | |
| | 1,685,000 | | Maplewood Hlth. Care Fac. Rev. (Volunteers of America Care Ctrs. Proj.), 7.375%, 10/1/12 | | | | 1,702,035 | |
| | | | Minnesota Higher Educ. Fac. Auth. Rev.: | | | | | |
| | 125,000 | | Series 1992-3L1 (Carleton College), 5.75%, 11/1/12 | | | | 127,111 | |
| | 425,000 | | Series 1996-4F1 (Augsburg College), 6.25%, 5/1/23 | | | | 437,491 | |
| | 50,000 | | Series 1997-4J (Macalester College), 5.40%, 3/1/09 | | | | 51,640 | |
| | 800,000 | | Series 1997-4L (St. John's University), 5.35%, 10/1/17 | | | | 835,328 | |
| | 400,000 | | Series 1997-4L (St. John's University), 5.40%, 10/1/22 | | | | 418,048 | |
| | | | MN Public Facs. Auth. Wtr. Pollution Ctrl. Rev.: Series 1997: | | | | | |
| | 70,000 | | Series 1996-B, 5.00%, 3/1/17 | | | | 70,639 | |
| | 215,000 | | Series 1997, 5.00%, 3/1/12 | | | | 220,988 | |
| | 105,000 | | Series 1997, 5.00%, 3/1/16 | | | | 107,924 | |
| | | | MN Agr. & Econ. Dev. Board Rev. Series 2000-A (Fairview Hlth. Care System Proj.): | | | | | |
| | 320,000 | | 6.375%, 11/15/22 | | | | 366,621 | |
| | 360,000 | | 6.375%, 11/15/29 | | | | 412,448 | |
| | 630,000 | | Puerto Rico Childrens Trust Fund Tobacco Settlement Rev. Series 2000, 5.75%, 7/1/20 | | | | 666,175 | |
| | 2,520,000 | | Shoreview Sr. Hsg. Rev. Series 1996 (Shoreview Sr. Residence Proj.), 7.25%, 2/1/26 | | | | 2,603,790 | |
| | 810,000 | | Steele Co. Hlth. Care Fac. Rev. Series 2000 (Elderly Hsg. Proj.), 6.625%, 6/1/20 | | | | 872,516 | |
| |
| |
| | 14,348,527 | |
| |
| |
| |
| General Obligation (3.9%) |
| | 455,000 | | Albany Independent School Dist. No. 745 G.O. Series 2005-A, 3.25%, 9/1/06 | | | | 455,878 | |
| | | | Apple Valley Equipment Certficates G.O. Series 2004: | | | | | |
| | 35,000 | | 2.50%, 10/1/05 | | | | 35,000 | |
| | 40,000 | | 2.50%, 10/1/06 | | | | 39,824 | |
| | 300,000 | | Becker Co. G.O. Refunding Series 2001, 3.75%, 2/1/06 | | | | 301,005 | |
| | 40,000 | | Cold Spring G.O. Series 1998-B, 4.55%, 12/1/08 | | | | 40,074 | |
| | 75,000 | | Cold Spring G.O. Series 2000, 5.15%, 2/1/09 | | | | 76,453 | |
| | 100,000 | | Eagan G.O. Series 2000-A, 5.25%, 2/1/11 | | | | 100,193 | |
| | 50,000 | | Hutchinson ISD No. 423 G.O. Series 1996-A, 5.85%, 2/1/18 | | | | 52,864 | |
| | 50,000 | | Little Falls G.O. Series 1999-A, 5.00%, 2/1/11 | | | | 50,872 | |
| | 50,000 | | Minneapolis Refunding G.O. Series 1993-A, 5.10%, 12/1/08 | | | | 50,188 | |
| | 45,000 | | Minneapolis G.O. Series 1999 (Parking Ramp Proj.), 5.125%, 12/1/16 | | | | 47,974 | |
| | 300,000 | | Minneapolis ISD No. 001 Series 1997, 5.00%, 2/1/09 | | | | 302,019 | |
| | 4,000,000 | | MN G.O. Series 1997, 4.90%, 8/1/14 | | | | 4,128,200 | |
| | 250,000 | | Montgomery ISD No. 394 G.O. Series 1997-A, 5.25%, 2/1/13 | | | | 251,865 | |
| | 780,000 | | New Ulm ISD No. 088 Refunding G.O. Series 1998, 4.35%, 2/1/17 | | | | 785,600 | |
| | 350,000 | | Owatonna ISD No. 761 G.O. Series 1996, 5.10%, 2/1/07 | | | | 352,471 | |
| | 150,000 | | Sauk Rapids Tax Increment G.O. Series 1997-B, 5.25%, 8/1/12 | | | | 152,614 | |
| | 1,000,000 | | Savage G.O. Series 1996-A, 5.35%, 2/1/07 | | | | 1,007,890 | |
| | 130,000 | | St. Anthony G.O. Series 2004-B, 1.55%, 2/1/07 | | | | 127,141 | |
| | 100,000 | | St. Cloud Infrastructure Mgmt. Fund G.O. Series 1997-C, 4.70%, 3/1/06 | | | | 100,152 | |
See accompanying notes to portfolios of investments on page 62.
45
| Sit Minnesota Tax-Free Income Fund
September 30, 2005
Portfolio of Investments (Unaudited)
|
|
| Quantity ($) | | Name of Issuer | | Market Value ($)(1) |
|---|
|
| |
| | | | St. Paul Cap. Impt. G.O. Series 2005: | | | | | |
| | 835,000 | | 4.00%, 3/1/06 | | | | 839,208 | |
| | 290,000 | | 4.00%, 9/1/06 | | | | 293,097 | |
| | 100,000 | | St. Paul ISD No. 625 G.O. Series 1998-A, 5.00%, 2/1/12 | | | | 100,687 | |
| | 100,000 | | St. Paul Street Impt. Special Assessment G.O. Series 2000-B, 5.30%, 3/1/12 | | | | 104,675 | |
| | 30,000 | | Winona Water & Sewer G.O. Series 1998-C, 4.90%, 2/1/13 | | | | 30,192 | |
| |
| |
| | 9,826,136 | |
| |
| |
| |
| Hospital/Health Care (21.6%) |
| | | | Aitkin Hlth. Care Fac. Rev. Series 2001 (Riverwood Hlth. Care Ctr. Proj.): | | | | | |
| | 250,000 | | 6.00%, 2/1/06 | | | | 251,262 | |
| | 250,000 | | 6.25%, 2/1/07 | | | | 255,232 | |
| | | | Alexandria Hlth. Care Fac. Rev. Series 2002-B (BSM Property - Bethany Home Proj.): | | | | | |
| | 375,000 | | 4.65%, 7/1/06 | | | | 375,187 | |
| | 375,000 | | 4.95%, 7/1/07 | | | | 375,765 | |
| | | | Bemidji Hosp. Fac. Rev. Refunding (North Country Hlth. Proj.): | | | | | |
| | 110,000 | | Series 1995, 6.05%, 9/1/24 | | | | 110,175 | |
| | 1,035,000 | | Series 1996, 5.625%, 9/1/21 | | | | 1,068,430 | |
| | | | Brooklyn Center Hlth. Care Fac. Rev. Series 1993 (Maranatha Proj.): | | | | | |
| | 50,000 | | 6.75%, 12/1/05 | | | | 50,170 | |
| | 500,000 | | 7.50%, 12/1/10 | | | | 501,900 | |
| | 200,000 | | 7.60%, 12/1/18 | | | | 200,568 | |
| | 305,000 | | Cambridge Hsg. & Hlth. Care Fac. Rev. Series 1998-C (Grandview West Proj.), 5.25%, 10/1/08 | | | | 309,621 | |
| | 905,000 | | Columbia Heights Multifamily & Health Care Fac. Rev. Series 1998 (Crest View Corp. Proj.), 5.75%, 9/1/11 | | | | 904,593 | |
| | | | Crookston Nursing Home & Multifamily Hsg. Rev Series 2002-A (Villa St. Vincent Proj.): | | | | | |
| | 100,000 | | 4.75%, 9/1/08 | | | | 101,372 | |
| | 75,000 | | 5.50%, 9/1/11 | | | | 77,495 | |
| | | | Cuyuna Range Hosp. Dist. Hlth. Fac. Gross Rev.: | | | | | |
| | | | Series 1999-A: | | | | | |
| | 1,000,000 | | 5.75%, 6/1/14 | | | | 1,028,660 | |
| | 1,000,000 | | 6.00%, 6/1/19 | | | | 1,029,260 | |
| | 235,000 | | Series 2005, 4.50%, 6/1/13 | | | | 233,677 | |
| | 1,500,000 | | Detroit Lakes Hsg. Rev. Refunding Series 2004-E (Mankato Lutheran Proj.), 4.25%, 8/1/34 | | | | 1,504,155 | |
| | 400,000 | | Duluth Econ. Dev. Auth. Hlth. Care Fac. Rev. Series 2002 (St. Luke's Hosp. Proj.), 6.00%, 6/15/12 | | | | 409,524 | |
| | 768,290 | | Duluth Sr. Hsg. Loan Participation Series 2004 (Lakeshore Proj.), 4.00%, 8/20/36 | | | | 769,427 | |
| | | | Elk River Rev. Series 1998 (Care Choice Member Proj.): | | | | | |
| | 1,000,000 | | 5.60%, 8/1/13 | | | | 1,016,610 | |
| | 160,000 | | 5.75%, 8/1/23 | | | | 161,275 | |
| | 850,000 | | Fergus Falls Hlth. Care Fac. Auth. Rev. Series 1995 (Lake Region Hosp. Corp.), 6.40%, 12/1/15 | | | | 869,669 | |
| | | | Glencoe Hlth. Care Fac. Rev. Series 2005 (Glencoe Regional Hlth. Svcs. Proj.): | | | | | |
| | 280,000 | | 3.60%, 4/1/08 | | | | 278,642 | |
| | 915,000 | | 4.15%, 4/1/12 | | | | 910,105 | |
| | | | Hastings Hlth. Care Fac. Rev. Series 1998 (Augustana Home of Hastings Proj.): | | | | | |
| | 115,000 | | 5.10%, 11/1/09 | | | | 113,814 | |
| | 120,000 | | 5.20%, 11/1/10 | | | | 118,656 | |
| | 135,000 | | 5.40%, 11/1/12 | | | | 133,408 | |
| | 140,000 | | 5.50%, 11/1/13 | | | | 138,510 | |
| | 1,000,000 | | Maple Grove Hlth. Care Fac. Rev. Series 2005 (North Memorial Hlth. Care Proj.), 5.00%, 9/1/20 | | | | 1,050,240 | |
46
|
| |
|
| Quantity ($) | | Name of Issuer | | Market Value ($)(1) |
|---|
|
| |
| | | | Maplewood Hlth. Care Fac. Rev. Refunding Series 2005-A (VOA Care Centers Proj.): | | | | | |
| | 100,000 | | 4.00%, 10/1/06 | | | | 100,073 | |
| | 250,000 | | 4.00%, 10/1/07 | | | | 249,442 | |
| | 255,000 | | 4.125%, 10/1/08 | | | | 253,381 | |
| | 300,000 | | 4.375%, 10/1/09 | | | | 298,587 | |
| | | | Marshall Medical Center Gross Rev. (Weiner Memorial Medical Center Proj.): | | | | | |
| | 305,000 | | Series 1999, 5.65%, 11/1/13 | | | | 322,196 | |
| | 320,000 | | Series 1999, 5.70%, 11/1/14 | | | | 337,347 | |
| | 150,000 | | Series 2003-B, 4.85%, 11/1/11 | | | | 157,857 | |
| | 850,000 | | Series 2003-A, 5.85%, 11/1/23 | | | | 923,304 | |
| | | | Minneapolis & St. Paul Hsg. & Redev. Auth. Hlth. Care Sys. Rev. Series 2003 (Health Partners Proj.): | | | | | |
| | 500,000 | | 4.00%, 12/1/05 | | | | 500,725 | |
| | 1,000,000 | | 5.25%, 12/1/08 | | | | 1,050,420 | |
| | 750,000 | | 5.25%, 12/1/12 | | | | 806,197 | |
| | 700,000 | | 5.25%, 12/1/13 | | | | 753,452 | |
| | 1,150,000 | | 5.00%, 12/1/14 | | | | 1,209,340 | |
| | 500,000 | | 5.875%, 12/1/29 | | | | 537,685 | |
| | 150,000 | | Minneapolis Hsg. & Hlth. Care Facs. Rev. Series 1997 (Augustana Chapel View Homes Proj.), | | | | | |
| | | | 6.75%, 6/1/27 | | | | 151,200 | |
| | | | Minneapolis Hlth. Care Fac. Rev.: | | | | | |
| | 1,045,000 | | Series 1993 (St. Olaf Res. Proj.), 7.00%,10/1/18 | | | | 1,045,115 | |
| | 855,000 | | Series 1999 (Shelter Care Foundation Proj.), 6.00%, 4/1/10 | | | | 849,032 | |
| | | | Series 2004-A (Augustana Chapel View Homes Proj.): | | | | | |
| | 270,000 | | 3.50%, 1/1/06 | | | | 269,428 | |
| | 280,000 | | 4.00%, 1/1/07 | | | | 278,466 | |
| | 315,000 | | 5.20%, 1/1/11 | | | | 317,854 | |
| | 500,000 | | 5.75%, 1/1/19 | | | | 508,320 | |
| | 500,000 | | 5.80%, 1/1/24 | | | | 507,260 | |
| | 400,000 | | 5.50%, 12/1/30 | | | | 399,968 | |
| | | | Series 2005 (Jones-Harrison Residence Proj.): | | | | | |
| | 105,000 | | 3.50%, 4/1/07 | | | | 104,905 | |
| | 110,000 | | 3.50%, 10/1/07 | | | | 109,857 | |
| | 1,470,000 | | 5.40%, 10/1/25 | | | | 1,450,199 | |
| | | | Series 2005-E (Augustana Chapel View Homes Proj.): | | | | | |
| | 190,000 | | 4.00%, 6/1/08 | | | | 190,631 | |
| | 200,000 | | 4.20%, 6/1/09 | | | | 201,160 | |
| | 205,000 | | 4.40%, 6/1/10 | | | | 206,400 | |
| | 220,000 | | 4.55%, 6/1/11 | | | | 222,277 | |
| | 240,000 | | 4.80%, 6/1/13 | | | | 242,155 | |
| | 250,000 | | 4.90%, 6/1/14 | | | | 251,642 | |
| | 255,000 | | 5.00%, 6/1/15 | | | | 257,249 | |
| | 270,000 | | 5.10%, 6/1/16 | | | | 272,668 | |
| | 285,000 | | 5.25%, 6/1/17 | | | | 288,320 | |
| | | | MN Agr. & Econ. Dev. Board Hlth. Care Rev.: | | | | | |
| | | | Series 1999 (Benedictine Care Centers Proj.): | | | | | |
| | 115,000 | | 5.45%, 2/1/09 | | | | 117,467 | |
| | 120,000 | | 5.45%, 8/1/09 | | | | 122,801 | |
| | 120,000 | | 5.50%, 2/1/10 | | | | 123,042 | |
| | 125,000 | | 5.50%, 8/1/10 | | | | 128,386 | |
See accompanying notes to portfolios of investments on page 62.
47
| Sit Minnesota Tax-Free Income Fund
September 30, 2005
Portfolio of Investments (Unaudited)
|
|
| Quantity ($) | | Name of Issuer | | Market Value ($)(1) |
|---|
|
| |
| | | | MN Agr. & Econ. Dev. Board Rev.: | | | | | |
| | | | Series 2000 (Evangelical Lutheran Good Samaritan Society Proj.): | | | | | |
| | 410,000 | | 5.80%, 8/1/08 | | | | 431,804 | |
| | 750,000 | | 6.55%, 8/1/16 | | | | 828,330 | |
| | 770,000 | | Series 2002-B (Principal Custody Receipts Proj.), Zero coupon, 3.85% effective yield, 11/15/22 | | | | 601,085 | |
| | | | Series 2002 (Evangelical Lutheran Good Samaritan Society Proj.): | | | | | |
| | 345,000 | | 5.40%, 2/1/09 | | | | 361,298 | |
| | 220,000 | | 5.50%, 2/1/12 | | | | 235,690 | |
| | | | Series 2000-A (Fairview Hlth. Care Sys. Proj.): | | | | | |
| | 645,000 | | 5.625%. 11/15/05 | | | | 646,999 | |
| | 590,000 | | 5.70%, 11/15/06 | | | | 606,101 | |
| | 10,000 | | 6.375%, 11/15/22 | | | | 10,953 | |
| | 20,000 | | 6.375%, 11/15/29 | | | | 21,752 | |
| | | | New Hope Hlth. Care Facs. Rev. Series 1999 (St. Therese Home, Inc. Proj.): | | | | | |
| | 45,000 | | Series 2003-B, 3.00%, 10/1/06 | | | | 44,686 | |
| | 300,000 | | Series 2003-A, 5.90%, 10/1/23 | | | | 310,773 | |
| | | | New Hope Hlth. Care Facs. Rev. (MN Masonic Home North Ridge Proj.): | | | | | |
| | 1,000,000 | | 5.90%, 3/1/19 | | | | 1,036,080 | |
| | 400,000 | | 5.875%, 3/1/29 | | | | 410,124 | |
| | | | North Oaks Presbyterian Loan Participation: | | | | | |
| | 599,856 | | Series 2004-B, 4.25%, 12/15/34 | | | | 601,752 | |
| | 434,664 | | Series 2004-C, 4.38%, 12/15/34 | | | | 436,038 | |
| | 290,602 | | Series 2004-D, 4.75%, 12/15/34 | | | | 290,663 | |
| | | | Northfield Hospital Rev. Series 2001-C: | | | | | |
| | 1,080,000 | | 6.00%, 11/1/13 | | | | 1,168,052 | |
| | 50,000 | | 6.00%, 11/1/21 | | | | 53,349 | |
| | 3,100,000 | | 6.00%, 11/1/26 | | | | 3,285,783 | |
| | | | Olmsted Co. Hlth. Care Fac. Rev. Series 1998 (Olmsted Medical Ctr. Proj.): | | | | | |
| | 775,000 | | 5.45%, 7/1/13 | | | | 797,746 | |
| | 900,000 | | 5.55%, 7/1/19 | | | | 920,259 | |
| | 240,000 | | Pine Island Hlth. Care Facs. Rev. Series 2001 (Olmsted Med. Ctr. Proj.), 5.00%, 7/1/10 | | | | 246,516 | |
| | 75,000 | | Rochester Hlth. Care Fac. Rev. G.O. Series 1998-A (Mayo Foundation Proj.), 5.50%, 11/15/27 | | | | 79,219 | |
| | | | Rochester Hlth. Care & Hsg. Rev. Series 2003-A (Samaritan Bethany Inc. Proj.): | | | | | |
| | 160,000 | | 3.25%, 8/1/06 | | | | 159,131 | |
| | 500,000 | | 6.25%, 8/1/19 | | | | 518,460 | |
| | | | Shakopee Hlth. Care Facs. Rev. Series 2004 (St. Francis Regl. Med. Ctr. Proj.): | | | | | |
| | 315,000 | | 4.00%, 9/1/06 | | | | 316,370 | |
| | 125,000 | | 5.10%, 9/1/25 | | | | 128,604 | |
| | | | St. Paul Hsg. & Redev. Auth. Hlth. Care Rev. Series 1998 (Regions Hosp. Proj.): | | | | | |
| | 800,000 | | 5.00%, 5/15/08 | | | | 824,200 | |
| | 250,000 | | 5.00%, 5/15/10 | | | | 258,475 | |
| | 1,340,000 | | 5.20%, 5/15/13 | | | | 1,377,708 | |
| | 2,050,000 | | 5.25%, 5/15/18 | | | | 2,091,164 | |
| | 580,000 | | 5.30%, 5/15/28 | | | | 588,584 | |
| | 1,000,000 | | St. Paul Hsg. & Redev. Auth. Hosp. Rev. Series 2005 (Health East Proj.), 5.25%, 11/15/14 | | | | 1,034,220 | |
| | 960,000 | | St. Paul Hsg. & Redev. Auth. Nursing Home Dev. Rev. Refunding Series 1996-C | | | | | |
| | | | (Franciscan Hlth. Cmmty. Proj., St. Mary's Home), 7.00%, 7/1/21 | | | | 970,541 | |
| | | | St. Paul Hsg. & Redev. Auth. Hlth. Care Rev. Series 2005 (Gillette Childrens Hosp. Proj.): | | | | | |
| | 200,000 | | 4.00%, 2/1/06 | | | | 200,444 | |
| | 200,000 | | 5.00%, 2/1/07 | | | | 203,978 | |
48
|
| |
|
| Quantity ($) | | Name of Issuer | | Market Value ($)(1) |
|---|
|
| |
| | 300,000 | | 4.00%, 2/1/11 | | | | 297,144 | |
| | 200,000 | | 5.00%, 2/1/13 | | | | 205,674 | |
| | 225,000 | | 5.00%, 2/1/14 | | | | 229,597 | |
| | 400,000 | | St. Paul Hsg. & Redev. Auth. Hlth. Care Rev. Series 2001A (Model Cities Hlth. Ctr. Proj.), 6.50%, 11/1/11 | | | | 415,364 | |
| | 440,000 | | St. Paul Port Auth. Lease Rev. Series 2005A (Health East Midway Campus Proj.), 5.00%, 5/1/10 | | | | 444,070 | |
| | 150,000 | | White Bear Lake First Mtg. Rev. Series 2004 (Health East Care Ctr. Proj.), 2.75%, 11/1/06 | | | | 148,350 | |
| |
| |
| | 54,300,340 | |
| |
| |
| |
| Industrial / Pollution Control (6.2%) |
| | 2,180,000 | | Anoka Co. Solid Waste Disp. Rev. Series 1987-A (Natl. Rural Util. Proj.), 6.95%, 12/1/08 (4) | | | | 2,191,925 | |
| | 1,305,000 | | Burnsville Solid Waste Rev. Refunding Series 2003-A (Freeway Transfer Inc. Proj.), 4.15%, 4/1/10 (4) | | | | 1,289,444 | |
| | 500,000 | | Cohasset Pollution Ctrl. Rev. Refunding Series 2004 (Allete, Inc. Proj.), 4.95%, 7/1/22 | | | | 504,845 | |
| | 655,000 | | East Grand Forks Industrial Dev. Rev. Refunding Series 2001-B (Am. Crystal Sugar Proj.), 5.40%, 4/1/11 | | | | 681,645 | |
| | 180,000 | | Guam Economic Dev. Auth. Tobacco Settlement Asset-Backed Series 2001-A, 5.00%, 5/15/22 | | | | 183,220 | |
| | 1,000,000 | | Guam Econ. Dev. Auth. Tobacco Settlement Asset-Backed Rev. Series 2001-B Zero Coupon, 5.20% Effective Yield on Purchase Date, 5/15/15 | | | | 897,390 | |
| | 1,500,000 | | Hugo Industial Dev. Rev. Refunding Series 2002 (MN Union Builders Proj.), 7.75%, 3/1/17 (4)(8)(9) | | | | 747,900 | |
| | | | MN Public Facs. Auth. Water Pollution Ctrl. Rev.: | | | | | |
| | 85,000 | | Series 1997, 5.00%, 3/1/12 | | | | 87,244 | |
| | 45,000 | | Series 1997, 5.00%, 3/1/16 | | | | 46,073 | |
| | 185,000 | | Series 2001-A, 5.00%, 3/1/19 | | | | 196,189 | |
| | 210,000 | | Medina Industrial Dev. Rev. Refunding Series 1998 (Temroc Metals, Inc. Proj.), 5.10%, 10/1/05 (4) | | | | 210,000 | |
| | | | Owatonna Industrial Dev. Rev. Series 1997 (Slidell, Inc. Proj.): | | | | | |
| | 280,000 | | 7.25%, 5/1/14 (4)(8)(9) | | | | 140,311 | |
| | 505,000 | | 7.375%, 5/1/17 (4)(8)(9) | | | | 252,323 | |
| | 20,000 | | 7.375%, 5/1/20 (4)(8)(9) | | | | 9,976 | |
| | 10,000 | | 7.50%, 5/1/24 (8)(9) | | | | 4,983 | |
| | 525,000 | | Puerto Rico Indus. Tourist, Educ., Medical and Environmental Control Facs. Financing Auth. Industrial Rev. Series 1998A (Guaynabo Warehouse for Emergencies Proj.), 4.35%, 7/1/06 | | | | 529,006 | |
| | | | Puerto Rico Childrens Trust Fund Tobacco Settlement Rev. : | | | | | |
| | 300,000 | | Series 2002, 4.00%, 5/15/10 | | | | 303,147 | |
| | 2,095,000 | | Series 2002, 5.375%, 5/15/33 | | | | 2,168,555 | |
| | 465,000 | | Roseville Dev. Rev. Refunding Series 2004 (Roseville Office Plaza Proj.), 4.625%, 8/1/12 | | | | 472,547 | |
| | 265,000 | | Sauk Centre Industrial Dev. Rev. Series 1998 (Seluemed LLP Proj.)(LOC First Trust), 5.75%, 4/1/18 (4) | | | | 265,533 | |
| | 1,250,000 | | Seaway Port Auth. Duluth Dock & Wharf Rev. Refunding Series 2004 (Cargill, Inc. Proj.), 4.20%, 5/1/13 | | | | 1,266,187 | |
| | | | St. Paul Hsg. & Redev. Auth. District Cooling Rev. Series 1998-J: | | | | | |
| | 150,000 | | 4.75%, 3/1/08 | | | | 153,550 | |
| | 95,000 | | 5.125%, 3/1/12 | | | | 98,710 | |
| | 500,000 | | 5.35%, 3/1/18 | | | | 516,760 | |
| | | | Virgin Islands Tobacco Settlement Financing Corp. Asset-Backed Rev. Series 2001: | | | | | |
| | 750,000 | | Zero Coupon, 4.95% Effective Yield on Purchase Date, 5/15/14 | | | | 672,930 | |
| | 1,615,000 | | 5.00%, 5/15/21 | | | | 1,633,847 | |
| |
| |
| | 15,524,240 | |
| |
| |
| |
| Insured (8.6%) |
| | 50,000 | | Bemidji ISD No. 031 G.O. Series 1998 (FSA insured), 5.00%, 4/1/19 | | | | 51,246 | |
| | 280,000 | | Elk River G.O. Series 1999-3A (FGIC Insured), 5.00%, 2/1/13 | | | | 281,912 | |
| | | | Goodhue Co. Econ. Dev. Auth. Lease Rev. Series 1998-A (MBIA insured): | | | | | |
| | 450,000 | | 4.65%, 2/1/12 | | | | 452,399 | |
| | 475,000 | | 4.70%, 2/1/13 | | | | 477,613 | |
See accompanying notes to portfolios of investments on page 62.
49
| Sit Minnesota Tax-Free Income Fund
September 30, 2005
Portfolio of Investments (Unaudited)
|
|
| Quantity ($) | | Name of Issuer | | Market Value ($)(1) |
|---|
|
| |
| | | | Hastings Hlth. Care Fac. Rev. Series 1998 (Regina Med. Ctr.)(ACA insured): | | | | | |
| | 565,000 | | 5.25%, 9/15/18 | | | | 576,916 | |
| | 240,000 | | 5.30%, 9/15/28 | | | | 243,466 | |
| | 20,000 | | Itasca Co. ISD No. 318 G.O. Series 1996 (MBIA insured), 5.20%, 2/1/10 | | | | 20,038 | |
| | 100,000 | | Lake Crystal G.O. Series 2004-B (Ambac insured), 2.00%, 12/1/05 | | | | 99,842 | |
| | 20,000 | | Marshall Lease Rev. Series 1998-A (Law Enforcement Ctr. Proj.)(MBIA insured), 4.40%, 2/1/06 | | | | 20,026 | |
| | | | Minneapolis & St. Paul Hsg. & Redev. Auth. Hlth. Care Sys. Rev. Series 1993-A | | | | | |
| | | | (Healthspan Hlth. Sys. Proj.) (Ambac insured): | | | | | |
| | 175,000 | | 5.00%, 11/15/13 | | | | 175,420 | |
| | 3,205,000 | | 4.75%, 11/15/18 | | | | 3,210,352 | |
| | | | Minneapolis & St. Paul Metro Airport Comm. Airport Rev. (Ambac insured): | | | | | |
| | 250,000 | | Series 1998-A, 5.00%, 1/1/22 | | | | 259,470 | |
| | 1,650,000 | | Series 1998-B, 5.25%, 1/1/13 (4) | | | | 1,722,435 | |
| | 650,000 | | MN HFA Single Family Mtg. Rev. Series 2001-A (MBIA insured), 5.35%, 7/1/17 | | | | 668,597 | |
| | | | NE Metro Intermediate School Dist. No. 916 C.O.P. Series 2004: | | | | | |
| | 705,000 | | 3.00%, 1/1/06 | | | | 704,803 | |
| | 500,000 | | 4.25%, 1/1/14 | | | | 504,830 | |
| | 305,000 | | North Mankato Impt. G.O. Series 2000-A (FGIC insured), 4.75%, 2/1/10 | | | | 306,726 | |
| | | | Perham Gas Utility Rev. Series 1999 (Radian insured): | | | | | |
| | 300,000 | | 5.35%, 6/1/19 | | | | 316,698 | |
| | 50,000 | | 5.45%, 6/1/29 | | | | 51,250 | |
| | 200,000 | | Puerto Rico Indus. Tourist Educ. Med. & Environmental Ctl. Facs. Rev. Series 1995-A | | | | | |
| | | | (Hosp. Auxilio Oblig. Group Proj.) (MBIA insured), 6.25%, 7/1/16 | | | | 204,526 | |
| | 300,000 | | Scott Co. Hsg. & Redev. Auth. Ltd. Special Benefits Tax Series 1997-B (River City Centre Proj.), | | | | | |
| | | | (Ambac insured), 5.45%, 2/1/20 | | | | 313,479 | |
| | 100,000 | | Sleepy Eye Refunding & Impt. G.O. Series 2005-A (Ambac insured), 3.00%, 2/1/06 | | | | 100,093 | |
| | | | St. Cloud Hosp. Facs. Rev. Ref. (St. Cloud Hosp. Proj.) (Ambac insured), | | | | | |
| | 435,000 | | Series 1996-B, 5.00%, 7/1/20 | | | | 443,613 | |
| | 200,000 | | St. Cloud Hlth. Care Rev. Series 2000-A (St. Cloud Hosp. Obligated Group)(FSA insured), 5.125%, 5/1/09 | | | | 212,174 | |
| | 250,000 | | St. Louis Co. Hsg. & Redev. Auth. Rev. Series 1997 (Law Enforce. Proj.)(FGIC insured), 5.00%, 12/1/08 | | | | 250,885 | |
| | 235,000 | | St. Paul Hsg. & Redev. Auth. Rev. Series 1993 (Ramsey Med. Ctr. Proj.)(Ambac insured), 5.55%, 5/15/23 | | | | 235,425 | |
| | 2,480,000 | | St. Paul Hsg. & Redev. Sales Tax Rev. Refunding Series 1996 (Civic Center Proj.) | | | | | |
| | | | (FSA insured), 7.10%, 11/1/23 | | | | 3,088,493 | |
| | 100,000 | | St. Paul Ind. School Dist. No. 625 G.O. Series 1997-B (FSA insured), 4.65%, 2/1/06 | | | | 100,150 | |
| | 130,000 | | Scott Co. Hsg. & Redev. Auth. Fac. Lease Rev. Series 1997 (Justice Ctr. Proj.)(Ambac insured), | | | | | |
| | | | 5.50%, 12/1/15 | | | | 136,301 | |
| | 165,000 | | Stillwater Cap. Outlay G.O. Series 1996-A (FSA insured), 5.375%, 2/1/11 | | | | 166,320 | |
| | 2,750,000 | | Southern MN Muni Pwr. Agy. Pwr. Supply Sys. Rev. Series 2002-A (Ambac insured), 5.00%, 1/1/07 | | | | 2,818,723 | |
| | 805,000 | | Waconia Hlth. Care Facs. Rev. Series 1999-A (Ridgeview Med. Ctr. Proj.) 6.125%, 1/1/29 | | | | 877,144 | |
| | 300,000 | | Western MN Pwr. Agy. Rev. Refunding Series 1996-A (Ambac insured), 5.50%, 1/1/12 | | | | 307,860 | |
| | 1,750,000 | | White Earth Band of Chippewa Indians Rev. Series 2000-A (ACA insured), 7.00%, 12/1/11 | | | | 1,916,355 | |
| | 145,000 | | Worthington Perm. Impt. Revolving Fd. G.O. Series 1998-A (FSA insured), 4.50%, 2/1/10 | | | | 145,692 | |
| |
| |
| | 21,461,272 | |
| |
| |
| |
| Multifamily Mortgage (23.2%) |
| | | | Apple Valley Multifamily Hsg. Rev. Refunding Series 1998-A (Mtg. Loan/Apple Valley | | | | | |
| | | | Villa Proj.) (GNMA collateralized): | | | | | |
| | 40,000 | | 4.90%, 8/1/09 | | | | 41,252 | |
| | 1,520,000 | | 5.25%, 8/1/18 | | | | 1,552,786 | |
50
|
| |
|
| Quantity ($) | | Name of Issuer | | Market Value ($)(1) |
|---|
|
| |
| | | | Austin Hsg. & Redev. Auth. Governmental Hsg. Gross Rev. (Courtyard Res. Proj.): | | | | | |
| | 50,000 | | Series 1995-A, 7.00%, 1/1/15 | | | | 51,606 | |
| | 500,000 | | Series 1995-A, 7.25%, 1/1/26 | | | | 516,250 | |
| | 650,000 | | Series 2000-A, 7.15%, 1/1/20 | | | | 699,530 | |
| | 500,000 | | Series 2000-A, 7.25%, 1/1/32 | | | | 535,850 | |
| | 494,531 | | Buffalo Hlth. Care C.O.P. Series 2004-C (Central MN Sr. Hsg., LLC Proj.), 7.50%, 2/20/33 | | | | 494,749 | |
| | 250,000 | | Buffalo Rev. Refunding Series 1998 (Covenant Retirement Cmtys. Proj.), 4.55%, 12/1/05 | | | | 250,280 | |
| | | | Burnsville Multifamily Hsg. Rev. Refunding Series 1991 (Oak Leaf Apts. Proj.)(GNMA collateralized): | | | | | |
| | 680,000 | | 7.05%, 1/1/12 | | | | 681,299 | |
| | 780,000 | | 7.125%, 1/1/17 | | | | 781,342 | |
| | 860,000 | | 7.125%, 1/1/21 | | | | 861,436 | |
| | 150,000 | | 7.15%, 1/1/27 | | | | 150,237 | |
| | 530,000 | | 7.15%, 1/1/23 | | | | 530,885 | |
| | 425,000 | | 7.15%, 1/1/25 | | | | 425,680 | |
| | | | Carver Co. Hsg. & Redev. Auth. Multifamily Hsg.: | | | | | |
| | 1,280,000 | | Gross Rev. & Ltd. Tax Refunding Series 1997-A (Lake Grace Apts. Proj.), 6.00%, 7/1/28 | | | | 1,295,258 | |
| | 650,000 | | Rev. Refunding Series 1997-A (Waybury Apts. Proj.), 5.875%, 8/1/27 | | | | 669,240 | |
| | 400,000 | | Subordinate Rev. Refunding Series 1997-C (Waybury Apts. Proj.), 8.00%, 8/1/27 | | | | 403,068 | |
| | | | Chaska Multifamily Hsg. Rev. Series 1999 (West Suburban Hsg. Partners Proj.): | | | | | |
| | 235,000 | | 5.00%, 9/1/09 (4) | | | | 227,048 | |
| | 495,000 | | 5.375%, 9/1/14 (4) | | | | 456,776 | |
| | 700,000 | | Coon Rapids Multifamily Hsg. Rev. Refunding Series 1997-A (Margaret Place Apts. Proj.), | | | | | |
| | | | 6.50%, 5/1/25 | | | | 704,928 | |
| | | | Coon Rapids Senior Hsg. Rev. Refunding Series 1998 (Epiphany Sr. Citizens Hsg. Corp. Proj.): | | | | | |
| | 115,000 | | 5.30%, 11/1/07 | | | | 115,058 | |
| | 115,000 | | 5.40%, 11/1/08 | | | | 115,053 | |
| | 170,000 | | 5.50%, 11/1/10 | | | | 170,032 | |
| | 545,000 | | 5.80%, 11/1/18 | | | | 544,978 | |
| | 800,000 | | Dakota Co. Cmty. Dev. Agy. Hsg. Fac. Rev. Subordinate Series 2002-B | | | | | |
| | | | (HADC Apple Valley Sr. Apts. Proj.), 7.50%, 8/15/43 | | | | 789,992 | |
| | 1,930,000 | | Eagan Multifamily Hsg. Rev. Refunding Series 1997-A (Woodridge Apts. Proj.), 5.95%, 2/1/32 | | | | 2,026,635 | |
| | | | Eden Prairie Multifamily Hsg. Rev. Refunding : | | | | | |
| | 25,000 | | Series 1997 (Preserve Place Proj.) (GNMA collateralized), 4.90%, 1/20/08 | | | | 25,859 | |
| | 300,000 | | Series 1997-A (Preserve Place Proj.) (GNMA collateralized), 5.50%, 1/20/18 | | | | 311,007 | |
| | 410,000 | | Series 1997-A (Preserve Place Proj.) (GNMA collateralized), 5.60%, 7/20/28 | | | | 422,493 | |
| | 470,000 | | Senior Series 2001-A (Rolling Hills Proj.) (GNMA collateralized), 6.00%, 8/20/21 | | | | 513,555 | |
| | 675,000 | | Senior Series 2001-A (Rolling Hills Proj.) (GNMA collateralized), 6.15%, 8/20/31 | | | | 733,887 | |
| | 1,185,000 | | Series 2001-A (Rolling Hills Proj.) (GNMA collateralized), 6.20%, 2/20/43 | | | | 1,283,711 | |
| | 1,020,000 | | Subordinate Series 2001-C (Rolling Hills Proj.), 9.00%, 4/1/43 | | | | 1,016,726 | |
| | 100,000 | | Faribault Hsg. & Redev. Auth. Govt. Hsg. Dev. Gross Rev. Refunding Series 1998-A | | | | | |
| | | | (Trails Edge Apts. Proj.), 5.25%, 2/1/28 | | | | 103,716 | |
| | | | Fairmont Hsg. Fac. Rev. Series 2002-A1 (Homestead-GEAC Proj.): | | | | | |
| | 1,100,000 | | 6.625%, 10/1/11 | | | | 1,160,412 | |
| | 295,000 | | 6.875%, 10/1/14 | | | | 298,844 | |
| | | | Golden Valley Rev. Series 1999-A (Covenant Retirement Cmntys. Proj.): | | | | | |
| | 500,000 | | 5.50%, 12/1/25 | | | | 519,650 | |
| | 1,170,000 | | 5.50%, 12/1/29 | | | | 1,212,377 | |
See accompanying notes to portfolios of investments on page 62.
51
| Sit Minnesota Tax-Free Income Fund
September 30, 2005
Portfolio of Investments (Unaudited)
|
|
| Quantity ($) | | Name of Issuer | | Market Value ($)(1) |
|---|
|
| |
| | | | Grand Rapids Hsg. & Redev. Auth. (Lakeshore Place and Forest Park West Apts. Proj.): | | | | | |
| | 55,000 | | Series 1999-B, 5.00%, 10/1/09 | | | | 55,957 | |
| | 500,000 | | Series 1999-A, 5.20%, 10/1/19 | | | | 507,245 | |
| | 1,660,000 | | Series 1999-A, 5.30%, 10/1/29 | | | | 1,674,060 | |
| | 130,000 | | Series 1999-B, 5.70%, 10/1/29 | | | | 131,282 | |
| | 490,000 | | Hopkins Subordinate Multifamily Hsg. Rev. Refunding Series 1996-C (Auburn Apts. Proj.), 8.00%, 6/20/31 | | | | 477,417 | |
| | | | Hopkins Multifamily Hsg. Rev. Series 1996 (Hopkins Renaissance Proj.) (Section 8): | | | | | |
| | 100,000 | | 5.85%, 4/1/09 | | | | 104,443 | |
| | 450,000 | | 6.25%, 4/1/15 | | | | 467,321 | |
| | | | Hutchinson Hsg. Fac. Rev. (Prince of Peace Apts. Proj.): | | | | | |
| | 50,000 | | Series 2003-A, 3.50%, 10/1/06 | | | | 50,020 | |
| | 115,000 | | Series 2003-A, 4.00%, 10/1/07 | | | | 115,087 | |
| | 120,000 | | Series 2003-A, 4.50%, 10/1/08 | | | | 120,133 | |
| | 1,400,000 | | Maplewood Multifamily Hsg. Rev. Series 1998 (Park Edge Apts. Proj.), 6.50%, 5/1/29 (4) | | | | 1,263,164 | |
| | | | Maplewood Multifamily Refunding Rev. (Village on Woodlyn Proj.): | | | | | |
| | 1,605,000 | | Series 1999-A (GNMA collateralized), 6.75%, 7/20/30 (4) | | | | 1,691,076 | |
| | 100,000 | | Subordinate Series 1999-C-1, 8.00%, 11/1/30 (4) | | | | 101,724 | |
| | 260,000 | | Subordinate Series 1999-C-2, 8.00%, 11/1/30 (4) | | | | 264,482 | |
| | 200,000 | | Moorhead Econ Dev. Auth. Multifamily Rev. Series 1999-B (Eventide Sr. Hsg. Proj.), 5.90%, 6/1/19 | | | | 200,804 | |
| | | | Minneapolis Multifamily Hsg. Rev.: | | | | | |
| | 500,000 | | Series 2002-A (Keeler Apts. Proj.), 7.00%, 10/1/17 | | | | 508,555 | |
| | 355,000 | | Series 1996 (Belmont Apts.), 7.25%, 11/1/16 | | | | 355,838 | |
| | 500,000 | | Series 1996-A (Nicollet Towers) (Section 8), 5.60%, 6/1/08 | | | | 519,415 | |
| | 5,020,000 | | Series 1996-A (Nicollet Towers) (Section 8), 6.00%, 12/01/19 | | | | 5,131,143 | |
| | 1,000,000 | | Series 1998 (Riverside Plaza Proj.) (GNMA collateralized), 5.10%, 12/20/18 (4) | | | | 1,017,380 | |
| | 330,000 | | Series 2000 (Garr Scott Loft Proj.)(LOC U.S. Bank), 5.95%, 5/1/30 (4) | | | | 345,190 | |
| | 50,000 | | Series 2003-A (Sumner Proj.) (GNMA collateralized), 3.00%, 8/20/08 (4) | | | | 49,618 | |
| | | | Minneapolis Student Hsg. Rev. Series 2000 (Riverton Community Hsg. Proj.): | | | | | |
| | 125,000 | | 6.80%, 7/1/10 | | | | 129,406 | |
| | 240,000 | | 6.90%, 7/1/11 | | | | 247,042 | |
| | 50,000 | | MN HFA Rental Hsg. Rev. Series 1996-A, 6.10%, 8/1/27 (4) | | | | 51,423 | |
| | 85,000 | | MN HFA Rental Hsg. Rev. Series 2004-A, 4.875%, 8/1/24 (4) | | | | 86,127 | |
| | 100,000 | | MN HFA Rental Hsg. Rev. Series 2000-A (Section 8), 5.375%, 2/1/09 (4) | | | | 104,729 | |
| | | | Minnetonka Multifamily Hsg. Rev. Refunding Series 1999-A (GNMA collateralized) (Archer Heights Apts. Proj.): | | | | | |
| | 540,000 | | 5.10%, 7/20/13 (4) | | | | 561,530 | |
| | 975,000 | | 5.20%, 1/20/18 (4) | | | | 1,007,253 | |
| | | | New Ulm Multifamily Rev. Series 1999 (HADC Ridgeway Proj.): | | | | | |
| | 95,000 | | 5.35%, 12/1/08 | | | | 96,315 | |
| | 100,000 | | 5.40%, 12/1/09 | | | | 101,482 | |
| | 105,000 | | 5.50%, 12/1/10 | | | | 106,757 | |
| | 110,000 | | 5.60%, 12/1/11 | | | | 111,917 | |
| | 200,000 | | 6.125%, 12/1/19 | | | | 204,692 | |
| | | | Northwest MN Multi Co. Hsg. & Redev. Auth. Hsg. Rev. Series 2005-A (Pooled Hsg. Proj.): | | | | | |
| | 145,000 | | 4.50%, 7/1/09 | | | | 144,842 | |
| | 115,000 | | 4.75%, 7/1/10 | | | | 114,847 | |
| | | | Oakdale Multifamily Sr. Hsg. Rev. Refunding Series 2004 (Oak Meadows Proj.): | | | | | |
| | 325,000 | | 4.25%, 4/1/08 | | | | 327,688 | |
| | 600,000 | | 5.00%, 4/1/12 | | | | 611,670 | |
52
|
| |
|
| Quantity ($) | | Name of Issuer | | Market Value ($)(1) |
|---|
|
| |
| | | | Plymouth Multifamily Hsg. Rev. Refunding (Fox Forest Apts. Proj.) (GNMA collateralized): | | | | | |
| | 1,650,000 | | Series 1996-A, 8.05%, 6/20/31 | | | | 1,727,138 | |
| | 630,000 | | Series 1996-C, 8.00%, 6/20/31 | | | | 615,138 | |
| | 500,000 | | Richfield Sr. Hsg. Rev. Refunding Series 2004-A (Richfield Sr. Hsg., Inc. Proj.), 5.00%, 12/1/15 | | | | 497,840 | |
| | 2,800,000 | | Rochester Multifamily Rev. Refunding Series 2000-A (Weatherstone Apts. Proj.) (LOC Household Finance) (Mandatory Put 9/1/17) 6.375%, 9/1/37 (4) | | | | 3,103,352 | |
| | | | Roseville Hsg. Fac. Rev. Refunding Bonds Series 1998 (College Properties Inc. Proj.): | | | | | |
| | 2,820,000 | | 5.60%, 10/1/13 | | | | 2,840,671 | |
| | 100,000 | | 5.875%, 10/1/28 | | | | 100,506 | |
| | 80,000 | | Sherburne Co. Hsg. & Redev. Auth. Lease Rev. Series 1997, 5.50%, 2/1/17 | | | | 80,346 | |
| | | | Shoreview Sr. Hsg. Rev. Series 2005-A (Shoreview Sr. Residence Proj.): | | | | | |
| | 110,000 | | 3.50%, 5/1/08 | | | | 109,036 | |
| | 115,000 | | 3.75%, 5/1/09 | | | | 114,042 | |
| | 100,000 | | St. Cloud Hsg. & Redev. Auth. Multifamily Hsg. Rev. Refunding Series 1998 | | | | | |
| | | | (Northway Manor Apts. Proj.)(Section 8), 5.35%, 12/1/18 | | | | 99,061 | |
| | 1,585,000 | | St. Cloud Hsg. & Redev. Auth. Multifamily Hsg. Rev.: | | | | | |
| | | | Series 1993 (Germain Towers Proj.) (Section 8), 5.90%, 9/1/20 | | | | 1,509,443 | |
| | 60,000 | | Series 1999-A (Parkview Terrace Apts. Proj.) (Section 8), 5.00%, 6/1/09 | | | | 59,837 | |
| | | | St. Louis Park Multifamily Hsg. Rev. Refunding: | | | | | |
| | 650,000 | | Series 1995 (FHA insured) (Knollwood Cmty. Hsg. Proj.), 6.15%, 12/1/16 | | | | 664,268 | |
| | 500,000 | | Series 1998-A (Park Ridge Apts. Proj.) (GNMA collateralized), 5.25%, 11/1/20 | | | | 516,860 | |
| | 200,000 | | St. Paul Hsg. & Redev. Auth. Multifamily Refunding Rev. Series 1995 | | | | | |
| | | | (Sun Cliffe Apts. Proj.)(GNMA collateralized), 5.875%, 7/1/15 | | | | 204,760 | |
| | 3,230,000 | | St. Paul Port Authority Multifamily Hsg. Refunding (Jackson Towers Apts. Proj.) Senior | | | | | |
| | | | Series 1998-1A (GNMA collateralized), 6.95%, 4/20/33 | | | | 3,454,679 | |
| | 755,000 | | Washington Co. Hsg. & Redev. Auth. Governmental Hsg. Rev. Refunding Series 1999-A (Briar Pond Apts. Proj.) (GNMA collateralized), 5.50%, 2/20/14 | | | | 779,175 | |
| |
| |
| | 58,328,711 | |
| |
| |
| |
| Municipal Lease (4.2%) (5) |
| | | | Andover Econ. Dev. Auth. Public Fac. Lease Rev. Series 2004 (Cmnty. Ctr. Proj.): | | | | | |
| | 185,000 | | 2.125%, 2/1/06 | | | | 184,236 | |
| | 500,000 | | 5.125%, 2/1/24 | | | | 516,225 | |
| | 40,000 | | Anoka Co. C.O.P. Series 1998, 5.40%, 6/1/28 | | | | 40,689 | |
| | 31,538 | | Brooklyn Park C.O.P. Series 1996, 5.45%, 9/27/06 | | | | 31,866 | |
| | 110,000 | | Burnsville Econ. Dev. Auth. Lease Rev. Series 1994-A, 5.90%, 12/1/05 | | | | 110,276 | |
| | 175,000 | | Cambridge Econ. Dev. Auth. Public Fac. Lease Rev. Refunding Series 1998, 4.50%, 2/1/10 | | | | 176,972 | |
| | 2,300,000 | | Carver Scott Co. Lease Purchase Agreement Series 2005, 5.00%, 8/4/20 | | | | 2,271,365 | |
| | 50,000 | | Chaska Econ. Dev. Auth. ISD No. 112 Sch. Facs. Lease Rev. Series 1999-A, 5.125%, 12/1/09 | | | | 52,852 | |
| | 89,000 | | Hennepin Co. Hsg. & Redev. Auth. Rev. Series 1993-A (Community Provider Program), 5.70%, 8/1/13 | | | | 89,108 | |
| | 415,000 | | Hibbing Econ. Dev. Auth. Public Proj. Rev. Series 1997 (Hibbing Lease Obligations Proj.), 6.10%, 2/1/08 | | | | 423,844 | |
| | 125,000 | | Mountain Iron Hsg. & Redev. Auth. Rev. Series 2001-A (Arrowhead Library Sys. Proj.), 5.00%, 9/1/09 | | | | 129,503 | |
| | 140,000 | | Shorewood Econ. Dev. Auth. Public Safety Fire Fac. Lease Rev. Series 2002-A, 3.50%, 2/1/06 | | | | 139,922 | |
| | 800,000 | | St. Cloud C.O.P. Series 1997, 5.90%, 12/1/17 | | | | 801,848 | |
| | 1,336,732 | | St. Paul Lease Series 1998 (City Hall Annex Building), 5.71%, 10/1/18 | | | | 1,414,851 | |
| | | | St. Paul ISD No. 625 C.O.P Series 1995-C: | | | | | |
| | 1,000,000 | | 5.125%, 2/1/06 | | | | 1,001,890 | |
| | 40,000 | | 5.40%, 2/1/10 | | | | 40,082 | |
| | 400,000 | | St. Paul Hsg. & Redev. Auth. Lease Rev. Series 2000 (Rivercentre Pkg. Ramp Proj.), 5.70%, 5/1/08 | | | | 421,696 | |
See accompanying notes to portfolios of investments on page 62.
53
| Sit Minnesota Tax-Free Income Fund
September 30, 2005
Portfolio of Investments (Unaudited)
|
|
| Quantity ($) | | Name of Issuer | | Market Value ($)(1) |
|---|
|
| |
| | | | Virginia Hsg. & Redev. Auth. Hlth. Care Fac. Lease Rev. Series 2005: | | | | | |
| | 300,000 | | 4.00%, 10/1/07 | | | | 301,980 | |
| | 275,000 | | 4.00%, 10/1/08 | | | | 276,430 | |
| | 300,000 | | 4.00%, 10/1/09 | | | | 300,936 | |
| | 300,000 | | 4.50%, 10/1/10 | | | | 306,741 | |
| | 1,200,000 | | 5.125%, 10/1/20 | | | | 1,233,576 | |
| |
| |
| | 10,266,888 | |
| |
| |
| |
| Public Facilities (0.7%) |
| | 50,000 | | MN Agr. Soc. State Fair Rev. Series 2003, 5.00%, 9/15/20 | | | | 51,252 | |
| | | | St. Paul Recreational Facs. Gross Rev. Series 1996-D: | | | | | |
| | 160,000 | | 5.50%, 6/1/08 | | | | 161,928 | |
| | 1,245,000 | | 5.875%, 6/1/18 | | | | 1,260,114 | |
| | 250,000 | | Rockville Econ. Dev. Auth. Pub. Proj. Lease Rev. Series 2005-A, 4.00%, 2/1/14 | | | | 247,665 | |
| |
| |
| | 1,720,959 | |
| |
| |
| |
| Single Family Mortgage (5.8%) |
| | | | Dakota County Hsg. & Redev. Auth. Single Family Mtg. Rev.: | | | | | |
| | 10,000 | | Series 1994-A (FNMA backed), 6.70%, 10/1/09 (4) | | | | 10,033 | |
| | 20,000 | | Series 1995 (FNMA & GNMA backed), 6.25%, 10/1/09 (4) | | | | 20,250 | |
| | | | Minneapolis- St. Paul Hsg. Fin. Bd. Single Family Mtg. Rev. (FNMA & GNMA backed): | | | | | |
| | 55,000 | | Series 1997, 6.25%, 11/1/30 | | | | 58,790 | |
| | 1,250,000 | | Series 2005-A3, 5.10%, 4/1/27 | | | | 1,323,163 | |
| | 915,000 | | Minneapolis Redev. Mtg. Rev. Series 1987-A (Riverplace Proj.) (LOC Bk. of Tokyo), 7.10%, 1/1/20 | | | | 918,660 | |
| | 186,528 | | Minneapolis Residual Interest Mtg. Rev. Series 1995, 7.00%, 10/1/12 | | | | 186,869 | |
| | | | MN HFA Single Family Mtg. Rev.: | | | | | |
| | 200,000 | | Series 1994-E, 5.90%, 7/1/25 | | | | 203,142 | |
| | 125,000 | | Series 1996-D, 6.00%, 1/1/16 | | | | 127,959 | |
| | 90,000 | | Series 1997-A, 5.60%, 7/1/09 | | | | 92,976 | |
| | 315,000 | | Series 1997-I, 5.50%, 1/1/17 | | | | 325,571 | |
| | 195,000 | | Series 1996-H, 6.00%, 1/1/21 | | | | 199,549 | |
| | 680,000 | | Series 1997-D, 5.85%, 7/1/19 (4) | | | | 687,147 | |
| | 35,000 | | Series 1997-E, 5.90%, 7/1/29 (4) | | | | 35,377 | |
| | 15,000 | | Series 1997-G, 6.00%, 1/1/18 | | | | 15,389 | |
| | 965,000 | | Series 1998-C, 5.25%, 1/1/17 | | | | 973,511 | |
| | 80,000 | | Series 1998-F-1, 4.75%, 7/1/07 | | | | 80,054 | |
| | 60,000 | | Series 1998-F, 4.95%, 7/1/08 | | | | 60,856 | |
| | 300,000 | | Series 1998-F-1, 5.45%, 1/1/17 | | | | 306,825 | |
| | 90,000 | | Series 1998-F, 5.70%, 1/1/17 | | | | 92,109 | |
| | 430,000 | | Series 1999-B, 5.25%, 1/1/20 | | | | 437,108 | |
| | 120,000 | | Series 2000-A, 5.75%, 7/1/18 | | | | 122,718 | |
| | 145,000 | | Series 2000-C, 6.10%, 7/1/30 (4) | | | | 148,889 | |
| | 35,000 | | Series 2001-B, 4.55%, 7/1/07 (4) | | | | 35,249 | |
| | 380,000 | | Series 2003-I, 4.30%, 7/1/11 (4) | | | | 387,843 | |
| | 665,000 | | Series 2003-I, 5.10%, 7/1/20 (4) | | | | 684,531 | |
| | 2,000,000 | | Series 2003-L-2, 2.35%, 1/1/31 (4) | | | | 1,978,120 | |
| | 5,000,000 | | Series 2005-D, 2.90%, 5/18/06 | | | | 4,994,700 | |
| |
| |
| | 14,507,388 | |
| |
| |
54
|
| |
|
| Quantity ($) | | Name of Issuer | | Market Value ($)(1) |
|---|
|
| |
| Utility (1.6%) |
| | 610,000 | | Chaska Electric Rev. Series 2000A, 5.50%, 10/1/06 | | | | 624,103 | |
| | 255,000 | | Glencoe Light & Power Commission Elec. Rev. Series 2004, 2.00%, 12/1/05 | | | | 254,508 | |
| | 500,000 | | MN Muni Pwr. Agy. Elec. Rev. Series 2005, 5.00%, 10/1/30 | | | | 516,700 | |
| | 300,000 | | Princeton Public Utility Sys. Rev. Series 2004, 5.00%, 4/1/24 | | | | 304,152 | |
| | 2,300,000 | | Puerto Rico Aqueduct & Swr. Auth. Rev. Refunding Series 1995, 5.00%, 7/1/19 | | | | 2,361,157 | |
| |
| |
| | 4,060,620 | |
| |
| |
| |
| Transportation (0.1%) |
| | 260,000 | | Puerto Rico Hwy. & Transportation Auth. Rev. Series 1993-X, 5.00%, 7/1/22 | | | | 260,764 | |
| |
| |
| |
| Other Revenue Bonds (8.0%) |
| | | | Columbia Heights Commercial Dev. Refunding Rev. Series 1999 (Columbia Park Properties - Medical Clinic Proj.): | | | | | |
| | 250,000 | | 5.15%, 12/1/08 | | | | 253,473 | |
| | 1,750,000 | | 5.60%, 12/1/15 | | | | 1,764,123 | |
| | | | Commissioner of Iron Range Resources and Rehab. Gross Rev. (Giant's Ridge Rec. Area Proj.): | | | | | |
| | 200,000 | | Series 2000, 6.25%, 11/1/05 | | | | 200,314 | |
| | 900,000 | | Series 2000, 7.25%, 11/1/16 | | | | 953,460 | |
| | | | Minneapolis Cmty. Dev. Agy. Ltd. Tax Common Bond Fund: | | | | | |
| | 125,000 | | Series 1996-1 (LOC-U.S. Bank), 6.00%, 6/1/11 | | | | 126,780 | |
| | 170,000 | | Series 1997-1 (Halper Corrugated Box Mfg. Co.), 5.90%, 6/1/07 (4) | | | | 175,795 | |
| | 500,000 | | Series 1999-1A (Discount Steel), 5.25%, 6/1/19 (4) | | | | 512,350 | |
| | 160,000 | | Series 2000-G2 (LOC-U.S. Bank), 6.00%, 12/1/20 | | | | 172,554 | |
| | 1,000,000 | | Series 2001-G3 (LOC-U.S. Bank), 5.35%, 12/1/21 | | | | 1,053,870 | |
| | 175,000 | | Series 2001-G3 (LOC-U.S. Bank), 5.45%, 12/1/31 | | | | 184,051 | |
| | 765,000 | | Minneapolis Public Hsg. Auth. Series 1997 (General Credit Energy Savings Proj.), 6.00%, 7/1/08 | | | | 754,091 | |
| | 600,000 | | Minneapolis Tax Increment Rev. Refunding Series 2004 (St. Anthony Falls Proj.), 4.50%, 2/1/13 | | | | 600,336 | |
| | 1,000,000 | | MN Agr. & Econ. Dev. Board Rev. Series 2000-B (Small Business Dev. Proj.), 7.25%, 8/1/20 | | | | 1,067,870 | |
| | 200,000 | | Renville Gross Rev. Golf Course Bond Series 1997, 6.50%, 2/1/19 | | | | 200,910 | |
| | | | St. Paul Hsg. & Redev. Auth. Tax Increment Rev.: | | | | | |
| | 100,000 | | Series 2001 (US Bank Operations Ctr. Proj.), 5.70%, 8/1/12 | | | | 103,993 | |
| | 800,000 | | Series 2001 (US Bank Operations Ctr. Proj.), 6.125%, 8/1/19 | | | | 826,560 | |
| | 1,140,000 | | Series 2002 (North Quadrant Owner Occupied Proj. Phase 2), 7.00%, 2/15/28 | | | | 1,181,291 | |
| | 1,059,000 | | Series 2002 (North Quadrant Owner Occupied Proj. Phase 1), 7.50%, 2/15/28 | | | | 1,130,885 | |
| | 3,000,000 | | Series 2002-A (Upper Landing Proj.), 6.80%, 3/1/29 | | | | 3,024,420 | |
| | 2,000,000 | | Series 2002-B-2 (Upper Landing Proj.), 6.90%, 3/1/29 | | | | 1,999,840 | |
| | 1,263,000 | | Series 2002 (Drake Marble Proj.), 6.75%, 3/1/28 | | | | 1,269,820 | |
| | 1,335,000 | | Series 2004 (9th St. Lofts Proj.), 6.375%, 2/15/28 | | | | 1,353,009 | |
| | 475,000 | | Steele Co. Hlth. Care Fac. Gross Rev. Refunding Crossover Series 2005-B, 4.65%, 6/1/20 | | | | 472,573 | |
| | | | Victoria Recreational Facility Gross Rev. Series 2002: | | | | | |
| | 70,000 | | 4.75%, 2/1/12 | | | | 71,717 | |
| | 75,000 | | 4.75%, 8/1/12 | | | | 76,840 | |
| | 85,000 | | 5.10%, 8/1/15 | | | | 87,591 | |
| | 445,000 | | Virgin Islands Public Fin. Auth. Rev. Gross Receipts Taxes Loan Note Series 1999-A, 5.625%, 10/1/10 | | | | 465,884 | |
| |
| |
| | 20,084,400 | |
| |
| |
| |
| Total municipal bonds (cost: $231,380,794) | | 233,589,773 | |
| |
| |
See accompanying notes to portfolios of investments on page 62.
55
| Sit Minnesota Tax-Free Income Fund
September 30, 2005
Portfolio of Investments (Unaudited)
|
|
| Quantity ($) | | Name of Issuer | | Market Value ($)(1) |
|---|
|
| |
| Short-term Securities (6.1%) (2) |
| | 920,000 | | Hennepin Co. G.O. Series 2005-A, variable rate, 12/1/25 | | | | 920,000 | |
| | 800,000 | | Minneapolis Convention Ctr. G.O. Series 1999, variable rate, 12/1/18 | | | | 800,000 | |
| | 3,200,000 | | Minneapolis Multifamily Rev. Series 2002 (St. Hedwigs Assisted Proj.), variable rate, 12/1/27 | | | | 3,200,000 | |
| | | | Minneapolis & St. Paul Hsg. & Redev. Auth. Hlth. Care Sys. ARS Children's Hlth. Care Fac. (FSA insured): | | | | | |
| | 950,000 | | Series 2004-A, variable rate, 8/15/34 | | | | 950,000 | |
| | 2,450,000 | | Series 2004-B, variable rate, 8/15/25 | | | | 2,450,000 | |
| | 1,900,000 | | MN Higher Educ. Fac. Auth. Rev. Series 2002-N2 (St. Catherine Proj.), variable rate, 10/1/32 | | | | 1,900,000 | |
| | 800,000 | | MN Higher Educ. Facs. Rev. Series 2003 , variable rate, 10/1/33 | | | | 800,000 | |
| | | | Robbinsdale Hlth. Care Facs. Rev. Series 2003 (North Memorial Health Proj.) (Ambac insured): | | | | | |
| | 800,000 | | Tranche I, variable rate, 5/15/33 | | | | 800,000 | |
| | 1,000,000 | | Tranche II, variable rate, 5/15/33 | | | | 1,000,000 | |
| | 1,250,000 | | St. Paul Hsg. & Redev. Auth. Rev. Series 2001 (Cretin -Derham Hall Proj.), variable rate, 2/1/26 | | | | 1,250,000 | |
| | 1,242,450 | | Wells Fargo Minnesota Municipal Cash Fund, 1.80% | | | | 1,242,450 | |
| |
| |
| |
| Total Short-Term Securities (cost: $15,312,450) | | 15,312,450 | |
| |
| |
| |
| Total investments in securities (cost: $246,693,244) (7) | | $248,902,223 | |
| |
| |
See accompanying notes to portfolios of investments on page 62.
56
This page has been left blank intentionally.
57
| Sit Florida Tax-Free Income Fund
Six Months Ended September 30, 2005
Senior Portfolio Managers
Michael C. Brilley w Debra A. Sit, CFA w Paul J. Jungquist, CFA |
The Sit Florida Tax-Free Income Fund provided a +2.00% return for the six months ended September 30, 2005, compared with a return of +1.81% for the Lehman 5-Year Municipal Bond Index. The Fund’s 30-day SEC yield was 4.18% and its 12-month distribution rate was 3.06%, compared with 4.23% and 2.93%, respectively, six months ago.
Despite four federal funds rate increases totaling 100 basis points, municipal yields were fairly stable during the period. Short term tax-exempt yields rose approximately 0.30%, longer term yields fell approximately 0.20% and intermediate yields were little changed. The Fund benefited from its investments in callable, high coupon securities that provided above average income. The Fund also benefited from its holdings in several distinct sectors, including the hospital, multifamily, and other revenue sectors, which includes tax increment bonds. These sectors saw price stability or gains as investors continued to seek yield. Sectors which underperformed included prerefunded bonds and utility bonds, as shorter duration holdings were negatively impacted by the rise in yields.
The Fund’s structure shifted as assets grew by 30% over the period. Purchases were made primarily in multifamily bonds which increased 5.2% to 18.0%, and in other revenue bonds which increased 4.1% to 13.1%. Utility holdings also increased from 2.6% to 4.3%. The Fund’s hospital sector weighting was unchanged while insured bonds were decreased from 56.7% to 48.4%. Finally, escrowed to maturity and prerefunded bonds increased from 2.4% to 7.1% as several issues were advance refunded during the period. Securities rated less than A increased from 19.2% to 28.8%, reflecting the purchase of shorter duration BBB rated securities at attractive yields. The average credit quality of the Fund, however, remains AA-.
We expect interest rates to move higher in 2006 as economic growth remains solid with rebuilding from Hurricane Katrina and inflation concerns increase as higher energy prices work their way into the system. The Fund’s implied duration increased to 3.2 years, compared to 2.6 years six months ago, as the rise in shorter term yields made it more attractive to lengthen slightly. The Fund remains defensively positioned relative to its benchmark to reduce the risk of price depreciation as interest rates rise. In addition, this short duration will allow the Fund to take advantage of attractive reinvestment opportunities at higher yield levels in the coming year.
| INVESTMENT OBJECTIVE AND STRATEGY |
|---|
The objective of the Florida Tax-Free Income Fund is to provide a high level of current income that is exempt from federal regular income tax by investing in securities that are exempt from the Florida intangibles tax.
The Fund seeks to achieve its objective by investing primarily in municipal securities that generate interest income that is exempt from regular federal income tax and that are exempt from the Florida intangible personal property tax. During normal market conditions, the Fund invests 100% (and, as a fundamental policy, no less than 80%) of its net assets in such tax-exempt municipal securities. The Fund may invest up to 10% of its assets in securities that generate interest income subject to federal alternative minimum tax.
| |
|---|
| | Net Asset Value 9/30/05: | | $9.98 Per Share | | |
| | 3/31/05: | | $9.94 Per Share | | |
| | Total Net Assets: | | $4.2 Million | | |
| | 30-day SEC Yield: | | 4.18 | | |
| | Tax Equivalent Yield: | | 6.43(1) | | |
| | 12-Month Distribution Rate: | | 3.06 | | |
| | Average Maturity: | | 13.5 Years | | |
| | Duration to Estimated Avg. Life: | | 2.3 Years(2) | | |
| | Implied Duration: | | 3.2 Years(2) | | |
| |
| | (1) For individuals in the 35.0% federal tax bracket. |
| | (2) See next page. |
PORTFOLIO STRUCTURE
(% OF TOTAL NET ASSETS) |
|---|
58
| AVERAGE ANNUAL TOTAL RETURNS* |
|---|
| Sit
FL Tax-Free
Income Fund | | Lehman
5-Year Muni.
Bond Index | | Lipper FL
Muni-Bond
Fund Index |
|---|
|
| |
| |
| |
| 3 Month** | | | 0.53% | | | -0.10% | | | 0.02% | | |
| 6 Month** | | | 2.00 | | | 1.81 | | | n/a | | |
| 1 Year | | | 3.21 | | | 1.45 | | | 4.05 | | |
| 3 Years | | | n/a | | | n/a | | | n/a | | |
| 5 Years | | | n/a | | | n/a | | | n/a | | |
| Inception*** | | | 2.83 | | | 1.92 | | | 3.81 | | |
| (12/31/03) | | |
| CUMULATIVE TOTAL RETURNS* |
|---|
| Sit
FL Tax-Free
Income Fund | | Lehman
5-Year Muni.
Bond Index | | Lipper FL
Muni-Bond
Fund Index |
|---|
|
| |
| |
| |
| 1 Year | | | 3.21% | | | 1.45% | | | 4.05% | | |
| 3 Years | | | n/a | | | n/a | | | n/a | | |
| 5 Years | | | n/a | | | n/a | | | n/a | | |
| Inception | | | 5.00 | | | 3.38 | | | 6.76 | | |
| (12/31/03) | | |
| |
| *As of 9/30/05. | | | | | | | | | **Not annualized. | | |
|
| Performance figures are historical and do not guarantee future results. Investment returns and principal value will vary, and you may have a gain or loss when you sell shares. Average annual total returns include changes in share price as well as reinvestment of all dividends and capital gains. Management fees and administrative expenses are included in the Fund’s performance; however, fees and expenses are not incorporated in the Lehman 5-Year Municipal Bond Index. The Lipper returns are obtained from Lipper Analytical Services, Inc., a large independent evaluator of mutual funds. |
(2) Duration is a measure which reflects estimated price sensitivity to a given change in interest rates. For example, for an interest rate change of 1%, a portfolio with a duration of 5 years would be expected to experience a price change of 5%. Estimated average life duration is based on current interest rates and the Adviser’s assumptions regarding the expected average life of individual securities held in the portfolio. Implied duration is calculated based on historical price changes of securities held by the Fund. The Adviser believes that the portfolio’s implied duration is a more accurate estimate of price sensitivity provided interest rates remain within their historical range. If interest rates exceed the historical range, the estimated average life duration may be a more accurate estimate of price sensitivity.

The sum of $10,000 invested at inception (12/31/03) and held until 9/30/05 would have grown to $10,500 in the Fund or $10,338 in the Lehman 5-Year Municipal Bond Index assuming reinvestment of all dividends and capital gains.
QUALITY RATINGS
(% OF TOTAL NET ASSETS) |
|---|

59
| Sit Florida Tax-Free Income Fund
September 30, 2005
Portfolio of Investments (Unaudited)
|
|
| Quantity ($) | | Name of Issuer | | Market Value ($)(1) |
|---|
|
| |
| Municipal Bonds (100.9%) (2) | | |
| Escrowed to Maturity / Prerefunded (7.1%) | | |
| | 90,000 | | Brevard Co. School Board C.O.P. Series 1996-B (Ambac insured), 5.50%, 7/1/21 | | | | 93,514 | |
| | 25,000 | | Orange Co. School Board C.O.P. Series 1997-A, 5.375%, 8/1/22 | | | | 26,156 | |
| | 20,000 | | Tampa - Hillsborough Expressway Auth. Rev. Series 1997, 5.00%, 7/1/27 | | | | 20,863 | |
| | 75,000 | | Tampa Rev. Series 1993 (Allegany Hlth. Sys. - St. Joseph's Hosp. Proj.) (MBIA insured), 5.125%, 12/1/23 | | | | 75,377 | |
| | 30,000 | | Jacksonville Elec. Auth Rev. Water & Sewer Series 2000-A, 4.50%, 10/1/09 | | | | 30,001 | |
| | 50,000 | | Univ. of South FL Hsg. Fac. Rev. Series 1997-A (MBIA insured), 5.35%, 7/1/15 | | | | 51,407 | |
| |
| |
| | | | | | | | 297,318 | |
| |
| |
| Hospital/Health Care (10.0%) | | |
| | | | Escambia Co. Hlth. Facs. Auth. Rev. Series 1998 (Baptist Hosp. Proj.): | | | | | |
| | 50,000 | | 5.125%, 10/1/14 | | | | 51,583 | |
| | 65,000 | | 5.125%, 10/1/19 | | | | 66,509 | |
| | | | Highlands Co. Hlth. Facs. Auth. Rev. Series 2003-D (Adventist Hlth. Sys. Proj.): | | | | | |
| | 15,000 | | 6.00%, 11/15/25 | | | | 16,367 | |
| | 25,000 | | 5.875%, 11/15/29 | | | | 27,157 | |
| | 25,000 | | Hillsborough Co. Industrial Dev. Auth. Hosp. Rev. Refunding Series 2003-A (Tampa General Hosp. Proj.), 2.50%, 10/1/05 | | | | 24,999 | |
| | | | Marion Co. Hosp. Dist. Rev. Refunding Series 1999 (Munroe Reg. Proj.): | | | | | |
| | 25,000 | | 5.25%, 10/1/10 | | | | 26,703 | |
| | 50,000 | | 5.50%, 10/1/14 | | | | 52,956 | |
| | 50,000 | | Miami Hlth. Fac. Auth. Rev. Series 2003-B (Catholic Hlth. East Proj.), 2.50%, 11/15/05 | | | | 49,966 | |
| | 100,000 | | South Lake Co. Hosp. Dist. Rev. Series 2003 (South Lake Hosp., Inc. Proj.), 5.50%, 10/1/13 | | | | 105,886 | |
| |
| |
| | | | | | | | 422,126 | |
| |
| |
| Insured (48.4%) | | |
| | 70,000 | | Clearwater Hsg. Auth. Rev. Refunding Series 1997 (Hamptons at Clearwater Proj.) (ACA insured), 5.40%, 5/1/13 | | | | 72,489 | |
| | 210,000 | | Dade Co. Hlth. Fac. Auth. Hosp. Rev. Refunding Series 1993-A (Baptist Hosp. Miami Proj.) (MBIA insured), 5.25%, 5/15/21 | | | | 210,298 | |
| | 135,000 | | Dade Co. Public Fac. Rev. Series 1993 (Jackson Mem. Hosp. Proj.)(MBIA insured), 5.25%, 6/1/23 | | | | 135,255 | |
| | 100,000 | | Dade Co. Seaport Rev. Refunding Series 1995 (MBIA insured), 5.75%, 10/1/15 | | | | 102,216 | |
| | 150,000 | | Dade Co. Special Oblig. Rev. Refunding Series 1996-B (Ambac insured), 5.00%, 10/1/35 | | | | 153,297 | |
| | 20,000 | | Dade Co. Water & Sewer System Rev. Series 1995 (FGIC insured), 5.50%, 10/1/18 | | | | 20,444 | |
| | 45,000 | | FL Correctional Privatization C.O.P. Series 1995-B (Ambac insured), 5.00%, 8/1/17 | | | | 45,960 | |
| | 50,000 | | FL HFC Hsg. Rev. Series 2000-D-1 (Augustine Club Apts. Proj.)(Ambac insured), 5.75%, 10/1/30 | | | | 52,524 | |
| | 75,000 | | FL Dept. Gen. Svcs. Div. Facs. Mgmt. Rev. Refunding Series 1995-B (Ambac insured), 5.70%, 9/1/20 | | | | 75,810 | |
| | 75,000 | | Fort Myers Impt. Rev. Series 1992-C (Ambac insured), 5.70%, 12/1/05 | | | | 75,179 | |
| | 100,000 | | Halifax Hosp. Med. Ctr. Health Care Fac. Rev. Series 1998-A (Halifax Mgmt. Sys. Proj.) (ACA insured), 5.00%, 4/1/12 | | | | 102,761 | |
| | 95,000 | | Hillsborough Co. Educ. Fac. Auth. Rev. Refunding Series 1998 (Univ. of Tampa Proj.) (Radian insured), 5.75%, 4/1/18 | | | | 103,267 | |
| | | | Lakeland Hosp. Sys. Rev. Refunding (Lakeland Regl. Med. Ctr. Proj.) (MBIA insured): | | | | | |
| | 55,000 | | Series 1996, 5.25%, 11/15/25 | | | | 57,075 | |
| | 50,000 | | Series 1997, 5.00%, 11/15/22 | | | | 51,117 | |
| | | | Miami - Dade Co. Special Oblig. Rev. Series 1997-B (MBIA insured): | | | | | |
| | 265,000 | | 5.44% effective yield, 10/1/33 | | | | 58,682 | |
| | 100,000 | | 4.79% effective yield, 10/1/35 | | | | 86,088 | |
| | 55,000 | | Naples Hosp. Rev. Refunding Series 1993 (Cmnty. Hosp. Inc. Proj)(MBIA insured), 5.25%, 10/1/14 | | | | 55,098 | |
| | 120,000 | | Orange Co. Hlth. Facs. Auth. Rev. Series 1995 (Adventist Hlth. Sys.)(Ambac insured), 5.25%, 11/15/20 | | | | 122,926 | |
60
|
| |
|
| Quantity ($) | | Name of Issuer | | Market Value ($)(1) |
|---|
|
| |
| | 90,000 | | Palm Beach Co. Hlth. Facs. Auth. Rev. Series 1993 (Jupiter Med. Ctr. Proj.)(FSA insured), 5.25%, 8/1/18 | | | | 90,140 | |
| | | | Port Everglades Auth. Rev. Refunding & Impt. Series 1989-A: | | | | | |
| | 45,000 | | (FSA insured), 5.00%, 9/1/16 | | | | 45,199 | |
| | 150,000 | | (MBIA-IBC insured), 5.00%, 9/1/16 | | | | 150,665 | |
| | 25,000 | | Venice Hlth. Care Rev. Series 1996 (Bon Secours Hlth. Sys. Proj.)(MBIA insured), 5.625%, 8/15/26 | | | | 25,942 | |
| | 140,000 | | Village Ctr. Cmnty. Dev. Dist. Recreational Rev. Series 1998-A (MBIA insured), 5.00%, 11/1/21 | | | | 146,677 | |
| |
| |
| | | | | | | | 2,039,109 | |
| |
| |
| Multifamily Mortgage (18.0%) | | |
| | 100,000 | | Broward Co. Hsg. Fin. Auth. Multifamily Rev. Refunding Series 1996 (Tamarac Pointe Apts. Proj.)(GNMA collateralized), 6.15%, 7/1/16 | | | | 103,053 | |
| | 45,000 | | Capital Trust Agy. Multifamily Rev. Sr. Series 2003-A (Golf Villas, Rivermill, and Village Square Apts. Proj.), 4.75%, 6/1/13 | | | | 43,854 | |
| | 45,000 | | Collier Co. HFA Multifamily Hsg. Rev. Series 2002C (Goodlette Arms Proj.), 5.25%, 8/15/15 | | | | 46,835 | |
| | 20,000 | | Dade Co. Hsg. Fin. Auth. Multifamily Rev. Refunding Series 1996-A (New Horizons Proj.) (FHA insured), 5.88%, 7/15/24 | | | | 20,846 | |
| | 35,000 | | Miami-Dade Co. Special Hsg. Rev. Refunding Series 1998 (Section 8), 5.30%, 10/1/05 | | | | 34,999 | |
| | 20,000 | | Ocala Cap. Impts. Rev. Series 1995 (Ambac insured), 5.375%, 10/1/22 | | | | 20,432 | |
| | 120,000 | | Orange Co. Hlth. Facs. Auth. Rev. Refunding Series 2005 (Orlando Lutheran Proj.), 4.625%, 7/1/09 | | | | 119,522 | |
| | 55,000 | | Palm Beach Co. Hsg. Fin. Auth. Rev. Refunding Series 1997-A (GNMA Mallard’s Cove Apts. Proj.), 5.95%, 10/20/31 | | | | 55,575 | |
| | 120,000 | | Palm Beach Co. Hlth. Fac. Auth. Rev. Series 1996 (ACTS Retirement Cmnty. Proj.), 5.625%, 11/15/20 | | | | 123,808 | |
| | 135,000 | | Plantation Hlth. Facs. Auth. Rev. Refunding Series 1998 (Covenant Village Proj.), 5.125%, 12/1/22 | | | | 135,972 | |
| | 50,000 | | Polk Co. Hsg. Fin. Auth. Mtg. Rev. Series 1994-A (Lake Wales Gardens Proj.), 5.625%, 5/20/14 | | | | 53,286 | |
| |
| |
| | | | | | | | 758,182 | |
| |
| |
| Utility (4.3%) | | |
| | | | Gainesville Utils. Sys. Rev. Series 1996-A: | | | | | |
| | 100,000 | | 5.00%, 10/1/15 | | | | 103,669 | |
| | 25,000 | | 5.20%, 10/1/26 | | | | 25,706 | |
| | 50,000 | | Jacksonville Elec. Auth. Rev. Refundng Series 1997 Issue 2-14 (St. John’s River Proj.), 4.90%, 10/1/08 | | | | 50,898 | |
| |
| |
| | | | | | | | 180,273 | |
| |
| |
| Other Revenue Bonds (13.1%) | | |
| | 15,000 | | Capital Region Cmnty. Dev. Dist. Rev. Series 2001-B, 5.95%, 5/1/06 | | | | 15,116 | |
| | 30,000 | | Double Branch Cmnty. Dev. Dist. Rev. Series 2003-C, 5.125%, 5/1/08 | | | | 30,188 | |
| | 100,000 | | Fiddlers Creek Cmnty. Dev. Dist. No. 2 Rev. Series 2003-B, 5.75%, 5/1/13 | | | | 104,042 | |
| | 100,000 | | Forest Creek Cmnty. Dev. Dist. Impt. Rev. Series 2005-B, 4.85%, 5/1/11 | | | | 99,899 | |
| | 30,000 | | Mediterra North Cmnty. Dev. Dist. Impt. Rev. Series 2001-B, 6.00%, 5/1/08 | | | | 30,284 | |
| | 100,000 | | Panther Trace II Cmnty. Dev. Rev. Series 2005-B, 5.00%, 11/1/10 | | | | 100,495 | |
| | 20,000 | | Parklands Lee Cmnty. Dev. Dist. Rev. Series 2004-B, 5.125%, 5/1/11 | | | | 20,110 | |
| | 15,000 | | Parklands West Cmnty. Dev. Dist. Rev. Series 2001-B, 6.00%, 5/1/06 | | | | 15,114 | |
| | 35,000 | | Reunion East Cmnty. Dev. Dist. Series 2002-B, 5.90%, 11/1/07 | | | | 35,319 | |
| | 100,000 | | Thousand Oaks Cmnty. Dev. Rev. Series 2005-A-1, 5.35%, 5/1/35 | | | | 100,336 | |
| |
| |
| | | | | | | | 550,903 | |
| |
| |
| |
| Total municipal bonds (cost: $4,239,508) | | | | | 4,247,911 |
| |
|
| |
| Total investments in securities (cost: $4,239,508) (7) | | | | $ | 4,247,911 |
| |
|
See accompanying notes to portfolios of investments on page 62.
61
| Sit Mutual Funds
September 30, 2005
Notes to Portfolios of Investments
|
| (1) | | Securities are valued by procedures described in note 1 to the financial statements. |
| (2) | | Percentage figures indicate percentage of total net assets. |
| (3) | | At September 30, 2005, 3.5% of net assets in the U.S. Government Securities Fund were invested in GNMA mobile home pass-through securities. |
| (4) | | Securities the income from which is treated as a tax preference that is included in alternative minimum taxable income for purposes of computing federal alternative minimum tax (AMT). At September 30, 2005, 9.3% of net assets in the Minnesota Tax-Free Income Fund was invested in such securities. |
| (5) | | Rule 144A Securities, Section 4(2) Commercial Paper, and Municipal Lease Securities (“Restricted Securities”) held by the Funds which have been determined to be liquid by the Adviser in accordance to guidelines established by the Board of Directors. |
| (6) | | This security represents an investment in an affiliated party. See notes to the accompanying financial statements. |
| (7) | | At September 30, 2005 the cost of securities for federal income tax purposes and the aggregate gross unrealized appreciation and depreciation based on that cost were as follows: |
| | | Money
Market
Fund | | U.S.
Government
Securities
Fund | | Tax-Free
Income
Fund |
|---|
| |
| |
| |
| |
| Cost for federal income tax purposes | | | $ | 58,784,510 | | $ | 265,682,814 | | $ | 361,368,782 | |
| |
| |
| |
| |
| Unrealized appreciation (depreciation) on investments: | | |
| Gross unrealized appreciation | | | | — | | $ | 1,922,727 | | $ | 4,979,939 | |
| Gross unrealized depreciation | | | | — | | | (3,337,534 | ) | | (10,383,599 | ) |
| |
| |
| |
| |
| Net unrealized appreciation (depreciation) | | | | — | | | ($ 1,414,806 | ) | | ($ 5,403,659 | ) |
| |
| |
| |
| |
| |
| | | Minnesota
Tax-Free
Income
Fund | | Florida
Tax-Free
Income
Fund | | |
|---|
| |
| |
| | | |
| Cost for federal income tax purposes | | | $ | 246,693,244 | | $ | 4,239,508 | | | | |
| |
| |
| | | |
| Unrealized appreciation (depreciation) on investments: | | |
| Gross unrealized appreciation | | | $ | 4,086,934 | | $ | 20,430 | | | | |
| Gross unrealized depreciation | | | | (1,877,955 | ) | | (12,027 | ) | | | |
| |
| |
| | | |
| Net unrealized appreciation (depreciation) | | | $ | 2,208,979 | | $ | 8,403 | | | | |
| |
| |
| | | |
| (8) | | These securities have been identified by the investment adviser as illiquid securities. The aggregate value of these securities at Septeber 30, 2005, is $8,479,083 and $407,593 in the Tax-Free Income and Minnesota Tax-Free Income Funds respectively, which represents 2.4% and 0.2% of the Fund’s net assets, respectively. |
| (9) | | Presently non-income producing securities. Items identified are in default as to payment of interest. |
62
This page has been left blank intentionally.
63
| Sit Mutual Funds
September 30, 2005
Statements of Assets and Liabilities (Unaudited)
|
| ASSETS | | Money
Market
Fund | | U.S.
Government
Securities
Fund | | Tax-Free
Income
Fund |
|---|
|
| |
| |
| |
| Investments in securities, at identified cost | | | $ | 58,784,510 | | $ | 265,682,814 | | $ | 361,368,782 | |
|
| |
| |
| |
| Investments in securities, at market value - see accompanying schedules for detail | | | $ | 58,784,510 | | $ | 264,268,008 | | $ | 355,965,122 | |
| Investments in affiliated mutual funds | | | | — | | | — | | | — | |
| Cash in bank on demand deposit | | | | 860 | | | — | | | — | |
| Accrued interest and dividends receivable | | | | — | | | 1,459,735 | | | 4,899,788 | |
| Receivable for investment securities sold | | | | — | | | — | | | — | |
| Receivable for principal paydowns | | | | — | | | 236,544 | | | — | |
| Other receivables | | | | — | | | — | | | 15,000 | |
| Receivable for Fund shares sold | | | | — | | | 43,119 | | | 60,242 | |
|
| |
| |
| |
| |
| Total assets | | | | 58,785,370 | | | 266,007,406 | | | 360,940,152 | |
|
| |
| |
| |
| |
| LIABILITIES | | |
| Disbursements in excess of cash balances | | | | — | | | 334 | | | 13,251 | |
| Payable for investment securities purchased | | | | — | | | 2,036,292 | | | 5,120,019 | |
| Payable for Fund shares redeemed | | | | — | | | 75,107 | | | 3,874,946 | |
| Cash portion of dividends payable to shareholders | | | | 144,122 | | | 814,056 | | | 1,094,531 | |
| Other payables | | | | — | | | 2,056 | | | 12,737 | |
| Accrued investment management and advisory services fee | | | | 22,693 | | | 173,138 | | | 224,454 | |
|
| |
| |
| |
| Total liabilities | | | | 166,815 | | | 3,100,983 | | | 10,339,938 | |
|
| |
| |
| |
| |
| Net assets applicable to outstanding capital stock | | | $ | 58,618,555 | | $ | 262,906,423 | | $ | 350,600,214 | |
|
| |
| |
| |
| |
| Net assets consist of: | | |
| Capital (par value and paid-in surplus) | | | $ | 58,618,555 | | $ | 266,639,496 | | $ | 385,689,569 | |
| Undistributed (distributions in excess of) net investment income | | | | — | | | — | | | — | |
| Accumulated net realized gain (loss) from security transactions | | | | — | | | (2,318,267 | ) | | (29,685,695 | ) |
| Unrealized appreciation (depreciation) on investments | | | | — | | | (1,414,806 | ) | | (5,403,660 | ) |
|
| |
| |
| |
| | | | $ | 58,618,555 | | $ | 262,906,423 | | $ | 350,600,214 | |
|
| |
| |
| |
| Outstanding shares | | | | 58,622,026 | | | 24,778,966 | | | 35,810,518 | |
|
| |
| |
| |
| Net asset value per share of outstanding capital stock | | | $ | 1.00 | | $ | 10.61 | | $ | 9.79 | |
|
| |
| |
| |
64
|
| |
| ASSETS | | Minnesota
Tax-Free
Income
Fund | | Florida
Tax-Free
Income
Fund | |
|---|
|
| |
| |
| Investments in securities, at identified cost | | | $ | 246,693,244 | | $ | 4,239,508 | |
|
| |
| |
| Investments in securities, at market value - see accompanying schedules for detail | | | $ | 248,902,223 | | $ | 4,247,911 | |
| Investments in affiliated mutual funds | | | | — | | | — | |
| Cash in bank on demand deposit | | | | 1,543 | | | 169 | |
| Accrued interest and dividends receivable | | | | 3,549,905 | | | 75,854 | |
| Receivable for investment securities sold | | | | — | | | — | |
| Receivable for principal paydowns | | | | — | | | — | |
| Other receivables | | | | 1,437 | | | — | |
| Receivable for Fund shares sold | | | | 10,000 | | | — | |
|
| |
| |
| |
| Total assets | | | | 252,465,108 | | | 4,323,934 | |
|
| |
| |
| |
| LIABILITIES | | |
| Disbursements in excess of cash balances | | | | — | | | — | |
| Payable for investment securities purchased | | | | 576,711 | | | 99,942 | |
| Payable for Fund shares redeemed | | | | — | | | — | |
| Cash portion of dividends payable to shareholders | | | | 766,363 | | | 11,703 | |
| Other payables | | | | — | | | — | |
| Accrued investment management and advisory services fee | | | | 163,802 | | | 2,778 | |
|
| |
| |
| Total liabilities | | | | 1,506,876 | | | 114,423 | |
|
| |
| |
| |
| Net assets applicable to outstanding capital stock | | | $ | 250,958,232 | | $ | 4,209,511 | |
|
| |
| |
| |
| Net assets consist of: | | |
| Capital (par value and paid-in surplus) | | | $ | 257,655,756 | | $ | 4,218,234 | |
| Undistributed (distributions in excess of) net investment income | | | | — | | | — | |
| Accumulated net realized gain (loss) from security transactions | | | | (8,906,504 | ) | | (17,126 | ) |
| Unrealized appreciation (depreciation) on investments | | | | 2,208,980 | | | 8,403 | |
|
| |
| |
| | | | $ | 250,958,232 | | $ | 4,209,511 | |
|
| |
| |
| Outstanding shares | | | | 24,690,147 | | | 421,757 | |
|
| |
| |
| Net asset value per share of outstanding capital stock | | | $ | 10.16 | | $ | 9.98 | |
|
| |
| |
See accompanying notes to financial statements on pages 70 - 73.
65
| Sit Mutual Funds
Six Months Ended September 30, 2005
Statements of Operations (Unaudited)
|
| | Money
Market
Fund | | U.S.
Government
Securities
Fund | | Tax-Free
Income
Fund | | Minnesota
Tax-Free
Income
Fund | | Florida
Tax-Free
Income
Fund |
|---|
|
| |
| |
| |
| |
| |
| Investment income: | | | | | | | | | | | | | | | | | |
| Income: | | |
| Interest | | | $ | 826,603 | | $ | 6,010,032 | | $ | 8,045,541 | | $ | 5,892,704 | | $ | 78,085 | |
|
| |
| |
| |
| |
| |
| Total income | | | | 826,603 | | | 6,010,032 | | | 8,045,541 | | | 5,892,704 | | | 78,085 | |
|
| |
| |
| |
| |
| |
| |
| Expenses (note 3): | | |
| Investment management and | | |
| advisory services fee | | | | 201,309 | | | 1,105,606 | | | 1,413,884 | | | 960,321 | | | 15,720 | |
| Less fees and expenses absorbed | | |
| by investment adviser | | | | (74,215 | ) | | (50,137 | ) | | (51,393 | ) | | — | | | — | |
|
| |
| |
| |
| |
| |
| Total net expenses | | | | 127,094 | | | 1,055,469 | | | 1,362,491 | | | 960,321 | | | 15,720 | |
|
| |
| |
| |
| |
| |
| Net investment income | | | | 699,509 | | | 4,954,563 | | | 6,683,050 | | | 4,932,383 | | | 62,365 | |
|
| |
| |
| |
| |
| |
| |
| Realized and unrealized gain (loss) on | | |
| investments: | | |
| Net realized gain (loss) | | | | — | | | 1,676,393 | | | (27,606 | ) | | (911,376 | ) | | (468 | ) |
| |
| Net change in unrealized appreciation | | |
| (or depreciation) on investments | | | | — | | | (1,832,120 | ) | | 786,632 | | | 2,529,927 | | | 12,454 | |
|
| |
| |
| |
| |
| |
| Net gain (loss) on investments | | | | — | | | (155,727 | ) | | 759,026 | | | 1,618,551 | | | 11,986 | |
|
| |
| |
| |
| |
| |
| |
| Net increase (decrease) in net assets resulting | | |
| from operations | | | $ | 699,509 | | $ | 4,798,836 | | $ | 7,442,076 | | $ | 6,550,934 | | $ | 74,351 | |
|
| |
| |
| |
| |
| |
See accompanying notes to financial statements on pages 70 - 73.
66
This page has been left blank intentionally.
67
| Sit Mutual Funds
Statements of Changes in Net Assets
|
| | Money Market
Fund | | U.S. Government
Securities Fund |
|---|
| |
| |
|
|---|
| | Six months
ended
September 30,
2005
(Unaudited) | | Year ended
March 31,
2005 | | Six months
ended
September 30,
2005
(Unaudited) | | Year ended
March 31,
2005 |
|---|
|
| |
| |
| |
| |
| Operations: | | | | | | | | | | | | | | |
| Net investment income | | | $ | 699,509 | | $ | 539,566 | | $ | 4,954,563 | | $ | 9,338,209 | |
| Net realized gain (loss) on investments | | | | — | | | — | | | 1,676,393 | | | 445,411 | |
| Net change in unrealized appreciation | | |
| (depreciation) of investments | | | | — | | | — | | | (1,832,120 | ) | | (5,039,411 | ) |
|
| |
| |
| |
| |
| |
| Net increase (decrease) in net assets resulting | | |
| from operations | | | | 699,509 | | | 539,566 | | | 4,798,836 | | | 4,744,209 | |
|
| |
| |
| |
| |
| Distributions to shareholders from: | | |
| Net investment income | | | | (699,509 | ) | | (539,566 | ) | | (4,954,563 | ) | | (9,338,209 | ) |
| Net realized gains on investments | | | | — | | | — | | | — | | | — | |
|
| |
| |
| |
| |
| |
| Total distributions | | | | (699,509 | ) | | (539,566 | ) | | (4,954,563 | ) | | (9,338,209 | ) |
|
| |
| |
| |
| |
| Capital share transactions: | | |
| Proceeds from shares sold | | | | 143,642,503 | | | 200,038,917 | | | 33,781,188 | | | 79,941,811 | |
| Reinvested distributions | | | | 401,739 | | | 370,743 | | | 4,733,412 | | | 8,604,289 | |
| Payments for shares redeemed | | | | (123,566,341 | ) | | (206,878,981 | ) | | (33,862,124 | ) | | (112,984,057 | ) |
|
| |
| |
| |
| |
| |
| Increase (decrease) in net assets from | | |
| capital share transactions | | | | 20,477,901 | | | (6,469,321 | ) | | 4,652,476 | | | (24,437,957 | ) |
|
| |
| |
| |
| |
| |
| Total increase (decrease) in net assets | | | | 20,477,901 | | | (6,469,321 | ) | | 4,496,749 | | | (29,031,957 | ) |
| Net assets | | |
| Beginning of period | | | | 38,140,654 | | | 44,609,975 | | | 258,409,674 | | | 287,441,631 | |
|
| |
| |
| |
| |
| End of period | | | $ | 58,618,555 | | $ | 38,140,654 | | $ | 262,906,423 | | $ | 258,409,674 | |
|
| |
| |
| |
| |
| |
| Capital transactions in shares: | | |
| Sold | | | | 143,642,889 | | | 200,038,917 | | | 3,164,520 | | | 7,477,550 | |
| Reinvested distributions | | | | 401,739 | | | 370,743 | | | 442,993 | | | 803,437 | |
| Redeemed | | | | (123,566,341 | ) | | (206,878,981 | ) | | (3,171,685 | ) | | (10,566,532 | ) |
|
| |
| |
| |
| |
| |
| Net increase (decrease) | | | | 20,478,287 | | | (6,469,321 | ) | | 435,828 | | | (2,285,545 | ) |
|
| |
| |
| |
| |
68
|
| |
| | Tax-Free
Income Fund | | Minnesota Tax-Free
Income Fund | | Florida Tax-Free
Income Fund |
|---|
| |
| |
| |
|
|---|
| | Six months
ended
September 30,
2005
(Unaudited) | | Year ended
March 31,
2005 | | Six months
ended
September 30,
2005
(Unaudited) | | Year ended
March 31,
2005 | | Six months
ended
September 30,
2005
(Unaudited) | | Year ended
March 31,
2005 |
|---|
|
| |
| |
| |
| |
| |
| |
| Operations: | | | | | | | | | | | | | | | | | | | | |
| Net investment income | | | $ | 6,683,050 | | $ | 13,084,617 | | $ | 4,932,383 | | $ | 9,583,129 | | $ | 62,365 | | | 86,155 | |
| Net realized gain (loss) on investments | | | | (27,606 | ) | | 167,720 | | | (911,376 | ) | | (866,459 | ) | | (468 | ) | | (16,907 | ) |
| Net change in unrealized appreciation | | |
| (depreciation) of investments | | | | 786,632 | | | (4,863,575 | ) | | 2,529,927 | | | (2,863,486 | ) | | 12,454 | | | (12,025 | ) |
|
| |
| |
| |
| |
| |
| |
| |
| Net increase (decrease) in net assets resulting | | |
| from operations | | | | 7,442,076 | | | 8,388,762 | | | 6,550,934 | | | 5,853,184 | | | 74,351 | | | 57,223 | |
|
| |
| |
| |
| |
| |
| |
| Distributions to shareholders from: | | |
| Net investment income | | | | (6,683,050 | ) | | (13,084,617 | ) | | (4,932,383 | ) | | (9,583,129 | ) | | (62,365 | ) | | (86,155 | ) |
| Net realized gains on investments | | | | — | | | — | | | — | | | — | | | — | | | — | |
|
| |
| |
| |
| |
| |
| |
| |
| Total distributions | | | | (6,683,050 | ) | | (13,084,617 | ) | | (4,932,383 | ) | | (9,583,129 | ) | | (62,365 | ) | | (86,155 | ) |
|
| |
| |
| |
| |
| |
| |
| Capital share transactions: | | |
| Proceeds from shares sold | | | | 42,103,129 | | | 87,033,580 | | | 40,975,885 | | | 76,385,175 | | | 984,718 | | | 908,356 | |
| Reinvested distributions | | | | 5,845,168 | | | 11,151,316 | | | 4,229,862 | | | 7,518,703 | | | 58,078 | | | 83,963 | |
| Payments for shares redeemed | | | | (51,974,999 | ) | | (91,902,209 | ) | | (28,900,466 | ) | | (64,912,684 | ) | | (18,029 | ) | | (438,402 | ) |
|
| |
| |
| |
| |
| |
| |
| |
| Increase (decrease) in net assets from | | |
| capital share transactions | | | | (4,026,702 | ) | | 6,282,687 | | | 16,305,281 | | | 18,991,194 | | | 1,024,767 | | | 553,917 | |
|
| |
| |
| |
| |
| |
| |
| |
| Total increase (decrease) in net assets | | | | (3,267,676 | ) | | 1,586,832 | | | 17,923,832 | | | 15,261,249 | | | 1,036,753 | | | 524,985 | |
| Net assets | | |
| Beginning of period | | | | 353,867,890 | | | 352,281,058 | | | 233,034,400 | | | 217,773,151 | | | 3,172,758 | | | 2,647,773 | |
|
| |
| |
| |
| |
| |
| |
| End of period | | | $ | 350,600,214 | | $ | 353,867,890 | | $ | 250,958,232 | | $ | 233,034,400 | | $ | 4,209,511 | | $ | 3,172,758 | |
|
| |
| |
| |
| |
| |
| |
| |
| Capital transactions in shares: | | |
| Sold | | | | 4,295,216 | | | 8,870,281 | | | 4,028,932 | | | 7,547,028 | | | 98,517 | | | 91,158 | |
| Reinvested distributions | | | | 596,028 | | | 1,136,292 | | | 415,985 | | | 743,012 | | | 5,815 | | | 8,422 | |
| Redeemed | | | | (5,302,594 | ) | | (9,369,595 | ) | | (2,843,182 | ) | | (6,424,729 | ) | | (1,804 | ) | | (43,911 | ) |
|
| |
| |
| |
| |
| |
| |
| |
| Net increase (decrease) | | | | (411,350 | ) | | 636,978 | | | 1,601,735 | | | 1,865,311 | | | 102,528 | | $ | 55,669 | |
|
| |
| |
| |
| |
| |
| |
See accompanying notes to financial statements on pages 70 - 73.
69
| Sit Mutual Funds
Notes to Financial Statements
|
| (1) | | Summary of Significant Accounting Policies |
| | The Sit Mutual Funds (the Funds) are 100% no-load funds, and are registered under the Investment Company Act of 1940 (as amended) as diversified (except Minnesota and Florida Tax-Free Income Funds which are non-diversified), open-end management investment companies, or series thereof. The Sit Minnesota Tax-Free Income Fund, and the Sit Tax-Free Income Fund are series funds of Sit Mutual Funds II, Inc. The Sit Florida Tax-Free Income Fund is a series fund of Sit Mutual Funds Trust. Each fund has 10 billion authorized shares of capital stock. Shares in the U.S. Government Securities Fund have a par value of $0.01, and shares in other funds have a par value of $0.001. This report covers the bond funds of the Sit Mutual Funds. The investment objective for each Fund is as follows: |
| Fund | Investment Objectives |
|---|
| Money Market | Maximum current income with the preservation of capital and maintenance of liquidity. |
U.S. Government
Securities | High level of current income and safety of principal. |
| Tax-Free Income | High level of current income that is exempt from federal income tax, consistent with the preservation of capital. |
Minnesota
Tax-Free Income | High level of current income that is exempt from federal reglar income tax and Minnesota regular personal income tax, consistent with the preservation of capital. |
Florida
Tax-Free Income | High level of current income that is exempt from federal regular income tax by investing in securities that are exempt from the Florida intangibles tax. |
| | Significant accounting policies followed by the Funds are summarized below: |
| | Investments in Securities
Securities maturing more than 60 days from the valuation date, with the exception of those in Money Market Fund, are valued at the market price supplied by an independent pricing vendor based on current interest rates; those securities with maturities of less than 60 days when acquired, or which subsequently are within 60 days of maturity, are valued at amortized cost, which approximates market value. When market quotations are not readily available, or when the Advisor becomes aware that a significant event impacting the value of a security or group of securities has occurred after the closing of the exchange on which the security or securities principally trade, but before the calculation of the daily net asset value, securities are valued at fair value as determined in good faith using procedures established by the Board of Directors. Pursuant to Rule 2a-7 of the Investment Company Act of 1940, all securities in the Money Market Fund are valued at amortized cost, which approximates market value, in order to maintain a constant net asset value of $1 per share. |
70
| | Security transactions are accounted for on the date the securities are purchased or sold. Gains and losses are calculated on the identified-cost basis. Interest, including level-yield amortization of long-term bond premium and discount, is recorded on the accrual basis. Dividends received from closed-end fund holdings are included in Interest Income and are generated from the underlying investments. |
| | Delivery and payment for securities which have been purchased by the Funds on a forward commitment or when-issued basis can take place two weeks or more after the transaction date. During this period, such securities are subject to market fluctuations and may increase or decrease in value prior to delivery, and the Funds maintain segregated assets with a market value greater than the amount of their purchase commitments. |
| | The Minnesota Tax-Free Income Fund concentrates its investments in Minnesota, and therefore may have more credit risk related to the economic conditions in the state of Minnesota than a portfolio with broader geographical diversification. |
| | The Florida Tax-Free Income Fund concentrates its investments in Florida, and therefore may have more credit risk related to the economic conditions in the state of Florida than a portfolio with broader geographical diversification. |
| | Federal Taxes
The Funds’ policy is to comply with the requirements of the Internal Revenue Code applicable to regulated investment companies and to distribute all of its taxable income to shareholders. Therefore, no income tax provision is required. Also, in order to avoid the payment of any federal excise taxes, the Funds will distribute substantially all of their net investment income and net realized gains on a calendar year basis. |
| | Net investment income and net realized gains may differ for financial statement and tax purposes. The character of distributions made during the year for net investment income or net realized gains may also differ from its ultimate characterization for tax purposes. |
| | As of March 31, 2005, for federal income tax purposes, some Funds have capital loss carryovers which, if not offset by subsequent gains will begin to expire as follows: |
| | | Loss Carryover
| | Expiration Year
|
|---|
| U.S. Government Securities | | | $ | 3,964,767 | | 2007 | | |
| Tax-Free Income | | | $ | 29,658,089 | | 2008 | | |
| MN Tax-Free Income | | | $ | 7,995,128 | | 2008 | | |
| FL Tax-Free Income | | | $ | 16,907 | | 2013 | | |
71
| Sit Mutual Funds
Notes to Financial Statements (continued)
|
| | Distributions
Distributions to shareholders are recorded as of the close of business on the record date. Such distributions are payable in cash or reinvested in additional shares of the Funds’capital stock. Distributions from net investment income are declared daily and paid monthly for the Funds. Distributions from net realized gains, if any, will be made annually for each of the Funds. |
| | Use of Estimates
The preparation of financial statements in conformity with accounting principles generally accepted in the United States of America requires management to make certain estimates and assumptions that affect the reported amounts of assets and liabilities and disclosure of contingent assets and liabilities at the date of the financial statements and the reported results. Actual results could differ from those estimates. |
| (2) | | Investment Security Transactions |
| | Purchases of and proceeds from sales and maturities of investment securities, other than short-term securities, for the period ended September 30, 2005, were as follows: |
| | | Purchases ($)
| | Proceeds ($)
|
|---|
| U.S. Government Securities Fund | | | | 66,248,517 | | | 58,195,669 | |
| Tax-Free Income Fund | | | | 56,109,592 | | | 52,872,860 | |
| Minnesota Tax-Free Income Fund | | | | 68,235,425 | | | 49,993,448 | |
| Florida Tax-Free Income Fund | | | | 1,414,846 | | | 222,250 | |
| | For the Money Market Fund during the period ended September 30, 2005 purchases of and proceeds from sales and maturities of investment securities aggregated $595,625,904 and $575,905,606, respectively. |
| | Investment Adviser
The Funds each have entered into an investment management agreement with Sit Investment Associates Inc. (SIA), under which SIA manages the Funds’ assets and provides research, statistical and advisory services, and pays related office rental, executive expenses and executive salaries. SIA also is obligated to pay all of the Funds’expenses (excluding extraordinary expenses, stock transfer taxes, interest, brokerage commissions, and other transaction charges relating to investing activities). The fee for investment management and advisory services is based on the average daily net assets of the Funds at the annual rate of: |
| | Average Daily
Net Assets |
|---|
| |
|
|---|
| Tax-Free Income Fund | .80% |
| Minnesota Tax-Free Income Fund | .80% |
| Florida Tax-Free Income Fund | .80% |
72
| | | First
$50 Million | | Over
$50 Million |
|---|
| | |
| |
|
|---|
| Money Market Fund | | | .80% | | | .60% | | |
| U.S. Government Securities Fund | | | 1.00% | | | .80% | | |
| | For the period October 1, 1993, through December 31, 2006, the Adviser has voluntarily agreed to limit the flat monthly fee (and, thereby, all Fund expenses, except extraordinary expenses, interest, brokerage commissions and other transaction charges not payable by the Adviser) paid by the Tax-Free Income Fund to an annual rate of .70% of the Fund’s average daily net assets in excess of $250 million and .60% of the Fund’s average daily net assets in excess of $500 million. After December 31, 2006, this voluntary fee waiver may be discontinued by the Adviser in its sole discretion. |
| | For the period October 1, 1993, through December 31, 2006, the Adviser has voluntarily agreed to limit the flat monthly fee (and, thereby, all Fund expenses, except extraordinary expenses, interest, brokerage commissions and other transaction charges not payable by the Adviser) paid by the U.S. Government Securities Fund and Money Market Fund to an annual rate of .80% and .50%, respectively of the Fund’s average daily net assets. After December 31, 2006, this voluntary fee waiver may be discontinued by the Adviser in its sole discretion. |
| | Transactions with affiliates
The investment adviser, affiliates of the investment adviser, directors and officers of the Funds as a whole owned the following shares as of September 30, 2005: |
| | | Shares | | % Shares
Outstanding |
|---|
| | |
| |
|
|---|
| Money Market Fund | | | | 39,477,941 | | | 67.3(*) | |
| U.S. Government Securities Fund | | | | 1,044,441 | | | 4.2 | |
| Tax-Free Income Fund | | | | 2,048,628 | | | 5.7 | |
| Minnesota Tax-Free Income Fund | | | | 1,570,122 | | | 6.4 | |
| Florida Tax-Free Income Fund | | | | 264,389 | | | 62.7 | |
| | (*) 45.8% shares owned by other Sit Mutual Funds. |
| | Per share data for a share of capital stock outstanding during the period and selected supplemental and ratio information for each period(s), are indicated on pages 75 through 79. |
73
This page has been left blank intentionally.
74
| Six months ended
September 30, 2005
(Unaudited) | | Years Ended March 31, |
|---|
| |
| |
| | | 2005 | | 2004 | | 2003 | | 2002 |
|---|
| |
| Net Asset Value: | | | | | | | | | | | | | | | | | |
| Beginning of period | | | $ | 1.00 | | $ | 1.00 | | $ | 1.00 | | $ | 1.00 | | $ | 1.00 | |
| |
| Operations: | | |
| Net investment income | | | | 0.01 | | | 0.01 | | | 0.01 | | | 0.01 | | | 0.03 | |
| |
| Total from operations | | | | 0.01 | | | 0.01 | | | 0.01 | | | 0.01 | | | 0.03 | |
| |
| Distributions to Shareholders: | | |
| From net investment income | | | | (0.01 | ) | | (0.01 | ) | | (0.01 | ) | | (0.01 | ) | | (0.03 | ) |
| |
| Net Asset Value: | | |
| End of period | | | $ | 1.00 | | $ | 1.00 | | $ | 1.00 | | $ | 1.00 | | $ | 1.00 | |
| |
| Total investment return (1) | | | | 1.37 | % | | 1.24 | % | | 0.60 | % | | 1.13 | % | | 2.63 | % |
| |
| Net assets at end of period (000's omitted) | | | $ | 58,619 | | $ | 38,141 | | $ | 44,610 | | $ | 73,843 | | $ | 93,785 | |
| |
| Ratios: | | |
| Expenses to average daily net assets | | | | 0.50 | % (2) | | 0.50 | % (2) | | 0.50 | % (2) | | 0.50 | % (2) | | 0.50 | % (2) |
| Net investment income to average daily net assets | | | | 2.75 | % (2) | | 1.22 | % (2) | | 0.60 | % (2) | | 1.14 | % (2) | | 2.65 | % (2) |
| _________________ |
| (1) | Total investment return is based on the change in net asset value of a share during the period and assumes reinvestment of distributions at net asset value. |
| (2) | Percentages for the period ended September 30, 2005 are adjusted to an annual rate.
Total Fund expenses are contractually limited to .80% of average daily net assets for the first $50 million in Fund net assets and .60% of average daily net assets for Fund net assets exceeding $50 million. However, during the period ended September 30, 2005 and the years ended March 31, 2005, 2004, 2003, and 2002, the investment adviser voluntarily absorbed expenses that were otherwise payable by the Fund. Had the Fund incurred these expenses, the ratio of expenses to average daily net assets would have been .79%, .80%, .76%, .74%, and .70% for each of these periods and the ratio of net investment income to average daily net assets would have been 2.46%, .92%, .34%, .90%, and 2.45%, respectively. |
75
| Sit U.S. Government Securities Fund
Financial Highlights |
| Six months ended
September 30, 2005
(Unaudited) | | Years Ended March 31, |
|---|
| |
| |
| | | 2005 | | 2004 | | 2003 | | 2002 |
|---|
| |
| Net Asset Value: | | | | | | | | | | | | | | | | | |
| Beginning of period | | | $ | 10.62 | | $ | 10.79 | | $ | 10.83 | | $ | 10.69 | | $ | 10.59 | |
| |
| Operations: | | |
| Net investment income | | | | .20 | | | .38 | | | .27 | | | .45 | | | .58 | |
| Net realized and unrealized gains | | |
| (losses) on investments | | | | (.01 | ) | | (.17 | ) | | (.04 | ) | | .14 | | | .10 | |
| |
| Total from operations | | | | .19 | | | .21 | | | .23 | | | .59 | | | .68 | |
| |
| Distributions to Shareholders: | | |
| From net investment income | | | | (.20 | ) | | (.38 | ) | | (.27 | ) | | (.45 | ) | | (.58 | ) |
| From realized gains | | | | — | | | — | | | — | | | — | | | — | |
| |
| Total Distributions | | | | (.20 | ) | | (.38 | ) | | (.27 | ) | | (.45 | ) | | (.58 | ) |
| |
| Net Asset Value: | | |
| End of period | | | $ | 10.61 | | $ | 10.62 | | $ | 10.79 | | $ | 10.83 | | $ | 10.69 | |
| |
| Total investment return (1) | | | | 1.80 | % | | 1.93 | % | | 2.19 | % | | 5.60 | % | | 6.53 | % |
| |
| Net assets at end of period (000's omitted) | | | $ | 262,906 | | $ | 258,410 | | $ | 287,442 | | $ | 408,840 | | $ | 211,947 | |
| |
| Ratios: | | |
| Expenses to average daily net assets | | | | 0.80 | % (2) | | 0.80 | % (2) | | 0.80 | % (2) | | 0.80 | % (2) | | 0.80 | % (2) |
| Net investment income to average daily net assets | | | | 3.75 | % (2) | | 3.51 | % (2) | | 2.48 | % (2) | | 3.98 | % (2) | | 5.40 | % (2) |
| Portfolio turnover rate (excluding short-term securities) | | | | 19.02 | % | | 36.64 | % | | 61.99 | % | | 77.06 | % | | 54.69 | % |
| _________________ |
| (1) | Total investment return is based on the change in net asset value of a share during the period and assumes reinvestment of distributions at net asset value. |
| (2) | Percentages for the period ended September 30, 2005 are adjusted to an annual rate.
Total Fund expenses are contractually limited to 1.00% of average daily net assets for the first $50 million in Fund net assets and .80% of average daily net assets for Fund net assets exceeding $50 million. However, during the period ended September 30, 2005 and the years ended March 31, 2005, 2004, 2003, and 2002, the investment adviser voluntarily absorbed expenses that were otherwise payable by the Fund. Had the Fund incurred these expenses, the ratio of expenses to average daily net assets would have been .84%, .84%, .83%, .83%, and .85% for each of these periods and the ratio of net investment income to average daily net assets would have been 3.71%, 3.47%, 2.45%, 3.95%, and 5.35%, respectively. |
76
| Sit Tax-Free Income Fund
Financial Highlights
| |
| Six months ended
September 30, 2005
(Unaudited) | | Years Ended March 31, |
|---|
| |
| |
| | | 2005 | | 2004 | | 2003 | | 2002 |
|---|
| |
| Net Asset Value: | | | | | | | | | | | | | | | | | |
| Beginning of period | | | $ | 9.77 | | $ | 9.90 | | $ | 9.94 | | $ | 9.82 | | $ | 9.90 | |
| |
| Operations: | | |
| Net investment income | | | | .19 | | | .38 | | | .42 | | | .45 | | | .48 | |
| Net realized and unrealized gains | | |
| (losses) on investments | | | | .02 | | | (.13 | ) | | (.04 | ) | | .12 | | | (.08 | ) |
| |
| Total from operations | | | | .21 | | | .25 | | | .38 | | | .57 | | | .40 | |
| |
| Distributions to Shareholders: | | |
| From net investment income | | | | (.19 | ) | | (.38 | ) | | (.42 | ) | | (.45 | ) | | (.48 | ) |
| From realized gains | | | | — | | | — | | | — | | | — | | | — | |
| |
| Total distributions | | | | (.19 | ) | | (.38 | ) | | (.42 | ) | | (.45 | ) | | (.48 | ) |
| |
| Net Asset Value: | | |
| End of period | | | $ | 9.79 | | $ | 9.77 | | $ | 9.90 | | $ | 9.94 | | $ | 9.82 | |
| |
| Total investment return (1) | | | | 2.12 | % | | 2.54 | % | | 3.89 | % | | 5.90 | % | | 4.05 | % |
| |
| Net assets at end of period (000's omitted) | | | $ | 350,600 | | $ | 353,868 | | $ | 352,281 | | $ | 414,419 | | $ | 440,431 | |
| |
| Ratios: | | |
| Expenses to average daily net assets | | | | 0.77 | % (2) | | 0.77 | % (2) | | 0.76 | % (2) | | 0.76 | % (2) | | 0.75 | % (2) |
| Net investment income to average daily net assets | | | | 3.78 | % (2) | | 3.84 | % (2) | | 4.23 | % (2) | | 4.53 | % (2) | | 4.79 | % (2) |
| Portfolio turnover rate (excluding short-term securities) | | | | 12.90 | % | | 41.29 | % | | 32.33 | % | | 37.98 | % | | 40.02 | % |
| _________________ |
| (1) | Total investment return is based on the change in net asset value of a share during the period and assumes reinvestment of distributions at net asset value. |
| (2) | Percentages for the period ended September 30, 2005 are adjusted to an annual rate.
Total Fund expenses are contractually limited to .80% of average daily net assets. However, during the period ended September 30, 2005 and years ended March 31, 2005, 2004, 2003, and 2002, the investment adviser voluntarily absorbed expenses that were otherwise payable by the Fund. Had the Fund incurred these expenses, the ratio of expenses to average daily net assets would have been .80% for these periods, and the ratio of net investment income to average daily net assets would have been 3.75%, 3.81%, 4.19%, 4.49%, and 4.74%, respectively. |
77
| Sit Minnesota Tax-Free Income Fund
Financial Highlights |
| Six months ended
September 30, 2005
(Unaudited) | | Years Ended March 31, |
|---|
| |
| |
| | | 2005 | | 2004 | | 2003 | | 2002 |
|---|
| |
| Net Asset Value: | | | | | | | | | | | | | | | | | |
| Beginning of period | | | $ | 10.09 | | $ | 10.26 | | $ | 10.22 | | $ | 9.99 | | $ | 10.01 | |
| |
| Operations: | | |
| Net investment income | | | | .21 | | | .44 | | | .46 | | | .47 | | | .49 | |
| Net realized and unrealized gains | | |
| (losses) on investments | | | | .07 | | | (.17 | ) | | .04 | | | .23 | | | (.02 | ) |
| |
| Total from operations | | | | .28 | | | .27 | | | .50 | | | .70 | | | .47 | |
| |
| Distributions to Shareholders: | | |
| From net investment income | | | | (.21 | ) | | (.44 | ) | | (.46 | ) | | (.47 | ) | | (.49 | ) |
| |
| Net Asset Value: | | |
| End of period | | | $ | 10.16 | | $ | 10.09 | | $ | 10.26 | | $ | 10.22 | | $ | 9.99 | |
| |
| Total investment return (1) | | | | 2.78 | % | | 2.69 | % | | 4.99 | % | | 7.14 | % | | 4.74 | % |
| |
| Net assets at end of period (000's omitted) | | | $ | 250,958 | | $ | 233,034 | | $ | 217,773 | | $ | 219,368 | | $ | 195,275 | |
| |
| Ratios: | | |
| Expenses to average daily net assets | | | | 0.80 | % (2) | | 0.80 | % | | 0.80 | % | | 0.80 | % | | 0.80 | % |
| Net investment income to average daily net assets | | | | 4.11 | % (2) | | 4.33 | % | | 4.47 | % | | 4.62 | % | | 4.87 | % |
| Portfolio turnover rate (excluding short-term securities) | | | | 31.67 | % | | 29.33 | % | | 27.31 | % | | 19.51 | % | | 23.81 | % |
| _________________ |
| (1) | Total investment return is based on the change in net asset value of a share during the period and assumes reinvestment of distributions at net asset value. |
| (2) | Adjusted to an annual rate. |
78
| Sit Florida Tax-Free Income Fund
Financial Highlights
| |
| Six months
ended
September 30,
2005
(Unaudited) | | Year
Ended
March 31,
2005 | | Three months
Ended
March 31,
2004 |
|---|
| |
| Net Asset Value: | | | | | | | | | | | |
| Beginning of period | | | $ | 9.94 | | $ | 10.05 | | $ | 10.00 | |
| |
| Operations: | | |
| Net investment income | | | | .16 | | | .29 | | | .06 | |
| Net realized and unrealized gains | | |
| (losses) on investments | | | | .04 | | | (.11 | ) | | .05 | |
| |
| Total from operations | | | | .20 | | | .18 | | | .11 | |
| |
| Distributions to Shareholders: | | |
| From net investment income | | | | (.16 | ) | | (.29 | ) | | (.06 | ) |
| |
| Net Asset Value: | | |
| End of period | | | $ | 9.98 | | $ | 9.94 | | $ | 10.05 | |
| |
| Total investment return (1) | | | | 2.00 | % | | 1.84 | % | | 1.08 | % |
| |
| Net assets at end of period (000's omitted) | | | $ | 4,210 | | $ | 3,173 | | $ | 2,648 | |
| |
| Ratios: | | |
| Expenses to average daily net assets | | | | 0.80 | % (2) | | 0.80 | % | | 0.80 | % (2) |
| Net investment income to average daily net assets | | | | 3.17 | % (2) | | 2.93 | % | | 2.49 | % (2) |
| Portfolio turnover rate (excluding short-term securities) | | | | 9.47 | % | | 29.52 | % | | 3.45 | % |
| _________________ |
| (1) | Total investment return is based on the change in net asset value of a share during the period and assumes reinvestment of distributions at net asset value. |
| (2) | Adjusted to an annual rate. |
79
| Sit Mutual Funds
Expense Example (Unaudited) |
As a shareholder of the Funds, you incur two types of costs: (1) transaction costs, including redemption fees and (2) ongoing costs, including management fees; and other Fund expenses. This Example is intended to help you understand your ongoing costs (in dollars) of investing in the Funds and to compare these costs with the ongoing costs of investing in other mutual funds.
The Example is based on an investment of $1,000 invested at the beginning of the period and held for the entire period April 1, 2005 to September 30, 2005.
Actual Expenses
The first line of the table below provides information about actual account values and actual expenses. You may use the information in this line, together with the amount you invested, to estimate the expenses that you paid over the period. Simply divide your account value by $1,000 (for example, an $8,600 account value divided by $1,000 = 8.6), then multiply the result by the number in the first line under the heading entitled “Expenses Paid During Period” to estimate the expenses you paid on your account during this period.
Hypothetical Example for Comparison Purposes
The second line of the table below provides information about hypothetical account values and hypothetical expenses based on the Fund’s actual expense ratio and an assumed rate of return of 5% per year before expenses, which is not the Fund’s actual return. The hypothetical account values and expenses may not be used to estimate the actual ending account balance or expenses you paid for the period. You may use this information to compare the ongoing costs of investing in the Fund and other funds. To do so, compare this 5% hypothetical example with the 5% hypothetical examples that appear in the shareholder reports of the other funds.
Please note that the expenses shown in the table are meant to highlight your ongoing costs only and do not reflect any transactional costs, such as redemption fees. Therefore, the second line of the table is useful in comparing ongoing costs only, and will not help you determine the relative total costs of owning different funds. In addition, if these transactional costs (redemption fees) were included, your costs would have been higher.
|
| Money Market Fund | | Beginning
Account Value
(4/1/05) | | Ending
Account Value
(9/30/05) | | Expenses Paid
During Period*
(4/1/05 – 9/30/05) |
|---|
|
| Actual | | | $1,000.00 | | | $1,013.70 | | | $ 2.51 | | |
|
| Hypothetical | | | $1,000.00 | | | $1,022.50 | | | $ 2.52 | | |
| (5% return before expenses) | | |
|
| * Expenses are equal to the Fund’s annualized expense ratio of 0.50%, multiplied by the average account value over the period, multiplied by 182/365 (to reflect the one-half year period). |
80
|
U.S. Goverment
Securities Fund | | Beginning
Account Value
(4/1/05) | | Ending
Account Value
(9/30/05) | | Expenses Paid
During Period*
(4/1/05 – 9/30/05) |
|---|
|
| Actual | | | $1,000.00 | | | $1,018.00 | | | $ 4.02 | | |
|
| Hypothetical | | | $1,000.00 | | | $1,021.00 | | | $ 4.03 | | |
| (5% return before expenses) | | |
|
| * Expenses are equal to the Fund’s annualized expense ratio of 0.80%, multiplied by the average account value over the period, multiplied by 182/365 (to reflect the one-half year period). |
|
| Tax-Free Income Fund | | Beginning
Account Value
(4/1/05) | | Ending
Account Value
(9/30/05) | | Expenses Paid
During Period*
(4/1/05 – 9/30/05) |
|---|
|
| Actual | | | $1,000.00 | | | $1,021.20 | | | $ 3.88 | | |
|
| Hypothetical | | | $1,000.00 | | | $1,021.15 | | | $ 3.88 | | |
| (5% return before expenses) | | |
|
| * Expenses are equal to the Fund’s annualized expense ratio of 0.77%, multiplied by the average account value over the period, multiplied by 182/365 (to reflect the one-half year period). |
|
Minnesota Tax-Free
Income Fund | | Beginning
Account Value
(4/1/05) | | Ending
Account Value
(9/30/05) | | Expenses Paid
During Period*
(4/1/05 – 9/30/05) |
|---|
|
| Actual | | | $1,000.00 | | | $1,027.80 | | | $ 4.04 | | |
|
| Hypothetical | | | $1,000.00 | | | $1,021.00 | | | $ 4.03 | | |
| (5% return before expenses) | | |
|
| * Expenses are equal to the Fund’s annualized expense ratio of 0.80%, multiplied by the average account value over the period, multiplied by 182/365 (to reflect the one-half year period). |
81
| Sit Mutual Funds
Expense Example (Continued) |
|
Florida Tax-Free
Income Fund | | Beginning
Account Value
(4/1/05) | | Ending
Account Value
(9/30/05) | | Expenses Paid
During Period*
(4/1/05 – 9/30/05) |
|---|
|
| Actual | | | $1,000.00 | | | $1,020.00 | | | $ 4.03 | | |
|
| Hypothetical | | | $1,000.00 | | | $1,021.00 | | | $ 4.03 | | |
| (5% return before expenses) | | |
|
| * Expenses are equal to the Fund’s annualized expense ratio of 0.80%, multiplied by the average account value over the period, multiplied by 182/365 (to reflect the one-half year period). |
82
This page has been intentionally left blank.
83
| Sit Mutual Funds
Additional Information |
PROXY VOTING
Each Fund follows certain policies and procedures for voting proxies for securities held in each portfolio. A description of the Funds’ proxy voting polices and procedures is available without charge upon request by calling the Funds at 1-800-332-5580.
Information regarding how each Fund voted proxies relating to its portfolio securities during the most recent twelve-month period ended June 30 is available 1) without charge upon request by calling the Funds at 1-800-332-5580; and 2) on the U.S. Securities and Exchange Commission’s website at http://www.sec.gov.
AVAILABILITY OF QUARTERLY PORTFOLIO SCHEDULES
The Funds file their complete schedules of portfolio holdings with the U.S. Securities and Exchange Commission (SEC) for the first and third quarters of each fiscal year on Form N-Q. The Funds’ Forms N-Q are available on the SEC’s website at http://www.sec.gov. The Funds’ Forms N-Q may be reviewed and copied at the SEC’s Public Reference Room in Washington, DC. Information on the operation of the Public Reference Room may be obtained by calling 1-800-SEC-0330. Information on the Funds’ Forms N-Q is also available without charge upon request by calling the Funds at 1-800-332-5580.
84
A Look at Sit Mutual Funds
Sit Mutual Funds are managed by Sit Investment Associates, Inc. Sit Investment Associates was founded by Eugene C. Sit in July 1981 and is dedicated to a single purpose, to be one of the premier investment management firms in the United States. Sit Investment Associates currently manages approximately $6.6 Billion for some of America’s largest corporations, foundations and endowments.
Sit Mutual Funds are comprised of thirteen no-load Funds. No-load means that Sit Mutual Funds have no sales charges on purchases, no deferred sales charges, no 12b-1 fees and no exchange fees. Every dollar you invest goes to work for you. Effective November 1, 2003, the Stock Funds, excluding the Balanced Fund, charge a 2% redemption fee on shares held less than 30 days.
Sit Mutual Funds offer:
- Free telephone exchange
- Dollar-cost averaging through an automatic investment plan
- Electronic transfer for purchases and redemptions
- Free checkwriting privileges on bond funds
- Retirement accounts including IRAs and 401(k) plans
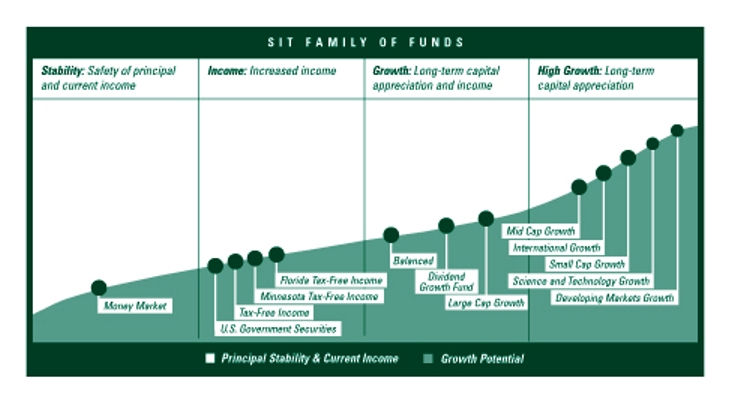
85
S E M I - A N N U A L R E P O R T B O N D F U N D S
Six months ended September 30, 2005
|
|---|
INVESTMENT ADVISER
Sit Investment Associates, Inc.
3300 IDS Center
80 South Eighth Street
Minneapolis, MN 55402
612-334-5888 (Metro Area)
800-332-5580
CUSTODIAN
PFPC Trust Company
P.O. Box 9763
Providence, RI 02940
TRANSFER AGENT AND
DISBURSING AGENT
PFPC, Inc.
P.O. Box 9763
Providence, RI 02940
To contact Sit Mutual Funds:
By Telephone:
800-332-5580 or 612-334-5888
By E-Mail:
info@sitinvest.com
On the Internet:
Visit our website at www.sitfunds.com
Visit the SEC website at www.sec.gov | DISTRIBUTOR
SIA Securities Corp.
3300 IDS Center
80 South Eighth Street
Minneapolis, MN 55402
612-334-5888 (Metro Area)
800-332-5580
AUDITORS
KPMGLLP
90 South Seventh Street
Suite 4200
Minneapolis, MN 55402
LEGAL COUNSEL
Dorsey & WhitneyLLP
50 South Sixth Street
Suite 1500
Minneapolis, MN 55402
By Regular Mail:
Sit Mutual Funds
P.O. Box 9763
Providence, RI 02940
By Express Mail:
Sit Mutual Funds
101 Sabin Street
Pawtucket, RI 02860 |
| |
| |

Item 2: Code of Ethics.
Not applicable to Semi-Annual Report.
Item 3: Audit Committee Financial Expert.
Not applicable to Semi-Annual Report.
Item 4: Principal Accountant Fees and Services.
Not applicable to Semi-Annual Report.
Item 5: Audit Committee of Listed Registrants.
Not applicable to open-end investment companies.
Item 6: Schedule of Investments.
The schedule of investments is included as part of the report to shareholders filed under Item 1 of this Form.
Item 7: Disclosure of Proxy Voting Policies and Procedures for Closed-End Management Investment Companies.
Not applicable to open-end investment companies.
Item 8: Portfolio Managers of Closed-End Management Companies.
Not applicable to open-end investment companies.
Item 9: Purchases of Equity Securities by Closed-End Management Investment Company and Affiliated Purchasers.
Not applicable to open-end investment companies.
Item 10: Submission of Matters to a vote of Security Holders.
There have been no material changes to the procedures by which shareholders may recommend nominees to the registrant’s board of directors.
Item 11: Controls and Procedures.
(a) Based on their evaluation of the Registrant’s Disclosure Controls and Procedures as of a date within 90 days of the Filing Date, the Registrant’s Chairman and Treasurer have determined that the Disclosure Controls and Procedures (as defined in Rule 30a-2(c) under the Act) are designed to ensure that information required to be disclosed by the Registrant is recorded, processed, summarized and reported by the filing Date, and that information required to be disclosed in the report is communicated to the Registrant’s management, as appropriate, to allow timely decisions regarding required disclosure.
(b) There were no changes in the Registrant’s internal control over financial reporting as defined in Rule 30a-3(d) under the Act) that occurred during the Registrant’s last fiscal half-year that has materially affected, or is reasonably likely to materially affect, the Registrant’s internal control over financial reporting.
Item 12: Exhibits.
(a) The following exhibits are attached to this Form N-CSR:
| | (2) A separate certification for each principal executive and principal financial officer of the registrant as required by Rule 30a-2(a) under the Act (17 CFR 270.30a-2) (certification required by Section 302 of the Sarbanes-Oxley Act of 2002). |
(b) Certification required by Rule 30a-2(b) under the Act (certification required by Section 906 of the Sarbanes-Oxley Act of 2002).
SIGNATURES
Pursuant to the requirements of the Securities Exchange Act of 1934 and the Investment Company Act of 1940, the registrant has duly caused this report to be signed on its behalf by the undersigned, thereunto duly authorized.
SIT U.S. GOVERNMENT SECURITIES FUND, INC.
| By (Signature and Title) | /s/ Paul E. Rasmussen
|
| | Paul E. Rasmussen
Vice President, Treasurer |
Date November 30, 2005
Pursuant to the requirements of the Securities Exchange Act of 1934 and the Investment Company Act of 1940, this report has been signed below by the following persons on behalf of the registrant and in the capacities and on the dates indicated.
| By (Signature and Title) | /s/ Paul E. Rasmussen
|
| | Paul E. Rasmussen
Vice President, Treasurer |
Date November 30, 2005
| By (Signature and Title) | /s/ Eugene C. Sit
|
| | Eugene C. Sit
Chairman |
Date November 30, 2005
Item 2: Code of Ethics.
Not applicable to Semi-Annual Report.
Item 3: Audit Committee Financial Expert.
Not applicable to Semi-Annual Report.
Item 4: Principal Accountant Fees and Services.
Not applicable to Semi-Annual Report.
Item 5: Audit Committee of Listed Registrants.
Not applicable to open-end investment companies.
Item 6: Schedule of Investments.
The schedule of investments is included as part of the report to shareholders filed under Item 1 of this Form.
Item 7: Disclosure of Proxy Voting Policies and Procedures for Closed-End Management Investment Companies.
Not applicable to open-end investment companies.
Item 8: Portfolio Managers of Closed-End Management Companies.
Not applicable to open-end investment companies.
Item 9: Purchases of Equity Securities by Closed-End Management Investment Company and Affiliated Purchasers.
Not applicable to open-end investment companies.
Item 10: Submission of Matters to a vote of Security Holders.
There have been no material changes to the procedures by which shareholders may recommend nominees to the registrant’s board of directors.
Item 11: Controls and Procedures.
(a) Based on their evaluation of the Registrant’s Disclosure Controls and Procedures as of a date within 90 days of the Filing Date, the Registrant’s Chairman and Treasurer have determined that the Disclosure Controls and Procedures (as defined in Rule 30a-2(c) under the Act) are designed to ensure that information required to be disclosed by the Registrant is recorded, processed, summarized and reported by the filing Date, and that information required to be disclosed in the report is communicated to the Registrant’s management, as appropriate, to allow timely decisions regarding required disclosure.
(b) There were no changes in the Registrant’s internal control over financial reporting as defined in Rule 30a-3(d) under the Act) that occurred during the Registrant’s last fiscal half-year that has materially affected, or is reasonably likely to materially affect, the Registrant’s internal control over financial reporting.
Item 12: Exhibits.
(a) The following exhibits are attached to this Form N-CSR:
| | (2) A separate certification for each principal executive and principal financial officer of the registrant as required by Rule 30a-2(a) under the Act (17 CFR 270.30a-2) (certification required by Section 302 of the Sarbanes-Oxley Act of 2002). |
(b) Certification required by Rule 30a-2(b) under the Act (certification required by Section 906 of the Sarbanes-Oxley Act of 2002).
SIGNATURES
Pursuant to the requirements of the Securities Exchange Act of 1934 and the Investment Company Act of 1940, the registrant has duly caused this report to be signed on its behalf by the undersigned, thereunto duly authorized.
SIT MONEY MARKET FUND, INC.
| By (Signature and Title) | /s/ Paul E. Rasmussen
|
| | Paul E. Rasmussen
Vice President, Treasurer |
Date November 30, 2005
Pursuant to the requirements of the Securities Exchange Act of 1934 and the Investment Company Act of 1940, this report has been signed below by the following persons on behalf of the registrant and in the capacities and on the dates indicated.
| By (Signature and Title) | /s/ Paul E. Rasmussen
|
| | Paul E. Rasmussen
Vice President, Treasurer |
Date November 30, 2005
| By (Signature and Title) | /s/ Eugene C. Sit
|
| | Eugene C. Sit
Chairman |
Date November 30, 2005
Item 2: Code of Ethics.
Not applicable to Semi-Annual Report.
Item 3: Audit Committee Financial Expert.
Not applicable to Semi-Annual Report.
Item 4: Principal Accountant Fees and Services.
Not applicable to Semi-Annual Report.
Item 5: Audit Committee of Listed Registrants.
Not applicable to open-end investment companies.
Item 6: Schedule of Investments.
The schedule of investments is included as part of the report to shareholders filed under Item 1 of this Form.
Item 7: Disclosure of Proxy Voting Policies and Procedures for Closed-End Management Investment Companies.
Not applicable to open-end investment companies.
Item 8: Portfolio Managers of Closed-End Management Companies.
Not applicable to open-end investment companies.
Item 9: Purchases of Equity Securities by Closed-End Management Investment Company and Affiliated Purchasers.
Not applicable to open-end investment companies.
Item 10: Submission of Matters to a vote of Security Holders.
There have been no material changes to the procedures by which shareholders may recommend nominees to the registrant’s board of directors.
Item 11: Controls and Procedures.
(a) Based on their evaluation of the Registrant’s Disclosure Controls and Procedures as of a date within 90 days of the Filing Date, the Registrant’s Chairman and Treasurer have determined that the Disclosure Controls and Procedures (as defined in Rule 30a-2(c) under the Act) are designed to ensure that information required to be disclosed by the Registrant is recorded, processed, summarized and reported by the filing Date, and that information required to be disclosed in the report is communicated to the Registrant’s management, as appropriate, to allow timely decisions regarding required disclosure.
(b) There were no changes in the Registrant’s internal control over financial reporting as defined in Rule 30a-3(d) under the Act) that occurred during the Registrant’s last fiscal half-year that has materially affected, or is reasonably likely to materially affect, the Registrant’s internal control over financial reporting.
Item 12: Exhibits:
(a) The following exhibits are attached to this Form N-CSR:
| | (2) A separate certification for each principal executive and principal financial officer of the registrant as required by Rule 30a-2(a) under the Act (17 CFR 270.30a-2) (certification required by Section 302 of the Sarbanes-Oxley Act of 2002). |
(b) Certification required by Rule 30a-2(b) under the Act (certification required by Section 906 of the Sarbanes-Oxley Act of 2002).
SIGNATURES
Pursuant to the requirements of the Securities Exchange Act of 1934 and the Investment Company Act of 1940, the registrant has duly caused this report to be signed on its behalf by the undersigned, thereunto duly authorized.
SIT MUTUAL FUNDS II, INC.
| By (Signature and Title) | /s/ Paul E. Rasmussen
|
| | Paul E. Rasmussen
Vice President, Treasurer |
Date November 30, 2005
Pursuant to the requirements of the Securities Exchange Act of 1934 and the Investment Company Act of 1940, this report has been signed below by the following persons on behalf of the registrant and in the capacities and on the dates indicated.
| By (Signature and Title) | /s/ Paul E. Rasmussen
|
| | Paul E. Rasmussen
Vice President, Treasurer |
Date November 30, 2005
| By (Signature and Title) | /s/ Eugene C. Sit
|
| | Eugene C. Sit
Chairman |
Date November 30, 2005
Item 2: Code of Ethics.
Not applicable to Semi-Annual Report.
Item 3: Audit Committee Financial Expert.
Not applicable to Semi-Annual Report.
Item 4: Principal Accountant Fees and Services.
Not applicable to Semi-Annual Report.
Item 5: Audit Committee of Listed Registrants.
Not applicable to open-end investment companies.
Item 6: Schedule of Investments.
The schedule of investments is included as part of the report to shareholders filed under Item 1 of this Form.
Item 7: Disclosure of Proxy Voting Policies and Procedures for Closed-End Management Investment Companies.
Not applicable to open-end investment companies.
Item 8: Portfolio Managers of Closed-End Management Companies.
Not applicable to open-end investment companies.
Item 9: Purchases of Equity Securities by Closed-End Management Investment Company and Affiliated Purchasers.
Not applicable to open-end investment companies.
Item 10: Submission of Matters to a vote of Security Holders.
There have been no material changes to the procedures by which shareholders may recommend nominees to the registrant’s board of directors.
Item 11: Controls and Procedures.
(a) Based on their evaluation of the Registrant’s Disclosure Controls and Procedures as of a date within 90 days of the Filing Date, the Registrant’s Chairman and Treasurer have determined that the Disclosure Controls and Procedures (as defined in Rule 30a-2(c) under the Act) are designed to ensure that information required to be disclosed by the Registrant is recorded, processed, summarized and reported by the filing Date, and that information required to be disclosed in the report is communicated to the Registrant’s management, as appropriate, to allow timely decisions regarding required disclosure.
(b) There were no changes in the Registrant’s internal control over financial reporting as defined in Rule 30a-3(d) under the Act) that occurred during the Registrant’s last fiscal half-year that has materially affected, or is reasonably likely to materially affect, the Registrant’s internal control over financial reporting.
Item 12: Exhibits:
(a) The following exhibits are attached to this Form N-CSR:
| | (2) A separate certification for each principal executive and principal financial officer of the registrant as required by Rule 30a-2(a) under the Act (17 CFR 270.30a-2) (certification required by Section 302 of the Sarbanes-Oxley Act of 2002). |
(b) Certification required by Rule 30a-2(b) under the Act (certification required by Section 906 of the Sarbanes-Oxley Act of 2002).
SIGNATURES
Pursuant to the requirements of the Securities Exchange Act of 1934 and the Investment Company Act of 1940, the registrant has duly caused this report to be signed on its behalf by the undersigned, thereunto duly authorized.
SIT MUTUAL FUNDS TRUST
| By (Signature and Title) | /s/ Paul E. Rasmussen
|
| | Paul E. Rasmussen
Vice President, Treasurer |
Date November 30, 2005
Pursuant to the requirements of the Securities Exchange Act of 1934 and the Investment Company Act of 1940, this report has been signed below by the following persons on behalf of the registrant and in the capacities and on the dates indicated.
| By (Signature and Title) | /s/ Paul E. Rasmussen
|
| | Paul E. Rasmussen
Vice President, Treasurer |
Date November 30, 2005
| By (Signature and Title) | /s/ Eugene C. Sit
|
| | Eugene C. Sit
Chairman |
Date November 30, 2005