UNITED STATES
SECURITIES AND EXCHANGE COMMISSION
Washington, D.C. 20549
FORM N-CSR
CERTIFIED SHAREHOLDER REPORT OF REGISTERED
MANAGEMENT INVESTMENT COMPANIES
Investment Company Act file number: 811-04032
Sit Money Market Fund, Inc.
(Exact name of registrant as specified in charter)
3300 IDS Center
80 South Eighth Street
Minneapolis, MN 55402
(Address of principal executive offices)
Paul E. Rasmussen, VP Treasurer
Sit Mutual Funds, Inc.
3300 IDS Center
80 South Eighth Street
Minneapolis, MN 55402
(Name and address of agent for service)
Copy to:
Mike Radmer, Esq.
Dorsey & Whitney
Suite 1500
50 South Sixth Street
Minneapolis, MN 55402-1498
Registrant’s telephone number, including area code:
(612) 334-5888
Date of fiscal year end: March 31, 2007
Date of reporting period: March 31, 2007
Item 1: Reports to Stockholders.
UNITED STATES
SECURITIES AND EXCHANGE COMMISSION
Washington, D.C. 20549
FORM N-CSR
CERTIFIED SHAREHOLDER REPORT OF REGISTERED
MANAGEMENT INVESTMENT COMPANIES
Investment Company Act file number: 811-04995
Sit U.S. Government Securities Fund, Inc.
(Exact name of registrant as specified in charter)
3300 IDS Center
80 South Eighth Street
Minneapolis, MN 55402
(Address of principal executive offices)
Paul E. Rasmussen, VP Treasurer
Sit Mutual Funds, Inc.
3300 IDS Center
80 South Eighth Street
Minneapolis, MN 55402
(Name and address of agent for service)
Copy to:
Mike Radmer, Esq.
Dorsey & Whitney
Suite 1500
50 South Sixth Street
Minneapolis, MN 55402-1498
Registrant’s telephone number, including area code:
(612) 334-5888
Date of fiscal year end: March 31, 2007
Date of reporting period: March 31, 2007
Item 1: Reports to Stockholders.
UNITED STATES
SECURITIES AND EXCHANGE COMMISSION
Washington, D.C. 20549
FORM N-CSR
CERTIFIED SHAREHOLDER REPORT OF REGISTERED
MANAGEMENT INVESTMENT COMPANIES
Investment Company Act file number: 811-04033
Sit Mutual Funds II, Inc.
(Exact name of registrant as specified in charter)
3300 IDS Center
80 South Eighth Street
Minneapolis, MN 55402
(Address of principal executive offices)
Paul E. Rasmussen, VP Treasurer
Sit Mutual Funds, Inc.
3300 IDS Center
80 South Eighth Street
Minneapolis, MN 55402
(Name and address of agent for service)
Copy to:
Mike Radmer, Esq.
Dorsey & Whitney
Suite 1500
50 South Sixth Street
Minneapolis, MN 55402-1498
Registrant’s telephone number, including area code:
(612) 334-5888
Date of fiscal year end: March 31, 2007
Date of reporting period: March 31, 2007
Item 1: Reports to Stockholders.
UNITED STATES
SECURITIES AND EXCHANGE COMMISSION
Washington, D.C. 20549
FORM N-CSR
CERTIFIED SHAREHOLDER REPORT OF REGISTERED
MANAGEMENT INVESTMENT COMPANIES
Investment Company Act file number: 811-21447
Sit Mutual Funds Trust
(Exact name of registrant as specified in charter)
3300 IDS Center
80 South Eighth Street
Minneapolis, MN 55402
(Address of principal executive offices)
Paul E. Rasmussen, VP Treasurer
Sit Mutual Funds, Inc.
3300 IDS Center
80 South Eighth Street
Minneapolis, MN 55402
(Name and address of agent for service)
Copy to:
Mike Radmer, Esq.
Dorsey & Whitney
Suite 1500
50 South Sixth Street
Minneapolis, MN 55402-1498
Registrant’s telephone number, including area code:
(612) 334-5888
Date of fiscal year end: March 31, 2007
Date of reporting period: March 31, 2007
Item 1: Reports to Stockholders.

Sit Mutual Funds
Bond Funds
Annual Report
March 31, 2007
Money Market Fund
U.S. Government Securities Fund
Tax-Free Income Fund
Minnesota Tax-Free Income Fund
Florida Tax-Free Income Fund
|
Sit Mutual Funds |
BOND FUNDS ANNUAL REPORT |
TABLE OF CONTENTS |
|
This document must be preceded or accompanied by a Prospectus.
| | | | | |
| 
| | | | |
| | | | |
| | Sit Mutual Funds | | |
| | One Year Ended March 31, 2007 | | |
| | | | |
| | Chairman’s Letter
| | |
| | | | |
| | | | |
Dear fellow shareholders:
The Federal Reserve increased short-term interest rates twice more during the second calendar quarter of 2006, bringing the federal funds rate to 5.25%. Treasury yields rose approximately 30 basis points to above 5.0% across the maturity spectrum, reflecting continued concerns over inflation and creating an almost flat yield curve. The Fed’s rate increase on June 29, 2006 was its 17th and latest move in the 425 basis points of tightening that began two years earlier. Weaker economic data in the third quarter of 2006 led intermediate and longer term yields to decline as investors believed that the current cycle of Fed tightening might be done. Treasury yields have been relatively stable since then, with the front end of the curve inverted as short term yields remain higher than longer term yields. The 3-month Treasury bill yield ended the 12-month period 0.40% higher at around 5.0% while the 5-year and 30-year Treasury yields declined -0.27% and -0.04% to 4.54% and 4.85%, respectively. The Fed has maintained a bias against inflationary risks since its May 2006 meeting.
The final estimate of U.S. fourth quarter 2006 real GDP growth was +2.5%, and total real GDP growth measured on a year-over-year basis in the fourth quarter remained a healthy +3.1%. We expect real GDP growth rate to moderate to a +2.7% average rate for 2007. Real personal consumption expenditures (PCE), which represent two-thirds of GDP, are on pace to exceed +3.0% for the first calendar quarter of 2007 and could approach +4.0%. While this rate of spending growth represents a slowdown from the +4.2% rate posted in the fourth quarter, it is still quite solid and counters the recession prospects that an inverted yield curve environment might suggest. The strong employment data released on April 5th, which saw the unemployment rate dip slightly to 4.4%, was also supportive of sustained consumer spending. The domestic economy could also see strength from other sectors. The inventory sector, which is notoriously volatile and remained a major drag in the fourth quarter, could eventually rebound to provide a solid underpinning to growth. In addition, real business spend-
ing remains a positive factor and, despite some softening, grew at approximately twice the rate of the total economy on a year-over-year basis in the fourth quarter.
The headline Consumer Price Index for All Urban Consumers (CPI) increased +0.4% in February, and core CPI, which excludes the volatile food and energy sectors, rose +0.2%. These monthly increases resulted in year-over-year figures of +2.4% and +2.7% for the headline and core CPIs, respectively. Over the next few months, the year-over-year CPI data are likely to decrease from February levels as a result of easy comparisons from the same period a year ago. However, in the second half of the year, the opposite effect will occur as even just moderate increases in the monthly inflation figures will boost the year-over-year measurements. Despite the intermediate volatility, we expect the average CPI figure for the year to fall in a range between +2.0% and +2.5%.
Although the dollar has been weak recently, it has stayed within its trading range of the past two years. We expect the dollar to remain in this range as pressure from the budget and trade deficits is, at least partially, offset by the relative attractiveness of U.S. equity and fixed-income markets.
The domestic fiscal environment has shown steady improvement and we continue to expect the deficit to be less than $200 billion for the current fiscal year. For the first five months of fiscal 2007 through February, the U.S. budget deficit stands at $162.2 billion, which is almost a $56 billion improvement over the $217.7 billion deficit for the comparable period last year. Receipt growth for the first half of fiscal year 2007 is estimated to have increased +8% versus the comparable period in fiscal 2006 due to higher tax payments, while outlays are estimated to have grown just +2%. Factoring in similarly positive Congressional Budget Office (CBO) estimates for March, estimates from CBO and the Office of Management and Budget (OMB) for the fiscal year 2007 budget deficit remain unchanged at $177 billion and $244 billion, respectively.
2
| | | | |
| | | 
| |
| | |
| | |
|
| |
| | | | |
Strategy Summary
We continue to expect that the U.S. economy will successfully transition to a more moderate growth environment, with real GDP growth averaging approximately +2.7% in 2007, as indications are that the key consumer spending sector remains intact. Elevated energy prices and a slowdown in the housing market are providing dual headwinds. Factors in the housing market, generally, and the subprime market, specifically, will continue to create pressures on consumer spending. However, we believe the bottoming phase in the housing market correction is underway and that the spillover effects from the difficulties in the subprime lending market will be manageable. While the price of crude oil rose in March, it remains well below the highs of last spring and summer and is close to flat with this period last year. Looking forward, inflation could provide a surprise on the upside later in the year as the easy comparisons from prior periods roll off. Nonetheless, we expect the CPI figure to average between +2.0% and +2.5% for the year.
The yield curve steepened in March, reflecting increased investor anticipation of a cut in the federal funds rate later this year in response to weaker economic data. The slowing housing market and problems within the subprime mortgage market have added to the list of justifications for the Fed to reduce its hawkish stance on interest rates. The Fed dropped its tightening bias at its meeting on March 21st, 2007 while maintaining an inflationary risk assessment. We expect further steepening in the yield curve later in the year as shorter and intermediate term rates decline while longer term yields should be relatively stable. However, longer term yields could shift slightly higher if an inflation surprise materializes and the Fed decides to maintain short term rates around current levels. Taxable bond portfolio durations are being maintained modestly longer than related benchmarks, with an emphasis on attractively yielding securities that will outperform in a steepening yield curve environment.
Municipal issuance volume remains high. New issuance volume in calendar 2007 is estimated to be around $375 billion, compared to $383 billion in 2006 and the record $408 billion in 2005. Approximately $80 billion of issuance is expected to come from voter-approved funding measures passed in November, of which $43 billion will come from California alone. Relative yield comparisons of short to intermediate duration municipals to similar duration Treasuries have cheapened as supply has kept shorter and intermediate municipal yields from declining. For example, the ratio of 10-year maturity municipal-to-Treasury yields increased from approximately 80% to 85% in March, returning to the higher end of its historical range in recent years. Longer term municipal bonds are fairly valued when compared to taxable bonds on a relative yield basis. We expect improving underwriting profitability for insurers to help demand for municipals remain robust, despite yields remaining near historic lows. Durations on our municipal portfolios are being extended closer to their benchmark levels in anticipation of the steepening yield curve environment we expect later in 2007. We remain focused on securities that offer attractive after-tax income, but are cautious as incremental yields provided by higher yielding sectors are historically narrow.
Fixed-income investments are an important component of a well-diversified, long term portfolio. We believe the Sit Bond Funds, with their dual objectives of high income and stability of principal, offer attractive risk/reward profiles to complement equity holdings. We appreciate your continued interest in Sit Mutual Funds and look forward to assisting you in achieving your long-term investment goals.
With best wishes,

Eugene C. Sit, CFA
Chairman and Chief Investment Officer
3
| | | | |
| Sit Mutual Funds | | | |
| One Year Ended March 31, 2007 | | | |
| | | | |
| Performance Summary - Bond Funds
| | | |
| | | | |
The Federal Reserve increased short term rates twice more on May 10th and June 29th, 2006, bringing the federal funds rate to 5.25%. The rate increase in June was the Fed’s 17th and latest move in the 425 basis points round of tightening that began two years earlier. The 3-month Treasury bill yield rose from 4.60% in March 2006 to 5.00% by June 2006 while Treasury bond yields rose approximately +0.30%, creating an almost flat yield curve. Since June, Treasury bill yields have been relatively stable while intermediate and longer term Treasury yields have fallen by approximately -0.60% and -0.35%, respectively, to create an inverted yield curve. Longer term bond yields ended the 12-month period little changed as 5-year and 30-year Treasury yields declined just - -0.27% and -0.04%, respectively, to 4.54% and 4.85% on March 31, 2007. The Fed has maintained a bias against inflationary risks since its May 2006 meeting.
Taxable bonds provided attractive returns for the 12-month period as short-term securities earned high current income and longer term securities benefited from price appreciation resulting from the decline in yields. The corporate sector outperformed due to its longer duration, despite recent widening in yield spreads as economic growth has moderated. The mortgage sector, with its yield advantage, also outperformed. The Treasury sector lagged due to its lower yields while the asset-backed sector lagged due to its shorter duration.
Shorter term municipals were fairly stable during the 12-month period while intermediate and longer term yields fell. Demand for municipals has remained robust despite a continued heavy pace of new issuance. The Bond Buyer 40-Bond Index yield rose to almost 5.0% in June and then declined to 4.61% to end the fiscal year-0.19% lower. As of March 31, 2007, longer term municipals were fairly valued compared to Treasury bonds on a relative yield basis while valuations on shorter and intermediate municipals were at the cheaper end of their recent historical range. The higher yielding industrial revenue and health care sectors outperformed during the period, while shorter duration municipal sectors lagged.
Fixed-income portfolios are being positioned to take advantage of the steepening yield curve environment we expect later in 2007, and we remain focused on securities that offer attractive incremental yield.
| | | | | | | | | | | |
SIT FIXED-INCOME FUNDS | | Three
Month* | | Six
Month* | |
U.S. Government Securities SNGVX | | | | 1.67 | | | | | 2.96 | | |
Lehman Inter. Govt. Bond Index | | | | 1.53 | | | | | 2.43 | | |
Tax-Free Income SNTIX | | | | 0.81 | | | | | 1.81 | | |
Lehman 5-Year Municipal Bond Index | | | | 0.93 | | | | | 1.56 | | |
Minnesota Tax-Free Income SMTFX | | | | 0.84 | | | | | 1.98 | | |
Lehman 5-Year Municipal Bond Index | | | | 0.93 | | | | | 1.56 | | |
Florida Tax-Free Income SFLIX | | | | 0.82 | | | | | 1.64 | | |
Lehman 5-Year Municipal Bond Index | | | | 0.93 | | | | | 1.56 | | |
| | | | | | | | | | | |
| | | | | | | | | | | |
SIT MONEY MARKET FUND | | | | | | | | | | | |
Money Market Fund(1) SNIXX | | | | 1.20 | | | | | 2.43 | | |
3-Month Treasury Bill | | | | 1.28 | | | | | 2.56 | | |
| | | | | | | | | | | |
*3- and 6-month returns not annualized. | | | | | | | | | | | |
| | | | | | | | | | | |
| | | | | |
| | 1997 | | 1998 | |
U.S. Government Securities SNGVX | | | | 8.19 | % | | | | 6.52 | % | |
Lehman Interm. Govt. Bond Index | | | | 7.72 | | | | | 8.49 | | |
Tax-Free Income SNTIX | | | | 9.87 | | | | | 6.29 | | |
Lehman 5-Year Municipal Bond Index | | | | 6.38 | | | | | 5.84 | | |
Minnesota Tax-Free Income SMTFX | | | | 8.19 | | | | | 6.14 | | |
Lehman 5-Year Municipal Bond Index | | | | 6.38 | | | | | 5.84 | | |
Florida Tax-Free Income SFLIX | | | | — | | | | | — | | |
Lehman 5-Year Municipal Bond Index | | | | — | | | | | — | | |
| | | | | | | | | | | |
Money Market Fund(1) SNIXX | | | | 5.22 | | | | | 5.17 | | |
3-Month Treasury Bill | | | | 5.32 | | | | | 5.01 | | |
Performance figures are historical and do not guarantee future results. Investment returns and principal value will vary, and you may have a gain or loss when you sell shares. Average annual returns include reinvestment of all dividends and capital gains. For any returns less than one year, the returns are cumulative. Investors should consider the investment objectives, risks, charges and expenses of the Funds carefully before investing. This and other information is contained in the Funds’ prospectus, which may be obtained by calling or visiting www.sitfunds.com. Please read the prospectus carefully before you invest or send money. An investment in the Money Market Fund is not insured or guaranteed by the Federal Deposit Insurance Corporation or any other government agency. Although the Money Market Fund seeks to preserve the value of your investment at $1.00 per share, it is possible to lose money by investing in the Fund.
| |
(1) | Converted from Sit Investment Reserve Fund to Sit Money Market Fund on 11/1/93 |
(2) | Based on the last 12 monthly distributions of net investment income and average NAV as of 3/31/07. |
(3) | For individuals in the 25%, 28%, 33% and 35% federal tax brackets, the federal tax equivalent yields are 5.72%, 5.96%, 6.40% and 6.60%, respectively. (Income subject to state tax, if any.) |
(4) | For Minnesota residents in the 25%, 28%, 33% and 35% federal tax brackets, the double exempt tax equivalent yields are 6.28%, 6.54%, 7.03% and 7.25%, respectively. (Assumes the maximum Minnesota tax bracket of 7.85%.) |
(5) | For individuals in the 25%, 28%, 33% and 35% federal tax brackets, the tax equivalent yields are 5.40%, 5.63%, 6.04% and 6.23%, respectively. (Income subject to state tax, if any.) |
(6) | The yield quotation more closely reflects the current earnings of the Money Market Fund than the total return quotation which refers to a specific past holding period. |
4
| | | | | | | | | | | | | | | | |
AVERAGE ANNUAL RETURNS FOR PERIODS ENDED MARCH 31, 2007 | |
| | |
One
Year | | Three
Year | | Five
Year | | Ten
Year | | Since
Inception | | Inception
Date | |
5.81 | | | 3.38 | | | 3.58 | | | 5.21 | | | 6.62 | | | 6/2/87 | |
5.75 | | | 2.39 | | | 4.29 | | | 5.64 | | | 6.77 | | | | |
4.00 | | | 3.30 | | | 3.93 | | | 4.52 | | | 5.85 | | | 9/29/88 | |
4.28 | | | 2.22 | | | 4.12 | | | 4.79 | | | 5.78 | | | | |
5.17 | | | 4.10 | | | 4.88 | | | 4.89 | | | 5.18 | | | 12/1/93 | |
4.28 | | | 2.22 | | | 4.12 | | | 4.79 | | | 4.77 | | | | |
3.97 | | | 3.12 | | | — | | | — | | | 3.21 | | | 12/31/03 | |
4.28 | | | 2.22 | | | — | | | — | | | 2.44 | | | | |
| | | | | | | | | | | | | | | | |
| | | | | | | | | | | | | | | | |
| | | | | | | | | | | | | | | | |
4.80 | | | 3.10 | | | 2.20 | | | 3.48 | | | 3.80 | | | 11/1/93 | |
5.18 | | | 3.56 | | | 2.63 | | | 3.70 | | | 4.05 | | | | |
| | | | |
AS OF 3/31/2007 |
| | | | |
30-Day
SEC Yield | | Distribution
Rate(2) |
4.98 | % | |
4.61
| % |
| | | | |
4.29 | (3) | | 3.93 | |
| | | | |
4.34 | (4) | | 4.17 | |
| | | | |
4.05 | (5) | | 3.60 | |
| | | | |
| | | | |
| | | | |
7-Day
Yield(6) | | 7-Day
Effective
Yield(6) |
4.97 | % | | 5.09 | % |
| | | | | | | | | | | | | | | | | | | | | | | | | |
| | | | | | | | | | | | | | | | | | | | | | | | | |
TOTAL RETURN BY CALENDAR YEAR |
1999 | | | 2000 | | | 2001 | | | 2002 | | | 2003 | | | 2004 | | | 2005 | | | 2006 | | | YTD 2007 |
1.37 | % | | 9.15 | % | | 8.56 | % | | 5.79 | % | | 1.19 | % | | 3.35 | % | | 2.49 | % | | 4.13 | % | | 1.67 | % |
0.49 | | | 10.47 | | | 8.42 | | | 9.64 | | | 2.29 | | | 2.33 | | | 1.68 | | | 3.84 | | | 1.53 | |
-4.01 | | | 8.32 | | | 5.84 | | | 5.69 | | | 2.87 | | | 3.96 | | | 3.30 | | | 3.54 | | | 0.81 | |
0.74 | | | 7.72 | | | 6.21 | | | 9.27 | | | 4.13 | | | 2.72 | | | 0.95 | | | 3.34 | | | 0.93 | |
-3.82 | | | 8.09 | | | 5.85 | | | 7.06 | | | 4.42 | | | 3.68 | | | 4.44 | | | 4.92 | | | 0.84 | |
0.74 | | | 7.72 | | | 6.21 | | | 9.27 | | | 4.13 | | | 2.72 | | | 0.95 | | | 3.34 | | | 0.93 | |
— | | | — | | | — | | | — | | | — | | | 2.58 | | | 3.22 | | | 3.82 | | | 0.82 | |
— | | | — | | | — | | | — | | | — | | | 2.72 | | | 0.95 | | | 3.34 | | | 0.93 | |
4.79 | | | 6.03 | | | 3.67 | | | 1.25 | | | 0.65 | | | 0.88 | | | 2.77 | | | 4.59 | | |
1.20
| |
4.88 | | | 6.16 | | | 3.50 | | | 1.67 | | | 1.03 | | | 1.41 | | | 3.26 | | | 5.00 | | | 1.28 | |
5
| | | | |
|
| Sit Mutual Funds | | | |
| | | | |
| Average Annual Total Returns for Periods Ended December 31, 2006
| | | |
| | | | |
The tables on the next page show the Funds’ average annual total returns (before and after taxes) and the change in value of a broad-based market index over various periods ended December 31, 2006. The index information is intended to permit you to compare each Fund’s performance to a broad measure of market performance. The after-tax returns are intended to show the impact of federal income taxes on an investment in a Fund. The highest individual federal marginal income tax rate in effect during the specified period is assumed, and the state and local tax impact is not reflected.
A Fund’s “Return After Taxes on Distributions” shows the effect of taxable distributions (dividends and capital gain distributions), but assumes that you still hold the Fund shares at the end of the period and so do not have any taxable gain or loss on your investment in the Fund.
A Fund’s “Return After Taxes on Distributions and Sale of Fund Shares” shows the effect of both taxable distributions and any taxable gain or loss that would be realized if the Fund shares were purchased at the beginning and sold at the end of the specified period.
The Funds’ past performance, before and after taxes, is not an indication of how the Funds will perform in the future. Your actual after-tax returns depend on your own tax situation and may differ from those shown. After-tax returns reflect past tax effects and are not predictive of future tax effects. After-tax returns are not relevant to investors who hold their Fund shares in a tax-deferred account (including a 401(k) or IRA account).
6
| | | |
Sit U.S. Government Securities Fund | 1 Year | 5 Years | 10 Years |
Return Before Taxes | 4.1% | 3.4% | 5.0% |
Return After Taxes on Distributions | 2.5% | 2.0% | 3.1% |
Return After Taxes on Distributions and Sale of Fund Shares | 2.6% | 2.1% | 3.1% |
Lehman Intermediate Government Bond Index | 3.8% | 3.9% | 5.5% |
| | | |
Sit Tax-Free Income Fund | 1 Year | 5 Years | 10 Years |
Return Before Taxes | 3.5% | 3.9% | 4.5% |
Return After Taxes on Distributions | 3.5% | 3.9% | 4.5% |
Return After Taxes on Distributions and Sale of Fund Shares | 3.6% | 3.9% | 4.5% |
Lehman 5-Year Municipal Bond Index | 3.3% | 4.1% | 4.7% |
| | | |
Sit Minnesota Tax-Free Income Fund | 1 Year | 5 Years | 10 Years |
Return Before Taxes | 4.9% | 4.9% | 4.8% |
Return After Taxes on Distributions | 4.9% | 4.9% | 4.8% |
Return After Taxes on Distributions and Sale of Fund Shares | 4.8% | 4.8% | 4.8% |
Lehman 5-Year Municipal Bond Index | 3.3% | 4.1% | 4.7% |
| | | |
Sit Florida Tax-Free Income Fund | 1 Year | 5 Years | Since Inception* |
Return Before Taxes | 3.8% | n/a | 3.2% |
Return After Taxes on Distributions | 3.8% | n/a | 3.2% |
Return After Taxes on Distributions and Sale of Fund Shares | 3.8% | n/a | 3.2% |
Lehman 5-Year Municipal Bond Index | 3.3% | n/a | 2.3% |
*Inception date 12/31/03
7
| | | | |
| Sit Money Market Fund | | | |
| One Year Ended March 31, 2007 | | | |
| | | | |
| Michael C. Brilley, Senior Portfolio Manager
Mark H. Book, CFA, Portfolio Manager | | | |
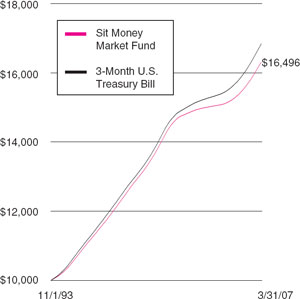
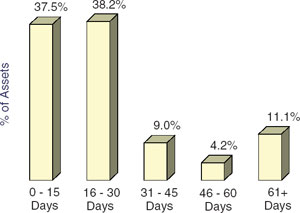
The Sit Money Market Fund returned +4.80% net of fees for the twelve months ended March 31, 2007 compared to +5.18% for the 3-month U.S. Treasury bill. As of March 31, the Fund’s 7-day compound yield was 4.97% and its average maturity was 25 days.
The Fed raised the federal funds rate target to 5.25% in June 2006, which was its latest increase in the tightening cycle that began two years earlier in June 2004. Short-term yields rose during the 12-month period while yields on intermediate and longer maturities declined. Yields on intermediate maturities fell the most, creating an inverted yield curve at the front end of the maturity spectrum and an upward sloping curve at the long end. Because investors in longer maturity Treasuries believe the Fed will be successful in its efforts to contain inflation, they have been willing to buy intermediate and long maturity Treasuries at lower yields. The steepening in the yield curve reflects investor anticipation of a cut in the federal funds rate later in 2007, in response to recent weaker economic data and the Federal Reserve’s decision to drop its tightening bias at its most recent FOMC meeting on March 21, 2007. While market levels currently suggest that the Fed will begin reducing rates in the third quarter of 2007, we believe that easing may not occur that soon, as the Fed is still focused on containing inflation. It is unclear when the Fed will begin easing monetary policy but action will continue to be largely dependent on various metrics including the rate of inflation and economic growth.
The Fund has maintained its average maturity near the short end of its customary 20 to 40 day range as the 3-month Treasury bill yield increased 43 basis points over the past twelve months. The Fund has begun to extend its average maturity as the current cycle of Fed tightening may be complete. Corporate credit quality remains strong in general, but some sectors have slowed along with the economy. The Fund has no direct exposure to sub-prime mortgages, which has become a concern in the Corporate market. We continue to focus on issuers with top-tier credit quality.
INVESTMENT OBJECTIVE AND STRATEGY |
The objective of the Fund is to achieve maximum current income to the extent consistent with the preservation of capital and maintenance of liquidity. The Fund pursues this objective by investing in short-term debt instruments which mature in 397 days or less and by maintaining a dollar-weighted portfolio maturity of 90 days or less.
An investment in the Fund is neither insured nor guaranteed by the U.S. Government and there can be no assurance that the Fund will be able to maintain a stable net asset value of $1.00 per share.
| | |
Net Asset Value 3/31/07: | | $1.00 Per Share |
3/31/06: | | $1.00 Per Share |
| | |
Total Net Assets: | | $52.5 Million |
PORTFOLIO STRUCTURE
(% OF TOTAL NET ASSETS) |
8
| | | | |
| | |
| |
| | |
| | |
|
| |
| | | | |
| | | | | | | | |
AVERAGE ANNUAL TOTAL RETURNS* | |
| | | | | | | |
| | Sit Money
Market Fund | | 3-Month
U.S.
Treasury Bill | | Lipper
Money
Market | |
| | | | | | | | | | |
3 Month** | | | 1.20 | % | | | 1.28 | % | | | 1.17 | % |
6 Month** | | | 2.43 | | | | 2.56 | | | | N/A | |
1 Year | | | 4.80 | | | | 5.18 | | | | 4.72 | |
5 Years | | | 2.20 | | | | 2.63 | | | | 2.13 | |
10 Years | | | 3.48 | | | | 3.70 | | | | 3.44 | |
Inception | | | 3.80 | | | | 4.05 | | | | 3.75 | |
(11/1/93) | | | | | | | | | | | | |
| | | | | | | | | | | | |
CUMULATIVE TOTAL RETURNS* |
| | | | | | | | | | | | |
| | Sit Money
Market Fund | | 3-Month
U.S.
Treasury Bill | | Lipper
Money
Market |
| | | | | | | | | | | | |
1 Year | | | 4.80 | % | | | 5.18 | % | | | 4.72 | % |
5 Year | | | 11.49 | | | | 13.83 | | | | 11.10 | |
10 Year | | | 40.83 | | | | 43.83 | | | | 40.24 | |
Inception | | | 64.96 | | | | 70.45 | | | | 63.91 | |
(11/1/93) | | | | | | | | | | | | |
| | | | | | | | | | | | |
*As of 3/31/07 | **Not annualized. |
| |
Performance is historical and assumes reinvestment of all dividends and capital gains. Money Market funds are neither insured nor guaranteed by the U.S. Government. There is no assurance that a fund will maintain a $1 share value. Yield fluctuates. Past performance is not a guarantee of future results. Management fees and administrative expenses are included in the Fund’s performance; however, fees and expenses are not incorporated in the 3-Month U.S. Treasury Bill. The Lipper returns are obtained from Lipper Analytical Services, Inc., a large independent evaluator of mutual funds.
The sum of $10,000 invested at inception (11/1/93) and held until 3/31/07 would have grown to $16,496 in the Fund or $17,045 in the 3-Month U.S. Treasury Bill assuming reinvestment of all dividends and capital gains.
SIT MONEY MARKET MATURITY RANGES |
9
| | | | |
| Sit Money Market Fund | | | |
| March 31, 2007 | | | |
| | | | |
| Portfolio of Investments | | | |
| | | | |
| | | | | |
Quantity ($) | Name of Issuer | | Market Value ($)(1) | |
| | | | | |
| | | | |
Commercial Paper (92.7%) (2) | | | |
| | | |
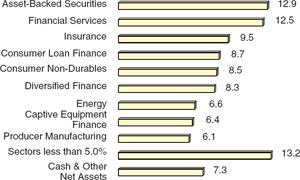
Asset-Backed (12.9%) | | | |
| | Daimler-Chrysler Auto Conduit: | | | |
700,000 | | 5.25%, 6/1/07 | | 693,695 | |
1,500,000 | | 5.25%, 6/1/07 | | 1,486,438 | |
1,000,000 | | FCAR Owner Trust Series I, | | | |
| | 5.25%, 4/24/07 | | 996,500 | |
1,300,000 | | FCAR Owner Trust Series II, | | | |
| | 5.27%, 4/5/07 | | 1,299,048 | |
2,300,000 | | New Center Asset Trust, | | | |
| | 5.23%, 4/27/07 | | 2,290,978 | |
| | | | | |
| | | | 6,766,659 | |
| | | | | |
| | | | | |
Captive Equipment Finance (6.4%) | | | |
1,200,000 | | Caterpillar Financial Services, | | | |
| | 5.24%, 4/2/07 | | 1,199,651 | |
| | Pitney Bowes Inc.: | | | |
1,175,000 | | 5.22%, 4/2/07 | | 1,174,659 | |
1,000,000 | | 5.25%, 4/17/07 | | 997,521 | |
| | | | | |
| | | | 3,371,831 | |
| | | | | |
Consumer Durables (4.8%) | | | |
2,500,000 | | American Honda Finance, | | | |
| | 5.23%, 4/16/07 | | 2,494,189 | |
| | | | | |
| | | | | |
Consumer Loan Finance (8.7%) | | | |
| | American Express Credit Corp.: | | | |
1,000,000 | | 5.24%, 4/3/07 | | 999,563 | |
1,300,000 | | 5.22%, 4/4/07 | | 1,299,246 | |
2,300,000 | | American General Financial Corp., | | | |
| | 5.23%, 4/23/07 | | 2,292,315 | |
| | | | | |
| | | | 4,591,124 | |
| | | | | |
Consumer Non-Durables (8.5%) | | | |
2,300,000 | | Coca Cola Company, | | | |
| | 5.20%, 4/10/07 | | 2,296,678 | |
| | Coca Cola Enterprises: | | | |
1,200,000 | | 5.26%, 4/13/07(5) | | 1,197,721 | |
1,000,000 | | 5.26%, 5/9/07(5) | | 994,302 | |
| | | | | |
| | | | 4,488,701 | |
| | | | | |
Diversified Finance (8.3%) | | | |
| | GE Capital Corp.: | | | |
1,300,000 | | 5.23%, 4/9/07 | | 1,298,300 | |
900,000 | | 5.23%, 6/8/07 | | 890,978 | |
2,200,000 | | GE Capital Services, | | | |
| | 5.23%, 5/29/07 | | 2,181,143 | |
| | | | | |
| | | | 4,370,421 | |
| | | | | |
Electronic Technology (4.2%) | | | |
| | IBM Corp.: | | | |
1,300,000 | | 5.20%, 4/17/07 | | 1,296,808 | |
900,000 | | 5.22%, 5/8/07 | | 895,041 | |
| | | | | |
| | | | 2,191,849 | |
| | | | | |
| | | | |
Quantity ($) | Name of Issuer | | Market Value ($)(1) |
| | | | | | |
| | | | | | |
Energy (6.6%) | | | | |
1,470,000 | | BP Capital Markets, | | | | |
| | 5.40%, 4/2/07 | | | 1,469,559 | |
2,000,000 | | Chevron Funding Corp., | | | | |
| | 5.23%, 5/4/07 | | | 1,990,121 | |
| | | | | | |
| | | | | 3,459,680 | |
| | | | | | |
Financial Services (12.5%) | | | | |
2,300,000 | | Citigroup Funding, Inc., | | | | |
| | 5.24%, 4/20/07 | | | 2,293,304 | |
2,300,000 | | Deutsche Bank Financial, | | | | |
| | 5.26%, 4/12/07 | | | 2,295,967 | |
| | UBS Finance Corp.: | | | | |
1,400,000 | | 5.25%, 4/19/07 | | | 1,396,121 | |
600,000 | | 5.23%, 4/19/07 | | | 598,337 | |
| | | | | | |
| | | | | 6,583,729 | |
| | | | | | |
Insurance (9.5%) | | | | |
2,200,000 | | AIG Funding, Inc., | | | | |
| | 5.24%, 4/18/07 | | | 2,194,236 | |
2,800,000 | | American Family Financial, | | | | |
| | 5.21%, 6/15/07 | | | 2,769,203 | |
| | | | | | |
| | | | | 4,963,439 | |
| | | | | | |
Producer Manufacturing (6.1%) | | | | |
1,000,000 | | Caterpillar, Inc, | | | | |
| | 5.30%, 4/9/07 | | | 998,675 | |
| | Siemens Capital: | | | | |
1,282,000 | | 5.24%, 4/9/07 | | | 1,280,321 | |
900,000 | | 5.25%, 4/11/07 | | | 898,556 | |
| | | | | | |
| | | | | 3,177,552 | |
| | | | | | |
Retail Trade (4.2%) | | | | |
| | Wal-Mart Stores Inc.: | | | | |
775,000 | | 5.20%, 4/24/07(5) | | | 772,313 | |
562,000 | | 5.20%, 4/24/07(5) | | | 560,052 | |
900,000 | | 5.21%, 5/8/07(5) | | | 895,051 | |
| | | | | | |
| | | | | 2,227,416 | |
| | | | | | |
| | | | | | |
Total Commercial Paper | | 48,686,590 | |
| | | | | | |
(cost: $48,686,590) | | | |
| | | | | | |
U.S. Government Securities (7.7%) (2) | | | | |
2,000,000 | | FHLB Discount Note, 5.16%, 4/25/07 | | | 1,992,833 | |
1,706,000 | | FHLMC Discount Note, 5.15%, 4/3/07 | | | 1,705,268 | |
350,000 | | FHLMC Discount Note, 5.15%, 4/5/07 | | | 349,750 | |
| | | | | | |
| | | | | 4,047,851 | |
| | | | | | |
| | | | | | |
(cost: $4,047,851) | | | | |
| | | | | | |
Total investments in securities | | | |
(cost: $52,734,441) (6) | $ | 52,734,441 | |
| | | | | | |
| |
10 | See accompanying notes to portfolios of investments on page 62. |
This page has been left blank intentionally.
11
| | | | |
| Sit U.S. Government Securities Fund | | | |
| One Year Ended March 31, 2007 | | | |
| | | | |
| Senior Portfolio Managers, Michael C. Brilley and Bryce A. Doty, CFA
Portfolio Manager, Mark H. Book, CFA
| | | |
| | | | |
The Sit U.S. Government Securities Fund returned +5.81% during the fiscal year ending March 31, 2007, compared to the return of the Lehman Intermediate Government Bond Index of +5.75%. The Fund’s 30-day SEC yield was 4.98% and its 12-month distribution rate was 4.61%.
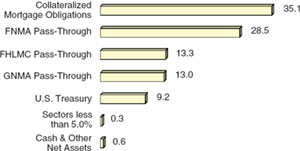
The return for the Fund was most positively influenced by its holdings in collateralized mortgage obligations, which exceeded the returns of the Lehman Intermediate Government Bond Index due to their income advantage. The Fund’s weighting in U.S. Treasury obligations detracted from performance, as these securities did not experience price appreciation in line with the bond market as a whole.
The last twelve months experienced two raises by the Federal Reserve in its target short-term lending rate to a level of 5.25%, each occurring in the first two meetings of the fiscal year, May 10th and June 29th. Mid-year 2006, the Federal Reserve ended its consistent tightening pace as inflation came to a more measured level. The Federal Reserve is still mindful of inflation risk, while monitoring the potential for an economic slowdown. We believe a decrease in the Federal Reserve’s short term borrowing rate sometime in the second half of the year is likely, as concern of slower economic growth builds. However, we believe that fears of higher inflation will potentially result in higher yields and price depreciation for longer maturity fixed income securities. As such, we expect the price stability of the Fund’s high coupon mortgage securities, coupled with their high level of income, to drive the Fund’s return, which has consistently been the case since the Fund’s inception.
INVESTMENT OBJECTIVE AND STRATEGY |
The objective of the U.S. Government Securities Fund is to provide high current income and safety of principal, which it seeks to attain by investing solely in debt obligations issues, guaranteed or insured by the U.S. government or its agencies or its instrumentalities.
Agency mortgage securities and U.S. Treasury securities will be the principal holdings in the Fund. The mortgage securities that the Fund will purchase consist of pass-through securities including those issued by Government National Mortgage Association (GNMA), Federal National Mortgage Asociation (FNMA), and Federal Home Loan Mortgage Corporation (FHLMC).
| | |
Net Asset Value 3/31/07: | | $10.56 Per Share |
3/31/06: | | $10.45 Per Share |
Total Net Assets: | | $198.4 Million |
30-day SEC Yield: | | 4.98% |
12-Month Distribution Rate: | | 4.61% |
Average Maturity: | | 21.8 Years |
Effective Duration: | | 3.0 Years(1) |
(1) See next page
PORTFOLIO STRUCTURE
(% OF TOTAL NET ASSETS) |
Portfolio Structure by Sector
12
| | | | |
| | |
| |
| | |
| | |
|
| |
| | | | |
| | | | | | | | |
AVERAGE ANNUAL TOTAL RETURNS* | |
| | | | | | | |
| | Sit
U.S. Gov’t
Securities
Fund | | Lehman
Inter. Gov’t
Bond Index | | Lipper
U.S. Gov’t
Fund Index | |
3 Month** | | | 1.67 | % | | | 1.53 | % | | | 1.38 | % |
6 Month** | | | 2.96 | | | | 2.43 | | | | n/a | |
1 Year | | | 5.81 | | | | 5.75 | | | | 5.66 | |
5 Years | | | 3.58 | | | | 4.29 | | | | 4.47 | |
10 Years | | | 5.21 | | | | 5.64 | | | | 5.52 | |
Inception | | | 6.62 | | | | 6.77 | | | | 6.36 | |
(6/2/87) | | | | | | | | | | | | |
| | | | | | | | | | | | |
CUMULATIVE TOTAL RETURNS* |
| | | | | | | | | | | | |
| | Sit
U.S. Gov’t
Securities
Fund | | Lehman
Inter. Gov’t
Bond Index | | Lipper
U.S. Gov’t
Fund Index |
1 Year | | | 5.81 | % | | | 5.75 | % | | | 5.66 | % |
5 Year | | | 19.24 | | | | 23.36 | | | | 24.42 | |
10 Year | | | 66.24 | | | | 73.09 | | | | 71.14 | |
Inception | | | 256.56 | | | | 266.64 | | | | 239.85 | |
(6/2/87) | | | | | | | | | | | | |
| | | | | | | | | | | | |
*As of 3/31/07.
| **Not annualized.
|
| |
Performance figures are historical and do not guarantee future results. Investment returns and principal value will vary, and you may have a gain or loss when you sell shares. Average annual total returns include changes in share price as well as reinvestment of all dividends and capital gains. Management fees and administrative expenses are included in the Fund’s performance; however, fees and expenses are not incorporated in the Lehman Intermediate Government Bond Index. The Lipper returns are obtained from Lipper Analytical Services, Inc., a large independent evaluator of mutual funds.
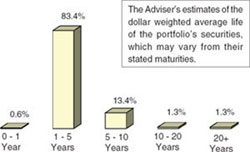
(1) Effective duration is a measure which reflects estimated price sensitivity to a given change in interest rates. For example, for an interest rate change of 1.0%, a portfolio with a duration of 5 years would be expected to experience a price change of 5%. Effective duration is based on current interest rates and the Adviser’s assumptions regarding the expected average life of individual securities held in the portfolio.
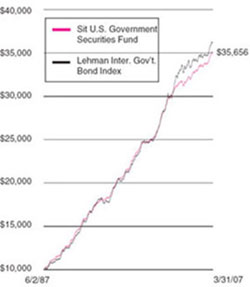
The sum of $10,000 invested at inception (6/2/87) and held until 3/31/07 would have grown to $35,656 in the Fund or $36,664 in the Lehman Intermediate Government Bond Index assuming reinvestment of all dividends and capital gains.
ESTIMATED AVERAGE LIFE PROFILE |
13
| | | | |
| Sit U.S. Government Securities Fund
March 31, 2007 | | | |
| | | | |
| Portfolio of Investments
| | | |
| | | | |
| | | | | | | |
Mortgage Pass-Through Securities (54.8%) (2) | |
Federal Home Loan Mortgage Corporation (13.3%): | |
|
Par ($) | | Coupon | | Maturity | | Market Value ($)(1) | |
| | | | | | | | |
49,067 | | 5.50% | | 8/1/17 | | 49,714 | |
215,209 | | 6.38% | | 12/1/26 | | 218,903 | |
76,705 | | 6.38% | | 8/1/27 | | 78,852 | |
120,448 | | 6.38% | | 12/1/27 | | 123,819 | |
716,104 | | 6.50% | | 8/1/29 | | 730,284 | |
86,532 | | 7.00% | | 6/1/19 | | 90,030 | |
1,291,476 | | 7.00% | | 10/1/31 | | 1,327,959 | |
302,211 | | 7.38% | | 12/17/24 | | 312,999 | |
31,993 | | 7.50% | | 2/1/17 | | 33,636 | |
152,221 | | 7.50% | | 1/1/23 | | 159,324 | |
153,518 | | 7.50% | | 8/1/23 | | 160,453 | |
528,320 | | 7.50% | | 1/1/27 | | 553,381 | |
807,403 | | 7.50% | | 7/1/29 | | 836,260 | |
62,881 | | 7.50% | | 1/1/30 | | 65,775 | |
108,899 | | 7.50% | | 9/1/30 | | 114,200 | |
1,004,654 | | 7.50% | | 1/1/31 | | 1,043,542 | |
1,261,305 | | 7.50% | | 10/1/31 | | 1,326,131 | |
2,310,626 | | 7.50% | | 4/1/32 | | 2,393,207 | |
1,557,914 | | 7.50% | | 7/1/32 | | 1,628,589 | |
613,789 | | 7.50% | | 6/1/35 | | 643,410 | |
68,541 | | 7.95% | | 10/1/25 | | 71,780 | |
73,019 | | 7.95% | | 10/1/25 | | 77,003 | |
51,753 | | 7.95% | | 11/1/25 | | 54,577 | |
22,149 | | 8.00% | | 5/1/17 | | 23,011 | |
69,905 | | 8.00% | | 1/1/21 | | 73,014 | |
430,893 | | 8.00% | | 12/1/23 | | 449,417 | |
267,411 | | 8.00% | | 9/15/24 | | 281,860 | |
41,650 | | 8.00% | | 12/1/26 | | 44,095 | |
143,956 | | 8.00% | | 6/1/30 | | 152,176 | |
9,595 | | 8.25% | | 12/1/08 | | 9,629 | |
48,339 | | 8.25% | | 12/1/17 | | 51,147 | |
5,092 | | 8.50% | | 1/1/17 | | 5,419 | |
25,388 | | 8.50% | | 2/1/17 | | 26,950 | |
27,710 | | 8.50% | | 3/1/17 | | 29,486 | |
75,882 | | 8.50% | | 4/1/17 | | 80,315 | |
77,077 | | 8.50% | | 5/1/17 | | 82,018 | |
25,689 | | 8.50% | | 5/1/17 | | 27,336 | |
72,045 | | 8.50% | | 10/1/19 | | 77,108 | |
39,172 | | 8.50% | | 7/1/21 | | 41,924 | |
410,489 | | 8.50% | | 12/1/29 | | 440,070 | |
485,271 | | 8.50% | | 2/1/31 | | 520,241 | |
22,526 | | 8.75% | | 1/1/17 | | 23,535 | |
6,762 | | 9.00% | | 5/1/09 | | 6,859 | |
3,781 | | 9.00% | | 6/1/09 | | 4,076 | |
11,059 | | 9.00% | | 7/1/09 | | 11,217 | |
12,541 | | 9.00% | | 7/1/09 | | 12,784 | |
| | | | | | | |
Par ($) | | Coupon | | Maturity | | Market Value ($)(1) | |
| | | | | | | | |
|
1,093 | | 9.00% | | 8/1/09 | | 1,114 | |
24,161 | | 9.00% | | 12/1/09 | | 24,507 | |
4,475 | | 9.00% | | 9/1/10 | | 4,501 | |
12,437 | | 9.00% | | 10/1/13 | | 13,201 | |
146,480 | | 9.00% | | 11/1/15 | | 158,920 | |
8,779 | | 9.00% | | 5/1/16 | | 9,391 | |
177,031 | | 9.00% | | 5/1/16 | | 192,065 | |
90,842 | | 9.00% | | 7/1/16 | | 97,173 | |
50,545 | | 9.00% | | 10/1/16 | | 53,566 | |
14,277 | | 9.00% | | 1/1/17 | | 15,238 | |
3,161 | | 9.00% | | 1/1/17 | | 3,381 | |
31,854 | | 9.00% | | 2/1/17 | | 32,697 | |
89,269 | | 9.00% | | 2/1/17 | | 95,490 | |
31,391 | | 9.00% | | 4/1/17 | | 32,064 | |
647,509 | | 9.00% | | 4/1/17 | | 691,334 | |
25,536 | | 9.00% | | 6/1/17 | | 27,270 | |
33,159 | | 9.00% | | 6/1/17 | | 35,556 | |
85,947 | | 9.00% | | 10/1/17 | | 92,158 | |
45,704 | | 9.00% | | 6/1/18 | | 48,512 | |
184,199 | | 9.00% | | 6/1/19 | | 196,666 | |
131,796 | | 9.00% | | 6/1/19 | | 140,716 | |
90,499 | | 9.00% | | 10/1/19 | | 97,401 | |
277,159 | | 9.00% | | 10/1/19 | | 297,189 | |
234,221 | | 9.00% | | 6/1/21 | | 243,608 | |
20,522 | | 9.00% | | 7/1/21 | | 22,171 | |
28,941 | | 9.00% | | 10/1/21 | | 30,176 | |
233,394 | | 9.00% | | 11/1/25 | | 252,786 | |
3,002,334 | | 9.00% | | 5/1/31 | | 3,243,641 | |
2,775 | | 9.25% | | 7/1/08 | | 2,836 | |
8,153 | | 9.25% | | 8/1/08 | | 8,334 | |
2,578 | | 9.25% | | 8/1/09 | | 2,621 | |
18,063 | | 9.25% | | 7/1/10 | | 18,482 | |
13,022 | | 9.25% | | 3/1/11 | | 13,107 | |
23,279 | | 9.25% | | 6/1/16 | | 25,080 | |
18,934 | | 9.25% | | 3/1/17 | | 20,399 | |
235,923 | | 9.25% | | 2/1/18 | | 247,901 | |
6,481 | | 9.25% | | 1/1/19 | | 6,523 | |
82,123 | | 9.25% | | 3/1/19 | | 86,884 | |
96,538 | | 9.25% | | 3/1/19 | | 99,909 | |
12,414 | | 9.50% | | 10/1/08 | | 12,708 | |
29,842 | | 9.50% | | 2/1/10 | | 30,501 | |
10,198 | | 9.50% | | 5/1/10 | | 10,609 | |
7,188 | | 9.50% | | 6/1/10 | | 7,346 | |
5,229 | | 9.50% | | 1/1/11 | | 5,514 | |
11,769 | | 9.50% | | 6/1/16 | | 12,748 | |
5,442 | | 9.50% | | 7/1/16 | | 5,895 | |
31,179 | | 9.50% | | 10/1/16 | | 33,775 | |
5,962 | | 9.50% | | 6/1/17 | | 6,479 | |
46,171 | | 9.50% | | 4/1/18 | | 50,309 | |
14
| | | | |
| | |
| |
| | |
| | |
|
| |
| | | | |
| | | | | | | |
Par ($) | | Coupon | | Maturity | | Market Value ($)(1) | |
| | | | | | | | |
|
6,062 | | 9.50% | | 10/1/18 | | 6,588 | |
256,507 | | 9.50% | | 6/17/19 | | 276,905 | |
1,116,650 | | 9.50% | | 12/17/21 | | 1,210,629 | |
15,451 | | 9.75% | | 12/1/08 | | 15,797 | |
4,048 | | 9.75% | | 12/1/08 | | 4,139 | |
18,176 | | 9.75% | | 11/1/09 | | 18,583 | |
9,034 | | 9.75% | | 6/1/11 | | 9,236 | |
159,879 | | 9.75% | | 12/1/16 | | 170,395 | |
40,524 | | 9.75% | | 6/1/17 | | 44,417 | |
145,456 | | 9.75% | | 12/1/17 | | 158,491 | |
30,341 | | 10.00% | | 11/1/10 | | 31,068 | |
34,117 | | 10.00% | | 11/1/11 | | 37,826 | |
169,314 | | 10.00% | | 9/1/20 | | 187,390 | |
1,065,875 | | 10.00% | | 3/15/25 | | 1,173,907 | |
12,396 | | 10.25% | | 6/1/10 | | 13,006 | |
32,188 | | 10.25% | | 2/1/17 | | 33,773 | |
43,791 | | 10.29% | | 9/1/16 | | 46,675 | |
54,015 | | 10.50% | | 10/1/13 | | 58,916 | |
73,804 | | 10.50% | | 5/1/14 | | 77,625 | |
25,688 | | 10.50% | | 9/1/15 | | 28,338 | |
17,437 | | 10.50% | | 1/1/19 | | 19,495 | |
298,524 | | 10.50% | | 6/1/19 | | 330,363 | |
6,434 | | 11.00% | | 12/1/11 | | 7,025 | |
22,675 | | 11.00% | | 6/1/15 | | 24,799 | |
12,689 | | 11.00% | | 2/1/16 | | 13,887 | |
12,127 | | 11.00% | | 5/1/19 | | 13,076 | |
14,549 | | 11.00% | | 7/1/19 | | 16,078 | |
731,189 | | 11.00% | | 8/15/20 | | 805,156 | |
6,464 | | 11.25% | | 10/1/09 | | 6,849 | |
17,122 | | 11.25% | | 8/1/11 | | 18,898 | |
19,123 | | 13.00% | | 5/1/17 | | 21,665 | |
| | | | | | | |
| | | | | | 26,308,962 | |
| | | | | | | |
| | | | | | | |
Federal National Mortgage Association (28.5%): | |
| | | | | | | |
Par ($) | | Coupon | | Maturity | | Market Value ($)(1) | |
| | | | | | | | |
197,759 | | 3.66% | | 8/1/33 | | 194,162 | |
282,401 | | 3.70% | | 8/1/33 | | 277,867 | |
76,769 | | 5.76% | | 3/1/33 | | 77,033 | |
26,518 | | 6.49% | | 3/1/19 | | 26,730 | |
88,018 | | 6.49% | | 2/1/32 | | 90,472 | |
72,321 | | 6.49% | | 4/1/32 | | 74,337 | |
55,757 | | 6.91% | | 11/1/26 | | 58,255 | |
186,614 | | 6.91% | | 8/1/27 | | 194,977 | |
322,624 | | 6.95% | | 8/1/21 | | 332,126 | |
14,190 | | 7.00% | | 2/1/17 | | 14,794 | |
24,115 | | 7.00% | | 4/1/27 | | 25,318 | |
553,460 | | 7.00% | | 1/1/29 | | 570,883 | |
27,161 | | 7.00% | | 10/1/29 | | 28,308 | |
1,882,962 | | 7.00% | | 11/1/29 | | 1,962,496 | |
274,094 | | 7.00% | | 5/1/31 | | 285,650 | |
| | | | | | | |
Par ($) | | Coupon | | Maturity | | Market Value ($)(1) | |
| | | | | | | | |
|
49,003 | | 7.00% | | 9/1/31 | | 51,114 | |
383,182 | | 7.00% | | 2/1/32 | | 395,245 | |
353,836 | | 7.00% | | 6/1/32 | | 371,284 | |
45,141 | | 7.00% | | 7/1/32 | | 47,041 | |
624,615 | | 7.00% | | 9/1/32 | | 650,897 | |
489,642 | | 7.00% | | 4/1/34 | | 505,056 | |
1,313,829 | | 7.45% | | 6/1/16 | | 1,417,833 | |
345,269 | | 7.50% | | 11/1/12 | | 348,470 | |
781,563 | | 7.50% | | 6/1/22 | | 818,055 | |
873,600 | | 7.50% | | 8/1/22 | | 918,794 | |
38,145 | | 7.50% | | 7/1/23 | | 39,948 | |
17,987 | | 7.50% | | 7/1/23 | | 18,852 | |
1,022,524 | | 7.50% | | 5/1/24 | | 1,059,824 | |
48,046 | | 7.50% | | 9/1/27 | | 50,860 | |
740,224 | | 7.50% | | 5/1/29 | | 767,227 | |
63,017 | | 7.50% | | 11/1/29 | | 66,092 | |
804,487 | | 7.50% | | 1/1/31 | | 843,289 | |
180,378 | | 7.50% | | 6/1/31 | | 185,905 | |
232,616 | | 7.50% | | 3/1/32 | | 242,827 | |
78,198 | | 7.50% | | 8/1/32 | | 80,647 | |
138,011 | | 7.50% | | 9/1/32 | | 142,315 | |
328,215 | | 7.50% | | 12/1/34 | | 340,188 | |
1,550,573 | | 7.50% | | 7/1/36 | | 1,607,163 | |
920,171 | | 7.50% | | 8/1/36 | | 953,754 | |
1,856,164 | | 7.50% | | 12/1/36 | | 1,923,908 | |
644,288 | | 7.95% | | 9/15/20 | | 679,623 | |
18,660 | | 8.00% | | 8/1/09 | | 18,955 | |
219,589 | | 8.00% | | 4/1/16 | | 231,085 | |
523,425 | | 8.00% | | 7/1/21 | | 555,309 | |
150,908 | | 8.00% | | 1/1/22 | | 159,092 | |
97,475 | | 8.00% | | 5/1/23 | | 102,574 | |
75,085 | | 8.00% | | 9/1/23 | | 79,214 | |
841,909 | | 8.00% | | 7/1/24 | | 891,251 | |
378,630 | | 8.00% | | 9/1/27 | | 401,338 | |
596,387 | | 8.00% | | 5/1/29 | | 628,579 | |
363,919 | | 8.00% | | 2/1/31 | | 383,563 | |
423,386 | | 8.00% | | 12/1/31 | | 446,240 | |
744,380 | | 8.00% | | 9/1/32 | | 788,544 | |
971,086 | | 8.00% | | 5/1/36 | | 1,023,457 | |
669,513 | | 8.00% | | 6/1/36 | | 705,646 | |
313,445 | | 8.00% | | 7/1/36 | | 330,349 | |
49,183 | | 8.25% | | 4/1/22 | | 51,454 | |
578,945 | | 8.33% | | 7/15/20 | | 628,782 | |
287,046 | | 8.38% | | 7/20/28 | | 307,998 | |
2,643,911 | | 8.45% | | 5/31/35 | | 2,847,894 | |
38,545 | | 8.50% | | 11/1/10 | | 39,518 | |
201,373 | | 8.50% | | 9/1/13 | | 203,662 | |
489,698 | | 8.50% | | 2/1/16 | | 523,016 | |
64,832 | | 8.50% | | 6/1/17 | | 65,679 | |
| |
See accompanying notes to portfolios of investments on page 62. | 15 |
| | | | |
| Sit U.S. Government Securities Fund
March 31, 2007 | | | |
| | | | |
| Portfolio of Investments
| | | |
| | | | |
| | | | | | | |
Par ($) | | Coupon | | Maturity | | Market Value ($)(1) | |
| | | | | | | | |
|
20,757 | | 8.50% | | 9/1/17 | | 21,758 | |
95,837 | | 8.50% | | 8/1/18 | | 102,201 | |
27,287 | | 8.50% | | 7/1/22 | | 29,355 | |
18,067 | | 8.50% | | 5/1/24 | | 19,449 | |
150,574 | | 8.50% | | 7/1/26 | | 160,602 | |
797,577 | | 8.50% | | 11/1/26 | | 857,229 | |
400,082 | | 8.50% | | 11/1/28 | | 430,319 | |
821,054 | | 8.50% | | 12/1/28 | | 882,462 | |
271,344 | | 8.50% | | 1/1/30 | | 290,765 | |
64,142 | | 8.50% | | 11/1/30 | | 68,700 | |
13,727 | | 8.50% | | 1/1/31 | | 14,702 | |
295,184 | | 8.52% | | 9/15/30 | | 315,635 | |
602,718 | | 8.71% | | 7/20/30 | | 647,989 | |
112,910 | | 8.87% | | 12/15/25 | | 125,305 | |
51,012 | | 9.00% | | 1/1/09 | | 52,095 | |
11,092 | | 9.00% | | 5/1/09 | | 11,306 | |
22,300 | | 9.00% | | 5/1/09 | | 22,505 | |
18,739 | | 9.00% | | 5/1/09 | | 19,101 | |
39,300 | | 9.00% | | 3/1/11 | | 40,611 | |
26,244 | | 9.00% | | 9/1/17 | | 28,192 | |
39,176 | | 9.00% | | 2/1/18 | | 42,084 | |
17,355 | | 9.00% | | 10/1/19 | | 18,516 | |
48,062 | | 9.00% | | 12/15/19 | | 51,218 | |
208,368 | | 9.00% | | 6/15/25 | | 228,100 | |
29,414 | | 9.00% | | 7/1/31 | | 31,987 | |
6,921,551 | | 9.00% | | 3/1/32 | | 7,501,400 | |
25,770 | | 9.25% | | 10/1/09 | | 26,371 | |
14,517 | | 9.25% | | 7/1/10 | | 14,980 | |
52,033 | | 9.25% | | 10/1/16 | | 56,267 | |
59,256 | | 9.25% | | 12/1/16 | | 64,078 | |
125,268 | | 9.25% | | 2/1/17 | | 134,937 | |
217,025 | | 9.34% | | 8/20/27 | | 242,433 | |
35,390 | | 9.50% | | 12/1/09 | | 36,654 | |
21,988 | | 9.50% | | 11/1/18 | | 24,086 | |
46,819 | | 9.50% | | 5/1/19 | | 51,425 | |
52,567 | | 9.50% | | 10/1/19 | | 56,930 | |
768,629 | | 9.50% | | 3/1/20 | | 860,865 | |
845,844 | | 9.50% | | 7/1/20 | | 927,179 | |
100,848 | | 9.50% | | 9/1/20 | | 110,062 | |
144,673 | | 9.50% | | 10/15/20 | | 156,251 | |
25,385 | | 9.50% | | 12/15/20 | | 27,408 | |
101,731 | | 9.50% | | 12/15/20 | | 110,317 | |
40,938 | | 9.50% | | 3/1/21 | | 44,701 | |
35,326 | | 9.50% | | 4/15/21 | | 38,476 | |
193,639 | | 9.50% | | 5/1/27 | | 214,012 | |
884,114 | | 9.50% | | 4/1/30 | | 967,075 | |
4,057,404 | | 9.50% | | 8/1/31 | | 4,455,927 | |
1,171,970 | | 9.55% | | 8/20/25 | | 1,295,110 | |
114,462 | | 9.75% | | 1/15/13 | | 123,876 | |
| | | | | | | |
Par ($) | | Coupon | | Maturity | | Market Value ($)(1) | |
| | | | | | | | |
|
113,392 | | 9.75% | | 1/1/21 | | 124,911 | |
202,885 | | 9.75% | | 10/1/21 | | 225,184 | |
240,150 | | 9.75% | | 4/1/25 | | 266,544 | |
32,732 | | 10.00% | | 5/1/11 | | 34,252 | |
94,142 | | 10.00% | | 7/1/13 | | 101,211 | |
507,930 | | 10.00% | | 2/1/15 | | 553,177 | |
711,803 | | 10.00% | | 3/1/15 | | 788,330 | |
66,241 | | 10.00% | | 11/1/16 | | 72,393 | |
41,947 | | 10.00% | | 9/1/19 | | 46,283 | |
15,970 | | 10.00% | | 11/1/20 | | 17,777 | |
35,201 | | 10.00% | | 1/1/21 | | 39,301 | |
85,525 | | 10.00% | | 1/1/24 | | 94,544 | |
429,518 | | 10.00% | | 2/1/28 | | 477,707 | |
293,216 | | 10.18% | | 7/1/20 | | 321,689 | |
212,650 | | 10.25% | | 8/15/13 | | 230,583 | |
26,331 | | 10.50% | | 5/1/15 | | 28,281 | |
181,917 | | 10.50% | | 1/1/16 | | 202,592 | |
58,964 | | 10.50% | | 12/1/17 | | 65,456 | |
97,309 | | 10.50% | | 4/1/22 | | 106,041 | |
11,301 | | 10.75% | | 11/1/10 | | 11,678 | |
3,877 | | 11.00% | | 4/1/14 | | 4,264 | |
20,766 | | 11.00% | | 8/1/15 | | 22,050 | |
19,062 | | 11.00% | | 4/1/17 | | 20,487 | |
306,132 | | 11.27% | | 8/15/20 | | 343,000 | |
187,256 | | 11.75% | | 10/20/22 | | 211,210 | |
| | | | | | | |
| | | | | | 56,614,769 | |
| | | | | | | |
| | | | | | | |
Government National Mortgage Association (13.0%) (3): | |
|
Par ($) | | Coupon | | Maturity | | Market Value ($)(1) | |
| | | | | | | | |
411,929 | | 5.50% | | 9/15/25 | | 412,487 | |
133,964 | | 5.76% | | 3/20/33 | | 134,642 | |
82,234 | | 5.76% | | 3/20/33 | | 82,650 | |
110,080 | | 5.76% | | 3/20/33 | | 110,637 | |
351,547 | | 5.76% | | 5/20/33 | | 353,325 | |
115,179 | | 5.76% | | 5/20/33 | | 115,762 | |
93,405 | | 5.76% | | 6/20/33 | | 93,877 | |
107,491 | | 5.76% | | 6/20/33 | | 108,035 | |
69,502 | | 6.00% | | 9/15/18 | | 70,310 | |
82,393 | | 6.05% | | 3/20/33 | | 83,263 | |
239,101 | | 6.25% | | 5/15/13 | | 243,041 | |
343,187 | | 6.25% | | 12/15/23 | | 352,172 | |
231,606 | | 6.25% | | 1/15/24 | | 237,676 | |
218,040 | | 6.38% | | 12/15/27 | | 223,645 | |
297,444 | | 6.38% | | 4/15/28 | | 305,122 | |
248,907 | | 6.49% | | 11/20/31 | | 255,619 | |
48,567 | | 6.49% | | 12/20/31 | | 49,876 | |
257,399 | | 6.49% | | 4/20/32 | | 264,103 | |
74,406 | | 6.49% | | 6/20/32 | | 76,343 | |
55,047 | | 6.49% | | 6/20/32 | | 56,480 | |
88,040 | | 6.49% | | 12/20/32 | | 90,332 | |
16
| | | | |
| | |
| |
| | |
| | |
|
| |
| | | | |
| | | | | | | | | |
| Par ($) | | Coupon | | | Maturity | | Market Value ($)(1) |
| | | | | | | |
| | | | | | | | | |
| 39,347 | | 6.57% | | | 9/20/32 | | | 40,508 |
| 65,957 | | 6.57% | | | 1/20/33 | | | 67,915 |
| 83,858 | | 6.57% | | | 3/20/33 | | | 86,347 |
| 77,858 | | 6.75% | | | 9/15/15 | | | 80,561 |
| 342,657 | | 6.75% | | | 8/15/28 | | | 355,972 |
| 192,538 | | 6.75% | | | 6/15/29 | | | 200,003 |
| 132,520 | | 6.75% | | | 6/15/29 | | | 137,658 |
| 527,295 | | 6.91% | | | 7/20/26 | | | 548,637 |
| 32,899 | | 7.00% | | | 9/20/16 | | | 33,973 |
| 493,822 | | 7.00% | | | 2/15/28 | | | 513,245 |
| 851,976 | | 7.00% | | | 7/15/29 | | | 891,320 |
| 953,684 | | 7.00% | | | 10/15/32 | | | 997,558 |
| 765,486 | | 7.00% | | | 11/15/32 | | | 800,658 |
| 16,964 | | 7.05% | | | 2/15/23 | | | 17,504 |
| 133,469 | | 7.05% | | | 9/20/26 | | | 137,352 |
| 80,648 | | 7.05% | | | 11/20/26 | | | 82,995 |
| 68,048 | | 7.05% | | | 1/20/27 | | | 70,022 |
| 144,318 | | 7.05% | | | 4/20/27 | | | 148,504 |
| 91,966 | | 7.15% | | | 12/20/26 | | | 94,885 |
| 76,082 | | 7.15% | | | 3/20/27 | | | 78,490 |
| 245,992 | | 7.15% | | | 4/20/27 | | | 253,778 |
| 17,873 | | 7.25% | | | 8/15/10 | | | 18,210 |
| 130,330 | | 7.25% | | | 5/15/29 | | | 135,252 |
| 64,113 | | 7.27% | | | 7/20/22 | | | 66,212 |
| 61,183 | | 7.38% | | | 1/15/29 | | | 63,690 |
| 451,959 | | 7.38% | | | 3/15/31 | | | 464,047 |
| 74,054 | | 7.50% | | | 5/15/16 | | | 77,427 |
| 293,359 | | 7.50% | | | 6/15/36 | | | 305,497 |
| 69,383 | | 7.55% | | | 7/20/22 | | | 72,579 |
| 83,749 | | 7.55% | | | 10/20/22 | | | 87,606 |
| 94,718 | | 7.63% | | | 10/15/29 | | | 99,611 |
| 88,535 | | 7.65% | | | 10/20/21 | | | 92,779 |
| 87,214 | | 7.65% | | | 7/20/22 | | | 91,456 |
| 180,911 | | 7.75% | | | 6/15/20 | | | 190,784 |
| 188,268 | | 7.75% | | | 7/15/20 | | | 198,543 |
| 141,766 | | 7.75% | | | 8/15/20 | | | 149,503 |
| 180,364 | | 7.75% | | | 8/15/20 | | | 190,208 |
| 83,199 | | 7.75% | | | 11/15/20 | | | 87,740 |
| 495,749 | | 7.75% | | | 10/15/22 | | | 527,824 |
| 44,163 | | 7.90% | | | 1/20/21 | | | 46,557 |
| 32,302 | | 7.90% | | | 1/20/21 | | | 34,053 |
| 29,481 | | 7.90% | | | 4/20/21 | | | 31,079 |
| 96,903 | | 7.95% | | | 2/15/20 | | | 102,679 |
| 42,471 | | 7.95% | | | 5/20/25 | | | 44,827 |
| 120,747 | | 7.95% | | | 7/20/25 | | | 127,447 |
| 48,590 | | 7.95% | | | 8/20/25 | | | 51,286 |
| 165,992 | | 7.95% | | | 9/20/25 | | | 175,202 |
| 27,243 | | 7.95% | | | 10/20/25 | | | 28,755 |
| 37,639 | | 7.95% | | | 10/20/25 | | | 39,727 |
| | | | | | | | | |
| Par ($) | | Coupon | | | Maturity | | Market Value ($)(1) |
| | | | | | | |
| | | | | | | | | |
| 31,980 | | 7.95% | | | 10/20/25 | | | 33,755 |
| 72,579 | | 7.95% | | | 1/20/26 | | | 76,649 |
| 82,324 | | 7.95% | | | 1/20/26 | | | 86,941 |
| 120,000 | | 7.95% | | | 4/20/26 | | | 126,729 |
| 23,148 | | 7.95% | | | 6/20/26 | | | 24,446 |
| 32,215 | | 7.95% | | | 9/20/26 | | | 34,022 |
| 39,079 | | 7.95% | | | 9/20/26 | | | 41,271 |
| 26,824 | | 7.95% | | | 11/20/26 | | | 28,328 |
| 35,452 | | 7.95% | | | 12/20/26 | | | 37,440 |
| 46,342 | | 7.95% | | | 3/20/27 | | | 48,938 |
| 49,593 | | 7.99% | | | 2/20/21 | | | 52,392 |
| 60,056 | | 7.99% | | | 4/20/21 | | | 63,446 |
| 133,838 | | 7.99% | | | 7/20/21 | | | 141,392 |
| 102,218 | | 7.99% | | | 9/20/21 | | | 107,988 |
| 102,253 | | 7.99% | | | 10/20/21 | | | 108,025 |
| 231,009 | | 7.99% | | | 1/20/22 | | | 244,280 |
| 359,958 | | 7.99% | | | 6/20/22 | | | 380,636 |
| 24,899 | | 8.00% | | | 10/15/12 | | | 26,156 |
| 432,160 | | 8.00% | | | 10/15/14 | | | 457,357 |
| 60,607 | | 8.00% | | | 5/15/16 | | | 64,425 |
| 223,533 | | 8.00% | | | 6/15/16 | | | 237,616 |
| 63,342 | | 8.00% | | | 9/15/16 | | | 67,333 |
| 81,701 | | 8.00% | | | 11/20/16 | | | 85,746 |
| 42,216 | | 8.00% | | | 7/20/23 | | | 44,553 |
| 25,717 | | 8.00% | | | 12/20/23 | | | 27,141 |
| 3,631 | | 8.00% | | | 2/20/24 | | | 3,835 |
| 119,831 | | 8.00% | | | 2/20/26 | | | 126,712 |
| 22,772 | | 8.00% | | | 12/20/26 | | | 24,079 |
| 56,988 | | 8.00% | | | 9/15/29 | | | 60,527 |
| 18,364 | | 8.00% | | | 1/20/32 | | | 19,422 |
| 260,218 | | 8.10% | | | 5/20/19 | | | 275,749 |
| 34,054 | | 8.10% | | | 6/20/19 | | | 36,087 |
| 121,365 | | 8.10% | | | 7/20/19 | | | 128,609 |
| 162,913 | | 8.10% | | | 9/20/19 | | | 172,637 |
| 80,809 | | 8.10% | | | 9/20/19 | | | 85,632 |
| 81,899 | | 8.10% | | | 10/20/19 | | | 86,787 |
| 73,363 | | 8.10% | | | 1/20/20 | | | 77,847 |
| 90,963 | | 8.10% | | | 7/20/20 | | | 96,523 |
| 103,222 | | 8.25% | | | 12/15/11 | | | 108,529 |
| 20,010 | | 8.25% | | | 1/15/12 | | | 21,158 |
| 54,056 | | 8.25% | | | 8/15/15 | | | 57,572 |
| 383,366 | | 8.25% | | | 4/15/19 | | | 409,181 |
| 131,803 | | 8.25% | | | 2/15/20 | | | 140,885 |
| 19,567 | | 8.25% | | | 4/15/27 | | | 20,899 |
| 39,387 | | 8.25% | | | 6/15/27 | | | 42,067 |
| 42,231 | | 8.38% | | | 10/15/19 | | | 45,198 |
| 106,535 | | 8.40% | | | 2/15/19 | | | 114,099 |
| 31,445 | | 8.40% | | | 4/15/19 | | | 33,677 |
| 116,429 | | 8.40% | | | 6/15/19 | | | 124,696 |
| |
See accompanying notes to portfolios of investments on page 62. | 17 |
| | | | |
| Sit U.S. Government Securities Fund | | | |
| March 31, 2007 | | | |
| | | | |
| Portfolio of Investments
| | | |
| | | | |
| | | | | | | | | |
| Par ($) | | Coupon | | | Maturity | | Market Value ($)(1) |
| | | | | | | |
| | | | | | | | | |
| 40,199 | | 8.40% | | | 9/15/19 | | | 43,054 |
| 55,384 | | 8.40% | | | 9/15/19 | | | 59,317 |
| 55,257 | | 8.40% | | | 2/15/20 | | | 59,275 |
| 27,341 | | 8.50% | | | 12/15/11 | | | 28,850 |
| 98,052 | | 8.50% | | | 1/15/12 | | | 104,101 |
| 12,317 | | 8.50% | | | 4/15/15 | | | 13,182 |
| 59,817 | | 8.50% | | | 4/15/15 | | | 64,020 |
| 176,447 | | 8.50% | | | 9/15/16 | | | 189,399 |
| 84,645 | | 8.50% | | | 1/15/17 | | | 91,445 |
| 105,749 | | 8.50% | | | 12/15/21 | | | 113,879 |
| 82,685 | | 8.50% | | | 12/15/21 | | | 88,932 |
| 12,752 | | 8.50% | | | 7/20/22 | | | 13,699 |
| 82,373 | | 8.50% | | | 10/20/22 | | | 88,495 |
| 43,253 | | 8.50% | | | 9/20/24 | | | 46,572 |
| 77,941 | | 8.50% | | | 3/20/25 | | | 83,948 |
| 221,365 | | 8.50% | | | 12/20/26 | | | 236,958 |
| 26,408 | | 8.50% | | | 8/15/30 | | | 28,376 |
| 54,752 | | 8.60% | | | 5/15/18 | | | 58,276 |
| 49,256 | | 8.60% | | | 6/15/18 | | | 52,426 |
| 56,597 | | 8.63% | | | 10/15/18 | | | 60,185 |
| 24,720 | | 8.75% | | | 11/15/09 | | | 25,880 |
| 30,980 | | 8.75% | | | 6/15/11 | | | 32,907 |
| 150,662 | | 8.75% | | | 11/15/11 | | | 160,033 |
| 28,446 | | 8.75% | | | 12/15/11 | | | 30,216 |
| 95,558 | | 8.75% | | | 10/15/30 | | | 103,151 |
| 3,784 | | 9.00% | | | 10/15/07 | | | 3,879 |
| 8,399 | | 9.00% | | | 9/15/08 | | | 8,552 |
| 3,336 | | 9.00% | | | 9/15/08 | | | 3,396 |
| 5,937 | | 9.00% | | | 11/15/08 | | | 6,045 |
| 11,341 | | 9.00% | | | 12/15/08 | | | 11,548 |
| 1,528 | | 9.00% | | | 2/15/09 | | | 1,575 |
| 6,852 | | 9.00% | | | 4/15/09 | | | 7,128 |
| 1,048 | | 9.00% | | | 5/15/09 | | | 1,080 |
| 9,889 | | 9.00% | | | 8/15/09 | | | 10,287 |
| 10,513 | | 9.00% | | | 9/15/09 | | | 10,936 |
| 4,450 | | 9.00% | | | 10/15/09 | | | 4,585 |
| 18,431 | | 9.00% | | | 11/15/09 | | | 19,341 |
| 2,929 | | 9.00% | | | 12/15/09 | | | 3,047 |
| 42,924 | | 9.00% | | | 7/15/10 | | | 44,656 |
| 77,463 | | 9.00% | | | 5/15/11 | | | 82,573 |
| 33,966 | | 9.00% | | | 5/15/11 | | | 36,207 |
| 55,172 | | 9.00% | | | 6/15/11 | | | 58,812 |
| 57,295 | | 9.00% | | | 7/15/11 | | | 61,074 |
| 72,787 | | 9.00% | | | 8/15/11 | | | 77,588 |
| 20,717 | | 9.00% | | | 8/15/11 | | | 22,043 |
| 79,528 | | 9.00% | | | 9/15/11 | | | 84,775 |
| 74,260 | | 9.00% | | | 9/15/11 | | | 79,159 |
| 45,507 | | 9.00% | | | 9/15/11 | | | 48,509 |
| 44,350 | | 9.00% | | | 10/15/11 | | | 47,276 |
| | | | | | | | | |
| Par ($) | | Coupon | | | Maturity | | Market Value ($)(1) |
| | | | | | | |
|
| 12,665 | | 9.00% | | | 1/15/12 | | | 13,585 |
| 43,044 | | 9.00% | | | 5/20/15 | | | 45,788 |
| 112,938 | | 9.00% | | | 7/15/15 | | | 120,590 |
| 33,273 | | 9.00% | | | 8/15/15 | | | 35,528 |
| 91,439 | | 9.00% | | | 12/20/15 | | | 97,269 |
| 14,409 | | 9.00% | | | 5/20/16 | | | 15,378 |
| 393,076 | | 9.00% | | | 12/15/16 | | | 421,078 |
| 107,350 | | 9.00% | | | 1/15/17 | | | 117,098 |
| 9,985 | | 9.00% | | | 3/20/17 | | | 10,662 |
| 317,754 | | 9.00% | | | 7/15/17 | | | 346,608 |
| 187,869 | | 9.00% | | | 8/20/17 | | | 200,608 |
| 2,569 | | 9.00% | | | 7/20/21 | | | 2,762 |
| 1,281 | | 9.00% | | | 10/20/21 | | | 1,377 |
| 261,829 | | 9.00% | | | 11/15/24 | | | 281,890 |
| 36,603 | | 9.00% | | | 7/20/25 | | | 39,509 |
| 126,918 | | 9.00% | | | 4/15/26 | | | 137,428 |
| 22,864 | | 9.10% | | | 5/15/18 | | | 24,719 |
| 50,450 | | 9.25% | | | 11/15/09 | | | 53,426 |
| 22,733 | | 9.25% | | | 1/15/10 | | | 24,276 |
| 28,278 | | 9.25% | | | 4/15/10 | | | 30,197 |
| 23,637 | | 9.25% | | | 11/15/10 | | | 25,241 |
| 56,819 | | 9.25% | | | 11/15/11 | | | 61,176 |
| 10,710 | | 9.25% | | | 4/15/12 | | | 11,609 |
| 11,325 | | 9.50% | | | 9/15/09 | | | 11,708 |
| 68,871 | | 9.50% | | | 10/15/09 | | | 71,201 |
| 15,544 | | 9.50% | | | 10/15/09 | | | 16,070 |
| 4,377 | | 9.50% | | | 10/15/09 | | | 4,525 |
| 21,360 | | 9.50% | | | 11/15/09 | | | 22,672 |
| 55,713 | | 9.50% | | | 1/15/10 | | | 59,673 |
| 12,535 | | 9.50% | | | 2/15/10 | | | 13,080 |
| 35,297 | | 9.50% | | | 4/15/10 | | | 37,428 |
| 18,132 | | 9.50% | | | 8/15/10 | | | 19,421 |
| 30,234 | | 9.50% | | | 11/15/10 | | | 32,383 |
| 9,931 | | 9.50% | | | 1/15/11 | | | 10,730 |
| 72,903 | | 9.50% | | | 3/15/11 | | | 78,771 |
| 14,730 | | 9.50% | | | 3/20/16 | | | 15,915 |
| 42,645 | | 9.50% | | | 11/20/16 | | | 46,074 |
| 3,283 | | 9.50% | | | 8/20/17 | | | 3,558 |
| 3,836 | | 9.50% | | | 12/20/17 | | | 4,158 |
| 5,007 | | 9.50% | | | 4/20/18 | | | 5,442 |
| 1,696 | | 9.50% | | | 5/20/18 | | | 1,843 |
| 36,605 | | 9.50% | | | 6/20/18 | | | 39,785 |
| 30,632 | | 9.50% | | | 7/20/18 | | | 33,294 |
| 21,914 | | 9.50% | | | 8/20/18 | | | 23,818 |
| 73,127 | | 9.50% | | | 9/20/18 | | | 79,481 |
| 42,918 | | 9.50% | | | 9/20/18 | | | 46,647 |
| 12,352 | | 9.50% | | | 9/20/18 | | | 13,425 |
| 30,453 | | 9.50% | | | 8/20/19 | | | 33,178 |
| 2,932 | | 9.50% | | | 10/20/19 | | | 3,194 |
18
| | | | |
| | |
| |
| | |
| | |
|
| |
| | | | |
| | | | | | | | | |
| Par ($) | | Coupon | | | Maturity | | Market Value ($)(1) |
| | | | | | | |
| | | | | | | | | |
| 35,896 | | 9.75% | | | 8/15/09 | | | 38,429 |
| 36,946 | | 9.75% | | | 9/15/09 | | | 39,553 |
| 101,825 | | 9.75% | | | 8/15/10 | | | 110,530 |
| 27,784 | | 9.75% | | | 11/15/10 | | | 30,160 |
| 136,166 | | 9.75% | | | 12/15/10 | | | 147,807 |
| 101,286 | | 9.75% | | | 1/15/11 | | | 111,081 |
| 76,120 | | 9.75% | | | 1/15/11 | | | 83,481 |
| 22,558 | | 9.75% | | | 10/15/12 | | | 24,942 |
| 9,064 | | 9.75% | | | 10/15/12 | | | 10,021 |
| 8,677 | | 9.75% | | | 10/15/12 | | | 9,593 |
| 8,390 | | 9.75% | | | 11/15/12 | | | 9,276 |
| 29,185 | | 9.75% | | | 11/15/12 | | | 32,268 |
| 24,482 | | 9.75% | | | 11/15/12 | | | 27,069 |
| 25,765 | | 9.75% | | | 11/15/12 | | | 28,487 |
| 14,965 | | 10.00% | | | 11/15/08 | | | 15,775 |
| 1,242 | | 10.00% | | | 11/15/09 | | | 1,302 |
| 4,038 | | 10.00% | | | 6/15/10 | | | 4,397 |
| 58,425 | | 10.00% | | | 6/15/10 | | | 63,609 |
| 18,985 | | 10.00% | | | 7/15/10 | | | 20,670 |
| 8,247 | | 10.00% | | | 7/15/10 | | | 8,979 |
| 7,787 | | 10.00% | | | 10/15/10 | | | 8,478 |
| 44,490 | | 10.00% | | | 11/15/10 | | | 48,437 |
| 31,138 | | 10.00% | | | 3/20/16 | | | 34,380 |
| 17,342 | | 10.00% | | | 11/15/17 | | | 19,274 |
| 31,531 | | 10.00% | | | 2/15/19 | | | 35,059 |
| 19,689 | | 10.00% | | | 2/20/19 | | | 21,814 |
| 21,181 | | 10.00% | | | 3/20/19 | | | 23,467 |
| 16,022 | | 10.00% | | | 5/20/19 | | | 17,751 |
| 173,439 | | 10.00% | | | 10/15/19 | | | 197,095 |
| 39,830 | | 10.00% | | | 11/15/19 | | | 44,287 |
| 31,523 | | 10.00% | | | 12/15/20 | | | 35,095 |
| 103,611 | | 10.00% | | | 6/15/21 | | | 115,483 |
| 23,765 | | 10.25% | | | 5/15/09 | | | 25,192 |
| 17,333 | | 10.25% | | | 11/15/11 | | | 18,790 |
| 19,962 | | 10.25% | | | 1/15/12 | | | 21,885 |
| 7,757 | | 10.25% | | | 2/15/12 | | | 8,504 |
| 7,593 | | 10.25% | | | 7/15/12 | | | 8,324 |
| 24,334 | | 10.50% | | | 6/15/09 | | | 25,855 |
| 4,699 | | 10.50% | | | 7/15/10 | | | 5,044 |
| 9,344 | | 10.50% | | | 9/15/15 | | | 10,368 |
| 12,218 | | 10.50% | | | 11/15/15 | | | 13,557 |
| 3,176 | | 10.50% | | | 8/20/17 | | | 3,530 |
| 46,928 | | 10.50% | | | 11/15/18 | | | 52,445 |
| 41,723 | | 10.50% | | | 6/15/19 | | | 46,768 |
| 213,229 | | 10.50% | | | 2/15/20 | | | 238,036 |
| 161,804 | | 10.50% | | | 8/15/21 | | | 183,866 |
| 2,721 | | 10.75% | | | 1/15/10 | | | 2,952 |
| 1,227 | | 10.75% | | | 7/15/11 | | | 1,340 |
| 19,728 | | 11.25% | | | 6/15/10 | | | 21,579 |
| | | | | | | | | |
| Par ($) | | Coupon | | | Maturity | | Market Value ($)(1) |
| | | | | | | |
| | | | | | | | | |
| 30,520 | | 11.25% | | | 9/15/10 | | | 33,384 |
| 3,811 | | 11.25% | | | 9/15/10 | | | 4,168 |
| 16,813 | | 11.25% | | | 3/15/11 | | | 18,514 |
| 7,582 | | 11.25% | | | 3/15/11 | | | 8,349 |
| 37,416 | | 11.25% | | | 4/15/11 | | | 41,200 |
| 8,652 | | 11.25% | | | 5/15/11 | | | 9,527 |
| 28,197 | | 11.25% | | | 7/15/11 | | | 31,049 |
| 6,050 | | 11.25% | | | 7/15/11 | | | 6,661 |
| 4,748 | | 11.25% | | | 7/15/11 | | | 5,229 |
| 13,242 | | 11.25% | | | 9/15/11 | | | 14,581 |
| 10,147 | | 11.25% | | | 10/15/11 | | | 11,174 |
| 88,714 | | 11.50% | | | 8/15/18 | | | 97,441 |
| | | | | | | | |
| | | | | | | | | 25,760,558 |
| | | | | | | | |
Total mortgage pass-through securities
(cost: $108,934,932) | | | | 108,684,289 |
| | | | | |
Taxable Municipal Securities (0.3%) (2)
| | | | | |
205,000 | | Bernalillo Multifamily Rev. Series | | | |
| | 1998A, 7.50%, 9/20/20 | | | 217,156 |
20,000 | | Cuyahoga County Multifamily Rev. | | | |
| | Series 2000B, 7.00%, 1/20/08 | | | 20,182 |
30,000 | | Louisiana Comm. Dev. Auth Rev. | | | |
| | Series 2002B, 5.25%, 12/20/07 | | | 29,918 |
370,000 | | Maplewood Multifamily Rev. | | | |
| | Series 1998B, 6.75%, 7/20/15 | | | 371,765 |
| | | | |
Total taxable municipal securities
(cost: $625,000) | | | 639,021 |
| | | | |
U.S. Treasury / Federal Agency Securities (9.2%) (2)
| | | | | |
5,000,000 | | FNMA Strip, zero coupon, | | | |
| | 4.88% effective yield, 11/15/30 | | | 1,475,985 |
3,000,000 | | U.S. Treasury Bond, 4.50%, 11/30/11 | | | 2,995,194 |
2,800,000 | | U.S. Treasury Note, 3.375%, 9/15/09 | | | 2,722,672 |
3,750,000 | | U.S. Treasury Note, 4.50%, 11/15/10 | | | 3,747,071 |
| | U.S. Treasury Strips, Zero Coupon: | | | |
3,500,000 | | 5.45% Effective Yield, 5/15/30 | | | 1,132,628 |
2,200,000 | | 4.60% Effective Yield, 8/15/16 | | | 2,234,890 |
3,734,024 | | U.S. Treasury inflation-protected security, | |
| | 3.375%, 1/15/12 (*) | | | 3,961,419 |
| | | | |
Total U.S. Treasury / Federal Agency securities
(cost: $18,316,378) | | | 18,269,859 |
| | |
Collateralized Mortgage Obligations (35.1%) (2)
Federal Home Loan Mortgage Corp.:
| | | | | | | | | |
| Par ($) | | Coupon | | | Maturity | | Market Value ($)(1) |
| | | | | | | |
| 597,577 | | 3.00% | | | 2/15/23 | | | 552,486 |
| |
See accompanying notes to portfolios of investments on page 62. | 19 |
| | | | |
| Sit U.S. Government Securities Fund | | | |
| March 31, 2007 | | | |
| | | | |
| Portfolio of Investments
| | | |
| | | | |
| | | | | | | | | |
| Par ($) | | Coupon | | | Maturity | | Market Value ($)(1) |
| | | | | | | |
| | | | | | | | | |
| 3,103,713 | | 3.25% | | | 4/15/32 | | | 2,895,825 |
| 632,671 | | 3.50% | | | 5/15/29 | | | 599,516 |
| 601,552 | | 4.00% | | | 11/15/14 | | | 584,093 |
| 2,683,573 | | 4.00% | | | 5/31/25 | | | 2,481,647 |
| 325,074 | | 4.00% | | | 12/15/32 | | | 308,626 |
| 1,028,473 | | 4.50% | | | 5/15/32 | | | 1,011,838 |
| 500,000 | | 5.50% | | | 7/15/31 | | | 502,204 |
| 5,000,000 | | 5.50% | | | 3/15/32 | | | 4,996,275 |
| 789,287 | | 6.95% | | | 3/15/28 | | | 815,885 |
| 517,644 | | 7.50% | | | 6/15/17 | | | 543,433 |
| 263,930 | | 7.50% | | | 9/15/30 | | | 269,875 |
| 17,335 | | 7.75% | | | 3/18/25 | | | 17,506 |
| 242,502 | | 8.00% | | | 11/25/22 | | | 250,857 |
| 89,052 | | 8.00% | | | 3/15/23 | | | 92,728 |
| 106,583 | | 8.00% | | | 4/25/24 | | | 113,979 |
| 31,024 | | 9.15% | | | 10/15/20 | | | 32,572 |
| 1,451,361 | | 9.50% | | | 2/15/20 | | | 1,516,227 |
| | | | | | | | | |
| | | | | | | | | 17,585,572 |
| | | | | | | | | |
| | | | | | |
Federal National Mortgage Association: | | |
| | | | | | |
| Par ($) | | Coupon | | | Maturity | | Market Value ($)(1) |
| | | | | | | |
| 3,348,105 | | 3.50% | | | 2/25/33 | | | 3,073,145 |
| 733,927 | | 3.50% | | | 3/25/33 | | | 698,911 |
| 352,963 | | 3.50% | | | 8/25/33 | | | 321,523 |
| 1,454,425 | | 3.50% | | | 6/25/35 | | | 1,400,242 |
| 921,103 | | 3.75% | | | 5/25/33 | | | 853,931 |
| 1,186,248 | | 4.00% | | | 11/25/32 | | | 1,143,830 |
| 345,454 | | 4.00% | | | 1/25/33 | | | 330,780 |
| 1,503,851 | | 4.00% | | | 3/25/33 | | | 1,424,399 |
| 1,725,186 | | 4.00% | | | 5/25/33 | | | 1,652,313 |
| 226,244 | | 5.00% | | | 8/25/22 | | | 222,951 |
| 1,700,000 | | 5.00% | | | 12/25/31 | | | 1,642,976 |
| 5,125,203 | | 5.50% | | | 5/25/25 | | | 5,099,363 |
| 3,787,251 | | 6.50% | | | 10/25/17 | | | 3,886,778 |
| 86,047 | | 6.85% | | | 12/18/27 | | | 88,786 |
| 106,788 | | 7.00% | | | 1/25/21 | | | 109,778 |
| 46,290 | | 7.70% | | | 3/25/23 | | | 48,789 |
| 230,864 | | 8.00% | | | 7/25/22 | | | 245,217 |
| 275,013 | | 8.00% | | | 7/25/22 | | | 284,250 |
| 100,000 | | 8.00% | | | 7/18/27 | | | 111,798 |
| 407,469 | | 8.00% | | | 7/25/44 | | | 428,368 |
| 78,745 | | 8.20% | | | 4/25/25 | | | 81,118 |
| 37,810 | | 8.50% | | | 1/25/21 | | | 40,340 |
| 41,112 | | 8.50% | | | 4/25/21 | | | 42,333 |
| 333,459 | | 8.50% | | | 9/25/21 | | | 358,705 |
| 94,415 | | 8.50% | | | 1/25/25 | | | 99,712 |
| 416,109 | | 8.50% | | | 6/25/30 | | | 496,204 |
| 73,019 | | 8.75% | | | 9/25/20 | | | 75,999 |
| 179,757 | | 8.95% | | | 10/25/20 | | | 193,489 |
| 547,169 | | 9.00% | | | 7/25/19 | | | 585,412 |
| | | | | | | | | |
| Par ($) | | Coupon | | | Maturity | | Market Value ($)(1) |
| | | | | | | |
| | | | | | | | | |
| 290,146 | | 9.00% | | | 12/25/19 | | | 311,754 |
| 105,093 | | 9.00% | | | 5/25/20 | | | 110,985 |
| 71,327 | | 9.00% | | | 6/25/20 | | | 76,733 |
| 162,344 | | 9.00% | | | 6/25/20 | | | 172,013 |
| 28,014 | | 9.00% | | | 7/25/20 | | | 30,369 |
| 150,528 | | 9.00% | | | 9/25/20 | | | 161,988 |
| 97,813 | | 9.00% | | | 10/25/20 | | | 105,598 |
| 212,876 | | 9.00% | | | 3/1/24 | | | 230,473 |
| 1,354,206 | | 9.00% | | | 11/25/28 | | | 1,498,387 |
| 157,260 | | 9.25% | | | 1/25/20 | | | 169,933 |
| 148,721 | | 9.50% | | | 12/25/18 | | | 161,548 |
| 272,344 | | 9.50% | | | 3/25/20 | | | 297,870 |
| 67,504 | | 9.50% | | | 4/25/20 | | | 71,754 |
| 190,198 | | 9.50% | | | 5/25/20 | | | 206,155 |
| 270,047 | | 9.50% | | | 11/25/20 | | | 295,218 |
| 81,225 | | 9.50% | | | 11/25/31 | | | 86,276 |
| 395,354 | | 9.60% | | | 3/25/20 | | | 430,395 |
| | | | | | | | |
| | | | | | | | | 29,458,889 |
| | | | | | | | |
| | | | | | | | | |
Government National Mortgage Association: | | |
| | | | | | | | | |
| Par ($) | | Coupon | | | Maturity | | Market Value ($)(1) |
| | | | | | | |
| 571,956 | | 4.00% | | | 10/17/29 | | | 547,810 |
| 2,715,141 | | 7.00% | | | 1/20/32 | | | 2,855,746 |
| 1,266,608 | | 7.50% | | | 2/16/30 | | | 1,334,407 |
| 405,169 | | 8.00% | | | 1/16/30 | | | 420,797 |
| | | | | | | | |
| | | | | | | | | 5,158,760 |
| | | | | | | | |
| | | | | | | | | |
Vendee Mortgage Trust: | | |
| | | | | | | | | |
| Par ($) | | Coupon | | | Maturity | | Market Value ($)(1) |
| | | | | | | |
| 1,000,000 | | 5.00% | | | 8/15/28 | | | 990,194 |
| 1,000,000 | | 5.00% | | | 7/15/30 | | | 969,821 |
| 142,791 | | 5.63% | | | 2/15/24 | | | 144,651 |
| 2,000,000 | | 6.00% | | | 2/15/30 | | | 2,030,261 |
| 8,845,047 | | 6.50% | | | 12/15/28 | | | 9,132,098 |
| 3,631,752 | | 7.00% | | | 9/15/27 | | | 3,748,998 |
| 360,347 | | 8.29% | | | 12/15/26 | | | 377,969 |
| | | | | | | | |
| | | | | | | | | 17,393,992 |
| | | | | | | | |
| | | | | | |
Total collateralized mortgage obligations
(cost: $70,467,057) | | | | 69,597,213 |
| | | | | |
| | | | | | |
Short-Term Securities (1.4%) (2) | | |
| 700,000 | | FHLB Agy. Disc. Note, 5.17%, 4/9/07 | | | 699,095 |
| 1,986,552 | | Dreyfus Cash Mgmt. Fund, 5.14% | | | 1,986,552 |
| | | | | | | | |
| | | | | | | | | 2,685,647 |
| | | | | | | | |
Total short-term securites
(cost: $2,685,647) | | | | | | |
| | | | | | |
Total investments in securities
(cost: $201,029,014) (6) | | | | $ | 199,876,029 |
| | | | | | | |
20
| |
| * U.S. Treasury inflation-protected securities (TIPS) are securities in which the principal amount is adjusted for inflation and the semiannual interest payments equal a fixed percentage of the inflation-adjusted principal amount. |
See accompanying notes to portfolios of investments on page 62. 21
| | | | |
| Sit Tax-Free Income Fund | | | |
| One Year Ended March 31, 2007 | | | |
| | | | |
| Senior Portfolio Managers
Michael C. Brilley • Debra A. Sit, CFA • Paul J. Jungquist, CFA
| | | |
| | | | |
The Sit Tax-Free Income Fund returned +4.00% for the fiscal year ended March 31, 2007, compared with a return of +4.28% for the Lehman 5-year Municipal Bond Index. The Fund’s 30-day SEC yield was 4.29% and its 12-month distribution rate was 3.93% as of March 31, 2007.
The Federal Reserve last raised its federal funds target rate in late June 2006. With short term rates unchanged since mid 2006, intermediate term bond yields have fallen over the past twelve months. This period of relative stability followed several prior years of rising intermediate term yields as the Federal Reserve increased its federal funds target rate from 1.0% to 5.25%. We expect short and intermediate term yields to be relatively stable until late 2007, when slowing economic growth could cause somewhat lower yields unless inflationary pressures force the Federal Reserve to increase short-term interest rate levels.
The Fund invests in six different market sectors that each account for more than 5% of its holdings. Five of these sectors earned returns that exceeded the return of the Lehman 5-Year Municipal Bond Index. Only the multi-family housing sector underperformed that index, as bond prices fell, reflecting the continued trend of rating reductions by the bond rating agencies due to the difficulties of raising rents and higher than historic vacancy levels.
We expect the Federal Reserve to maintain short-term rates at their current level for the next six months. Economic growth is expected to be in the +2% to +3% range and inflation to moderate during the second half of 2007. Bond yields are expected to remain relatively stable until late in the year when the yield curve is expected to steepen.
INVESTMENT OBJECTIVE AND STRATEGY |
The objective of the Tax-Free Income Fund is to provide a high level of current income that is exempt from federal income tax, consistent with preservation of capital, by investing primarily in investment-grade municipal securities.
Such municipal securities generate interest income that is exempt from both regular federal income tax and federal alternative minimum tax. During normal market conditions, the Fund invests 100% of its net assets in such tax-exempt municipal securities.
| | |
Net Asset Value 3/31/07: | | $9.72 Per Share |
3/31/06: | | $9.72 Per Share |
Total Net Assets: | | $377.5 Million |
30-day SEC Yield: | | 4.29% |
Tax Equivalent Yield: | | 6.60%(1) |
12-Month Distribution Rate: | | 3.93% |
Average Maturity: | | 13.9 Years |
Duration to Estimated Avg. Life: | | 3.9 Years(2) |
Implied Duration: | | 4.7 Years(2) |
| | |
(1) For individuals in the 35.0% federal tax bracket.
(2) See next page. |
PORTFOLIO STRUCTURE
(% OF TOTAL NET ASSETS) |
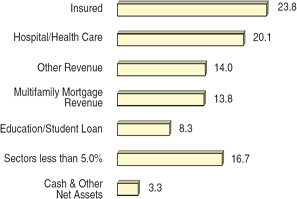
22
| | | | |
| | |
| |
| | |
| | |
|
| |
| | | | |
| | | | | | | | | | | | |
| |
AVERAGE ANNUAL TOTAL RETURNS* | |
| | | | | | | | | | |
| | Sit
Tax-Free
Income
Fund | | Lehman
5-Year Muni.
Bond Index | | Lipper
General
Muni. Bond
Fund Index | |
| | | | | | | |
3 Month** | | 0.81 | % | | 0.93 | % | | 0.74 | % | |
6 Month** | | 1.81 | | | 1.56 | | | N/A | | |
1 Year | | 4.00 | | | 4.28 | | | 5.38 | | |
5 Years | | 3.93 | | | 4.12 | | | 5.35 | | |
10 Years | | 4.52 | | | 4.79 | | | 5.35 | | |
Inception
(9/29/88) | | 5.85 | | | 5.78 | | | 6.39 | | |
| | | | | | | | | | |
CUMULATIVE TOTAL RETURNS* |
| |
| | Sit
Tax-Free
Income
Fund | | Lehman
5-Year Muni.
Bond Index | | Lipper
General
Muni. Bond
Fund Index | |
| | | | | | | |
1 Year | | 4.00 | % | | 4.28 | % | | 5.38 | % | |
5 Year | | 21.26 | | | 22.36 | | | 29.75 | | |
10 Year | | 55.53 | | | 59.73 | | | 68.46 | | |
Inception
(9/29/88) | | 186.63 | | | 182.78 | | | 214.53 | | |
| | | | | | | | | | |
*As of 3/31/07. | **Not annualized. | |
| | |
Performance figures are historical and do not guarantee future results. Investment returns and principal value will vary, and you may have a gain or loss when you sell shares. Average annual total returns include changes in share price as well as reinvestment of all dividends and capital gains. Management fees and administrative expenses are included in the Fund’s performance; however, fees and expenses are not incorporated in the Lehman 5-Year Muni. Bond Index. The Lipper returns are obtained from Lipper Analytical Services, Inc., a large independent evaluator of mutual funds.
(2) Duration is a measure which reflects estimated price sensitivity to a given change in interest rates. For example, for an interest rate change of 1%, a portfolio with a duration of 5 years would be expected to experience a price change of 5%. Estimated average life duration is based on current interest rates and the Adviser’s assumptions regarding the expected average life of individual securities held in the portfolio. Implied duration is calculated based on historical price changes of securities held by the Fund. The Adviser believes that the portfolio’s implied duration is a more accurate estimate of price sensitivity provided interest rates remain within their historical range. If interest rates exceed the historical range, the estimated average life duration may be a more accurate estimate of price sensitivity.
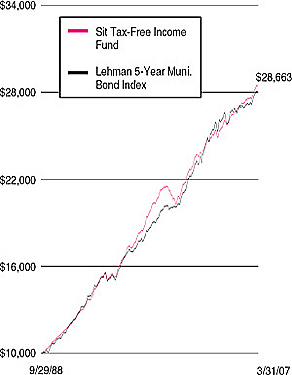
The sum of $10,000 invested at inception (9/29/88) and held until 3/31/07 would have grown to $28,663 in the Fund or $28,278 in the Lehman 5-Year Municipal Bond Index assuming reinvestment of all dividends and capital gains.
QUALITY RATINGS
(% OF TOTAL NET ASSETS) |
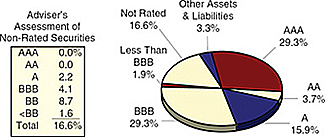
Lower of Moody’s, S&P, Fitch or Duff & Phelps ratings used.
23
| | | | |
| Sit Tax-Free Income Fund | | | |
| March 31, 2007 | | | |
| | | | |
| Portfolio of Investments
| | | |
| | | | |
| | | | |
Quantity ($) | | Name of Issuer | | Market Value ($)(1) |
| | | | |
Municipal Bonds (96.1%) (2) | | |
Alabama (1.8%) | | |
1,375,000 | | AL State Univ. Rev. Series 2006, 5.25%, 8/1/28 | | 1,492,109 |
300,000 | | AL Wtr. Pollution Ctrl. Auth. Revolving Fund Lien Series 1998-B (AMBAC insured), 5.00%, 8/15/21 | | 305,997 |
845,000 | | ASMS Pub. Educ. Bldg. Rev Series 2006-B (ASMSF LLC Proj.) (Ambac Insured), 4.375%, 9/1/26 | | 829,241 |
675,000 | | Birmingham-Southern College Private Educ. Bldg. Rev. Series 1997, 5.35%, 12/1/19 | | 680,170 |
100,000 | | DCH Hlth. Care Auth. Fac. Rev. Series 1998 (MBIA insured), 4.875%, 6/01/13 | | 102,050 |
| | Huntsville Hlth. Care Auth. Rev. | | |
200,000 | | Series 1997-A (MBIA insured), 5.00%, 6/1/17 | | 203,856 |
1,000,000 | | Series 2002-A, 5.625%, 6/1/32 | | 1,068,790 |
1,000,000 | | Series 2002-B, 5.75%, 6/1/32 | | 1,100,890 |
250,000 | | Series 2007-A, variable rate, 6/1/32 | | 250,000 |
750,000 | | Montgomery Special Care Facs. Fin. Auth. Rev. Series 1997-C (Baptist Med. Ctr. Proj.), 5.375%, 9/1/22 | | 768,795 |
| | | | |
| | | | 6,801,898 |
| | | | |
Alaska (1.9%) | | |
325,000 | | Alaska Indl. Dev. & Expt. Auth. Cmnty. Provider Rev. Series 2007 (Boys & Girls Home Proj.), 5.45%, 12/1/11 | | 324,444 |
12,640,000 | | Alaska HFC Gen. Mtg. Rev. Series 1997-A, zero coupon, 6.15% effective yield on purchase date, 12/1/17 | | 6,768,471 |
| | | | |
| | | | 7,092,915 |
| | | | |
Arizona (2.7%) | | |
1,500,000 | | Arizona Hlth. Care Facility Auth. Rev. Series 2007 (Beatitudes Campus Proj.), 4.75%, 10/1/10 | | 1,500,000 |
200,000 | | Bullhead City Special Assessment Impt. Dist. Series 1993 (Bullhead Pkwy. Proj.), 6.10%, 1/1/10 | | 200,916 |
| | Maricopa Co. Indl. Dev. Auth. Multifamily Hsg. Rev.: | | |
400,000 | | Series 1996-A (Place Five & Greenery Apts. Proj.), Escrowed to Maturity, 6.625%, 1/1/27 | | 429,696 |
490,000 | | Series 1996-B (Advantage PT, etc. Proj.), Escrowed to Maturity, 7.375%, 7/1/26 | | 501,280 |
100,000 | | Maricopa Co. Pollution Ctrl. Rev. Ref. Public Svc. Series 1996-A (New Mexico Public Svc. Co. Proj.), | | |
| | 6.30%, 12/1/26 | | 102,282 |
150,000 | | Parkway Cmnty. Facility Dist. No. 1 G.O. Series 2006, 4.85%, 7/15/15 | | 151,695 |
700,000 | | Phoenix Street & Hwy. User Rev. Ref. Jr. Lien Series 1992, 6.25%, 7/1/11 | | 701,239 |
| | Pima Co. Indl. Dev. Auth. Educ. Rev.: | | |
295,000 | | Series 2004-I (AZ Charter Schools Proj.), 5.00%, 7/1/12 | | 299,879 |
250,000 | | Series 2004-A (Noah Webster Basic School Proj.), 5.25%, 12/15/16 | | 255,703 |
210,000 | | Series 2005-M (AZ Charter Schools Proj.), 5.70%, 7/1/23 | | 221,838 |
750,000 | | Series 2006 (Choice Educ. & Dev. Corp. Proj.), 6.00%, 6/1/16 | | 775,568 |
1,000,000 | | Series 2006-A (Sonoran Science Academy Proj.). 5.35%, 12/1/17 | | 992,710 |
575,000 | | Series 2007-O (AZ Charter Schools Proj.), 4.65%, 7/1/14 | | 573,666 |
400,000 | | Ref. Series 2007 (Tucson Country Day School Proj.), 5.00%, 6/1/22 | | 406,352 |
565,000 | | Pinal Co. Indl. Dev. Auth. Correctional Fac. Rev. Series 2006-A (Florence West Prison Proj.) | | |
| | (ACA insured), 5.25%, 10/1/23 | | 601,516 |
500,000 | | Pinal Co. Certificate of Participation Series 2004, 5.00%, 12/1/26 (5) | | 517,345 |
| | Quail Creek Cmnty. Fac. Dist. G.O. Series 2006: | | |
585,000 | | 4.85%, 7/15/12 | | 589,768 |
500,000 | | 5.15%, 7/15/16 | | 513,185 |
360,000 | | Verrado Cmnty. Facilities Dist. No. 1 G. O. Series 2006, 4.85%, 7/15/14 | | 360,130 |
500,000 | | Westpark Cmnty. Facilities Dist. G.O. Series 2006, 4.90%, 7/15/16 | | 502,860 |
| | | | |
| | | | 10,197,628 |
| | | | |
24
| | | | |
| | |
| |
| | |
| | |
|
| |
| | | | |
| | | | |
Quantity ($) | | Name of Issuer | | Market Value ($)(1) |
| | | | |
Arkansas (0.6%) | | |
750,000 | | Bentonville Co. ISD No. 6 Refunding & Construction G.O. Series 2003-A | | |
| | (Ambac insured), 4/75%, 6/1/24 | | 757,027 |
4,524 | | Drew Co. Public Fac. Bd. Single Family Mtg. Rev. Ref. Series 1993-A2 | | |
| | (FNMA backed), 7.90%, 8/1/11 | | 4,535 |
565,000 | | Maumelle HDC First Lien Rev. Ref. Series 1992-A (Section 8), 7.875%, 7/1/09 | | 566,090 |
1,000,000 | | White Co. Hlth. Care Fac. Rev. Series 2005 (White Co. Med. Ctr. Proj.), 5.00%, 12/1/14 | | 1,032,200 |
| | | | |
| | | | 2,359,852 |
| | | | |
California (7.2%) | | |
80,000 | | ABAG Fin. Auth. For Nonprofit Corp. Rev Series 2002 (Redwood Sr. Homes & Svcs. | | |
| | Proj.), 4.10%, 11/15/07 | | 79,899 |
250,000 | | Agua Caliente Band Cahuilla Indians Rev. Series 2003, 4.60%, 7/1/08 | | 251,257 |
120,000 | | Bay Area Govt. Assoc. Tax Allocation Rev. Series 1994-A (FSA insured), 6.00%, 12/15/14 | | 120,572 |
250,000 | | Blythe Redev. Agy. Tax Allocation Ref. Series 1997 (Proj. No. 1), 5.80%, 5/1/28 | | 257,997 |
200,000 | | Calexico Cmnty. Redev. Agy. Tax Allocation Series 2000 (Merged Central Bus. District Redev. Proj.) | | 208,878 |
| | (Ambac insured), 5.375%, 8/1/26 | | |
500,000 | | CA Co. Tobacco Securitization Agy. Asset-Backed Rev. Series 2002 (Alameda Co. Proj.), 4.75%, 6/1/19 | | |
| | CA Cmnty. Hsg. Fin. Agy. Lease Rev. Pass Thru Oblig. | | 503,270 |
180,000 | | Series 2005-D, 4.875%, 4/1/12 | | 180,639 |
480,000 | | Series 2005-F, 4.85%, 11/1/12 | | 481,882 |
750,000 | | CA Dept. Water Resources Rev. Series 1972 (Central Valley Proj.), 5.25%, 7/1/22 | | 774,210 |
220,000 | | CA Dept. Water Resources Rev. Series 1996-Q (Central Valley Proj.) (MBIA insured), 5.375%, 12/1/27 | | 223,546 |
| | CA Educ. Facs. Auth. Rev.: | | |
10,000 | | Series 1995-A (Pooled College & Univ. Proj.), 5.60%, 12/1/14 | | 10,103 |
135,000 | | Rev. Refunded Series 1996 (Chapman Univ. Proj.), 5.125%, 10/1/26 | | 137,847 |
| | CA G.O. Rev. Ref.: | | |
770,000 | | Series 1993 (FSA insured), 5.125%, 10/1/17 | | 770,031 |
60,000 | | Series 1996 (Ambac insured), 5.25%, 6/1/21 | | 60,452 |
495,000 | | CA Govt. Fin. Auth. Lease Rev. Series 2003-A (Placer Co. Transportation Proj.), 6.00%, 12/1/28 | | 539,718 |
| | CA Hlth. Facs. Fin. Auth. Rev.: | | |
500,000 | | Series 1997-B (Cedars-Sinai Med. Ctr. Proj.), 5.125%, 8/1/27 | | |
| | Series 2001 (Casa Colina Proj.): | | 511,815 |
500,000 | | 5.00%, 4/01/08 | | 504,375 |
500,000 | | 5.50%, 4/01/11 | | 523,905 |
500,000 | | CA Fin. Auth. Educ. Rev. Series 2006-A (American Heritage Educ. Fndtn. Proj.), 5.25%, 6/1/26 | | 526,350 |
| | CA Public Works Board Lease Rev. Series 1993-A (Various CA State Univ. Proj.): | | |
300,000 | | 5.25%, 12/1/13 (5) | | 300,318 |
625,000 | | 5.50%, 12/1/18 | | 625,631 |
| | CA Statewide Cmntys. Dev. Auth. Rev. Series: | | |
505,000 | | 2005 (Daughters of Charity Hlth. Proj.), 5.25%, 7/1/11 | | 528,023 |
500,000 | | 2007-B (Kaiser Permanente Proj.), variable rate, 4/1/36 | | 501,250 |
235,000 | | Garden Grove C.O.P Series 1993 (Bahia Village/Emerald Isle Proj.) (FSA insured), 5.70%, 8/1/23 | | |
| | Golden State Tobacco Securitization Corp. Asset-Backed Rev.: | | 235,390 |
| | Series 2005-A: | | |
150,000 | | 5.00%, 6/1/16 | | 150,151 |
2,000,000 | | 5.00%, 6/1/19 | | 2,050,260 |
350,000 | | Series 2007-A1, 4.50%, 6/1/27 | | 340,609 |
1,250,000 | | Interest Appreciation Bonds, zero coupon, 4.55% effective yield, 6/1/22 | | 1,102,000 |
175,000 | | Industry Urban Dev. Agy. Tax Allocation Ref. Series 2002-2, 4.75%, 5/1/21 | | 178,125 |
750,000 | | Intercommunity Hosp. Fin. Auth. C.O.P Series 1998 (ACA insured), 5.25%, 11/1/19 | | 774,173 |
| |
See accompanying notes to portfolios of investments on page 62. | 25 |
| | | | |
| Sit Tax-Free Income Fund | | | |
| March 31, 2007 | | | |
| | | | |
| Portfolio of Investments
| | | |
| | | | |
| | | | |
Quantity ($) | | Name of Issuer | | Market Value ($)(1) |
| | | | |
3,175,000 | | Northern CA Power Agy. Rev. Series 1987-A, 5.00%, 7/1/09 | | 3,177,540 |
685,000 | | Northern CA Tobacco Securitization Auth. Asset-Backed Rev. Series 2005-A1, 4.75%, 6/1/23 | | 682,356 |
500,000 | | Oakland UNI Sch. Dist. Alameda Co. G.O. Series 2005 (MBIA insured), 5.00%, 8/1/24 | | 530,025 |
1,000,000 | | Rancho Cucamonga Redev. Agy. Tax Allocation Series 1996 (MBIA insured), 5.25%, 9/1/16 | | 1,021,250 |
1,000,000 | | San Bernardino City. Sch. Dist. G.O. Cap. Appreciation Series 2007 (MBIA insured), zero coupon, | | |
| | 4.72% effective yield, 8/1/29 | | 337,910 |
2,750,000 | | San Bernardino Co. C.O.P. Series 1996 (Med. Ctr. Fin. Proj.) (MBIA insured), 5.00%, 8/1/28 | | 2,794,963 |
1,000,000 | | San Francisco City & Co. Airpts., Intl. Arpt. Rev. Ref. Series 2001-27B (FGIC insured), 5.125%, 5/1/31 | | 1,039,960 |
750,000 | | San Joaquin Hills Toll Rd. Rev. Refunding Series 1997-A, 5.25%, 1/15/30 | | 765,713 |
500,000 | | Santa Clara Redev. Agy. Tax Allocation Series 2003 (Bayshore North Proj.) (MBIA insured), 5.00%, 6/1/15 | | 501,135 |
| | Santa Rosa Rancheria Tachi Yokut Tribe Enterprise Rev.: | | |
| | Series 2006: | | |
215,000 | | 4.50%, 3/1/11 | | 215,299 |
385,000 | | 4.875%, 3/1/16 | | 389,066 |
2,000,000 | | Series 2001-B, 6.00%, 5/15/22 | | 2,126,700 |
| | | | |
| | | | 27,034,593 |
| | | | |
Colorado (2.5%) | | |
385,000 | | Aurora Golf Course Enterprise Sys. Rev. Ref. Series 2005, 4.00%, 12/1/08 | | 384,553 |
250,000 | | CO Educ. & Cultural Fac. Rev. Ref. Series 2003-C (Cheyenne Mtn. Charter Sch. Proj.), 4.625%, 6/15/12 | | 254,795 |
| | CO HFA Single Family Program Senior Series: | | |
45,000 | | 1996B-2, 7.45%, 11/1/27 | | 45,643 |
40,000 | | 1997B-3, 6.80%, 11/1/28 | | 40,080 |
| | CO Hlth. Fac. Auth. Rev.: | | |
750,000 | | Series 1999 (Steamboat Springs Hlth. Proj.), 5.70%, 9/15/23 | | 781,627 |
260,000 | | Series 2000-A (Porter Place Proj.) (GNMA collateralized), 5.10%, 1/20/11 | | 265,551 |
250,000 | | Series 2005 (Covenant Retirement Cmntys. Proj.), 4.50%, 12/1/07 | | 250,592 |
400,000 | | Series 2005 (Covenant Retirement Cmntys. Proj.), 4.50%, 12/1/08 | | 402,408 |
390,000 | | Unrefunded Balance Rev. Series 2000 (Evangelical Lutheran Proj.), 6.25%, 12/1/10 | | 408,392 |
610,000 | | Prerefunded Rev. Series (Evangelical Lutheran Proj.), 6.25%, 12/1/10 | | 639,573 |
1,500,000 | | Ref. Series 2006-D (Adventist Hlth./Sunbelt Proj.), 5.125%, 11/15/29 | | 1,576,095 |
600,000 | | Denver Hsg. Corp. Multifamily Rev. Ref. Series 1997-A (Section 8), 5.35%, 10/1/12 | | 608,046 |
255,000 | | Denver West Met. Dist. Refunding G.O. Series 2005, 3.40%, 12/1/07 | | 254,092 |
435,000 | | E-470 Pub. Hwy. Auth. Rev. Senior Series 1997-A (MBIA insured), 5.00%, 9/1/26 | | 441,064 |
500,000 | | Inverness Wtr. & Sanitation Dist. Arapahoe & Dougles Cos. G.O. Series 2006-A | | |
| | (Radian insured), 4.60%, 12/1/19 | | 502,780 |
1,000,000 | | Lyons Rev. Series 2006 (Longmont Humane Soc. Proj.), 4.75%, 11/30/16 | | 1,007,270 |
1,250,000 | | Midcities Metro Dist. No. 2 G.O. Ref. & Impt. Series 2006 (Radian insured), 5.125%, 12/1/30 | | 1,316,650 |
205,000 | | SBC Met. Dist. G.O. Ref. Series 2005 (ACA insured), 3.00%, 12/1/07 | | 203,653 |
5,000 | | Thornton Single Family Mtg. Rev. Ref. Series 1992-A, 8.05%, 8/1/09 | | 5,012 |
| | | | |
| | | | 9,387,876 |
| | | | |
Connecticut (1.1%) | | |
960,000 | | CT Dev. Auth. Pollution Ctrl. Rev. Ref. Series 1993-A (CT Light & Power Proj.), 5.85%, 9/1/28 | | 1,005,686 |
| | Mashantucket Western Pequot Tribe Subordinated Special Rev.: | | |
750,000 | | Series 2006-A, 5.50%, 9/1/36 | | 794,040 |
300,000 | | Series 1997-B, 5.75%, 9/1/18 | | 307,356 |
1,850,000 | | Series 1999-B, zero coupon, 5.05% effective yield on purchase date, 9/1/09 | | 1,654,492 |
500,000 | | Series 1999-B, zero coupon, 5.12% effective yield on purchase date, 9/1/26 | | 314,095 |
| | | | |
| | | | 4,075,669 |
| | | | |
Delaware (0.1%) | | |
250,000 | | DE Hlth. Fac. Auh. Rev. Series 2005-A (Beebe Med. Ctr. Proj.), 5.00%, 6/1/07 | | 250,402 |
| | | | |
26
| | | | |
| | |
| |
| | |
| | |
|
| |
| | | | |
| | | | |
Quantity ($) | | Name of Issuer | | Market Value ($)(1) |
|
Florida (8.0%) | | | | |
700,000 | | Belmont Cmnty. Dev. Dist. Cap. Impt. Rev. Series 2006-B, 5.125%, 11/01/14 | | 698,012 |
500,000 | | Capital Trust Agy. Hsg. Rev. Series 2005-B (Sub-Atlandtic Hsg. Foundation Proj.), 4.50%, 7/1/15 | | 505,990 |
| | Capital Trust Agy. Multifamily Rev. Sr. Series 2003-A: | | |
600,000 | | (Golf Villas, Rivermill, and Village Square Apts. Proj.), 4.75%, 6/1/13 | | 585,090 |
1,000,000 | | (American Opportunity Proj.), 5.875%, 6/1/38 | | 1,027,970 |
525,000 | | Collier Co. HFA Multifamily Hsg. Rev. Series 2002-C (Goodlette Arms Proj.), 5.25%, 8/15/15 | | 543,753 |
400,000 | | Connerton West Cmnty. Dev. Dist. Cap. Impt. Spl. Assmt. Rev. Series 2007-B, 5.125%, 5/1/16 | | 400,012 |
385,000 | | Dade Co. Hlth. Fac. Auth. Hosp. Rev. Ref. Series 1993-A (Baptist Hosp. Miami Proj.) (MBIA insured), 5.25%, 5/15/21 | | 385,385 |
| | Escambia Co. Hlth. Facs. Auth. Rev. Series 1998 (Baptist Hosp. & Manor Proj.): | | |
200,000 | | 5.00%, 10/01/08 | | 202,656 |
630,000 | | 5.125%, 10/1/19 | | 641,460 |
100,000 | | Fiddlers Creek Cmnty. Dev. Dist. No. 2 Spl. Assmt. Rev. Series 2003-B, 5.75%, 5/1/13 | | 103,148 |
500,000 | | FL Div. Bd. Fin. Dept. Gen. Svcs. Rev. Series 1997-A, 5.00%, 7/1/11 | | 506,550 |
750,000 | | FL HFC Hsg. Rev. Hsg. Series 2000-D-1 (Augustine Club Apts. Proj.) (MBIA insured), 5.75%, 10/1/30 | | 786,315 |
500,000 | | FL Brd. Educ. Cap. Outlay G.O. Series 1998-A (Pub. Educ. Proj.) (FSA insured), 5.20%, 6/1/23 | | 513,870 |
1,950,000 | | FL University Cap. Impt. Rev. Series 2004, 5.125%, 9/1/33 | | 1,999,140 |
1,000,000 | | Heritage Isle At Viera Cmnty. Dev. Dist. Special Assessment Series 2006, 5.00%, 11/1/13 | | 992,220 |
| | Highlands Co. Hlth. Fac. Auth. Hosp. Rev. (Aventist Hlth. Proj.): | | |
425,000 | | Ref. Series 2005-B, 5.00%, 11/15/30 | | 438,192 |
1,000,000 | | Series 2006-C, 5.25%, 11/15/36 | | 1,056,410 |
500,000 | | Hillsborough Co. Indl. Dev. Auth. Hosp. Rev. Ref. Series 2003-A (Tampa Gen. Hosp. Proj.): 5.25%, 10/1/24 | | 521,510 |
475,000 | | Hillsborough Co. Indl. Dev. Auth. Indl. Rev. Series 1999-A (Hlth. Facs. Proj. - Univ. Cmnty. Hosp.), 5.625%, 8/15/23 | | 493,772 |
250,000 | | Gramercy Farms Cmnty. Dev. Dist. Spl. Assessment Series 2007-B, 5.10%, 5/1/14 | | 249,267 |
500,000 | | Jacksonville Econ. Dev. Commn. Rev. Series 2007-A, 4.55%, 3/1/47 | | 486,085 |
| | Lake Ashton Cmnty. Dev. Dist. Cap. Impt. Spl. Assessment Rev.: | | |
750,000 | | Series 2006-B, 5.00%, 11/1/11 | | 749,723 |
| | Lakeland Hosp. Sys. Rev. Ref. Series 1997 (Lakeland Regl. Med. Center Proj.): | | |
400,000 | | (MBIA insured), 5.00%, 11/15/22 | | 405,732 |
| | Lee Co. Indus. Dev. Auth. Hlth. Care Fac. Rev.: | | |
545,000 | | Series 1999-A (ShellPoint Village Proj.), 5.50%, 11/15/08 | | 559,786 |
1,000,000 | | Series 2007-A (Lee Charter Foundation), 5.25%, 6/15/27 | | 1,006,990 |
585,000 | | Marion Co. Hosp. Dist. Rev. Ref. Series 1999 (Munroe Regl. Med. Ctr. Proj), 5.25%, 10/1/10 | | 608,400 |
405,000 | | Martin Co. Hlth. Fac. Auth. Hosp. Rev. Ref. Series 2002-B (Martin Memorial Med. Ctr. Proj.), 4.875%, 11/15/12 | | 413,060 |
500,000 | | Miami - Dade Co. Spl. Obligation Sub. Series 1997-B, 5.00%, 10/1/37 | | 510,325 |
1,000,000 | | New River Cmnty. Dev. Dist. Cap. Impt. Spl. Assessment Rev. Series 2006-B, 5.00%, 5/1/13 | | 992,720 |
| | North Broward Hosp. Dist. Rev. Series 1997 (MBIA insured): | | |
180,000 | | Unrefunded Balance Series, 5.375%, 1/15/24 | | 181,987 |
1,000,000 | | Orange Co. Hlth. Fac. Auth. Rev. Series 2006-B (Orlando Regl. Hlth. Care Proj.), 5.125%, 11/15/39 | | 1,040,150 |
| | Palm Beach Co. Hlth. Fac. Auth. Rev. Ref.: | | |
200,000 | | Series 2003 (Abbey Delray South Proj.), 5.15%, 10/1/12 | | 207,458 |
| | Pinellas Co. Educ. Fac. Auth. Rev. Series 2006 (Eckerd College Proj.) (ACA insured): | | |
350,000 | | 4.50%, 10/1/14 | | 357,035 |
680,000 | | 4.625%, 10/1/16 | | 694,430 |
3,105,000 | | Port Everglades Auth. Rev. Ref. Series 1989-A (FSA insured), 5.00%, 9/1/16 | | 3,113,197 |
750,000 | | Riverwood Estates Cmnty. Dev. Dist. Spl. Assessment Series 2006-B, 5.00%, 5/1/13 | | 748,140 |
| |
See accompanying notes to portfolios of investments on page 62. | 27 |
| | | | |
| Sit Tax-Free Income Fund | | | |
| March 31, 2007 | | | |
| | | | |
| Portfolio of Investments | | | |
| | | | |
| | | | |
Quantity ($) | | Name of Issuer | | Market Value ($)(1) |
|
250,000 | | Sarasota Natl. Cmnty. Dev. Dist. Spl. Assessment Rev. Series 2007, 5.30%, 5/1/39 | | 248,955 |
500,000 | | St. Johns Co. Indl. Dev. Auth. Hlth. Care Rev. Ref. Series 2007-A (Bayview Proj.), 5.00%, 10/1/17 | | 502,435 |
250,000 | | South Broward Hosp. Dist. Rev. Ref. Series 2007 (South Broward Hosp. Dist. Proj.), 4.75%, 5/1/24 | | 256,648 |
| | South Lake Co. Hosp. Dist. Rev. Series 2003 (South Lake Hosp. Inc. Proj.): | | |
190,000 | | 4.25%, 10/1/08 | | 190,000 |
700,000 | | 5.50%, 10/1/13 | | 741,104 |
500,000 | | South Miami Hlth. Fac. Auth. Hosp. Rev. Series 2003 (Baptist Hlth. So. FL Grp. Proj.), 5.20%, 11/15/28 | | 522,140 |
750,000 | | Sterling Hill Cmnty. Dev. Dist. Cap. Impt. Spl. Assessment Rev. Series, 5.10%, 5/1/11 | | 751,613 |
1,000,000 | | Verano Ctr. Cmnty. Dev. Dist. Spl. Assessment Series 2006-B (Dist. No. 1 Infrastructure Proj.). 5.00%, 11/1/12 | | 994,670 |
750,000 | | Waters Edge Cmnty. Dev. Dist. Cap. Impt. Spl. Assessment Rev. Series 2006-B, 5.00%, 11/1/12 | | 746,003 |
500,000 | | Zephyr Ridge Cmnty. Dev. Dist. Spl. Assessment Rev. Series 2006-B, 5.25%, 5/1/13 | | 498,435 |
| | | | |
| | | | 30,177,943 |
| | | | |
| | | | |
Georgia (1.4%) | | | | |
500,000 | | Atlanta Dev. Auth. Rev. Series 2005-C (Tuff ATDC Proj.), 5.00%, 1/1/31 | | 516,175 |
750,000 | | Chatham Co. Hosp. Auth. Rev. & Impt. Series 2004-A (Mem. Health Univ. Proj.), 5.50%, 1/1/34 | | 794,992 |
590,000 | | Cobb Co. Dev. Auth. Pkg. Rev. Series 2004 (Kennesaw State Univ. Fdn., Inc. Proj.) (MBIA insured), 5.00%, 7/15/29 | | 620,102 |
1,500,000 | | East Point Tax Allocation Series 2002-A, 8.00%, 2/1/26 | | 1,706,835 |
250,000 | | Gainesville Redev. Auth. Educ. Facs. Rev. Ref. Series 2007 (Riverside Military Academy Proj.), 5.125%, 3/1/27 | | 257,037 |
250,000 | | Medical Ctr. Hosp. Auth. Rev. Ref. Series 2007 (Spring Harbor Green Isl. Proj.), 5.25%, 7/1/27 (9) | | 255,348 |
| | Private Colleges & Univ. Auth. Rev. Ref.: | | |
| | Series 1999-A (Mercer Univ. Proj.): | | |
300,000 | | 4.45%, 10/1/07 | | 300,309 |
750,000 | | 5.25%, 10/1/14 | | 768,540 |
100,000 | | Series 2001 (Mercer Univ. Proj.), 5.00%, 10/1/11 | | 102,208 |
| | | | |
| | | | 5,321,546 |
| | | | |
Illinois (14.2%) | | | | |
300,000 | | Annawan Tax Allocation Series 2007 (Patriot Renewable Fuels, LLC Proj.), 5.625%, 1/1/18 | | 298,560 |
475,000 | | Blue Island Tax Increment G.O. Ref. Series 1997 (MBIA insured), 5.10%, 12/15/12 | | 479,546 |
| | Broadview Village of Cook Co. Tax Increment Rev. Series 1999: | | |
1,410,000 | | 5.00%, 7/1/07 | | 1,411,706 |
1,085,000 | | 5.05%, 7/1/08 | | 1,092,801 |
2,030,000 | | 5.10%, 7/1/09 | | 2,058,461 |
500,000 | | Chicago Brd. Educ. G.O. Series 1997-A (Chicago School Reform Proj.), 5.25%, 12/1/22 | | 514,170 |
585,000 | | Chicago G.O. Series 1996-B (FGIC insured), Unrefunded, 5.125%, 1/1/25 | | 590,054 |
30,000 | | Chicago Metro Hsg. Dev. Corp. Mtg. Rev. Ref. Series 1992-A (FHA insured) (Section 8), 6.85%, 7/1/22 | | 30,763 |
250,000 | | Cook Co. Sch. Dist. No. 95 G.O. Series 2007, 5.25%, 12/1/24 (9) | | 251,452 |
250,000 | | Cortland Spl. Service Area No. 001 Spl. Tax Ref. Series 2007 (Assured Guaranty Insured), 4.70%, 3/1/32 (9) | | 248,683 |
250,000 | | Du Page Co. Spl. Svc. Areano 31 Spl. Tax Series 2006 (Monarch Landing Proj.), 5.40%, 3/1/16 | | 260,770 |
100,000 | | IL DFA Rev. Series 1998 (St. Patrick High School Proj.), 5.125%, 7/15/28 | | 100,957 |
380,000 | | IL DFA Rev. Series 2002-A (Chicago Charter School Fdn. Proj.), 5.25%, 12/1/12 | | 392,563 |
500,000 | | IL DFA Rev. Ref. Series 2007 (Chicago Charter School Fdn. Proj.), 5.00%, 12/1/36 | | 512,690 |
1,250,000 | | IL DFA Pollution Control Rev. Ref. Series 2000-A (Ameren CIPS Proj.), 5.50%, 3/1/14 | | 1,257,987 |
| | IL DFA Refunding & New Money Rev. (Cmty. Rehab. Providers Fac. Acquisition Program): | | |
1,740,000 | | Series 1997-A, 5.80%, 7/1/08 | | 1,763,734 |
2,635,000 | | Series 1997-A, 6.05%, 7/1/19 | | 2,671,258 |
300,000 | | Series 1997-A, 5.90%, 7/1/09 | | 304,167 |
28
| | | | |
| | |
| |
| | |
| | |
|
| |
| | | | |
| | | | |
Quantity ($) | | Name of Issuer | | Market Value ($)(1) |
|
4,765,000 | | Series 1997-A, 6.00%, 7/1/15 | | 4,829,899 |
1,240,000 | | Series 1997-C, 5.65%, 7/1/19 | | 1,268,718 |
1,000,000 | | Series 1998-A, 5.50%, 7/1/12 | | 1,023,150 |
275,000 | | Series 1998-A, 5.70%, 7/1/19 | | 281,561 |
305,000 | | Series 2002-A (Cmnty. Rehab. Providers Fac. Proj.), 5.70%, 7/1/12 | | 315,727 |
| | IL Fin. Auth. Rev.: | | |
500,000 | | Ref. Series 2006 (Luther Hillside Village Proj.), 5.25%, 2/1/37 | | 525,045 |
700,000 | | Series 2006-A (Three Crowns Park Plaza Proj.), 5.875%, 2/15/38 | | 735,231 |
500,000 | | Series 2006-B2 (Three Crowns Park Plaza Proj.), 5.40%, 2/15/38 | | 500,815 |
| | Series 2006 (Tabor Hills Supportive Living Proj.): | | |
1,000,000 | | 4.40%, 11/15/12 | | 996,510 |
500,000 | | 5.25%, 11/15/26 | | 514,430 |
| | Series 2006-A (Montgomery Place Proj.): | | |
1,250,000 | | 5.25%, 5/15/15 | | 1,272,500 |
500,000 | | 5.75%, 5/15/38 | | 520,800 |
1,250,000 | | IL Educ. Facs. Auth. Rev. Series 1998-A (Univ. Chciago Proj.) (MBIA-IBC Insured), 5.125%, 7/1/38 | | 1,278,837 |
5,000 | | IL HDA Multifamily Rev. Series 1994-5 (Section 8), 6.75%, 9/1/23 (Section 8), 4.75%, 9/1/23 | | 5,057 |
500,000 | | IL Fin. Auth. Educ. Rev. Series 2006-E (Uno Charter School Network Proj.) (ACA Insured), 5.00%, 9/1/26 | | 519,785 |
| | IL Hlth. Fac. Auth. Rev.: | | |
940,000 | | Ref. Series 1994 (Passavant Memorial Area Hospital Assn.) (MBIA insured), 5.95%, 10/1/11 | | 978,455 |
1,895,000 | | Ref. Series 1993-A (Edward Hosp. Proj.), 6.00%, 2/15/19 | | 1,895,701 |
| | Ref. Series 1993-A (Hinsdale Hosp Proj.): | | |
300,000 | | 7.00%, 11/15/19 | | 314,205 |
4,100,000 | | (Ambac Insured), 7.00%, 11/15/19 | | 4,294,135 |
1,500,000 | | Ref. Series 1993-B (Glen Oaks Proj.) (Ambac Insured), 7.00%, 11/15/19 | | 1,571,025 |
55,000 | | Unrefunded Balance Series 1996 (MBIA insured), 5.80%, 8/15/16 | | 56,484 |
350,000 | | Ref. Series 1996-B (Sarah Bush Lincoln Hlth. Ctr. Proj.), 5.50%, 2/15/16 | | 357,280 |
125,000 | | Series 1997-A (Edward Oblig Group Proj.) (Ambac insured), 5.25%, 2/15/27 | | 127,912 |
660,000 | | Ref. Series 1999 (Silver Cross Hosp. Proj.), 5.25%, 8/15/15 | | 676,269 |
970,000 | | Ref. Series 2001 (Decatur Memorial Hospital Proj.), 4.625%, 10/1/08 | | 978,051 |
500,000 | | Series 2000 (IA Health System Proj.), 6.75%, 2/15/13 | | 545,560 |
1,150,000 | | Ref. Series 2003 (Sinai Health Proj.) (FHA Insured), 5.10%, 8/15/33 | | 1,192,849 |
200,000 | | IL Sales Tax Rev. Series 1994-U, 5.00%, 6/15/10 | | 200,194 |
| | Lombard Public Facs. Corp. Rev. First Tier Series 2005-A1 (Conference Ctr. & Hotel Proj.): | | |
115,000 | | 6.375%, 1/1/15 | | 118,772 |
750,000 | | (ACA insured) 5.50%, 1/1/25 | | 812,175 |
1,000,000 | | (ACA insured) 5.50%, 1/1/30 | | 1,081,390 |
2,000,000 | | Malta Tax Allocation Rev. Series 2006, 5.75%, 12/30/25 | | 2,010,600 |
250,000 | | Melrose Park Tax Increment G.O. Series 1999-A (FSA insured), 5.25%, 12/15/15 | | 256,343 |
| | Southwestern IL Dev. Auth. Rev. Series 1999 (Anderson Hosp. Proj.): | | |
750,000 | | 5.375%, 8/15/15 | | 772,493 |
2,625,000 | | 5.625%, 8/15/29 | | 2,705,903 |
| | Southwestern IL Dev. Auth. Local Govt. Prog. Rev.: | | |
2,300,000 | | Series 1998-A (City of East St. Louis Proj.) Tax Increment Financing Proj., 6.00%, 4/1/10 | | 2,274,608 |
500,000 | | Series 2006 (Village of Sauget Proj.), 5.625%, 11/1/26 | | 508,870 |
335,000 | | Upper Illinois River Valley Dev. Auth. Rev. Series 2001 (Morris Hosp. Proj.), 6.05%, 12/1/11 | | 359,981 |
440,000 | | Will Co. Spl. Educ. Rev. Series 2006, 5.40%, 1/1/18 | | 474,100 |
500,000 | | Will Co. Student Hsg. Rev. Series 2002-A (Joliet Junior College Proj.), 6.375%, 9/1/13 (7) (8) | | 307,480 |
| | | | |
| | | | 53,699,222 |
| | | | |
| |
See accompanying notes to portfolios of investments on page 62. | 29 |
| | | | |
| Sit Tax-Free Income Fund | | | |
| March 31, 2007 | | | |
| | | | |
| Portfolio of Investments | | | |
| | | | |
| | | | |
Quantity ($) | | Name of Issuer | | Market Value ($)(1) |
|
Indiana (3.1%) | | | | |
500,000 | | Anderson Economic Dev. Rev. Ref. & Impt. Series 2007 (Anderson Univ. Proj.), 4.75%, 10/1/21 | | 501,435 |
100,000 | | Bloomington Sewer Wks. Rev. Series 1999-A (MBIA insured), 5.20%, 1/1/29 | | 104,017 |
500,000 | | Boone Co. Redev. Tax Increment Rev. Series 2005-B, 5.375%, 8/1/23 | | 536,475 |
100,000 | | Elkhart Co. Ind. Hosp. Auth. Rev. Series 1998 (Elkhart General Hosp. Proj.), 5.25%, 8/15/28 | | 103,160 |
400,000 | | IN Hlth. & Educ. Fac. Fin. Auth. Rev. Series 2005 (Baptist Homes of IN Proj.), 5.25%, 11/15/25 | | 419,768 |
215,000 | | IN Hlth. Fac. Fin. Auth. Hlth. Fac. Rev. Series 1998 (Holy Cross Health Sys. Corp. Proj.) (MBIA insured), 5.00%, 12/1/28 | | 219,251 |
| | IN Hlth. Fac. Fin. Auth. Hosp. Rev.: | | |
| | Series 1993 (Community Hosp. of Anderson Proj.) (MBIA insured): | | |
120,000 | | 6.00%, 1/1/14 | | 122,257 |
650,000 | | 6.00%, 1/1/23 | | 650,864 |
600,000 | | Ref. Series 1998 (Floyd Memorial Hosp. & Hlth. Svcs. Proj.), 5.25%, 2/15/18 | | 613,110 |
| | Series 2001-A (Community Foundation Northwest IN): | | |
1,000,000 | | 6.00%, 8/1/07 | | 1,004,840 |
1,000,000 | | 6.00%, 8/1/08 | | 1,019,170 |
1,320,000 | | 5.50%, 8/1/13 | | 1,370,503 |
405,000 | | 6.375%, 8/1/21 | | 434,448 |
190,000 | | 6.375%, 8/1/31 | | 202,967 |
300,000 | | Series 2004-A (Community Foundation Northwest IN), 4.75%, 3/1/14 | | 300,288 |
500,000 | | IN HFA Single Family Mtg. Rev. Ref. Series 1992-A, 6.80%, 1/1/17 | | 512,240 |
| | IN Hlth. Fac. Fin. Auth. Rev. Ref. Series 1998: | | |
170,000 | | (Greenwood Village South Proj.), 5.35%, 5/15/08 | | 170,087 |
1,875,000 | | (Marquette Manor Proj.), 5.00%, 8/15/18 | | 1,878,937 |
1,155,000 | | IN State Dev. Fin. Auth. Rev. Educ. Facs. Series 2003 (Archdiocese Indpls. Proj.), 5.50%, 1/1/33 | | 1,227,603 |
125,000 | | Shelby Co. Indl. Jail Bldg. Corp. Rev. Ref. Series 1996 (First Mtg. Proj.) (MBIA insured), 5.30%, 7/15/07 | | 125,563 |
| | | | |
| | | | 11,516,983 |
| | | | |
Iowa (1.2%) | | | | |
500,000 | | Carroll Co. Hosp. Rev. Series 2006-A (St. Anthony Regl. Hosp. Proj.), 5.00%, 11/1/31 | | 506,055 |
| | Coralville Urban Renewal Rev. Tax Increment Series 2006-A: | | |
240,000 | | 5.00%, 6/1/11 | | 243,134 |
115,000 | | 5.00%, 6/1/12 | | 116,876 |
120,000 | | 5.00%, 6/1/14 | | 121,025 |
185,000 | | 5.00%, 6/1/15 | | 186,243 |
405,000 | | Dickinson Co. Hsg. Sr. Rev. Series 2006-A (Spirit Lake - GEAC LLC Proj.), 5.375%, 12/1/16 | | 403,096 |
345,000 | | Iowa Fin. Auth. Cmnty. Provider Rev. Series 2007 (Boys & Girls Proj.), 5.40%, 12/1/10 | | 344,517 |
350,000 | | IA Fin. Auth. Sr. Hsg. Rev. Ref. Series 2006-A (Bethany Life Cmntys. Proj.), 5.20%, 11/1/16 | | 350,137 |
1,130,000 | | IA Fin. Auth. Multifamily Hsg. Rev. Ref. Series 1997-A (Kingswood Apts. Proj.) (GNMA-collateralized), 6.15%, 5/1/32 | | 1,153,854 |
| | IA Fin. Auth Single Family Rev. Series 2000-D (GNMA/FNMA Mtg. Backed Securities Proj.): | | |
110,000 | | 5.65%, 7/1/07 | | 110,179 |
100,000 | | 5.75%, 7/1/09 | | 102,716 |
500,000 | | Palo Alto Co. Hosp. Rev. Series 2006 (Palo Alto Co. Hosp. Proj.), 5.25%, 8/1/24 | | 510,470 |
400,000 | | Washington Co. Hosp. Rev. Series 2006 (Washington Co. Hosp. Proj.), 5.125%, 7/1/15 | | 408,196 |
| | | | |
| | | | 4,556,498 |
| | | | |
Kansas (0.0%) | | | | |
35,000 | | Olathe & Labette Cos. Mtg. Loan Rev. Series 1991-B (GNMA collateralized) zero coupon, 7.56% effective yield on purchase date, 2/1/23 | | 11,541 |
| | | | |
30
| | | | |
| | |
| |
| | |
| | |
|
| |
| | | | |
| | | | |
Quantity ($) | | Name of Issuer | | Market Value ($)(1) |
|
Kentucky (0.1%) | | | | |
250,000 | | Dawson Springs Water & Sewer Rev. Ref. Series 1997, 5.10%, 9/1/13 | | 256,153 |
| | | | |
Louisiana (1.9%) | | | | |
7,200,000 | | Capital Appreciation Series 2000-D1 (GNMA & FNMA collateralized) zero coupon, 6.46% effective yield, 4/1/34 | | 1,310,688 |
400,000 | | Denham Springs - Livingston Hsg. & Mtg. Rev Series 2007, 5.00%, 11/1/40 (9) | | 414,496 |
| | East Baton Rouge Fin. Auth. Single Family Mtg. Rev. Ref Series 2007-A: | | |
750,000 | | 4.40%, 10/1/23 | | 752,077 |
500,000 | | 4.50%, 10/1/28 | | 497,950 |
500,000 | | New Orleans Auth. Spl. Tax Sr. Sub. Series 2003-A (Ernest N Morial Proj.) (Ambac Insured), 5.25%, 7/15/28 | | 531,570 |
| | Jefferson Parish Fin. Auth. Single Family Mtg. Rev. Series 2007-D: | | |
300,000 | | 4.00%, 12/1/23 | | 300,165 |
900,000 | | 5.00%, 6/1/38 | | 945,873 |
500,000 | | Juban Park Cmnty. Dev. Dist. Special Assessment Series 2006, 5.15%, 10/1/14 | | 501,420 |
500,000 | | LA Hsg. Fin. Agy. Single Family Mtg. Rev Series 2007-A1 (Home Ownership Proj.), 4.40%, 12/1/23 | | 500,600 |
500,000 | | LA Public Facs. Auth. Rev. Series 1995-A (Glen Retirement Sys. Proj.), 6.50%, 12/1/15 | | 504,940 |
425,000 | | St. Tammany Parish Fin. Auth. Single Family Mtg. Rev. Series 2007-A: | | |
| | (Home Ownership Prog. Proj.) (GNMA/FNMA/FHLMC Backed Securities Proj.), 5.25%, 12/1/39 | | 451,435 |
450,000 | | South LA Port Common Rev. Ref. Series 1997 (Cargill, Inc. Proj.), 5.85%, 4/1/17 | | 459,369 |
| | | | |
| | | | 7,170,583 |
| | | | |
Maine (0.5%) | | | | |
1,000,000 | | Skowhegan Pollution Ctrl. Rev. Ref. Series 1993 (Scott Paper Co. Proj.), 5.90%, 11/1/13 | | 1,001,720 |
1,000,000 | | South Berwick Educ. Rev. Series 1998 (Berwick Academy Issue), 5.25%, 8/1/13 | | 1,020,150 |
| | | | |
| | | | 2,021,870 |
| | | | |
Maryland (0.4%) | | | | |
200,000 | | Howard Co. Retirement Cmnty. Rev. Ref. Series 2007-A (Vantage House Fac. Proj.), 4.50%, 4/1/10 (9) | | 199,722 |
310,000 | | MD Economic Dev. Corp. Rev. Ref. Sr. Lien Series 2006-A (Chesapeake Bay Proj.), 4.75%, 12/1/11 | | 311,851 |
1,150,000 | | MD Hlth. & Hgr. Educ. Fac. Auth. Rev. Series 2007-B (King Farm Presbyterian Cmnty. Proj.), 4.75%, 1/1/13 | | 1,151,840 |
| | | | |
| | | | 1,663,413 |
| | | | |
Massachusetts (1.5%) | | | |
380,000 | | Lynn Mass. Wtr. & Swr. Rev. Series 2003-A (MBIA Insured), 5.00%, 12/1/32 | | 401,120 |
2,000,000 | | MA St. College Bldg. Auth. Proj. Rev. Series 1999-1 (MBIA Insured), 5.375%, 5/1/39 | | 2,077,340 |
250,000 | | MA Hlth. & Educ. Fac. Auth. Rev. Series 1993-E (South Shore Hosp. Proj.) (MBIA insured), 5.50%, 7/1/20 | | 252,953 |
| | MA Dev. Fin. Agy. Rev. | | |
| | Series 2005 (Evergreen Ctr., Inc.): | | |
195,000 | | 4.00%, 1/1/08 | | 194,105 |
200,000 | | 4.00%, 1/1/09 | | 197,956 |
500,000 | | Series 2005-A (Curry College Proj.) (ACA Insured), 4.55%, 3/1/16 | | 509,350 |
| | MA Indus. Fin. Agy. Rev. Series: | | |
600,000 | | 1995 (St. Mark’s School Issue), 6.00%, 1/1/15 | | 609,258 |
1,250,000 | | 1997 (Trustees Deerfield Academy Proj.), 5.00%, 10/1/23 | | 1,280,388 |
| | | | |
| | | | 5,522,470 |
| | | | |
Michigan (2.4%) | | | | |
| | Chandler Park Academy Public School Rev. Series 2005: | | |
80,000 | | 3.60%, 11/1/07 | | 79,560 |
125,000 | | 4.00%, 11/1/09 | | 123,366 |
500,000 | | 5.00%, 11/1/22 | | 507,650 |
1,000,000 | | Kent Hosp. Fin. Auth. Rev. Series 2005-A (Met Hosp. Proj.), 6.00%, 7/1/35 | | 1,096,960 |
| |
See accompanying notes to portfolios of investments on page 62. | 31 |
| | | | |
| Sit Tax-Free Income Fund | | | |
| March 31, 2007 | | | |
| | | | |
| Portfolio of Investments | | | |
| | | | |
| | | | |
Quantity ($) | | Name of Issuer | | Market Value ($)(1) |
|
| | Kentwood Econ. Dev. Ltd. Oblig. Series 2006-A (Holland Home Proj.): | | |
1,000,000 | | 5.25%, 11/15/26 | | 1,038,990 |
500,000 | | 5.375%, 11/15/36 | | 521,530 |
| | MI Pub. Educ. Facs. Auth Ltd. Obligation Rev. Ref. Series 2006 (Black River School Proj.): | | |
115,000 | | 5.125%, 9/1/11 | | 115,446 |
250,000 | | 5.50%, 9/1/19 | | 255,145 |
635,000 | | MI Hosp. Fin. Auth. Rev. Ref. Series 1997-A (Detroit Medical Gr.), 5.25%, 8/15/27 | | 650,189 |
750,000 | | MI Strategic Fund Ltd. Obligation Rev. Ref. Series 2003 (Dow Chemical Proj.) (Mandatory Put 6/1/08), 4.60%, 6/1/14 | | 755,670 |
750,000 | | Monroe Co. Hosp. Fin. Auth. Hosp. Rev. Ref. Series 2006 (Mercy Memorial Hosp. Proj.), 5.375%, 6/1/26 | | 786,458 |
500,000 | | Plymouth Educ. Ctr. Charter Schl. Academy Rev. Ref. Series 2005, 5.00%, 11/1/11 | | 507,545 |
300,000 | | Pontiac Tax Increment Fin. Auth. Rev. Ref. Series 2002 (Dev. Area 2 Proj.) (ACA insured), 5.625%, 6/1/22 | | 319,776 |
2,095,000 | | Southfield Econ. Dev. Corp. Ltd. Obligation Rev. Series 1998-A (Lawrence Tech. Univ. Proj.), 5.25%, 2/1/13 | | 2,127,200 |
| | | | |
| | | | 8,885,485 |
| | | | |
Minnesota (2.0%) | | | | |
740,000 | | Hopkins Multifamily Hsg. Rev. Series 1996 (Hopkins Renaissance Proj.) (Section 8), 6.375%, 4/1/20 | | 756,176 |
5,000,000 | | Intermediate Sch. Dist. 287 Lease Rev. Series 2006, 5.295%, 11/1/32 | | 5,114,850 |
1,000,000 | | MN St. Hgr. Educ. Fac. Auth. Rev. Series 2006-6M (College of St. Benedict Proj.), 4.493%, 10/1/16 | | 1,010,890 |
600,000 | | St. Paul Hsg. & Redev. Auth. Rev. Series 2006 (Nursing Home NTS-Episcopal Proj.), 5.63%, 10/1/33 | | 617,616 |
| | | | |
| | | | 7,499,532 |
| | | | |
Mississippi (0.5%) | | | | |
| | MS Dev. Bank Spl. Oblig. Rev. Ref.: | | |
325,000 | | Series 1998 (Three Rivers Solid Waste Proj.), 5.125%, 7/1/14 | | 325,140 |
| | Series 2006-B (Magnolia Regl. Hlth. Ctr. Proj.): | | |
1,000,000 | | 5.00%, 10/1/13 | | 1,028,310 |
200,000 | | 4.00%, 10/1/08 | | 199,798 |
100,000 | | MS Business Fin. Corp. Hlth. Fac. Rev. Series 1998 (Rush Medical Foundation Inc. Proj.), 5.375%, 7/1/15 | | 103,848 |
365,000 | | MS Hosp. Equip. & Facs. Auth. Rev. Series 2007-A (MS Baptist Hlth. Sys. Inc. Proj.), 5.00%, 8/15/26 | | 379,056 |
| | | | |
| | | | 2,036,152 |
| | | | |
Missouri (2.5%) | | | | |
1,000,000 | | Cameron Indl. Dev. Auth. Rev. Ref. Series 2000 (Cameron Cmnty. Hosp. Proj.) (ACA insured), 5.80%, 12/1/09 | | 1,015,970 |
| | Cape Girardeau Co. Indl. Dev. Auth. Hlth. Care Fac. Rev.: | | |
500,000 | | Series 2002 (Southeast MO Hosp. Assoc. Proj.), 5.75%, 6/1/32 | | 526,855 |
1,000,000 | | Series 2007 (Southeast MO Hosp. Assoc. Proj.), 5.00%, 6/1/36 (9) | | 1,016,640 |
500,000 | | Chillicothe Tax Increment Rev Series 2006 (South U.S. 65 Proj.), 5.625%, 4/1/27 | | 513,315 |
155,000 | | Greene Co. C.O.P. Series 2000 (Law Enforcement Proj.), 5.50%, 7/1/09 (5) | | 157,678 |
335,000 | | Hannibal Indl. Dev. Auth. Tax Increment & Transn. Dev. Rev. Ref. & Impt. Series 2006(Stardust-Munger Proj.), 4.70%, 4/15/23 | | 335,479 |
| | MO Dev. Finance Board Infrastructure Fac. Rev.: | | |
| | Series 2000A (Eastland Ctr. Proj. Phase 1): | | |
710,000 | | 5.75%, 4/1/09 | | 721,637 |
550,000 | | 5.75%, 4/1/12 | | 566,583 |
1,000,000 | | Series 2000-B (Eastland Ctr. Proj. Phase 2), 6.00%, 4/1/15 | | 1,037,190 |
| | MO Hlth. & Educ. Fac. Auth. Rev. Series: | | |
500,000 | | 2005-A (Sr. Living Fac.-Lutheran Sr. Svcs. Proj.), 5.375%, 2/1/35 | | 524,215 |
500,000 | | 2007-A (Sr. Living Fac.-Lutheran Sr. Svcs. Proj.), 4.875%, 2/1/18 | | 512,340 |
700,000 | | MO Hlth. & Educ. Fac. Auth. Educ. Fac. Rev. Series 1999 (Park College Proj.), 5.55%, 6/1/09 | | 699,776 |
| | MO Environmental Impt. & Energy Res. Auth. Water Fac. Rev. Ref.: | | |
825,000 | | Series 1996, 5.25%, 12/1/09 | | 834,248 |
32
| | | | |
| | |
| |
| | |
| | |
|
| |
| | | | |
| | | | |
Quantity ($) | | Name of Issuer | | Market Value ($)(1) |
|
150,000 | | Series 1999 (Tri-Co. Water Auth. Proj.) (Radian insured), 5.50%, 4/1/07 | | 150,006 |
500,000 | | St. Louis Indl. Dev. Auth. Tax Allocation Rev. Series 2006 (Southtown Redev. Proj.), 5.125%, 5/1/26 | | 502,050 |
275,000 | | Univ. City Indl. Dev. Auth. Hsg. Rev. Ref. Series 1995-A (Canterbury Proj., 5.75%, 12/20/15 | | 275,300 |
| | | | |
| | | | 9,389,282 |
| | | | |
Montana (0.3%) | | | | |
977,367 | | MT Fac. Fin. Auth. Rev. Series 2005 (Great Falls Pre-Release Svcs. Proj.), 5.08%, 4/1/21 | | 1,015,856 |
| | | | |
Nebraska (0.2%) | | | | |
| | Douglas Co. San. & Impt.: | | |
200,000 | | Dists. No. 420 G.O. Series 2003, 5.75%, 10/15/26 | | 202,076 |
220,000 | | Dists. No. 375 G.O. Series 2003 (Walnut Ridge Proj.), 5.30%, 12/15/23 | | 223,557 |
500,000 | | Mead Vlg. Tax Allocation Rev. Series 2006-A (E3 Biofuels - Mead LLC Proj.), 5.125%, 7/1/12 | | 499,730 |
| | | | |
| | | | 925,363 |
| | | | |
Nevada (0.6%) | | | | |
1,000,000 | | Clark Co. Poll. Ctrl. Rev. Ref. Series 1995-D (Nev. Pwr. Co. Proj.) (ACA-CBI Insured), 5.30%, 10/1/11 | | 1,005,780 |
600,000 | | Las Vegas Paiute Tribe Rev. Series 2002A (ACA insured), 6.625%, 11/1/17 | | 667,074 |
340,000 | | North Las Vegas LOC Impt. Spl. Assessment Ref. Sub. Spl. Series 2006-B (Impt. Dist. No. 60), 4.50%, 12/1/10 | | 340,435 |
140,000 | | NV Hsg. Dev. SF Mtg. Program Mezzanine Series 1998B-1, 5.30%, 4/1/16 | | 143,506 |
| | | | |
| | | | 2,156,795 |
| | | | |
New Hampshire (1.3%) | | | | |
| | Manchester Hsg. & Redev. Auth. Rev.: | | |
300,000 | | Series 2000-B (Radian insured) zero coupon, 5.25% effective yield, 1/1/19 | | 177,819 |
890,000 | | Series 2000-A (ACA insured), 6.75%, 1/1/15 | | 956,278 |
| | NH Hlth. & Educ. Fac. Auth. Rev.: | | |
500,000 | | Series 2004 (Covenant Hlth. Proj.), 5.00%, 7/1/14 | | 520,315 |
485,000 | | Series 2006 (The Memorial Hosp. Proj.), 5.25%, 6/1/16 | | 512,053 |
615,000 | | Series 2006-A (Havenwood-Heritage Heights Proj.), 5.00%, 1/1/16 | | 617,116 |
| | NH Hlth. & Educ. Facs. Auth. Hosp. Rev. Series 2004 (Speare Mem. Hosp. Proj.): | | |
255,000 | | 5.00%, 7/1/10 | | 256,729 |
500,000 | | 5.00%, 7/1/16 | | 504,335 |
690,000 | | NH Higher Educ. & Hlth. Fac. Auth. Rev. Series 1997 (Catholic Charities Proj.), 5.75%, 8/1/12 | | 700,771 |
135,000 | | NH Higher Educ. & Hlth. Fac. Auth. Rev. Series 1997 (Monadnock Cmnty. Hosp.), 5.25%, 10/1/07 | | 135,598 |
265,000 | | NH Higher Educ. & Hlth. Fac. Auth. Rev. Series 1998 (New Hampton School), 5.00%, 10/1/08 | | 266,330 |
190,000 | | NH Higher Educ. & Hlth. Fac. Auth. Rev. Series 1998 (Rivier College Proj.), 5.55%, 1/1/18 | | 195,542 |
| | | | |
| | | | 4,842,886 |
| | | | |
New Jersey (0.4%) | | | | |
365,000 | | NJ Hlth. Care Facs. Fin. Auth. Rev. Series 1997 (Capital Health Sys. Proj.), 5.125%, 7/1/12 | | 373,508 |
1,000,000 | | Tobacco Settlement Fin. Corp. Series 2007-1A, 5.00%, 6/1/41 | | 974,050 |
| | | | |
| | | | 1,347,558 |
| | | | |
New Mexico (0.4%) | | | | |
665,000 | | NM MFA Forward Mortgage-Backed Series 1995-E (GNMA collateralized), 6.95%, 1/1/26 | | 672,741 |
500,000 | | NM Hsg. Auth. Region III Multifamily Hsg. Rev. Series 2003-A (Villa Del Oso Apts. Proj.), 6.00%, 7/1/17 | | 531,105 |
250,000 | | NM State Hosp. Equip. Ln. Council Hosp. Rev. Ref. Series 2007-A (Rehoboth Proj.), 5.00%, 8/15/17 | | 247,793 |
160,000 | | Taos Co. Gross Receipts Tax Rev. Series 2004 (Co. Education Improvement Proj.), 3.25%, 10/1/08 | | 158,152 |
| | | | |
| | | | 1,609,791 |
| | | | |
| |
See accompanying notes to portfolios of investments on page 62. | 33 |
| | | | |
| Sit Tax-Free Income Fund | | | |
| March 31, 2007 | | | |
| | | | |
| Portfolio of Investments | | | |
| | | | |
| | | | |
Quantity ($) | | Name of Issuer | | Market Value ($)(1) |
|
New York (0.7%) | | | | |
250,000 | | Albany Indl. Dev. Agy. Civic Fac. Rev. Series 2007-A (Brighter Choice Charter Sch. Proj.), 5.00%, 4/1/20 | | 255,130 |
500,000 | | Amherst Indl. Dev. Agy. Civic Fac. Rev. Series 2007 (Beechwood Hlth. Care Ctr. Inc. Proj.), 4.875%, 1/1/13 | | 501,330 |
170,000 | | Monroe Co. Indl. Dev. Agy. Student Hsg. Rev. Series 1999-A (Collegiate Hsg. Fdn. - Rochester Institute of Technology Proj.), 4.90%, 4/1/09 | | 171,404 |
1,230,000 | | NY Dorm Auth. Rev. Series 1996-A (Maimonides Med. Ctr. Proj.), 5.75%, 8/1/24 | | 1,244,231 |
190,000 | | NY Cos. Tobacco Trust IV Settlement Pass-Thru Rev. Series 2005-A, 4.25%, 6/1/21 | | 187,640 |
| | NY Tobacco Settlement Fing. Corp Asset-Backed Rev.: | | |
160,000 | | Series 2003-C1, 5.00%, 6/1/11 | | 160,158 |
250,000 | | Series 2003-C1, 5.25%, 6/1/13 | | 254,125 |
| | | | |
| | | | 2,774,018 |
| | | | |
North Carolina (1.0%) | | | | |
375,000 | | Asheville Certificates of Participation Series 1997-A, 5.125%, 6/1/18 | | 379,549 |
500,000 | | Charlotte-Mecklenburg Hosp. Auth. Hlth. Care Sys. Rev. Series 1997-A (Carolinas Hlth. Care Proj.), 5.00%, 1/15/14 | | 510,095 |
160,000 | | Mecklenburg Co. Indus. Facs. & Pollution Ctrl. Fin. Auth. Rev. Series 1993 (Fluor Corp. Proj.), 5.25%, 12/1/09 | | 160,141 |
250,000 | | NC Med. Care Commission Hosp. Rev. Series 1995 (Gaston Memorial Hsop. Proj.), 5.50%, 2/15/19 | | 256,338 |
375,000 | | NC Med. Care Commission Retirement Facs. Rev. Ref. Series 2007 (Givens Estates), 5.00%, 7/1/27 | | 387,836 |
150,000 | | NC Med. Care. Commission Hlth. Care Facs. Rev. Series 1998-B (Novant Hlth. Proj.), 5.00%, 10/1/28 | | 153,602 |
| | NC Med. Care Commission Hlth. Care Hsg. Rev. Series 2004-A: | | |
500,000 | | (The ARC of NC Proj.), 4.65%, 10/1/14 | | 505,145 |
700,000 | | (ARC Proj.), 5.80%, 10/1/34 | | 756,378 |
420,000 | | NC Med. Care Commission Rev. Series 2003 (FHA Insd. Mtg.-Betsy Johnson Proj.) | | |
| | (FSA insured), 5.375%, 10/1/24 | | 453,029 |
190,000 | | Northern Hosp. Dist. Surry. Co. Hlth. Care Facs. Rev. Series 1999, 5.50%, 10/1/19 | | 199,732 |
| | | | |
| | | | 3,761,845 |
| | | | |
North Dakota (0.4%) | | | | |
750,000 | | City of Washburn Series 2007-B (Bismarck State College Fdtn.), 5.01%, 4/1/32 (9) | | 763,903 |
| | Grand Forks Sr. Hsr. Rev. Ref. Series 2006 (4000 VY Square Proj.), 4.50%, 12/1/08 | | |
260,000 | | 4.50%, 12/1/08 | | 259,984 |
395,000 | | 4.60%, 12/1/10 | | 395,889 |
175,000 | | Williams Co. Sales Tax Rev. Series 2006, 5.00%, 11/1/31 | | 179,433 |
| | | | |
| | | | 1,599,209 |
| | | | |
Ohio (2.1%) | | | | |
100,000 | | Akron Bath Copley Twp. Hosp. Dist. Rev. Series 2006-A (Akron Gen. Hlth. Sys. Proj.), 4.00%, 1/1/08 | | 100,076 |
330,000 | | Blue Ash Tax Allocation Rev. Series 2006 (Duke Realty Ohio Proj.), 5.00%, 12/1/21 | | 336,118 |
295,000 | | Cleveland-Cuyahoga Port. Auth. Dev. Rev. Series 1999-A (Port of Cleveland Bond Fund Capital Imprv. Proj.), 5.375%, 5/15/19 | | 300,655 |
| | Cleveland-Cuyahoga Co. Port. Auth. Dev. Rev.: | | |
700,000 | | Series 2004-D (Garfield Heights Proj.), 5.25%, 5/15/23 | | 719,369 |
610,000 | | Series 2004-E (Meyers Univ. Proj.), 4.65%, 5/15/14 | | 612,653 |
530,000 | | Series 2004-E (Meyers Univ. Proj.), 5.60%, 5/15/25 | | 555,260 |
275,000 | | Series 2005-B (Fairmount Proj.), 5.125%, 5/15/25 | | 280,456 |
750,000 | | Series 2006-A (Sr. Hsg. - St. Clarence - Geac Proj.), 6.00%, 5/1/21 | | 772,162 |
430,000 | | Cleveland C.O.P. Series 1997 (Cleveland Stadium Proj.), 5.25%, 11/15/27 | | 441,709 |
1,000,000 | | Dayton Special Facs. Rev. Ref. Series 1998-A (Emery Air Freight Proj.), 5.625%, 2/1/18 | | 1,032,440 |
1,500,000 | | Hamilton Co. Hlth. Care Rev. Ref. Series 2006-A (Life Enriching Cmntys. Proj.), 5.00%, 1/1/27 | | 1,526,550 |
805,000 | | Lorain Co. Hosp. Rev. Series 1997-B (Catholic Hlth. Care Partners Proj.) (MBIA insured), 5.50%, 9/1/27 | | 825,890 |
500,000 | | Miami Co. Hosp. Fac. Rev. Ref. Impt. Series 2006 (Upper Valley Med. Ctr. Proj.), 5.25%, 5/15/17 | | 533,295 |
| | | | |
| | | | 8,036,633 |
| | | | |
34 | | | | |
| | | | |
| | |
| |
| | |
| | |
|
| |
| | | | |
| | | | |
Quantity ($) | | Name of Issuer | | Market Value ($)(1) |
| | | | |
Oklahoma (2.0%) | | | | |
| | Citizen Potawatomi Nation Tax Rev. Series 2004-A: | | |
660,000 | | 5.00%, 9/1/08 | | 658,634 |
500,000 | | 6.50%, 9/1/16 | | 529,330 |
250,000 | | Langston Econ. Dev. Auth. Rev. Series 2005-A (Langston Univ. Proj.) (ACA insured), 5.00%, 5/1/35 | | 257,530 |
500,000 | | McClain Co. Econ. Dev. Auth. Educ. Fac. Lease Rev. Series 2006 (Newcastle Pub. School Proj.), 4.125%, 9/1/08 (5) | | 500,020 |
| | Norman Regl. Hosp. Auth. Rev.: | | |
1,500,000 | | Ref. Series 1996-A (MBIA insured), 5.625%, 9/1/16 | | 1,532,010 |
340,000 | | Ref. Series 1996-A (MBIA insured), 5.625%, 9/1/21 | | 347,208 |
500,000 | | Series 2005, 5.50%, 9/1/24 | | 534,855 |
915,000 | | Oklahoma St. Ind. Auth Rev. Series 2006 (YMCA Greater OK Earlywine Proj.), 4.875%, 7/1/22 | | 909,775 |
445,000 | | Valley View Hosp. Auth. Rev. Ref. Series 1996, 6.00%, 8/15/14 | | 467,637 |
1,250,000 | | Washington Co. Med. Auth. Rev. Bartlesville Ref. Series 1996 (Jane Phillips Med. Ctr. Proj.) | | |
| | (Connie Lee insured), 5.50%, 11/1/10 | | 1,264,038 |
500,000 | | Weatherford Hosp. Auth. Rev. Series 2006, 6.00%, 5/1/16 | | 529,910 |
| | | | |
| | | | 7,530,947 |
| | | | |
Oregon (1.0%) | | | | |
500,000 | | Cow Creek Band Umpqua Tribe of Indians Rev. Series 2006-C, 4.875%, 10/1/08 | | 500,810 |
200,000 | | Klamath Falls Intercmnty. Hosp. Auth. Rev. Ref. Series 2002 (Merle West Med. Ctr. Proj.), 5.20%, 9/1/09 | | 203,398 |
1,250,000 | | OR G.O. Series 2001-81 (Veterans Welfare Proj.), 5.25%, 10/1/42 | | 1,287,100 |
150,000 | | OR Hsg. & Cmty. Svcs. Dept. Mtg. Rev. Series 2000-K, 5.70%, 7/1/22 | | 150,953 |
1,475,000 | | Western Generation Agy. Sub. Lien Rev. Series 2006-C (Wauna Cogeneration Proj.), 5.00%, 1/1/21 | | 1,485,119 |
| | | | |
| | | | 3,627,380 |
| | | | |
Pennsylvania (5.4%) | | | | |
200,000 | | Abington Co. School Dist. G.O. Series 1997 (FGIC insured), 5.125%, 5/15/26 | | 200,348 |
| | Allegheny Co. Hosp. Dev. Auth. Rev. Series 2003-A (Ohio Valley Gen. Hosp. Proj.): | | |
245,000 | | 3.30%, 4/1/08 | | 242,761 |
135,000 | | 3.875%, 4/1/10 | | 133,474 |
125,000 | | Beaver Co. Indus. Dev. Auth. Pollution Ctrl. Rev., Series 1977 (St. Joe Minerals Corp. Proj.), 6.00%, 5/1/07 | | 125,142 |
565,000 | | Chartiers Valley Indl. & Commercial Dev. Auth. Rev. Ref. Series 2003-A(Friendship Village South Proj.), 4.75%, 8/15/11 | | 567,243 |
1,210,000 | | Delaware River Port Auth. PA & NJ Rev. Series 1995 (FGIC insured), 5.50%, 1/1/26 | | 1,223,879 |
555,000 | | Erie Auth. Pkg. Fac. Rev. Series 2006, 4.60%, 9/1/21 | | 559,884 |
500,000 | | Harrisburg Auth. Univ. Rev. Series 2007-A (Harrisburg Univ of Science Proj.), 5.40%, 9/1/16 | | 509,590 |
2,750,000 | | Grove City Area Hosp. Auth. Rev. Series 1998 (United Cmnty. Hosp. Proj.), 5.25%, 7/1/12 | | 2,753,740 |
| | Lancaster Co. Hosp. Auth. Rev.: | | |
200,000 | | Series 1994 (Hlth. Center-Masonic Homes Proj.), 5.30%, 11/15/08 | | 200,884 |
250,000 | | Series 2006 (Hlth. Center-Masonic Homes Proj.), 5.00%, 11/1/26 | | 260,825 |
| | Lehigh Co. General Purpose Auth. Rev.: | | |
500,000 | | Rev. Series 2003 (Saint Luke’s Bethlehem Proj.), 5.25%, 8/15/23 | | 539,010 |
250,000 | | Rev. Series 2007 (Saint Luke’s Bethlehem Proj.), variable rate, 8/15/42 | | 249,875 |
1,560,000 | | Montgomery Co. Indus. Dev. Auth. Retirement Cmnty. Rev. Series 1998, 5.25%, 11/15/28 | | 1,594,039 |
730,000 | | PA Econ. Dev. Fin. Auth. Rev. Series 1998-A (Northwestern Human Svcs. Proj.) (ACA insured), 4.875%, 6/1/08 | | 733,927 |
3,890,000 | | PA Hgr. Educ. Fac. Auth. Hlth. Svcs. Rev. Series 1996-A (Allegheny Delaware Valley Obligated Group, Inc.) (MBIA insured), 5.875%, 11/15/16 | | 3,973,907 |
| | PA Higher Educ. Fac. Auth. Rev.: | | |
190,000 | | Unrefunded Balance Series 1998 (Temple Univ. Proj.), 5.00%, 4/1/21 | | 194,222 |
| |
See accompanying notes to portfolios of investments on page 62. | 35 |
| | | | |
| Sit Tax-Free Income Fund
March 31, 2007 | | | |
| | | | |
| Portfolio of Investments
| | | |
| | | | |
| | | | |
Quantity ($) | | Name of Issuer | | Market Value ($)(1) |
|
590,000 | | Series 2000 (Univ. of the Arts Proj.) (Radian insured), 5.75%, 3/15/30 | | 617,854 |
| | Series 2005 (Widener Univ. Proj.): | | |
100,000 | | 3.00%, 7/15/07 | | 99,733 |
190,000 | | 3.10%, 7/15/08 | | 188,087 |
370,000 | | Series 2006-FF2 (Assn. Indpt. Colleges & Univ. Proj.) (Radian insured), 5.00%, 12/15/24 | | 386,920 |
1,000,000 | | PA Hgr. Educ. Fac. Auth. College & Univ. Rev. Series 1998 (Geneva College Proj.), 5.375%, 4/1/15 | | 1,027,430 |
| | Philadelphia Hosp. & Hgr. Educ. Fac. Auth. Hosp. Rev. (Temple Univ Hosp. Proj.): | | |
| | Series 1993-A: | | |
530,000 | | 6.50%, 11/15/08 | | 543,059 |
385,000 | | 6.625%, 11/15/23 | | 386,694 |
440,000 | | Series 1997, 5.875%, 11/15/23 | | 447,788 |
1,250,000 | | Sayre Hlth. Care. Facs. Auth. Rev. Series 2007 (Guthrie Health Proj.), variable rate, 12/1/31 | | 1,250,000 |
1,200,000 | | Washington Co. Auth. Rev. Series 1999, 6.15%, 12/1/29 | | 1,291,464 |
| | | | |
| | | | 20,301,779 |
| | | | |
Puerto Rico (0.1%) | | | |
500,000 | | Puerto Rico Commonwealth Hwy. & Transportation Auth. Rev. Ref. Series 2007-N, variable rate, 7/1/45 | | 500,750 |
| | | | |
Rhode Island (0.4%) | | | |
260,000 | | RI Clean Water Protection Fin. Agy. Pooled Lien Rev. Series 1995A (MBIA insured), 5.375%, 10/1/15 | | 262,124 |
| | RI Hlth. & Educ. Bldg. Corp. Rev. Series: | | |
250,000 | | 1996 (Lifespan Oblig. Group Proj.), 5.25%, 5/15/26 | | 255,333 |
| | 1997 (Steere House Proj.): | | |
260,000 | | 5.375%, 7/1/07 | | 260,507 |
565,000 | | 5.80%, 7/1/20 | | 572,978 |
| | | | |
| | | | 1,350,942 |
| | | | |
South Carolina (1.5%) | | | |
| | Berkeley Co. Sch. Dist. Intallment Lease (Securing Assets For Education Proj.): | | |
500,000 | | Series 2003, 5.25%, 12/01/19 | | 526,665 |
1,000,000 | | Series 2006, 5.00%, 12/1/20 | | 1,052,420 |
400,000 | | Charleston Educ. Excellence Fin. Rev. Series 2005 (Charleston Co. Schl. Dist. Proj.), 5.25%, 12/1/20 | | 429,932 |
60,000 | | Greenville Hosp. Sys. Hosp. Fac. Rev. Series 2001, 5.00%, 5/1/31 | | 61,843 |
1,500,000 | | Kershaw Co. Public Sch. Fdn. Installment Pwr. Rev. Series 2006 (Kershaw Co. Sch. Dist. Proj.) | | |
| | (CIFG insured), 5.00%, 12/1/25 | | 1,584,705 |
500,000 | | Scago Educ. Fac. Corp. For Beaufort Sch. Dist. Installment Rev. Series 2006 (FSA Insured), 5.00%, 12/1/31 | | 527,015 |
| | SC Jobs Econ. Dev. Auth. Hosp. Fac. Rev. Ref. & Impt. Series 2006 (Hampton Regl. Med. Proj.): | | |
390,000 | | 4.60%, 11/1/09 | | 390,363 |
735,000 | | 4.65%, 11/1/11 | | 734,669 |
500,000 | | SC Jobs Econ. Dev. Auth. Hosp. Fac. Rev. Series 2006 (Tuomey Regl. Med. Ctr. Proj.) | | |
| | (CIFG insured), 5.00%, 11/1/30 | | 524,160 |
| | | | |
| | | | 5,831,772 |
| | | | |
South Dakota (0.6%) | | | |
| | SD Hlth. & Educ. Fac. Auth. Rev.: | | |
| | Ref. Series 2006 (Huron Regional Med. Ctr. Proj.): | | |
100,000 | | 4.00%, 4/1/07 | | 99,999 |
125,000 | | 4.25%, 4/1/08 | | 125,098 |
410,000 | | Series 2006 (Westhills Village Retirement Community), 5.00%, 9/1/19 | | 423,317 |
1,000,000 | | Series 2004 (Avera Health Proj.), variable rate, 7/1/24 | | 1,000,000 |
500,000 | | Series 2004-A (Sioux Valley Hosp. & Hlth.), 5.25%, 11/1/34 | | 526,155 |
| | | | |
| | | | 2,174,569 |
| | | | |
36
| | | | |
| | |
| |
| | |
| | |
|
| |
| | | | |
| | | | |
Quantity ($) | | Name of Issuer | | Market Value ($)(1) |
|
Tennessee (2.3%) | | | | |
500,000 | | Johnson City Hlth. & Educ. Fac. Brd. Hosp. Rev. Series 2006-A (Mountain States Hlth. Alliance Proj.), 5.50%, 7/1/31 | | 534,340 |
835,000 | | Knox Co. Hlth. Educ. & Hsg. Fac. Brd. Rev. Series 1999 (Univ. Hlth. Sys. Inc. Proj.), 5.625%, 4/1/29 | | 861,085 |
500,000 | | Metro Govt. Nashville & Davidson Co. Hlth. & Educ. Facs. Brd. Multifamily Hsg. Rev.
Series 2005-A (Prestige Proj.), 7.50%, 12/20/40 | | 499,965 |
| | Metro Govt. Nashville & Davidson Co. Indus. Dev. Brd. Rev. Ref.: | | |
250,000 | | Series 1994-A (Section 8) (FNMA collateralized), 6.00%, 4/1/24 | | 251,160 |
240,000 | | Series 2001-A (GNMA collateralized), 6.625%, 3/20/36 | | 263,191 |
| | Shelby Co. Hlth., Educ. & Hsg. Fac. Board Multifamily Hsg. Rev.: | | |
| | (CME Memphis Apts. Proj.): | | |
1,850,000 | | Senior Series 1998-A, 5.35%, 1/1/19 (7) (8) | | 752,969 |
7,875,000 | | Senior Series 1998-A, 5.55%, 1/1/29 (7) (8) | | 3,127,714 |
1,630,000 | | Subordinate Series 1998-C, 6.00%, 1/1/29 (7) (8) | | 16 |
| | (Eastwood Park Apts. Proj.): | | |
1,000,000 | | Senior Series 1995-A2, 6.40%, 9/1/25 (7) (8) | | 402,950 |
405,000 | | Subordinate Series 1995-C, 7.50%, 9/1/25 (7) (8) | | 4 |
| | (Raleigh Forest & Sherwood Apts. Proj.): | | |
2,670,000 | | Senior Series 1996-A, 6.60%, 1/1/26 (7) (8) | | 1,074,034 |
610,000 | | Subordinate Series 1996-C, 7.25%, 1/1/26 (7) (8) | | 1,366 |
500,000 | | Series 2006-A (Trezevant Manor Proj.), 4.90%, 9/1/11 | | 500,710 |
500,000 | | Sullivan Co. Hlth. Educ. & Hsg. Fac. Brd. Hosp. Rev. Series 2006-C, (Wellmont Hlth. Sys. Proj.), 5.25%, 9/1/36 | | 523,820 |
| | | | |
| | | | 8,793,324 |
| | | | |
Texas (10.2%) | | | | |
2,500,000 | | Arlington Special Oblig. Rev. Series 2005-A (Special Tax-Dallas Cowboys Proj.), 5.00%, 8/15/34 | | 2,618,275 |
400,000 | | Austin Convention Enterprises, Inc. (Convention Ctr.) Rev. Ref. Series 2006-B, 6.00%, 1/1/10 | | 411,892 |
| | Austin Utilities System Rev. Ref.: | | |
20,000 | | Series 1993 (MBIA insured), 5.25%, 5/15/18 | | 20,024 |
500,000 | | Series 1997, 5.125%, 11/15/13 | | 504,310 |
1,000,000 | | Bell Co. Hlth. Fac. Dev. Corp. Retirement Fac. Rev. Series 1998 (Buckner Retirement Services, Inc. Obligated Group, Proj.), 5.00%, 11/15/11 | | 1,022,210 |
1,500,000 | | Bexar Co. Hlth. Fac. Dev. Corp. Rev. Ref. Series 1993 (Incarnate Word Hlth. Svcs. Proj.) (FSA insured), 6.10%, 11/15/23 | | 1,559,610 |
| | Bexar Co. HFC Multifamily Hsg. Rev.: | | |
565,000 | | Subordinated Series 2000-C (Honey Creek Apts. Proj.), 8.00%, 4/1/30 | | 569,605 |
145,000 | | Subordinated Series 2001-B (American Oppty. Hsg. Dublin Kingswood & Waterford Apts. Proj.), 7.50%, 12/1/14 | | 150,429 |
1,000,000 | | Series 2001-A-1 (Stablewood Farms Proj.) (GNMA Insured), 6.25%, 7/20/43 | | 1,103,590 |
440,000 | | Series 2001-A-1 (American Opportunity -Waterford Proj.), 6.50%, 12/1/21 | | 472,415 |
495,000 | | Bexar Co. Rev. Series 2000 (Venue Proj.) (MBIA insured), 5.75%, 8/15/22 | | 519,359 |
500,000 | | Brazos Co. Hlth. Fac. Dev. Corp. Franciscan Svcs. Corp. Series 2002, 5.38%, 1/1/32 | | 525,790 |
650,000 | | Brazos River Hbr. Nav. Dist Rev. Series 2002-B-2 (Dow Chemical Co. Proj.), 4.75%, 5/15/33 | | 650,643 |
750,000 | | Cameron Educ. Corp. Rev. Series 2006-A (Faith Family Academy Proj.) (ACA Insured), 5.00%, 8/15/21 | | 781,297 |
500,000 | | Dallas Area Rapid Transit Rev. Sr. Lien Series 2001 (Ambac Insured), 5.00%, 12/1/26 | | 516,770 |
6,142,000 | | Dallas HFC Multifamily Mtg. Rev. Series 1998-A (GNMA collateralized) (Towne Ctr. Apts.), 6.75%, 10/20/32 | | 6,551,057 |
500,000 | | Galveston Co. Hlth. Fac. Dev. Corp. Rev. Series 1995 (Devereux Foundation Proj.) (MBIA insured), 5.00%, 11/1/14 | | 505,885 |
| | Garza Co. Public Hlth. Fac. Corp. Rev. | | |
750,000 | | Series 2006, 5.00%, 10/1/11 | | 762,382 |
500,000 | | Series 2006, 5.50%, 10/1/16 | | 530,965 |
| |
See accompanying notes to portfolios of investments on page 62. | 37 |
| | | | |
| Sit Tax-Free Income Fund
March 31, 2007 | | | |
| | | | |
| Portfolio of Investments
| | | |
| | | | |
| | | | |
Quantity ($) | | Name of Issuer | | Market Value ($)(1) |
|
100,000 | | Harris Co. Spl. Rev. Sr. Lien Series 1998-A (Houston Sports Auth. Proj.), 5.00%, 11/15/28 | | 101,412 |
500,000 | | Harris Co. Municipal Util. Dist. No. 360 G.O. Series 1998 (FSA Insured), 4.875%, 12/1/23 | | 503,165 |
500,000 | | Harris Co. Rev. Ref. Sr. Lien Series 2005-A (Toll Road Proj.) (FSA insured), 5.25%, 8/15/35 | | 520,165 |
310,000 | | Harris Co. Hlth. Fac. Dev. Corp. Hosp. Rev. Series 1998 (Hermann Hosp. Sys. Proj.) FSA insured), 5.25%, 6/1/27 | | 317,111 |
700,000 | | Hidalgo Co. Hlth. Svcs. Rev. Series 2005 (Mission Hosp., Inc. Proj.), 5.00%, 8/15/19 | | 711,767 |
750,000 | | Houston Cmnty. College G.O. Ref. Series 2005, 5.00%, 2/15/12 | | 753,120 |
| | Kerrville Hlth. Fac. Dev. Corp. Hosp. Rev. Series 2005 (Sid Peterson Memorial Hosp. Proj.): | | |
655,000 | | 4.125%, 8/15/10 | | 652,629 |
1,500,000 | | 5.45%, 8/15/35 | | 1,514,400 |
44,915 | | Midland HFC Single Family Mtg. Rev. Ref. Series 1992 A-2, 8.45%, 12/1/11 | | 45,188 |
| | Mesquite Hlth. Fac. Dev. Corp. Retirement Fac. Rev. (Christian Care Ctr. Proj.): | | |
485,000 | | Series 2000-A, 7.00%, 2/15/10 | | 510,870 |
750,000 | | Series 2005, 5.00%, 2/15/15 | | 766,013 |
1,000,000 | | Muleshoe Indpt. Sch. Dist. G.O. Series 2006 (Sch. Bldg. Proj.), 5.00%, 2/15/31 | | 1,003,490 |
1,250,000 | | North Harris Co. Regl. Water Auth. Rev. Sr. Lien Series 2005 (MBIA Insured), 5.00%, 12/15/32 | | 1,303,475 |
500,000 | | Red River Auth. Pollution Ctrl. Rev. Ref. Series 1991 (Ambac insured), 5.20%, 7/1/11 | | 503,815 |
| | Richardson Hosp. Auth. Rev. Ref. Series 1998 (Baylor/Richardson Proj.): | | |
585,000 | | 5.50%, 12/1/18 | | 600,842 |
1,135,000 | | 5.625%, 12/1/28 | | 1,165,588 |
350,000 | | Sendero I Pub. Fac. Corp. Multifamily Hsg. Rev. Series 2003-A (Crown Meadows Proj.), 5.00%, 6/1/23 | | 364,259 |
| | Tarrant Co. Hlth. Facs. Dev. Corp. Rev. Series 1997-A: | | |
750,000 | | (Hlth. Resources Sys. Proj.), 5.25%, 2/15/22 | | 773,093 |
| | Tarrant Co. HFC Multifamily Hsg. Rev: | | |
530,000 | | Senior Series 2001-A (Westridge Apts. Proj.), 5.50%, 6/1/11 (7) (8) | | 331,976 |
490,000 | | Subordinate Series 2001-C (Crossroads Apt. Proj.), 7.25%, 12/1/36 (7) (8) | | 2,818 |
| | TX Affordable Hsg. Corp. Multifamily Hsg. Rev: | | |
500,000 | | Senior Series 2001-A (NHT/GTEX Proj.) (MBIA insured), 4.10%, 10/1/08 | | 498,795 |
740,000 | | Junior Series 2001-B (NHT/GTEX Proj.), 6.75%, 10/1/16 (7) (8) | | 98,790 |
| | TX Municipal Gas Acq. & Supply Corp. I Gas Supply Sub. Lien Rev.: | | |
250,000 | | Series 2006-B, Variable Rate, 12/15/26 | | 250,313 |
500,000 | | Series 2006-C, Variable Rate, 12/15/26 | | 500,350 |
265,000 | | TX Public Property Fin. Corp. Mental Hlth. & Mental Retardation Rev. Series 1996, 6.20%, 9/1/16 | | 268,434 |
205,000 | | TX St. Student Hsg. Corp. Rev. Series 2002 (Midwestern St. Univ. Proj.), 5.50%, 9/1/12 | | 208,928 |
| | TX Pub. Fin. Auth. Charter Sch. Fin. Corp. Rev.: | | |
1,000,000 | | Series 2006-A (Kipp Inc. Proj.) (ACA Insured), 5.00%, 2/15/28 | | 1,028,640 |
750,000 | | Series 2006-A (Ed-Burnham Wood Proj.), 5.50%, 9/1/18 | | 753,120 |
| | TX Water Dev. Brd. State Revolving Fund Sr. Lien Rev.: | | |
500,000 | | Series 1996-A, 5.25%, 7/15/17 | | 500,585 |
835,000 | | Travis Co. Hlth. Facs. Dev. Corp. Retirement Fac. Rev. Series 2005(Querencia Barton Creek Proj.), 4.90%, 11/15/13 | | 843,375 |
340,000 | | Tyler Hlth. Facs. Dev. Corp. Rev. Series 1997-B (East TX Med. Ctr. Proj.), 5.60%, 11/1/27 | | 349,802 |
205,000 | | Weslaco Hlth. Fac. Dev. Series 2002 (Knapp Med. Ctr. Proj.), 5.00%, 6/1/07 | | 205,203 |
750,000 | | Whitehouse TX Indpt. Sch. Dist. Cap. Apprec. G.O. Ref. Series 2007 (Sch. Building Proj.), zero coupon, 4.65% effective yield, 2/15/25 (9) | | 320,235 |
500,000 | | Winkler Co. G.O. Series 2006 (Radian insured), 5.25%, 2/15/31 | | 530,545 |
| | | | |
| | | | 38,578,819 |
| | | | |
38
| | | | |
| | |
| |
| | |
| | |
|
| |
| | | | |
| | | | |
Quantity ($) | | Name of Issuer | | Market Value ($)(1) |
| | | | |
Utah (0.7%) | | | | |
725,000 | | Eagle Mountain Water & Sewer Rev. Ref. Series 2000 (ACA insured), 5.60%, 11/15/13 | | 767,253 |
250,000 | | Provo Charter Sch. Rev. Series 2007 (Freedom Academy Fdtn. Proj.), 5.50%, 6/15/37 (9) | | 250,000 |
| | Salt Lake Co. College Rev. (Westminster College Proj.): | | |
1,000,000 | | Series 1997, 5.75%, 10/1/27 | | 1,020,070 |
| | Series 1999: | | |
120,000 | | 5.15%, 10/1/11 | | 123,504 |
125,000 | | 5.20%, 10/1/12 | | 128,696 |
130,000 | | 5.25%, 10/1/13 | | 133,934 |
240,000 | | UT Hsg. Finance Agy. Multifamily Rev. Ref. Series 1996-A (Section 8) (FHA insured), 6.10%, 7/1/22 | | 245,076 |
| | | | |
| | | | 2,668,533 |
| | | | |
Vermont (0.1%) | | | | |
| | VT Educ. & Hlth. Bldgs. Financing Agency Rev.: | | |
85,000 | | Series 2002-A (Developmental & Mental Hlth. Proj.), 4.375%, 6/15/07 | | 84,862 |
400,000 | | Series 2003-A (Vermont Law School Proj.), 5.00%, 1/1/13 | | 403,356 |
| | | | |
| | | | 488,218 |
| | | | |
Virginia (1.2%) | | | | |
415,000 | | Alexandria Indl. Dev. Auth. Rev. Pollution Control Ref. Series 1994 (Potomac Electric Proj.) (MBIA insured), 5.375%, 2/15/24 | | 415,498 |
250,000 | | Chesterfield Co. Indl. Dev. Auth. Pollution Ctrl. Rev. Series 1987-A Rmktg. (VA Elec. & Power Co. Proj.), 5.875%, 6/1/17 | | 268,080 |
1,000,000 | | Farms New Kent Cmnty. Dev. Auth. Spl. Assmt. Series 2006-A, 5.125%, 3/1/36 | | 1,011,500 |
250,000 | | Henrico Co. Econ. Dev. Auth. Res. Care Fac. Rev. Ref. Mortgage Series 2006 (Westminster Canterbury Proj.), 5.00%, 10/1/27 | | 256,852 |
100,000 | | Prince William Co. Indus. Dev. Auth. Educ. Fac. Rev. Series 2003 (Catholic Diocese Arlington): 5.00%, 10/1/18 | | 104,058 |
400,000 | | Suffolk Indl. Dev. Auth. Retirement Facs. Rev. Ref. Series 2006 (Lake Prince Ctr. Proj.), 4.625%, 9/1/11 | | 401,764 |
2,000,000 | | Virginia St. Hsg. Dev. Auth. Comwlth. Mtg. Rev. Series 2001-H1 (MBIA insured), 5.375%, 7/1/36 | | 2,096,860 |
| | | | |
| | | | 4,554,612 |
| | | | |
Washington (1.6%) | | | | |
2,000,000 | | King Co. G.O. Ref. Series 1998-B, 5.00%, 1/1/30 | | 2,033,220 |
500,000 | | Skagit Co. Public Hosp. Dist. No. 001 Rev. Series 2005 (Skagit Valley Hosp. Proj.), 5.50%, 12/1/13 | | 527,910 |
500,000 | | WA G.O. Variable Purpose Series 2001-A (FSA insured), 5.00%, 7/1/22 | | 520,535 |
| | WA State Hsg. Fin. Commn. Nonprofit Rev. Series: | | |
1,750,000 | | 2007-A (Skyline At First hill Proj.), 5.25%, 1/1/17 | | 1,769,828 |
1,250,000 | | 2007-B (Skyline At First Hill Proj.), 5.10%, 1/1/13 | | 1,251,813 |
| | | | |
| | | | 6,103,306 |
| | | | |
West Virginia (0.3%) | | | |
1,250,000 | | Pleasants Co. Pollution Ctrl. Rev. Series 1995-C (Monongahela Pwr. Co.), 6.15%, 5/1/15 | | 1,287,575 |
| | | | |
Wisconsin (3.7%) | | | | |
500,000 | | Freedom Co. Dist. No. 1 Waterworks Sys. Rev. Series 2006 (Bond Antic Notes), 4.90%, 6/1/11 | | 503,975 |
500,000 | | Milwaukee Redev. Auth. Rev. Series 2005-A (Science Ed. Consortium Proj.), 5.125%, 8/1/15 | | 504,230 |
| | WI Hlth. & Educ. Fac. Auth. Rev.: | | |
550,000 | | Series 1995 (Franciscan Sisters Proj.) (Connie Lee insured), 5.50%, 2/15/14 | | 550,693 |
850,000 | | Ref. Series 1997-B, (United Hlth. Grp., Inc. Proj.), 5.50%, 12/15/20 | | 876,265 |
195,000 | | Series 1998 (Lawrence Univ. Proj.), 5.125%, 4/15/28 | | 196,819 |
365,000 | | Series 1999 (FH Hlth. Care Dev. Inc Proj.), 5.625%, 11/15/09 | | 372,063 |
705,000 | | Series 1999 (Kenosha Hosp. & Med. Ctr., Inc. Proj.), 5.10%, 5/15/07 | | 705,867 |
2,120,000 | | Series 1999-A (Aurora Hlth. Care Proj), 5.60%, 2/15/29 | | 2,189,684 |
| |
See accompanying notes to portfolios of investments on page 62. | 39 |
| | | | |
| Sit Tax-Free Income Fund
March 31, 2007 | | | |
| | | | |
| Portfolio of Investments
| | | |
| | | | |
| | | | |
Quantity ($) | | Name of Issuer | | Market Value ($)(1) |
| | | | |
200,000 | | Series 1999-B (Aurora Hlth. Care Proj), 5.50%, 2/15/15 | | 207,060 |
500,000 | | Series 1999-B (Aurora Hlth. Care Proj) (ACA insured), 5.625%, 2/15/29 | | 514,030 |
900,000 | | Series 1999 (Divine Savior, Inc. Proj.) (ACA insured), 5.70%, 6/1/28 | | 926,568 |
| | Series 2001 (Agnesian Healthcare, Inc. Proj.): | | |
550,000 | | 6.00%, 7/1/17 | | 586,163 |
340,000 | | 6.00%, 7/1/21 | | 360,862 |
1,025,000 | | Series 2003-A (Wheaton Franciscan Svcs. Proj.), 5.125%, 8/15/33 | | 1,050,974 |
| | Series 2003 (Synergy Hlth., Inc. Proj.): | | |
235,000 | | 6.00%, 11/15/23 | | 255,309 |
250,000 | | 6.00%, 11/15/32 | | 271,173 |
225,000 | | Ref. Series 2003 (Three Pillars Proj.), 4.60%, 8/15/13 | | 225,977 |
105,000 | | Series 2004-A (Three Pillars Sr. Living Proj.), 4.15%, 8/15/11 | | 103,305 |
450,000 | | Series 2004 (Blood Ctr. Southeastern Proj.), 5.50%, 6/1/24 | | 478,418 |
425,000 | | Series 2004 (Beaver Dam Cmnty. Hosp. Inc. Proj.), 5.50%, 8/15/14 | | 432,608 |
600,000 | | Series 2005 (Vernon Mem. Hlth. Care Inc. Proj.), 4.65%, 3/1/15 | | 602,622 |
| | Ref. Series 2006 (Sr. Hsg. Proj.): | | |
315,000 | | 5.00%, 8/1/09 | | 316,758 |
300,000 | | 5.00%, 8/1/10 | | 302,058 |
250,000 | | Ref. Series 2006 (Milwaukee Catholic Home Proj.), 5.00%, 7/1/26 | | 259,168 |
400,000 | | Series 2006-B (Upland Hills Health Inc. Proj.), 5.125%, 5/15/29 | | 411,876 |
| | Series 2006-A (Marshfield Clinic Proj.): | | |
375,000 | | 5.00%, 2/15/11 | | 386,014 |
500,000 | | 5.375%, 2/15/34 | | 527,950 |
| | | | |
| | | | 14,118,489 |
| | | | |
Total municipal bonds (cost: $371,884,092) | | 362,910,475 |
| | | | |
|
Closed-End Mutual Funds (0.6%) (2) | | |
3,500 | | BlackRock Insured Municipal Term Trust | | 52,675 |
400 | | BlackRock MuniYield Florida Fund | | 5,576 |
8,400 | | Colonial Insured Municipal Fund | | 116,340 |
36,100 | | DWS Municipal Income Trust | | 408,291 |
12,500 | | Insured Municipal Income Fund | | 168,500 |
8,600 | | MBIA Capital/Claymore Managed Duration Investment Grade Municipal Fund | | 114,380 |
23,000 | | Nuveen Florida Investment Quality Municipal Fund | | 322,460 |
17,600 | | Nuveen Florida Quality Income Municipal Fund | | 247,984 |
13,200 | | Nuveen Premier Municipal Income Fund | | 186,384 |
34,300 | | Seligman Select Municipal Fund | | 351,918 |
20,000 | | Van Kampen Pennsylvania Value Municipal Income Trust | | 292,200 |
100 | | Van Kampen Trust Investment Grade Muni Fund | | 1,570 |
100 | | Van Kampen Select Muni Fund | | 1,361 |
| | | | |
|
Total closed-end mutual funds (cost: $2,201,993) | | 2,269,639 |
| | | | |
| | |
Short-Term Securities (3.6%) (2) | | |
12,411,965 | | Dreyfus Tax-Exempt Cash Management Fund, 3.84% | | 12,411,965 |
1,105,000 | | SD Hlth. & Educ. Facs. Auth. Rev. Series 2004 (Avera Hlth. Proj.), variable rate, 7/1/30 | | 1,105,000 |
| | | | |
|
Total short-term securities (cost: $13,516,965) | | 13,516,965 |
| | | | |
|
Total investments in securities (cost: $387,603,050) (6) | | $ 378,697,079 |
| | | | |
40
This page has been left blank intentionally.
41
| | | | |
| Sit Minnesota Tax-Free Income Fund | | | |
| One Year Ended March 31, 2007 | | | |
| | | | |
| Senior Portfolio Managers
Michael C. Brilley • Debra A. Sit, CFA • Paul J. Jungquist, CFA | | | |
| | | | |
The Minnesota Tax Free Income Fund returned +5.17% over the past twelve months compared to +4.28% for the Lehman 5-Year Municipal Bond Index. The Fund’s 30-day SEC yield was 4.34% as of March 31, 2007 and its 12-month distribution rate was 4.17%. The Fund’s taxable equivalent yield of 7.25% for investors in the highest state and federal tax brackets compares favorably to taxable fixed-income alternatives.
During the 12-month period, short-term Treasury rates rose, with intermediate rates declining approximately 0.25% and the 30-year Treasury down just 0.04%. The Federal Reserve has left the federal funds rate target unchanged at 5.25% since its latest increase in June 2006. It appears likely that the Fed has completed its tightening cycle, and the market expects that the Fed will cut its rate target later this year.
The municipal yield curve flattened during the period but remains positively sloped. Over the past 12-month period, municipal yields fell 9 basis points for 1-year maturities and approximately 18 to 33 basis points for maturities in the 5-year to 30-year range. The decline in rates resulted in price appreciation across all maturities, with longer maturities exhibiting the greatest increases in price and the highest returns.
The Fund’s largest sector holdings are in hospital/health-care, multifamily housing, and education issues. These sectors each earned significantly higher returns than the benchmark Index. The primary factors affecting returns over the 12-month period were the Fund’s yield advantage, security selection, and strong price performance, which was due to both the dearth of supply of Minnesota issues with higher yields as well as the Fund’s longer duration relative to its benchmark.
The market currently expects the Fed to begin cutting the federal funds rate target by the end of the third quarter. However, we believe rate cuts would only materialize if inflation is contained and that they may not occur as early as the market expects. The municipal market should be fairly stable over the near term. We plan to maintain the Fund’s duration close to its benchmark, or perhaps modestly lengthen, in light of our expectations for a steeper yield curve and possible rate cuts late in the year.
INVESTMENT OBJECTIVE AND STRATEGY |
The investment objective of the Minnesota Tax-Free Income Fund is to provide a high level of current income exempt from federal regular income tax and Minnesota regular personal income tax as is consistent with the preservation of capital.
During normal market conditions, the Fund invests 100% of its net assets in municipal securities that generate interest income that is exempt from regular federal income tax and Minnesota regular personal income tax. The Fund anticipates that substantially all of its distributions to its shareholders will be exempt as such. For investors subject to the alternative minimum tax (“AMT”), up to 20% of the Fund’s income may be alternative minimum taxable income.
| | |
Net Asset Value 3/31/07: | | $10.21 Per Share |
3/31/06: | | $10.12 Per Share |
Total Net Assets: | | $288.9 Million |
30-day SEC Yield: | | 4.34% |
Tax Equivalent Yield: | | 7.25%(1) |
12-Month Distribution Rate: | | 4.17% |
Average Maturity: | | 14.3 Years |
Duration to Estimated Avg. Life: | | 4.2 Years(2) |
Implied Duration: | | 4.9 Years(2) |
| | |
(1) For individuals in the 35.0% federal tax and 7.85% MN tax brackets. |
(2) See next page. | | |
PORTFOLIO STRUCTURE
(% OF TOTAL NET ASSETS) |
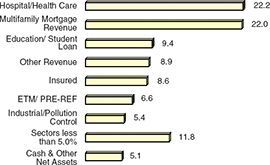
42
| | | | |
| | |
| |
| | |
| | |
|
| |
| | | | |
| | | | | | | | | |
AVERAGE ANNUAL TOTAL RETURNS* | |
| | | | | | | |
| | Sit
MN Tax-Free
Income Fund | | Lehman
5-Year Muni.
Bond Index | | Lipper
MN Muni.
Bond Fund
Index | |
| | | | | | | | | | |
3 Month** | | | 0.84 | % | | | 0.93 | % | | | 0.71 | % |
6 Month** | | | 1.98 | | | | 1.56 | | | | N/A | |
1 Year | | | 5.17 | | | | 4.28 | | | | 4.78 | |
5 Years | | | 4.88 | | | | 4.12 | | | | 4.96 | |
10 Years | | | 4.89 | | | | 4.79 | | | | 5.05 | |
Inception | | | 5.18 | | | | 4.77 | | | | 4.87 | |
(12/1/93) | | | | | | | | | | | | |
| | | | | | | | | | | | |
CUMULATIVE TOTAL RETURNS* |
| | | | | | | | | | | | |
| | Sit
MN Tax-Free
Income Fund | | Lehman
5-Year Muni.
Bond Index | | Lipper
MN Muni
Bond Fund
Index |
| | | | | | | | | | | | |
1 Year | | | 5.17 | | | | 4.28 | | | | 4.78 | |
5 Year | | | 26.91 | | | | 22.36 | | | | 27.39 | |
10 Year | | | 61.26 | | | | 59.73 | | | | 63.74 | |
Inception | | | 96.07 | | | | 86.11 | | | | 88.61 | |
(12/1/93) | | | | | | | | | | | | |
| | | | | | | | | | | | |
*As of 3/31/07.
| **Not annualized.
|
| |
Performance figures are historical and do not guarantee future results. Investment returns and principal value will vary, and you may have a gain or loss when you sell shares. Average annual total returns include changes in share price as well as reinvestment of all dividends and capital gains. Management fees and administrative expenses are included in the Fund’s performance; however, fees and expenses are not incorporated in the Lehman 5-Year Municipal Bond Index. The Lipper returns are obtained from Lipper Analytical Services, Inc., a large independent evaluator of mutual funds.
(2) Duration is a measure which reflects estimated price sensitivity to a given change in interest rates. For example, for an interest rate change of 1%, a portfolio with a duration of 5 years would be expected to experience a price change of 5%. Estimated average life duration is based on current interest rates and the Adviser’s assumptions regarding the expected average life of individual securities held in the portfolio. Implied duration is calculated based on historical price changes of securities held by the Fund. The Adviser believes that the portfolio’s implied duration is a more accurate estimate of price sensitivity provided interest rates remain within their historical range. If interest rates exceed the historical range, the estimated average life duration may be a more accurate estimate of price sensitivity.
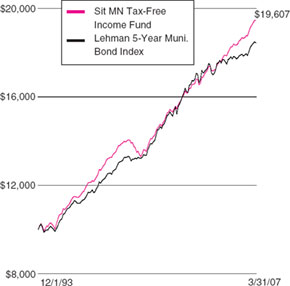
The sum of $10,000 invested at inception (12/1/93) and held until 3/31/07 would have grown to $19,607 in the Fund or $18,611 in the Lehman 5-Year Municipal Bond Index assuming reinvestment of all dividends and capital gains.
QUALITY RATINGS
(% OF TOTAL NET ASSETS) |
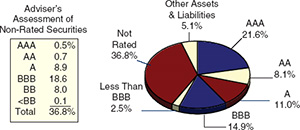
Lower of Moody’s, S&P, Fitch or Duff & Phelps ratings used.
43
| | | | |
| Sit Minnesota Tax-Free Income Fund | | | |
| March 31, 2007 | | | |
| | | | |
| Portfolio of Investments | | | |
| | | | |
| | | | |
Quantity ($) | | Name of Issuer | | Market Value ($)(1) |
|
Municipal Bonds (94.7%) (2) | | |
Education/Student Loan (9.4%) | | |
| | Intermediate Sch. Dist. 287 Lease Rev. Series 2006: | | |
4,200,000 | | 5.46%, 1/1/28 | | 4,397,358 |
3,650,000 | | 5.30%, 11/1/32 | | 3,733,840 |
| | Minneapolis Educ. Fac. Lease Rev. Series 2006-A (Seed/Harvest Prep. Proj.) (LOC-U.S. Bank): | | |
775,000 | | 5.125%, 1/1/16 | | 781,099 |
875,000 | | 6.25%, 1/1/21 | | 882,551 |
| | Minnesota Higher Educ. Fac. Auth. Rev.: | | |
750,000 | | Series 1998-4T (College of St. Benedict), 5.35%, 3/1/20 | | 756,030 |
110,000 | | Series 1998-4R (St. Olaf College), 5.25%, 10/1/23 | | 110,552 |
426,964 | | Lease Rev. Series 1999-5A (Concordia University), 5.25%, 4/25/14 | | 428,612 |
700,000 | | Series 1999-4Y (Augsburg College), 5.05%, 10/1/13 | | 714,329 |
150,000 | | Series 1999-4Y (Augsburg College), 5.20%, 10/1/16 | | 153,099 |
75,000 | | Series 1999-4Y (Augsburg College), 5.30%, 10/1/27 | | 76,736 |
700,000 | | Series 2005-6C (Augsburg College), 5.00%, 5/1/23 | | 726,166 |
| | Series 2006-6J1 (Augsburg College): | | |
730,000 | | 5.00%, 5/1/10 | | 744,476 |
595,000 | | 5.00%, 5/1/12 | | 611,940 |
100,000 | | Series 1999-4Z (Northwestern Hlth. Services University), 4.875%, 10/1/09 | | 100,421 |
675,000 | | Series 1999-4Z (Northwestern Hlth. Services University), 5.20%, 10/1/13 | | 679,286 |
50,000 | | Series 1998-4T (St. Benedict College), 5.125%, 3/1/13 | | 50,106 |
270,000 | | Series 2004-5U (St. Mary’s Univ.), 3.75%, 10/1/13 | | 264,503 |
1,400,000 | | Series 2006-6I (Univ. St. Thomas), 5.00%, 4/1/23 | | 1,478,946 |
| | Series 2006-6K (College of Art & Design): | | |
245,000 | | 4.15%, 5/1/08 | | 245,250 |
270,000 | | 4.50%, 5/1/10 | | 273,013 |
750,000 | | 5.00%, 5/1/19 | | 782,910 |
3,000,000 | | Series 2006-6M (College of St. Benedict), 4.493%, 10/1/16 | | 3,032,670 |
1,115,000 | | Moorhead Educ. Fac. Rev. Series 2005-A (Concordia College Corp. Proj.), 5.00%, 12/15/20 | | 1,181,097 |
| | Pine City Lease Rev. Series 2006-A (Lakes Intl. Language Academy Proj.): | | |
315,000 | | 5.75%, 5/1/16 | | 320,106 |
300,000 | | 6.00%, 5/1/26 | | 305,445 |
575,000 | | Ramsey Lease Rev. Series 2004-A (Pact Charter School Proj.), 5.65%, 12/1/13 | | 585,229 |
550,000 | | Olmsted Co. Hsg. & Redev. Auth. Series 2007 (Schaeffer Academy Proj.), 4.977%, 4/25/27 (9) | | 560,980 |
| | St. Paul Hsg. & Redev. Auth. Lease Rev.: | | |
495,000 | | Series 1999 (St. Paul Academy & Summit School Proj.), 5.50%, 10/1/24 | | 510,731 |
415,000 | | Series 2002-A (New Spirit Charter School Proj.), 6.50%, 12/1/12 | | 424,205 |
605,000 | | Series 2006-A (Hmong Academy Proj.), 5.50%, 9/1/18 | | 623,350 |
| | Series 2006-A (Cmnty. Peace Academy Proj.): | | |
685,000 | | 4.35%, 12/1/12 | | 682,239 |
600,000 | | 4.35%, 12/1/14 | | 596,106 |
100,000 | | Victoria Private School Fac. Rev. Series 1999-A (Holy Family Catholic H.S. Proj.), 5.20%, 9/1/11 | | 100,691 |
| | Winona Port. Auth. Lease Rev. Series 1999-A (Bluffview Montessori School Proj.): | | |
85,000 | | 5.90%, 12/1/07 | | 85,597 |
165,000 | | 8.00%, 12/1/24 | | 175,639 |
| | | | |
| | | | 27,175,308 |
| | | | |
Escrowed To Maturity/Prerefunded (6.6%) | | |
50,000 | | Bemidji ISD No. 031 G.O. Series 1998 (FSA insured), 5.00%, 4/1/19 | | 50,001 |
400,000 | | Carver Co. Hsg. & Redev. Auth. Multifamily Hsg. Subordinate Rev. Refunding Series 1997-C (Waybury Apts. Proj.), 8.00%, 8/1/27 | | 413,380 |
44
| | | | |
| | |
| |
| | |
| | |
|
| |
| | | | |
| | | | |
Quantity ($) | | Name of Issuer | | Market Value ($)(1) |
| | | | |
165,000 | | Dakota Co. Hsg. & Redev. Auth. Multifamily Hsg. Rev. Refunding (Walnut Trails Apts. Proj.), Subordinate Series 1995-C, 9.00%, 1/20/15 (4) | | 171,971 |
475,000 | | Hopkins Subordinate Multifamily Hsg. Rev. Ref. Series 1996-C (Auburn Apts. Proj.), 8.00%, 6/20/31 | | 497,106 |
| | Hermantown Econ. Dev. Auth. Sales Tax Rev. Series 1998 (MBIA insured), 4.90%, 2/1/18 | | |
240,000 | | 4.90%, 2/1/18 | | 242,496 |
250,000 | | 5.00%, 2/1/23 | | 252,452 |
2,775,000 | | Little Canada Multifamily Hsg. Rev. Series 1997-A (Hsg. Alt. Dev. Co. Proj.), 6.10%, 12/1/17 | | 2,804,165 |
| | Minneapolis Cmty. Dev. Agy. Ltd. Tax Common Bond Fund: | | |
1,000,000 | | Series 2001-G3 (LOC-U.S. Bank), 5.35%, 12/1/21 | | 1,069,220 |
175,000 | | Series 2001-G3 (LOC-U.S. Bank), 5.45%, 12/1/31 | | 187,857 |
45,000 | | Minneapolis G.O. Series 1999 (Parking Ramp Proj.), 5.125%, 12/1/16 | | 46,718 |
| | Minnesota Higher Educ. Fac. Auth. Rev.: | | |
800,000 | | Series 1997-4L (St. John’s University), 5.35%, 10/1/17 | | 806,592 |
100,000 | | Series 2000-5D (College Art & Design), 5.75%, 5/1/08 | | 101,444 |
185,000 | | MN Public Facs. Auth. Water Pollution Ctrl. Rev. Series 2001-A, 5.00%, 3/1/19 | | 191,852 |
1,000,000 | | Minneapolis Rev. Series 1997-A (Univ. Gateway Proj.), 5.25%, 12/1/17 | | 1,010,450 |
| | Minneapolis Student Hsg. Rev. Series 2000 (Riverton Community Hsg. Proj.): | | |
125,000 | | 6.80%, 7/1/10 | | 135,479 |
240,000 | | 6.90%, 7/1/11 | | 260,813 |
| | Minneapolis & St. Paul Metro Airport Comm. Airport Rev. (Ambac insured): | | |
440,000 | | Series 1998-A, 5.00%, 1/1/22 | | 448,730 |
380,000 | | Series 1998-A, 5.00%, 1/1/30 | | 387,539 |
| | MN Agr. & Econ. Dev. Board Rev.: | | |
360,000 | | Series 2000-A (Fairview Hlth. Care System Proj.), 6.375%, 11/15/29 | | 395,521 |
| | Series 2000 (Evangelical Proj.): | | |
50,000 | | 5.65%, 8/1/07 | | 50,317 |
195,000 | | 5.80%, 8/1/08 | | 200,331 |
345,000 | | 6.55%, 8/1/16 | | 381,446 |
| | Northfield Hospital Rev. Series 2001-C: | | |
50,000 | | 6.00%, 11/1/21 | | 54,654 |
3,100,000 | | 6.00%, 11/1/26 | | 3,388,548 |
| | Plymouth Multifamily Hsg. Rev. Refunding Series 1996-C (Fox Forest Apts. Proj.) | | |
615,000 | | (GNMA collateralized), 8.00%, 6/20/31 | | 643,622 |
535,000 | | Puerto Rico Childrens Trust Fund Tobacco Settlement Rev. Series 2000, 5.75%, 7/1/20 | | 553,634 |
300,000 | | Scott Co. Hsg. & Redev. Auth. Spl. Benefits Tax Series 1997-B (River City Centre Proj.) (Ambac insured), 5.45%, 2/1/20 | | 304,467 |
| | St. Paul Hsg. & Redev. Auth. Lease Rev.: | | |
795,000 | | Series 2001-A (Cmty. of Peace Academy Proj.), 6.375%, 12/1/11 | | 852,208 |
750,000 | | Series 2001-A (Cmty. of Peace Academy Proj.), 7.00%, 12/1/15 | | 843,938 |
350,000 | | Series 2001-A (Cmty. of Peace Academy Proj.), 7.375%, 12/1/19 | | 398,034 |
620,000 | | Steele Co. Hlth. Care Fac. Gross. Rev. Prerefunded Series 2000 (Elderly Hsg. Proj.), 6.625%, 6/1/20 | | 659,593 |
1,090,000 | | Western MN Muni Pwr. Agy. Series 1979 (MBIA-IBC insured), 6.60%, 1/1/10 | | 1,140,783 |
| | | | |
| | | | 18,945,361 |
| | | | |
General Obligation (1.8%) | | |
120,000 | | Austin Impt. G.O. Series 1998-B, 4.70%, 2/1/13 | | 120,084 |
200,000 | | Barnesville Impt. G.O. Series 2002, 5.00%, 2/1/23 | | 204,608 |
85,000 | | Barnum Indpt. Sch. Dist. No. 91 G.O. Series 1997 (SD Cred. Prog.), 5.00%, 2/1/18 | | 85,081 |
100,000 | | Carlton Co. Indpt. Sch. Dist. No. 99 G.O. Rev. Refunding Series 1998, 4.875%, 4/1/17 | | 100,003 |
15,000 | | Cold Spring G.O. Series 1998-B, 4.55%, 12/1/08 | | 15,017 |
75,000 | | Cold Spring G.O. Series 2000, 5.15%, 2/1/09 | | 75,066 |
250,000 | | Hennepin Co. G.O. Series 1998-A, 4.50%, 12/1/07 | | 250,165 |
| |
See accompanying notes to portfolios of investments on page 62. | 45 |
| | | | |
| Sit Minnesota Tax-Free Income Fund
March 31, 2007 | | | |
| | | | |
| Portfolio of Investments
| | | |
| | | | |
| | | | | |
Quantity ($) | | Name of Issuer | | Market Value ($)(1) |
| | | | | |
50,000 | | Hutchinson ISD No. 423 G.O. Series 1996-A, 5.85%, 2/1/18 | | | 50,866 |
50,000 | | Little Falls G.O. Series 1999-A, 5.00%, 2/1/11 | | | 50,042 |
4,000,000 | | MN State G.O. Series 1997, 4.90%, 8/1/14 | | | 4,015,720 |
150,000 | | Sauk Rapids Tax Increment G.O. Series 1997-B, 5.25%, 8/1/12 | | | 150,173 |
100,000 | | St. Paul Street Impt. Special Assessment G.O. Series 2000-B, 5.30%, 3/1/12 | | | 101,454 |
30,000 | | Winona Water & Sewer G.O. Series 1998-C, 4.90%, 2/1/13 | | | 30,027 |
| | | | |
| | | | | 5,248,306 |
| | | | |
Hospital/Health Care (22.2%) | | | |
| | Aitkin Hlth. Care Fac. Rev. Refunding Series (Riverwood Hlth. Care Ctr. Proj.): | | | |
155,000 | | 5.00%, 2/1/09 | | | 155,983 |
615,000 | | 5.00%, 2/1/12 | | | 622,011 |
| | Alexandria Hlth. Care Fac. Rev. Series 2002-B (BSM Property - Bethany Home Proj.): | | | |
375,000 | | 4.95%, 7/1/07 | | | 375,589 |
1,775,000 | | Breckenridge Rev. Series 2004-A (Catholic Hlth. Initiatives Proj.), 5.00%, 5/1/30 | | | 1,845,734 |
165,000 | | Cambridge Hsg. & Hlth. Care Fac. Rev. Series 1998-C (Grandview West Proj.), 5.25%, 10/1/08 | | | 166,112 |
| | Carlton Hlth. Care & Hsg. Fac. Rev. Ref. Series 2006 (Faith Care Ctr. Proj.): | | | |
100,000 | | 5.00%, 4/1/13 | | | 100,996 |
400,000 | | 5.20%, 4/1/16 | | | 406,612 |
| | Cold Spring Nursing Home & Sr. Hsg. Rev. Series 2005 (Assumption Home, Inc. Proj.): | | | |
135,000 | | 4.70%, 3/1/14 | | | 131,710 |
145,000 | | 4.80%, 3/1/15 | | | 141,884 |
150,000 | | 4.90%, 3/1/16 | | | 150,855 |
705,000 | | Columbia Heights Multifamily & Health Care Fac. Rev. Series 1998 | | | |
| | (Crest View Corp. Proj.), 5.75%, 9/1/11 | | | 710,287 |
| | Crookston Nursing Home & Multifamily Hsg. Rev Series 2002-A (Villa St. Vincent Proj.): | | | |
55,000 | | 4.75%, 9/1/08 | | | 55,320 |
75,000 | | 5.50%, 9/1/11 | | | 76,888 |
| | Cuyuna Range Hosp. Dist. Hlth. Fac. Gross Rev.: | | | |
| | Series 1999-A: | | | |
1,000,000 | | 5.75%, 6/1/14 | | | 1,019,080 |
1,060,000 | | 6.00%, 6/1/19 | | | 1,081,359 |
| | Series 2005, 4.50%, 6/1/13 | | | |
235,000 | | 4.50%, 6/1/13 | | | 235,251 |
400,000 | | 5.20%, 6/1/25 | | | 408,780 |
1,000,000 | | 5.50%, 6/1/35 | | | 1,038,150 |
1,500,000 | | Detroit Lakes Hsg. Rev. Ref. Series 2004-E (Mankato Lutheran Proj.), 4.25%, 8/1/34 | | | 1,502,160 |
455,000 | | Detroit Lakes Hsg. & Hlth. Facs. Rev. Ref. Series 2004-A (CDL Homes Proj.), 4.00%, 8/1/34 | | | 452,716 |
355,000 | | Duluth Econ. Dev. Auth. Hlth. Care Fac. Rev. Series 2002 (St. Luke’s Hosp. Proj.), 6.00%, 6/15/12 | | | 372,083 |
990,206 | | Duluth Sr. Hsg. Loan Participation (Lakeshore Proj.) Series 2004, 4.00%, 8/20/36 | | | 990,553 |
702,831 | | Duluth Hsg. & Redev. Auth. Sr. Hsg. Fac. Loan Participation (Lakeshore Proj.) | | | |
| | Series 2005, 5.20%, 12/20/35 | | | 703,675 |
| | Elk River Rev. Series 1998 (Care Choice Member Proj.): | | | |
725,000 | | 5.60%, 8/1/13 | | | 727,465 |
115,000 | | 5.75%, 8/1/23 | | | 115,289 |
| | Glencoe Hlth. Care Fac. Rev. Series 2005 (Glencoe Regional Hlth. Svcs. Proj.): | | | |
280,000 | | 3.60%, 4/1/08 | | | 278,855 |
1,150,000 | | 5.00%, 4/1/25 | | | 1,184,385 |
| | Hastings Hlth. Care Fac. Rev. Series 1998 (Augustana Home of Hastings Proj.): | | | |
115,000 | | 5.10%, 11/1/09 | | | 114,317 |
120,000 | | 5.20%, 11/1/10 | | | 119,359 |
135,000 | | 5.40%, 11/1/12 | | | 133,923 |
46
| | | | |
| | |
| |
| | |
| | |
|
| |
| | | | |
| | | | | |
Quantity ($) | | Name of Issuer | | Market Value ($)(1) |
| | | | | |
140,000 | | 5.50%, 11/1/13 | | | 139,626 |
| | Inver Grove Heights Nursing Home Rev. Refunding Series 2006 (Presbyterian Homes Care Proj.): | | | |
215,000 | | 5.00%, 10/1/07 | | | 215,580 |
250,000 | | 5.00%, 10/1/11 | | | 253,032 |
290,000 | | 5.00%, 10/1/12 | | | 292,845 |
450,000 | | 5.00%, 10/1/16 | | | 450,558 |
| | Maple Grove Hlth. Care Fac. Rev. Series 2005 (North Memorial Hlth. Care Proj.) | | | |
1,000,000 | | 5.00%, 9/1/20 | | | 1,046,100 |
2,000,000 | | 5.00%, 9/1/29 | | | 2,077,900 |
| | Maplewood Hlth. Care Fac. Rev. Refunding Series 2005-A (VOA Care Centers Proj.): | | | |
250,000 | | 4.00%, 10/1/07 | | | 249,630 |
255,000 | | 4.125%, 10/1/08 | | | 253,881 |
300,000 | | 4.375%, 10/1/09 | | | 299,331 |
| | Marshall Medical Center Gross Rev. (Weiner Memorial Medical Center Proj.): | | | |
150,000 | | Series 2003-B, 4.85%, 11/1/11 | | | 154,655 |
50,000 | | Series 2003-A, 5.00%, 11/1/14 | | | 52,083 |
850,000 | | Series 2003-A, 5.85%, 11/1/23 | | | 922,905 |
100,000 | | Series 2003-A, 6.00%, 11/1/28 | | | 109,357 |
| | Minneapolis & St. Paul Hsg. & Redev. Auth. Hlth. Care Sys. Rev. Series 2003 (Health Partners Proj.): | | | |
750,000 | | 5.25%, 12/1/12 | | | 789,315 |
700,000 | | 5.25%, 12/1/13 | | | 738,990 |
1,150,000 | | 5.00%, 12/1/14 | | | 1,194,287 |
500,000 | | 5.875%, 12/1/29 | | | 539,795 |
| | Minneapolis Hlth. Care Sys. Rev. Series 2002-A (Allina Hlth. Sys. Proj.): | | | |
50,000 | | 5.00%, 11/15/07 | | | 50,316 |
300,000 | | 5.75%, 11/15/32 | | | 322,287 |
| | Minneapolis Hlth. Care Fac. Rev.: | | | |
625,000 | | Series 1999 (Shelter Care Foundation Proj.), 6.00%, 4/1/10 | | | 626,525 |
| | Series 2005 (Jones-Harrison Residence Proj.): | | | |
105,000 | | 3.50%, 4/1/07 | | | 104,999 |
110,000 | | 3.50%, 10/1/07 | | | 109,865 |
1,470,000 | | 5.40%, 10/1/25 | | | 1,491,344 |
| | Series 2005-E (Augustana Chapel View Homes Proj.): | | | |
190,000 | | 4.00%, 6/1/08 | | | 190,122 |
200,000 | | 4.20%, 6/1/09 | | | 200,822 |
205,000 | | 4.40%, 6/1/10 | | | 206,521 |
220,000 | | 4.55%, 6/1/11 | | | 222,059 |
240,000 | | 4.80%, 6/1/13 | | | 242,614 |
250,000 | | 4.90%, 6/1/14 | | | 253,198 |
255,000 | | 5.00%, 6/1/15 | | | 258,822 |
270,000 | | 5.10%, 6/1/16 | | | 274,571 |
285,000 | | 5.25%, 6/1/17 | | | 290,204 |
| | Minneapolis Hsg. Fac. Rev. (Augustana Chapel View Homes Proj.): | | | |
| | Series 2004-A: | | | |
315,000 | | 5.20%, 1/1/11 | | | 315,293 |
500,000 | | 5.75%, 1/1/19 | | | 508,030 |
530,000 | | 5.80%, 1/1/24 | | | 539,439 |
200,000 | | 5.50%, 6/1/27 | | | 203,036 |
500,000 | | Refunding Series 2006-A 5.00%, 6/1/15 | | | 504,495 |
| | MN Agr. & Econ. Dev. Board Hlth. Care Rev. Series 1999 (Benedictine Care Centers. Proj.): | | | |
115,000 | | 5.45%, 2/1/09 | | | 115,708 |
See accompanying notes to portfolios of investments on page 62. 47
| | | | |
| Sit Minnesota Tax-Free Income Fund
March 31, 2007 | | | |
| | | | |
| Portfolio of Investments
| | | |
| | | | |
| | | | | |
Quantity ($) | | Name of Issuer | | Market Value ($)(1) |
|
120,000 | | 5.45%, 8/1/09 | | | 120,931 |
120,000 | | 5.50%, 2/1/10 | | | 121,148 |
125,000 | | 5.50%, 8/1/10 | | | 126,393 |
| | MN Agr. & Econ. Dev. Board Rev.: | | | |
| | Series 2000 (Evangelical Lutheran Good Samaritan Society Proj.): | | | |
50,000 | | 5.65%, 8/1/07 | | | 50,259 |
215,000 | | 5.80%, 8/1/08 | | | 219,775 |
405,000 | | 6.55%, 8/1/16 | | | 439,615 |
770,000 | | Series 2002-B (Principal Custody Receipts Proj.), zero coupon, 3.85% effective yield, 11/15/22 | | | 651,374 |
| | Series 2002 (Evangelical Lutheran Good Samaritan Society Proj.): | | | |
345,000 | | 5.40%, 2/1/09 | | | 352,956 |
220,000 | | 5.50%, 2/1/12 | | | 232,267 |
| | Series 2000-A (Fairview Hlth. Care Sys. Proj.): | | | |
10,000 | | 6.375%, 11/15/22 | | | 10,789 |
20,000 | | 6.375%, 11/15/29 | | | 21,549 |
| | Moose Lake Cmnty. Hosp. Dist. Hlth. Facs. Rev. Ref. Series 2005-A (Crossover Proj.): | | | |
110,000 | | 4.10%, 12/1/10 | | | 109,883 |
225,000 | | 4.40%, 12/1/14 | | | 226,553 |
300,000 | | New Hope Hlth. Care Facs. Rev. Series 2003-A (St. Therese Home, Inc. Proj.), 5.90%, 10/1/23 | | | 310,308 |
| | New Hope Hlth. Care Facs. Rev. (MN Masonic Home North Ridge Proj.): | | | |
1,000,000 | | 5.90%, 3/1/19 | | | 1,029,370 |
575,000 | | 5.875%, 3/1/29 | | | 590,272 |
| | North Oaks Presbyterian Loan Participation: | | | |
1,050,000 | | Series 2004-B, 4.25%, 12/15/34 | | | 1,053,224 |
750,000 | | Series 2004-C, 4.38%, 12/15/34 | | | 752,303 |
500,000 | | Series 2004-D, 4.75%, 12/15/34 | | | 501,045 |
| | Northfield Hospital Rev. Series 2006: | | | |
900,000 | | 5.50%, 11/1/15 | | | 968,319 |
1,255,000 | | 5.25%, 11/1/21 | | | 1,321,590 |
| | Olmsted Co. Hlth. Care Fac. Rev. Series 1998 (Olmsted Medical Ctr. Proj.): | | | |
775,000 | | 5.45%, 7/1/13 | | | 785,036 |
900,000 | | 5.55%, 7/1/19 | | | 910,440 |
| | Pine Island Hlth. Care Facs. Rev. Series 2001 (Olmsted Med. Ctr. Proj.): | | | |
155,000 | | 4.90%, 7/1/09 | | | 156,376 |
240,000 | | 5.00%, 7/1/10 | | | 242,275 |
| | Redwood Falls Hosp. Fac. Gross Rev. Series 2006 (Redwood Area Hosp. Proj.): | | | |
190,000 | | 5.00%, 12/1/09 | | | 193,502 |
100,000 | | 5.00%, 12/1/10 | | | 102,211 |
1,000,000 | | 5.00%, 12/1/21 | | | 1,013,720 |
90,000 | | Rochester Hlth. Care Fac. Rev. G.O. Series 1998-A (Mayo Foundation Proj.), 5.50%, 11/15/27 | | | 92,447 |
500,000 | | Rochester Hlth. Care & Hsg. Rev. Series 2003-A (Samaritan Bethany Inc. Proj.), 6.25%, 8/1/19 | | | 518,475 |
| | Shakopee Hlth. Care Facs. Rev. Series 2004 (St. Francis Regl. Med. Ctr. Proj.): | | | |
125,000 | | 5.10%, 9/1/25 | | | 130,114 |
2,475,000 | | 5.25%, 9/1/34 | | | 2,587,712 |
2,500,000 | | Stillwater Hlth. Care Rev. Series 2005 (Hlth. Sys. Obligation Proj.), 5.00%, 6/1/25 | | | 2,596,625 |
| | St. Paul Hsg. & Redev. Auth. Hlth. Care Rev. Series 1998 (Regions Hosp. Proj.): | | | |
250,000 | | 5.00%, 5/15/10 | | | 254,880 |
50,000 | | 5.00%, 5/15/11 | | | 50,930 |
1,340,000 | | 5.20%, 5/15/13 | | | 1,367,041 |
2,060,000 | | 5.25%, 5/15/18 | | | 2,096,297 |
800,000 | | 5.30%, 5/15/28 | | | 813,144 |
48
| | | | |
| | |
| |
| | |
| | |
|
| |
| | | | |
| | | | |
Quantity ($) | | Name of Issuer | | Market Value ($)(1) |
| | | | | | |
1,000,000 | | St. Paul Hsg. & Redev. Auth. Hosp. Rev. Series 2005 (Health East Proj.), 5.25%, 11/15/14 | | | 1,040,890 | |
2,000,000 | | St. Paul Hsg. & Redev. Auth. Nursing Home Dev. Rev. Series 2006, 5.63%, 10/1/33 | | | 2,058,720 | |
960,000 | | St. Paul HRA Rev. Refunding Series 1996-C (St. Mary’s Home Proj.), 7.00%, 7/1/21 | | | 961,296 | |
| | St. Paul Hsg. & Redev. Auth. Hlth. Care Rev. Series 2005 (Gillette Childrens Hosp. Proj.): | | | | |
300,000 | | 4.00%, 2/1/11 | | | 297,735 | |
200,000 | | 5.00%, 2/1/13 | | | 205,628 | |
225,000 | | 5.00%, 2/1/14 | | | 231,118 | |
400,000 | | St. Paul Hsg. & Redev. Auth. Hlth. Care Rev. Series 2001-A | | | | |
| | (Model Cities Hlth. Ctr. Proj.), 6.50%, 11/1/11 | | | 408,660 | |
2,000,000 | | St. Paul Hsg. & Redev. Auth. Hlth. Care Fac. Rev. Series 2006 | | | | |
| | (HealthPartners Oblig. Group Proj.), 5.25%, 5/15/36 | | | 2,100,080 | |
910,000 | | St. Paul Port Auth. Lease Rev. Series 2005-A (Health East Midway Campus Proj.), 5.00%, 5/1/10 | | | 918,190 | |
400,000 | | Virginia Hsg. & Redev. Auth. Hlth. Care Fac. Lease Rev. Series 2005, 5.25%, 10/1/25 | | | 419,560 | |
50,000 | | Washington Co. Hsg. & Redev. Auth. Hosp. Rev. Series 1998 (Healtheast Proj.), 5.25%, 11/15/12 | | | 51,028 | |
| | | | | |
| | | | | 64,041,574 | |
| | | | | |
Industrial / Pollution Control (5.4%) | | | | |
1,155,000 | | Anoka Co. Solid Waste Disp. Rev. Series 1987-A (Natl. Rural Util. Proj.), 6.95%, 12/1/08 (4) | | | 1,187,594 | |
955,000 | | Burnsville Solid Waste Rev. Refunding Series 2003-A (Freeway Transfer Inc. Proj.), 4.15%, 4/1/10 (4) | | | 940,713 | |
500,000 | | Cohasset Pollution Ctrl. Rev. Refunding Series 2004 (Allete, Inc. Proj.), 4.95%, 7/1/22 | | | 511,395 | |
560,000 | | E. Grand Forks Indus. Dev. Rev. Refunding Series 2001-B (Am. Crystal Sugar Proj.), 5.40%, 4/1/11 | | | 569,145 | |
130,000 | | Guam Economic Dev. Auth. Tobacco Settlement Asset-Backed Series 2001-A, 5.00%, 5/15/22 | | | 131,483 | |
1,000,000 | | Guam Econ. Dev. Auth. Tobacco Settlement Asset-Backed Rev. Series 2001-B, | | | | |
| | zero coupon, 5.20% Effective Yield on Purchase Date, 5/15/15 | | | 994,130 | |
| | Laurentian Energy Auth. MN Cogeneration Rev. Series 2005-A: | | | | |
650,000 | | 4.00%, 12/1/08 | | | 646,548 | |
965,000 | | 4.00%, 12/1/09 | | | 956,527 | |
1,500,000 | | MN Public Facs. Auth. Water Pollution Ctrl. Rev. Series 1998, 5.00%, 3/1/14 | | | 1,517,835 | |
| | Owatonna Industrial Dev. Rev. Series 1997 (Slidell, Inc. Proj.): | | | | |
280,000 | | 7.25%, 5/1/14 (4)(7) | | | 145,600 | |
505,000 | | 7.375%, 5/1/17 (4)(7) | | | 262,600 | |
20,000 | | 7.375%, 5/1/20 (4)(7) | | | 10,400 | |
10,000 | | 7.50%, 5/1/24 (7) | | | 5,200 | |
| | Puerto Rico Childrens Trust Fund Tobacco Settlement Rev.: | | | | |
300,000 | | Series 2002, 4.00%, 5/15/10 | | | 299,379 | |
2,040,000 | | Series 2002, 5.375%, 5/15/33 | | | 2,135,023 | |
465,000 | | Roseville Dev. Rev. Refunding Series 2004 (Roseville Office Plaza Proj.), 4.625%, 8/1/12 | | | 469,836 | |
265,000 | | Sauk Centre Industrial Dev. Rev. Series 1998 (Seluemed LLP Proj.) (LOC First Trust), 5.75%, 4/1/18 (4) | | | 265,533 | |
1,700,000 | | Seaway Port Auth. Dock & Wharf Rev. Refunding Series 2004 (Cargill, Inc. Proj.), 4.20%, 5/1/13 | | | 1,705,661 | |
| | St. Paul Hsg. & Redev. Auth. District Cooling Rev. Series 1998-J: | | | | |
65,000 | | 4.75%, 3/1/08 | | | 65,486 | |
95,000 | | 5.125%, 3/1/12 | | | 96,969 | |
500,000 | | 5.35%, 3/1/18 | | | 510,045 | |
| | Virgin Islands Tobacco Settlement Financing Corp. Asset-Backed Rev. Series 2001: | | | | |
750,000 | | zero coupon, 4.95% effective yield on purchase date, 5/15/14 | | | 740,790 | |
1,535,000 | | 5.00%, 5/15/21 | | | 1,557,979 | |
| | | | | |
| | | | | 15,725,871 | |
| | | | | |
Insured (8.6%) | | | | | |
| | Hastings Hlth. Care Fac. Rev. Series 1998 (Regina Med. Ctr.) (ACA insured): | | | | |
565,000 | | 5.25%, 9/15/18 | | | 572,418 | |
275,000 | | 5.30%, 9/15/28 | | | 278,415 | |
20,000 | | Itasca Co. ISD No. 318 G.O. Series 1996 (MBIA insured), 5.20%, 2/1/10 | | | 20,024 | |
See accompanying notes to portfolios of investments on page 62. 49
| | | | |
| Sit Minnesota Tax-Free Income Fund
March 31, 2007 | | | |
| | | | |
| Portfolio of Investments
| | | |
| | | | |
| | | | | | |
Quantity ($) | | Name of Issuer | | Market Value ($)(1) | |
|
| | Minneapolis & St. Paul Hsg. & Redev. Auth. Hlth. Care Sys. Rev. Series 1993-A (Healthspan Hlth. Sys. Proj.) (Ambac insured): | | | | |
200,000 | | 5.00%, 11/15/13 | | | 201,398 | |
3,450,000 | | 4.75%, 11/15/18 | | | 3,452,139 | |
| | Minneapolis & St. Paul Metro Airport Comm. Airport Rev. (Ambac insured): | | | | |
1,650,000 | | Series 1998-B, 5.25%, 1/1/13 (4) | | | 1,681,053 | |
75,000 | | Series 1999-B, 5.25%, 1/1/18 (4) | | | 77,202 | |
530,000 | | MN HFA Single Family Mtg. Rev. Series 2001-A (MBIA insured), 5.35%, 7/1/17 | | | 543,446 | |
500,000 | | NE Metro Intermediate School Dist. No. 916 C.O.P. Series 2004, 4.25%, 1/1/14 | | | 505,535 | |
305,000 | | North Mankato Impt. G.O. Series 2000-A (FGIC insured), 4.75%, 2/1/10 | | | 305,247 | |
| | Perham Gas Utility Rev. Series 1999 (Radian insured): | | | | |
300,000 | | 5.35%, 6/1/19 | | | 308,343 | |
50,000 | | 5.45%, 6/1/29 | | | 51,084 | |
1,000,000 | | Puerto Rico Commonwealth Hwy. & Trnsn. Auth. Rev. Ref. Series 2007-N, variable rate, 7/1/45 | | | 1,001,500 | |
100,000 | | Puerto Rico Elec. Pwr. Auth. Rev. Ref. Series 1997-C (MBIA-IBC insured), 5.25%, 7/1/09 | | | 101,883 | |
200,000 | | Puerto Rico Indus. Tourist Educ. Med. & Environmental Ctl. Facs. Rev. Series 1995-A (Hosp. Auxilio Oblig. Group Proj.) (MBIA insured), 6.25%, 7/1/16 | | | 200,416 | |
5,000,000 | | Puerto Rico Commonwealth Infrastruc. Fin. Auth. Special Obligation Series 2000-A, 5.50%, 10/1/32 | | | 5,347,300 | |
100,000 | | Rockford Impt. G.O. Series 1998 (Ambac insured), 4.30%, 12/1/07 | | | 100,101 | |
510,000 | | St. Cloud Hosp. Facs. Rev. Ref. (St. Cloud Hosp. Proj.) (Ambac insured), | | | | |
| | Series 1996-B, 5.00%, 7/1/20 | | | 515,523 | |
| | St. Cloud Hlth. Care Rev. Series 2000-A (St. Cloud Hosp. Obligated Group) (FSA insured): | | | | |
200,000 | | 5.125%, 5/1/09 | | | 205,978 | |
250,000 | | 5.75%, 5/1/26 | | | 265,535 | |
2,345,000 | | St. Paul Hsg. & Redev. Sales Tax Rev. Refunding Series 1996 (Civic Center Proj.) (FSA insured), 7.10%, 11/1/23 | | | 2,878,933 | |
130,000 | | Scott Co. Hsg. & Redev. Auth. Fac. Lease Rev. Series 1997 (Justice Ctr. Proj.) (Ambac insured), | | | | |
| | 5.50%, 12/1/15 | | | 131,534 | |
3,100,000 | | Southern MN Pwr. Agy. Pwr. Supply Sys. Rev Series 2006, 4.84%, 1/1/13 | | | 3,091,754 | |
805,000 | | Waconia Hlth. Care Facs. Rev. Series 1999-A (Ridgeview Med. Ctr. Proj.) 6.125%, 1/1/29 | | | 849,758 | |
1,750,000 | | White Earth Band of Chippewa Indians Rev. Series 2000-A (ACA insured), 7.00%, 12/1/11 | | | 1,864,660 | |
145,000 | | Worthington Perm. Impt. Revolving Fd. G.O. Series 1998-A (FSA insured), 4.50%, 2/1/10 | | | 145,088 | |
| | | | | |
| | | | | 24,696,267 | |
| | | | | |
Multifamily Mortgage (22.0%) | | | | |
| | Apple Valley Multifamily Hsg. Rev. Refunding Series 1998-A (Mtg. Loan/Apple Valley Villa Proj.) (GNMA collateralized): | | | | |
40,000 | | 4.90%, 8/1/09 | | | 40,442 | |
1,520,000 | | 5.25%, 8/1/18 | | | 1,539,258 | |
| | Austin Hsg. & Redev. Auth. Governmental Hsg. Gross Rev. (Courtyard Res. Proj.): | | | | |
645,000 | | Series 2000-A, 7.15%, 1/1/20 | | | 680,352 | |
500,000 | | Series 2000-A, 7.25%, 1/1/32 | | | 526,575 | |
2,715,000 | | Carver Co. Hsg. & Redev. Auth. Multifamily Hsg. Gross Rev. & Ltd. Tax Refunding Series 1997-A (Lake Grace Apts. Proj.), 6.00%, 7/1/28 | | | 2,762,675 | |
| | Chaska Multifamily Hsg. Rev. Series 1999 (West Suburban Hsg. Partners Proj.): | | | | |
155,000 | | 5.00%, 9/1/09 (4) | | | 152,436 | |
495,000 | | 5.375%, 9/1/14 (4) | | | 480,987 | |
500,000 | | Cloquet Hsg. Fac. Rev. Ref. Series 2005-A (HADC Cloquet LLC Proj.), 5.50%, 8/1/25 | | | 505,710 | |
700,000 | | Coon Rapids Multifamily Hsg. Rev. Refunding Series 1997-A (Margaret Place Apts. Proj.), 6.50%, 5/1/25 | | | 718,977 | |
| | Coon Rapids Senior Hsg. Rev. Refunding Series 1998 (Epiphany Sr. Citizens Hsg. Corp. Proj.): | | | | |
115,000 | | 5.30%, 11/1/07 | | | 115,038 | |
50
| | | | |
| | |
| |
| | |
| | |
|
| |
| | | | |
| | | | |
Quantity ($) | | Name of Issuer | | Market Value ($)(1) |
|
| | | | | | |
115,000 | | 5.40%, 11/1/08 | | | 115,043 | |
170,000 | | 5.50%, 11/1/10 | | | 170,044 | |
545,000 | | 5.80%, 11/1/18 | | | 545,082 | |
2,000,000 | | Cottage Grove Sr. Hsg. Rev. Series 2006-A (Cottage Grove, Inc. Proj.), 5.00%, 12/1/31 | | | 1,985,840 | |
| | Dakota Co. Cmnty. Dev. Agy. Multifamily Hsg. Rev. Ref. Series 2007-A (Commons On Marice Proj.): | | | | |
240,000 | | 4.30%, 11/1/08 | | | 239,882 | |
150,000 | | 4.40%, 11/1/09 | | | 149,932 | |
500,000 | | 5.00%, 11/1/22 | | | 503,285 | |
1,930,000 | | Eagan Multifamily Hsg. Rev. Refunding Series 1997-A (Woodridge Apts. Proj.), 5.95%, 2/1/32 | | | 1,970,858 | |
| | Eden Prairie Multifamily Hsg. Rev. Refunding: | | | | |
15,000 | | Series 1997 (Preserve Place Proj.) (GNMA collateralized), 4.90%, 1/20/08 | | | 15,097 | |
300,000 | | Series 1997-A (Preserve Place Proj.) (GNMA collateralized), 5.50%, 1/20/18 | | | 308,403 | |
410,000 | | Series 1997-A (Preserve Place Proj.) (GNMA collateralized), 5.60%, 7/20/28 | | | 420,037 | |
470,000 | | Senior Series 2001-A (Rolling Hills Proj.) (GNMA collateralized), 6.00%, 8/20/21 | | | 512,126 | |
675,000 | | Senior Series 2001-A (Rolling Hills Proj.) (GNMA collateralized), 6.15%, 8/20/31 | | | 733,225 | |
1,185,000 | | Series 2001-A (Rolling Hills Proj.) (GNMA collateralized), 6.20%, 2/20/43 | | | 1,284,481 | |
890,000 | | Subordinate Series 2001-C (Rolling Hills Proj.), 9.00%, 4/1/43 | | | 889,831 | |
| | Eveleth Multifamily Hsg. Rev. Sr. Series 2006-A1 (Manor House Woodland Proj.): | | | | |
200,000 | | 4.90%, 10/1/09 | | | 200,070 | |
140,000 | | 4.95%, 10/1/10 | | | 140,169 | |
100,000 | | 5.00%, 10/1/11 | | | 100,207 | |
155,000 | | 5.10%, 10/1/12 | | | 155,405 | |
165,000 | | 5.15%, 10/1/13 | | | 165,515 | |
| | Faribault Hsg. & Redev. Auth. Govt. Hsg. Dev. Gross Rev. Ref. Series 1998-A (Trails Edge Apts. Proj.): | | | | |
355,000 | | 5.125%, 2/1/18 | | | 360,872 | |
650,000 | | 5.25%, 2/1/28 | | | 657,800 | |
| | Fairmont Hsg. Fac. Rev. Series 2002-A1 (Homestead-GEAC Proj.): | | | | |
1,100,000 | | 6.625%, 10/1/11 | | | 1,148,851 | |
295,000 | | 6.875%, 10/1/14 | | | 311,871 | |
| | Fairmont Hsg. Fac. Rev. Series 2005-A (Goldfinch Estates-GEAC Proj.): | | | | |
300,000 | | 5.75%, 10/1/17 | | | 302,871 | |
290,000 | | 6.00%, 10/1/21 | | | 295,342 | |
| | Golden Valley Rev. Series 1999-A (Covenant Retirement Cmntys. Proj.): | | | | |
675,000 | | 5.50%, 12/1/25 | | | 698,267 | |
1,470,000 | | 5.50%, 12/1/29 | | | 1,520,671 | |
| | Grand Rapids Hsg. & Redev. Auth. (Lakeshore Place and Forest Park West Apts. Proj.): | | | | |
35,000 | | Series 1999-B, 5.00%, 10/1/09 | | | 35,106 | |
500,000 | | Series 1999-A, 5.20%, 10/1/19 | | | 505,415 | |
1,660,000 | | Series 1999-A, 5.30%, 10/1/29 | | | 1,668,615 | |
| | Hopkins Multifamily Hsg. Rev. Series 1996 (Hopkins Renaissance Proj.) (Section 8): | | | | |
100,000 | | 5.85%, 4/1/09 | | | 102,078 | |
450,000 | | 6.25%, 4/1/15 | | | 459,787 | |
| | Hutchinson Hsg. Fac. Rev. (Prince of Peace Apts. Proj.): | | | | |
115,000 | | Series 2003-A, 4.00%, 10/1/07 | | | 115,074 | |
120,000 | | Series 2003-A, 4.50%, 10/1/08 | | | 120,241 | |
245,000 | | Inver Grove Heights Nursing Home Rev. Ref. Series 2006 (Presbyterian Homes Care Proj.), 5.50%, 10/1/33 | | | 248,820 | |
1,400,000 | | Maplewood Multifamily Hsg. Rev. Series 1998 (Park Edge Apts. Proj.), 6.50%, 5/1/29 (4) | | | 1,430,800 | |
| | Maplewood Multifamily Refunding Rev. (Village on Woodlyn Proj.): | | | | |
1,605,000 | | Series 1999-A (GNMA collateralized), 6.75%, 7/20/30 (4) | | | 1,659,747 | |
100,000 | | Subordinate Series 1999-C-1, 8.00%, 11/1/30 (4) | | | 102,074 | |
| | | | | | |
See accompanying notes to portfolios of investments on page 62. 51
| | | | |
| Sit Minnesota Tax-Free Income Fund | | | |
| March 31, 2007 | | | |
| |
| | | | |
| Portfolio of Investments | | | |
| | | | |
| | | | |
Quantity ($) | | Name of Issuer | | Market Value ($)(1) |
|
245,000 | | Subordinate Series 1999-C-2, 8.00%, 11/1/30 (4) | | 250,081 |
| | Minneapolis Multifamily Hsg. Rev.: | | |
355,000 | | Series 1996 (Belmont Apts.), 7.25%, 11/1/16 | | 361,323 |
305,000 | | Series 1996-A (Nicollet Towers) (Section 8), 5.60%, 6/1/08 | | 308,447 |
5,020,000 | | Series 1996-A (Nicollet Towers) (Section 8), 6.00%, 12/01/19 | | 5,097,408 |
115,000 | | Ref. Series 1998 (Riverside Plaza Proj.) (GNMA collateralized), 4.75%, 12/20/12 (4) | | 116,035 |
1,000,000 | | Series 1998 (Riverside Plaza Proj.) (GNMA collateralized), 5.10%, 12/20/18 (4) | | 1,010,440 |
320,000 | | Series 2000 (Garr Scott Loft Proj.) (LOC U.S. Bank), 5.95%, 5/1/30 (4) | | 332,029 |
500,000 | | Series 2002-A (Keeler Apts. Proj.), 7.00%, 10/1/17 | | 560,425 |
30,000 | | Series 2003-A (Sumner Proj.) (GNMA collateralized), 3.00%, 8/20/08 (4) | | 29,678 |
| | Ref. Series 2007-A (Keeler Apts. Proj.): | | |
150,000 | | 4.50%, 10/1/12 | | 149,279 |
580,000 | | 4.65%, 10/1/15 | | 576,903 |
| | Moorhead Sr. Hsg. Rev. Series 2006 (Sheyenne Crossing Proj.): | | |
300,000 | | 5.00%, 4/1/13 | | 302,211 |
170,000 | | 5.10%, 4/1/14 | | 172,145 |
85,000 | | Series 2004-A, 4.875%, 8/1/24 (4) | | 86,080 |
| | Series 1997-A: | | |
60,000 | | 5.40%, 8/1/10 (4) | | 61,067 |
125,000 | | 5.45%, 8/1/11(4) | | 127,224 |
100,000 | | Series 2000-A (Section 8), 5.375%, 2/1/09 (4) | | 102,195 |
1,350,000 | | MN HFA Residential Hsg. Rev. Series 2006-I, 5.00%, 7/1/21 (4) | | 1,394,348 |
| | Minnetonka Multifamily Hsg. Rev. Ref. Series 1999-A (GNMA coll.) (Archer Heights Apts. Proj.): | | |
540,000 | | 5.10%, 7/20/13 (4) | | 556,740 |
975,000 | | 5.20%, 1/20/18 (4) | | 1,002,719 |
| | Northwest MN Multi Co. Hsg. & Redev. Auth. Hsg. Rev. Series 2005-A (Pooled Hsg. Proj.): | | |
145,000 | | 4.50%, 7/1/09 | | 143,737 |
115,000 | | 4.75%, 7/1/10 | | 113,782 |
| | Norwood Young America Econ. Dev. Auth. Gov. Rev. Series 2005-A (Harbor at Peace Village Proj.): | | |
150,000 | | 5.35%, 8/1/15 | | 149,589 |
200,000 | | 5.625%, 8/1/20 | | 201,416 |
550,000 | | 5.75%, 8/1/25 | | 553,196 |
250,000 | | 6.00%, 8/1/31 | | 252,423 |
| | Oakdale Multifamily Sr. Hsg. Rev. Refunding Series 2004 (Oak Meadows Proj.): | | |
325,000 | | 4.25%, 4/1/08 | | 326,901 |
600,000 | | 5.00%, 4/1/12 | | 616,008 |
| | Oronoco Multifamily Hsg. Rev. Ref. Series 2006 (Wedum Shorewood Campus Proj.): | | |
600,000 | | 4.65%, 6/1/09 | | 594,024 |
725,000 | | 4.70%, 6/1/11 | | 713,219 |
| | Pine City Hlth. Care & Hsg. Rev. Series 2006-A (North Branc Proj.): | | |
125,000 | | 4.50%, 10/20/16 | | 128,528 |
300,000 | | 4.75%, 10/20/21 | | 307,215 |
500,000 | | Richfield Sr. Hsg. Rev. Refunding Series 2004-A (Richfield Sr. Hsg., Inc. Proj.), 5.00%, 12/1/15 | | 493,605 |
2,800,000 | | Rochester Multifamily Rev. Refunding Series 2000-A (Weatherstone Apts. Proj.) (LOC Household Fin.) (Mandatory Put 9/1/17) 6.375%, 9/1/37 (4) | | 3,103,100 |
| | Roseville Hsg. Fac. Rev. Refunding Bonds Series 1998 (College Properties Inc. Proj.): | | |
2,820,000 | | 5.60%, 10/1/13 | | 2,821,382 |
100,000 | | 5.875%, 10/1/28 | | 100,061 |
80,000 | | Sherburne Co. Hsg. & Redev. Auth. Lease Rev. Series 1997, 5.50%, 2/1/17 | | 80,085 |
| | Shoreview Sr. Hsg. Rev. Series 2005-A (Shoreview Sr. Residence Proj.): | | |
110,000 | | 3.50%, 5/1/08 | | 108,755 |
52
| | | | |
| | |
| |
| | |
| | |
|
| |
| | | | |
| | | | |
Quantity ($) | | Name of Issuer | | Market Value ($)(1) |
|
115,000 | | 3.75%, 5/1/09 | | 113,154 |
600,000 | | St. Cloud Hsg. & Redev. Auth. Multifamily Hsg. Rev. Refunding Series 1998
(Northway Manor Apts. Proj.) (Section 8), 5.35%, 12/1/18 | | 588,786 |
| | St. Cloud Hsg. & Redev. Auth. Multifamily Hsg. Rev.: | | |
1,515,000 | | Series 1993 (Germain Towers Proj.) (Section 8), 5.90%, 9/1/20 | | 1,496,972 |
60,000 | | Series 1999-A (Parkview Terrace Apts. Proj.) (Section 8), 5.00%, 6/1/09 | | 55,070 |
500,000 | | St. Louis Park Multifamily Hsg. Rev. Refunding Series 1998-A (Park Ridge Apts. Proj.)
(GNMA collateralized), 5.25%, 11/1/20 | | 515,445 |
| | St. Louis Park Rev. Ref. Series 2006 (Roitenberg Family Proj.): | | |
140,000 | | 4.65%, 8/15/09 | | 140,799 |
525,000 | | 5.50%, 8/15/26 | | 534,844 |
200,000 | | St. Paul Hsg. & Redev. Auth. Multifamily Refunding Rev. Series 1995 (Sun Cliffe Apts. Proj.) (GNMA collateralized), 5.875%, 7/1/15 | | 202,590 |
3,170,000 | | St. Paul Port Authority Multifamily Hsg. Refunding (Jackson Towers Apts. Proj.) Senior | | |
| | Series 1998-1A (GNMA collateralized), 6.95%, 4/20/33 | | 3,360,897 |
735,000 | | Stillwater Multifamily Hsg. Rev. Series 2007 (Orleans Homes LP Proj.), 5.00%, 2/1/17 (4) | | 732,126 |
120,000 | | Victoria Sr. Hsg. Rev. Series 2003 (Chanhassen, Inc. Proj.), 5.50%, 8/1/18 | | 123,259 |
| | Washington Co. Hsg. & Redev. Auth. Governmental Hsg. Rev. Ref. Series: | | |
755,000 | | 1999-A (Briar Pond Apts. Proj.) (GNMA collateralized), 5.50%, 2/20/14 | | 773,082 |
695,000 | | 2002 (Woodland Park Apts. Proj.) (Co. Guaranteed), 4.70%, 10/1/26 | | 702,388 |
500,000 | | Woodbury Econ. Dev. Auth. Sr. Hsg. Rev. Series 2006-B (Summerhouse Woodbury Proj.), | | |
| | 5.75%, 6/1/41 | | 513,475 |
250,000 | | Worthington Sr. Hsg. Rev. Series 2003-A (Meadows Worthington Proj.), 4.50%, 12/1/33 | | 248,243 |
| | | | |
| | | | 63,376,217 |
| | | | |
Municipal Lease (3.1%) (5) | | |
500,000 | | Andover Econ. Dev. Auth. Public Fac. Lease Rev. Series 2004 (Cmnty. Ctr. Proj.), 5.125%, 2/1/24 | | 524,785 |
40,000 | | Anoka Co. C.O.P. Series 1998, 5.40%, 6/1/28 | | 40,499 |
100,000 | | Big Lake Econ. Dev. Auth. Public Proj. Rev. Series 2005-A, 4.20%, 2/1/10 | | 99,863 |
175,000 | | Cambridge Econ. Dev. Auth. Public Fac. Lease Rev. Refunding Series 1998, 4.50%, 2/1/10 | | 175,003 |
2,137,791 | | Carver Scott Co. Lease Purchase Agreement Series 2005, 5.00%, 8/4/20 | | 2,146,534 |
50,000 | | Chaska Econ. Dev. Auth. ISD No. 112 Sch. Facs. Lease Rev. Series 1999-A, 5.125%, 12/1/09 | | 51,715 |
89,000 | | Hennepin Co. Hsg. & Redev. Auth. Rev. Series 1993-A (Community Provider Program), 5.70%, 8/1/13 | | 92,441 |
150,000 | | Hibbing Econ. Dev. Auth. Public Proj. Rev. Series 1997 (Hibbing Lease Obligations Proj.), 6.10%, 2/1/08 | | 150,159 |
792,085 | | Intermediate Sch. Dist. 287 Lease Rev. Series 2006, 4.78%, 3/15/13 | | 809,027 |
125,000 | | Mountain Iron Hsg. & Redev. Auth. Rev. Series 2001-A (Arrowhead Library Sys. Proj.), 5.00%, 9/1/09 | | 127,015 |
1,233,260 | | St. Paul Lease Series 1998 (City Hall Annex Building), 5.71%, 10/1/18 | | 1,261,453 |
400,000 | | St. Paul Hsg. & Redev. Auth. Lease Rev. Series 2000 (Rivercentre Pkg. Ramp Proj.), 5.70%, 5/1/08 | | 407,940 |
520,000 | | Scott Co. Hsg. & Red. Auth. Fac. Lease Rev. Series 1998 (Workforce Ctr. Proj.), 5.00%, 2/1/18 | | 524,207 |
| | Virginia Hsg. & Redev. Auth. Hlth. Care Fac. Lease Rev. Series 2005: | | |
300,000 | | 4.00%, 10/1/07 | | 299,823 |
275,000 | | 4.00%, 10/1/08 | | 274,483 |
300,000 | | 4.00%, 10/1/09 | | 299,010 |
300,000 | | 4.50%, 10/1/10 | | 303,000 |
200,000 | | 5.00%, 10/1/11 | | 206,172 |
1,200,000 | | 5.125%, 10/1/20 | | 1,248,204 |
| | | | |
| | | | 9,041,333 |
| | | | |
Public Facilities (0.4%) | | |
50,000 | | MN Agr. Soc. State Fair Rev. Series 2003, 5.00%, 9/15/20 | | 51,869 |
250,000 | | Rockville Econ. Dev. Auth. Pub. Proj. Lease Rev. Series 2005-A, 4.00%, 2/1/14 | | 247,468 |
| | Spring Grove Econ. Dev. Auth. Pub. Proj. Rev. Series 2006-A: | | |
135,000 | | 4.625%, 2/1/12 | | 136,145 |
| |
See accompanying notes to portfolios of investments on page 62. | 53 |
| | | | |
| Sit Minnesota Tax-Free Income Fund | | | |
| March 31, 2007 | | | |
| |
| | | | |
| Portfolio of Investments | | | |
| | | | |
| | | | |
Quantity ($) | | Name of Issuer | | Market Value ($)(1) |
|
255,000 | | 5.00%, 2/1/16 | | 258,973 |
125,000 | | 5.10%, 2/1/18 | | 127,018 |
| | Victoria Recreational Facility Gross Rev. Series 2002: | | |
70,000 | | 4.75%, 2/1/12 | | 70,932 |
75,000 | | 4.75%, 8/1/12 | | 75,998 |
85,000 | | 5.10%, 8/1/15 | | 86,801 |
205,000 | | Victoria Rec. Fac. Gross Rev. Ref. Crossover Series 2006-A, 4.55%, 8/1/17 | | 205,812 |
| | | | |
| | | | 1,261,016 |
| | | | |
Single Family Mortgage (4.5%) | | |
2,992,095 | | Dakota Co. Cmnty. Dev. Agy. Single Family Mtg. Rev. Series 2006 (FNMA, GNMA, & | | |
| | FHLMC backed), 5.30%, 12/1/39 | | 3,173,685 |
| | Minneapolis- St. Paul Hsg. Fin. Bd. Single Family Mtg. Rev. (FNMA & GNMA backed): | | |
35,000 | | Series 1997, 6.25%, 11/1/30 | | 36,954 |
1,441,246 | | Series 2005-A3, 5.10%, 4/1/27 | | 1,490,695 |
| | MN HFA Single Family Mtg. Rev.: | | |
200,000 | | Series 1994-E, 5.90%, 7/1/25 | | 203,026 |
90,000 | | Series 1996-D, 6.00%, 1/1/16 | | 91,025 |
70,000 | | Series 1997-A, 5.60%, 7/1/09 | | 71,096 |
260,000 | | Series 1997-I, 5.50%, 1/1/17 | | 264,688 |
155,000 | | Series 1996-H, 6.00%, 1/1/21 | | 156,742 |
580,000 | | Series 1997-D, 5.85%, 7/1/19 (4) | | 588,909 |
35,000 | | Series 1997-E, 5.90%, 7/1/29 (4) | | 35,555 |
15,000 | | Series 1997-G, 6.00%, 1/1/18 | | 15,183 |
800,000 | | Series 1998-C, 5.25%, 1/1/17 | | 807,464 |
65,000 | | Series 1998-F-1, 4.75%, 7/1/07 | | 65,086 |
45,000 | | Series 1998-F, 4.95%, 7/1/08 | | 45,027 |
230,000 | | Series 1998-F-1, 5.45%, 1/1/17 | | 231,888 |
70,000 | | Series 1998-F, 5.70%, 1/1/17 | | 70,457 |
65,000 | | Series 1998-A, 4.80%, 7/1/09 | | 66,218 |
70,000 | | Series 1998-A, 4.90%, 7/1/10 | | 71,429 |
375,000 | | Series 1999-B, 5.25%, 1/1/20 | | 376,523 |
65,000 | | Series 1999-H, 5.30%, 7/1/11 | | 65,639 |
110,000 | | Series 2000-A, 5.75%, 7/1/18 | | 113,084 |
125,000 | | Series 2000-C, 6.10%, 7/1/30 (4) | | 129,359 |
25,000 | | Series 2001-B, 4.55%, 7/1/07 (4) | | 25,036 |
320,000 | | Series 2003-I, 4.30%, 7/1/11 (4) | | 322,656 |
600,000 | | Series 2003-I, 5.10%, 7/1/20 (4) | | 615,504 |
1,980,000 | | Series 2006-B, 5.00%, 1/1/37 (4) | | 2,033,737 |
1,950,000 | | Series 2006-M, 4.80%, 7/1/26 (4) | | 1,964,274 |
| | | | |
| | | | 13,130,939 |
| | | | |
Transportation (0.0%) | | | |
20,000 | | Minneapolis & St. Paul Met. Arpts. Rev. Series 2001-B (FGIC Insured), 5.75%, 1/1/16 (4) | | 21,214 |
| | | | |
54
| | | | |
| | |
| |
| | |
| | |
|
| |
| | | | |
| | | | |
Quantity ($) | | Name of Issuer | | Market Value ($)(1) |
|
Utility (1.8%) | | | | |
1,000,000 | | Chaska Elec. Rev. Ref. Series 2005-A (Generating Facs. Proj.), 5.25%, 10/1/25 | | 1,067,060 |
200,000 | | Delano Wtr. & Pwr. Cmnty. Elec. Rev. Series 2000-A, 5.30%, 12/1/09 | | 200,218 |
| | MN Muni Pwr. Agy. Elec. Rev. Series 2005: | | |
1,475,000 | | 5.00%, 10/1/30 | | 1,532,968 |
1,900,000 | | 5.00%, 10/1/35 | | 1,970,585 |
| | Princeton Public Utility Sys. Rev. Series 2004: | | |
90,000 | | 3.00%, 4/1/07 | | 89,997 |
300,000 | | 5.00%, 4/1/24 | | 307,734 |
| | | | |
| | | | 5,168,562 |
| | | | |
Other Revenue Bonds (8.9%) | | |
| | Columbia Heights Commercial Dev. Refunding Rev. Series 1999 (Columbia Park Properties - | | |
| | Medical Clinic Proj.): | | |
250,000 | | 5.15%, 12/1/08 | | 251,570 |
1,750,000 | | 5.60%, 12/1/15 | | 1,770,755 |
900,000 | | Commissioner of Iron Range Resources and Rehab. Gross Rev. (Giant’s Ridge Rec. Area Proj.), | | |
| | Series 2000, 7.25%, 11/1/16 | | 974,880 |
800,000 | | Crystal Governmental Fac. Rev. Series 2006, 5.095%, 12/15/26 | | 812,792 |
| | Minneapolis Cmty. Dev. Agy. Ltd. Tax Common Bond Fund: | | |
125,000 | | Series 1996-1 (LOC-U.S. Bank), 6.00%, 6/1/11 | | 125,418 |
85,000 | | Series 1997-1 (Halper Corrugated Box Mfg. Co.), 5.90%, 6/1/07 (4) | | 85,303 |
500,000 | | Series 1999-1A (Discount Steel), 5.25%, 6/1/19 (4) | | 508,050 |
160,000 | | Series 2000-G2 (LOC-U.S. Bank), 6.00%, 12/1/20 | | 169,354 |
490,000 | | Minneapolis Public Hsg. Auth. Series 1997 (General Credit Energy Savings Proj.), 6.00%, 7/1/08 | | 486,693 |
| | Minneapolis Tax Increment Rev. Refunding Series 2004 (St. Anthony Falls Proj.): | | |
600,000 | | 4.50%, 2/1/13 | | 596,016 |
75,000 | | 4.40%, 2/1/09 | | 74,501 |
100,000 | | 4.50%, 2/1/10 | | 99,051 |
100,000 | | 4.60%, 2/1/11 | | 99,170 |
125,000 | | 4.70%, 2/1/12 | | 124,426 |
125,000 | | 4.80%, 2/1/13 | | 124,904 |
675,000 | | Minneapolis Tax Increment Rev. Series 2006 (Grant Park Proj.), 5.00%, 2/1/16 | | 682,742 |
1,000,000 | | MN Agr. & Econ. Dev. Board Rev. Series 2000-B (Small Business Dev. Proj.), 7.25%, 8/1/20 (4) | | 1,046,560 |
| | Mound Hsg. & Redev. Auth. Tax Increment Rev. Ref. Series 2006 (Metroplaines Proj.): | | |
309,000 | | 4.25%, 8/15/11 | | 307,696 |
1,205,000 | | 5.00%, 2/15/27 | | 1,209,205 |
| | St. Paul Hsg. & Redev. Auth. Tax Increment Rev.: | | |
155,000 | | Series 2001 (US Bank Operations Ctr. Proj.), 5.40%, 8/1/09 | | 156,578 |
100,000 | | Series 2001 (US Bank Operations Ctr. Proj.), 5.70%, 8/1/12 | | 102,569 |
800,000 | | Series 2001 (US Bank Operations Ctr. Proj.), 6.125%, 8/1/19 | | 834,136 |
1,125,000 | | Series 2002 (North Quadrant Owner Occupied Proj. Phase 2), 7.00%, 2/15/28 | | 1,204,324 |
1,020,000 | | Series 2002 (North Quadrant Owner Occupied Proj. Phase 1), 7.50%, 2/15/28 | | 1,069,521 |
3,000,000 | | Series 2002-A (Upper Landing Proj.), 6.80%, 3/1/29 | | 3,215,250 |
2,000,000 | | Series 2002-B-2 (Upper Landing Proj.), 6.90%, 3/1/29 | | 2,152,820 |
1,226,000 | | Series 2002 (Drake Marble Proj.), 6.75%, 3/1/28 | | 1,303,741 |
1,335,000 | | Series 2004 (9th St. Lofts Proj.), 6.375%, 2/15/28 | | 1,421,588 |
| | St. Paul Port Auth. Lease Rev. Series 2007-1 (Regions Hosp. Parking Ramp Proj.): | | |
155,000 | | 5.00%, 8/1/09 | | 157,516 |
200,000 | | 5.00%, 8/1/10 | | 204,296 |
390,000 | | 5.00%, 8/1/11 | | 400,362 |
| |
See accompanying notes to portfolios of investments on page 62. | 55 |
| | | | |
| Sit Minnesota Tax-Free Income Fund | | | |
| |
| | | | |
| March 31, 2007 | | | |
| Portfolio of Investments | | | |
| | | | |
| | | | | |
Quantity ($) | | Name of Issuer | | Market Value ($)(1) |
|
555,000 | | 5.00%, 8/1/21 | | | 567,010 |
1,150,000 | | 5.00%, 8/1/36 | | | 1,161,029 |
| | St. Paul Recreational Facs. Gross Rev. Series 2005 (Highland National Proj.): | | | |
205,000 | | 3.50%, 10/1/07 | | | 204,807 |
715,000 | | 5.00%, 10/1/25 | | | 754,497 |
| | Steele Co. Hlth. Care Fac. Gross Rev. Refunding Crossover Series 2005-B: | | | |
475,000 | | 4.65%, 6/1/20 | | | 479,066 |
300,000 | | 5.00%, 6/1/30 | | | 305,589 |
160,000 | | Steele Co. Hlth. Care Fac. Gross Rev. Unref. Bal. Series 2000 (Elderly Housing Proj.), 6.625%, 6/1/20 | | | 170,218 |
340,000 | | Virgin Islands Public Fin. Auth. Rev. Gross Receipts Taxes Loan Series 1999-A, 5.625%, 10/1/10 | | | 347,949 |
| | | | | |
| | | | | 25,761,952 |
| | | | | |
| | | |
Total municipal bonds (cost: $269,306,821) | | | 273,593,920 |
| | | | | |
| | | | | |
Closed-End Mutual Funds (0.2%) (2) | | | |
4,700 | | First American Minnesota Municipal Income Fund II | | | 67,351 |
29,000 | | MN Municipal Income Portfolio | | | 416,440 |
| | | | | |
|
Total closed-end mutual funds (cost: $480,950) | | | 483,791 |
| | | | | |
| | | | | |
Short-Term Securities (4.5%) (2) | | | |
1,800,000 | | Burnsville Rev. Series 1996 (YMCA Proj.), variable rate, 8/1/16 | | | 1,800,000 |
1,425,000 | | Mendota Heights Hsg. MTG Rev. Series 1991, variable rate, 11/1/31 | | | 1,425,000 |
955,000 | | Midwest Consortium of Utility Rev. Series 2005-A (MN Utilities Assoc. Proj.), variable rate, 1/1/25 | | | 955,000 |
1,000,000 | | Mpls. & St. Paul Hsg. & Redev. Auth. Hlth. Care Sys. Series 2004-B, variable rate, 8/15/25 | | | 1,000,000 |
1,145,000 | | Mpls. Nursing Home Rev. Ref. Series 2002 (Catholic Eldercare Proj.), variable rate, 12/1/27 | | | 1,145,000 |
1,820,000 | | Minneapolis Multifamily Rev. Series 2001 (Seven Corners Apts. Proj.), variable rate, 11/1/31 | | | 1,820,000 |
800,000 | | MN Higher Educ. Facs. Rev. Series 2003, variable rate, 10/1/33 | | | 800,000 |
1,500,000 | | Robbinsdale Hlth. Care Facs. Rev. Series 2003 (North Memorial Health Proj.), variable rate, 5/15/33 | | | 1,500,000 |
1,550,000 | | St. Paul Hsg. & Redev. Auth. Rev. Series 2001 (Cretin -Derham Hall Proj.), variable rate, 2/1/26 | | | 1,550,000 |
1,077,927 | | Wells Fargo Minnesota Municipal Cash Fund, 2.94% | | | 1,077,927 |
| | | | | |
| | | |
Total Short-Term Securities (cost: 13,072,927) | | | 13,072,927 |
| | | | | |
| | | | | |
Total investments in securities (cost: $282,860,698) (6) | | $ | 287,150,638 |
| | | |
| |
56 | See accompanying notes to portfolios of investments on page 62. |
This page has been left blank intentionally.
57
| | | | |
| Sit Florida Tax-Free Income Fund | | | |
| One Year Ended March 31, 2007 | | | |
| | | | |
| Senior Portfolio Managers
Michael C. Brilley • Debra A. Sit, CFA • Paul J. Jungquist, CFA
| | | |
| | | | |
The Sit Florida Tax-Free Income Fund provided a return of +3.97% net of fees for the twelve months ended March 31, 2007, compared with a return of +4.28% for the Lehman 5-Year Municipal Bond Index. The Fund’s 30-day SEC yield was 4.05% and its 12-month distribution rate was 3.60%.
Municipal bond yields fell slightly over the past 12 month period, with yields on intermediate and longer maturities down more than yields on short maturities. The yield curve flattened during the year, but remains positively sloping. Interest rates declined as economic growth began to slow, and the Federal Reserve has held short-term interest rates steady since its latest increase in June 2006. While the Federal Reserve remains focused on containing inflation, the market is anticipating a cut in the targeted rate later this year.
The Fund’s investment returns from the hospital/health-care, multi-family housing and other revenue sectors outperformed the Lehman 5-Year Municipal Index, with the hospital sector providing the greatest incremental return. The Fund’s duration remained shorter than the Lehman 5-Year Index as it has since the inception of the Fund. That shorter duration has been the primary factor contributing to the Fund’s underperformance relative to the benchmark index. The Fund remains focused on providing attractive tax exempt income and relative stability of principal.
INVESTMENT OBJECTIVE AND STRATEGY |
The objective of the Florida Tax-Free Income Fund is to provide a high level of current income that is exempt from federal regular income tax by investing in securities that are exempt from the Florida intangibles tax.
The Fund seeks to achieve its objective by investing primarily in municipal securities that generate interest income that is exempt from regular federal income tax and that are exempt from the Florida intangible personal property tax. During normal market conditions, the Fund invests 100% (and, as a fundamental policy, no less than 80%) of its net assets in such tax-exempt municipal securities. The Fund may invest up to 10% of its assets in securities that generate interest income subject to federal alternative minimum tax.
| | |
Net Asset Value 3/31/07: | | $9.99 Per Share |
3/31/06: | | $9.96 Per Share |
Total Net Assets: | | $3.7 Million |
30-day SEC Yield: | | 4.05% |
Tax Equivalent Yield: | | 6.23%(1) |
12-Month Distribution Rate: | | 3.60% |
Average Maturity: | | 12.4 Years |
Duration to Estimated Avg. Life: | | 2.6 Years(2) |
Implied Duration: | | 3.6 Years(2) |
| | |
(1) For individuals in the 35.0% federal tax bracket.
(2) See next page. |
PORTFOLIO STRUCTURE
(% OF TOTAL NET ASSETS) |
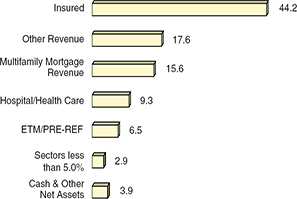
58
| | | | |
| | |
| |
| | |
| | |
|
| |
| | | | |
| | | | | | | | | | | | |
| |
AVERAGE ANNUAL TOTAL RETURNS* | |
| | | | | | | | | | |
| | Sit
FL Tax-Free
Income Fund | | Lehman
5-Year Muni.
Bond Index | | Lipper
FL Muni.
Bond Fund
Index | |
| | | | | | | |
3 Month** | | 0.82 | | | 0.93 | | | 0.74 | | |
6 Month** | | 1.64 | | | 1.56 | | | n/a | | |
1 Year | | 3.97 | | | 4.28 | | | 5.16 | | |
5 Years | | n/a | | | n/a | | | n/a | | |
10 Years | | n/a | | | n/a | | | n/a | | |
Inception
(12/31/03) | | 3.21
| | | 2.44
| | | 4.07
| | |
| | | | | | | | | | |
CUMULATIVE TOTAL RETURNS* |
| |
| | Sit
FL Tax-Free
Income Fund | | Lehman
5-Year Muni.
Bond Index | | Lipper
FL Muni.
Bond Fund
Index | |
| | | | | | | |
1 Year | | 3.97 | | | 4.28 | | | 5.16 | | |
5 Year | | n/a | | | n/a | | | n/a | | |
10 Year | | n/a | | | n/a | | | n/a | | |
Inception
(12/31/03) | | 10.82 | | | 8.16 | | | 13.83 | | |
| | | | | | | | | | |
*As of 3/31/07 | **Not annualized. | |
| | |
Performance figures are historical and do not guarantee future results. Investment returns and principal value will vary, and you may have a gain or loss when you sell shares. Average annual total returns include changes in share price as well as reinvestment of all dividends and capital gains. Management fees and administrative expenses are included in the Fund’s performance; however, fees and expenses are not incorporated in the Lehman 5-Year Municipal Bond Index. The Lip-per returns are obtained from Lipper Analytical Services, Inc., a large independent evaluator of mutual funds.
(2) Duration is a measure which reflects estimated price sensitivity to a given change in interest rates. For example, for an interest rate change of 1%, a portfolio with a duration of 5 years would be expected to experience a price change of 5%. Estimated average life duration is based on current interest rates and the Adviser’s assumptions regarding the expected average life of individual securities held in the portfolio. Implied duration is calculated based on historical price changes of securities held by the Fund. The Adviser believes that the portfolio’s implied duration is a more accurate estimate of price sensitivity provided interest rates remain within their historical range. If interest rates exceed the historical range, the estimated average life duration may be a more accurate estimate of price sensitivity.
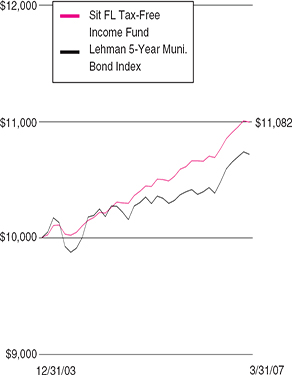
The sum of $10,000 invested at inception (12/31/03) and held until 3/31/07 would have grown to $11,082 in the Fund or $10,816 in the Lehman 5-Year Municipal Bond Index assuming reinvestment of all dividends and capital gains.
QUALITY RATINGS
(% OF TOTAL NET ASSETS) |
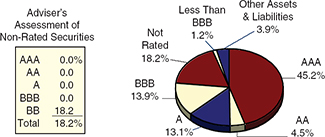
Lower of Moody’s, S&P, Fitch or Duff & Phelps ratings used.
59
| | | | |
| Sit Florida Tax-Free Income Fund
March 31, 2007 | | | |
| | | | |
| Portfolio of Investments
| | | |
| | | | |
| | | | | | |
Quantity ($) | | Name of Issuer | | Market Value ($)(1) | |
| | | | | |
Municipal Bonds (96.1%) (2) | | | �� | |
| | | | |
Escrowed to Maturity / Prerefunded (6.5%) | | | | |
50,000 | | Jacksonville Elec. Auth. Rev. Refundng Series 1997 Issue 2-14 (St. John’s River Proj.), 4.90%, 10/1/08 | | | 50,001 | |
25,000 | | Orange Co. School Board C.O.P. Series 1997-A, 5.375%, 8/1/22 | | | 25,374 | |
20,000 | | Pinellas Co. Swr. Rev. Series 1998 (FGIC Insured), 5.00%, 10/1/24 | | | 20,593 | |
20,000 | | Tampa - Hillsborough Expressway Auth. Rev. Series 1997, 5.00%, 7/1/27 | | | 20,264 | |
| | Tampa Rev. Allegany Hlth. Sys.: | | | | |
50,000 | | Series 1993 (St. Anthony Hosp. Proj.), 5.125%, 12/1/15 | | | 50,303 | |
75,000 | | Series 1993 (St. Joseph’s Hosp. Proj.) (MBIA insured), 5.125%, 12/1/23 | | | 75,454 | |
| | | | | |
| | | | | 241,989 | |
| | | | | |
General Obligation (0.7%) | | | | |
25,000 | | State Board of Educ. Cap. Outlay G.O. Ref. Series 1989, 5.00%, 6/1/24 | | | 25,020 | |
| | | | | |
Hospital / Health Care (9.3%) | | | | |
50,000 | | Collier Co. Indl. Dev. Auth. Hlth. Care Fac. Rev. Series 2004 | | | | |
| | (Naples Cmnty. Hosp. Inc. Proj.), 4.65%, 10/1/34 | | | 50,775 | |
| | Escambia Co. Hlth. Facs. Auth. Rev. Series 1998 (Baptist Hosp. Proj.): | | | | |
50,000 | | 5.125%, 10/1/14 | | | 51,067 | |
65,000 | | 5.125%, 10/1/19 | | | 66,182 | |
15,000 | | Henderson Hlth. Care Fac. Rev. Series 1998 (Catholic Healthcare West Proj.), 5.125%, 7/1/28 | | | 15,268 | |
| | Marion Co. Hosp. Dist. Rev. Refunding Series 1999 (Munroe Reg. Proj.): | | | | |
25,000 | | 5.25%, 10/1/10 | | | 26,000 | |
50,000 | | 5.50%, 10/1/14 | | | 52,094 | |
80,000 | | South Lake Co. Hosp. Dist. Rev. Series 2003 (South Lake Hosp., Inc. Proj.), 5.50%, 10/1/13 | | | 84,698 | |
| | | | | |
| | | | | 346,084 | |
| | | | | |
Industrial / Pollution Control (2.2%) | | | | |
50,000 | | Hillsborough Co. Indl. Dev. Auth. Pollution Ctrl. Rev. Series 2002 (Tampa Electric Co. Proj.), 5.50%, 10/1/23 | | | 52,862 | |
30,000 | | Jacksonville Pollution Ctrl. Rev. Ref. Series 1996 (Anheuser-Busch Proj.), 5.70%, 8/1/31 | | | 30,025 | |
| | | | | |
| | | | | 82,887 | |
| | | | | |
Insured (44.2%) | | | | |
50,000 | | Bay Med. Ctr. Hosp. Rev. Ref. Series 1996 (Bay Med. Ctr. Proj.) (Ambac insured), 5.55%, 10/1/15 | | | 51,058 | |
60,000 | | Clearwater Hsg. Auth. Rev. Refunding Series 1997 (Hamptons at Clearwater Proj.) (ACA insured), 5.40%, 5/1/13 | | | 61,507 | |
45,000 | | Cocoa Cap. Impt. Rev. Series 1998 (MBIA Insured), 5.00%, 10/1/22 | | | 46,120 | |
150,000 | | Dade Co. Special Oblig. Rev. Refunding Series 1996-B (Ambac insured), 5.00%, 10/1/35 | | | 151,713 | |
45,000 | | First FL Govt. Financing Comm. Unrefunded Rev. Series 1997 (MBIA insured), 5.70%, 7/1/17 | | | 45,666 | |
45,000 | | FL Correctional Privatization C.O.P. Series 1995-B (Ambac insured), 5.00%, 8/1/17 | | | 45,190 | |
50,000 | | FL HFC Hsg. Rev. Series 2000-D-1 (Augustine Club Apts. Proj.) (Ambac insured), 5.75%, 10/1/30 | | | 52,421 | |
100,000 | | Halifax Hosp. Med. Ctr. Health Care Fac. Rev. Series 1998-A (Halifax Mgmt. Sys. Proj.) (ACA insured), 5.00%, 4/1/12 | | | 101,656 | |
90,000 | | Hillsborough Co. Educ. Fac. Auth. Rev. Refunding Series 1998 (Univ. of Tampa Proj.) (Radian insured), 5.75%, 4/1/18 | | | 93,362 | |
| | Lakeland Hosp. Sys. Rev. Refunding (Lakeland Regl. Med. Ctr. Proj.) (MBIA insured): | | | | |
80,000 | | Series 1996, 5.25%, 11/15/25 | | | 81,655 | |
60
| | | | |
| | |
| |
| | |
| | |
|
| |
| | | | |
| | | | | | |
Quantity ($) | | Name of Issuer | | Market Value ($)(1) | |
| | | | | |
50,000 | | Series 1997, 5.00%, 11/15/22 | | | 50,716 | |
40,000 | | Miami - Dade Co. Impts. Public Svc. Tax Rev. Series 1999, 5.00%, 10/1/23 | | | 41,374 | |
| | Miami - Dade Co. Special Oblig. Rev. Series 1997-B (MBIA insured), zero coupon: | | | | |
265,000 | | 5.44% effective yield, 10/1/33 | | | 63,433 | |
100,000 | | 4.79% effective yield, 10/1/35 | | | 94,378 | |
20,000 | | Ocala Cap. Impts. Rev. Series 1995 (Ambac insured), 5.375%, 10/1/22 | | | 20,150 | |
60,000 | | Orlando & Orange Co. Expwy. Auth. Rev. Junior Lien Series 1998 (FGIC insured), 5.00%, 7/1/28 | | | 61,212 | |
90,000 | | Palm Beach Co. Hlth. Facs. Auth. Rev. Series 1993 (Jupiter Med. Ctr. Proj.) (FSA insured), 5.25%, 8/1/18 | | | 90,098 | |
45,000 | | Pinellas Co. Educ. Fac. Auth. Rev. Series 2006 (Eckerd College Proj.) (ACA insured), 4.50%, 10/1/14 | | | 45,905 | |
55,000 | | Pinellas Co. Swr. Rev. Ref. Series 1998 (FGIC Insured), 5.00%, 10/1/24 | | | 56,370 | |
| | Port Everglades Auth. Rev. Refunding & Impt. Series 1989-A: | | | | |
45,000 | | (FSA insured), 5.00%, 9/1/16 | | | 45,119 | |
150,000 | | (MBIA-IBC insured), 5.00%, 9/1/16 | | | 150,305 | |
25,000 | | South Fork Auth. Hosp. Rev. Series 1998-B (Conemaugh Valley Memorial Hosp. Proj.), 5.375%, 7/1/22 | | | 25,637 | |
170,000 | | Village Ctr. Cmnty. Dev. Dist. Recreational Rev. Series 1998-A (MBIA insured), 5.00%, 11/1/21 | | | 174,592 | |
| | | | | | |
| | | | | 1,649,637 | |
| | | | | | |
Multifamily Mortgage (15.6%) | | | | |
100,000 | | Broward Co. Hsg. Fin. Auth. Multifamily Rev. Refunding Series 1996 (Tamarac Pointe Apts. Proj.) (GNMA collateralized), 6.15%, 7/1/16 | | | 102,052 | |
100,000 | | Capital Trust Agy. Hsg. Rev. Series 2005-B (Atlantic Hsg. Foundation Proj.), 4.50%, 7/1/15 | | | 101,198 | |
45,000 | | Capital Trust Agy. Multifamily Rev. Sr. Series 2003-A (Golf Villas, Rivermill, and Village Square Apts. Proj.), 4.75%, 6/1/13 | | | 43,882 | |
45,000 | | Collier Co. HFA Multifamily Hsg. Rev. Series 2002-C (Goodlette Arms Proj.), 5.25%, 8/15/15 | | | 46,607 | |
20,000 | | Dade Co. Hsg. Fin. Auth. Multifamily Rev. Refunding Series 1996-A (New Horizons Proj.) (FHA insured), 5.88%, 7/15/24 | | | 20,616 | |
120,000 | | Orange Co. Hlth. Facs. Auth. Rev. Refunding Series 2005 (Orlando Lutheran Proj.), 4.625%, 7/1/09 | | | 118,943 | |
150,000 | | Plantation Hlth. Facs. Auth. Rev. Refunding Series 1998 (Covenant Village Proj.), 5.125%, 12/1/22 | | | 151,460 | |
| | | | | | |
| | | | | 584,758 | |
| | | | | | |
Other Revenue Bonds (17.6%) | | | | |
100,000 | | Arbor Greene Cmnty. Dev. Dist. Special Assessment Rev. Ref. Series 2006, 5.00%, 5/1/19 | | | 105,670 | |
80,000 | | Belmont Cmnty. Dev. Dist. Impt. Rev. Series 2006-B, 5.125%, 11/1/14 | | | 79,773 | |
5,000 | | Double Branch Cmnty. Dev. Dist. Rev. Series 2003-C, 5.125%, 5/1/08 | | | 5,000 | |
100,000 | | Fiddlers Creek Cmnty. Dev. Dist. No. 2 Rev. Series 2003-B, 5.75%, 5/1/13 | | | 103,148 | |
100,000 | | Forest Creek Cmnty. Dev. Dist. Impt. Rev. Series 2005-B, 4.85%, 5/1/11 | | | 99,120 | |
100,000 | | Heritage Isle At Viera Cmnty. Dev. Dist. Spl. Assessment Series 2006, 5.00%, 11/1/13 | | | 99,222 | |
5,000 | | Mediterra North Cmnty. Dev. Dist. Impt. Rev. Series 2001-B, 6.00%, 5/1/08 | | | 5,021 | |
10,000 | | Parklands Lee Cmnty. Dev. Dist. Rev. Series 2004-B, 5.125%, 5/1/11 | | | 10,004 | |
100,000 | | Sterling Hill Cmnty. Dev. Dist. Cap. Impt. Rev. Series 2006-B, 5.10%, 5/1/11 | | | 100,215 | |
50,000 | | West Villages Impt. Dist. Rev. Special Assessment Series 2006, 5.50%, 5/1/37 | | | 50,095 | |
| | | | | | |
| | | | | 657,268 | |
| | | | | | |
| | | | | | |
Total municipal bonds (cost: $3,577,804) | | | 3,587,643 | |
| | | | | | |
| | | | | | |
Total investments in securities (cost: $3,577,804) (6) | | $ | 3,587,643 | |
| | | | | |
| |
See accompanying notes to portfolios of investments on page 62. | 61 |
| | | | |
| Sit Mutual Funds
March 31, 2007 | | | |
| | | | |
| Notes to Portfolios of Investments
| | | |
| | | | |
| |
(1) | Securities are valued by procedures described in note 1 to the financial statements. |
| |
(2) | Percentage figures indicate percentage of total net assets. |
| |
(3) | At March 31, 2007, 3.1% of net assets in the U.S. Government Securities Fund were invested in GNMA mobile home pass-through securities. |
| |
(4) | Securities the income from which is treated as a tax preference that is included in alternative minimum taxable income for purposes of computing federal alternative minimum tax (AMT). At March 31, 2007, 9.2% of net assets in the Minnesota Tax-Free Income Fund was invested in such securities. |
| |
(5) | Rule 144A Securities, Section 4(2) Commercial Paper, and Municipal Lease Securities (“Restricted Securities”) held by the Funds which have been determined to be liquid by the Adviser in accordance with guidelines established by the Board of Directors. |
| |
(6) | At March 31, 2007 the cost of securities for federal income tax purposes and the aggregate gross unrealized appreciation and depreciation based on that cost were as follows: |
| | | | | | | | | | |
| | Money
Market
Fund | | U.S.
Government
Securities
Fund | | Tax-Free
Income
Fund | |
| | | | | | | | | | |
Cost for federal income tax purposes | | $ | 52,734,441 | | $ | 201,029,014 | | $ | 387,603,050 | |
| | | | | | | | | | |
Unrealized appreciation (depreciation) on investments: | | | | | | | | | | |
Gross unrealized appreciation | | | — | | $ | 1,260,634 | | $ | 3,907,709 | |
Gross unrealized depreciation | | | — | | | (2,413,619 | ) | | (12,813,680 | ) |
| | | | | | | | | | |
| | | | | | | | | | |
Net unrealized appreciation (depreciation) | | | — | | ($ | 1,152,985 | ) | ($ | 8,905,971 | ) |
| | | | | | | | | | |
|
| | Minnesota
Tax-Free
Income
Fund | | Florida
Tax-Free
Income
Fund | | | | |
| | | | | | | | | | |
Cost for federal income tax purposes | | $ | 282,860,698 | | $ | 3,577,804 | | | | |
| | | | | | | | | | |
| | | | | | | | | | |
Unrealized appreciation (depreciation) on investments: | | | | | | | | | | |
Gross unrealized appreciation | | $ | 5,099,738 | | $ | 18,704 | | | | |
Gross unrealized depreciation | | | (809,798 | ) | | (8,865 | ) | | | |
| | | | | | | | | | |
| | | | | | | | | | |
Net unrealized appreciation (depreciation) | | $ | 4,289,940 | | $ | 9,839 | | | | |
| | | | | | | | | | |
| |
(7) | These securities have been identified by the investment adviser as illiquid securities. The aggregate value of these securities at March 31, 2007, is $6,100,117 and $423,800 in the Tax-Free Income and Minnesota Tax-Free Income Funds respectively, which represents 1.6% and 0.1% of the Fund’s net assets, respectively. |
| |
(8) | Presently non-income producing securities. Items identified are in default as to payment of interest. |
| |
(9) | At March 31, 2007, the total cost of investments purchased on a when-issued or forward-commitment basis was $3,405,068 and $560,980 for the Tax-Free Income Fund and Minnesota Tax-Free Income Fund, respectively |
62
This page has been left blank intentionally.
63
| | | | |
| Sit Mutual Funds
March 31, 2007 | | | |
| | | | |
| Statements of Assets and Liabilities
| | | |
| | | | |
| | | | | | | | | | |
| | Money
Market
Fund | | U.S.
Government
Securities
Fund | | Tax-Free
Income
Fund | |
| | | | | | | |
ASSETS | | | | | | | | | | |
Investments in securities, at identified cost | | $ | 52,734,441 | | $ | 201,029,014 | | $ | 387,603,050 | |
| | | | | | | | | | |
Investments in securities, at market value - see accompanying schedules for detail | | $ | 52,734,441 | | $ | 199,876,029 | | $ | 378,697,079 | |
Cash in bank on demand deposit | | | 297 | | | 213,228 | | | — | |
Accrued interest and dividends receivable | | | — | | | 1,212,993 | | | 5,020,720 | |
Receivable for investment securities sold | | | — | | | 2,463,512 | | | 2,697,228 | |
Receivable for principal paydowns | | | — | | | 93,916 | | | — | |
Other receivables | | | — | | | — | | | 15,000 | |
Receivable for Fund shares sold | | | 15 | | | 86,486 | | | 318,663 | |
| | | | | | | | | | |
|
Total assets | | | 52,734,753 | | | 203,946,164 | | | 386,748,690 | |
| | | | | | | | | | |
|
LIABILITIES | | | | | | | | | | |
Disbursements in excess of cash balances | | | — | | | — | | | 519,742 | |
Payable for investment securities purchased - when issued (note 1) | | | — | | | — | | | 3,405,068 | |
Payable for investment securities purchased | | | — | | | 4,000,624 | | | 3,622,250 | |
Payable for Fund shares redeemed | | | — | | | 648,827 | | | 128,982 | |
Cash portion of dividends payable to shareholders | | | 198,293 | | | 785,815 | | | 1,273,208 | |
Other payables | | | — | | | 1,082 | | | 12,506 | |
Accrued investment management and advisory services fee | | | 20,684 | | | 131,723 | | | 237,789 | |
| | | | | | | | | | |
Total liabilities | | | 218,977 | | | 5,568,071 | | | 9,199,545 | |
| | | | | | | | | | |
|
Net assets applicable to outstanding capital stock | | $ | 52,515,776 | | $ | 198,378,093 | | $ | 377,549,145 | |
| | | | | | | | | | |
Net assets consist of: | | | | | | | | | | |
Capital (par value and paid-in surplus) | | $ | 52,515,776 | | $ | 203,351,767 | | $ | 415,194,187 | |
Undistributed (distributions in excess of) net investment income | | | — | | | — | | | — | |
Accumulated net realized gain (loss) from security transactions | | | — | | | (3,820,689 | ) | | (28,739,071 | ) |
Unrealized appreciation (depreciation) on investments | | | — | | | (1,152,985 | ) | | (8,905,971 | ) |
|
| | | | | | | | | | |
| | $ | 52,515,776 | | $ | 198,378,093 | | $ | 377,549,145 | |
| | | | | | | | | | |
| | | | | | | | | | |
Outstanding shares | | | 52,519,251 | | | 18,792,328 | | | 38,827,764 | |
| | | | | | | | | | |
|
Net asset value per share of outstanding capital stock | | $ | 1.00 | | $ | 10.56 | | $ | 9.72 | |
| | | | | | | | | | |
64
| | | | |
| | |
| |
| | |
| | |
|
| |
| | | | |
| | | | | | | |
| | Minnesota
Tax-Free
Income
Fund | | Florida
Tax-Free
Income
Fund | |
| | | | | |
ASSETS | | | | | | | |
Investments in securities, at identified cost | | $ | 282,860,698 | | $ | 3,577,804 | |
| | | | | | | |
Investments in securities, at market value - see accompanying schedules for detail | | $ | 287,150,638 | | $ | 3,587,643 | |
Cash in bank on demand deposit | | | 16,306 | | | 96,136 | |
Accrued interest and dividends receivable | | | 4,492,151 | | | 64,122 | |
Receivable for investment securities sold | | | — | | | — | |
Receivable for principal paydowns | | | — | | | — | |
Other receivables | | | 1,486 | | | — | |
Receivable for Fund shares sold | | | — | | | — | |
| | | | | | | |
|
Total assets | | | 291,660,581 | | | 3,747,901 | |
| | | | | | | |
| | | | | | | |
LIABILITIES | | | | | | | |
Disbursements in excess of cash balances | | | — | | | — | |
Payable for investment securities purchased - when issued (note 1) | | | 560,980 | | | — | |
Payable for investment securities purchased | | | 1,000,519 | | | — | |
Payable for Fund shares redeemed | | | — | | | — | |
Cash portion of dividends payable to shareholders | | | 986,988 | | | 11,280 | |
Other payables | | | — | | | — | |
Accrued investment management and advisory services fee | | | 190,568 | | | 2,460 | |
| | | | | | | |
Total liabilities | | | 2,739,055 | | | 13,740 | |
| | | | | | | |
|
Net assets applicable to outstanding capital stock | | $ | 288,921,526 | | $ | 3,734,161 | |
| | | | | | | |
|
Net assets consist of: | | $ | 294,297,168 | | $ | 3,739,325 | |
Capital (par value and paid-in surplus) | | | — | | | 249 | |
Undistributed (distributions in excess of) net investment income | | | (9,665,582 | ) | | (15,252 | ) |
Accumulated net realized gain (loss) from security transactions | | | 4,289,940 | | | 9,839 | |
|
| | | | | | | |
Unrealized appreciation (depreciation) on investments | | $ | 288,921,526 | | $ | 3,734,161 | |
| | | | | | | |
|
Outstanding shares | | | 28,289,923 | | | 373,841 | |
| | | | | | | |
|
Net asset value per share of outstanding capital stock | | $ | 10.21 | | $ | 9.99 | |
| | | | | | | |
See accompanying notes to financial statements on pages 70-74. 65
| | | | |
| Sit Mutual Funds
One Year Ended March 31, 2007 | | | |
| | | | |
| Statements of Operations
| | | |
| | | | |
| | | | | | | | | | |
| | Money
Market
Fund | | U.S.
Government
Securities
Fund | | Tax-Free
Income
Fund | |
| | | | | | | |
Investment income: | | | | | | | | | | |
Income: | | | | | | | | | | |
Interest | | $ | 3,368,767 | | $ | 11,504,522 | | $ | 17,280,487 | |
| | | | | | | | | | |
Total income | | | 3,368,767 | | | 11,504,522 | | | 17,280,487 | |
| | | | | | | | | | |
|
Expenses (note 3): | | | | | | | | | | |
Investment management and advisory services fee | | | 487,686 | | | 1,799,020 | | | 2,935,165 | |
Less fees and expenses absorbed by investment adviser | | | (164,255 | ) | | (99,726 | ) | | (117,581 | ) |
| | | | | | | | | | |
Total net expenses | | | 323,431 | | | 1,699,294 | | | 2,817,584 | |
| | | | | | | | | | |
Net investment income | | | 3,045,336 | | | 9,805,228 | | | 14,462,903 | |
| | | | | | | | | | |
|
Realized and unrealized gain (loss) on investments: | | | | | | | | | | |
Net realized gain (loss) | | | — | | | (995,910 | ) | | 755,205 | |
|
Net change in unrealized appreciation (or depreciation) on investments | | | — | | | 3,040,999 | | | (838,265 | ) |
| | | | | | | | | | |
Net gain (loss) on investments | | | — | | | 2,045,089 | | | (83,060 | ) |
| | | | | | | | | | |
|
Net increase (decrease) in net assets resulting from operations | | $ | 3,045,336 | | $ | 11,850,317 | | $ | 14,379,843 | |
| | | | | | | | | | |
66
| | | | | | | |
| | Minnesota
Tax-Free
Income
Fund | | Florida
Tax-Free
Income
Fund | |
| | | | | |
Investment income: | | | | | | | |
Income: | | | | | | | |
Interest | | $ | 13,647,373 | | $ | 171,255 | |
| | | | | | | |
Total income | | | 13,647,373 | | | 171,255 | |
| | | | | | | |
|
Expenses (note 3): | | | | | | | |
Investment management and advisory services fee | | | 2,192,609 | | | 31,117 | |
Less fees and expenses absorbed by investment adviser | | | — | | | — | |
| | | | | | | |
Total net expenses | | | 2,192,609 | | | 31,117 | |
| | | | | | | |
Net investment income | | | 11,454,764 | | | 140,138 | |
| | | | | | | |
|
Realized and unrealized gain (loss) on investments: | | | | | | | |
Net realized gain (loss) | | | 46,712 | | | 2,503 | |
|
Net change in unrealized appreciation (or depreciation) on investments | | | 2,372,026 | | | 10,868 | |
| | | | | | | |
Net gain (loss) on investments | | | 2,418,738 | | | 13,371 | �� |
| | | | | | | |
|
Net increase (decrease) in net assets resulting from operations | | $ | 13,873,502 | | $ | 153,509 | |
| | | | | | | |
See accompanying notes to financial statements on pages 70-74. 67
| | | | |
| | | | |
| Sit Mutual Funds | |
| | |
| Statements of Changes in Net Assets
| |
| | | | |
| | | | | | | | | | | | | |
| | Money Market
Fund | | U.S. Government
Securities Fund | |
| | | | | |
|
| | Year ended
March 31,
2007 | | Year ended
March 31,
2006 | | Year ended
March 31,
2007 | | Year ended
March 31,
2006 | |
| | | | | | | | | |
Operations: | | | | | | | | | | | | | |
Net investment income | | $ | 3,045,336 | | $ | 2,041,527 | | $ | 9,805,228 | | $ | 10,362,410 | |
Net realized gain (loss) on investments | | | — | | | — | | | (995,910 | ) | | 750,613 | |
Net change in unrealized appreciation (depreciation) of investments | | | — | | | — | | | 3,040,999 | | | (4,611,298 | ) |
| | | | | | | | | | | | | |
| | | | | | | | | | | | | |
Net increase (decrease) in net assets resulting from operations | | | 3,045,336 | | | 2,041,527 | | | 11,850,317 | | | 6,501,725 | |
| | | | | | | | | | | | | |
Distributions to shareholders from: | | | | | | | | | | | | | |
Net investment income | | | (3,045,336 | ) | | (2,041,527 | ) | | (9,805,228 | ) | | (10,362,410 | ) |
Net realized gains on investments | | | — | | | — | | | — | | | — | |
| | | | | | | | | | | | | |
| | | | | | | | | | | | | |
Total distributions | | | (3,045,336 | ) | | (2,041,527 | ) | | (9,805,228 | ) | | (10,362,410 | ) |
| | | | | | | | | | | | | |
Capital share transactions: | | | | | | | | | | | | | |
Proceeds from shares sold | | | 228,663,487 | | | 296,220,951 | | | 54,637,396 | | | 71,154,845 | |
Reinvested distributions | | | 1,685,472 | | | 1,012,883 | | | 9,659,292 | | | 9,696,616 | |
Payments for shares redeemed | | | (247,515,120 | ) | | (265,692,551 | ) | | (102,358,453 | ) | | (101,005,681 | ) |
| | | | | | | | | | | | | |
| | | | | | | | | | | | | |
Increase (decrease) in net assets from capital share transactions | | | (17,166,161 | ) | | 31,541,283 | | | (38,061,765 | ) | | (20,154,220 | ) |
| | | | | | | | | | | | | |
| | | | | | | | | | | | | |
Total increase (decrease) in net assets | | | (17,166,161 | ) | | 31,541,283 | | | (36,016,676 | ) | | (24,014,905 | ) |
Net assets | | | | | | | | | | | | | |
Beginning of period | | | 69,681,937 | | | 38,140,654 | | | 234,394,769 | | | 258,409,674 | |
| | | | | | | | | | | | | |
End of period | | $ | 52,515,776 | | $ | 69,681,937 | | $ | 198,378,093 | | $ | 234,394,769 | |
| | | | | | | | | | | | | |
| | | | | | | | | | | | | |
Capital transactions in shares: | | | | | | | | | | | | | |
Sold | | | 228,663,487 | | | 296,221,341 | | | 5,218,496 | | | 6,709,932 | |
Reinvested distributions | | | 1,685,472 | | | 1,012,883 | | | 922,551 | | | 913,343 | |
Redeemed | | | (247,515,120 | ) | | (265,692,551 | ) | | (9,768,659 | ) | | (9,546,473 | ) |
| | | | | | | | | | | | | |
| | | | | | | | | | | | | |
Net increase (decrease) | | | (17,166,161 | ) | | 31,541,673 | | | (3,627,612 | ) | | (1,923,198 | ) |
| | | | | | | | | | | | | |
68
| | | | |
| | |
| |
| | |
| | |
|
| |
| | | | |
| | | | | | | | | | | | | | | | | | | |
| | Tax-Free
Income Fund | | Minnesota Tax-Free
Income Fund | | Florida Tax-Free
Income Fund | |
| | | | | | | |
|
| | Year ended
March 31,
2007 | | Year ended
March 31,
2006 | | Year ended
March 31,
2007 | | Year ended
March 31,
2006 | | Year ended
March 31,
2007 | | Year ended
March 31,
2006 | |
| | | | | | | | | | | | | |
Operations: | | | | | | | | | | | | | | | | | | | |
Net investment income | | $ | 14,462,903 | | $ | 13,551,425 | | $ | 11,454,764 | | $ | 10,095,953 | | $ | 140,138 | | $ | 130,583 | |
Net realized gain (loss) on investments | | | 755,205 | | | 163,813 | | | 46,712 | | | (1,717,166 | ) | | 2,503 | | | (848 | ) |
Net change in unrealized appreciation (depreciation) of investments | | | (838,265 | ) | | (1,877,414 | ) | | 2,372,026 | | | 2,238,861 | | | 10,868 | | | 3,022 | |
| | | | | | | | | | | | | | | | | | | |
| | | | | | | | | | | | | | | | | | | |
Net increase (decrease) in net assets resulting from operations | | | 14,379,843 | | | 11,837,824 | | | 13,873,502 | | | 10,617,648 | | | 153,509 | | | 132,757 | |
| | | | | | | | | | | | | | | | | | | |
Distributions to shareholders from: | | | | | | | | | | | | | | | | | | | |
Net investment income | | | (14,462,903 | ) | | (13,551,425 | ) | | (11,454,764 | ) | | (10,095,953 | ) | | (140,138 | ) | | (130,583 | ) |
Net realized gains on investments | | | — | | | — | | | — | | | — | | | — | | | — | |
| | | | | | | | | | | | | | | | | | | |
| | | | | | | | | | | | | | | | | | | |
Total distributions | | | (14,462,903 | ) | | (13,551,425 | ) | | (11,454,764 | ) | | (10,095,953 | ) | | (140,138 | ) | | (130,583 | ) |
| | | | | | | | | | | | | | | | | | | |
Capital share transactions: | | | | | | | | | | | | | | | | | | | |
Proceeds from shares sold | | | 112,626,064 | | | 102,432,805 | | | 94,800,905 | | | 82,036,189 | | | 334,573 | | | 1,659,197 | |
Reinvested distributions | | | 12,778,006 | | | 11,757,251 | | | 9,353,492 | | | 8,392,121 | | | 132,262 | | | 123,600 | |
Payments for shares redeemed | | | (114,719,972 | ) | | (99,396,238 | ) | | (80,963,635 | ) | | (60,672,379 | ) | | (507,857 | ) | | (1,195,917 | ) |
| | | | | | | | | | | | | | | | | | | |
| | | | | | | | | | | | | | | | | | | |
Increase (decrease) in net assets from capital share transactions | | | 10,684,098 | | | 14,793,818 | | | 23,190,762 | | | 29,755,931 | | | (41,022 | ) | | 586,880 | |
| | | | | | | | | | | | | | | | | | | |
| | | | | | | | | | | | | | | | | | | |
Total increase (decrease) in net assets | | | 10,601,038 | | | 13,080,217 | | | 25,609,500 | | | 30,277,626 | | | (27,651 | ) | | 589,054 | |
Net assets | | | | | | | | | | | | | | | | | | | |
Beginning of period | | | 366,948,107 | | | 353,867,890 | | | 263,312,026 | | | 233,034,400 | | | 3,761,812 | | | 3,172,758 | |
| | | | | | | | | | | | | | | | | | | |
End of period | | $ | 377,549,145 | | $ | 366,948,107 | | $ | 288,921,526 | | $ | 263,312,026 | | $ | 3,734,161 | | $ | 3,761,812 | |
| | | | | | | | | | | | | | | | | | | |
| | | | | | | | | | | | | | | | | | | |
Capital transactions in shares: | | | | | | | | | | | | | | | | | | | |
Sold | | | 11,588,831 | | | 10,475,538 | | | 9,310,566 | | | 8,076,581 | | | 33,692 | | | 166,249 | |
Reinvested distributions | | | 1,315,255 | | | 1,201,483 | | | 919,038 | | | 826,211 | | | 13,256 | | | 12,389 | |
Redeemed | | | (11,813,651 | ) | | (10,161,560 | ) | | (7,954,513 | ) | | (5,976,372 | ) | | (50,828 | ) | | (120,146 | ) |
| | | | | | | | | | | | | | | | | | | |
| | | | | | | | | | | | | | | | | | | |
Net increase (decrease) | | | 1,090,435 | | | 1,515,461 | | | 2,275,091 | | | 2,926,420 | | | (3,880 | ) | $ | 58,492 | |
| | | | | | | | | | | | | | | | | | | |
See accompanying notes to financial statements on pages 70-74. 69
| | | | |
|
| Sit Mutual Funds | | | |
| Notes to Financial Statements
| | | |
| | | | |
| |
(1) | Summary of Significant Accounting Policies |
| |
| The Sit Mutual Funds (the Funds) are no-load funds, and are registered under the Investment Company Act of 1940 (as amended) as diversified (except Minnesota and Florida Tax-Free Income Funds which are non-diversified), open-end management investment companies, or series thereof. The Sit Minnesota Tax-Free Income Fund and the Sit Tax-Free Income Fund are series funds of Sit Mutual Funds II, Inc. The Sit Florida Tax-Free Income Fund is a series fund of Sit Mutual Funds Trust. Each fund has 10 billion authorized shares of capital stock. Shares in the U.S. Government Securities Fund have a par value of $0.01, and shares in other funds have a par value of $0.001. This report covers the bond funds of the Sit Mutual Funds. The investment objective for each Fund is as follows: |
| |
Fund | Investment Objective |
Money Market | Maximum current income with the preservation of capital and maintenance of liquidity. |
U.S. Government Securities | High level of current income and safety of principal. |
Tax-Free Income | High level of current income that is exempt from federal income tax, consistent with the preservation of capital. |
Minnesota Tax-Free Income | High level of current income that is exempt from federal regular income tax and Minnesota regular personal income tax, consistent with the preservation of capital. |
Florida Tax-Free Income | High level of current income that is exempt from federal regular income tax by investing in securities that are exempt from the Florida intangibles tax. |
| |
| Significant accounting policies followed by the Funds are summarized below: |
| |
| Investments in Securities |
| Securities maturing more than 60 days from the valuation date, with the exception of those in Money Market Fund, are valued at the market price supplied by an independent pricing vendor based on current interest rates; those securities with maturities of less than 60 days when acquired, or which subsequently are within 60 days of maturity, are valued at amortized cost, which approximates market value. When market quotations are not readily available, or when the Adviser becomes aware that a significant event impacting the value of a security or group of securities has occurred after the closing of the exchange on which the security or securities principally trade, but before the calculation of the daily net asset value, securities are valued at fair value as determined in good faith using procedures established by the Board of Directors. Pursuant to Rule 2a-7 of the Investment Company Act of 1940, all securities in the Money Market Fund are valued at amortized cost, which approximates market value, in order to maintain a constant net asset value of $1 per share. |
70
| | | | |
| | |
| |
| | |
| | |
|
| |
| | | | |
| |
| Security transactions are accounted for on the date the securities are purchased or sold. Gains and losses are calculated on the identified-cost basis. Interest, including level-yield amortization of long-term bond premium and discount, is recorded on the accrual basis. Dividends received from closed-end fund holdings are included in Interest Income and are generated from the underlying investments. |
| |
| Delivery and payment for securities which have been purchased by the Funds on a forward commitment or when-issued basis can take place two weeks or more after the transaction date. During this period, such securities are subject to market fluctuations and may increase or decrease in value prior to delivery. As of March 31, 2007, the Tax-Free Income and Minnesota Tax-Free Income Funds entered into when-issued or forward commitments valued at $3,405,068 and $560,980, respectively. |
| |
| The Minnesota Tax-Free Income Fund concentrates its investments in Minnesota, and therefore may have more credit risk related to the economic conditions in the state of Minnesota than a portfolio with broader geographical diversification. |
| |
| The Florida Tax-Free Income Fund concentrates its investments in Florida, and therefore may have more credit risk related to the economic conditions in the state of Florida than a portfolio with broader geographical diversification. |
| |
| Line of Credit |
| The Funds have a $25,000,000 committed line of credit through PNC Bank, N.A., whereby the Funds may borrow for the temporary funding of shareholder redemptions or for other temporary purposes. Interest is charged to each Fund based on its borrowings at a rate equal to the Federal Funds Rate plus fifty basis points (0.50%). The Funds had no borrowings outstanding during the year ended March 31, 2007. |
| |
| Recent Accounting Pronouncements |
| On September 20, 2006, the Financial Accounting Standards Board (FASB) released Statement of Financial Accounting Standards No. 157, “Fair Value Measurements” (SFAS 157). SFAS 157 establishes an authoritative definition of fair value, sets out a framework for measuring fair value, and requires additional disclosures about fair-value measurements. The application of SFAS 157 is required for fiscal years beginning after November 15, 2007 and interim periods within those fiscal years. The impact of SFAS 157 on the Fund’s financial statements is being evaluated. |
| |
| In June 2006, the FASB issued FASB Interpretation 48 (FIN 48), “Accounting for Uncertainty in Income Taxes.” FIN 48 clarifies the accounting for uncertainty in income taxes recognized in accordance with FASB Statement No. 109, “Accounting for Income Taxes.” FIN 48 prescribes a two-step process to recognize and measure a tax position taken or expected to be taken in a tax return. The first step is to determine whether a tax position has met the more-likely-than-not recognition threshold and the second step is to measure a tax position that meets the threshold to determine the amount of benefit to recognize. FIN 48 also provides guidance on derecognition, classification, interest and penalties, accounting in interim periods, disclosure, and transition. FIN 48 is effective for fiscal years beginning after December 15, 2006. Tax positions of the Funds are being evaluated to determine the impact, if any, to the Funds. The adoption of FIN 48 is not anticipated to have a material impact on the Funds. |
71
| | | | |
|
| Sit Mutual Funds | | | |
| Notes to Financial Statements (continued)
| | | |
| | | | |
| |
| Federal Taxes |
| The Funds’ policy is to comply with the requirements of the Internal Revenue Code applicable to regulated investment companies and to distribute all of its taxable income to shareholders. Therefore, no income tax provision is required. Also, in order to avoid the payment of any federal excise taxes, the Funds will distribute substantially all of their net investment income and net realized gains on a calendar year basis. |
| |
| Net investment income and net realized gains may differ for financial statement and tax purposes. The character of distributions made during the year for net investment income or net realized gains may also differ from its ultimate characterization for tax purposes. The tax character of distributions paid during the fiscal years ended March 31, 2007 were as follows: |
| | | | | | | | | | | | | | | | |
Year Ended March 31, 2007: | | | | | | | |
| | | | | | | |
| | Ordinary Income | | Long Term Capital Gain | | Total | |
| | | | | | | |
Money Market | | | $ | 3,045,336 | | | — | | | $ | 3,045,336 | | |
U.S. Government Securities | | | $ | 9,805,228 | | | — | | | $ | 9,805,228 | | |
Tax-Free Income (*) | | | $ | 14,462,903 | | | — | | | $ | 14,462,903 | | |
MN Tax-Free Income (*) | | | $ | 11,454,764 | | | — | | | $ | 11,454,764 | | |
FL Tax-Free Income (*) | | | $ | 140,138 | | | — | | | $ | 140,138 | | |
(*) 100% of dividends were derived from interest on tax-exempt securities. | | | | | | | |
| | | | | | | | | | | | | | |
Year Ended March 31, 2006: | | | | | | | | | | | | | | |
| | | | | | | | | | | | | | |
| | Ordinary Income | | Long Term Capital Gain | | Total | |
| | | | | | | |
Money Market | | | $ | 2,041,527 | | | — | | | $ | 2,041,527 | | |
U.S. Government Securities | | | $ | 10,362,410 | | | — | | | $ | 10,362,410 | | |
Tax-Free Income (*) | | | $ | 13,551,425 | | | — | | | $ | 13,551,425 | | |
MN Tax-Free Income (*) | | | $ | 10,095,953 | | | — | | | $ | 10,095,953 | | |
FL Tax-Free Income (*) | | | $ | 130,583 | | | — | | | $ | 130,583 | | |
(*) 100% of dividends were derived from interest on tax-exempt securities. | | | | | |
| | | | | | | | | | | | | | |
As of March 31, 2007, the components of distributable earnings on a tax basis were as follows: | | |
| | Undistributed
Ordinary Income | | Accumulated
Gain (Loss) | | Unrealized
Appreciation
(Depreciation) | |
| | | | | | | |
Money Market | | | $ | 198,293 | | | | | — | | | | | — | | |
U.S. Government Securities | | | $ | 785,815 | | | | ($ | 3,820,689 | ) | | | ($ | 1,152,985 | ) | |
Tax-Free Income | | | $ | 1,273,208 | | | | ($ | 28,739,071 | ) | | | ($ | 8,905,971 | ) | |
MN Tax-Free Income | | | $ | 986,988 | | | | ($ | 9,665,582 | ) | | | $ | 4,289,940 | | |
FL Tax-Free Income | | | $ | 11,529 | | | | ($ | 15,252 | ) | | | $ | 9,839 | | |
On the statement of assets and liabilities for the U.S. Government Securities Fund, as a result of permanent book-to-tax differences, a reclassification adjustment of $419,268 was made to decrease additional paid-in capital and increase accumulated net realized gain (loss).
72
As of March 31, 2007, for federal income tax purposes, some Funds have capital loss carryovers which, if not offset by subsequent gains will begin to expire as follows:
| | | | | | | | |
| | Loss Carryover | | Expiration Year | |
| | | | | |
U.S. Government Securities | | | $ | 3,820,689 | | | 2008 | |
Tax-Free Income | | | $ | 28,739,071 | | | 2008 | |
MN Tax-Free Income | | | $ | 9,665,582 | | | 2008 | |
FL Tax-Free Income | | | $ | 15,252 | | | 2013 | |
| |
| Distributions |
| Distributions to shareholders are recorded as of the close of business on the record date. Such distributions are payable in cash or reinvested in additional shares of the Funds’ capital stock. Distributions from net investment income are declared daily and paid monthly for the Funds. Distributions from net realized gains, if any, will be made annually for each of the Funds. |
| |
| Use of Estimates |
| The preparation of financial statements in conformity with U.S. generally accepted accounting principles requires management to make certain estimates and assumptions that affect the reported amounts of assets and liabilities and disclosure of contingent assets and liabilities at the date of the financial statements and the reported results. Actual results could differ from those estimates. |
| |
(2) | Investment Security Transactions |
| |
| The cost of purchases of and proceeds from sales and maturities of investment securities, other than short-term securities, for the period ended March 31, 2007, were as follows: |
| | | | | | | |
| | Purchases ($) | | Proceeds ($) | |
| | | | | |
U.S. Government Securities Fund | | 92,417,493 | | | 130,271,746 | | |
Tax-Free Income Fund | | 191,877,660 | | | 181,729,848 | | |
Minnesota Tax-Free Income Fund | | 101,356,304 | | | 77,568,639 | | |
Florida Tax-Free Income Fund | | 958,097 | | | 1,062,374 | | |
| |
| For the Money Market Fund during the period ended March 31, 2007 purchases of and proceeds from sales and maturities of investment securities aggregated $1,473,876,245 and $1,494,487,530, respectively. |
| |
(3) | Expenses |
| |
| Investment Adviser |
| The Funds each have entered into an investment management agreement with Sit Investment Associates Inc. (SIA), under which SIA manages the Funds’ assets and provides research, statistical and advisory services, and pays related office rental, executive expenses and executive salaries. SIA also is obligated to pay all of the Funds’ expenses (excluding extraordinary expenses, stock transfer taxes, interest, brokerage commissions, and other transaction charges relating to |
73
| | | | |
|
| Sit Mutual Funds | | | |
| Notes to Financial Statements (continued)
| | | |
| | | | |
investing activities). The fee for investment management and advisory services is based on the average daily net assets of the Funds at the annual rate of:
| |
| Average Daily Net Assets |
| |
Tax-Free Income Fund | .80% |
Minnesota Tax-Free Income Fund | .80% |
Florida Tax-Free Income Fund | .80% |
| | | | |
| First $50 Million | | Over $50 Million |
| | | |
Money Market Fund | .80 | % | | .60% |
U.S. Government Securities Fund | 1.00 | % | | .80% |
| |
| For the period October 1, 1993, through December 31, 2007, the Adviser has voluntarily agreed to limit the flat monthly fee (and, thereby, all Fund expenses, except extraordinary expenses, interest, brokerage commissions and other transaction charges not payable by the Adviser) paid by the Tax-Free Income Fund to an annual rate of .70% of the Fund’s average daily net assets in excess of $250 million and .60% of the Fund’s average daily net assets in excess of $500 million. After December 31, 2007, this voluntary fee waiver may be discontinued by the Adviser in its sole discretion. |
| |
| For the period October 1, 1993, through December 31, 2007, the Adviser has voluntarily agreed to limit the flat monthly fee (and, thereby, all Fund expenses, except extraordinary expenses, interest, brokerage commissions and other transaction charges not payable by the Adviser) paid by the U.S. Government Securities Fund and Money Market Fund to an annual rate of .80% and .50%, respectively of the Fund’s average daily net assets. After December 31, 2007, this voluntary fee waiver may be discontinued by the Adviser in its sole discretion. |
| |
| Transactions with affiliates |
| The investment adviser, affiliates of the investment adviser, directors and officers of the Funds as a whole owned the following shares as of March 31, 2007: |
| | | | |
| Shares | | % Shares Outstanding |
| | | |
Money Market Fund | 22,167,074 | | 42.2 | (*) |
U.S. Government Securities Fund | 557,945 | | 3.0 | |
Tax-Free Income Fund | 1,875,959 | | 4.8 | |
Minnesota Tax-Free Income Fund | 1,672,204 | | 5.9 | |
Florida Tax-Free Income Fund | 256,645 | | 68.7 | |
(*) 29.8% shares owned by other Sit Mutual Funds. | | | |
| |
(4) | Financial Highlights |
| |
| Per share data for a share of capital stock outstanding during the period and selected supplemental and ratio information for each period(s), are indicated on pages 75 through 79. |
74
| | | | |
| | |
| |
| Sit Money Market Fund | |
| | |
| Financial Highlights
| |
| | | | |
| | | | | | | | | | | | | | | | |
| | Years Ended March 31, | |
| | | |
| | 2007 | | 2006 | | 2005 | | 2004 | | 2003 | |
| | | | | | | | | | | | |
Net Asset Value: | | | | | | | | | | | | | | | | |
Beginning of period | | $ | 1.00 | | $ | 1.00 | | $ | 1.00 | | $ | 1.00 | | $ | 1.00 | |
| | | | | | | | | | | | | | | | | |
Operations: | | | | | | | | | | | | | | | | |
Net investment income | | | 0.05 | | | 0.03 | | | 0.01 | | | 0.01 | | | 0.01 | |
| | | | | | | | | | | | | | | | | |
Total from operations | | | 0.05 | | | 0.03 | | | 0.01 | | | 0.01 | | | 0.01 | |
| | | | | | | | | | | | | | | | | |
Distributions to Shareholders: | | | | | | | | | | | | | | | | |
From net investment income | | | (0.05 | ) | | (0.03 | ) | | (0.01 | ) | | (0.01 | ) | | (0.01 | ) |
| | | | | | | | | | | | | | | | | |
Net Asset Value: | | | | | | | | | | | | | | | | |
End of period | | $ | 1.00 | | $ | 1.00 | | $ | 1.00 | | $ | 1.00 | | $ | 1.00 | |
| | | | | | | | | | | | | | | | | |
Total investment return (1) | | | 4.80 | % | | 3.28 | % | | 1.24 | % | | 0.60 | % | | 1.13 | % |
| | | | | | | | | | | | | | | | | |
Net assets at end of period (000’s omitted) | | $ | 52,516 | | $ | 69,682 | | $ | 38,141 | | $ | 44,610 | | $ | 73,843 | |
| | | | | | | | | | | | | | | | |
Ratios: | | | | | | | | | | | | | | | | |
Expenses to average daily net assets | | | 0.50 | % (2) | | 0.50 | % (2) | | 0.50 | % (2) | | 0.50 | % (2) | | 0.50 | % (2) |
Net investment income to average daily net assets | | | 4.70 | % (2) | | 3.35 | % (2) | | 1.22 | % (2) | | 0.60 | % (2) | | 1.14 | % (2) |
| | |
| | |
|
| (1) | Total investment return is based on the change in net asset value of a share during the period and assumes reinvestment of distributions at net asset value. |
| | |
| (2) | Total Fund expenses are contractually limited to .80% of average daily net assets for the 8rst $50 million in Fund net assets and .60% of average daily net assets for Fund net assets exceeding $50 million. However, during the years ended March 31, 2007, 2006, 2005, 2004, and 2003, the investment adviser voluntarily absorbed expenses that were otherwise payable by the Fund. Had the Fund incurred these expenses, the ratio of expenses to average daily net assets would have been .75%, .76%, .80%, .76%, and .74%, for each of these periods and the ratio of net investment income to average daily net assets would have been 4.45%, 3.09%, .92%, .34%, and .90%, respectively. |
75
| | | | |
| | | | |
|
| Sit U.S. Government Securities Fund | | | |
| Financial Highlights
| | | |
| | | | |
| | | | | | | | | | | | | | | | |
| | Years Ended March 31, | |
| | | |
| | 2007 | | 2006 | | 2005 | | 2004 | | 2003 | |
| | | | | | | | | | | | |
Net Asset Value: | | | | | | | | | | | | | | | | |
Beginning of period | | $ | 10.45 | | $ | 10.62 | | $ | 10.79 | | $ | 10.83 | | $ | 10.69 | |
| | | | | | | | | | | | | | | | | |
Operations: | | | | | | | | | | | | | | | | |
Net investment income | | | .48 | | | .43 | | | .38 | | | .27 | | | .45 | |
Net realized and unrealized gains (losses) on investments | | | .11 | | | (.17 | ) | | (.17 | ) | | (.04 | ) | | .14 | |
| | | | | | | | | | | | | | | | | |
Total from operations | | | .59 | | | .26 | | | .21 | | | .23 | | | .59 | |
| | | | | | | | | | | | | | | | | |
Distributions to Shareholders: | | | | | | | | | | | | | | | | |
From net investment income | | | (.48 | ) | | (.43 | ) | | (.38 | ) | | (.27 | ) | | (.45 | ) |
From net realized gains | | | — | | | — | | | — | | | — | | | — | |
| | | | | | | | | | | | | | | | | |
Total Distributions | | | (.48 | ) | | (.43 | ) | | (.38 | ) | | (.27 | ) | | (.45 | ) |
| | | | | | | | | | | | | | | | | |
Net Asset Value: | | | | | | | | | | | | | | | | |
End of period | | $ | 10.56 | | $ | 10.45 | | $ | 10.62 | | $ | 10.79 | | $ | 10.83 | |
| | | | | | | | | | | | | | | | | |
Total investment return (1) | | | 5.81 | % | | 2.45 | % | | 1.93 | % | | 2.19 | % | | 5.60 | % |
| | | | | | | | | | | | | | | | | |
Net assets at end of period (000’s omitted) | | $ | 198,378 | | $ | 234,395 | | $ | 258,410 | | $ | 287,442 | | $ | 408,840 | |
| | | | | | | | | | | | | | | | |
Ratios: | | | | | | | | | | | | | | | | |
Expenses to average daily net assets (3) | | | 0.80 | % (2) | | 0.80 | % (2) | | 0.80 | % (2) | | 0.80 | % (2) | | 0.80 | % (2) |
Net investment income to average daily net assets | | | 4.61 | % (2) | | 4.03 | % (2) | | 3.51 | % (2) | | 2.48 | % (2) | | 3.98 | % (2) |
Portfolio turnover rate (excluding short-term securities) | | | 43.98 | % | | 60.37 | % | | 36.64 | % | | 61.99 | % | | 77.06 | % |
| |
| |
| |
(1) | Total investment return is based on the change in net asset value of a share during the period and assumes reinvestment of distributions at net asset value. |
| |
(2) | Total Fund expenses are contractually limited to 1.00% of average daily net assets for the first $50 million in Fund net assets and .80% of average daily net assets for Fund net assets exceeding $50 million. However, during years ended March 31, 2007, 2006, 2005, 2004, and 2003, the investment adviser voluntarily absorbed expenses that were otherwise payable by the Fund. Had the Fund incurred these expenses, the ratio of expenses to average daily net assets would have been .85%, .84%, .84%, .83%, and .83% for each of these periods and the ratio of net investment income to average daily net assets would have been 4.56%, 3.99%, 3.47%, 2.45%, and 3.95%, respectively. |
| |
(3) | In addition to fees and expenses which the Fund bears directly, the Fund indirectly bears a pro rata share of the fees and expenses of the acquired funds in which it invests. Such indirect expenses are not included in the above reported expense ratios. |
76
| | | | |
| | |
| |
| Sit Tax-Free Income Fund | |
| | |
| Financial Highlights
| |
| | | | |
| | | | | | | | | | | | | |
| | Years Ended March 31, | |
| | | |
| | 2007 | | 2006 | | 2005 | | 2004 | |
| | | | | | | | | | |
Net Asset Value: | | | | | | | | | | | | | |
Beginning of period | | $ | 9.72 | | $ | 9.77 | | $ | 9.90 | | $ | 9.94 | |
| | | | | | | | | | | | | | |
Operations: | | | | | | | | | | | | | |
Net investment income | | | .38 | | | .37 | | | .38 | | | .42 | |
Net realized and unrealized gains (losses) on investments | | | .00 | | | (.05 | ) | | (.13 | ) | | (.04 | ) |
| | | | | | | | | | | | | | |
Total from operations | | | .38 | | | .32 | | | .25 | | | .38 | |
| | | | | | | | | | | | | | |
Distributions to Shareholders: | | | | | | | | | | | | | |
From net investment income | | | (.38 | ) | | (.37 | ) | | (.38 | ) | | (.42 | ) |
From net realized gains | | | — | | | — | | | — | | | — | |
| | | | | | | | | | | | | | |
Total distributions | | | (.38 | ) | | (.37 | ) | | (.38 | ) | | (.42 | ) |
| | | | | | | | | | | | | | |
Net Asset Value: | | | | | | | | | | | | | |
End of period | | $ | 9.72 | | $ | 9.72 | | $ | 9.77 | | $ | 9.90 | |
| | | | | | | | | | | | | | |
Total investment return (1) | | | 4.00 | % | | 3.35 | % | | 2.54 | % | | 3.89 | % |
| | | | | | | | | | | | | | |
Net assets at end of period (000’s omitted) | | $ | 377,549 | | $ | 366,948 | | $ | 353,868 | | $ | 352,281 | |
| | | | | | | | | | | | | |
Ratios: | | | | | | | | | | | | | |
Expenses to average daily net assets (3) | | | 0.77 | % (2) | | 0.77 | % (2) | | 0.77 | % (2) | | 0.76 | % (2) |
Net investment income to average daily net assets | | | 3.93 | % (2) | | 3.81 | % (2) | | 3.84 | % (2) | | 4.23 | % (2) |
Portfolio turnover rate (excluding short-term securities) | | | 50.67 | % | | 32.93 | % | | 41.29 | % | | 32.33 | % |
| | |
| | |
| | |
| (1) | Total investment return is based on the change in net asset value of a share during the period and assumes reinvestment of distributions at net asset value. |
| | |
| (2) | Total Fund expenses are contractually limited to .80% of average daily net assets. However, during the years ended March 31, 2007, 2006, 2005, 2004, and 2003, the investment adviser voluntarily absorbed expenses that were otherwise payable by the Fund. Had the Fund incurred these expenses, the ratio of expenses to average daily net assets would have been .80% for these periods, and the ratio of net investment income to average daily net assets would have been 3.90%, 3.78%, 3.81%, 4.19%, and 4.49%, respectively. |
| | |
| (3) | In addition to fees and expenses which the Fund bears directly, the Fund indirectly bears a pro rata share of the fees and expenses of the acquired funds in which it invests. Such indirect expenses are not included in the above reported expense ratios. |
77
| | | | |
| | | | |
| Sit Minnesota Tax-Free Income Fund | | | |
| Financial Highlights
| | | |
| | | | |
| | | | | | | | | | | | | | | | |
| | Years Ended March 31, | |
| | |
| | 2007 | | 2006 | | 2005 | | 2004 | | 2003 | |
| | | | | | | | | | | | |
Net Asset Value: | | | | | | | | | | | | | | | | |
Beginning of period | | $ | 10.12 | | $ | 10.09 | | $ | 10.26 | | $ | 10.22 | | $ | 9.99 | |
| | | | | | | | | | | | | | | | | |
Operations: | | | | | | | | | | | | | | | | |
Net investment income | | | .42 | | | .41 | | | .44 | | | .46 | | | .47 | |
Net realized and unrealized gains (losses) on investments | | | .09 | | | .03 | | | (.17 | ) | | .04 | | | .23 | |
| | | | | | | | | | | | | | | | | |
Total from operations | | | .51 | | | .44 | | | .27 | | | .50 | | | .70 | |
| | | | | | | | | | | | | | | | | |
Distributions to Shareholders: | | | | | | | | | | | | | | | | |
From net investment income | | | (.42 | ) | | (.41 | ) | | (.44 | ) | | (.46 | ) | | (.47 | ) |
| | | | | | | | | | | | | | | | | |
Net Asset Value: | | | | | | | | | | | | | | | | |
End of period | | $ | 10.21 | | $ | 10.12 | | $ | 10.09 | | $ | 10.26 | | $ | 10.22 | |
| | | | | | | | | | | | | | | | | |
Total investment return (1) | | | 5.17 | % | | 4.46 | % | | 2.69 | % | | 4.99 | % | | 7.14 | % |
| | | | | | | | | | | | | | | | | |
Net assets at end of period (000’s omitted) | | $ | 288,922 | | $ | 263,312 | | $ | 233,034 | | $ | 217,773 | | $ | 219,368 | |
| | | | | | | | | | | | | | | | |
Ratios: | | | | | | | | | | | | | | | | |
Expenses to average daily net assets (2) | | | 0.80 | % | | 0.80 | % | | 0.80 | % | | 0.80 | % | | 0.80 | % |
Net investment income to average daily net assets | | | 4.17 | % | | 4.07 | % | | 4.33 | % | | 4.47 | % | | 4.62 | % |
Portfolio turnover rate (excluding short-term securities) | | | 28.42 | % | | 54.91 | % | | 29.33 | % | | 27.31 | % | | 19.51 | % |
| |
| |
| |
(1) | Total investment return is based on the change in net asset value of a share during the period and assumes reinvestment of distributions at net asset value. |
| |
(2) | In addition to fees and expenses which the Fund bears directly, the Fund indirectly bears a pro rata share of the fees and expenses of the acquired funds in which it invests. Such indirect expenses are not included in the above reported expense ratios. |
78
| | | | |
| | |
| |
| Sit Florida Tax-Free Income Fund | |
| | |
| Financial Highlights
| |
| | | | |
| | | | | | | | | | | | | | |
| | | | | Three months
Ended
March 31,
2004 | |
| | Years Ended March 31, | | | |
| | | | | |
| | 2007 | | 2006 | | 2005 | | | |
| | | | | | | | | | | |
Net Asset Value: | | | | | | | | | | | | | | |
Beginning of period | | $ | 9.96 | | $ | 9.94 | | $ | 10.05 | | | $ | 10.00 | |
| | | | | | | | | | | | | | | |
Operations: | | | | | | | | | | | | | | |
Net investment income | | | .36 | | | .33 | | | .29 | | | | .06 | |
Net realized and unrealized gains (losses) on investments | | | .03 | | | .02 | | | (.11 | ) | | | .05 | |
| | | | | | | | | | | | | | | |
Total from operations | | | .39 | | | .35 | | | .18 | | | | .11 | |
| | | | | | | | | | | | | | | |
Distributions to Shareholders: | | | | | | | | | | | | | | |
From net investment income | | | (.36 | ) | | (.33 | ) | | (.29 | ) | | | (.06 | ) |
| | | | | | | | | | | | | | | |
Net Asset Value: | | | | | | | | | | | | | | |
End of period | | $ | 9.99 | | $ | 9.96 | | $ | 9.94 | | | $ | 10.05 | |
| | | | | | | | | | | | | | | |
Total investment return (1) | | | 3.97 | % | | 3.55 | % | | 1.84 | % | | | 1.08 | % |
| | | | | | | | | | | | | | | |
Net assets at end of period (000’s omitted) | | $ | 3,734 | | $ | 3,762 | | $ | 3,173 | | | $ | 2,648 | |
| | | | | | | | | | | | | | |
Ratios: | | | | | | | | | | | | | | |
Expenses to average daily net assets | | | 0.80 | % | | 0.80 | % | | 0.80 | % | | | 0.80 | % (2) |
Net investment income to average daily net assets | | | 3.59 | % | | 3.30 | % | | 2.93 | % | | | 2.49 | % (2) |
Portfolio turnover rate (excluding short-term securities) | | | 25.36 | % | | 58.46 | % | | 29.52 | % | | | 3.45 | % |
| | |
| |
| | |
| (1) | Total investment return is based on the change in net asset value of a share during the period and assumes reinvestment of distributions at net asset value. |
| | |
| (2) | Adjusted to an annual rate. |
| | |
| Notice to Shareholders: |
| | |
| | Pursuant to a plan approved by the shareholders of the Sit Florida Tax-Free Income Fund (“Florida Fund”), the Florida Fund will be dissolved and liquidated on or before December 31, 2007. |
79
This page has been left blank intentionally.
80
|
|
Report of Independent Registered
Public Accounting Firm |
|
The Board of Directors and Shareholders
Sit Money Market Fund, Inc.
Sit U.S. Government Securities Fund, Inc.
Sit Mutual Funds II, Inc.
Sit Mutual Funds Trust:
We have audited the accompanying statements of assets and liabilities, including the schedules of investments, of Sit Money Market Fund, Inc., Sit U.S. Government Securities Fund, Inc., Sit Tax-Free Income Fund (a series of Sit Mutual Funds II, Inc.), Sit Minnesota Tax-Free Income Fund (a series of Sit Mutual Funds II, Inc.), and Sit Florida Tax-Free Income Fund (a series of Sit Mutual Funds Trust) (the “Funds”), as of March 31, 2007, and the related statements of operations for the year then ended, the statements of changes in net assets for each of the years in the two-year period then ended, and the financial highlights for each of the years or periods in the five-year period then ended. These financial statements and financial highlights are the responsibility of the Funds’ management. Our responsibility is to express an opinion on these financial statements and financial highlights based on our audits.
We conducted our audits in accordance with the standards of the Public Company Accounting Oversight Board (United States). Those standards require that we plan and perform the audit to obtain reasonable assurance about whether the financial statements and financial highlights are free of material misstatement. An audit includes examining, on a test basis, evidence supporting the amounts and disclosures in the financial statements. Our procedures included confirmation of securities owned as of March 31, 2007, by correspondence with the custodian and brokers or by other appropriate auditing procedures. An audit also includes assessing the accounting principles used and significant estimates made by management, as well as evaluating the overall financial statement presentation. We believe that our audits provide a reasonable basis for our opinion.
In our opinion, the financial statements and financial highlights referred to above present fairly, in all material respects, the financial position of Sit Money Market Fund, Sit U.S. Government Securities Fund, Sit Tax-Free Income Fund, Sit Minnesota Tax-Free Income Fund, and Sit Florida Tax-Free Income Fund as of March 31, 2007, and the results of their operations for the year then ended, the changes in their net assets for each of the years in the two-year period then ended, and their financial highlights for each of the years or periods in the five-year period then ended, in conformity with U.S. generally accepted accounting principles.
KPMG LLP
Minneapolis, MN
May 16, 2007
81
| | | | |
| Sit Mutual Funds | | | |
| | | | |
| Expense Example (Unaudited)
| | | |
| | | | |
As a shareholder of the Funds, you incur two types of costs: (1) transaction costs, including redemption fees and (2) ongoing costs, including management fees; and other Fund expenses. This Example is intended to help you understand your ongoing costs (in dollars) of investing in the Funds and to compare these costs with the ongoing costs of investing in other mutual funds.
The Example is based on an investment of $1,000 invested at the beginning of the period and held for the entire period October 1, 2006 to March 31, 2007.
Actual Expenses
The first line of the table below provides information about actual account values and actual expenses. You may use the information in this line, together with the amount you invested, to estimate the expenses that you paid over the period. Simply divide your account value by $1,000 (for example, an $8,600 account value divided by $1,000 = 8.6), then multiply the result by the number in the first line under the heading entitled “Expenses Paid During Period” to estimate the expenses you paid on your account during this period.
Hypothetical Example for Comparison Purposes
The second line of the table below provides information about hypothetical account values and hypothetical expenses based on the Fund’s actual expense ratio and an assumed rate of return of 5% per year before expenses, which is not the Fund’s actual return. The hypothetical account values and expenses may not be used to estimate the actual ending account balance or expenses you paid for the period. You may use this information to compare the ongoing costs of investing in the Fund and other funds. To do so, compare this 5% hypothetical example with the 5% hypothetical examples that appear in the shareholder reports of the other funds.
Please note that the expenses shown in the table are meant to highlight your ongoing costs only and do not reflect any transactional costs, such as redemption fees. Therefore, the second line of the table is useful in comparing ongoing costs only, and will not help you determine the relative total costs of owning different funds. In addition, if these transactional costs (redemption fees) were included, your costs would have been higher.
| | | |
| Beginning | Ending | Expenses Paid |
| Account Value | Account Value | During Period* |
Money Market Fund | (10/1/06) | (3/31/07) | (10/1/06 - 3/31/07) |
| | | | |
Actual | $1,000 | $1,024.30 | $2.51 |
| | | | |
Hypothetical (5% return before expenses) | $1,000 | $1,022.50 | $2.51 |
| |
* Expenses are equal to the Fund’s annualized expense ratio of 0.50%, multiplied by the average account value over the period, multiplied by 181/365 (to reflect the one-half year period.) |
82
| | | |
| Beginning | Ending | Expenses Paid |
| Account Value | Account Value | During Period* |
U.S. Government Securities Fund | (10/1/06) | (3/31/07) | (10/1/06 - 3/31/07) |
| | | | |
Actual | $1,000 | $1,029.60 | $4.03 |
| | | | |
Hypothetical (5% return before expenses) | $1,000 | $1,021.00 | $4.03 |
| |
* Expenses are equal to the Fund’s annualized expense ratio of 0.80%, multiplied by the average account value over the period, multiplied by 181/365 (to reflect the one-half year period.) |
| | | |
| Beginning | Ending | Expenses Paid |
| Account Value | Account Value | During Period* |
Tax-Free Income Fund | (10/1/06) | (3/31/07) | (10/1/06 - 3/31/07) |
| | | | |
Actual | $1,000 | $1,018.10 | $3.85 |
| | | | |
Hypothetical (5% return before expenses) | $1,000 | $1,021.15 | $3.86 |
| |
* Expenses are equal to the Fund’s annualized expense ratio of 0.76%, multiplied by the average account value over the period, multiplied by 181/365 (to reflect the one-half year period.) |
| | | |
| Beginning | Ending | Expenses Paid |
| Account Value | Account Value | During Period* |
Minnesota Tax-Free Income Fund | (10/1/06) | (3/31/07) | (10/1/06 - 3/31/07) |
| | | | |
Actual | $1,000 | $1,019.80 | $4.01 |
| | | | |
Hypothetical (5% return before expenses) | $1,000 | $1,021.00 | $4.01 |
| |
* Expenses are equal to the Fund’s annualized expense ratio of 0.80%, multiplied by the average account value over the period, multiplied by 181/365 (to reflect the one-half year period.) |
| | | |
| Beginning | Ending | Expenses Paid |
| Account Value | Account Value | During Period* |
Florida Tax-Free Income Fund | (10/1/06) | (3/31/07) | (10/1/06 - 3/31/07) |
| | | | |
Actual | $1,000 | $1,016.40 | $4.00 |
| | | | |
Hypothetical (5% return before expenses) | $1,000 | $1,021.00 | $4.01 |
| |
* Expenses are equal to the Fund’s annualized expense ratio of 0.80%, multiplied by the average account value over the period, multiplied by 181/365 (to reflect the one-half year period.) |
83
| | | | |
| Sit Mutual Funds | | | |
| Federal Tax Information (Unaudited)
| | | |
| | | | |
We are required by Federal tax regulations to provide shareholders with certain information regarding dividend distributions on an annual fiscal year basis. The figures are for informational purposes only and should not be used for reporting to federal or state revenue agencies. All necessary tax information will be mailed in January each year.
| | | | | | | |
Fund and Payable Date | | Ordinary
Income (a) | | Long-Term
Capital
Gain (b) | |
| | | | | | |
Money Market Fund | | | | | | | |
| | | | | | | |
April 30, 2006 | | $ | 0.00332 | | $ | — | |
May 31, 2006 | | | 0.00401 | | | — | |
June 30, 2006 | | | 0.00378 | | | — | |
July 31, 2006 | | | 0.00409 | | | — | |
August 31, 2006 | | | 0.00412 | | | — | |
September 30, 2006 | | | 0.00381 | | | — | |
October 31, 2006 | | | 0.00424 | | | — | |
November 30, 2006 | | | 0.00396 | | | — | |
December 31, 2006 | | | 0.00382 | | | — | |
January 31, 2007 | | | 0.00441 | | | — | |
February 28, 2007 | | | 0.00365 | | | — | |
March 31, 2007 | | | 0.00398 | | | — | |
| | | | | | | |
| | $ | 0.04721 | (c) | $ | 0.00000 | |
| | | | | | | |
| | | | | | | |
| | | | | | | |
Tax-Free Income Fund | | | | | | | |
| | | | | | | |
April 30, 2006 | | $ | 0.02868 | | $ | — | |
May 31, 2006 | | | 0.03299 | | | — | |
June 30, 2006 | | | 0.03080 | | | — | |
July 31, 2006 | | | 0.03176 | | | — | |
August 31, 2006 | | | 0.03197 | | | — | |
September 30, 2006 | | | 0.03065 | | | — | |
October 31, 2006 | | | 0.03354 | | | — | |
November 30, 2006 | | | 0.03140 | | | — | |
December 31, 2006 | | | 0.03127 | | | — | |
January 31, 2007 | | | 0.03575 | | | — | |
February 28, 2007 | | | 0.02993 | | | — | |
March 31, 2007 | | | 0.03296 | | | — | |
| | | | | | | |
| | $ | 0.38171 | (d) | $ | 0.00000 | |
| | | | | | | |
| | | | | | | |
Fund and Payable Date | | Ordinary
Income (a) | | Long-Term
Capital
Gain (b) | |
| | | | | | |
U.S. Government Securities Fund | | | | | | | |
| | | | | | | |
April 30, 2006 | | $ | 0.03184 | | $ | — | |
May 31, 2006 | | | 0.04317 | | | — | |
June 30, 2006 | | | 0.03954 | | | — | |
July 31, 2006 | | | 0.04048 | | | — | |
August 31, 2006 | | | 0.04166 | | | — | |
September 30, 2006 | | | 0.03866 | | | — | |
October 31, 2006 | | | 0.04403 | | | — | |
November 30, 2006 | | | 0.03966 | | | — | |
December 31, 2006 | | | 0.03852 | | | — | |
January 31, 2007 | | | 0.04232 | | | — | |
February 28, 2007 | | | 0.04129 | | | — | |
March 31, 2007 | | | 0.04159 | | | — | |
| | | | | | | |
| | $ | 0.48275 | (c) | $ | 0.00000 | |
| | | | | | | |
| | | | | | | |
| | | | | | | |
Minnesota Tax-Free Income Fund | | | | | | | |
| | | | | | | |
April 30, 2006 | | | 0.03372 | | | — | |
May 31, 2006 | | | 0.03816 | | | — | |
June 30, 2006 | | | 0.03474 | | | — | |
July 31, 2006 | | | 0.03570 | | | — | |
August 31, 2006 | | | 0.03736 | | | — | |
September 30, 2006 | | | 0.03340 | | | — | |
October 31, 2006 | | | 0.03677 | | | — | |
November 30, 2006 | | | 0.03502 | | | — | |
December 31, 2006 | | | 0.03331 | | | — | |
January 31, 2007 | | | 0.03847 | | | — | |
February 28, 2007 | | | 0.03265 | | | — | |
March 31, 2007 | | | 0.03495 | | | — | |
| | | | | | | |
| | $ | 0.42425 | (d) | $ | 0.00000 | |
| | | | | | | |
84
| | | | | | | |
Fund and Payable Date | | Ordinary
Income (a) | | Long-Term
Capital
Gain (b) | |
| | | | | | |
Florida Tax-Free Income Fund | | | | | | | |
| | | | | | | |
April 30, 2006 | | $ | 0.02664 | | $ | — | |
May 31, 2006 | | | 0.03065 | | | — | |
June 30, 2006 | | | 0.02886 | | | — | |
July 31, 2006 | | | 0.03010 | | | — | |
August 31, 2006 | | | 0.03070 | | | — | |
September 30, 2006 | | | 0.02889 | | | — | |
October 31, 2006 | | | 0.03219 | | | — | |
November 30, 2006 | | | 0.02984 | | | — | |
December 31, 2006 | | | 0.02946 | | | — | |
January 31, 2007 | | | 0.03296 | | | — | |
February 28, 2007 | | | 0.02819 | | | — | |
March 31, 2007 | | | 0.03017 | | | — | |
| | | | | | | |
| | $ | 0.35864 | (d) | $ | 0.00000 | |
| | | | | | | |
| |
(a) | Includes distributions of short-term gains, if any, which are taxable as ordinary income. |
| |
(b) | Taxable as long-term gain. |
| |
(c) | Taxable as dividend income and does not qualify for deduction by corporations or reduced dividend income tax rate for individuals. |
| |
(d) | 100% of dividends were derived from interest on tax-exempt securities. This portion of exempt-interest dividends is exempt from federal taxes and should not be included in shareholders’ gross income. Exempt-interest dividends may be subject to state and local taxes. Each shareholder should consult a tax adviser about reporting this income for state and local tax purposes. |
85
| | | | |
| Sit Mutual Funds | | | |
| |
| | | | |
| Information about Directors and Officers | | | |
| | | | |
The Sit Mutual Funds are a family of no-load mutual funds. The Bond Funds described in this Bond Funds Annual Report are the Sit Money Market Fund, Sit U.S. Government Securities Fund, Sit Tax-Free Income Fund, Sit Minnesota Tax-Free Income Fund, and Sit Florida Tax-Free Income Fund (the “Funds” or individually, a “Fund”). The stock funds within the Sit Mutual Fund family are described in a Stock Funds Statement of Additional Information (SAI). The Sit Money Market Fund, Sit U.S. Government Securities Fund, the corporate issuer of the Sit Florida Tax-Free Income Fund and the corporate issuer of the Sit Tax-Free Income Fund and the Sit Minnesota Tax-Free Income Fund have a Board of Directors and officers. Pursuant to Minnesota law, the Boards of Directors are responsible for the management of the Funds and the establishment of the Funds’ policies. The officers of the Funds manage the day-to-day operation of the Funds. Information pertaining to the directors and officers of the Funds is set forth below. The business address, unless otherwise noted below, is that of the Funds’ investment adviser – 3300 IDS Center, 80 South Eighth Street, Minneapolis, Minnesota 55402. The Boards have a separate Audit Committee. The Bond Funds’ SAI has additional information about the Fund’s directors and is available without charge upon request by calling the Sit Funds at 800-332-5580.
| | | | | | | | | | |
Name, Address
and Age | | Position(s)
Held
With Fund | | Term of
Office(1)
and Length of
Time Served | | Principal Occupation(s)
During Past Five Years | | Number of
Funds in Fund
Complex
Overseen by
Director | | Other Directorships Held
by Director(4) |
| | | | | | | | | | | |
INTERESTED DIRECTORS: | | | | | | | | |
| | | | | | | | | |
Eugene C. Sit (2)
Age: 68 | | Director and
Chairman | | Director since inception. | | Chairman, CEO and CIO of Sit Investment Associates, Inc. (the “Adviser”) and Sit/ Kim International Investment Associates, Inc. (“Sit/Kim”); Director of SIA Securities Corp. (the “Distributor”), and Chairman and CEO of Sit Investment Fixed Income Advisors, Inc. (“SF”). | | 14 | | Corning Incorporated; Smurfit – Stone Container Corporation |
| | | | | | | | | | | |
William E. Frenzel (2)
Age: 78 | | Director | | Director since 1991 or the Fund’s inception if later. | | Guest Scholar at The Brookings Institution and member of several government policy committees, foundations and organizations; Advisory Director of the Adviser; Director of Sit/Kim and SF. | | 14 | | None |
| | | | | | | | | | | |
INDEPENDENT DIRECTORS: | | | | | | | | |
| | | | | | | | | |
Sidney L. Jones
Age: 73 | | Director | | Director since 1988 to 1989 and since 1993 or the Fund’s inception if later. | | Lecturer, Washington Campus Consortium of 17 Universities; Senior Advisor to Lawrence and Co., Toronto, Canada (investment management). | | 14 | | None |
| | | | | | | | | | | |
86
| | | | |
| | |
| |
| | |
| | |
|
| |
| | | | |
| | | | | | | | | | |
Name, Address
and Age | | Position(s)
Held
With Fund | | Term of
Office(1)
and Length of
Time Served | | Principal Occupation(s)
During Past Five Years | | Number of
Funds in Fund
Complex
Overseen by
Director | | Other Directorships Held
by Director(4) |
| | | | | | | | | | | |
John P. Fagan
Age: 76 | | Director | | Director since 2006 or the Fund’s inception, if later.
| | Honorary member on Board of St. Joseph’s College in Rensselaer, Indiana. | | 14 | | None |
| | | | | | | | | | | |
Donald W. Phillips
Age: 58 | | Director | | Director of the International Fund since 1993, and since 1990 or the Fund’s inception if later for all other Funds. | | Chairman and CEO of WP Global Partners Inc., 7/05 to present; CEO and CIO of WestLB Asset Management (USA) LLC, 4/00 to 4/05. | | 14 | | None |
| | | | | | | | | | | |
Melvin C. Bahle
Age: 88 | | Director | | Director since 2005; Director Emeritus since 1995. | | Director and/or officer of several foundations and charitable organizations. | | 14 | | None |
| | | | | | | | | | | |
OFFICERS: | | | | | | | | | | |
| | | | | | | | | | | |
Peter L. Mitchelson
Age: 65 | | Vice Chairman | | Re-Elected by the Boards annually; Officer since inception. | | Director and Vice Chairman of the Adviser; Director and Executive Vice President of Sit/Kim; Director of the Distributor; and Vice Chairman of SF; Director of the Sit Funds through 4/30/02. | | N/A | | N/A |
| | | | | | | | | | | |
Michael C. Brilley
Age: 61 | | Senior Vice President | | Re-Elected by the Boards annually; Officer since 1985. | | Senior Vice President and Senior Fixed Income Officer of the Adviser; Director, President and Chief Fixed- Income Officer of SF. Director of the Sit Funds (Bond Funds only) through 4/30/02. | | N/A | | N/A |
| | | | | | | | | | | |
Roger J. Sit (3)
Age: 45 | | Executive Vice President | | Re-Elected by the Boards annually; Officer since 1998. | | Director and President of the Adviser; Director, President, COO, and Deputy CIO of Sit/Kim. | | N/A | | N/A |
| | | | | | | | | | | |
Debra A. Sit (3)
Age: 46 | | Vice President– Investments | | Re-Elected by the Boards annually; Officer since 1994. | | Vice President – Bond Investments of the Adviser; Senior Vice President, Assistant Treasurer and Assistant Secretary of SF; Assistant Treasurer and Assistant Secretary of Sit/Kim.
| | N/A | | N/A |
| | | | | | | | | | | |
87
| | | | |
| Sit Mutual Funds | | | |
| |
| | | | |
| Information about Directors and Officers (Continued) | | | |
| | | | |
| | | | | | | | | | |
Name, Address,
and Age | | Position(s)
Held With
Fund | | Term of Office(1)
and length of
Time Served | | Principal Occupation(s)
During Past Five Years | | Number of
Funds in Fund
Complex
Overseen by
Director | | Other Directorships Held
by Director(4) |
| | | | | | | | | | | |
Bryce A. Doty
Age: 40 | | Vice President – Investments. | | Re-Elected by the Boards annually; Officer since 1996.
| | Vice President and Portfolio Manager of SF. | | N/A | | N/A |
| | | | | | | | | | | |
Paul J. Junquist
Age: 45
| | Vice President – Investments | | Re-Elected by the Boards annually; Officer since 1996. | | Vice President and Portfolio Manager of SF. | | N/A | | N/A |
| | | | | | | | | | | |
Mark H. Book
Age: 43 | | Vice President – Investments | | Re-Elected by the Boards annually; Officer since 2002. | | Vice President and Portfolio Manager of SF. | | N/A | | N/A |
| | | | | | | | | | | |
Paul E. Rasmussen
Age: 46 | | Vice President and Treasurer | | Re-Elected by the Boards annually; Officer since 1994. | | Vice President, Secretary, Controller and Chief Compliance Officer of the Adviser; Vice President, Secretary, and Chief Compliance Officer of Sit/Kim and SF; President & Treasurer of the Distributor. | | N/A | | N/A |
| | | | | | | | | | | |
Michael J. Radmer
50 S. 6th Street
Minneapolis, MN
55402
Age: 61
| | Secretary | | Re-Elected by the Boards annually; Officer since 1984. | | Partner of the Funds’ general counsel, Dorsey & Whitney, LLP | | N/A | | N/A |
| | | | | | | | | | | |
Carla J. Rose
Age: 40 | | Vice President, Assistant Secretary & Assistant Treasurer | | Re-Elected by the Boards annually; Officer since 2000. | | Vice President, Administration & Deputy Controller of the Adviser; Vice President, Administration and Controller of Sit/Kim; Controller and Treasurer of SF. | | N/A | | N/A |
| | | | | | | | | | | |
Kelly K. Boston
Age: 38 | | Assistant Secretary & Assistant Treasurer | | Re-Elected by the Boards annually; Officer since 2000. | | Staff Attorney of the Adviser. | | N/A | | N/A |
| | | | | | | | | | | |
1) Directors serve until their death, resignation, removal or the next shareholder meeting at which election of directors is an agenda item and a successor is duly elected and qualified.
2) Directors who are deemed to be “interested persons” of the Funds as that term is defined by the Investment Company Act of 1940. Mr. Sit is considered an “interested person” because he is an officer and shareholder of Sit Investment Associates, Inc., the Fund’s investment adviser. Mr. Frenzel is deemed to be an interested person because he is an director and shareholder of the Fund’s investment adviser.
3) Mr. Roger Sit is the son of Eugene C. Sit. Ms. Debra Sit is the daughter of Eugene C. Sit.
4) Includes only directorships of companies required to report under the Securities Exchange Act of 1934 (i.e., public companies) or other investment companies registered under the 1940 Act.
88
| | | | |
| | |
| |
| Sit Mutual Funds | |
| | |
| Additional Information
| |
| | | | |
PROXY VOTING
Each Fund follows certain policies and procedures for voting proxies for securities held in each portfolio. A description of the Funds’ proxy voting polices and procedures is available without charge upon request by calling the Funds at 1-800-332-5580.
Information regarding how each Fund voted proxies relating to its portfolio securities during the most recent twelve-month period ended June 30 is available 1) without charge upon request by calling the Funds at 1-800-332-5580; and 2) on the U.S. Securities and Exchange Commission’s website at http://www.sec.gov.
AVAILABILITY OF QUARTERLY PORTFOLIO SCHEDULES
The Funds file their complete schedules of portfolio holdings with the U.S. Securities and Exchange Commission (SEC) for the first and third quarters of each fiscal year on Form N-Q. The Funds’ Forms N-Q are available on the SEC’s website at http://www.sec.gov. The Funds’ Forms N-Q may be reviewed and copied at the SEC’s Public Reference Room in Washington, DC. Information on the operation of the Public Reference Room may be obtained by calling 1-800-SEC-0330. Information on the Funds’ Forms N-Q is also available without charge upon request by calling the Funds at 1-800-332-5580.
RE-APPROVAL OF INVESTMENT MANAGEMENT AGREEMENTS
At their joint meeting held on October 23, 2006 the Boards of Directors of the Sit Mutual Funds unanimously approved the continuation for another one year period of the investment management agreements entered into by and between Sit Investment Associates, Inc. (“SIA”) and Sit Mutual Funds II, Inc. dated November 1, 1992; Sit U.S. Government Securities Fund, Inc. dated November 1, 1992; Sit Money Market Fund, Inc. dated November 1, 1992; and Sit Mutual Funds Trust dated December 15, 2003 (the “Advisory Agreements”).
The Boards approved the Agreements after a lengthy discussion and consideration of various factors relating to both the Boards’ selection of SIA as the investment adviser and the Boards’ approval of the fees to be paid under the Agreements.
Investment Adviser Criteria. The Directors began their analysis by discussing their criteria for determining the quality of an investment adviser. The Directors’ noted that their analysis is similar to that used by institutional investors in evaluating and selecting investment advisers. The Directors discussed several factors used to determine the overall quality of an investment adviser, including the following:
Investment Philosophy and Process. The Directors considered SIA’s philosophy of managing assets. With respect to fixed income securities, SIA stresses the consistent attainment of superior risk-adjusted returns using a conservative investment management approach that identifies pricing anomalies in the market and management of portfolio duration.
With respect to fixed income securities, SIA seeks investment grade securities with a special emphasis on interest
89
| | | | |
| Sit Mutual Funds | | | |
| |
| | | | |
| Additional Information (Continued) | | | |
| | | | |
income and significant stability of principal value. SIA’s style seeks to avoid excessive return volatility and generate consistent results over an economic cycle. The Directors noted that the Bond Funds’ objectives are to seek high current income. The Directors reviewed the Bond Funds’ characteristics, and noted that SIA has consistently managed the Bond Funds in this style. The Directors noted that since the Bond Funds emphasize income, they may at times not rank highly in total return comparisons with other funds during certain periods.
The Directors discussed SIA’s consistent and well-defined investment process. With respect to fixed income securities, the portfolio managers are responsible for implementing the strategy set forth in the Chief Fixed Income Officer’s duration targets and the Chief Investment Officer’s interest rate projections.
Investment Professionals. The Directors discussed the experience, knowledge and organizational stability of SIA and its investment professionals. The Directors noted that SIA’s senior founding professionals are actively involved in the investment process and have led the organization since its inception in 1981 which has provided not only organizational stability, but a consistent portfolio management style. The senior professionals of SIA are among the most experienced professionals in the industry.
The Directors discussed the depth of SIA’s investment staff. The Directors noted that SIA has over 30 investment professionals. Given the investment products offered by SIA and the assets under management, the Directors determined that SIA’s investment staff is well positioned to meet the current needs of its clients, including the Funds, and to accommodate growth in the number of clients and assets under management for the near future. The Directors concluded that the depth of the investment staff, and in particular senior management and investment analysts, is actually greater than the Funds currently require at their present asset size. The Directors noted that SIA has the resources of a $6.9 billion investment firm working for the benefit of the Fund shareholders.
Investment Performance. The Directors reviewed and discussed the Funds’ investment performance on an absolute and comparable basis for various periods as discussed below. The Directors noted that the investment performance of the Funds has generally been competitive with indices and other funds with similar investment styles as the Funds, such as fixed income funds seeking to maximize income.
Corporate Culture. The Directors discussed SIA’s corporate values to operate under the highest ethical and professional standards. SIA’s culture is set and practiced by senior management who insist that all professionals exhibit honesty and integrity. The Board noted that the firm’s values are evident in all of the services provided to the Funds.
Review of Specific Factors. The Directors continued their analysis by reviewing specific information on SIA and the Funds and specific terms of the Agreements, including the following.
Investment Performance. The Directors reviewed investment performance of each Fund for 1 month, 3 months, 6 months, year-to-date, 1 year, 5 years (as applicable), 10 years (as applicable) and since inception, both on an absolute basis and on a comparative basis to indices and mutual funds within the same investment categories. As noted above, the Directors concluded that the investment performance of the Funds has been competitive in relation to their stated objectives and strategies on a comparable basis with funds with similar objectives and strategies.
90
Fees and Expenses. The Directors noted that the Funds pay SIA a monthly fee and SIA is responsible for all of the Funds’ expenses except interest, brokerage commissions and transaction charges and certain extraordinary expenses. The Directors reviewed fees paid in prior years and the fees to be paid under the Agreements, both before and after the voluntary waiver of fees by SIA with respect to the Tax-Free Income Fund, U.S. Government Fund and Money Market Fund. The Directors reviewed the average and median expense ratios of mutual funds within the same investment category for each Fund. The Directors noted that each Fund’s total expense ratio compares favorably to the total expense ratios of other no-load funds within the Fund’s Morningstar category, and are lower than the average total expense ratio for the full Morningstar category. The Directors concluded that the fees paid by the Funds are reasonable and appropriate.
The Directors reviewed the extent to which the fees to be paid under the Agreements by each Fund may be affected by an increase in the Fund’s assets, which included reviewing each Fund’s current and historical assets and the likelihood and magnitude of future increases in the Fund’s assets. It was noted that three of the fixed-income funds have tiered investment fee schedules after SIA’s voluntary fee waiver. The Directors agreed that it is appropriate that the Funds benefit from improved economies of scale as the Funds’ assets increase. However, the Directors concluded that given the limited size of the Funds, negotiating a graduated fee structure for each Fund is unnecessary since it is unlikely that the size of the Funds will increase enough to justify a graduated fee schedule within the near future.
The Directors reviewed the expenses paid by SIA relating to the operations of the Funds, and SIA’s income with respect to the management of the Funds for the past two calendar years. The Directors concluded that the expenses paid were appropriate.
The Directors reviewed SIA’s investment advisory fee schedule for investment management services provided to other clients. The Directors compared the services provided to the Funds and other clients of SIA, and recognized that the Funds’ expenses are borne by SIA. The Directors concluded that the fees paid by the Funds in relation to the fees paid by other SIA clients were appropriate and reasonable. The Directors also concluded that SIA’s profit margin with respect to the management of the Funds was appropriate.
The Directors discussed the extent to which SIA receives benefits from the relationship with the Funds such as soft dollar arrangements by which brokers provide research services to SIA as a result of brokerage generated by the Funds. The Board concluded that any benefits SIA receives from its relationship with the Funds are well within industry norms and are reflected in the amount of the fees paid by the Funds to SIA and are appropriate and reasonable.
Non-Advisory Services. The Directors considered the quality of non-advisory services which SIA provides to the Funds (and their shareholders) and the quality and depth of SIA’s non-investment personnel who provide such services. Directors concluded that the level of such services and the quality and depth of such personnel are consistent with industry standards.
Finally, the Directors considered the compliance staff and the regulatory history of SIA and the Funds, and concluded that both are consistent with industry standards.
91
A Look at Sit Mutual Funds
Sit Mutual Funds are managed by Sit Investment Associates, Inc. Sit Investment Associates was founded by Eugene C. Sit in July 1981 and is dedicated to a single purpose, to be one of the premier investment management firms in the United States. Sit Investment Associates currently manages approximately $6.9 billion for some of America’s largest corporations, foundations and endowments.
Sit Mutual Funds are comprised of fourteen no-load Funds. The Stock Funds, excluding the Balanced Fund, charge a 2% redemption fee on shares held less than 30 days.
Sit Mutual Funds offer:
| | |
| • | Free telephone exchange |
| • | Dollar-cost averaging through an automatic investment plan |
| • | Electronic transfer for purchases and redemptions |
| • | Free checkwriting privileges on Bond Funds |
| • | Retirement accounts including IRAs and 401(k) plans |
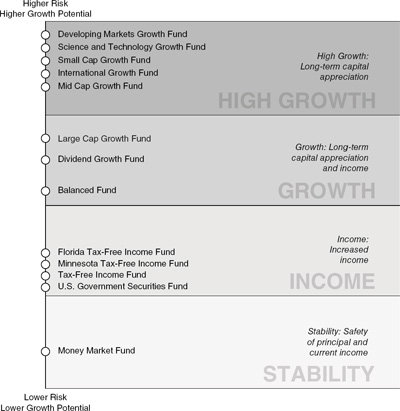
92

A N N U A L R E P O R T B O N D F U N D S
One Year Ended March 31, 2007
INVESTMENT ADVISER
Sit Investment Associates, Inc.
3300 IDS Center
80 South Eight Street
Minneapolis, MN 55402
612-334-5888 (Metro Area)
800-332-5580
DISTRIBUTOR
SIA Securities Corp.
3300 IDS Center
80 South Eighth Street
Minneapolis, MN 55402
612-334-5888 (Metro Area)
800-332-5580
CUSTODIAN
PFPC Trust Company
P.O. Box 9763
Providence, RI 02940
TRANSFER AGENT AND
DISBURSING AGENT
PFPC, Inc.
P.O. Box 9763
Providence, RI 02940
INDEPENDENT REGISTERED PUBLIC
ACCOUNTING FIRM
KPMG LLP
90 South Seventh Street
Suite 4200
Minneapolis, MN 55402
LEGAL COUNSEL
Dorsey & Whitney LLP
50 South Sixth Street, Suite 1500
Minneapolis, MN 55402
www.sitfunds.com

Sit Mutual Funds
High Income Municipal Bond Fund
Annual Report
March 31, 2007
Sit Mutual Funds
HIGH INCOME MUNICIPAL BOND FUND ANNUAL REPORT
TABLE OF CONTENTS
This document must be preceded or accompanied by a Prospectus.
| | | | |
| Sit Mutual Funds
Sit High Income Municipal Bond Fund | | | |
| | | | |
| | | | |
| Chairman’s Letter – Period Ended March 31, 2007 | | | |
| | | | |
Dear fellow shareholders:
The Federal Reserve increased short-term interest rates twice more during the second calendar quarter of 2006, bringing the federal funds rate to 5.25%. Treasury yields rose approximately 30 basis points to above 5.0% across the maturity spectrum, reflecting continued concerns over inflation and creating an almost flat yield curve. The Fed’s rate increase on June 29, 2006 was its 17th and latest move in the 425 basis points of tightening that began two years earlier. Weaker economic data in the third quarter of 2006 led intermediate and longer term yields to decline as investors believed that the current cycle of Fed tightening might be done. Treasury yields have been relatively stable since then, with the front end of the curve inverted as short term yields remain higher than longer term yields. The 3-month Treasury bill yield ended the 12-month period 0.40% higher at around 5.0% while the 5-year and 30-year Treasury yields declined -0.27% and -0.04% to 4.54% and 4.85%, respectively. The Fed has maintained a bias against inflationary risks since its May 2006 meeting.
The final estimate of U.S. fourth quarter 2006 real GDP growth was +2.5%, and total real GDP growth measured on a year-over-year basis in the fourth quarter remained a healthy +3.1%. We expect real GDP growth rate to moderate to a +2.7% average rate for 2007. Real personal consumption expenditures (PCE), which represent two-thirds of GDP, are on pace to exceed +3.0% for the first calendar quarter of 2007 and could approach +4.0%. While this rate of spending growth represents a slowdown from the +4.2% rate posted in the fourth quarter, it is still quite solid and counters the recession prospects that an inverted yield curve environment might suggest. The strong employment data released on April 5th, which saw the unemployment rate dip slightly to 4.4%, was also supportive of sustained consumer spending. The domestic economy could also see strength from other sectors. The inventory sector, which is notoriously volatile and remained a major drag in the fourth quarter, could eventually rebound to provide a solid underpinning to growth. In addition, real business spending remains a positive factor and, despite some softening, grew at approximately twice the rate of the total economy on a year-over-year basis in the fourth quarter.
The headline Consumer Price Index for All Urban Consumers (CPI) increased +0.4% in February, and core CPI, which excludes the volatile food and energy sectors, rose +0.2%. These monthly increases resulted in year-over-year figures of +2.4% and +2.7% for the headline and core CPIs, respectively. Over the next few months, the year-over-year CPI data are likely to decrease from February levels as a result of easy comparisons from the same period a year ago. However, in the second half of the year, the opposite effect will occur as even just moderate increases in the monthly inflation figures will boost the year-over-year measurements. Despite the intermediate volatility, we expect the
average CPI figure for the year to fall in a range between +2.0% and +2.5%.
Although the dollar has been weak recently, it has stayed within its trading range of the past two years. We expect the dollar to remain in this range as pressure from the budget and trade deficits is, at least partially, offset by the relative attractiveness of U.S. equity and fixed-income markets.
The domestic fiscal environment has shown steady improvement and we continue to expect the deficit to be less than $200 billion for the current fiscal year. For the first five months of fiscal 2007 through February, the U.S. budget deficit stands at $162.2 billion, which is almost a $56 billion improvement over the $217.7 billion deficit for the comparable period last year. Receipt growth for the first half of fiscal year 2007 is estimated to have increased +8% versus the comparable period in fiscal 2006 due to higher tax payments, while outlays are estimated to have grown just +2%. Factoring in similarly positive Congressional Budget Office (CBO) estimates for March, estimates from CBO and the Office of Management and Budget (OMB) for the fiscal year 2007 budget deficit remain unchanged at $177 billion and $244 billion, respectively.
Strategy Summary
We continue to expect that the U.S. economy will successfully transition to a more moderate growth environment, with real GDP growth averaging approximately +2.7% in 2007, as indications are that the key consumer spending sector remains intact. Elevated energy prices and a slowdown in the housing market are providing dual headwinds. Factors in the housing market, generally, and the subprime market, specifically, will continue to create pressures on consumer spending. However, we believe the bottoming phase in the housing market correction is underway and that the spill-over effects from the difficulties in the subprime lending market will be manageable. While the price of crude oil rose in March, it remains well below the highs of last spring and summer and is close to flat with this period last year. Looking forward, inflation could provide a surprise on the upside later in the year as the easy comparisons from prior periods roll off. Nonetheless, we expect the CPI figure to average between +2.0% and +2.5% for the year.
The yield curve steepened in March, reflecting increased investor anticipation of a cut in the federal funds rate later this year in response to weaker economic data. The slowing housing market and problems within the subprime mortgage market have added to the list of justifications for the Fed to reduce its hawkish stance on interest rates. The Fed dropped its tightening bias at its meeting on March 21st, 2007 while maintaining an inflationary risk assessment. We expect further steepening in the yield curve later in the year as shorter and intermediate term rates decline while longer term yields should be relatively stable. However,
2
| | | | |
| | | 
| |
| | |
| | |
|
| |
| | | | |
longer term yields could shift slightly higher if an inflation surprise materializes and the Fed decides to maintain short term rates around current levels. Taxable bond portfolio durations are being maintained modestly longer than related benchmarks, with an emphasis on attractively yielding securities that will outperform in a steepening yield curve environment.
Municipal issuance volume remains high. New issuance volume in calendar 2007 is estimated to be around $375 billion, compared to $383 billion in 2006 and the record $408 billion in 2005. Approximately $80 billion of issuance is expected to come from voter-approved funding measures passed in November, of which $43 billion will come from California alone. Relative yield comparisons of short to intermediate duration municipals to similar duration Treasuries have cheapened as supply has kept shorter and intermediate municipal yields from declining. For example, the ratio of 10-year maturity municipal-to-Treasury yields increased from approximately 80% to 85% in March, returning to the higher end of its historical range in recent years. Longer term municipal bonds are fairly valued when compared to taxable bonds on a relative yield basis. We expect improving underwriting profitability for insurers to help demand for municipals remain robust, despite yields remaining near historic lows. Durations on our municipal portfolios are being extended closer to their benchmark levels in anticipation of the steepening yield curve environment we expect later in 2007. We remain focused on securities that offer attractive after-tax income, but are cautious as incremental yields provided by higher yielding sectors are historically narrow.
Fixed-income investments are an important component of a well-diversified, long term portfolio. We believe the Sit Bond Funds, with their dual objectives of high income and stability of principal, offer attractive risk/reward profiles to complement equity holdings. We appreciate your continued interest in Sit Mutual Funds and look forward to assisting you in achieving your long-term investment goals.
With best wishes,

Eugene C. Sit, CFA
Chairman and Chief Investment Officer
3
| | | | |
| Sit High Income Municipal Bond Fund | | | |
| Three Months Ended March 31, 2007 | | | |
| | | | |
| Portfolio Managers
Michael C. Brilley • Debra A. Sit, CFA • Paul J. Jungquist, CFA • Andrew T. Clark, CFA | | | |
| | | | |
The Fund made its inception December 31, 2006. The Fund provided investors with a +0.90% total return for the quarter ended March 31, 2007 compared to a +0.80% return for the Lehman Municipal Bond Index. As of March 31, 2007, the Fund’s 30-day SEC yield was 3.56%.
Municipal bond yields increased slightly during the quarter, primarily as a result of continued heavy supply. Municipal issuance totaled slightly more than $100 billion in the quarter, an increase of 49% over the first quarter of 2006. Issuance is expected to remain heavy throughout 2007. While it appears that the Fed is close to or done for this tightening cycle, the interest rate environment could remain challenging for the remainder of the year, as the timing and direction of the Fed’s next move is still unclear. The Fund’s net asset value was remarkably stable during the quarter, rising from $10.00 at December 31, 2006 to $10.01 at March 31, 2007. The Fund experienced an increase in net assets over the quarter to $9.5 million.
The Fund’s most significant investments during the quarter were in the multi-family housing (primarily senior living) sector, the healthcare (primarily hospitals) sector, the education (primarily charter schools) sector, and the other revenue (primarily land-secured) sector. The Fund will maintain significant weightings in these sectors going forward, but the weightings should decrease somewhat as the Fund grows and becomes more diversified. Forty-one credits (half of which were rated) in twenty-one states were held in the Fund as of March 31. The Fund’s overall weighted credit quality is BBB.
We have lengthened the Fund’s average life duration close to 4.0 years since its inception. When it becomes clear the Fed is ready to begin easing, perhaps later this year, we anticipate that we will lengthen duration to lock in higher yields for the Fund. Demand should remain strong for lower-rated and non-rated bonds as investors reach for yield in this historically low interest rate environment, which should benefit the Fund’s performance. The Fund will likely see a significant increase in emphasis on non-rated credits in the coming year as it grows and diversifies.
INVESTMENT OBJECTIVE AND STRATEGY |
The Fund seeks high current income that is exempt from federal regular income tax. The Fund seeks to achieve its objective by investing primarily in municipal securities that generate interest income that is exempt from regular federal income tax. During normal market conditions, the Fund invests 100% (and, as a fundamental policy, no less than 80%) of its net assets in such tax-exempt municipal securities.
| | |
Net Asset Value 3/31/07: | | $10.01 Per Share |
12/31/06: | | $10.00 Per Share |
Total Net Assets: | | $9.5 Million |
30-day SEC Yield: | | 3.56% |
Tax Equivalent Yield: | | 5.48%(1) |
12-Month Distribution Rate: | | n/a |
Average Maturity: | | 12.2 Years |
Duration to Estimated Avg. Life: | | 3.9 Years(2) |
Implied Duration: | | 4.0 Years(2) |
| |
(1) | For individuals in the 35.0% federal tax bracket. |
(2) | See next page. |
PORTFOLIO STRUCTURE
(% OF TOTAL NET ASSETS) |
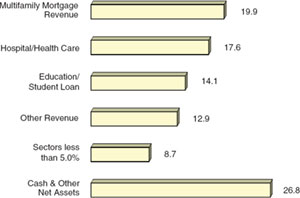
4
| | | | |
| | |
| |
| | |
| | |
|
| |
| | | | |
| | | | | | | | | | | | | |
AVERAGE ANNUAL TOTAL RETURNS* | |
| | | | | | | | | | |
| | Sit High
Income Muni
Bond Fund | | Lehman
Muni Bond
Index | | Lehman Muni
High Yield
Index | |
3 Month** | | | 0.90 | % | | | 0.80 | % | | | 1.57 | % | |
6 Month** | | | n/a | | | | n/a | | | | n/a | | |
1 Year | | | n/a | | | | n/a | | | | n/a | | |
3 Years | | | n/a | | | | n/a | | | | n/a | | |
5 Years | | | n/a | | | | n/a | | | | n/a | | |
Inception** | | | 0.90 | | | | 0.80 | | | | 1.57 | | |
(12/31/06) | | | | | | | | | | |
| | | | | | | | | | |
CUMULATIVE TOTAL RETURNS* | |
| | | | | | | | | | |
| | Sit High
Income Muni
Bond Fund | | Lehman
Muni Bond
Index | | Lehman Muni
High Yield
Index | |
1 Year | | | n/a | | | | n/a | | | | n/a | | |
3 Year | | | n/a | | | | n/a | | | | n/a | | |
5 Year | | | n/a | | | | n/a | | | | n/a | | |
Inception | | | 0.90 | % | | | 0.80 | % | | | 1.57 | % | |
(12/31/06) | | | | | | | | | | |
| | | | | | | | | | |
*As of 3/31/07 | | | **Not annualized. | |
| |
Performance is historical and assumes reinvestment of all dividends and capital gains. Past performance is not a guarantee of future results. Management fees and administrative expenses are included in the Fund’s performance; however, fees and expenses are not incorporated in the Lehman Muni Bond Index.
(2) Duration is a measure which reflects estimated price sensitivity to a given change in interest rates. For example, for an interest rate change of 1%, a portfolio with a duration of 5 years would be expected to experience a price change of 5%. Estimated average life duration is based on current interest rates and the Adviser’s assumptions regarding the expected average life of individual securities held in the portfolio. Implied duration is calculated based on historical price changes of securities held by the Fund. The Adviser believes that the portfolio’s implied duration is a more accurate estimate of price sensitivity provided interest rates remain within their historical range. If interest rates exceed the historical range, the estimated average life duration may be a more accurate estimate of price sensitivity.
The sum of $10,000 invested at inception (12/31/06) and held until 3/31/07 would have grown to $10,090 in the Fund or $10,080 in the Lehman Municipal Bond Index assuming reinvestment of all dividends and capital gains.
QUALITY RATINGS
(% OF TOTAL NET ASSETS) |
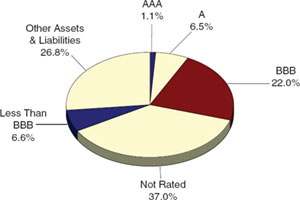
| | | |
Adviser’s |
Assessment of |
Non-Rated Securities |
| | | |
AAA | | 0.0 | % |
AA | | 0.0 | |
A | | 0.0 | |
BBB | | 0.0 | |
BB | | 9.3 | |
<BB | | 27.7 | |
| | | |
Total | | 37.0 | % |
Lower of Moody’s, S&P, Fitch or Duff & Phelps ratings used.
5
| | | | |
| Sit High Income Municipal Bond Fund | | | |
| March 31, 2007 | | | |
| | | | |
| Portfolio of Investments | | | |
| | | | |
| | | | | | | | | | | |
Quantity ($) | | Name of Issuer | | Coupon Rate (%) | | Maturity Date | | Market Value ($)(1) | |
| | | | | | | | | | |
| | | | | | | | | | |
Municipal Bonds (73.2%) (2) | | | | | | | | |
| | | | | | | | | | |
Alaska (2.6%) | | | | | | | | |
250,000 | | AK Indl. Dev. & Expt. Rev. (Boys & Girls Home) | | 5.50 | | 12/1/12 | | | | 249,497 | |
| | | | | | | | | | | |
| | | | | | | | | | |
Arizona (2.7%) | | | | | | | | | |
250,000 | | Pima Co. Indl. Rev. Ref. (Tucson Country Day Sch.) | | 5.00 | | 6/1/22 | | | | 253,970 | |
| | | | | | | | | | | |
| | | | | | | | | | |
California (2.6%) | | | | | | | | | |
250,000 | | Golden State Tob. Sec. Corp. Asset-Backed Sr. Rev. | | 5.00 | | 6/1/33 | | | | 246,927 | |
| | | | | | | | | | | |
| | | | | | | | | | |
Colorado (2.7%) | | | | | | | | | |
250,000 | | La Junta Hosp. Rev. (Ark Valley Regl. Med. Ctr.) | | 6.10 | | 4/1/24 | | | | 259,593 | |
| | | | | | | | | | | |
| | | | | | | | | | |
Florida (16.6%) | | | | | | | | | |
250,000 | | Alachua Co. Health Facs. Rev. (Shands Healthcare)(4) | | 4.41 | | 12/1/37 | | | | 250,062 | |
100,000 | | Connerton West Cap. Impt. Spl. Assmnt. Rev. | | 5.13 | | 5/1/16 | | | | 100,003 | |
250,000 | | Gramercy Farms Cmnty. Dev. Dist. Spl. Assmnt. | | 5.10 | | 5/1/14 | | | | 249,267 | |
100,000 | | Lake Ashton II Cmnty. Dev. Dist. Cap. Impt. Rev. | | 5.00 | | 11/1/11 | | | | 99,963 | |
| | Lee Co. Indl. Rev. Ref.: | | | | | | | | | |
250,000 | | (Shell Pt./Alliance Cmnty.) (5) | | 5.00 | | 11/15/29 | | | | 255,570 | |
200,000 | | (Lee Charter Foundation) (5) | | 5.25 | | 6/15/27 | | | | 201,398 | |
140,000 | | St. Johns Co. Indl. Dev. Auth. Rev. Ref. (Bayview) | | 5.00 | | 10/1/17 | | | | 140,682 | |
250,000 | | Sarasota Natl. Cmnty. Spl. Assessment | | 5.30 | | 5/1/39 | | | | 248,955 | |
25,000 | | Waters Edge Cmnty. Dev. Dist. Cap. Impt. | | 5.00 | | 11/1/12 | | | | 24,867 | |
| | | | | | | | | | | |
| | | | | | | | | | 1,570,767 | |
| | | | | | | | | | | |
Georgia (1.1%) | | | | | | | | | |
100,000 | | Medical Ctr. Hosp. Auth. Rev. Ref. (Spring Harbor) (5) | | 5.25 | | 7/1/27 | | | | 102,139 | |
| | | | | | | | | | | |
| | | | | | | | | | | |
Illinois (3.2%) | | | | | | | | | |
250,000 | | Annawan Tax Alloc. (Patriot Renewable Fuels LLC) | | 5.63 | | 1/1/18 | | | | 248,800 | |
55,000 | | IL Hlth. Facs. Auth. Rev. (Condell Med. Ctr.) | | 5.50 | | 5/15/32 | | | | 57,107 | |
| | | | | | | | | | | |
| | | | | | | | | | 305,907 | |
| | | | | | | | | | | |
| | | | | | | | | | |
Indiana (1.0%) | | | | | | | | | |
100,000 | | North Manchester Storm Water Rev. | | 5.90 | | 2/1/16 | | | | 100,159 | |
| | | | | | | | | | | |
| | | | | | | | | | |
Maryland (3.2%) | | | | | | | | | |
250,000 | | Howard Co. Retirement Cmnty. Ref. (Vantage House) (5) | | 5.25 | | 4/1/27 | | | | 256,853 | |
50,000 | | MD State Hlth. & Hgr. Educ. Facs. (King Farm Presb.) | | 5.00 | | 1/1/17 | | | | 50,246 | |
| | | | | | | | | | | |
| | | | | | | | | | 307,099 | |
| | | | | | | | | | | |
| | | | | | | | | | |
Massachusetts (1.1%) | | | | | | | | | |
100,000 | | MA State Hlth. & Educ. (Valley Regl. Hlth. Sys.) | | 5.75 | | 7/1/18 | | | | 100,146 | |
| | | | | | | | | | | |
| | | | | | | | | | |
Michigan (8.0%) | | | | | | | | | |
250,000 | | Grand Traverse Academy Pub. Sch. Acad. Rev. Ref. | | 5.00 | | 11/1/22 | | | | 258,720 | |
300,000 | | Kentwood Econ. Ltd. Oblig. Rev. (Holland Home) | | 5.38 | | 11/15/36 | | | | 312,918 | |
190,000 | | MI Educ. Facs. Oblig. Rev. Ref. (Black River School) | | 4.95 | | 9/1/08 | | | | 189,628 | |
| | | | | | | | | | | |
| | | | | | | | | | 761,266 | |
| | | | | | | | | | | |
| | | | | | | | | | |
Minnesota (1.1%) | | | | | | | | | |
100,000 | | Cloquet Hsg. Fac. Rev. Ref. (HADC Cloquet LLC) | | 5.50 | | 8/1/25 | | | | 101,142 | |
| | | | | | | | | | | |
| | | | | | | | | | |
Nevada (2.7%) | | | | | | | | | |
250,000 | | Clark Co. Poll. Ctr. Rev. Ref. (Nev. Pwr. Co.) | | 5.30 | | 10/1/11 | | | | 251,445 | |
| | | | | | | | | | | |
| | | | | | | | | | |
New Mexico (2.6%) | | | | | | | | | |
250,000 | | NM State Hosp. Equip. Rev. Ref. (Rehoboth) | | 5.00 | | 8/15/17 | | | | 247,793 | |
| | | | | | | | | | | |
| | | | | | | | | | |
North Dakota (1.1%) | | | | | | | | | |
105,000 | | City of Washburn (Bismarck State College Fdtn.) (5) | | 5.01 | | 4/1/32 | | | | 106,946 | |
| | | | | | | | | | | |
| | | | | | | | | | |
New York (1.3%) | | | | | | | | | |
125,000 | | Tobacco Settlement Fin. Corp. Rev. | | 5.00 | | 6/1/11 | | | | 125,124 | |
| | | | | | | | | | | |
6
| | | | |
| | |
| |
| | |
| | |
|
| |
| | | | |
| | | | | | | | | | | |
Quantity ($) | | Name of Issuer | | Coupon Rate (%) | | Maturity Date | | Market Value ($)(1) | |
| | | | | | | | | | | |
| | | | | | | | | | |
Oregon (1.1%) | | | | | | | | |
100,000 | | Oregon State Hlth. Hsg. Educ. & Cultural Facs. Rev. | | 8.00 | | 11/15/26 | | | | 101,290 | |
| | | | | | | | | | | |
| | | | | | | | | | |
Pennsylvania (4.4%) | | | | | | | | | |
250,000 | | Lehigh Co. Gen. Purpose Rev. (St. Luke’s Hosp) | | 4.61 | | 8/15/42 | | | | 249,875 | |
60,000 | | Montgomery Co. Indl. Dev. Auth. (Whitemarsh) | | 6.00 | | 2/1/21 | | | | 63,170 | |
105,000 | | Philadelphia Hosp. & Hgr. Educ. Rev. (Temple Univ.) | | 6.63 | | 11/15/23 | | | | 105,462 | |
| | | | | | | | | | | |
| | | | | | | | | | 418,507 | |
| | | | | | | | | | | |
| | | | | | | | | | |
Texas (7.9%) | | | | | | | | | |
200,000 | | Abilene Hlth. Facs. Rev. (Sears Methodist) | | 5.15 | | 11/15/28 | | | | 200,112 | |
180,000 | | El Paso Hlth. Facs. Rev. (Bienvivir Sr. Hlth.) | | 7.00 | | 8/15/12 | | | | 192,807 | |
100,000 | | Richardson Rev. Ref. & Impt. (Baylor/Richardson) | | 5.63 | | 12/1/28 | | | | 102,695 | |
250,000 | | Travis Co. Hlth. Dev. Corp. (Querencia Barton Creek) | | 5.10 | | 11/15/15 | | | | 253,240 | |
| | | | | | | | | | | |
| | | | | | | | | | 748,854 | |
| | | | | | | | | | | |
| | | | | | | | | | |
Utah (2.1%) | | | | | | | | | |
200,000 | | Provo Charter Sch. Rev. (Freedom Academy Fdtn.) (5) | | 5.50 | | 6/15/37 | | | | 200,000 | |
| | | | | | | | | | | |
| | | | | | | | | | |
Washington (2.7%) | | | | | | | | | |
150,000 | | WA St. Hsg. Fin. Commn. Rev. (Skyline At First Hill) | | 5.25 | | 1/1/17 | | | | 151,700 | |
100,000 | | WA St. Hsg. Fin. Commn. Rev. (Skyline At First Hill) | | 5.25 | | 1/1/13 | | | | 100,145 | |
| | | | | | | | | | | |
| | | | | | | | | | 251,845 | |
| | | | | | | | | | | |
| | | | | | | | | | |
Wisconsin (1.4%) | | | | | | | | | |
130,000 | | Milwaukee Redev. Auth. (Science Ed. Consortium) | | 5.13 | | 8/1/15 | | | | 131,100 | |
| | | | | | | | | | | |
| | | | | | | | | | | |
Total municipal bonds (cost: $6,942,456) | | | | | | | | 6,941,516 | |
| | | | | | | | | | | |
| | | | | | | | | | | |
Short-Term Securities (33.1%) (2) | | | | | | | | | |
3,133,988 | | Dreyfus Tax-Exempt Cash Management Fund, 3.84% | | | | | | | | 3,133,988 | |
| | | | | | | | | | | |
| | | | | | | | | | | |
(cost: $3,133,988) | | | | | | | | | | | |
| | | | | | | | | | | |
Total investments in securities (cost: $10,076,444) (3) | | | | | | | $ | 10,075,504 | |
| | | | | | | | | |
See accompanying notes to portfolios of investments on page 8.
7
| | | | |
| Sit High Income Municipal Bond Fund | | | |
| March 31, 2007 | | | |
| | | | |
| Notes to Portfolio of Investments | | | |
| | | | |
| |
(1) | Securities are valued by procedures described in note 1 to the financial statements. |
| |
(2) | Percentage figures indicate percentage of total net assets. |
| |
(3) | At March 31, 2007 the cost of securities for federal income tax purposes and the aggregate gross unrealized appreciation and depreciation based on that cost were as follows: |
| | | | |
| | | | |
Cost for federal income tax purposes | | $ | 10,076,444 | |
| | | | |
| | | | |
Unrealized appreciation (depreciation) on investments: | | | | |
Gross unrealized appreciation | | $ | 16,600 | |
Gross unrealized depreciation | | | (17,540 | ) |
| | | | |
| | | | |
Net unrealized appreciation (depreciation) | | ($ | 940 | ) |
| | | | |
| |
(4) | Interest rate varies based on a predetermined schedule or to reflect current market conditions; rate shown is effective rate on March 31, 2007. |
| |
(5) | At March 31, 2007, the total cost of investments purchased on a when-issued or forward-commitment basis was $1,124,345. |
8
| | | | |
| Sit High Income Municipal Bond Fund | |
| |
| March 31, 2007 | |
| | |
| Statement of Assets and Liabilities | |
| | | | |
| | | | |
ASSETS | | | | |
Investments in securities, at identified cost | | $ | 10,076,444 | |
| | | | |
| | | | |
Investments in securities, at market value - see accompanying schedules for detail | | $ | 10,075,504 | |
Cash in bank on demand deposit | | | — | |
Accrued interest and dividends receivable | | | 65,021 | |
Receivable for investment securities sold | | | — | |
Other receivables | | | — | |
Receivable for Fund shares sold | | | 740,000 | |
| | | | |
| | | | |
Total assets | | | 10,880,525 | |
| | | | |
| | | | |
| | | | |
| | | | |
LIABILITIES | | | | |
Disbursements in excess of cash balances | | | 249,999 | |
Payable for investment securities purchased - when issued (note 1) | | | 1,124,345 | |
Payable for investment securities purchased | | | — | |
Payable for Fund shares redeemed | | | — | |
Cash portion of dividends payable to shareholders | | | 21,147 | |
Other payables | | | — | |
Accrued investment management and advisory fees | | | 5,424 | |
| | | | |
| | | | |
Total liabilities | | | 1,400,915 | |
| | | | |
| | | | |
Net assets applicable to outstanding capital stock | | $ | 9,479,610 | |
| | | | |
| | | | |
Net assets consist of: | | | | |
Capital (par value and paid-in surplus) | | $ | 9,480,550 | |
Undistributed (distributions in excess of) net investment income | | | — | |
Accumulated net realized gain (loss) from security transactions | | | — | |
Unrealized appreciation (depreciation) on investments | | | (940 | ) |
| | | | |
| | | | |
| | $ | 9,479,610 | |
| | | | |
| | | | |
| | | | |
Outstanding shares | | | 946,778 | |
| | | | |
| | | | |
Net asset value per share of outstanding capital stock | | $ | 10.01 | |
| | | | |
See accompanying notes to financial statements on pages 12.
9
| | | | |
| Sit High Income Municipal Bond Fund | | | |
| Three Months Ended March 31, 2007 | | | |
| | | | |
| Statement of Operations | | | |
| | | | |
| | | | |
Investment income: | | | | |
Income: | | | | |
Interest | | $ | 42,214 | |
| | | | |
Total income | | | 42,214 | |
| | | | |
| | | | |
Expenses (note 3): | | | | |
Investment management and advisory services fee | | | 6,255 | |
Regulatory expenses | | | 24,176 | |
Fund administration services | | | 18,434 | |
Custodian fees | | | 296 | |
| | | | |
Total expenses | | | 49,161 | |
| | | | |
| | | | |
Less fees absorbed by the adviser | | | (40,294 | ) |
| | | | |
| | | | |
Total net expenses | | | 8,867 | |
| | | | |
| | | | |
Net investment income | | | 33,347 | |
| | | | |
| | | | |
Realized and unrealized gain (loss) on investments: | | | | |
| | | | |
Net realized gain (loss) | | | — | |
Net change in unrealized appreciation (or depreciation) on investments | | | (940 | ) |
| | | | |
| | | | |
Net gain (loss) on investments | | | (940 | ) |
| | | | |
| | | | |
Net increase (decrease) in net assets resulting from operations | | $ | 32,407 | |
| | | | |
See accompanying notes to financial statements on pages 12.
10
| | | | |
| Sit High Income Municipal Bond Fund | |
| |
| | |
| | |
| Statement of Changes in Net Assets | |
| | | | |
| | | | |
| | Three Months | |
| | Ended | |
| | March 31, | |
| | 2007 | |
| | | |
Operations: | | | | |
Net investment income | | $ | 33,347 | |
Net realized gain (loss) on investments | | | — | |
Net change in unrealized appreciation (depreciation) of investments | | | (940 | ) |
| | | | |
| | | | |
| | | | |
Net increase (decrease) in net assets resulting from operations | | | 32,407 | |
| | | | |
| | | | |
Distributions to shareholders from: | | | | |
Net investment income | | | (33,347 | ) |
Net realized gains on investments | | | — | |
| | | | |
| | | | |
Total distributions | | | (33,347 | ) |
| | | | |
| | | | |
Capital share transactions: | | | | |
Proceeds from shares sold | | | 9,577,067 | |
Reinvested distributions | | | 3,491 | |
Payments for shares redeemed | | | (100,008 | ) |
| | | | |
| | | | |
Increase (decrease) in net assets from capital transactions | | | 9,480,550 | |
| | | | |
| | | | |
Total increase (decrease) in net assets | | | 9,479,610 | |
| | | | |
Net assets | | | | |
Beginning of period | | | — | |
| | | | |
End of period | | $ | 9,479,610 | |
| | | | |
| | | | |
Capital transactions in shares: | | | | |
Sold | | | 956,431 | |
Reinvested distributions | | | 348 | |
Redeemed | | | (10,001 | ) |
| | | | |
| | | | |
Net increase (decrease) | | | 946,778 | |
| | | | |
See accompanying notes to financial statements on pages 12.
11
| | | | |
Sit High Income Municipal Bond Fund | | | |
| | | |
| | | | |
Notes to Financial Statements
| | | |
| | | | |
| |
(1) | Summary of Significant Accounting Policies |
| |
| The Sit High Income Municipal Bond Fund (the Fund) is a no-load fund, and is registered under the Investment Company Act of 1940 (as amended) as a diversified, open-end management investment company, or series thereof. The Fund is a series fund of Sit Mutual Funds II, Inc. The Fund has 10 billion authorized shares of capital stock that have a par value of $0.001. The Fund offers its shares in two classes: Class I and Class U. For the period ended March 31, 2007, only Class I shares were active. Accordingly, all information in this document pertains to the Class I shares. The Fund’s objective is to seek high current income that is exempt from regular income tax. |
| |
| Significant accounting policies followed by the Fund are summarized below: |
| |
| Investments in Securities |
| |
| Securities maturing more than 60 days from the valuation date, are valued at the market price supplied by an independent pricing vendor based on current interest rates; those securities with maturities of less than 60 days when acquired, or which subsequently are within 60 days of maturity, are valued at amortized cost, which approximates market value. When market quotations are not readily available, or when the Adviser becomes aware that a significant event impacting the value of a security or group of securities has occurred after the closing of the exchange on which the security or securities principally trade, but before the calculation of the daily net asset value, securities are valued at fair value as determined in good faith using procedures established by the Board of Directors. |
| |
| Security transactions are accounted for on the date the securities are purchased or sold. Gains and losses are calculated on the first in – first out basis. Interest, including level-yield amortization of long-term bond premium and discount, is recorded on the accrual basis. |
| |
| Delivery and payment for securities which have been purchased by the Fund on a forward commitment or when-issued basis can take place two weeks or more after the transaction date. During this period, such securities are subject to market fluctuations and may increase or decrease in value prior to delivery. As of March 31, 2007, the Fund entered into when-issued or forward commitments valued at $1,124,345. |
| |
| Line of Credit |
| |
| The Fund has a $25,000,000 committed line of credit through PNC Bank, N.A., whereby the Fund may borrow for the temporary funding of shareholder redemptions or for other temporary purposes. Interest is charged to the Fund based on its borrowings at a rate equal to the Federal Funds Rate plus fifty basis points (0.50%). The Fund had no borrowings outstanding during the period ended March 31, 2007. |
| |
| Recent Accounting Pronouncements |
| |
| On September 20, 2006, the Financial Accounting Standards Board (FASB) released Statement of Financial Accounting Standards No. 157, “Fair Value Measurements” (SFAS 157). SFAS 157 establishes an authoritative definition of fair value, sets out a framework for measuring fair value, and requires additional disclosures about fair-value measurements. The application of SFAS 157 is required for fiscal years beginning after November 15, 2007 and interim periods within those fiscal years. The impact of SFAS 157 on the Fund’s financial statements is being evaluated. |
| |
| In June 2006, the FASB issued FASB Interpretation 48 (FIN 48), “Accounting for Uncertainty in Income Taxes.” FIN 48 clarifies the accounting for uncertainty in income taxes recognized in accordance with FASB Statement No. 109, “Accounting for Income Taxes.” FIN 48 prescribes a two-step process to recognize and measure a tax position taken or expected to be taken in a tax return. The first step is to determine whether a tax position has met the more-likely-than-not recognition threshold and the second step is to measure a tax position that meets the threshold to determine the amount of benefit to recognize. FIN 48 also provides guidance on derecognition, classification, interest and penalties, accounting in interim periods, disclosure, and transition. FIN 48 is effective for fiscal years beginning after December 15, 2006. Tax positions of the Fund are being evaluated to determine the impact, if any, to the Fund. The adoption of FIN 48 is not anticipated to have a material impact on the Fund. |
| |
| Federal Taxes |
| |
| The Fund’s policy is to comply with the requirements of the Internal Revenue Code applicable to regulated investment companies and to distribute all of its taxable income to shareholders. Therefore, no income tax provision is required. Also, in order to avoid the payment of any federal excise taxes, the Fund will distribute substantially all of its net investment income and net realized gains on a calendar year basis. |
12
| |
| Net investment income and net realized gains may differ for financial statement and tax purposes. The character of distributions made during the year for net investment income or net realized gains may also differ from its ultimate characterization for tax purposes. The tax character of distributions paid during the fiscal period ended March 31, 2007 were as follows: |
| |
| Period Ended March 31, 2007: |
| | | | | | |
| Ordinary Income | | Long Term Capital Gain | | Total | |
|
| |
| |
| |
| $33,347 (*) | | ----- | | $33,347 | |
| |
| (*) 100% of dividends were derived from interest on tax-exempt securities. |
| |
| As of March 31, 2007, the components of distributable earnings on a tax basis were as follows: |
| | | | | | |
| Undistributed
Ordinary Income | | Accumulated
Gain (Loss) | | Unrealized
Appreciation
(Depreciation) | |
|
| |
| |
| |
| $21,147 | | ----- | | ($940) | |
| |
| Distributions |
| |
| Distributions to shareholders are recorded as of the close of business on the record date. Such distributions are payable in cash or reinvested in additional shares of the Fund’s capital stock. Distributions from net investment income are declared daily and paid monthly for the Fund. Distributions from net realized gains, if any, will be made annually for the Fund. |
| |
| Use of Estimates |
| |
| The preparation of financial statements in conformity with U.S. generally accepted accounting principles requires management to make certain estimates and assumptions that affect the reported amounts of assets and liabilities and disclosure of contingent assets and liabilities at the date of the financial statements and the reported results. Actual results could differ from those estimates. |
| |
(2) | Investment Security Transactions |
| |
| The cost of purchases and proceeds from sales and maturities of investment securities, other than short-term securities, for the period ended March 31, 2007, were as follows: |
| | | |
| Purchases ($) | | Proceeds ($) |
|
| |
|
| 6,943,503 | | ------ |
| |
(3) | Expenses |
| |
| Investment Adviser |
| |
| The Fund has entered into an investment management agreement with Sit Investment Associates Inc. (SIA), under which SIA manages the Fund’s assets and provides research, statistical and advisory services, and pays related office rental, executive expenses and executive salaries. The fee for investment management and advisory services is based on the average daily net assets of the Fund at the annual rate of 0.60%. The Fund is obligated to pay all of its other operating expenses (including, but not limited to, custody, regulatory, and fund administration fees). Effective with the inception of the Fund (December 31, 2006) through December 31, 2007, the Adviser will voluntarily waive fees and reimburse other Fund expenses so that total operating expenses, after waiver, do not exceed 0.85% of average daily net assets. Amounts waived by the Adviser as described in the statement of operations are for the first three months of operation of the Fund. The 0.85% expense limitation is determined on an annual basis and therefore these amounts may be recovered by the Adviser over the remainder of the calendar year. Fee waivers may be modified or discontinued at any time after December 31, 2007 with the approval of the Board of Directors without further notice to investors. |
| |
| Transactions with affiliates |
| |
| The investment adviser, affiliates of the investment adviser, directors and officers of the Fund as a whole owned 22,149 shares of the Fund as of March 31, 2007, which represented 2.3% of all shares outstanding. |
13
| | | | |
| | |
| |
Sit High Income Municipal Bond Fund | |
| | |
Financial Highlights
| |
| | | | |
| | | | |
| | Three months
ended
March 31,
2007 | |
| | | |
|
| | | | | |
Net Asset Value: | | | | |
Beginning of period | | $ | 10.00 | |
| | | | | |
Operations: | | | | |
Net investment income | | | .08 | |
Net realized and unrealized gains (losses) on investments | | | .01 | |
| | | | | |
Total from operations | | | .09 | |
| | | | | |
Distributions to Shareholders: | | | | |
From net investment income | | | (.08 | ) |
| | | | | |
Net Asset Value: | | | | |
End of period | | $ | 10.01 | |
| | | | | |
Total investment return (1) | | | 0.90 | % |
| | | | | |
Net assets at end of period (000’s omitted) | | $ | 9,480 | |
| | | | |
Ratios: | | | | |
Expenses to average daily net assets (3) | | | 0.85 | % (2) |
Net investment income to average daily net assets | | | 3.18 | % (2) |
Portfolio turnover rate (excluding short-term securities) | | | 0.00 | % |
| |
(1) | Total investment return is based on the change in net asset value of a share during the period and assumes reinvestment of distributions at net asset value. |
| |
(2) | Adjusted to an annual rate. Total Fund expenses are contractually limited to .85% of average daily net assets. However, during the period ended March 31, 2007, the investment adviser voluntarily absorbed expenses that were otherwise payable by the Fund. Had the Fund incurred these expenses, the ratio of expenses to average daily net assets would have been 4.69% for this period, and the ratio of net investment income (loss) to average daily net assets would have been (0.66%). |
| |
(3) | In addition to fees and expenses which the Fund bears directly, the Fund indirectly bears a pro rata share of the fees and expenses of the acquired funds in which it invests. Such indirect expenses are not included in the above reported expense ratios. |
14
|
|
Report of Independent Registered
Public Accounting Firm |
|
The Board of Directors and Shareholders
Sit Mutual Funds II, Inc.
We have audited the accompanying statement of assets and liabilities, including the schedule of investments, of Sit High Income Municipal Bond Fund (a series of Sit Mutual Funds II, Inc.) (the “Fund”), as of March 31, 2007, and the related statements of operations, changes in net assets, and the financial highlights for the period from December 31, 2006 (when shares became publicly available) to March 31, 2007. These financial statements and financial highlights are the responsibility of the Funds’ management. Our responsibility is to express an opinion on these financial statements and financial highlights based on our audits.
We conducted our audits in accordance with the standards of the Public Company Accounting Oversight Board (United States). Those standards require that we plan and perform the audit to obtain reasonable assurance about whether the financial statements and financial highlights are free of material misstatement. An audit includes examining, on a test basis, evidence supporting the amounts and disclosures in the financial statements. Our procedures included confirmation of securities owned as of March 31, 2007, by correspondence with the custodian and brokers or by other appropriate auditing procedures. An audit also includes assessing the accounting principles used and significant estimates made by management, as well as evaluating the overall financial statement presentation. We believe that our audits provide a reasonable basis for our opinion.
In our opinion, the financial statements and financial highlights referred to above present fairly, in all material respects, the financial position of Sit High Income Municipal Bond Fund as of March 31, 2007, and the results of its operations, the changes in its net assets, and the financial highlights for the period from December 31, 2006 (when shares became publicly available) to March 31, 2007, in conformity with U.S. generally accepted accounting principles.
KPMG LLP
Minneapolis, MN
May 16, 2007
15
| | | | |
| Sit High Income Municipal Bond Fund | | | |
| Expense Example (Unaudited) | | | |
| | | | |
| | | | |
| | | | |
As a shareholder of the Fund, you incur two types of costs: (1) transaction costs, including redemption fees and (2) ongoing costs, including management fees; and other Fund expenses. This Example is intended to help you understand your ongoing costs (in dollars) of investing in the Funds and to compare these costs with the ongoing costs of investing in other mutual funds.
The Example is based on an investment of $1,000 invested at the beginning of the period and held for the entire period December 31, 2006 to March 31, 2007.
Actual Expenses
The first line of the table below provides information about actual account values and actual expenses. You may use the information in this line, together with the amount you invested, to estimate the expenses that you paid over the period. Simply divide your account value by $1,000 (for example, an $8,600 account value divided by $1,000 = 8.6), then multiply the result by the number in the first line under the heading entitled “Expenses Paid During Period” to estimate the expenses you paid on your account during this period.
Hypothetical Example for Comparison Purposes
The second line of the table below provides information about hypothetical account values and hypothetical expenses based on the Fund’s actual expense ratio and an assumed rate of return of 5% per year before expenses, which is not the Fund’s actual return. The hypothetical account values and expenses may not be used to estimate the actual ending account balance or expenses you paid for the period. You may use this information to compare the ongoing costs of investing in the Fund and other funds. To do so, compare this 5% hypothetical example with the 5% hypothetical examples that appear in the shareholder reports of the other funds.
Please note that the expenses shown in the table are meant to highlight your ongoing costs only and do not reflect any transactional costs, such as redemption fees. Therefore, the second line of the table is useful in comparing ongoing costs only, and will not help you determine the relative total costs of owning different funds. In addition, if these transactional costs (redemption fees) were included, your costs would have been higher.
| | | | | | | | | |
| | | Beginning | | | Ending | | | Expenses Paid |
| | | Account Value | | | Account Value | | | During Period* |
Sit High Income Muni Bond Fund | | | (12/31/06) | | | (3/31/07) | | | (12/31/06 - 3/31/07) |
Actual | | | $1,000 | | | $1,009.00 | | | $2.11 |
Hypothetical (5% return before expenses) | | | $1,000 | | | $1,008.25 | | | $2.10 |
* Expenses are equal to the Fund’s annualized expense ratio of 0.85%, multiplied by the average account value over the period, multiplied by 90/365 (to reflect the one-quarter year period.)
16
| | | | |
| | |
| |
| Sit High Income Municipal Bond Fund
Federal Tax Information (Unaudited)
| |
| | |
| | |
We are required by Federal tax regulations to provide shareholders with certain information regarding dividend distributions on an annual fiscal year basis. The figures are for informational purposes only and should not be used for reporting to federal or state revenue agencies. All necessary tax information will be mailed in January each year.
| | | | | | | |
| | | | | Long-Term | |
| | Ordinary | | Capital | |
Fund and Payable Date | | Income (a) | | Gain (b) | |
| | | | | | |
High Income Municipal Bond Fund | | | | | | | |
| | | | | | | |
April 30, 2006 | | $ | — | | $ | — | |
May 31, 2006 | | | — | | | — | |
June 30, 2006 | | | — | | | — | |
July 31, 2006 | | | — | | | — | |
August 31, 2006 | | | — | | | — | |
September 30, 2006 | | | — | | | — | |
October 31, 2006 | | | — | | | — | |
November 30, 2006 | | | — | | | — | |
December 31, 2006 | | | — | | | — | |
January 31, 2007 | | | 0.02924 | | | — | |
February 28, 2007 | | | 0.02288 | | | — | |
March 31, 2007 | | | 0.02753 | | | — | |
| | | | | | | |
| | $ | 0.07964 | (c) | $ | 0.00000 | |
| | | | | | | |
| |
(a) | Includes distributions of short-term gains, if any, which are taxable as ordinary income. |
| |
(b) | Taxable as long-term gain. |
| |
(c) | 100% of dividends were derived from interest on tax-exempt securities. This portion of exempt-interest dividends is exempt from federal taxes and should not be included in shareholders’ gross income. Exempt-interest dividends may be subject to state and local taxes. Each shareholder should consult a tax adviser about reporting this income for state and local tax purposes. |
17
| | | | |
| Sit Mutual Funds | | | |
| |
| | | | |
| Information about Directors and Officers | | | |
| | | | |
The Sit Mutual Funds are a family of no-load mutual funds. The Fund described in this Annual Report is the Sit High Income Municipal Bond Fund. There are five other bond funds within the Sit Mutual Fund family that are described in a separate Bond Funds Annual Report and Bonds Funds Statement of Additional Information (SAI). The eight stock funds within the Sit Mutual Fund family are described in a Stock Funds SAI. The corporate issuer of the Sit High Income Municipal Bond Fund has a Board of Directors and officers. Pursuant to Minnesota law, the Board of Directors is responsible for the management of the Fund and the establishment of the Fund’s policies. The officers of the Fund manage the day-to-day operation of the Fund. Information pertaining to the directors and officers of the Fund is set forth below. The business address, unless otherwise noted below, is that of the Fund’s investment adviser -- 3300 IDS Center, 80 South Eighth Street, Minneapolis, Minnesota 55402. The Board has a separate Audit Committee. The SAI has additional information about the Fund’s directors and is available without charge upon request by calling the Sit Funds at 800-332-5580.
| | | | | | | | | | |
Name, Address
and Age | | Position(s)
Held
With Fund | | Term of
Office(1)
and Length of
Time Served | | Principal Occupation(s) During
Past Five Years | | Number of
Funds in Fund
Complex Over-
seen by Director | | Other Directorships
Held by Director(4) |
| | | | | | | | | | | |
INTERESTED DIRECTORS: | | | | | | | | |
| | | | | | | | | | | |
Eugene C. Sit (2)
Age: 68 | | Director and
Chairman | | Director since
inception. | | Chairman, CEO and CIO of Sit Investment Associates, Inc. (the “Adviser”) and Sit/Kim International Investment Associates, Inc. (“Sit/Kim”); Director of SIA Securities Corp. (the “Distributor”), and Chairman and CEO of Sit Investment Fixed Income Advisors, Inc. (“SF”). | | 14 | | Corning Incorporated; Smurfit – Stone Container Corporation |
| | | | | | | | | | | |
William E. Frenzel (2)
Age: 78 | | Director | | Director since 1991 or the Fund’s inception if later. | | Guest Scholar at The Brookings Institution and member of several government policy committees, foundations and organizations; Advisory Director of the Adviser; Director of Sit/Kim and SF. | | 14 | | None |
| | | | | | | | | | | |
INDEPENDENT DIRECTORS: | | | | | | | | |
| | | | | | | | | | | |
Sidney L. Jones
Age: 73 | | Director | | Director since 1988 to 1989 and since 1993 or the Fund’s inception if later. | | Lecturer, Washington Campus Consortium of 17 Universities; Senior Advisor to Lawrence and Co., Toronto, Canada (investment management). | | 14 | | None |
| | | | | | | | | | | |
Bruce C. Lueck
Age: 66 | | Director | | Director since 2004 or the Fund’s inception, if later. | | Consultant for Zephyr Management, L.P. (investment management) and committee member of several investment funds and foundations. President & Chief Investment Officer, Okabena Investment Services, Inc. from 1985 to 2003; Board Member, Okabena Company from 1985 to 2003. | | 14 | | None |
| | | | | | | | | | | |
John P. Fagan
Age: 76 | | Director | | Director since 2006 or the Fund’s inception, if later. | | Honorary member on Board of St. Joseph’s College in Rensselaer, Indiana. | | 14 | | None |
| | | | | | | | | | | |
Donald W. Phillips
Age: 58 | | Director | | Director of the International Fund since 1993, and since 1990 or the Fund’s inception if later for all other Funds. | | Chairman and CEO of WP Global Partners Inc., 7/05 to present; CEO and CIO of WestLB Asset Management (USA) LLC, 4/00 to 4/05. | | 14 | | None |
| | | | | | | | | | | |
Melvin C. Bahle
Age: 88 | | Director | | Director since 2005; Director Emeritus since 1995. | | Director and/or officer of several foundations and charitable organizations. | | 14 | | None |
| | | | | | | | | | | |
OFFICERS: | | | | | | | | | | |
| | | | | | | | | | | |
Peter L. Mitchelson
Age: 65 | | Vice
Chairman | | Re-Elected by the Boards annually; Officer since inception. | | Director and Vice Chairman of the Adviser; Director and Executive Vice President of Sit/Kim; Director of the Distributor; and Vice Chair- man of SF; Director of the Sit Funds through 4/30/02. | | N/A | | N/A |
| | | | | | | | | | | |
18
| | | | |
| | |
| |
| | |
| | |
|
| |
| | | | |
| | | | | | | | | | |
Name, Address,
and Age | | Position(s)
Held
With Fund | | Term of
Office(1)
and length of
Time Served | | Principal Occupation(s) During
Past Five Years | | Number of
Funds in Fund
Complex Over-
seen by Director | | Other Directorships
Held by Director(4) |
| | | | | | | | | | | |
Michael C. Brilley
Age: 61 | | Senior Vice President | | Re-Elected by the Boards annually; Officer since 1985. | | Senior Vice President and Senior Fixed Income Officer of the Adviser; Director, President and Chief Fixed-Income Officer of SF. Director of the Sit Funds (Bond Funds only) through 4/30/02. | | N/A | | N/A |
| | | | | | | | | | | |
Roger J. Sit (3)
Age: 45 | | Executive Vice President | | Re-Elected by the Boards annually; Officer since 1998. | | Director and President of the Adviser; Director, President, COO, and Deputy CIO of Sit/Kim. | | N/A | | N/A |
| | | | | | | | | | | |
Debra A. Sit (3)
Age: 46 | | Vice President– Investments | | Re-Elected by the Boards annually; Officer since 1994. | | Vice President – Bond Investments of the Adviser; Senior Vice President, Assistant Treasurer and Assistant Secretary of SF; Assistant Treasurer and Assistant Secretary of Sit/Kim. | | N/A | | N/A |
| | | | | | | | | | | |
Bryce A. Doty
Age: 40 | | Vice President - Investments. | | Re-Elected by the Boards annually; Officer since 1996. | | Vice President and Portfolio Manager of SF. | | N/A | | N/A |
| | | | | | | | | | | |
Paul J. Junquist
Age: 45 | | Vice President– Investments | | Re-Elected by the Boards annually; Officer since 1996. | | Vice President and Portfolio Manager of SF. | | N/A | | N/A |
| | | | | | | | | | | |
Mark H. Book
Age: 43 | | Vice President - Investments | | Re-Elected by the Boards annually; Officer since 2002. | | Vice President and Portfolio Manager of SF. | | N/A | | N/A |
| | | | | | | | | | | |
Paul E. Rasmussen
Age: 46 | | Vice President and Treasurer | | Re-Elected by the Boards annually; Officer since 1994. | | Vice President, Secretary, Controller and Chief Compliance Officer of the Adviser; Vice President, Secretary, and Chief Compliance Officer of Sit/Kim and SF; President & Treasurer of the Distributor. | | N/A | | N/A |
| | | | | | | | | | | |
Michael J. Radmer
50 S. 6th Street
Minneapolis, MN
55402
Age: 61 | | Secretary | | Re-Elected by the Boards annually; Officer since 1984. | | Partner of the Funds’ general counsel, Dorsey & Whitney, LLP | | N/A | | N/A |
| | | | | | | | | | | |
Carla J. Rose
Age: 40 | | Vice President, Assistant Secretary & Assistant Treasurer | | Re-Elected by the Boards annually; Officer since 2000. | | Vice President, Administration & Deputy Controller of the Adviser; Vice President, Administration and Controller of Sit/Kim; Controller and Treasurer of SF. | | N/A | | N/A |
| | | | | | | | | | | |
Kelly K. Boston
Age: 38 | | Assistant Secretary & Assistant Treasurer | | Re-Elected by the Boards annually; Officer since 2000. | | Staff Attorney of the Adviser. | | N/A | | N/A |
| | | | | | | | | | | |
| |
(1) | Directors serve until their death, resignation, removal or the next shareholder meeting at which election of directors is an agenda item and a successor is duly elected and qualified. |
| |
(2) | Directors who are deemed to be “interested persons” of the Funds as that term is defined by the Investment Company Act of 1940. Mr. Sit is considered an “interested person” because he is an officer of Sit Investment Associates, Inc., the Fund’s investment adviser. Mr. Frenzel is deemed to be an interested person because he is a director and shareholder of the Fund’s investment adviser. |
| |
(3) | Mr. Roger Sit is the son of Eugene C. Sit. Ms. Debra Sit is the daughter of Eugene C. Sit. |
| |
(4) | Includes only directorships of companies required to report under the Securities Exchange Act of 1934 (i.e., public companies) or other investment companies registered under the 1940 Act. |
19
| | | | |
| Sit High Income Municipal Bond Fund | | | |
| Additional Information | | | |
| | | | |
| | | | |
| | | | |
| | | | |
PROXY VOTING
The Fund follows certain policies and procedures for voting proxies for securities held in the portfolio. A description of the Fund’s proxy voting polices and procedures is available without charge upon request by calling the Fund at 1-800-332-5580.
AVAILABILITY OF QUARTERLY PORTFOLIO SCHEDULES
The Fund files its complete schedule of portfolio holdings with the U.S. Securities and Exchange Commission (SEC) for the first and third quarters of each fiscal year on Form N-Q. The Fund’s Form N-Q IS available on the SEC’s website at http://www.sec.gov. The Fund’s Form N-Q may be reviewed and copied at the SEC’s Public Reference Room in Washington, DC. Information on the operation of the Public Reference Room may be obtained by calling 1-800-SEC-0330. Information on the Fund’s Forms N-Q is also available without charge upon request by calling the Fund at 1-800-332-5580.
APPROVAL OF INVESTMENT MANAGEMENT AGREEMENT
At their meeting held on October 23, 2006 the Board of Directors of Sit Mutual Funds II, Inc. unanimously approved the investment management agreement entered into by and between Sit Investment Associates, Inc. (“SIA”) and Sit Mutual Funds II, Inc. (the “Advisory Agreement”) with respect to the management of the Fund. The Board approved the Advisory Agreement after a lengthy discussion and consideration of various factors relating to both the Board’s selection of SIA as the investment adviser and the Board’s approval of the fee to be paid under the Agreement.
Investment Adviser Criteria. The Directors began their analysis by discussing their criteria for determining the quality of an investment adviser. The Directors’ noted that their analysis is similar to that used by institutional investors in evaluating and selecting investment advisers. The Directors discussed several factors used to determine the overall quality of an investment adviser, including the following:
Investment Philosophy and Process. The Directors considered SIA’s philosophy of managing assets. With respect to fixed income securities generally, SIA stresses the consistent attainment of superior risk-adjusted returns using a conservative investment management approach that identifies pricing anomalies in the market and management of portfolio duration. SIA seeks securities with a special emphasis on interest income and significant stability of principal value. SIA’s style seeks to avoid excessive return volatility and generate consistent results over an economic cycle. The Directors noted that the Fund invests primarily in municipal securities that are not rated by a nationally recognized statistical rating organization, and may invest up to 60% of its assets in municipal securities rated below investment-grade.
The Directors discussed SIA’s consistent and well-defined investment process. The fixed income portfolio managers are responsible for implementing the strategy set forth in the Chief Fixed Income Officer’s duration targets and the Chief Investment Officer’s interest rate projections.
Investment Professionals. The Directors discussed the experience, knowledge and organizational stability of SIA and its investment professionals. The Directors noted that SIA’s senior founding professionals are actively involved in the investment process and have led the organization since its inception in 1981 which has provided not only organizational stability, but a consistent portfolio management style. The senior professionals of SIA are among the most experienced professionals in the industry.
The Directors discussed the depth of SIA’s investment staff. The Directors noted that SIA has over 30 investment professionals. Given the investment products offered by SIA and the assets under management, the Directors determined that SIA’s investment staff is well positioned to meet the current needs of its clients, including the Fund, and to accommodate growth in the number of clients and assets under management for the near future. The Directors concluded that the depth of the investment staff, and in particular senior management and investment analysts, is actually greater than the Fund currently requires at its present asset size. The Directors noted that SIA has the resources of a $6.6 billion investment firm working for the benefit of the Fund shareholders.
20
Investment Performance. The Fund’s inception was December 31, 2006, and therefore there was no investment performance information to review for the Fund at the Directors’ October 23, 2006 meeting. The Directors reviewed and discussed the investment performance of each of the Sit Mutual Funds and determined that performance of the fixed income funds has generally been competitive with indices and other funds with similar investment styles as the Sit Funds, such as fixed income funds seeking to maximize income.
Corporate Culture. The Directors discussed SIA’s corporate values to operate under the highest ethical and professional standards. SIA’s culture is set and practiced by senior management who insist that all professionals exhibit honesty and integrity. The Board noted that the firm’s values are evident in all of the services provided to the Fund.
Review of Specific Factors. The Directors continued their analysis by reviewing specific information on SIA and the Fund and specific terms of the Advisory Agreement, including the following:
Investment Performance. The Directors reviewed the investment performance of each of the Sit Mutual Funds for 1 month, 3 months, 6 months, year-to-date, 1 year, 5 years (as applicable), 10 years (as applicable) and since inception, both on an absolute basis and on a comparative basis to indices and mutual funds within the same investment categories. As noted above, the Directors concluded that the investment performance of the Sit fixed income funds has been competitive in relation to their stated objectives and strategies on a comparable basis with funds with similar objectives and strategies.
Fees and Expenses. The Directors noted that the Fund will pay SIA a fee for its services equal to .60% per year of the Fund’s average daily net assets, and that the Fund shall bear all of its expenses. The Directors reviewed the average and median expense ratios of mutual funds within the same investment category of the Fund. The Directors noted that the Fund’s estimated total expense ratio based on projected levels of total Fund assets, and including the servicing fee paid to a third party intermediary through which Class U shares are purchased, compares favorably to the total expense ratios of other no-load funds within the Fund’s Morningstar category. The Directors concluded that the fee set for the Fund is reasonable and appropriate. The Directors noted that through December 31, 2007, SIA will voluntarily waive fees and reimburse other Fund expenses so that total operating expenses, after waiver, do not exceed 0.85% and 1.00% of average daily net assets, for Class I and Class U shares respectively.
The Directors reviewed SIA’s investment advisory fee schedule for investment management services provided to other clients. The Directors compared the services provided to the Fund and other clients of SIA. The Directors concluded that the fees paid by the Fund in relation to the fees paid by other SIA clients were appropriate and reasonable. The Directors noted that the Fund had not commenced operations, and based on expected levels of assets there was no indication that the Fund’s expenses would be excessive.
The Directors discussed the anticipated benefit SIA will receive from the relationship with the Fund. The Board concluded that any benefits SIA receives from its relationship with the Fund are well within industry norms and are reflected in the amount of the fees paid by the Fund to SIA and are appropriate and reasonable.
Non-Advisory Services. The Directors considered the quality of non-advisory services which SIA provides to its active and operating Funds in the Sit Mutual Fund Family of Funds (and its shareholders) and the quality and depth of SIA’s non-investment personnel who provide such services. Directors concluded that the level of such services and the quality and depth of such personnel are consistent with industry standards.
Finally, the Directors considered the compliance staff and the regulatory history of SIA, and concluded that both are consistent with industry standards.
21

ANNUAL REPORT - Sit High Income Municipal Bond Fund
THREE MONTHS ENDED MARCH 31, 2007
INVESTMENT ADVISER
Sit Investment Associates, Inc.
3300 IDS Center
80 South Eighth Street
Minneapolis, MN 55402
612-334-5888 (Metro Area)
800-332-5580
DISTRIBUTOR
SIA Securities Corp.
3300 IDS Center
80 South Eighth Street
Minneapolis, MN 55402
612-334-5888 (Metro Area)
800-332-5580
CUSTODIAN
PFPC Trust Company
P.O. Box 9763
Providence, RI 02940
TRANSFER AGENT AND DISBURSING AGENT
PFPC Trust Company
P. O. Box 9763
Providence, RI 02940
INDEPENDENT REGISTERED PUBLIC
ACCOUNTING FIRM
KPMG LLP
90 South Seventh Street
Suite 4200
Minneapolis, MN 55402
LEGAL COUNSEL
Dorsey & Whitney LLP
50 South Sixth Street
Suite 1500
Minneapolis, MN 55402
www.sitfunds.com
Item 2: Code of Ethics.
The registrant has adopted a code of ethics that applies to the registrant’s principal executive officer, principal financial officer, principal accounting officer, and persons performing similar functions. The registrant has not made any amendment to its code of ethics during the period covered by this report which must be described herein pursuant to Item 2. The registrant has not granted any waivers from any provisions of the code of ethics during the period covered by this report.
A copy of the registrant’s code of ethics is available without charge upon request by calling the registrant at 612-334-5888 or 1-800-332-5580, or by mail at Sit Mutual Funds, 3300 IDS Center, 80 South Eighth Street, Minneapolis, MN 55402.
Item 3: Audit Committee Financial Expert.
The registrant’s Board of Directors has determined that Mr. Melvin C. Bahle, Mr. John P. Fagan, Mr. Sidney L. Jones, Mr. Bruce C. Lueck and Mr. Donald W. Phillips are audit committee financial experts serving on its audit committee. Mr. Bahle, Mr. Fagan, Mr. Jones, Mr. Lueck and Mr. Phillips are independent for purposes of this item.
Item 4: Principal Accountant Fees and Services.
(a) – (d) Aggregate fees billed to the registrant for the last two fiscal years for professional services rendered by the registrant’s principal accountant were as follows:
| | Audit
Fees (a) | | Audit
Related
Fees (b) | | Tax
Fees (c) | | Other
Fees (d) | |
Fiscal year ended March 31, 2007 | | 17,500 | | 0 | | 3,975 | | 0 | |
Fiscal year ended March 31, 2006 | | 17,300 | | 0 | | 3,860 | | 0 | |
Audit fees include amounts related to the audit of the registrant’s annual financial statements and services normally provided by the accountant in connection with statutory and regulatory filings. Audit-related fees include amounts reasonably related to the performance of the audit of the registrant’s financial statements, and/or are traditionally performed by the auditor. Tax fees include amounts related to tax compliance, tax planning, and tax advice. Other Fees include services provided to review the Fund’s order processing and trading procedures.
(e) (1) The Audit Committee is required to pre-approve audit and non-audit services performed for the registrant by the independent auditor in order to assure that the provision of such services does not impair the auditor’s independence. The audit committee also is required to pre-approve certain non-audit services performed by the registrant’s independent auditor for the registrant’s investment adviser and certain of the adviser’s affiliates if the services relate directly to the operations and financial reporting of the registrant. Services to be provided by the auditor must receive general pre-approval or specific pre-approval by the audit committee. Any proposed services exceeding pre-approved cost levels will require separate pre-approval by the audit committee.
The audit committee may delegate pre-approval authority to the audit committee chairman. The chairman shall report any pre-approval decisions to the audit committee at its next scheduled meeting. The audit committee does not delegate its responsibility to pre-approve services performed by the independent auditor to management.
(2) No services included in (b) – (d) were approved pursuant to paragraph (c)(7)(i)(C) of Rule 2-01 of Regulation S-X.
(f) Not applicable.
(g) The aggregate fees billed for the most recent fiscal year and the preceding fiscal year by the registrant’s principal accountant for non-audit services rendered to the registrant, its investment adviser, and any entity controlling, controlled by, or under common control with the investment adviser that provides ongoing services to the registrant were $32,000 and $121,000, respectively.
(h) The registrant’s audit committee has determined that the provision of non-audit services rendered to the registrant’s investment adviser, and any entity controlling, controlled by, or under common control with the investment adviser that provides ongoing services to the registrant, that were not pre-approved pursuant to paragraph (c)(7)(ii) of Rule 2-01 of Regulation S-X is considered compatible with maintaining the principal accountant’s independence.
Item 5: Audit Committee of Listed Registrants.
Not applicable to open-end investment companies.
Item 6: Schedule of Investments.
The schedule of investments is included as part of the report to shareholders filed under Item 1 of this Form.
Item 7: Disclosure of Proxy Voting Policies and Procedures for Closed-End Management Investment Companies.
Not applicable to open-end investment companies.
Item 8: Portfolio Managers of Closed-End Management Investments Companies.
Not applicable to open-end investment companies.
Item 9: Purchases of Equity Securities by Closed-End Management Investment Company and Affiliated Purchasers.
Not applicable to open-end investment companies.
Item 10: Submission of Matters to a vote of Security Holders.
There have been no material changes to the procedures by which shareholders may recommend nominees to the registrant’s board of directors.
Item 11: Controls and Procedures.
(a) Based on their evaluation of the Registrant’s Disclosure Controls and Procedures as of a date within 90 days of the Filing Date, the Registrant’s Chairman and Treasurer have determined that the Disclosure Controls and Procedures (as defined in Rule 30a-2(c) under the Act) are designed to ensure that information required to be disclosed by the Registrant is recorded, processed, summarized and reported by the filing Date, and that information required to be disclosed in the report is communicated to the Registrant’s management, as appropriate, to allow timely decisions regarding required disclosure.
(b) There were no significant changes in the Registrant’s internal controls or in other factors that could significantly affect these controls subsequent to the date of their evaluation, and there were no corrective actions with regard to significant deficiencies and material weaknesses.
Item 12: Exhibits.
(a) The following exhibits are attached to this Form N-CSR:
(2) A separate certification for each principal executive and principal financial officer of the registrant as required by Rule 30a-2(a) under the Act (17 CFR 270.30a-2) (certification required by Section 302 of the Sarbanes-Oxley Act of 2002).
(b) Certification required by Rule 30a-2(b) under the Act (certification required by Section 906 of the Sarbanes-Oxley Act of 2002).
SIGNATURES
Pursuant to the requirements of the Securities Exchange Act of 1934 and the Investment Company Act of 1940, the registrant has duly caused this report to be signed on its behalf by the undersigned, thereunto duly authorized.
Sit Money Market Fund, Inc.
By (Signature and Title)* | /s/ Paul E. Rasmussen |
| Paul E. Rasmussen |
| Vice President, Treasurer |
Date May 31, 2007
Pursuant to the requirements of the Securities Exchange Act of 1934 and the Investment Company Act of 1940, this report has been signed below by the following persons on behalf of the registrant and in the capacities and on the dates indicated.
By (Signature and Title) | /s/ Paul E. Rasmussen |
| Paul E. Rasmussen |
| Vice President, Treasurer |
Date May 31, 2007
By (Signature and Title) | /s/ Eugene C. Sit |
| Eugene C. Sit |
| Chairman |
Date May 31, 2007
Item 2: Code of Ethics.
The registrant has adopted a code of ethics that applies to the registrant’s principal executive officer, principal financial officer, principal accounting officer, and persons performing similar functions. The registrant has not made any amendment to its code of ethics during the period covered by this report which must be described herein pursuant to Item 2. The registrant has not granted any waivers from any provisions of the code of ethics during the period covered by this report.
A copy of the registrant’s code of ethics is available without charge upon request by calling the registrant at 612-334-5888 or 1-800-332-5580, or by mail at Sit Mutual Funds, 3300 IDS Center, 80 South Eighth Street, Minneapolis, MN 55402.
Item 3: Audit Committee Financial Expert.
The registrant’s Board of Directors has determined that Mr. Melvin C. Bahle, Mr. John P. Fagan, Mr. Sidney L. Jones, Mr. Bruce C. Lueck and Mr. Donald W. Phillips are audit committee financial experts serving on its audit committee. Mr. Bahle, Mr. Fagan, Mr. Jones, Mr. Lueck and Mr. Phillips are independent for purposes of this item.
Item 4: Principal Accountant Fees and Services.
(a) – (d) Aggregate fees billed to the registrant for the last two fiscal years for professional services rendered by the registrant’s principal accountant were as follows:
| | Audit
Fees (a) | | Audit
Related
Fees (b) | | Tax
Fees (c) | | Other
Fees (d) | |
Fiscal year ended March 31, 2007 | | 16,300 | | 0 | | 3,975 | | 0 | |
Fiscal year ended March 31, 2006 | | 15,800 | | 0 | | 3,860 | | 0 | |
Audit fees include amounts related to the audit of the registrant’s annual financial statements and services normally provided by the accountant in connection with statutory and regulatory filings. Audit-related fees include amounts reasonably related to the performance of the audit of the registrant’s financial statements, and/or are traditionally performed by the auditor. Tax fees include amounts related to tax compliance, tax planning, and tax advice. Other Fees include services provided to review the Fund’s order processing and trading procedures.
(e) (1) The Audit Committee is required to pre-approve audit and non-audit services performed for the registrant by the independent auditor in order to assure that the provision of such services does not impair the auditor’s independence. The audit committee also is required to pre-approve certain non-audit services performed by the registrant’s independent auditor for the registrant’s investment adviser and certain of the adviser’s affiliates if the services relate directly to the operations and financial reporting of the registrant. Services to be provided by the auditor must receive general pre-approval or specific pre-approval by the audit committee. Any proposed services exceeding pre-approved cost levels will require separate pre-approval by the audit committee.
The audit committee may delegate pre-approval authority to the audit committee chairman. The chairman shall report any pre-approval decisions to the audit committee at its next scheduled meeting. The audit committee does not delegate its responsibility to pre-approve services performed by the independent auditor to management.
(2) No services included in (b) – (d) were approved pursuant to paragraph (c)(7)(i)(C) of Rule 2-01 of Regulation S-X.
(f) Not applicable.
(g) The aggregate fees billed for the most recent fiscal year and the preceding fiscal year by the registrant’s principal accountant for non-audit services rendered to the registrant, its investment adviser, and any entity controlling, controlled by, or under common control with the investment adviser that provides ongoing services to the registrant were $32,000 and $121,000, respectively.
(h) The registrant’s audit committee has determined that the provision of non-audit services rendered to the registrant’s investment adviser, and any entity controlling, controlled by, or under common control with the investment adviser that provides ongoing services to the registrant, that were not pre-approved pursuant to paragraph (c)(7)(ii) of Rule 2-01 of Regulation S-X is considered compatible with maintaining the principal accountant’s independence.
Item 5: Audit Committee of Listed Registrants.
Not applicable to open-end investment companies.
Item 6: Schedule of Investments.
The schedule of investments is included as part of the report to shareholders filed under Item 1 of this Form.
Item 7: Disclosure of Proxy Voting Policies and Procedures for Closed-End Management Investment Companies.
Not applicable to open-end investment companies.
Item 8: Portfolio Managers of Closed-End Management Investments Companies.
Not applicable to open-end investment companies.
Item 9: Purchases of Equity Securities by Closed-End Management Investment Company and Affiliated Purchasers.
Not applicable to open-end investment companies.
Item 10: Submission of Matters to a vote of Security Holders.
There have been no material changes to the procedures by which shareholders may recommend nominees to the registrant’s board of directors.
Item 11: Controls and Procedures.
(a) Based on their evaluation of the Registrant’s Disclosure Controls and Procedures as of a date within 90 days of the Filing Date, the Registrant’s Chairman and Treasurer have determined that the Disclosure Controls and Procedures (as defined in Rule 30a-2(c) under the Act) are designed to ensure that information required to be disclosed by the Registrant is recorded, processed, summarized and reported by the filing Date, and that information required to be disclosed in the report is communicated to the Registrant’s management, as appropriate, to allow timely decisions regarding required disclosure.
(b) There were no significant changes in the Registrant’s internal controls or in other factors that could significantly affect these controls subsequent to the date of their evaluation, and there were no corrective actions with regard to significant deficiencies and material weaknesses.
Item 12: Exhibits.
(a) The following exhibits are attached to this Form N-CSR:
(2) A separate certification for each principal executive and principal financial officer of the registrant as required by Rule 30a-2(a) under the Act (17 CFR 270.30a-2) (certification required by Section 302 of the Sarbanes-Oxley Act of 2002).
(b) Certification required by Rule 30a-2(b) under the Act (certification required by Section 906 of the Sarbanes-Oxley Act of 2002).
SIGNATURES
Pursuant to the requirements of the Securities Exchange Act of 1934 and the Investment Company Act of 1940, the registrant has duly caused this report to be signed on its behalf by the undersigned, thereunto duly authorized.
Sit U.S. Government Securities Fund, Inc.
By (Signature and Title)* | /s/ Paul E. Rasmussen |
| Paul E. Rasmussen |
| Vice President, Treasurer |
Date May 31, 2007
Pursuant to the requirements of the Securities Exchange Act of 1934 and the Investment Company Act of 1940, this report has been signed below by the following persons on behalf of the registrant and in the capacities and on the dates indicated.
By (Signature and Title) | /s/ Paul E. Rasmussen |
| Paul E. Rasmussen |
| Vice President, Treasurer |
Date May 31, 2007
By (Signature and Title) | /s/ Eugene C. Sit |
| Eugene C. Sit |
| Chairman |
Date May 31, 2007
Item 2: Code of Ethics.
The registrant has adopted a code of ethics that applies to the registrant’s principal executive officer, principal financial officer, principal accounting officer, and persons performing similar functions. The registrant has not made any amendment to its code of ethics during the period covered by this report which must be described herein pursuant to Item 2. The registrant has not granted any waivers from any provisions of the code of ethics during the period covered by this report.
A copy of the registrant’s code of ethics is available without charge upon request by calling the registrant at 612-334-5888 or 1-800-332-5580, or by mail at Sit Mutual Funds, 3300 IDS Center, 80 South Eighth Street, Minneapolis, MN 55402.
Item 3: Audit Committee Financial Expert.
The registrant’s Board of Directors has determined that Mr. Melvin C. Bahle, Mr. John P. Fagan, Mr. Sidney L. Jones, Mr. Bruce C. Lueck and Mr. Donald W. Phillips are audit committee financial experts serving on its audit committee. Mr. Bahle, Mr. Fagan, Mr. Jones, Mr. Lueck and Mr. Phillips are independent for purposes of this item.
Item 4: Principal Accountant Fees and Services.
(a) – (d) Aggregate fees billed to the registrant for the last two fiscal years for professional services rendered by the registrant’s principal accountant were as follows:
| | 2007 | | 2006 | |
| | Audit
Fees | | Audit
Related | | Tax
Fees | | Other
Fees | | Audit
Fees | | Audit
Related | | Tax
Fees | | Other
Fees | |
Fiscal year ended March 31 | | | | | | | | | | | | | | | | | |
Sit Mutual Funds II, Inc. | | | | | | | | | | | | | | | | | |
Sit Tax-Free Income Fund (series A) | | 22,000 | | 0 | | 3,975 | | 0 | | 21,600 | | 0 | | 3,860 | | 0 | |
Sit Minnesota Tax-Free Income Fund (series B) | | 18,500 | | 0 | | 3,975 | | 0 | | 18,000 | | 0 | | 3,860 | | 0 | |
Sit Bond Fund (series C) | | 0 | | 0 | | 0 | | 0 | | 0 | | 0 | | 0 | | 0 | |
Sit High Income Municipal Bond Fund (series D) | | 14,000 | | 0 | | 3,975 | | 0 | | 0 | | 0 | | 0 | | 0 | |
Total Mutual Funds II, Inc. | | 54,500 | | 0 | | 11,925 | | 0 | | 39,600 | | 0 | | 7,720 | | 0 | |
Audit fees include amounts related to the audit of the registrant’s annual financial statements and services normally provided by the accountant in connection with statutory and regulatory filings. Audit-related fees include amounts reasonably related to the performance of the audit of the registrant’s financial statements, and/or are traditionally performed by the auditor. Tax fees include amounts related to tax compliance, tax planning, and tax advice. Other Fees include services provided to review the Fund’s order processing and trading procedures.
(e) (1) The Audit Committee is required to pre-approve audit and non-audit services performed for the registrant by the independent auditor in order to assure that the provision of such services does not impair the auditor’s independence. The audit committee also is required to pre-approve certain non-audit services performed by the registrant’s independent auditor for the registrant’s investment adviser and certain of the adviser’s affiliates if the services relate directly to the operations and financial reporting of the registrant. Services to be provided by the auditor must receive general pre-approval or specific pre-approval by the audit committee. Any proposed services exceeding pre-approved cost levels will require separate pre-approval by the audit committee.
The audit committee may delegate pre-approval authority to the audit committee chairman. The chairman shall report any pre-approval decisions to the audit committee at its next scheduled meeting. The audit committee does not delegate its responsibility to pre-approve services performed by the independent auditor to management.
(2) No services included in (b) – (d) were approved pursuant to paragraph (c)(7)(i)(C) of Rule 2-01 of Regulation S-X.
(f) Not applicable.
(g) The aggregate fees billed for the most recent fiscal year and the preceding fiscal year by the registrant’s principal accountant for non-audit services rendered to the registrant, its investment adviser, and any entity controlling, controlled by, or under common control with the investment adviser that provides ongoing services to the registrant were $32,000 and $121,000, respectively.
(h) The registrant’s audit committee has determined that the provision of non-audit services rendered to the registrant’s investment adviser, and any entity controlling, controlled by, or under common control with the investment adviser that provides ongoing services to the registrant, that were not pre-approved pursuant to paragraph (c)(7)(ii) of Rule 2-01 of Regulation S-X is considered compatible with maintaining the principal accountant’s independence.
Item 5: Audit Committee of Listed Registrants.
Not applicable to open-end investment companies.
Item 6: Schedule of Investments.
The schedule of investments is included as part of the report to shareholders filed under Item 1 of this Form.
Item 7: Disclosure of Proxy Voting Policies and Procedures for Closed-End Management Investment Companies.
Not applicable to open-end investment companies.
Item 8: Portfolio Managers of Closed-End Management Investments Companies.
Not applicable to open-end investment companies.
Item 9: Purchases of Equity Securities by Closed-End Management Investment Company and Affiliated Purchasers.
Not applicable to open-end investment companies.
Item 10: Submission of Matters to a vote of Security Holders.
There have been no material changes to the procedures by which shareholders may recommend nominees to the registrant’s board of directors.
Item 11: Controls and Procedures.
(a) Based on their evaluation of the Registrant’s Disclosure Controls and Procedures as of a date within 90 days of the Filing Date, the Registrant’s Chairman and Treasurer have determined that the Disclosure Controls and Procedures (as defined in Rule 30a-2(c) under the Act) are designed to ensure that information required to be disclosed by the Registrant is recorded, processed, summarized and reported by the filing Date, and that information required to be disclosed in the report is communicated to the Registrant’s management, as appropriate, to allow timely decisions regarding required disclosure.
(b) There were no significant changes in the Registrant’s internal controls or in other factors that could significantly affect these controls subsequent to the date of their evaluation, and there were no corrective actions with regard to significant deficiencies and material weaknesses.
Item 12: Exhibits.
(a) The following exhibits are attached to this Form N-CSR:
(2) A separate certification for each principal executive and principal financial officer of the registrant as required by Rule 30a-2(a) under the Act (17 CFR 270.30a-2) (certification required by Section 302 of the Sarbanes-Oxley Act of 2002).
(b) Certification required by Rule 30a-2(b) under the Act (certification required by Section 906 of the Sarbanes-Oxley Act of 2002).
SIGNATURES
Pursuant to the requirements of the Securities Exchange Act of 1934 and the Investment Company Act of 1940, the registrant has duly caused this report to be signed on its behalf by the undersigned, thereunto duly authorized.
Sit Mutual Funds II, Inc.
By (Signature and Title)* | /s/ Paul E. Rasmussen |
| Paul E. Rasmussen |
| Vice President, Treasurer |
Date May 31, 2007
Pursuant to the requirements of the Securities Exchange Act of 1934 and the Investment Company Act of 1940, this report has been signed below by the following persons on behalf of the registrant and in the capacities and on the dates indicated.
By (Signature and Title) | /s/ Paul E. Rasmussen |
| Paul E. Rasmussen |
| Vice President, Treasurer |
Date May 31, 2007
By (Signature and Title) | /s/ Eugene C. Sit |
| Eugene C. Sit |
| Chairman |
Date May 31, 2007
Item 2: Code of Ethics.
The registrant has adopted a code of ethics that applies to the registrant's principal executive officer, principal financial officer, principal accounting officer, and persons performing similar functions. The registrant has not made any amendment to its code of ethics during the period covered by this report which must be described herein pursuant to Item 2. The registrant has not granted any waivers from any provisions of the code of ethics during the period covered by this report.
A copy of the registrant’s code of ethics is available without charge upon request by calling the registrant at 612-334-5888 or 1-800-332-5580, or by mail at Sit Mutual Funds, 3300 IDS Center, 80 South Eighth Street, Minneapolis, MN 55402.
Item 3: Audit Committee Financial Expert.
The registrant’s Board of Directors has determined that Mr. Melvin C. Bahle, Mr. John P. Fagan, Mr. Sidney L. Jones, Mr. Bruce C. Lueck and Mr. Donald W. Phillips are audit committee financial experts serving on its audit committee. Mr. Bahle, Mr. Fagan, Mr. Jones, Mr. Lueck and Mr. Phillips are independent for purposes of this item.
Item 4: Principal Accountant Fees and Services.
(a) – (d) Aggregate fees billed to the registrant for the last two fiscal years for professional services rendered by the registrant’s principal accountant were as follows:
| | Audit
Fees (a) | | Audit
Related
Fees (b) | | Tax
Fees (c) | | Other
Fees (d) | |
Fiscal year ended March 31, 2007 | | 16,300 | | 0 | | 3,975 | | 0 | |
Fiscal year ended March 31, 2006 | | 15,800 | | 0 | | 3,860 | | 0 | |
Audit fees include amounts related to the audit of the registrant’s annual financial statements and services normally provided by the accountant in connection with statutory and regulatory filings. Audit-related fees include amounts reasonably related to the performance of the audit of the registrant’s financial statements, and/or are traditionally performed by the auditor. Tax fees include amounts related to tax compliance, tax planning, and tax advice. Other Fees include services provided to review the Fund’s order processing and trading procedures.
(e) (1) The Audit Committee is required to pre-approve audit and non-audit services performed for the registrant by the independent auditor in order to assure that the provision of such services does not impair the auditor’s independence. The audit committee also is required to pre-approve certain non-audit services performed by the registrant’s independent auditor for the registrant’s investment adviser and certain of the adviser’s affiliates if the services relate directly to the operations and financial reporting of the registrant. Services to be provided by the auditor must receive general pre-approval or specific pre-approval by the audit committee. Any proposed services exceeding pre-approved cost levels will require separate pre-approval by the audit committee.
The audit committee may delegate pre-approval authority to the audit committee chairman. The chairman shall report any pre-approval decisions to the audit committee at its next scheduled meeting. The audit committee does not delegate its responsibility to pre-approve services performed by the independent auditor to management.
(2) No services included in (b) – (d) were approved pursuant to paragraph (c)(7)(i)(C) of Rule 2-01 of Regulation S-X.
(f) Not applicable.
(g) The aggregate fees billed for the most recent fiscal year and the preceding fiscal year by the registrant’s principal accountant for non-audit services rendered to the registrant, its investment adviser, and any entity controlling, controlled by, or under common control with the investment adviser that provides ongoing services to the registrant were $32,000.00 and $121,000, respectively.
(h) The registrant’s audit committee has determined that the provision of non-audit services rendered to the registrant’s investment adviser, and any entity controlling, controlled by, or under common control with the investment adviser that provides ongoing services to the registrant, that were not pre-approved pursuant to paragraph (c)(7)(ii) of Rule 2-01 of Regulation S-X is considered compatible with maintaining the principal accountant’s independence.
Item 5: Audit Committee of Listed Registrants.
Not applicable to open-end investment companies.
Item 6: Schedule of Investments.
The schedule of investments is included as part of the report to shareholders filed under Item 1 of this Form.
Item 7: Disclosure of Proxy Voting Policies and Procedures for Closed-End Management Investment Companies.
Not applicable to open-end investment companies.
Item 8: Portfolio Managers of Closed-End Management Investments Companies.
Not applicable to open-end investment companies.
Item 9: Purchases of Equity Securities by Closed-End Management Investment Company and Affiliated Purchasers.
Not applicable to open-end investment companies.
Item 10. Submission of Matters to a vote of Security Holders.
There have been no material changes to the procedures by which shareholders may recommend nominees to the registrant’s board of directors.
Item 11: Controls and Procedures -
(a) Based on their evaluation of the Registrant's Disclosure Controls and Procedures as of a date within 90 days of the Filing Date, the Registrant's Chairman and Treasurer have determined that the Disclosure Controls and Procedures (as defined in Rule 30a-2(c) under the Act) are designed to ensure that information required to be disclosed by the Registrant is recorded, processed, summarized and reported by the filing Date, and that information required to be disclosed in the report is communicated to the Registrant's management, as appropriate, to allow timely decisions regarding required disclosure.
(b) There were no significant changes in the Registrant's internal controls or in other factors that could significantly affect these controls subsequent to the date of their evaluation, and there were no corrective actions with regard to significant deficiencies and material weaknesses.
Item 12: Exhibits:
(a) The following exhibits are attached to this Form N-CSR:
(2) A separate certification for each principal executive and principal financial officer of the registrant as required by Rule 30a-2(a) under the Act (17 CFR 270.30a-2) (certification required by Section 302 of the Sarbanes-Oxley Act of 2002).
(b) Certification required by Rule 30a-2(b) under the Act (certification required by Section 906 of the Sarbanes-Oxley Act of 2002).
SIGNATURES
Pursuant to the requirements of the Securities Exchange Act of 1934 and the Investment Company Act of 1940, the registrant has duly caused this report to be signed on its behalf by the undersigned, thereunto duly authorized.
Sit Mutual Funds Trust
By (Signature and Title)* | /s/ Paul E. Rasmussen |
| Paul E. Rasmussen |
| Vice President, Treasurer |
Date May 31, 2007
Pursuant to the requirements of the Securities Exchange Act of 1934 and the Investment Company Act of 1940, this report has been signed below by the following persons on behalf of the registrant and in the capacities and on the dates indicated.
By (Signature and Title) | /s/ Paul E. Rasmussen |
| Paul E. Rasmussen |
| Vice President, Treasurer |
Date May 31, 2007
By (Signature and Title) | /s/ Eugene C. Sit |
| Eugene C. Sit |
| Chairman |
Date May 31, 2007