UNITED STATES SECURITIES AND EXCHANGE COMMISSION
Washington, D.C. 20549
FORM N-CSR
- - - - - - - - - - - - -
CERTIFIED SHAREHOLDER REPORT OF REGISTERED
MANAGEMENT INVESTMENT COMPANIES
Investment Company Act file number: 811-04033
- - - - - - - - - - - - -
Sit Mutual Funds II, Inc.
(Exact name of registrant as specified in charter)
3300 IDS Center
80 South Eighth Street
Minneapolis, MN 55402
(Address of principal executive offices)
Paul E. Rasmussen, VP Treasurer
Sit Mutual Funds, Inc.
3300 IDS Center
80 South Eighth Street
Minneapolis, MN 55402
(Name and address of agent for service)
Registrant’s telephone number, including area code:
(612) 332-3223
Date of fiscal year end: March 31, 2024
Date of reporting period: March 31, 2024
Item 1: Reports to Stockholders
Annual Report March 31, 2024 U.S. Government Securities Fund Quality Income Fund Tax-Free Income Fund Minnesota Tax-Free Income Fund Beginning with the Funds’ September 30, 2024 semi-annual report, as required by regulations adopted by the U.S. Securities and Exchange Commission, the Funds will transmit tailored annual and semi-annual reports to shareholders that highlight key information deemed important for retail investors to assess and monitor their fund investments. Other information, including financial statements, portfolio holdings, and financial highlights, will not appear in the tailored shareholder reports transmitted to shareholders, but must be available online, delivered free of charge upon request, and filed on a semiannual basis on Form N-CSR. If you previously elected to receive the Funds’ shareholder reports electronically, you will continue to receive them electronically. Otherwise, the Funds’ shareholder reports will be mailed to you via USPS. If you would like to receive the Funds’ shareholder reports and other Fund communications electronically instead of by mail, please log into your account at www.sitfunds.com or call 800-332-5580. Sit Mutual Funds
|
|
| Sit Mutual Funds |
| BOND FUNDS ANNUAL REPORT |
TABLE OF CONTENTS |
This document must be preceded or accompanied by a Prospectus.
CHAIRMAN’S LETTER
May 6, 2024
Dear fellow shareholders:
The U.S. fixed income markets have been in an extended transitional phase during the twelve months ended March 31, 2024. This period encompassed the end of a highly aggressive tightening operation by the Federal Reserve, a transitory shift to a neutral holding pattern, and cautious steps towards a prospective new regime of easier monetary policy. The initial heady successes in the Fed’s war on inflation last summer were followed by stalled momentum over the last mile to the finish line. Over this 12-month period, the economy cooperated optimally by cooling but averting even a soft landing and a significant rise in unemployment rates. This period has also been memorable for major bond market movements due to shifting investor expectations over the commencement and extent of interest rate cuts that remain on the horizon.
A Bumpy Road Along the Last Mile
The Fed pivoted last summer after raising the Fed Funds rate at ten consecutive FOMC meetings. It left the rate unchanged in its June 2023 meeting, then raised it one final quarter point on July 26, 2023. This coincided with a steep decline in the Consumer Price Index from a 40-year peak of 9.1% in June 2022 to 3.2% in July 2023. However, there has been no clear improvement in inflation since then, and the Fed Funds rate has remained static through five subsequent FOMC meetings at the level of 5.25% to 5.50% (the highest since 2001). In late 2023, Fed officials began unequivocally communicating that rate cuts were coming in 2024. The Federal Reserve has curtailed reinvestment of cash generated by its massive holdings of Treasury bonds and mortgage-backed securities since mid-2022. However, Chairman Powell stated after its March 2024 FOMC meeting that the Fed may also soon begin tapering this runoff. Meanwhile, the Fed sharply contracted aggregate money supply.
The bond market initially responded to positive data on inflation and signs of moderating growth with a strong rally through the first quarter of 2023, pricing in a view that the Fed would soon reach its stated goal of 2% inflation (per the core price index for personal consumption expenditures) with a potential soft landing (i.e., short, mild recession). The most deeply inverted Treasury bond yield curve since 1981 was taken as a strong signal of impending recession. However, by late summer 2023 as inflation progress stalled, a “higher for longer” outlook took hold. The 10-year U.S. Treasury bond yield began to back up sharply from 3.47% on March 31, 2023, to peak at 4.98% on October 19, 2023, exceeding the previous cyclical high set in 2022 by 73 basis points.
This bear market reversed course abruptly again following the FOMC meeting on November 1, 2023, due to softer economic data and dovish comments from Powell. The 2024 Fed forecast from its December meeting showed a projected 75 basis points median decline in the fed funds rate for 2024, up from 50 basis points
previously. Chairman Powell also acknowledged the Fed would likely begin cutting rates before the 2.0% inflation target is achieved, to avoid having the now higher real Fed Funds rate eventually sink the economy. The strong year-end rally erased much of the sell-off, as the 10-year yield fell to 3.88% by December 31. However, bond market impatience with the pace of progress with inflation waned in the first quarter of 2024. The 10-year US Treasury yield crept up to 4.20% on March 31, 2024, 73 points higher than a year prior. For the twelve-month period ended March 31, 2024, the Bloomberg U.S. Aggregate Bond Index returned 1.70%. The Bloomberg Municipal Bond Index return was 3.13%.
Looking Ahead to the Finish Line
The Fed did not move exclusively in 25 basis point increments when raising rates. Ultimately, we do not think the magnitude of a rate cut at any individual Fed meeting matters. Instead, we are focused on the cumulative magnitude of cuts in the coming quarters. Additionally, compared to our peers we are less focused on trying to forecast where rates will be at the end of the calendar year. We believe looking further forward is warranted when forecasting the pace and magnitude of potential cuts - as projected 2025 Fed actions will have a growing impact on interest rates as 2024 progresses.
Overall, we believe the gap between the current rate target of 5.25% to 5.50% and core inflation of closer to 2.5% gives the Fed ample room to lower rates while continuing to be restrictive to both keep inflation subdued and maintain an appearance of being politically impartial through the election season. Under our base case expectation for an economic “soft landing,” continued growth and subdued inflation within 0.5% of the Fed’s 2% target should allow them to lower the headline rate by up to 1.25 - 1.50 percentage points in the next 12 months while continuing to maintain a contractionary monetary policy stance in 2025.
Taxable Fixed Income Strategy
Despite our optimism about the prospects for the economy to avoid entering a recession, we have reduced our overweight to non-government guaranteed bonds, where appropriate, due to meaningful recent spread narrowing. At current levels, credit spreads are near 10-year lows. We think spreads are being heavily influenced by an overall increase in investor demand for bonds with credit risk now that yields are higher overall. However, we believe that the absolute level of yields on non-government securities will also act as a shock absorber and not keep up with the broader bond market once interest rates start to fall. As a result, we have increased portfolio positions in Treasury, asset-backed, and mortgage-backed securities (where appropriate). We believe the second-order effects of the yield curve
| | |
| | |
| 2 | | SIT MUTUAL FUNDS ANNUAL REPORT |
returning to its normal upward-sloping shape will drive renewed demand for mortgage-related investments and that mortgage-backed securities are poised to do well later this year.
Our outlook for returns in 2024 remains centered on attractive interest income levels, particularly in the three-to-six-year segment of the yield curve. We intend to enhance exposure to mortgage-backed securities within client portfolios while selectively reducing allocations in credit sectors when appropriate. While we maintain a projection of a soft landing for the economy, there has been a notable shift in the risk balance within credit sectors. Corporate spreads have tightened considerably in recent months, making mortgages comparatively more appealing.
Bond maturities closely mirror those of the overall market, with a focus on the midsection of the curve and a slight underweighting in longer maturities. Anticipating a pronounced decline in rates across the mid-curve once the Fed commits to easing, we foresee longer maturity yields remaining relatively stable due to ongoing economic expansion and concerns about potential inflation resurgence. Even as we prioritize higher-quality assets, we maintain a robust income advantage over the overall market. We expect this income advantage to persist as a significant driver of relative performance over time.
Municipal Fixed Income Strategy
We are cautiously optimistic in our current outlook for the tax-exempt municipal bond market. Municipal bonds significantly outpaced other fixed income markets over the last twelve months, particularly during the historic bond market rally in the fourth quarter of 2023 and into early 2024. This left spreads of tax-exempt bonds to Treasury bonds tight by historic standards. However, real yields remain attractive on a selective basis, moderately below the cyclical peaks of six months ago. Tax-exempt bond mutual fund flows were positive in the first quarter, reversing an outflow cycle that persisted through most of last year. The municipal market outperformed, notwithstanding a 25% jump in issuance in the first quarter of 2024. State and local government credits are in excellent shape to weather a potential moderate recession. Municipal bonds continue to experience far fewer defaults than corporate bonds of comparable ratings. High-yield, unrated municipal bonds have particularly outperformed in this environment and experienced exceptional demand in the face of light supply. Furthermore, demand for tax-exempt income should remain strong, as we even foresee federal income tax rates possibly rising over the intermediate term for investors in municipal bonds.
The main determinant of municipal bond market performance will continue to be the direction of the Treasury bond market. We will seek opportunities created by any intermittent market reversals
to selectively add to positions. Our portfolios are designed to earn higher yield while positioned with longer duration than benchmarks. Our focus on income-oriented investments and specialty sectors where we can exploit pricing inefficiencies should do well in this market environment. We continue to emphasize single-family housing bonds, select high-yield and revenue bond issues where we can utilize our institutional expertise to find undervalued bonds offering additional spread. We believe our portfolios are appropriately positioned for the current environment.
In conclusion, investors should maintain a well-diversified portfolio of stocks and bonds underpinned by strong fundamentals to help manage risk in this challenging market. We appreciate your continued interest in the Sit family of funds.
With best wishes,

Roger J. Sit
Chairman and President Sit Mutual Funds
| | | | |
Sit U.S. Government Securities Fund - Class S and Class Y |
OBJECTIVE & STRATEGY
The objective of the Sit U.S. Government Securities Fund is to provide high current income and safety of principal, which it seeks to attain by investing solely in debt obligations issued, guaranteed or insured by the U.S. government or its agencies or its instrumentalities. Agency mortgage securities and U.S. Treasury securities are the principal holdings in the Fund. The mortgage securities that the Fund purchases consist of pass-through securities including those issued by Government National Mortgage Association (GNMA), Federal National Mortgage Association (FNMA) and Federal Home Loan Mortgage Corporation (FHLMC).
Fund Performance
The Sit U.S. Government Securities Fund (Class S) provided a return of +1.64% during the 12-month period ended March 31, 2024, compared to the return of the Bloomberg Intermediate Government Bond Index of +1.65%. The Fund’s 30-day SEC yield was 4.28% and its 12-month distribution rate was 3.39%.
Factors that Influenced the Fund’s Performance
During the 12-month period, the Fund benefited from the consistent relatively high level of income provided by its holdings in higher coupon government agency mortgages. Yields on U.S. Treasury securities were higher across all maturities. The Fund reduces interest rate risk by using options on Treasury securities. The use of options was effective in providing stability to the Fund’s net asset value but detracted from overall performance. The Fund continued to experience relatively stable prepayment rates as the mortgage holdings are generally well-seasoned and have been through many refinancing cycles. Mortgage pass-through holdings and collateralized mortgage obligations outperformed during the period as yield spreads continue to narrow as investors believe we have reached the end of the Federal Reserve’s (Fed) interest rate hiking cycle. The Fund’s holdings in U.S. Treasury securities matched the performance of the benchmark.
Outlook and Positioning
The inflation rate continues to be heavily scrutinized to determine when the Fed will cut short-term interest rates. Economic indicators have whipsawed investors with respect to the timing of the Fed’s eventual cut in short-term interest rates. The Fed has achieved an environment with decelerating inflation as year-over-year core PCE, the Fed’s preferred inflation metric, has fallen from 4.8% to start the period to 2.8%. However, the Fed continues to be weary of cutting interest rates too soon, but as it stands, it appears to have achieved the Goldilocks scenario of lowering inflation without causing a widely anticipated recession. The question remains whether the Fed will hold rates too high for too long and cause the recession that they have previously avoided. The tail-winds of supply chain normalization and depleted savings will continue to drive the inflation rate toward the Fed’s target. We expect that the Fed will be slightly behind when it comes to reducing interest rates but will make up for it with greater than 0.25% cuts, which the market is not currently projecting. We expect 30-year mortgage rates to decline over
HYPOTHETICAL GROWTH OF $10,000
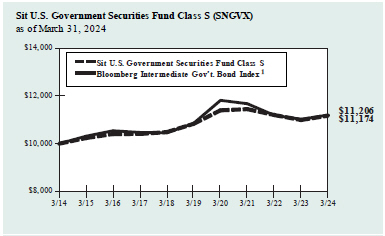
The chart above illustrates the total value of a hypothetical $10,000 investment in the Fund over the past 10 years (or for the life of the Fund if shorter) as compared to the performance of the Bloomberg Intermediate Government Bond Index. Past performance does not guarantee future results. Returns include the reinvestment of distributions. The chart does not reflect the deduction of taxes that a shareholder would pay on Fund distributions or the redemption of Fund shares.
1 The Bloomberg Intermediate Government Bond Index is a sub-index of the Bloomberg Government Bond Index covering issues with remaining maturities of between three and five years. The Bloomberg Government Bond Index is an index that measures the performance of all public U.S. government obligations with remaining maturities of one year or more. The returns include the reinvestment of income and do not include any transaction costs, management fees or other costs. It is not possible to invest directly in an index. This is the Fund’s primary index.
the upcoming year as the banking sector has more flexibility and clarity with respect to interest rates. Housing affordability is extremely low, but we anticipate an increase in the upcoming year. Mortgage prepayments should remain low from reduced refinancing activity and lower housing turnover due to higher interest rates.
We have positioned the portfolio for the eventual yield curve normalization when the Fed signals that it has reached its inflation goals. The Fund’s focus on seasoned, high coupon agency mortgage securities provides a high level of income which has been a fundamental focus of the Fund since its inception.
| | |
Bryce A. Doty, CFA | | Mark H. Book, CFA |
Senior Portfolio Manager | | Portfolio Manager |
| | |
| |
| Information on this page is unaudited. | | |
| | |
| 4 | | SIT MUTUAL FUNDS ANNUAL REPORT |
COMPARATIVE RATES OF RETURNS
as of March 31, 2024
| | | | | | | | | | | | | | | | |
| | | Sit U.S. Government | | | | |
| | | Securities Fund | | | | |
| | | Class S | | Class Y | | Bloomberg Intermediate Gov’t. Bond Index1 | | Lipper U.S. Gov’t Fund Index2 |
One Year | | | 1.64 | % | | | 1.91 | % | | | 1.65 | % | | | -0.18 | % |
Five Year | | | 0.62 | | | | n/a | | | | 0.64 | | | | -0.44 | |
Ten Year | | | 1.12 | | | | n/a | | | | 1.14 | | | | 0.91 | |
| Since Inception-Class S (6/2/87) | | | 4.56 | | | | n/a | | | | 4.70 | | | | 4.46 | |
| Since Inception-Class Y (1/1/20) | | | n/a | | | | 0.50 | | | | -0.07 | | | | -1.49 | |
| | | | | | | | | | | | | | | | | |
Performance figures are historical and do not guarantee future results. Investment returns and principal value will vary, and you may have a gain or loss when you sell shares. Current performance may be lower or higher than the performance data quoted. Contact the Fund for performance data current to the most recent month-end. Returns include changes in share price as well as reinvestment of all dividends and capital gains and all fee waivers. Without the fee waivers total return and yield figures would have been lower. Returns do not reflect the deduction of taxes that a shareholder would pay on Fund distributions or the redemption of Fund shares. Management fees and administrative expenses are included in the Fund’s performance. Returns for periods greater than one year are compounded average annual rates of return.
1 The Bloomberg Intermediate Government Bond Index is a sub-index of the Bloomberg Government Bond Index covering issues with remaining maturities of between three and five years. The Bloomberg Government Bond Index is an index that measures the performance of all public U.S. government obligations with remaining maturities of one year or more. The returns include the reinvestment of income and do not include any transaction costs, management fees or other costs. It is not possible to invest directly in an index.
2 The Lipper returns are obtained from Lipper Analytical Services, Inc., a large independent evaluator of mutual funds.
| | | | |
| FUND DIVERSIFICATION | | | | |
| |
Collateralized Mortgage Obligations | | | 70.6 | % |
| |
Government National Mortgage Association | | | 11.5 | |
| |
Federal Home Loan Mortgage Corporation | | | 7.1 | |
| |
Federal National Mortgage Association | | | 6.9 | |
| |
Asset-Backed Securities | | | 1.1 | |
| |
U.S. Treasury / Federal Agency Securities | | | 1.0 | |
| |
Small Business Administration | | | 0.4 | |
| |
Other Net Assets | | | 1.4 | |
| |
| Based on net assets as of March 31, 2024. | | | |
| | | | | | | | |
| PORTFOLIO SUMMARY | | | | | | | | |
| | |
Class S: | | | | | | | | |
Net Asset Value 3/31/24: | | | $10.17 Per Share | | | | | |
Net Asset Value 3/31/23: | | | $10.35 Per Share | | | | | |
Net Assets: | | | $182.2 Million | | | | | |
| | |
Class Y: | | | | | | | | |
Net Asset Value 3/31/24: | | | $10.17 Per Share | | | | | |
Net Asset Value 3/31/23: | | | $10.35 Per Share | | | | | |
Net Assets: | | | $65.3 Million | | | | | |
| | |
Average Maturity | | | 23.5 Years | | | | | |
Effective Duration:3 | | | 3.0 Years | | | | | |
3 Duration is a measure of estimated price sensitivity relative to changes in interest rates. Portfolios with longer durations are typically more sensitive to changes in interest rates. For example, if interest rates rise by 1%, the fair value of a security with an effective duration of 5 years would decrease by 5%, with all other factors being constant. The correlation between duration and price sensitivity is greater for securities rated investment-grade than it is for securities rated below investment-grade. Duration estimates are based on assumptions by Sit Investment Associates, Inc. (the “Adviser”) and are subject to a number of limitations. Effective duration is calculated based on historical price changes of securities held by the Fund, and therefore is a more accurate estimate of price sensitivity provided interest rates remain within their historical range.
| | |
| ESTIMATED AVERAGE LIFE | | |
| |
0-1 Year | | 1.2% |
1-5 Years | | 94.7 |
5-10 Years | | 3.1 |
10-20 Years | | 1.0 |
| | | |
The table represents the Adviser’s estimates of the dollar weighted average life of the portfolio’s securities, which differ from their stated maturities. The Fund’s average stated maturity was 23.5 years as of 3/31/2024.
| | |
| |
| Information on this page is unaudited. | | |
| | |
| MARCH 31, 2024 | | 5 |
SCHEDULE OF INVESTMENTS
March 31, 2024
Sit U.S. Government Securities Fund
| | | | | | | | | | | | | | | | | | | | |
| | | | | | |
Principal Amount ($) | | | | | Coupon Rate (%) | | | | | Maturity Date | | | Fair Value ($) |
|
| | Mortgage Pass-Through Securities - 25.9% | |
| | Federal Home Loan Mortgage Corporation - 7.1% | |
| | 240,491 | | | | | | 2.00 | | | | | | | | 8/1/41 | | | | 202,725 | |
| | 1,018,057 | | | | | | 4.50 | | | | | | | | 7/1/52 | | | | 974,296 | |
| | 335,935 | | | | | | 5.00 | | | | | | | | 7/1/35 | | | | 338,389 | |
| | 306,761 | | | | | | 5.00 | | | | | | | | 5/1/42 | | | | 305,985 | |
| | 499,999 | | | | | | 5.50 | | | | | | | | 9/1/52 | | | | 500,599 | |
| | 44,073 | | | | | | 5.82 | | | | | | | | 10/1/37 | | | | 45,560 | |
| | 5,183,520 | | | | | | 6.00 | | | | | | | | 11/1/38 | | | | 5,268,548 | |
| | 388,511 | | | | | | 6.00 | | | | | | | | 6/1/52 | | | | 393,231 | |
| | 226,226 | | | | | | 6.50 | | | | | | | | 12/1/34 | | | | 228,306 | |
| | 2,365,352 | | | | | | 6.50 | | | | | | | | 11/1/53 | | | | 2,417,521 | |
| | 106,058 | | | | | | 6.88 | | | | | | | | 2/17/31 | | | | 107,449 | |
| | 7,427 | | | | | | 7.00 | | | | | | | | 8/1/27 | | | | 7,406 | |
| | 174,001 | | | | | | 7.00 | | | | | | | | 4/1/37 | | | | 179,175 | |
| | 2,299,046 | | | | | | 7.00 | | | | | | | | 10/1/37 | | | | 2,379,582 | |
| | 1,292,232 | | | | | | 7.00 | | | | | | | | 10/1/38 | | | | 1,349,736 | |
| | 2,339,300 | | | | | | 7.00 | | | | | | | | 11/1/53 | | | | 2,412,500 | |
| | 813 | | | | | | 7.38 | | | | | | | | 12/17/24 | | | | 809 | |
| | 139,169 | | | | | | 7.50 | | | | | | | | 1/1/32 | | | | 143,812 | |
| | 92,029 | | | | | | 7.50 | | | | | | | | 8/1/32 | | | | 92,608 | |
| | 52,235 | | | | | | 8.00 | | | | | | | | 1/1/37 | | | | 55,192 | |
| | 47,998 | | | | | | 8.50 | | | | | | | | 3/1/31 | | | | 49,856 | |
| | 2,111 | | | | | | 9.00 | | | | | | | | 5/1/31 | | | | 2,119 | |
| | 95 | | | | | | 10.00 | | | | | | | | 7/1/30 | | | | 95 | |
| | | | | | | | | | | | | | | | | | | | |
| | | | | |
| | | | | | | | | | | | | | | | | | | 17,455,499 | |
| | | | | | | | | | | | | | | | | | | | |
| | Federal National Mortgage Association - 6.9% | |
| | 197,405 | | | | | | 3.50 | | | | | | | | 10/1/34 | | | | 187,391 | |
| | 4,775,681 | | | | | | 4.50 | | | | | | | | 7/1/52 | | | | 4,551,807 | |
| | 4,863,836 | | | | | | 4.50 | | | | | | | | 9/1/52 | | | | 4,635,831 | |
| | 345,866 | | | | | | 5.00 | | | | | | | | 6/1/51 | | | | 356,132 | |
| | 1,813,525 | | | | | | 5.00 | | | | | | | | 7/1/52 | | | | 1,748,361 | |
| | 140,326 | | | | | | 5.50 | | | | | | | | 6/1/33 | | | | 139,612 | |
| | 448,366 | | | | | | 5.50 | | | | | | | | 4/1/50 | | | | 453,059 | |
| | 738,965 | | | | | | 5.93 | | | | | | | | 5/1/35 | | | | 736,044 | |
| | 56,884 | | | | | | 6.00 | | | | | | | | 5/1/37 | | | | 58,175 | |
| | 40,307 | | | | | | 6.00 | | | | | | | | 9/1/37 | | | | 39,950 | |
| | 1,441,245 | | | | | | 6.00 | | | | | | | | 11/1/38 | | | | 1,464,886 | |
| | 86,498 | | | | | | 6.50 | | | | | | | | 6/1/31 | | | | 87,324 | |
| | 26,538 | | | | | | 6.50 | | | | | | | | 8/1/34 | | | | 26,538 | |
| | 124,414 | | | | | | 6.50 | | | | | | | | 1/1/39 | | | | 123,427 | |
| | 1,419,234 | | | | | | 6.50 | | | | | | | | 10/1/53 | | | | 1,436,234 | |
| | 60,824 | | | | | | 7.00 | | | | | | | | 7/1/33 | | | | 61,045 | |
| | 41,329 | | | | | | 7.00 | | | | | | | | 7/1/34 | | | | 41,932 | |
| | 9,753 | | | | | | 7.00 | | | | | | | | 12/1/37 | | | | 9,758 | |
| | 248,988 | | | | | | 7.00 | | | | | | | | 1/1/40 | | | | 256,779 | |
| | 426,901 | | | | | | 7.00 | | | | | | | | 9/1/47 | | | | 418,134 | |
| | 20,043 | | | | | | 7.50 | | | | | | | | 4/1/32 | | | | 19,953 | |
| | 74,506 | | | | | | 7.50 | | | | | | | | 1/1/34 | | | | 75,961 | |
| | 831 | | | | | | 8.00 | | | | | | | | 8/20/25 | | | | 828 | |
| | 66,628 | | | | | | 8.00 | | | | | | | | 1/1/32 | | | | 67,503 | |
| | 42,149 | | | | | | 8.00 | | | | | | | | 11/1/37 | | | | 44,258 | |
| | 2,741 | | | | | | 8.05 | | | | | | | | 7/20/30 | | | | 2,738 | |
| | 26,236 | | | | | | 8.18 | | | | | | | | 11/15/31 | | | | 27,008 | |
| | 65,821 | | | | | | 8.50 | | | | | | | | 1/1/37 | | | | 66,431 | |
| | 353 | | | | | | 9.00 | | | | | | | | 6/15/25 | | | | 352 | |
| | 11,390 | | | | | | 9.00 | | | | | | | | 5/15/28 | | | | 11,359 | |
| | 15,285 | | | | | | 9.00 | | | | | | | | 7/1/31 | | | | 15,248 | |
| | 2,066 | | | | | | 9.50 | | | | | | | | 8/1/24 | | | | 2,059 | |
| | | | | | | | | | | | | | | | | | | | |
| | | | | |
| | | | | | | | | | | | | | | | | | | 17,166,117 | |
| | | | | | | | | | | | | | | | | | | | |
| | | | | | | | | | | | | | | | | | | | |
| | | | | | |
Principal Amount ($) | | | | | Coupon Rate (%) | | | | | Maturity Date | | | Fair Value ($) |
|
| | Government National Mortgage Association - 11.5% | |
| | 16,129 | | | | | | 4.00 | | | | | | | | 12/15/24 | | | | 15,980 | |
| | 497,160 | | | | | | 4.00 | | | | | | | | 12/20/31 | | | | 480,838 | |
| | 375,417 | | | | | | 4.25 | | | | | | | | 10/20/31 | | | | 365,896 | |
| | 280,834 | | | | | | 4.25 | | | | | | | | 3/20/37 | | | | 270,039 | |
| | 400,153 | | | | | | 5.00 | | | | | | | | 7/20/49 | | | | 395,344 | |
| | 19,365 | | | | | | 5.50 | | | | | | | | 9/15/25 | | | | 19,320 | |
| | 300,321 | | | | | | 5.50 | | | | | | | | 7/20/37 | | | | 307,549 | |
| | 348,665 | | | | | | 5.50 | | | | | | | | 5/20/40 | | | | 357,006 | |
| | 660,614 | | | | | | 5.50 | | | | | | | | 7/20/62 | | | | 655,687 | |
| | 9,190,289 | | | | | | 5.50 | | | | | | | | 8/20/62 | | | | 9,134,737 | |
| | 447,371 | | | | | | 5.75 | | | | | | | | 10/20/31 | | | | 452,604 | |
| | 280,158 | | | | | | 6.00 | | | | | | | | 7/20/29 | | | | 283,883 | |
| | 323,503 | | | | | | 6.00 | | | | | | | | 10/20/32 | | | | 329,616 | |
| | 365,881 | | | | | | 6.00 | | | | | | | | 8/20/38 | | | | 380,817 | |
| | 137,911 | | | | | | 6.00 | | | | | | | | 2/20/47 | | | | 143,538 | |
| | 1,597,366 | | | | | | 6.00 | | | | | | | | 7/20/47 | | | | 1,662,541 | |
| | 6,750,649 | | | | | | 6.00 | | | | | | | | 8/20/62 | | | | 6,763,880 | |
| | 14,898 | | | | | | 6.50 | | | | | | | | 12/20/38 | | | | 14,712 | |
| | 128,289 | | | | | | 6.50 | | | | | | | | 1/20/39 | | | | 130,556 | |
| | 69,133 | | | | | | 6.50 | | | | | | | | 2/20/39 | | | | 70,994 | |
| | 154,362 | | | | | | 6.50 | | | | | | | | 4/20/39 | | | | 160,463 | |
| | 162,618 | | | | | | 6.50 | | | | | | | | 6/20/39 | | | | 170,901 | |
| | 322,144 | | | | | | 6.50 | | | | | | | | 8/20/39 | | | | 338,282 | |
| | 169,674 | | | | | | 6.50 | | | | | | | | 4/20/43 | | | | 173,267 | |
| | 97,438 | | | | | | 7.00 | | | | | | | | 10/15/36 | | | | 97,727 | |
| | 1,189,310 | | | | | | 7.00 | | | | | | | | 12/20/52 | | | | 1,216,605 | |
| | 184,654 | | | | | | 7.50 | | | | | | | | 4/15/34 | | | | 188,171 | |
| | 2,047,933 | | | | | | 8.00 | | | | | | | | 10/20/48 | | | | 2,103,859 | |
| | 1,684,039 | | | | | | 8.00 | | | | | | | | 10/20/53 | | | | 1,730,839 | |
| | | | | | | | | | | | | | | | | | | | |
| | | | | |
| | | | | | | | | | | | | | | | | | | 28,415,651 | |
| | | | | | | | | | | | | | | | | | | | |
|
| | Small Business Administration - 0.4% | |
| | 1,159,059 | | | | | | 5.33 | | | | | | | | 8/25/36 | | | | 1,099,600 | |
| | | | | | | | | | | | | | | | | | | | |
| | | | | |
| | | | | | | | | | | | | | | | | | | 1,099,600 | |
| | | | | | | | | | | | | | | | | | | | |
| |
| | Total Mortgage Pass-Through Securities | | | | 64,136,867 | |
| | | | | | | | | | | | | | | | | | | | |
| | (cost: $65,658,621) | | | | | | | | | | | | | |
|
| | U.S. Treasury / Federal Agency Securities - 1.0% | |
| | U.S. Treasury Bonds: | |
| | | | | |
| | 2,850,000 | | | | | | 3.63 | | | | | | | | 2/15/53 | | | | 2,507,332 | |
| | | | | | | | | | | | | | | | | | | | |
| |
| | Total U.S. Treasury / Federal Agency Securities | | | | 2,507,332 | |
| | | | | | | | | | | | | | | | | | | | |
| | (cost: $2,711,790) | | | | | | | | | | | | | |
|
| | Collateralized Mortgage Obligations - 70.6% | |
|
| | Federal Home Loan Mortgage Corporation - 11.7% | |
| | 747,995 | | | | | | 4.59 | | | | | | | | 7/25/32 | 1 | | | 715,487 | |
| | 1,597,068 | | | | | | 5.00 | | | | | | | | 2/25/51 | | | | 1,574,054 | |
| | 5,244,279 | | | | | | 5.00 | | | | | | | | 11/25/50 | 1 | | | 5,028,684 | |
| | 4,697,654 | | | | | | 5.50 | | | | | | | | 6/25/51 | | | | 4,738,131 | |
| | 541,952 | | | | | | 6.00 | | | | | | | | 4/15/30 | | | | 547,040 | |
| | 1,036,081 | | | | | | 6.00 | | | | | | | | 5/15/36 | | | | 1,066,022 | |
| | 685,531 | | | | | | 6.00 | | | | | | | | 6/15/37 | | | | 708,846 | |
| | 945,538 | | | | | | 6.00 | | | | | | | | 9/15/42 | | | | 953,206 | |
| | 2,692,400 | | | | | | 6.00 | | | | | | | | 9/25/52 | | | | 2,747,393 | |
| | 104,279 | | | | | | 6.50 | | | | | | | | 8/15/31 | | | | 107,301 | |
| | 108,482 | | | | | | 6.50 | | | | | | | | 1/15/32 | | | | 110,821 | |
| | 263,780 | | | | | | 6.50 | | | | | | | | 6/25/32 | | | | 263,352 | |
| | 99,171 | | | | | | 6.50 | | | | | | | | 7/15/32 | | | | 102,336 | |
| | 545,599 | | | | | | 6.50 | | | | | | | | 5/15/35 | | | | 569,534 | |
| | |
| |
| See accompanying notes to financial statements. | | |
| | |
| 6 | | SIT MUTUAL FUNDS ANNUAL REPORT |
| | | | | | | | | | | | | | | | | | | | |
Principal Amount ($) | | | | | Coupon Rate (%) | | | | Maturity Date | | | Fair Value ($) |
| | | | | |
| | 243,204 | | | | | | 6.50 | | | | | | | | 8/15/39 | | | | 255,588 | |
| | 823,224 | | | | | | 6.50 | | | | | | | | 2/25/43 | | | | 836,718 | |
| | 297,139 | | | | | | 6.50 | | | | | | | | 3/25/43 | | | | 297,833 | |
| | 607,673 | | | | | | 6.50 | | | | | | | | 10/25/43 | | | | 612,716 | |
| | 1,549,367 | | | | | | 6.50 | | | | | | | | 8/15/45 | | | | 1,675,816 | |
| | 100,917 | | | | | | 7.00 | | | | | | | | 8/15/29 | | | | 102,808 | |
| | 600,000 | | | | | | 7.00 | | | | | | | | 12/15/40 | | | | 649,513 | |
| | 1,570,315 | | | | | | 7.00 | | | | | | | | 3/25/43 | | | | 1,633,693 | |
| | 2,122,605 | | | | | | 7.00 | | | | | | | | 7/25/43 | | | | 2,203,229 | |
| | 922,972 | | | | | | 7.00 | | | | | | | | 3/15/49 | | | | 976,719 | |
| | 547,859 | | | | | | 7.50 | | | | | | | | 9/25/43 | | | | 556,304 | |
| | | | | | | | | | | | | | | | | | | | |
| | | | | |
| | | | | | | | | | | | | | | | | | | 29,033,144 | |
| | | | | | | | | | | | | | | | | | | | |
| | Federal National Mortgage Association - 18.2% | | | | | |
| | 310,535 | | | | | | 3.84 | | | | | | | | 8/25/43 | 1 | | | 287,408 | |
| | 135,746 | | | | | | 4.55 | | | | | | | | 6/25/43 | | | | 133,439 | |
| | 1,748,521 | | | | | | 5.00 | | | | | | | | 7/25/33 | | | | 1,708,502 | |
| | 230,122 | | | | | | 5.00 | | | | | | | | 11/25/41 | | | | 227,100 | |
| | 3,155,221 | | | | | | 5.00 | | | | | | | | 11/25/50 | | | | 3,065,473 | |
| | 3,633,783 | | | | | | 5.00 | | | | | | | | 12/25/50 | | | | 3,606,776 | |
| | 399,163 | | | | | | 5.00 | | | | | | | | 1/25/51 | | | | 388,427 | |
| | 1,952,245 | | | | | | 5.25 | | | | | | | | 8/25/49 | | | | 1,930,257 | |
| | 1,864,675 | | | | | | 5.27 | | | | | | | | 12/25/42 | 1 | | | 1,840,221 | |
| | 408,750 | | | | | | 5.36 | | | | | | | | 6/25/42 | | | | 411,460 | |
| | 424,867 | | | | | | 5.50 | | | | | | | | 9/25/33 | | | | 423,326 | |
| | 593,721 | | | | | | 5.50 | | | | | | | | 6/25/40 | | | | 593,814 | |
| | 996,450 | | | | | | 5.50 | | | | | | | | 1/25/49 | | | | 990,681 | |
| | 1,364,675 | | | | | | 5.62 | | | | | | | | 11/25/33 | | | | 1,341,322 | |
| | 564,132 | | | | | | 5.64 | | | | | | | | 12/25/53 | 1 | | | 574,989 | |
| | 246,524 | | | | | | 5.75 | | | | | | | | 8/25/33 | | | | 245,137 | |
| | 472,453 | | | | | | 5.81 | | | | | | | | 8/25/43 | | | | 460,902 | |
| | 98,267 | | | | | | 6.00 | | | | | | | | 11/25/32 | | | | 100,115 | |
| | 545,231 | | | | | | 6.00 | | | | | | | | 9/25/35 | | | | 551,944 | |
| | 152,790 | | | | | | 6.00 | | | | | | | | 6/25/36 | | | | 157,004 | |
| | 569,454 | | | | | | 6.00 | | | | | | | | 10/25/36 | | | | 582,501 | |
| | 1,318,618 | | | | | | 6.00 | | | | | | | | 11/25/43 | | | | 1,337,235 | |
| | 1,819,631 | | | | | | 6.00 | | | | | | | | 6/25/44 | | | | 1,846,454 | |
| | 427,494 | | | | | | 6.00 | | | | | | | | 8/25/44 | | | | 433,388 | |
| | 500,702 | | | | | | 6.00 | | | | | | | | 9/25/46 | | | | 510,090 | |
| | 671,508 | | | | | | 6.00 | | | | | | | | 2/25/48 | | | | 699,484 | |
| | 1,450,000 | | | | | | 6.00 | | | | | | | | 10/25/53 | | | | 1,512,805 | |
| | 590,369 | | | | | | 6.28 | | | | | | | | 8/25/47 | 1 | | | 606,012 | |
| | 921,518 | | | | | | 6.48 | | | | | | | | 9/25/37 | 1 | | | 894,191 | |
| | 168,677 | | | | | | 6.50 | | | | | | | | 6/25/32 | | | | 173,738 | |
| | 1,250,933 | | | | | | 6.50 | | | | | | | | 11/25/41 | | | | 1,258,689 | |
| | 1,120,329 | | | | | | 6.50 | | | | | | | | 7/25/42 | | | | 1,157,983 | |
| | 2,083,664 | | | | | | 6.50 | | | | | | | | 12/25/43 | | | | 2,106,850 | |
| | 296,377 | | | | | | 6.66 | | | | | | | | 8/25/37 | 1 | | | 292,585 | |
| | 221,490 | | | | | | 6.70 | | | | | | | | 9/25/37 | 1 | | | 219,863 | |
| | 291,975 | | | | | | 6.75 | | | | | | | | 4/25/37 | | | | 289,752 | |
| | 822,003 | | | | | | 7.00 | | | | | | | | 12/25/33 | | | | 848,411 | |
| | 673,846 | | | | | | 7.00 | | | | | | | | 6/19/41 | 1 | | | 678,033 | |
| | 273,524 | | | | | | 7.00 | | | | | | | | 10/25/41 | | | | 275,647 | |
| | 145,036 | | | | | | 7.00 | | | | | | | | 11/25/41 | | | | 150,937 | |
| | 931,536 | | | | | | 7.00 | | | | | | | | 12/25/41 | | | | 956,675 | |
| | 692,131 | | | | | | 7.00 | | | | | | | | 7/25/42 | | | | 713,535 | |
| | 545,625 | | | | | | 7.00 | | | | | | | | 2/25/44 | | | | 559,067 | |
| | 708,683 | | | | | | 7.00 | | | | | | | | 4/25/49 | | | | 751,714 | |
| | 263,132 | | | | | | 7.50 | | | | | | | | 10/25/40 | | | | 263,340 | |
| | 880,952 | | | | | | 7.50 | | | | | | | | 11/25/40 | | | | 868,774 | |
| | 948,780 | | | | | | 7.50 | | | | | | | | 7/25/41 | | | | 953,191 | |
| | 305,408 | | | | | | 7.50 | | | | | | | | 1/25/42 | | | | 315,499 | |
| | | | | | | | | | | | | | | | | | | | |
Principal Amount ($) | | | | | Coupon Rate (%) | | | | Maturity Date | | | Fair Value ($) |
| | | | | |
| | 555,507 | | | | | | 7.50 | | | | | | | | 5/25/42 | | | | 582,256 | |
| | 655,391 | | | | | | 7.50 | | | | | | | | 2/25/44 | | | | 671,445 | |
| | 425,439 | | | | | | 7.50 | | | | | | | | 5/25/44 | | | | 445,206 | |
| | 2,804,460 | | | | | | 7.50 | | | | | | | | 1/25/48 | | | | 2,925,832 | |
| | 26,331 | | | | | | 8.26 | | | | | | | | 10/25/42 | 1 | | | 27,876 | |
| | 404 | | | | | | 8.50 | | | | | | | | 1/25/25 | | | | 404 | |
| | 166,384 | | | | | | 8.50 | | | | | | | | 6/25/30 | | | | 177,507 | |
| | 8,533 | | | | | | 21.60 | | | | | | | | 3/25/39 | 1 | | | 11,200 | |
| | | | | | | | | | | | | | | | | | | | |
| | | | | |
| | | | | | | | | | | | | | | | | | | 45,136,466 | |
| | | | | | | | | | | | | | | | | | | | |
| | Government National Mortgage Association - 40.0% | | | | | |
| | 2,157,003 | | | | | | 4.75 | | | | | | | | 5/20/51 | 1 | | | 2,091,020 | |
| | 2,206,426 | | | | | | 4.76 | | | | | | | | 5/20/51 | 1 | | | 2,141,768 | |
| | 4,727,142 | | | | | | 4.81 | | | | | | | | 8/20/51 | 1 | | | 4,558,136 | |
| | 2,708,795 | | | | | | 5.00 | | | | | | | | 12/20/50 | | | | 2,657,140 | |
| | 3,832,267 | | | | | | 5.00 | | | | | | | | 1/20/51 | | | | 3,768,813 | |
| | 6,824,654 | | | | | | 5.00 | | | | | | | | 2/20/51 | | | | 6,537,715 | |
| | 1,000,000 | | | | | | 5.00 | | | | | | | | 6/20/52 | | | | 985,319 | |
| | 484,889 | | | | | | 5.50 | | | | | | | | 9/20/39 | | | | 496,833 | |
| | 1,737,211 | | | | | | 5.50 | | | | | | | | 11/20/50 | | | | 1,774,220 | |
| | 3,569,698 | | | | | | 5.50 | | | | | | | | 12/20/50 | | | | 3,621,538 | |
| | 2,995,608 | | | | | | 5.50 | | | | | | | | 1/20/51 | | | | 3,092,238 | |
| | 1,734,899 | | | | | | 5.50 | | | | | | | | 4/20/51 | | | | 1,770,887 | |
| | 12,406,453 | | | | | | 5.50 | | | | | | | | 5/20/51 | | | | 12,601,607 | |
| | 12,817,527 | | | | | | 5.50 | | | | | | | | 6/20/51 | | | | 12,885,126 | |
| | 14,950,761 | | | | | | 5.50 | | | | | | | | 7/20/51 | | | | 15,067,705 | |
| | 468,631 | | | | | | 5.50 | | | | | | | | 10/20/51 | | | | 475,570 | |
| | 5,277,182 | | | | | | 5.50 | | | | | | | | 11/20/51 | | | | 5,289,688 | |
| | 7,214,916 | | | | | | 5.86 | | | | | | | | 2/20/51 | 1 | | | 7,428,977 | |
| | 297,507 | | | | | | 6.00 | | | | | | | | 12/20/35 | | | | 303,576 | |
| | 182,778 | | | | | | 6.00 | | | | | | | | 3/20/42 | | | | 185,835 | |
| | 255,305 | | | | | | 6.00 | | | | | | | | 3/20/48 | | | | 256,880 | |
| | 1,323,525 | | | | | | 6.00 | | | | | | | | 3/20/49 | | | | 1,327,709 | |
| | 388,440 | | | | | | 6.00 | | | | | | | | 5/20/49 | | | | 396,904 | |
| | 1,234,569 | | | | | | 6.12 | | | | | | | | 1/20/39 | 1 | | | 1,293,339 | |
| | 769,486 | | | | | | 6.47 | | | | | | | | 7/20/39 | 1 | | | 795,473 | |
| | 712,530 | | | | | | 6.50 | | | | | | | | 2/20/37 | | | | 721,490 | |
| | 129,514 | | | | | | 6.50 | | | | | | | | 9/16/38 | | | | 131,612 | |
| | 2,056,455 | | | | | | 6.50 | | | | | | | | 8/20/48 | | | | 2,093,905 | |
| | 896,027 | | | | | | 6.50 | | | | | | | | 10/20/48 | | | | 942,729 | |
| | 886,797 | | | | | | 6.50 | | | | | | | | 1/20/49 | | | | 884,551 | |
| | 491,187 | | | | | | 7.00 | | | | | | | | 10/20/48 | | | | 509,404 | |
| | 757,839 | | | | | | 7.00 | | | | | | | | 11/20/48 | | | | 784,343 | |
| | 307,911 | | | | | | 7.06 | | | | | | | | 2/20/45 | 1 | | | 323,430 | |
| | 645,239 | | | | | | 7.09 | | | | | | | | 12/20/38 | 1 | | | 666,288 | |
| | | | | | | | | | | | | | | | | | | | |
| | | | | |
| | | | | | | | | | | | | | | | | | | 98,861,768 | |
| | | | | | | | | | | | | | | | | | | | |
| | Vendee Mortgage Trust - 0.7% | | | | | |
| | 428,476 | | | | | | 6.49 | | | | | | | | 7/15/30 | 1 | | | 433,919 | |
| | 844,433 | | | | | | 6.50 | | | | | | | | 8/15/31 | | | | 835,741 | |
| | 496,819 | | | | | | 6.50 | | | | | | | | 10/15/31 | | | | 511,047 | |
| | | | | | | | | | | | | | | | | | | | |
| | | | | |
| | | | | | | | | | | | | | | | | | | 1,780,707 | |
| | | | | | | | | | | | | | | | | | | | |
| |
| | Total Collateralized Mortgage Obligations | | | | 174,812,085 | |
| | | | | | | | | | | | | | | | | | | | |
| | (cost: $190,668,597) | | | | | | | | | | | | | |
|
| | Asset-Backed Securities - 1.1% | |
| |
| | Federal Home Loan Mortgage Corporation - 0.1% | | | | | |
| | 227 | | | | | | 6.09 | | | | | | | | 9/25/29 | 1 | | | 219 | |
| | 306,295 | | | | | | 7.16 | | | | | | | | 7/25/29 | | | | 308,405 | |
| | | | | | | | | | | | | | | | | | | | |
| | | | | |
| | | | | | | | | | | | | | | | | | | 308,624 | |
| | | | | | | | | | | | | | | | | | | | |
| | |
| |
| See accompanying notes to financial statements. | | |
| | |
| MARCH 31, 2024 | | 7 |
SCHEDULE OF INVESTMENTS
March 31, 2024
Sit U.S. Government Securities Fund (Continued)
| | | | | | | | | | | | | | | | | | |
Principal
Amount ($) | | | | | Coupon Rate (%) | | | | Maturity Date | | | Fair Value ($) | |
|
| | Federal National Mortgage Association - 0.7% | |
| | 269,456 | | | | | 4.40 | | | | | | | 11/25/33 | 14 | | | 259,222 | |
| | 302,495 | | | | | 4.45 | | | | | | | 9/26/33 | 14 | | | 290,326 | |
| | 72,582 | | | | | 4.85 | | | | | | | 10/25/33 | 14 | | | 72,531 | |
| | 5,649 | | | | | SOFRRATE 30 Day
Average + 0.28%, 5.60 | | | | | | | 11/25/32 | 1 | | | 5,561 | |
| | 1,065,148 | | | | | 5.75 | | | | | | | 2/25/33 | 14 | | | 1,005,793 | |
| | 694 | | | | | 6.00 | | | | | | | 5/25/32 | 14 | | | 676 | |
| | 25,458 | | | | | 6.09 | | | | | | | 10/25/31 | 14 | | | 25,420 | |
| | 675 | | | | | 7.36 | | | | | | | 6/25/26 | 1 | | | 673 | |
| | | | | | | | | | | | | | | | | | |
| | | | | |
| | | | | | | | | | | | | | | | | 1,660,202 | |
| | | | | | | | | | | | | | | | | | |
| | Small Business Administration - 0.3% | |
| | 81,093 | | | | | 5.78 | | | | | | | 8/1/27 | | | | 80,090 | |
| | 327,403 | | | | | 5.87 | | | | | | | 7/1/28 | | | | 322,896 | |
| | 341,972 | | | | | 6.02 | | | | | | | 8/1/28 | | | | 343,403 | |
| | | | | | | | | | | | | | | | | | |
| | | | | |
| | | | | | | | | | | | | | | | | 746,389 | |
| | | | | | | | | | | | | | | | | | |
| |
| | Total Asset-Backed Securities | | | | 2,715,215 | |
| | | | | | | | | | | | | | | | | | |
| | (cost: $2,858,445) | | | | | |
| |
| | Put Options Purchased 19 - 0.2% | | | | 406,875 | |
| | | | | | | | | | | | | | | | | | |
| | (cost: $693,088) | | | | | |
| | | | | | | | | | | | | | | | | | |
| Quantity | | | Name of Issuer | | | Fair Value ($) | |
|
| | Short-Term Securities - 1.8% | |
| | 4,401,972 | | | Fidelity Inst. Money Mkt. Gvt. Fund, 5.25% | | | | 4,401,972 | |
| | | | | | | | | | | | | | | | | | |
| | (cost: $4,401,972) | | | | | | | | | | | | |
| |
| Total Investments in Securities - 100.6%
(cost: $266,992,513) |
| | | 248,980,346 | |
| | | | | | | | | | | | | | | | | | |
| |
| | Other Assets and Liabilities - (0.6)% | | | | (1,575,408 | ) |
| | | | | | | | | | | | | | | | | | |
| | | |
| | Net Assets - 100.0% | | | | | | | | | | | $247,404,938 | |
| | | | | | | | | | | | | | | | | | |
| 1 | Variable rate security. Rate disclosed is as of March 31, 2024. Certain variable rate securities are not based on a published reference rate and spread but are determined by the issuer or agent and are based on current market conditions, or, for mortgage-backed securities, are impacted by the individual mortgages which are paying off over time. These securities do not indicate a reference rate and spread in their descriptions. |
| 14 | Step Coupon: A bond that pays a coupon rate that increases on a specified date(s). Rate disclosed is as of March 31, 2024. |
Numeric footnotes not disclosed are not applicable to this Schedule of Investments.
| | |
| |
| See accompanying notes to financial statements. | | |
| | |
| 8 | | SIT MUTUAL FUNDS ANNUAL REPORT |
19 Options outstanding as of March 31, 2024 were as follows:
| | | | | | | | | | | | | | | | | | | | | | | | | | |
| Description | | Contracts | | Exercise
Price ($) | | | Expiration
Date | | | Counterparty | | | Notional
Amount ($) | | | Cost/
Premiums ($) | | | Value ($) | |
| | | | | | |
Put Options Purchased - U.S. Treasury Futures: | | | | | | | | | | | | | | | | | | | | | | | | |
| | | | | | | |
5-Year | | 868 | | | 106.50 | | | | May 2024 | | | | StoneX Financial, Inc. | | | | 92,442,000 | | | | 693,088 | | | | 406,875 | |
A summary of the levels for the Fund’s investments as of March 31, 2024 is as follows (see Note 2 - significant accounting policies in the notes to financial statements):
| | | | | | | | | | | | | | | | |
| | | Investment in Securities |
| | | | |
| | | Level 1
Quoted
Prices ($) | | Level 2 Other significant observable inputs ($) | | Level 3 Significant unobservable inputs ($) | | Total ($) | |
Mortgage Pass-Through Securities | | | — | | | | 64,136,867 | | | | — | | | | 64,136,867 | |
U.S. Treasury / Federal Agency Securities | | | — | | | | 2,507,332 | | | | — | | | | 2,507,332 | |
Collateralized Mortgage Obligations | | | — | | | | 174,812,085 | | | | — | | | | 174,812,085 | |
Asset-Backed Securities | | | — | | | | 2,715,215 | | | | — | | | | 2,715,215 | |
Put Options Purchased | | | 406,875 | | | | — | | | | — | | | | 406,875 | |
Short-Term Securities | | | 4,401,972 | | | | — | | | | — | | | | 4,401,972 | |
Total: | | | 4,808,847 | | | | 244,171,499 | | | | — | | | | 248,980,346 | |
There were no transfers into or out of level 3 during the reporting period.
| | |
| |
| See accompanying notes to financial statements. | | |
| | |
| MARCH 31, 2024 | | 9 |
|
Sit Quality Income Fund - Class S and Class Y |
OBJECTIVE & STRATEGY
The objective of the Sit Quality Income Fund is to provide high current income and safety of principal, which it seeks to attain by investing under normal market conditions at least 80% of its assets in debt securities issued by the U.S. government and its agencies, debt securities issued by corporations, and mortgage and other asset-backed securities. The Fund invests at least 50% of its assets in U.S. government debt securities, which are securities issued, guaranteed or insured by the U.S. government, its agencies or instrumentalities.
Fund Performance
The Sit Quality Income Fund (Class S) provided a return of +4.05% during the 12-month period ended March 31, 2024, compared to the return of the Bloomberg 1-3 Year Government/Credit Bond Index of +3.49%. The Fund’s 30-day SEC yield was 4.01% and its 12-month distribution rate was 3.98%.
Factors that Influenced the Fund’s Performance
The primary goal of the Fund is to maintain a high credit quality portfolio with stable principal values while generating a relatively high level of income. Yields on U.S. Treasury securities were higher across all maturities. Yield spreads tightened across corporate, asset-backed, and collateralized mortgage obligations which more than offset the increase in U.S. Treasury yields. Mortgage pass-through securities underperformed as those securities extended in duration. The Fund’s holdings in U.S. agency debentures and taxable municipal securities outperformed due to the strong income advantage offsetting the negative price performance. The Fund reduces interest rate risk by using futures and options on Treasury securities. The use of futures and options was effective in providing stability to the Fund’s net asset value and provided a positive return.
Outlook and Positioning
The inflation rate continues to be heavily scrutinized to determine when the Fed will cut short-term interest rates. Economic indicators have whipsawed investors with respect to the timing of the Fed’s eventual cut in short-term interest rates. The Fed has achieved an environment with decelerating inflation as year-over-year core PCE, the Fed’s preferred inflation metric, has fallen from 4.8% to start the period to 2.8%. However, the Fed continues to be weary of cutting interest rates too soon, but as it stands, it appears to have achieved the Goldilocks scenario of lowering inflation without causing a widely anticipated recession. The question remains whether the Fed will hold rates too high for too long and cause the recession that they have previously avoided. The tail-winds of supply chain normalization and depleted savings will continue to drive the inflation rate toward the Fed’s target. We expect that the Fed will be slightly behind when it comes to reducing interest rates but will make up for it with greater than 0.25% cuts, which the market is not currently projecting. We expect 30-year mortgage rates to decline over
HYPOTHETICAL GROWTH OF $10,000
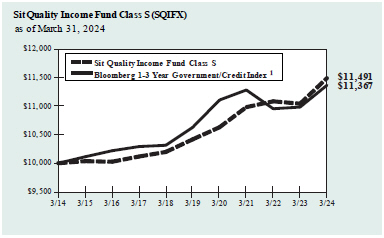
The chart above illustrates the total value of a hypothetical $10,000 investment in the Fund over the past 10 years as compared to the performance of the Bloomberg 1-3 Year Government/Credit Index. Past performance does not guarantee future results. Returns include the reinvestment of distributions. The chart does not reflect the deduction of taxes that a shareholder would pay on Fund distributions or the redemption of Fund shares.
1 The Bloomberg 1-3 Year Government/Credit Index is an unmanaged index of Treasury or government agency securities and investment grade corporate debt securities with maturities of one to three years. The returns include the reinvestment of income and do not include any transaction costs, management fees or other costs. It is not possible to invest directly in an index. This is the Fund’s primary index.
the upcoming year as the banking sector has more flexibility and clarity with respect to interest rates. Housing affordability is extremely low, but we anticipate an increase in the upcoming year. Mortgage prepayments should remain low from reduced refinancing activity and lower housing turnover due to higher interest rates.
We have positioned the Fund defensively in terms of credit quality while emphasizing securities that will benefit from a normalization of the yield curve. We focus on a mix of Treasury, agency, and credit sectors that provide relatively high levels of income and stable prices.
| | |
| Bryce A. Doty, CFA | | Chris M. Rasmussen, CFA |
| Senior Portfolio Manager | | Mark H. Book, CFA |
| | Portfolio Managers |
| | |
| |
| Information on this page is unaudited. | | |
| | |
| 10 | | SIT MUTUAL FUNDS ANNUAL REPORT |
COMPARATIVE RATES OF RETURNS
as of March 31, 2024
| | | | | | | | |
| | | Sit Quality
Income Fund | | | | |
| | | Class S | | Class Y | | Bloomberg
1-3 Year
Government/
Credit Index1 | | Lipper Short
Investment
Grade Bond
Index2 |
One Year | | 4.05% | | 4.42% | | 3.49% | | 5.23% |
Five Year | | 1.98 | | n/a | | 1.36 | | 2.01 |
Ten Year | | 1.40 | | n/a | | 1.29 | | 1.77 |
| Since Inception-Class S (12/31/12) | | 1.32 | | n/a | | 1.22 | | 1.68 |
| Since Inception-Class Y (3/31/22) | | n/a | | 2.13 | | 1.86 | | 2.72 |
Performance figures are historical and do not guarantee future results. Investment returns and principal value will vary, and you may have a gain or loss when you sell shares. Current performance may be lower or higher than the performance data quoted. Contact the Fund for performance data current to the most recent month-end. Returns include changes in share price as well as reinvestment of all dividends and capital gains and all fee waivers. Without the fee waivers total return and yield figures would have been lower. Returns do not reflect the deduction of taxes that a shareholder would pay on Fund distributions or the redemption of Fund shares. Management fees and administrative expenses are included in the Fund’s performance. Returns for periods greater than one year are compounded average annual rates of return.
1 The Bloomberg 1-3 Year Government/Credit Index is an unmanaged index of Treasury or government agency securities and investment grade corporate debt securities with maturities of one to three years. The returns include the reinvestment of income and do not include any transaction costs, management fees or other costs. It is not possible to invest directly in an index.
2 The Lipper returns are obtained from Lipper Analytical Services, Inc., a large independent evaluator of mutual funds.
FUND DIVERSIFICATION
| | | | |
| |
Mortgage Pass-Through Securities | | | 29.2 | % |
| |
Taxable Municipal Bonds | | | 24.1 | |
| |
U.S. Treasury / Federal Agency Securities | | | 21.5 | |
| |
Corporate Bonds | | | 13.4 | |
| |
Collateralized Mortgage Obligations - Non Agency | | | 5.9 | |
| |
Asset-Backed Securities - Non Agency | | | 1.9 | |
| |
Other Net Assets | | | 4.0 | |
Based on net assets as of March 31, 2024.
PORTFOLIO SUMMARY
| | |
| |
Class S: | | |
Net Asset Value 3/31/24: | | $9.46 Per Share |
Net Asset Value 3/31/23: | | $9.46 Per Share |
Net Assets: | | $31.6 Million |
| |
Class Y: | | |
Net Asset Value 3/31/24: | | $9.48 Per Share |
Net Asset Value 3/31/23: | | $9.48 Per Share |
Net Assets: | | $101.8 Million |
| |
Average Maturity | | 14.8 Years |
Effective Duration:3 | | 1.9 Years |
3 Duration is a measure of estimated price sensitivity relative to changes in interest rates. Portfolios with longer durations are typically more sensitive to changes in interest rates. For example, if interest rates rise by 1%, the fair value of a security with an effective duration of 5 years would decrease by 5%, with all other factors being constant. The correlation between duration and price sensitivity is greater for securities rated investment-grade than it is for securities rated below investment-grade. Duration estimates are based on assumptions by Sit Investment Associates, Inc. (the “Adviser”) and are subject to a number of limitations. Effective duration is calculated based on historical price changes of securities held by the Fund, and therefore is a more accurate estimate of price sensitivity provided interest rates remain within their historical range.
QUALITY RATING (% of Net Assets)
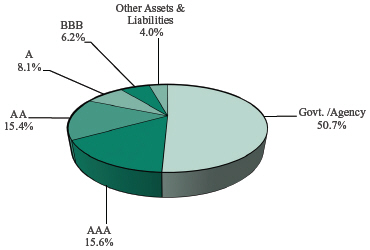
Lower of Moody’s, S&P, Fitch or Duff & Phelps ratings used.
| | |
| |
| Information on this page is unaudited. | | |
| | |
| MARCH 31, 2024 | | 11 |
SCHEDULE OF INVESTMENTS
March 31, 2024
Sit Quality Income Fund
| | | | | | | | | | | | | | | | |
| | | | | |
| Name of Issuer | | Principal
Amount ($) | | | Coupon
Rate (%) | | | Maturity
Date | | | Fair
Value ($) |
| | | | |
Asset-Backed Securities - 2.3% | | | | | | | | | | | | | | | | |
| | | | |
Agency - 0.4% | | | | | | | | | | | | | | | | |
FNMA Grantor Trust, Series 2004-T5, Class A11 1 | | | 360,130 | | | | 10.46 | | | | 5/28/35 | | | | 355,314 | |
Small Business Administration, Series 2006-20D, Class 1 | | | 46,762 | | | | 5.64 | | | | 4/1/26 | | | | 46,358 | |
Small Business Administration, Series 2007-20B, Class 1 | | | 37,267 | | | | 5.49 | | | | 2/1/27 | | | | 36,654 | |
Small Business Administration, Series 2007-20J, Class 1 | | | 83,432 | | | | 5.57 | | | | 10/1/27 | | | | 82,323 | |
| | | | | | | | | | | | | | | | |
| | | | |
| | | | | | | | | | | | | | | 520,649 | |
| | | | | | | | | | | | | | | | |
Non-Agency - 1.9% | | | | | | | | | | | | | | | | |
Centex Home Equity Loan Trust, Series 2004-A, Class AF4 14 | | | 102,684 | | | | 5.01 | | | | 8/25/32 | | | | 100,954 | |
RCKT Mortgage Trust, Series 2023-CES3, Class A1A 1, 4 | | | 964,486 | | | | 7.11 | | | | 11/25/43 | | | | 978,531 | |
Towd Point Mortgage Trust, Series 2019-MH1, Class A2 1, 4 | | | 676,147 | | | | 3.00 | | | | 11/25/58 | | | | 669,682 | |
Towd Point Mortgage Trust, Series 2020-MH1, Class A1A 1, 4 | | | 295,204 | | | | 2.18 | | | | 2/25/60 | | | | 281,297 | |
Towd Point Mortgage Trust, Series 2023-CES2, Class A1A 1, 4 | | | 473,375 | | | | 7.29 | | | | 10/25/63 | | | | 482,272 | |
| | | | | | | | | | | | | | | | |
| | | | |
| | | | | | | | | | | | | | | 2,512,736 | |
| | | | | | | | | | | | | | | | |
| | | | |
Total Asset-Backed Securities
(cost: $3,047,374) | | | | | | | | | | | | | | | 3,033,385 | |
| | | | | | | | | | | | | | | | |
| | | | |
Collateralized Mortgage Obligations - 26.0% | | | | | | | | | | | | | | | | |
| | | | |
Agency - 20.1% | | | | | | | | | | | | | | | | |
FHLMC REMICS, Series 3104, Class BY | | | 14,371 | | | | 5.50 | | | | 1/15/26 | | | | 14,288 | |
FHLMC REMICS, Series 3418, Class DF | | | 372,691 | | | | 6.00 | | | | 3/15/32 | | | | 379,177 | |
FHLMC REMICS, Series 3756, Class PZ | | | 2,548,008 | | | | 4.00 | | | | 11/15/40 | | | | 2,442,802 | |
FHLMC REMICS, Series 3806, Class JA | | | 4,323 | | | | 3.50 | | | | 2/15/26 | | | | 4,303 | |
FHLMC REMICS, Series 3982, Class LA | | | 153,629 | | | | 2.50 | | | | 12/15/39 | | | | 152,278 | |
FHLMC REMICS, Series 4246, Class PT | | | 194,443 | | | | 6.50 | | | | 2/15/36 | | | | 199,277 | |
FHLMC REMICS, Series 4390, Class CA | | | 707,576 | | | | 3.50 | | | | 6/15/50 | | | | 693,263 | |
FHLMC REMICS, Series 4717, Class KV | | | 884,932 | | | | 3.50 | | | | 8/15/40 | | | | 868,994 | |
FHLMC REMICS, Series 4759, Class NA | | | 11,699 | | | | 3.00 | | | | 8/15/44 | | | | 11,614 | |
FHLMC REMICS, Series 5226, Class D | | | 400,205 | | | | 3.50 | | | | 12/15/45 | | | | 379,974 | |
FHLMC REMICS, Series 5252, Class BT | | | 897,467 | | | | 6.00 | | | | 9/25/52 | | | | 915,798 | |
FHLMC Structured Pass-Through Certificates, Series T-60, Class 1A2 | | | 472,103 | | | | 7.00 | | | | 3/25/44 | | | | 485,885 | |
FNMA Grantor Trust, Series 2004-T1, Class 2A 1 | | | 223,093 | | | | 3.84 | | | | 8/25/43 | | | | 206,478 | |
FNMA REMICS, Series 2002-W1, Class 2A 1 | | | 784,856 | | | | 4.64 | | | | 2/25/42 | | | | 771,773 | |
FNMA REMICS, Series 2004-W5, Class A1 | | | 1,503,760 | | | | 6.00 | | | | 2/25/47 | | | | 1,545,087 | |
FNMA REMICS, Series 2010-68, Class W 1 | | | 194,831 | | | | 1.93 | | | | 7/25/37 | | | | 168,300 | |
FNMA REMICS, Series 2011-10, Class AC | | | 1,614,387 | | | | 3.00 | | | | 2/25/41 | | | | 1,514,490 | |
FNMA REMICS, Series 2011-146, Class LX | | | 877,639 | | | | 3.50 | | | | 10/25/40 | | | | 849,965 | |
FNMA REMICS, Series 2015-61, Class VB | | | 871,000 | | | | 3.50 | | | | 6/25/34 | | | | 841,077 | |
FNMA REMICS, Series 2017-97, Class DP | | | 9,606 | | | | 3.50 | | | | 10/25/46 | | | | 9,452 | |
FNMA REMICS, Series 2018-25, Class AG | | | 154,490 | | | | 3.50 | | | | 4/25/47 | | | | 148,209 | |
FNMA REMICS, Series 2023-64, Class HA | | | 3,381,012 | | | | 5.50 | | | | 9/25/50 | | | | 3,342,060 | |
FNMA Trust, Series 2004-W9, Class 1A3 | | | 633,085 | | | | 6.05 | | | | 2/25/44 | | | | 646,547 | |
Freddie Mac Multifamily Structured Pass-Through Certificates, Series K728, Class A2 1 | | | 2,455,060 | | | | 3.06 | | | | 8/25/24 | | | | 2,430,237 | |
Freddie Mac Multifamily Structured Pass-Through Certificates, Series K730, Class A2 1 | | | 2,937,230 | | | | 3.59 | | | | 1/25/25 | | | | 2,895,509 | |
FRESB Mortgage Trust, Series 2018-SB45, Class A5H, SOFRRATE 30 Day Average + 0.81% 1 | | | 149,052 | | | | 6.13 | | | | 11/25/37 | | | | 148,149 | |
FRESB Mortgage Trust, Series 2018-SB46, Class A5H, SOFRRATE 30 Day Average + 0.81% 1 | | | 512,199 | | | | 6.13 | | | | 12/25/37 | | | | 502,513 | |
Government National Mortgage Association, Series 2004-11, Class QG | | | 231,685 | | | | 5.00 | | | | 2/16/34 | | | | 230,058 | |
Government National Mortgage Association, Series 2020-149, Class AW | | | 1,581,903 | | | | 5.50 | | | | 10/20/50 | | | | 1,592,241 | |
Government National Mortgage Association, Series 2024-4, Class GK | | | 997,067 | | | | 5.00 | | | | 3/20/52 | | | | 980,695 | |
Seasoned Credit Risk Transfer Trust, Series 2019-4, Class M55D | | | 237,973 | | | | 4.00 | | | | 2/25/59 | | | | 221,073 | |
| | | | |
Seasoned Credit Risk Transfer Trust, Series 2022-2, Class M5TU | | | 1,339,255 | | | | 4.00 | | | | 4/25/62 | | | | 1,241,842 | |
| | | | | | | | | | | | | | | | |
| | | | |
| | | | | | | | | | | | | | | 26,833,408 | |
| | | | | | | | | | | | | | | | |
Non-Agency - 5.9% | | | | | | | | | | | | | | | | |
Chase Home Lending Mortgage Trust, Series 2024-3, Class A4 1, 4 | | | 750,000 | | | | 6.00 | | | | 2/25/55 | | | | 747,272 | |
JP Morgan Mortgage Trust, Series 2021-1, Class A4 1, 4 | | | 572,644 | | | | 2.50 | | | | 6/25/51 | | | | 507,674 | |
JP Morgan Mortgage Trust, Series 2021-14, Class A4 1, 4 | | | 766,746 | | | | 2.50 | | | | 5/25/52 | | | | 664,059 | |
| | |
| |
| See accompanying notes to financial statements. | | |
| | |
| 12 | | SIT MUTUAL FUNDS ANNUAL REPORT |
| | | | | | | | | | | | | | | | |
| | | | | |
| Name of Issuer | | Principal
Amount ($) | | | Coupon
Rate (%) | | | Maturity
Date | | | Fair
Value ($) | |
| | | | |
JP Morgan Mortgage Trust, Series 2021-6, Class A4 1, 4 | | | 1,362,265 | | | | 2.50 | | | | 10/25/51 | | | | 1,190,241 | |
JP Morgan Mortgage Trust, Series 2021-7, Class A4 1, 4 | | | 472,354 | | | | 2.50 | | | | 11/25/51 | | | | 411,958 | |
JP Morgan Mortgage Trust, Series 2022-1, Class A11, SOFRRATE 30 Day Average + 0.85% 1, 4 | | | 2,521,843 | | | | 5.00 | | | | 7/25/52 | | | | 2,325,899 | |
New Residential Mortgage Loan Trust, Series 2017-2A, Class A4 1, 4 | | | 194,636 | | | | 4.00 | | | | 3/25/57 | | | | 182,138 | |
New Residential Mortgage Loan Trust, Series 2017-3A, Class A1 1, 4 | | | 205,600 | | | | 4.00 | | | | 4/25/57 | | | | 193,936 | |
New Residential Mortgage Loan Trust, Series 2017-5A, Class A1, TSFR1M + 1.61% 1, 4 | | | 64,831 | | | | 6.94 | | | | 6/25/57 | | | | 64,837 | |
New Residential Mortgage Loan Trust, Series 2018-1A, Class A1A 1, 4 | | | 149,811 | | | | 4.00 | | | | 12/25/57 | | | | 141,823 | |
New Residential Mortgage Loan Trust, Series 2018-4A, Class A1S, TSFR1M + 0.86% 1, 4 | | | 171,312 | | | | 6.19 | | | | 1/25/48 | | | | 166,024 | |
Sequoia Mortgage Trust, Series 2020-4, Class A5 1, 4 | | | 236,538 | | | | 2.50 | | | | 11/25/50 | | | | 212,672 | |
Sequoia Mortgage Trust, Series 2023-4, Class A10 1, 4 | | | 867,781 | | | | 6.00 | | | | 11/25/53 | | | | 863,025 | |
Wells Fargo Mortgaged Backed Securities Trust, Series 2020-5, Class A3 1, 4 | | | 213,482 | | | | 2.50 | | | | 9/25/50 | | | | 191,241 | |
| | | | | | | | | | | | | | | | |
| | | | |
| | | | | | | | | | | | | | | 7,862,799 | |
| | | | | | | | | | | | | | | | |
| | | | |
Total Collateralized Mortgage Obligations
(cost: $35,584,440) | | | | | | | | | | | | | | | 34,696,207 | |
| | | | | | | | | | | | | | | | |
| | | | |
Corporate Bonds - 13.4% | | | | | | | | | | | | | | | | |
| | | | |
American Tower Trust 4 | | | 1,300,000 | | | | 5.49 | | | | 3/15/28 | | | | 1,311,500 | |
BGC Group, Inc. | | | 900,000 | | | | 4.38 | | | | 12/15/25 | | | | 875,442 | |
Cabot Corp. | | | 583,000 | | | | 4.00 | | | | 7/1/29 | | | | 550,661 | |
Cadence Bank (Subordinated), 3 Mo. Libor + 2.47% 1 | | | 1,565,000 | | | | 4.13 | | | | 11/20/29 | | | | 1,471,401 | |
Comerica Bank (Subordinated) | | | 250,000 | | | | 7.88 | | | | 9/15/26 | | | | 257,351 | |
CVS Pass-Through Trust Series 2009 4 | | | 761,939 | | | | 8.35 | | | | 7/10/31 | | | | 820,480 | |
Delta Air Lines 2015-1 Class AA Pass Through Trust | | | 314,772 | | | | 3.63 | | | | 7/30/27 | | | | 297,711 | |
DTE Electric Securitization Funding II, LLC | | | 875,000 | | | | 5.97 | | | | 3/1/32 | | | | 906,730 | |
Equitable Financial Life Global Funding 4 | | | 800,000 | | | | 1.80 | | | | 3/8/28 | | | | 704,739 | |
F&G Global Funding 4 | | | 1,600,000 | | | | 5.15 | | | | 7/7/25 | | | | 1,575,636 | |
First-Citizens Bank & Trust Co. (Subordinated), US Treasury + 2.37% 1 | | | 1,500,000 | | | | 4.13 | | | | 11/13/29 | | | | 1,443,012 | |
Minnesota Life Insurance Co. (Subordinated) 4 | | | 1,020,000 | | | | 8.25 | | | | 9/15/25 | | | | 1,045,920 | |
Nationwide Mutual Insurance Co. (Subordinated), 3 Mo. Libor + 2.29% 1, 4 | | | 1,400,000 | | | | 7.88 | | | | 12/15/24 | | | | 1,400,115 | |
Prudential Insurance Co. of America (Subordinated) 4 | | | 1,075,000 | | | | 8.30 | | | | 7/1/25 | | | | 1,102,132 | |
SBA Tower Trust 4 | | | 1,300,000 | | | | 6.60 | | | | 1/15/28 | | | | 1,332,401 | |
Solventum Corp. 4 | | | 975,000 | | | | 5.40 | | | | 3/1/29 | | | | 977,016 | |
SouthState Corp. (Subordinated), TSFR3M + 5.62% 1 | | | 650,000 | | | | 5.75 | | | | 6/1/30 | | | | 633,820 | |
Tennessee Gas Pipeline Co., LLC | | | 555,000 | | | | 7.00 | | | | 10/15/28 | | | | 594,076 | |
Truist Financial Corp. 1 | | | 500,000 | | | | 7.16 | | | | 10/30/29 | | | | 533,624 | |
| | | | | | | | | | | | | | | | |
| | | | |
Total Corporate Bonds
(cost: $17,985,498) | | | | | | | | | | | | | | | 17,833,767 | |
| | | | | | | | | | | | | | | | |
| | | | |
Mortgage Pass-Through Securities - 29.2% | | | | | | | | | | | | | | | | |
| | | | |
Federal Home Loan Mortgage Corporation - 6.8% | | | | | | | | | | | | | | | | |
Freddie Mac | | | 2,124,079 | | | | 2.50 | | | | 8/1/30 | | | | 1,995,143 | |
Freddie Mac | | | 26,528 | | | | 3.00 | | | | 9/1/27 | | | | 25,686 | |
Freddie Mac | | | 2,451,702 | | | | 3.00 | | | | 3/1/31 | | | | 2,329,820 | |
Freddie Mac | | | 2,287,337 | | | | 3.00 | | | | 4/1/33 | | | | 2,147,381 | |
Freddie Mac | | | 4,292 | | | | 3.50 | | | | 7/1/26 | | | | 4,212 | |
Freddie Mac | | | 27,518 | | | | 4.00 | | | | 7/1/26 | | | | 27,010 | |
Freddie Mac | | | 29,678 | | | | 4.00 | | | | 1/1/27 | | | | 29,219 | |
Freddie Mac | | | 495,525 | | | | 4.00 | | | | 4/1/29 | | | | 486,247 | |
Freddie Mac | | | 107,037 | | | | 4.00 | | | | 10/1/31 | | | | 103,957 | |
Freddie Mac | | | 562 | | | | 4.50 | | | | 7/1/26 | | | | 558 | |
Freddie Mac | | | 387,161 | | | | 4.50 | | | | 6/1/39 | | | | 378,379 | |
Freddie Mac | | | 1,491 | | | | 5.00 | | | | 10/1/25 | | | | 1,477 | |
Freddie Mac | | | 1,213,881 | | | | 5.00 | | | | 8/1/38 | | | | 1,213,668 | |
Freddie Mac | | | 394,765 | | | | 5.00 | | | | 3/1/39 | | | | 394,353 | |
| | | | | | | | | | | | | | | | |
| | | | |
| | | | | | | | | | | | | | | 9,137,110 | |
| | | | | | | | | | | | | | | | |
| | | | |
Federal National Mortgage Association - 19.7% | | | | | | | | | | | | | | | | |
Fannie Mae | | | 354,798 | | | | 3.00 | | | | 10/1/27 | | | | 344,921 | |
| | |
| |
| See accompanying notes to financial statements. | | |
| | |
| MARCH 31, 2024 | | 13 |
SCHEDULE OF INVESTMENTS
March 31, 2024
Sit Quality Income Fund (Continued)
| | | | | | | | | | | | | | | | |
| | | | | |
| Name of Issuer | | Principal
Amount ($) | | | Coupon
Rate (%) | | | Maturity
Date | | | Fair
Value ($) | |
| | | | |
Fannie Mae | | | 36,806 | | | | 3.00 | | | | 8/1/28 | | | | 35,677 | |
Fannie Mae | | | 500,284 | | | | 3.00 | | | | 5/1/30 | | | | 477,711 | |
Fannie Mae | | | 356,429 | | | | 3.00 | | | | 11/1/31 | | | | 344,971 | |
Fannie Mae | | | 1,425,026 | | | | 3.00 | | | | 10/1/32 | | | | 1,338,720 | |
Fannie Mae | | | 56,346 | | | | 3.50 | | | | 1/1/26 | | | | 55,319 | |
Fannie Mae | | | 1,614,991 | | | | 3.50 | | | | 4/1/32 | | | | 1,542,893 | |
Fannie Mae | | | 375,983 | | | | 3.50 | | | | 11/1/38 | | | | 356,493 | |
Fannie Mae | | | 176 | | | | 4.00 | | | | 9/1/24 | | | | 174 | |
Fannie Mae | | | 9,757 | | | | 4.00 | | | | 6/1/25 | | | | 9,644 | |
Fannie Mae | | | 6,412 | | | | 4.00 | | | | 10/1/31 | | | | 6,220 | |
Fannie Mae | | | 389,479 | | | | 4.00 | | | | 10/1/34 | | | | 379,448 | |
Fannie Mae | | | 877,388 | | | | 4.00 | | | | 6/1/38 | | | | 849,772 | |
Fannie Mae | | | 4,131 | | | | 4.50 | | | | 4/1/25 | | | | 4,104 | |
Fannie Mae | | | 682,657 | | | | 4.50 | | | | 3/1/29 | | | | 675,701 | |
Fannie Mae | | | 89,915 | | | | 4.50 | | | | 7/1/31 | | | | 88,648 | |
Fannie Mae | | | 1,827,512 | | | | 4.50 | | | | 4/1/39 | | | | 1,798,548 | |
Fannie Mae | | | 2,550,462 | | | | 5.00 | | | | 3/1/43 | | | | 2,528,307 | |
Fannie Mae | | | 516,848 | | | | 5.50 | | | | 12/1/35 | | | | 527,947 | |
Fannie Mae | | | 704,048 | | | | 5.50 | | | | 12/1/38 | | | | 709,825 | |
Fannie Mae | | | 841,116 | | | | 5.50 | | | | 1/1/40 | | | | 859,227 | |
Fannie Mae | | | 367,014 | | | | 5.50 | | | | 8/1/40 | | | | 383,755 | |
Fannie Mae | | | 571,094 | | | | 5.50 | | | | 2/1/42 | | | | 583,372 | |
Fannie Mae | | | 875,030 | | | | 5.50 | | | | 5/1/49 | | | | 884,620 | |
Fannie Mae | | | 525,668 | | | | 5.50 | | | | 9/1/49 | | | | 536,963 | |
Fannie Mae | | | 1,780,099 | | | | 5.50 | | | | 8/1/56 | | | | 1,825,128 | |
Fannie Mae | | | 1,115,507 | | | | 6.00 | | | | 9/1/29 | | | | 1,126,196 | |
Fannie Mae | | | 525,350 | | | | 6.00 | | | | 7/1/37 | | | | 544,532 | |
Fannie Mae | | | 877,917 | | | | 6.00 | | | | 11/1/38 | | | | 892,318 | |
Fannie Mae | | | 1,257,629 | | | | 6.00 | | | | 10/1/53 | | | | 1,275,444 | |
Fannie Mae | | | 1,119,401 | | | | 6.00 | | | | 10/1/53 | | | | 1,130,161 | |
Fannie Mae | | | 575,552 | | | | 6.50 | | | | 5/1/40 | | | | 596,141 | |
Fannie Mae | | | 561,006 | | | | 7.00 | | | | 1/1/40 | | | | 578,561 | |
Fannie Mae | | | 697,365 | | | | 7.00 | | | | 1/1/40 | | | | 719,186 | |
Fannie Mae | | | 2,070,234 | | | | 7.50 | | | | 10/1/38 | | | | 2,128,866 | |
| | | | | | | | | | | | | | | | |
| | | | |
| | | | | | | | | | | | | | | 26,139,513 | |
| | | | | | | | | | | | | | | | |
Government National Mortgage Association - 2.3% | | | | | | | | | | | | | | | | |
Ginnie Mae, US Treasury + 1.50% 1 | | | 14,253 | | | | 3.88 | | | | 4/20/33 | | | | 14,148 | |
Ginnie Mae, US Treasury + 1.50% 1 | | | 4,241 | | | | 3.88 | | | | 4/20/42 | | | | 4,237 | |
Ginnie Mae | | | 598,984 | | | | 4.00 | | | | 7/20/26 | | | | 588,860 | |
Ginnie Mae | | | 67 | | | | 5.00 | | | | 9/15/24 | | | | 67 | |
Ginnie Mae | | | 2,106 | | | | 5.00 | | | | 6/20/26 | | | | 2,083 | |
Ginnie Mae | | | 484,402 | | | | 6.00 | | | | 2/20/34 | | | | 493,393 | |
Ginnie Mae | | | 334,224 | | | | 6.00 | | | | 7/20/37 | | | | 350,714 | |
Ginnie Mae | | | 1,595,206 | | | | 6.00 | | | | 9/20/38 | | | | 1,604,564 | |
| | | | | | | | | | | | | | | | |
| | | | |
| | | | | | | | | | | | | | | 3,058,066 | |
| | | | | | | | | | | | | | | | |
Other Federal Agency Securities - 0.4% | | | | | | | | | | | | | | | | |
Small Business Administration Pools, PRIME - 2.50% 1 | | | 146,025 | | | | 6.00 | | | | 5/25/43 | | | | 145,320 | |
Small Business Administration Pools, PRIME + 0.78% 1 | | | 261,263 | | | | 9.28 | | | | 2/25/28 | | | | 269,573 | |
Small Business Administration Pools, PRIME + 0.86% 1 | | | 114,031 | | | | 9.36 | | | | 3/25/30 | | | | 119,016 | |
| | | | | | | | | | | | | | | | |
| | | | |
| | | | | | | | | | | | | | | 533,909 | |
| | | | | | | | | | | | | | | | |
| | | | |
Total Mortgage Pass-Through Securities
(cost: $39,471,718) | | | | | | | | | | | | | | | 38,868,598 | |
| | | | | | | | | | | | | | | | |
| | | | |
Taxable Municipal Bonds - 24.1% | | | | | | | | | | | | | | | | |
Alief Independent School District G.O. | | | 800,000 | | | | 5.20 | | | | 2/15/27 | | | | 802,080 | |
Arizona School Facilities Board 9 | | | 1,010,000 | | | | 6.00 | | | | 9/1/27 | | | | 1,038,502 | |
City of San Francisco CA | | | 105,000 | | | | 5.50 | | | | 11/1/25 | | | | 105,337 | |
Colorado Housing & Finance Authority | | | 745,000 | | | | 6.50 | | | | 5/1/48 | | | | 779,136 | |
| | |
| |
| See accompanying notes to financial statements. | | |
| | |
| 14 | | SIT MUTUAL FUNDS ANNUAL REPORT |
| | | | | | | | | | | | | | | | |
| | | | | |
| Name of Issuer | | Principal
Amount ($) | | | Coupon
Rate (%) | | | Maturity
Date | | | Fair
Value ($) | |
| | | | |
Colorado Housing & Finance Authority | | | 5,000 | | | | 4.00 | | | | 11/1/31 | | | | 4,988 | |
County of Yamhill OR | | | 370,000 | | | | 4.50 | | | | 10/1/30 | | | | 351,903 | |
Florida Capital Projects Finance Authority | | | 250,000 | | | | 4.00 | | | | 10/1/24 | | | | 247,463 | |
Florida Housing Finance Corp. | | | 1,000,000 | | | | 6.50 | | | | 1/1/55 | | | | 1,044,090 | |
Idaho Housing & Finance Association | | | 1,000,000 | | | | 6.25 | | | | 7/1/54 | | | | 1,040,950 | |
Idaho Housing & Finance Association | | | 995,000 | | | | 6.50 | | | | 7/1/53 | | | | 1,043,377 | |
Idaho Housing & Finance Association | | | 995,000 | | | | 6.00 | | | | 1/1/48 | | | | 1,021,696 | |
Illinois Housing Development Authority | | | 985,000 | | | | 5.75 | | | | 10/1/53 | | | | 997,332 | |
Illinois Housing Development Authority | | | 1,000,000 | | | | 6.00 | | | | 4/1/54 | | | | 1,029,570 | |
Illinois Housing Development Authority | | | 1,000,000 | | | | 6.50 | | | | 4/1/54 | | | | 1,054,200 | |
Kentucky Higher Education Student Loan Corp. 8 | | | 960,000 | | | | 2.52 | | | | 6/1/35 | | | | 834,960 | |
Kentucky Higher Education Student Loan Corp. | | | 1,000,000 | | | | 5.95 | | | | 6/1/37 | | | | 995,320 | |
Kindred Public School District No. 2 | | | 1,000,000 | | | | 6.00 | | | | 8/1/27 | | | | 1,026,330 | |
Louisiana Local Government Environmental Facilities & Community Development Authority | | | 1,021,352 | | | | 3.62 | | | | 2/1/29 | | | | 1,000,711 | |
Maine Municipal Bond Bank | | | 500,000 | | | | 6.12 | | | | 11/1/26 | | | | 511,085 | |
Maryland Community Development Administration | | | 315,000 | | | | 3.95 | | | | 3/1/27 | | | | 306,659 | |
Maryland Community Development Administration | | | 1,000,000 | | | | 6.00 | | | | 9/1/53 | | | | 1,023,680 | |
Massachusetts Educational Financing Authority | | | 5,000 | | | | 4.00 | | | | 1/1/32 | | | | 4,903 | |
Massachusetts Educational Financing Authority | | | 180,000 | | | | 4.41 | | | | 7/1/34 | | | | 172,001 | |
Massachusetts Educational Financing Authority | | | 965,000 | | | | 2.64 | | | | 7/1/37 | | | | 858,570 | |
Massachusetts Housing Finance Agency | | | 1,000,000 | | | | 6.50 | | | | 12/1/52 | | | | 1,045,400 | |
Massachusetts State College Building Authority | | | 500,000 | | | | 5.83 | | | | 5/1/30 | | | | 516,285 | |
Miami University of Ohio | | | 1,075,000 | | | | 6.67 | | | | 9/1/28 | | | | 1,135,802 | |
Michigan Municipal Bond Authority | | | 500,000 | | | | 6.70 | | | | 5/1/27 | | | | 501,615 | |
Minnesota Housing Finance Agency | | | 1,000,000 | | | | 6.25 | | | | 7/1/53 | | | | 1,033,460 | |
Minnesota Housing Finance Agency | | | 270,000 | | | | 4.17 | | | | 1/1/25 | | | | 267,705 | |
New Hampshire Housing Finance Authority | | | 5,000 | | | | 4.00 | | | | 7/1/35 | | | | 4,993 | |
North Carolina Housing Finance Agency | | | 500,000 | | | | 6.50 | | | | 1/1/55 | | | | 522,590 | |
North Dakota Housing Finance Agency | | | 565,000 | | | | 2.86 | | | | 7/1/24 | | | | 561,441 | |
Oklahoma Development Finance Authority | | | 441,036 | | | | 3.88 | | | | 5/1/37 | | | | 423,650 | |
Oklahoma Development Finance Authority | | | 931,996 | | | | 4.14 | | | | 12/1/33 | | | | 905,649 | |
Rhode Island Convention Center Authority 9 | | | 700,000 | | | | 3.58 | | | | 5/15/26 | | | | 677,789 | |
Rhode Island Housing & Mortgage Finance Corp. | | | 500,000 | | | | 6.50 | | | | 10/1/52 | | | | 526,195 | |
Rhode Island Student Loan Authority | | | 1,000,000 | | | | 4.00 | | | | 12/1/38 | | | | 933,930 | |
South Dakota Housing Development Authority | | | 975,000 | | | | 5.46 | | | | 5/1/53 | | | | 968,116 | |
St. Louis School District | | | 1,000,000 | | | | 6.45 | | | | 4/1/28 | | | | 1,066,140 | |
State of Connecticut Special Tax Revenue | | | 1,000,000 | | | | 5.74 | | | | 12/1/29 | | | | 1,019,190 | |
State of Oregon Housing & Community Services Department | | | 1,000,000 | | | | 6.25 | | | | 7/1/53 | | | | 1,033,840 | |
State Public School Building Authority | | | 500,000 | | | | 5.00 | | | | 9/15/27 | | | | 501,015 | |
Utah Housing Corp. | | | 1,000,000 | | | | 6.25 | | | | 1/1/54 | | | | 1,035,560 | |
Wisconsin Housing & Economic Development Authority 8 | | | 145,000 | | | | 3.50 | | | | 3/1/46 | | | | 142,877 | |
| | | | | | | | | | | | | | | | |
| | | | |
Total Taxable Municipal Bonds
(cost: $32,294,398) | | | | | | | | | | | | | | | 32,118,085 | |
| | | | | | | | | | | | | | | | |
| | | | |
U.S. Treasury / Federal Agency Securities - 1.0% | | | | | | | | | | | | | | | | |
| | | | |
Federal Agency Issues - 1.0% | | | | | | | | | | | | | | | | |
Federal Home Loan Banks | | | 1,400,000 | | | | 5.40 | | | | 2/23/26 | | | | 1,399,030 | |
| | | | | | | | | | | | | | | | |
| | | | |
| | | | | | | | | | | | | | | 1,399,030 | |
| | | | | | | | | | | | | | | | |
| | | | |
Total U.S. Treasury / Federal Agency Securities
(cost: $1,398,749) | | | | | | | | | | | | | | | 1,399,030 | |
| | | | | | | | | | | | | | | | |
| | | | |
Put Options Purchased 19 - 0.0%
(cost: $88,632) | | | | | | | | | | | | | | | 52,031 | |
| | |
| |
| See accompanying notes to financial statements. | | |
| | |
| MARCH 31, 2024 | | 15 |
SCHEDULE OF INVESTMENTS
March 31, 2024
Sit Quality Income Fund (Continued)
| | | | | | | | | | | | | | | | |
| | | | | |
| Name of Issuer | | Quantity | | | | | | | | | Fair Value ($) | |
| | | | |
Short-Term Securities - 3.0% | | | | | | | | | | | | | | | | |
Fidelity Inst. Money Mkt. Gvt. Fund, 5.25%
(cost: $4,016,220) | | | 4,016,220 | | | | | | | | | | | | 4,016,220 | |
| | | | | | | | | | | | | | | | |
| | | | |
Total Investments in Securities - 99.0%
(cost: $133,887,029) | | | | | | | | | | | | | | | 132,017,323 | |
| | | | | | | | | | | | | | | | |
| | | | |
Other Assets and Liabilities, net - 1.0% | | | | | | | | | | | | | | | 1,307,902 | |
| | | | | | | | | | | | | | | | |
| | | | |
Net Assets - 100.0% | | | | | | | | | | | | | | $ | 133,325,225 | |
| | | | | | | | | | | | | | | | |
| 1 | Variable rate security. Rate disclosed is as of March 31, 2024. Certain variable rate securities are not based on a published reference rate and spread but are determined by the issuer or agent and are based on current market conditions, or, for mortgage-backed securities, are impacted by the individual mortgages which are paying off over time. These securities do not indicate a reference rate and spread in their descriptions. |
| 4 | 144A Restricted Security. The total value of such securities as of March 31, 2024 was $20,544,520 and represented 15.4% of net assets. These securities have been determined to be liquid by the Adviser in accordance with guidelines established by the Board of Directors. |
| 8 | Securities the income from which is treated as a tax preference that is included in alternative minimum taxable income for purposes of computing federal alternative minimum tax (AMT). At March 31, 2024, 0.7% of net assets in the Fund was invested in such securities. |
| 9 | Municipal Lease Security. The total value of such securities as of March 31, 2024 was $1,716,291 and represented 1.3% of net assets. These securities have been determined to be liquid by the Adviser in accordance with guidelines established by the Board of Directors. |
| 14 | Step Coupon: A bond that pays a coupon rate that increases on a specified date(s). Rate disclosed is as of March 31, 2024. |
Numeric footnotes not disclosed are not applicable to this Schedule of Investments.
Short futures contracts outstanding as of March 31, 2024 were as follows:
| | | | | | | | | | | | | | | | |
| Type | | Contracts | | Expiration Date | | | Notional
Amount ($) | | | Value/ Unrealized Appreciation
(Depreciation) ($) | |
Short Futures: 10 | | | | | | | | | | | | | | | | |
U.S. Treasury 5-Year | | | 150 | | | | June 2024 | | | | (16,052,344) | | | | (15,636) | |
| 10 | The amount of $400,000 in cash was segregated with the broker to cover margin requirements for derivative transactions as of March 31, 2024. |
| 19 | Options outstanding as of March 31, 2024 were as follows: |
| | | | | | | | | | | | | | | | | | | | | | | | |
| Description | | Contracts | | Exercise
Price ($) | | Expiration
Date | | | Counterparty | | | Notional
Amount ($) | | | Cost/
Premiums ($) | | | Value ($) |
| | | | | |
Put Options Purchased - U.S. Treasury Futures: | | | | | | | | | | | | | | | | | | | | |
5-Year | | 111 | | 106.50 | | | May 2024 | | | | StoneX Financial, Inc. | | | | 11,821,500 | | | | 88,632 | | | | 52,031 | |
| | |
| |
| See accompanying notes to financial statements. | | |
| | |
| 16 | | SIT MUTUAL FUNDS ANNUAL REPORT |
A summary of the levels for the Fund’s investments as of March 31, 2024 is as follows (see Note 2 - significant accounting policies in the notes to financial statements):
| | | | | | | | | | | | | | | | |
| | | Investment in Securities | |
| | | | |
| | | Level 1 Quoted
Prices ($) | | | Level 2 Other significant
observable inputs ($) | | | Level 3 Significant
unobservable inputs ($) | | | Total ($) |
Assets | | | | | | | | | | | | | | | | |
Asset-Backed Securities | | | — | | | | 3,033,385 | | | | — | | | | 3,033,385 | |
Collateralized Mortgage Obligations | | | — | | | | 34,696,207 | | | | — | | | | 34,696,207 | |
Corporate Bonds | | | — | | | | 17,833,767 | | | | — | | | | 17,833,767 | |
Mortgage Pass-Through Securities | | | — | | | | 38,868,598 | | | | — | | | | 38,868,598 | |
Taxable Municipal Bonds | | | — | | | | 32,118,085 | | | | — | | | | 32,118,085 | |
U.S. Treasury / Federal Agency Securities | | | — | | | | 1,399,030 | | | | — | | | | 1,399,030 | |
Put Options Purchased | | | 52,031 | | | | — | | | | — | | | | 52,031 | |
Short-Term Securities | | | 4,016,220 | | | | — | | | | — | | | | 4,016,220 | |
Total: | | | 4,068,251 | | | | 127,949,072 | | | | — | | | | 132,017,323 | |
Liabilities | | | | | | | | | | | | | | | | |
Futures | | | (15,636 | ) | | | — | | | | — | | | | (15,636 | ) |
There were no transfers into or out of level 3 during the reporting period.
| | |
| |
| See accompanying notes to financial statements. | | |
| | |
| MARCH 31, 2024 | | 17 |
|
Sit Tax-Free Income Fund - Class S and Class Y |
OBJECTIVE & STRATEGY
The objective of the Sit Tax-Free Income Fund is to provide a high level of current income that is exempt from federal income tax, consistent with preservation of capital, by investing primarily in investment-grade municipal securities. Such municipal securities generate interest income that is exempt from both federal regular income tax and federal alternative minimum tax. During normal market conditions, the Fund invests 100% of its net assets in such tax-exempt municipal securities.
Fund Performance
The Sit Tax-Free Income Fund (Class S) provided a return of +4.88% during the 12-month period ended March 31, 2024, versus a return of +1.95% for its benchmark, the Bloomberg 5-year Municipal Bond Index. As of March 31, 2024, the Fund’s 30-day SEC yield was 3.30%, compared to the yield of 3.06% for the benchmark index. The Fund’s 12-month distribution rate was 3.60%.
Factors that Influenced the Fund’s Performance
U.S. Treasury yields rose roughly 55 to 75 basis points throughout the period, with the yield curve remaining inverted. Similarly, the tax-exempt yield curve remained partially inverted as well. Yields for short tax-exempt maturities rose approximately 60 basis points from the beginning of the period. Meanwhile, yields for intermediate and long maturities rose by about 25 to 30 basis points and 40 basis, points respectively. Tax-exempt bond outflows exceeded $18B for the period with steady outflows during most of 2023, before turning positive in early 2024. Municipal issuance for the period was almost $400B, which exceeded the prior year by approximately 9%. Credit spreads for most tax-exempt bonds narrowed throughout the period, thereby providing strong support for municipal bond prices.
The Fund’s exposure to BBB-rated bonds as well as significant allocation to below investment grade and non-rated bonds were the biggest reasons the Fund outperformed its benchmark for the period. Performance was directly correlated with credit quality as BBB-rated bonds were the best-performing part of the index and AAA-rated bonds the worst. As for duration, longer bonds generally outperformed shorter bonds despite the slight backup in tax-exempt yields. As such, the Fund benefited from a larger weighting of long-duration bonds relative to the benchmark over the last year. In addition, the Fund’s hedge in U.S. Treasury futures was a positive contributor to performance as Treasury yields rose meaningfully during the period, especially during 3Q23. From a sector perspective, the Fund’s overweight in multi-family housing bonds, with a large concentration in senior living, outperformed largely due to narrowing credit spreads and higher coupons. Other revenue bonds, including land-secured bonds, and education/student loan bonds boosted performance as well. Conversely, the Fund’s significant weighting in single-family mortgage revenue bonds lagged the benchmark mostly due to low coupon structures.
HYPOTHETICAL GROWTH OF $10,000
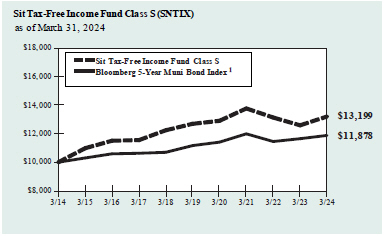
The chart above illustrates the total value of a hypothetical $10,000 investment in the Fund over the past 10 years as compared to the performance of the Bloomberg 5-Year Municipal Bond Index. Past performance does not guarantee future results. Returns include the reinvestment of distributions. The chart does not reflect the deduction of taxes that a shareholder would pay on Fund distributions or the redemption of Fund shares.
1 The Bloomberg 5-Year Municipal Bond Index is the 5 year (4-6) component of the Bloomberg Municipal Bond Index, an unmanaged, rules-based, market-value-weighted index for the long-term tax-exempt bond market. The index includes bonds with a minimum credit rating of BBB. The returns include the reinvestment of income and do not include any transaction costs, management fees or other costs. It is not possible to invest directly in an index. This is the Fund’s primary index.
Outlook and Positioning
Municipal credit remains strong in general, although we are mindful that the economy continues to experience higher-than-target inflation. The Fund’s core strategy continues to emphasize current income as the primary driver of returns over the long run and the Fund maintains a yield advantage over the benchmark. The Fund’s longer than benchmark duration, sizeable allocation to non-rated bonds, emphasis on revenue bonds, and focus on bond structures with attractive prepayment characteristics all contribute to this yield advantage. We will continue to add higher coupon bonds and focus deeply on credit analysis to differentiate opportunities as they arise. The Fund remains diversified on a geographic and issuer basis to mitigate credit and liquidity risk, and we believe the Fund is well-positioned to achieve attractive risk-adjusted returns going forward.
| | |
| Paul J. Jungquist, CFA | | Todd S. Emerson, CFA |
| Senior Portfolio Manager | | Kevin P. O’Brien, CFA |
| | Portfolio Managers |
| | |
| |
| Information on this page is unaudited. | | |
| | |
| 18 | | SIT MUTUAL FUNDS ANNUAL REPORT |
COMPARATIVE RATES OF RETURNS
as of March 31, 2024
| | | | | | | | |
| | | Sit Tax-Free Income
Fund | | | | |
| | | Class S | | Class Y | | Bloomberg 5-Year Muni Bond Index1 | | Lipper
General
Muni Bond
Fund Index2 |
One Year | | 4.88% | | 5.13% | | 1.95% | | 4.32% |
Five Year | | 0.79 | | n/a | | 1.25 | | 1.58 |
Ten Year | | 2.81 | | n/a | | 1.74 | | 2.80 |
| Since Inception-Class S (9/29/88) | | 4.56 | | n/a | | 4.39 | | 4.94 |
| Since Inception-Class Y (6/1/21) | | n/a | | -1.83 | | -0.48 | | -1.27 |
Performance figures are historical and do not guarantee future results. Investment returns and principal value will vary, and you may have a gain or loss when you sell shares. Current performance may be lower or higher than the performance data quoted. Contact the Fund for performance data current to the most recent month-end. Returns include changes in share price as well as reinvestment of all dividends and capital gains. Returns do not reflect the deduction of taxes that a shareholder would pay on Fund distributions or the redemption of Fund shares. Management fees and administrative expenses are included in the Fund’s performance. Returns for periods greater than one year are compounded average annual rates of return.
1 The Bloomberg 5-Year Municipal Bond Index is the 5 year (4-6) component of the Bloomberg Municipal Bond Index, unmanaged rules-based, market-value-weighted index for the long-term tax-exempt bond market. The index includes bonds with a minimum credit rating of BBB. The returns include the reinvestment of income and do not include any transaction costs, management fees or other costs. It is not possible to invest directly in an index.
2 The Lipper returns are obtained from Lipper Analytical Services, Inc., a large independent evaluator of mutual funds.
FUND DIVERSIFICATION
| | | | |
| |
Single Family Mortgage | | | 35.6 | % |
Other Revenue Bonds | | | 20.4 | |
Multifamily Mortgage | | | 14.8 | |
Education/Student Loan | | | 5.4 | |
Municipal Closed End Fund - Perpetual | | | 5.1 | |
Sectors less than 5% | | | 10.4 | |
Cash & Other Net Assets | | | 8.3 | |
Based on net assets as of March 31, 2024.
PORTFOLIO SUMMARY
| | | | | | |
Class S: | | | | | | |
Net Asset Value 3/31/24: | | | $8.64 | | | Per Share |
Net Asset Value 3/31/23: | | | $8.54 | | | Per Share |
Net Assets: | | | $100.2 | | | Million |
| | |
Class Y: | | | | | | |
Net Asset Value 3/31/24: | | | $8.64 | | | Per Share |
Net Asset Value 3/31/23: | | | $8.54 | | | Per Share |
Net Assets: | | | $63.7 | | | Million |
| | |
Average Maturity | | | 19.3 | | | Years |
Effective Duration:3 | | | 5.6 | | | Years |
3 Duration is a measure of estimated price sensitivity relative to changes in interest rates. Portfolios with longer durations are typically more sensitive to changes in interest rates. For example, if interest rates rise by 1%, the fair value of a security with an effective duration of 5 years would decrease by 5%, with all other factors being constant. The correlation between duration and price sensitivity is greater for securities rated investment-grade than it is for securities rated below investment-grade. Duration estimates are based on assumptions by Sit Investment Associates, Inc. (the “Adviser”) and are subject to a number of limitations. Effective duration is calculated based on historical price changes of securities held by the Fund, and therefore is a more accurate estimate of price sensitivity provided interest rates remain within their historical range.
QUALITY RATINGS (% of Net Assets)
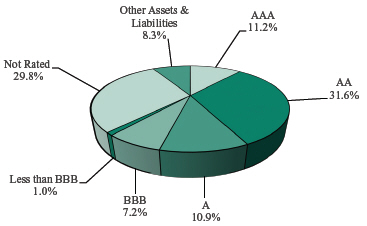
Lower of Moody’s, S&P, Fitch or Duff & Phelps ratings used.
Adviser’s Assessment of Non-Rated Securities
| | | | |
| |
AA | | | 0.3% | |
| |
BBB | | | 2.9 | |
| |
BB | | | 19.3 | |
| |
<BB | | | 7.3 | |
| | | | |
| |
Total | | | 29.8% | |
| | |
| |
| Information on this page is unaudited. | | |
| | |
| MARCH 31, 2024 | | 19 |
SCHEDULE OF INVESTMENTS
March 31, 2024
Sit Tax-Free Income Fund
| | | | | | | | | | | | | | | | |
| |
| | | | |
| Name of Issuer | | Principal Amount ($) | | | Coupon Rate (%) | | | Maturity Date | | | Fair Value ($) | |
| |
| | | | |
Municipal Bonds - 86.6% | | | | | | | | | | | | | | | | |
| | | | |
Alabama - 0.3% | | | | | | | | | | | | | | | | |
| | | | |
Mobile Co. Limited Obligation Warrants Rev. (Gomesa Proj.) 4 | | | 500,000 | | | | 4.00 | | | | 11/1/45 | | | | 453,470 | |
| | | | | | | | | | | | | | | | |
| | | | |
Alaska - 0.3% | | | | | | | | | | | | | | | | |
| | | | |
AK Industrial Dev. & Export Auth. Rev. (Boys & Girls Home) 2, 5, 15 | | | 250,000 | | | | 5.50 | | | | N/A | | | | 275 | |
| | | | |
AK Industrial Dev. & Export Auth. Rev. (GTR Fairbanks Community Hospital Foundation) | | | 250,000 | | | | 5.00 | | | | 4/1/33 | | | | 250,347 | |
| | | | |
AK Industrial Dev. & Export Auth. Rev. (Tanana Chiefs Conference Proj.) | | | 300,000 | | | | 4.00 | | | | 10/1/49 | | | | 275,700 | |
| | | | | | | | | | | | | | | | |
| | | | |
| | | | | | | | | | | | | | | 526,322 | |
| | | | | | | | | | | | | | | | |
| | | | |
Arizona - 0.4% | | | | | | | | | | | | | | | | |
| | | | |
AZ Industrial Dev. Auth. Rev. (Legacy Cares, Inc. Proj.) 2, 4, 5 | | | 750,000 | | | | 6.75 | | | | 7/1/30 | | | | 45,000 | |
| | | | |
AZ Industrial Dev. Auth. Rev. (Legacy Cares, Inc. Proj.) 2, 4, 5 | | | 100,000 | | | | 5.50 | | | | 7/1/31 | | | | 6,000 | |
| | | | |
AZ Industrial Dev. Auth. Rev. (Legacy Cares, Inc. Proj.) 2, 4, 5 | | | 750,000 | | | | 7.75 | | | | 7/1/50 | | | | 45,000 | |
| | | | |
AZ Industrial Dev. Auth. Rev. (Legacy Cares, Inc. Proj.) 2, 4, 5 | | | 200,000 | | | | 6.00 | | | | 7/1/51 | | | | 12,000 | |
| | | | |
AZ Industrial Dev. Auth. Rev. (Mirabella ST ASU Proj.) 1, 4 | | | 165,000 | | | | 4.70 | | | | 10/1/28 | | | | 147,482 | |
| | | | |
Pima Co. Industrial Dev. Auth. Rev. (LA Posada at Pusch Ridge Proj.) 4 | | | 350,000 | | | | 6.25 | | | | 11/15/35 | | | | 375,746 | |
| | | | | | | | | | | | | | | | |
| | | | |
| | | | | | | | | | | | | | | 631,228 | |
| | | | | | | | | | | | | | | | |
| | | | |
Arkansas - 0.2% | | | | | | | | | | | | | | | | |
| | | | |
Mountain Home City Sales & Use Tax Rev. | | | 450,000 | | | | 2.00 | | | | 9/1/38 | | | | 338,737 | |
| | | | | | | | | | | | | | | | |
| | | | |
California - 4.0% | | | | | | | | | | | | | | | | |
| | | | |
CA Health Facs. Financing Auth. Rev. (On Lok Senior Health Services) | | | 500,000 | | | | 5.00 | | | | 8/1/50 | | | | 517,410 | |
| | | | |
CA Municipal Finance Auth. Rev. (Aldersly Proj.) | | | 300,000 | | | | 5.00 | | | | 5/15/43 | | | | 326,388 | |
| | | | |
CA Municipal Finance Auth. Rev. (Caritas Proj.) | | | 250,000 | | | | 4.00 | | | | 8/15/56 | | | | 208,448 | |
| | | | |
CA Pollution Control Financing Auth. Rev. (Poseidon Resources) 4 | | | 300,000 | | | | 5.00 | | | | 7/1/38 | | | | 322,980 | |
| | | | |
CA Public Finance Auth. Rev. (Enso Village Proj.) 4 | | | 350,000 | | | | 3.13 | | | | 5/15/29 | | | | 341,001 | |
| | | | |
Encinitas Union School District G.O. Capital Appreciation 6 | | | 500,000 | | | | 6.75 | | | | 8/1/35 | | | | 661,465 | |
| | | | |
Irvine Facs. Financing Auth. Rev. (Gateway Preserve Land Acquisition Proj.) 9 | | | 300,000 | | | | 5.25 | | | | 5/1/48 | | | | 309,177 | |
| | | | |
Los Alamitos Unified School District Capital Appreciation C.O.P. 6 | | | 1,100,000 | | | | 6.00 | | | | 8/1/34 | | | | 1,253,373 | |
| | | | |
Orange Co. Community Facs. District No. 2017-1 Special Assessment (Village of Esencia) | | | 500,000 | | | | 4.00 | | | | 8/15/45 | | | | 456,190 | |
| | | | |
Sacramento Co. Water Financing Auth. Rev. (NATL-RE FGIC Insured) 1 | | | 500,000 | | | | 4.32 | | | | 6/1/39 | | | | 448,360 | |
| | | | |
San Jose Financing Auth. Rev. (Civic Center Garage Proj.) 9 | | | 400,000 | | | | 5.00 | | | | 6/1/39 | | | | 400,456 | |
| | | | |
Tracy Joint Unified School District G.O. Capital Appreciation 6 | | | 600,000 | | | | 7.00 | | | | 8/1/41 | | | | 631,326 | |
| | | | |
Val Verde Unified School District G.O. Capital Appreciation (AGM Insured) 6 | | | 500,000 | | | | 6.13 | | | | 8/1/34 | | | | 612,045 | |
| | | | | | | | | | | | | | | | |
| | | | |
| | | | | | | | | | | | | | | 6,488,619 | |
| | | | | | | | | | | | | | | | |
| | | | |
Colorado - 3.1% | | | | | | | | | | | | | | | | |
| | | | |
Baseline Metropolitan District No. 1 G.O. | | | 280,000 | | | | 5.00 | | | | 12/1/51 | | | | 257,485 | |
| | | | |
CO Educational & Cultural Facs. Auth. Rev. (CO Springs Charter Academy Proj.) | | | 250,000 | | | | 5.60 | | | | 7/1/34 | | | | 250,465 | |
| | | | |
CO Educational & Cultural Facs. Auth. Rev. (Mountain Phoenix Community Proj.) 4 | | | 500,000 | | | | 6.00 | | | | 7/1/43 | | | | 505,120 | |
| | | | |
CO Health Facs. Auth. Rev. (Aberdeen Ridge) | | | 400,000 | | | | 3.50 | | | | 5/15/30 | | | | 370,680 | |
| | | | |
CO Health Facs. Auth. Rev. (Aberdeen Ridge) | | | 415,000 | | | | 5.00 | | | | 5/15/44 | | | | 290,811 | |
| | | | |
CO Health Facs. Auth. Rev. (Aberdeen Ridge) | | | 850,000 | | | | 5.00 | | | | 5/15/58 | | | | 535,645 | |
| | | | |
CO Health Facs. Auth. Rev. (Covenant Retirement Community) | | | 650,000 | | | | 5.00 | | | | 12/1/48 | | | | 645,132 | |
| | | | |
Crossroads Metropolitan District No. 1 G.O. | | | 500,000 | | | | 6.50 | | | | 12/1/51 | | | | 495,950 | |
| | | | |
Reunion Metropolitan District Rev. | | | 576,230 | | | | 3.63 | | | | 12/1/44 | | | | 442,210 | |
| | | | |
Rudolph Farms Metropolitan District No. 6 G.O. | | | 500,000 | | | | 6.50 | | | | 6/1/52 | | | | 501,155 | |
| | | | |
Tree Farm Metropolitan District G.O. 4 | | | 500,000 | | | | 4.50 | | | | 12/1/41 | | | | 456,940 | |
| | |
| |
| See accompanying notes to financial statements. | | |
| | |
| 20 | | SIT MUTUAL FUNDS ANNUAL REPORT |
| | | | | | | | | | | | | | | | |
| |
| | | | |
| Name of Issuer | | Principal Amount ($) | | | Coupon Rate (%) | | | Maturity Date | | | Fair Value ($) | |
| |
| | | | |
Windler Public Improvement Auth. Rev. | | | 500,000 | | | | 4.00 | | | | 12/1/41 | | | | 404,005 | |
| | | | | | | | | | | | | | | | |
| | | | |
| | | | | | | | | | | | | | | 5,155,598 | |
| | | | | | | | | | | | | | | | |
| | | | |
Connecticut - 0.2% | | | | | | | | | | | | | | | | |
| | | | |
Stamford Hsg. Auth. Rev. (Dogwoods Proj.) 4 | | | 350,000 | | | | 11.00 | | | | 12/1/27 | | | | 391,079 | |
| | | | | | | | | | | | | | | | |
| | | | |
District of Columbia - 0.7% | | | | | | | | | | | | | | | | |
| | | | |
Metropolitan Washington Airports Auth. Aviation Rev. | | | 1,000,000 | | | | 5.25 | | | | 10/1/48 | | | | 1,077,130 | |
| | | | | | | | | | | | | | | | |
| | | | |
Florida - 16.9% | | | | | | | | | | | | | | | | |
| | | | |
Artisan Lakes East Community Dev. District Special Assessment | | | 450,000 | | | | 4.00 | | | | 5/1/51 | | | | 368,136 | |
| | | | |
Ave Maria Stewardship Community District Special Assessment (Phase 4 Master IMPT Proj.) 4 | | | 500,000 | | | | 5.50 | | | | 5/1/53 | | | | 506,645 | |
| | | | |
Blackburn Creek Community Dev. District Special Assessment (Grand Palm Proj.) | | | 100,000 | | | | 6.25 | | | | 5/1/35 | | | | 103,898 | |
| | | | |
Capital Trust Agency Rev. (Tallahassee Tapestry) 2, 4, 5 | | | 550,000 | | | | 6.75 | | | | 12/1/35 | | | | 180,125 | |
| | | | |
Capital Trust Agency Rev. (Tapestry Walden Senior Hsg. Proj.) 2, 4, 5 | | | 250,000 | | | | 6.75 | | | | 7/1/37 | | | | 46,250 | |
| | | | |
Capital Trust Agency Rev. (Tuscan Gardens Senior Living Center) 2, 5 | | | 250,000 | | | | 7.00 | | | | 4/1/35 | | | | 175,000 | |
| | | | |
CFM Community Dev. District Special Assessment | | | 500,000 | | | | 4.00 | | | | 5/1/51 | | | | 411,335 | |
| | | | |
Collier Co. Industrial Dev. Auth. Rev. (Arlington of Naples Proj.) 2, 4, 5 | | | 186,423 | | | | 7.25 | | | | 5/15/26 | | | | 5,033 | |
| | | | |
Collier Co. Industrial Dev. Auth. Rev. (Arlington of Naples Proj.) 2, 4, 5 | | | 559,270 | | | | 8.13 | | | | 5/15/44 | | | | 15,100 | |
| | | | |
Elevation Pointe Community Dev. District Special Assessment | | | 500,000 | | | | 4.40 | | | | 5/1/32 | | | | 494,290 | |
| | | | |
Entrada Community Dev. District Special Assessment Rev. 4 | | | 400,000 | | | | 4.00 | | | | 5/1/52 | | | | 342,136 | |
| | | | |
FL Dev. Finance Corp. Rev. (Green Bond-Brightline Proj.) 4 | | | 650,000 | | | | 7.38 | | | | 1/1/49 | | | | 677,365 | |
| | | | |
FL Dev. Finance Corp. Rev. (Jensen Dunes Proj.) 4 | | | 500,000 | | | | 5.00 | | | | 11/15/30 | | | | 466,500 | |
| | | | |
FL Hsg. Finance Corp. (GNMA/FNMA/FHLMC Collateralized) | | | 780,000 | | | | 5.05 | | | | 7/1/47 | | | | 799,094 | |
| | | | |
FL Hsg. Finance Corp. (GNMA/FNMA/FHLMC Collateralized) | | | 705,000 | | | | 2.75 | | | | 7/1/50 | | | | 507,812 | |
| | | | |
FL Hsg. Finance Corp. (GNMA/FNMA/FHLMC Collateralized) | | | 1,355,000 | | | | 2.30 | | | | 1/1/52 | | | | 872,932 | |
| | | | |
FL Hsg. Finance Corp. (GNMA/FNMA/FHLMC Collateralized) | | | 495,000 | | | | 4.75 | | | | 1/1/54 | | | | 493,228 | |
| | | | |
FL Hsg. Finance Corp. (GNMA/FNMA/FHLMC Collateralized) | | | 1,000,000 | | | | 6.25 | | | | 1/1/54 | | | | 1,112,400 | |
| | | | |
FRERC Community Dev. District Special Assessment 2, 5 | | | 965,000 | | | | 5.38 | | | | 11/1/40 | | | | 912,793 | |
| | | | |
Gramercy Farms Community Dev. District Special Assessment 6 | | | 240,000 | | | | 3.24 | | | | 5/1/39 | | | | 124,800 | |
| | | | |
Grande Pines Community Dev. District Special Assessment | | | 635,000 | | | | 4.00 | | | | 5/1/51 | | | | 521,018 | |
| | | | |
Hacienda North Community Dev. District Special Assessment | | | 500,000 | | | | 6.30 | | | | 5/1/43 | | | | 536,760 | |
| | | | |
Harbor Bay Community Dev. District Special Assessment | | | 280,000 | | | | 4.10 | | | | 5/1/48 | | | | 238,188 | |
| | | | |
Heritage Harbour North Community Dev. District Special Assessment | | | 200,000 | | | | 5.00 | | | | 5/1/34 | | | | 206,370 | |
| | | | |
Hyde Park Community Dev. District No. 1 Special Assessment | | | 500,000 | | | | 4.00 | | | | 5/1/52 | | | | 411,450 | |
| | | | |
Lakes of Sarasota Community Dev. District Special Assessment | | | 205,000 | | | | 3.88 | | | | 5/1/31 | | | | 201,080 | |
| | | | |
Lakes of Sarasota Community Dev. District Special Assessment | | | 500,000 | | | | 4.13 | | | | 5/1/31 | | | | 493,490 | |
| | | | |
Lakes of Sarasota Community Dev. District Special Assessment | | | 265,000 | | | | 4.10 | | | | 5/1/51 | | | | 225,110 | |
| | | | |
Lakewood Ranch Stewardship District Cap. Improvement Special Assessment Rev. | | | 100,000 | | | | 4.25 | | | | 5/1/25 | | | | 100,088 | |
| | | | |
Lakewood Ranch Stewardship District Cap. Improvement Special Assessment Rev. (Azario Proj.) | | | 520,000 | | | | 3.75 | | | | 5/1/40 | | | | 453,346 | |
| | | | |
Lakewood Ranch Stewardship District Cap. Improvement Special Assessment Rev. (Azario Proj.) | | | 580,000 | | | | 4.00 | | | | 5/1/40 | | | | 526,147 | |
| | | | |
Lakewood Ranch Stewardship District Cap. Improvement Special Assessment Rev. (Lakewood National) | | | 300,000 | | | | 5.25 | | | | 5/1/37 | | | | 305,787 | |
| | | | |
Lakewood Ranch Stewardship District Cap. Improvement Special Assessment Rev. (Lakewood National) | | | 300,000 | | | | 5.38 | | | | 5/1/47 | | | | 305,208 | |
| | | | |
Lakewood Ranch Stewardship District Cap. Improvement Special Assessment Rev. (Lakewood Ranch) | | | 400,000 | | | | 5.00 | | | | 5/1/36 | | | | 404,680 | |
| | | | |
Lakewood Ranch Stewardship District Cap. Improvement Special Assessment Rev. (Lakewood Ranch) | | | 430,000 | | | | 3.00 | | | | 5/1/41 | | | | 336,187 | |
| | | | |
Lakewood Ranch Stewardship District Cap. Improvement Special Assessment Rev. (Lorraine Lakes Proj.) 4 | | | 500,000 | | | | 3.63 | | | | 5/1/40 | | | | 430,280 | |
| | | | |
Lakewood Ranch Stewardship District Cap. Improvement Special Assessment Rev. (NE Sector Proj.) | | | 300,000 | | | | 5.00 | | | | 5/1/38 | | | | 304,512 | |
| | | | |
Lakewood Ranch Stewardship District Cap. Improvement Special Assessment Rev. (NE Sector Proj.) 4 | | | 485,000 | | | | 3.75 | | | | 5/1/40 | | | | 425,549 | |
| | | | |
Lakewood Ranch Stewardship District Cap. Improvement Special Assessment Rev. (Sweetwater Proj.) | | | 490,000 | | | | 3.10 | | | | 5/1/41 | | | | 384,846 | |
| | |
| |
| See accompanying notes to financial statements. | | |
| | |
| MARCH 31, 2024 | | 21 |
SCHEDULE OF INVESTMENTS
March 31, 2024
Sit Tax-Free Income Fund (Continued)
| | | | | | | | | | | | | | | | |
| |
| | | | |
| Name of Issuer | | Principal Amount ($) | | | Coupon Rate (%) | | | Maturity Date | | | Fair Value ($) | |
| |
| | | | |
Lakewood Ranch Stewardship District Cap. Improvement Special Assessment Rev. (Webb Proj.) 4 | | | 320,000 | | | | 5.00 | | | | 5/1/37 | | | | 324,173 | |
| | | | |
Lakewood Ranch Stewardship District Special Assessment (Lake Club Phase 4 Proj.) | | | 220,000 | | | | 4.50 | | | | 5/1/49 | | | | 201,793 | |
| | | | |
Lakewood Ranch Stewardship District Utility Rev. (System Acquisition Proj.) (AGM Insured) | | | 500,000 | | | | 5.25 | | | | 10/1/53 | | | | 544,045 | |
| | | | |
Laurel Road Community Dev. District Special Assessment | | | 420,000 | | | | 3.13 | | | | 5/1/31 | | | | 378,647 | |
| | | | |
LT Ranch Community Dev. District Special Assessment | | | 300,000 | | | | 5.90 | | | | 5/1/53 | | | | 309,306 | |
| | | | |
Marshall Creek Community Dev. District Cap. Improvement Special Assessment Rev. | | | 150,000 | | | | 5.00 | | | | 5/1/32 | | | | 150,894 | |
| | | | |
Meadow View at Twin Creeks Community Dev. District Special Assessment | | | 220,000 | | | | 3.75 | | | | 5/1/52 | | | | 172,099 | |
| | | | |
Meadow View at Twin Creeks Community Dev. District Special Assessment | | | 245,000 | | | | 4.00 | | | | 5/1/52 | | | | 200,361 | |
| | | | |
New River Community Dev. District Cap. Improvement Special Assessment Rev. 2, 5, 15 | | | 230,000 | | | | 5.00 | | | | N/A | | | | 2 | |
| | | | |
North River Ranch Community Dev. District Cap. Improvement Special Assessment Rev. | | | 245,000 | | | | 4.20 | | | | 5/1/35 | | | | 235,528 | |
| | | | |
North River Ranch Improvement Stewardship District Special Assessment Rev. | | | 500,000 | | | | 5.75 | | | | 5/1/33 | | | | 512,580 | |
| | | | |
North River Ranch Improvement Stewardship District Special Assessment Rev. | | | 250,000 | | | | 6.80 | | | | 5/1/35 | | | | 250,097 | |
| | | | |
North River Ranch Improvement Stewardship District Special Assessment Rev. | | | 500,000 | | | | 6.50 | | | | 5/1/44 | | | | 533,895 | |
| | | | |
Orange Co. Health Facs. Auth. Rev. (Presbyterian Retirement Community Proj.) | | | 550,000 | | | | 5.00 | | | | 8/1/34 | | | | 551,573 | |
| | | | |
Palm Beach Co. Health Facs. Auth. Rev. (ACTS Retirement-Life Community, Inc.) | | | 500,000 | | | | 5.00 | | | | 11/15/32 | | | | 517,705 | |
| | | | |
Palm Beach Co. Health Facs. Auth. Rev. (Green Cay Life Plan Village Proj.) 4 | | | 500,000 | | | | 11.50 | | | | 7/1/27 | | | | 588,145 | |
| | | | |
Palm Beach Co. Health Facs. Auth. Rev. (Lifespace Communities, Inc.) | | | 500,000 | | | | 4.00 | | | | 5/15/53 | | | | 360,415 | |
| | | | |
Palm Coast Park Community Dev. District Special Assessment | | | 500,000 | | | | 4.00 | | | | 5/1/52 | | | | 410,080 | |
| | | | |
Palm Coast Park Community Dev. District Special Assessment Rev. | | | 275,000 | | | | 5.40 | | | | 5/1/43 | | | | 281,146 | |
| | | | |
Parker Road Community Dev. District Special Assessment | | | 500,000 | | | | 4.10 | | | | 5/1/50 | | | | 387,920 | |
| | | | |
Parkview at Long Lake Ranch Community Dev. District Special Assessment | | | 270,000 | | | | 4.00 | | | | 5/1/51 | | | | 222,858 | |
| | | | |
Pinellas Co. Industrial Dev. Auth. Rev. | | | 500,000 | | | | 5.00 | | | | 7/1/39 | | | | 504,780 | |
| | | | |
Poitras East Community Dev. District Special Assessment | | | 335,000 | | | | 5.25 | | | | 5/1/52 | | | | 339,084 | |
| | | | |
River Landing Community Dev. District Special Assessment | | | 210,000 | | | | 4.25 | | | | 11/1/35 | | | | 198,748 | |
| | | | |
Rolling Hills Community Dev. District Special Assessment | | | 250,000 | | | | 3.65 | | | | 5/1/32 | | | | 234,275 | |
| | | | |
Sawyers Landing Community Dev. District Special Assessment Rev. | | | 500,000 | | | | 4.13 | | | | 5/1/41 | | | | 417,610 | |
| | | | |
Sawyers Landing Community Dev. District Special Assessment Rev. | | | 750,000 | | | | 4.25 | | | | 5/1/53 | | | | 598,185 | |
| | | | |
Southern Groves Community Dev. District No. 5 Special Assessment | | | 280,000 | | | | 4.00 | | | | 5/1/48 | | | | 243,670 | |
| | | | |
Sunbridge Stewardship District Special Assessment (Weslyn Park Proj.) | | | 350,000 | | | | 5.20 | | | | 5/1/42 | | | | 352,048 | |
| | | | |
Tolomato Community Dev. District Special Assessment 2, 5 | | | 120,000 | | | | 6.61 | | | | 5/1/40 | | | | 1 | |
| | | | |
Tolomato Community Dev. District Special Assessment 6 | | | 110,000 | | | | 7.00 | | | | 5/1/40 | | | | 106,016 | |
| | | | |
Trout Creek Community Dev. District Special Assessment | | | 300,000 | | | | 5.38 | | | | 5/1/38 | | | | 305,595 | |
| | | | |
Trout Creek Community Dev. District Special Assessment | | | 250,000 | | | | 4.00 | | | | 5/1/40 | | | | 220,945 | |
| | | | |
Viera Stewardship District Special Assessment | | | 250,000 | | | | 4.00 | | | | 5/1/53 | | | | 200,963 | |
| | | | |
Viera Stewardship District Special Assessment | | | 300,000 | | | | 5.50 | | | | 5/1/54 | | | | 305,562 | |
| | | | |
Waterset South Community Dev. District Special Assessment | | | 500,000 | | | | 5.90 | | | | 5/1/42 | | | | 524,505 | |
| | | | |
Windward at Lakewood Ranch Community Dev. District Special Assessment | | | 250,000 | | | | 4.25 | | | | 5/1/52 | | | | 213,305 | |
| | | | |
Wiregrass Community Dev. District Special Assessment | | | 240,000 | | | | 5.38 | | | | 5/1/35 | | | | 242,155 | |
| | | | |
Zephyr Ridge Community Dev. District Special Assessment 2, 5, 15 | | | 450,000 | | | | 5.25 | | | | N/A | | | | 78,750 | |
| | | | | | | | | | | | | | | | |
| | | | |
| | | | | | | | | | | | | | | 27,644,427 | |
| | | | | | | | | | | | | | | | |
| | | | |
Georgia - 1.7% | | | | | | | | | | | | | | | | |
| | | | |
Clarke Co. Hospital Auth. Rev. (Piedmont Healthcare) | | | 350,000 | | | | 5.00 | | | | 7/1/46 | | | | 354,966 | |
| | | | |
Fulton Co. Dev. Auth. Rev. (Piedmont Healthcare Inc. Proj.) | | | 850,000 | | | | 5.00 | | | | 7/1/44 | | | | 851,054 | |
| | | | |
Fulton Co. Dev. Auth. Rev. (Woodruff Arts Center) | | | 500,000 | | | | 5.00 | | | | 3/15/44 | | | | 523,285 | |
| | | | |
Gainesville & Hall Co. Dev. Auth. Rev. (Lanier Christian Academy, inc. Proj.) 4 | | | 640,000 | | | | 6.25 | | | | 9/1/44 | | | | 592,122 | |
| | |
| |
| See accompanying notes to financial statements. | | |
| | |
| 22 | | SIT MUTUAL FUNDS ANNUAL REPORT |
| | | | | | | | | | | | | | | | |
| |
| | | | |
| Name of Issuer | | Principal Amount ($) | | | Coupon Rate (%) | | | Maturity Date | | | Fair Value ($) | |
| |
| | | | |
Gainesville Hospital Auth. Rev. (Northeast Georgia Health System, Inc. Proj.) | | | 500,000 | | | | 5.00 | | | | 2/15/37 | | | | 521,695 | |
| | | | | | | | | | | | | | | | |
| | | | |
| | | | | | | | | | | | | | | 2,843,122 | |
| | | | | | | | | | | | | | | | |
| | | | |
Idaho - 0.5% | | | | | | | | | | | | | | | | |
| | | | |
ID Health Facs. Authority Rev. (Terraces Boise Proj.) | | | 100,000 | | | | 8.00 | | | | 10/1/28 | | | | 93,670 | |
| | | | |
ID Health Facs. Authority Rev. (Terraces Boise Proj.) | | | 290,000 | | | | 3.80 | | | | 10/1/31 | | | | 246,752 | |
| | | | |
ID Health Facs. Authority Rev. (Terraces Boise Proj.) | | | 250,000 | | | | 4.00 | | | | 10/1/33 | | | | 205,773 | |
| | | | |
ID Health Facs. Authority Rev. (Terraces Boise Proj.) | | | 500,000 | | | | 4.50 | | | | 10/1/50 | | | | 348,425 | |
| | | | | | | | | | | | | | | | |
| | | | |
| | | | | | | | | | | | | | | 894,620 | |
| | | | | | | | | | | | | | | | |
| | | | |
Illinois - 3.3% | | | | | | | | | | | | | | | | |
| | | | |
Burbank Educational Facs. Rev. (Intercultural Montessori Language School) 4 | | | 500,000 | | | | 6.00 | | | | 9/1/35 | | | | 502,785 | |
| | | | |
Chicago O’Hare International Airport Rev. (Senior Lien) (AGM Insured) | | | 500,000 | | | | 5.50 | | | | 1/1/53 | | | | 534,895 | |
| | | | |
IL Fin. Auth. Rev. (Christian Homes, Inc.) | | | 500,000 | | | | 5.00 | | | | 5/15/36 | | | | 212,500 | |
| | | | |
IL Fin. Auth. Rev. (Edward Elmhurst Healthcare) | | | 1,000,000 | | | | 5.00 | | | | 1/1/44 | | | | 1,075,590 | |
| | | | |
IL Fin. Auth. Sports Facs. Rev. (North Shore Ice Arena Proj.) | | | 1,000,000 | | | | 6.25 | | | | 12/1/38 | | | | 659,400 | |
| | | | |
IL Hsg. Dev. Auth. Rev. | | | 750,000 | | | | 4.75 | | | | 10/1/48 | | | | 759,495 | |
| | | | |
IL Sports Facilities Auth. Rev. (State Tax Supported) (AGM Insured) | | | 1,000,000 | | | | 5.25 | | | | 6/15/31 | | | | 1,001,610 | |
| | | | |
Malta Tax Allocation Rev. 2, 5 | | | 1,921,000 | | | | 5.75 | | | | 12/30/25 | | | | 441,830 | |
| | | | |
Southwestern IL Dev. Auth. Tax Allocation Ref. (Local Govt. Program) 2, 15 | | | 313,173 | | | | 7.00 | | | | N/A | | | | 250,538 | |
| | | | | | | | | | | | | | | | |
| | | | |
| | | | | | | | | | | | | | | 5,438,643 | |
| | | | | | | | | | | | | | | | |
| | | | |
Indiana - 0.4% | | | | | | | | | | | | | | | | |
| | | | |
IN Finance Auth. Rev. (BHI Senior Living) | | | 500,000 | | | | 4.00 | | | | 11/15/41 | | | | 452,770 | |
| | | | |
Merrillville Industry Economic Dev. Rev. (Belvedere Housing Proj.) | | | 300,000 | | | | 5.75 | | | | 4/1/36 | | | | 269,220 | |
| | | | | | | | | | | | | | | | |
| | | | |
| | | | | | | | | | | | | | | 721,990 | |
| | | | | | | | | | | | | | | | |
| | | | |
Iowa - 1.5% | | | | | | | | | | | | | | | | |
| | | | |
IA Fin. Auth. Rev. (GNMA/FNMA/FHLMC Collateralized) | | | 495,000 | | | | 5.50 | | | | 7/1/53 | | | | 521,492 | |
| | | | |
IA Fin. Auth. Rev. (Lifespace Communities, Inc.) | | | 565,000 | | | | 5.00 | | | | 5/15/47 | | | | 507,811 | |
| | | | |
IA Fin. Auth. Rev. (Lifespace Communities, Inc.) | | | 750,000 | | | | 5.00 | | | | 5/15/48 | | | | 673,448 | |
| | | | |
IA Fin. Auth. Rev. (Lifespace Communities, Inc.) | | | 500,000 | | | | 4.00 | | | | 5/15/53 | | | | 360,415 | |
| | | | |
IA Fin. Auth. Rev. (Lifespace Communities, Inc.) | | | 530,000 | | | | 4.00 | | | | 5/15/55 | | | | 376,199 | |
| | | | | | | | | | | | | | | | |
| | | | |
| | | | | | | | | | | | | | | 2,439,365 | |
| | | | | | | | | | | | | | | | |
| | | | |
Kentucky - 0.4% | | | | | | | | | | | | | | | | |
| | | | |
Boyle Co. Educational Facs. Auth. Rev. (Centre College) | | | 600,000 | | | | 5.25 | | | | 6/1/49 | | | | 638,010 | |
| | | | | | | | | | | | | | | | |
| | | | |
Louisiana - 3.2% | | | | | | | | | | | | | | | | |
| | | | |
Capital Area Finance Auth. Rev. (GNMA/FNMA/FHLMC Collateralized) | | | 500,000 | | | | 5.50 | | | | 10/1/53 | | | | 523,095 | |
| | | | |
LA Hsg. Fin. Agy. Single Family Mtg. Rev. (Home Ownership Prog.) (GNMA/FHLMC Collateralized) | | | 385,000 | | | | 2.50 | | | | 12/1/45 | | | | 274,694 | |
| | | | |
LA Hsg. Fin. Agy. Single Family Mtg. Rev. (Home Ownership Prog.) (GNMA/FHLMC Collateralized) | | | 500,000 | | | | 5.75 | | | | 6/1/54 | | | | 538,830 | |
| | | | |
LA Hsg. Fin. Agy. Single Family Mtg. Rev. (Home Ownership Prog.) (GNMA/FHLMC Collateralized) | | | 1,000,000 | | | | 4.65 | | | | 12/1/54 | | | | 1,003,100 | |
| | | | |
LA Local Government Environmental Facilities & Community Development Auth. | | | 500,000 | | | | 6.00 | | | | 11/15/30 | | | | 502,325 | |
| | | | |
LA Local Government Environmental Facilities & Community Development Auth. Rev. 4 | | | 300,000 | | | | 5.65 | | | | 11/1/37 | | | | 318,501 | |
| | | | |
LA Local Government Environmental Facilities & Community Development Auth. Rev. 4 | | | 200,000 | | | | 5.50 | | | | 11/1/39 | | | | 209,704 | |
| | | | |
LA Local Government Environmental Facilities & Community Development Auth. Rev. 4 | | | 410,000 | | | | 4.00 | | | | 11/1/44 | | | | 368,885 | |
| | | | |
LA Local Government Environmental Facilities & Community Development Auth. Rev. 4 | | | 390,000 | | | | 4.40 | | | | 11/1/44 | | | | 378,667 | |
| | | | |
LA Local Government Environmental Facilities & Community Development Auth. Rev. 4 | | | 715,000 | | | | 4.00 | | | | 11/1/46 | | | | 639,367 | |
| | | | |
LA Public Facs. Auth. Rev. (Tulane Univ. Proj.) (NATL-RE Insured) 1 | | | 465,000 | | | | 4.43 | | | | 2/15/36 | | | | 439,997 | |
| | | | | | | | | | | | | | | | |
| | | | |
| | | | | | | | | | | | | | | 5,197,165 | |
| | | | | | | | | | | | | | | | |
| | |
| |
| See accompanying notes to financial statements. | | |
| | |
| MARCH 31, 2024 | | 23 |
SCHEDULE OF INVESTMENTS
March 31, 2024
Sit Tax-Free Income Fund (Continued)
| | | | | | | | | | | | | | | | |
| |
| | | | |
| Name of Issuer | | Principal Amount ($) | | | Coupon Rate (%) | | | Maturity Date | | | Fair Value ($) | |
| |
| | | | |
Maryland - 0.2% | | | | | | | | | | | | | | | | |
| | | | |
MD Community Dev. Administration Rev. | | | 500,000 | | | | 2.55 | | | | 9/1/44 | | | | 370,840 | |
| | | | | | | | | | | | | | | | |
| | | | |
Massachusetts - 1.2% | | | | | | | | | | | | | | | | |
| | | | |
MA Dev. Finance Agy. Rev. (Orchard Cove, Inc.) | | | 400,000 | | | | 5.00 | | | | 10/1/49 | | | | 401,436 | |
| | | | |
MA Education Finance Auth. Education Rev. | | | 55,000 | | | | 2.63 | | | | 7/1/36 | | | | 54,365 | |
| | | | |
MA Education Finance Auth. Education Rev. | | | 1,000,000 | | | | 3.00 | | | | 7/1/51 | | | | 684,910 | |
| | | | |
MA Housing Finance Agy. Rev. | | | 900,000 | | | | 3.85 | | | | 12/1/47 | | | | 818,694 | |
| | | | | | | | | | | | | | | | |
| | | | |
| | | | | | | | | | | | | | | 1,959,405 | |
| | | | | | | | | | | | | | | | |
| | | | |
Michigan - 5.3% | | | | | | | | | | | | | | | | |
| | | | |
City of Allen Park G.O. (BAM Insured) | | | 300,000 | | | | 3.25 | | | | 5/1/34 | | | | 292,914 | |
| | | | |
MI Finance Auth. Rev. (Holly Academy Proj.) | | | 400,000 | | | | 3.00 | | | | 12/1/31 | | | | 352,612 | |
| | | | |
MI Finance Auth. Rev. (Madison Academy Proj.) | | | 255,000 | | | | 4.25 | | | | 12/1/39 | | | | 206,262 | |
| | | | |
MI Hsg. Dev. Auth. Rev. | | | 500,000 | | | | 4.90 | | | | 12/1/48 | | | | 504,170 | |
| | | | |
MI Hsg. Dev. Auth. Rev. | | | 1,000,000 | | | | 4.65 | | | | 12/1/49 | | | | 994,870 | |
| | | | |
MI Hsg. Dev. Auth. Rev. | | | 210,000 | | | | 3.15 | | | | 6/1/50 | | | | 197,202 | |
| | | | |
MI Hsg. Dev. Auth. Rev. | | | 2,000,000 | | | | 2.75 | | | | 6/1/51 | | | | 1,420,120 | |
| | | | |
MI Hsg. Dev. Auth. Rev. | | | 3,500,000 | | | | 2.50 | | | | 6/1/52 | | | | 2,325,190 | |
| | | | |
MI Hsg. Dev. Auth. Rev. | | | 1,000,000 | | | | 4.95 | | | | 12/1/53 | | | | 1,011,960 | |
| | | | |
MI Hsg. Dev. Auth. Rev. | | | 500,000 | | | | 5.75 | | | | 6/1/54 | | | | 533,700 | |
| | | | |
MI Public Educational Facs. Auth. Rev. (Chandler Park Academy) | | | 175,000 | | | | 6.35 | | | | 11/1/28 | | | | 175,098 | |
| | | | |
MI Strategic Fund. Rev. (United Methodist Retirement Facs.) | | | 415,000 | | | | 5.00 | | | | 11/15/49 | | | | 355,232 | |
| | | | |
Universal Academy Michigan Public School Rev. | | | 350,000 | | | | 4.00 | | | | 12/1/40 | | | | 315,126 | |
| | | | | | | | | | | | | | | | |
| | | | |
| | | | | | | | | | | | | | | 8,684,456 | |
| | | | | | | | | | | | | | | | |
| | | | |
Minnesota - 0.2% | | | | | | | | | | | | | | | | |
| | | | |
Apple Valley Rev. (Senior Living, LLC Proj.) | | | 475,000 | | | | 5.00 | | | | 1/1/47 | | | | 285,195 | |
| | | | | | | | | | | | | | | | |
| | | | |
Mississippi - 0.8% | | | | | | | | | | | | | | | | |
| | | | |
MS Development Bank Rev. (Green Bond-Hancock County) 4 | | | 900,000 | | | | 4.55 | | | | 11/1/39 | | | | 907,371 | |
| | | | |
MS Development Bank Rev. (Jackson Co. Gomesa Proj.) 4 | | | 400,000 | | | | 3.63 | | | | 11/1/36 | | | | 372,116 | |
| | | | | | | | | | | | | | | | |
| | | | |
| | | | | | | | | | | | | | | 1,279,487 | |
| | | | | | | | | | | | | | | | |
| | | | |
Missouri - 2.3% | | | | | | | | | | | | | | | | |
| | | | |
Joplin Industrial Dev. Auth. Rev. (32nd Street Place Community Improvement Dist. Proj.) | | | 185,000 | | | | 3.50 | | | | 11/1/40 | | | | 167,797 | |
| | | | |
Kansas City Industrial Dev. Auth. Rev. (United Methodist Retirement Home, Inc.) 2, 5 | | | 118,010 | | | | 2.00 | | | | 11/15/46 | | | | 5,517 | |
| | | | |
Kansas City Industrial Dev. Auth. Rev. (United Methodist Retirement Home, Inc.) | | | 264,421 | | | | 5.00 | | | | 11/15/46 | | | | 188,487 | |
| | | | |
MO Health & Education Facs. Auth. Rev. (Lutheran Senior Services) | | | 1,000,000 | | | | 4.00 | | | | 2/1/48 | | | | 822,820 | |
| | | | |
MO Hsg. Dev. Commission Rev. (GNMA/FNMA/FHLMC Collateralized) | | | 1,000,000 | | | | 5.00 | | | | 11/1/48 | | | | 1,017,200 | |
| | | | |
MO Hsg. Dev. Commission Rev. (GNMA/FNMA/FHLMC Collateralized) | | | 435,000 | | | | 2.50 | | | | 5/1/50 | | | | 305,657 | |
| | | | |
MO Hsg. Dev. Commission Rev. (GNMA/FNMA/FHLMC Collateralized) | | | 350,000 | | | | 2.40 | | | | 11/1/51 | | | | 233,121 | |
| | | | |
MO Hsg. Dev. Commission Rev. (GNMA/FNMA/FHLMC Collateralized) | | | 985,000 | | | | 4.70 | | | | 11/1/53 | | | | 985,049 | |
| | | | | | | | | | | | | | | | |
| | | | |
| | | | | | | | | | | | | | | 3,725,648 | |
| | | | | | | | | | | | | | | | |
| | | | |
Montana - 0.2% | | | | | | | | | | | | | | | | |
| | | | |
MT Board of Housing Single Family Rev. | | | 415,000 | | | | 2.40 | | | | 12/1/45 | | | | 291,919 | |
| | | | | | | | | | | | | | | | |
| | | | |
Nebraska - 0.0% | | | | | | | | | | | | | | | | |
| | | | |
Mead Village Tax Allocation Rev. (E3 Biofuels - Mead LLC Proj.) 2, 5, 15 | | | 410,000 | | | | 5.13 | | | | N/A | | | | 17,015 | |
| | | | | | | | | | | | | | | | |
| | | | |
Nevada - 0.7% | | | | | | | | | | | | | | | | |
| | | | |
Las Vegas NV Special Improvement District No 817 Summerlin Village 29 Special Assessment | | | 300,000 | | | | 6.00 | | | | 6/1/48 | | | | 311,556 | |
| | | | |
NV Hsg. Division Rev. (GNMA/FNMA/FHLMC Collateralized) | | | 750,000 | | | | 2.60 | | | | 4/1/46 | | | | 541,980 | |
| | |
| |
| See accompanying notes to financial statements. | | |
| | |
| 24 | | SIT MUTUAL FUNDS ANNUAL REPORT |
| | | | | | | | | | | | | | | | |
| |
| | | | |
| Name of Issuer | | Principal Amount ($) | | | Coupon Rate (%) | | | Maturity Date | | | Fair Value ($) | |
| |
| | | | |
NV Hsg. Division Rev. (GNMA/FNMA/FHLMC Collateralized) | | | 495,000 | | | | 2.45 | | | | 10/1/51 | | | | 334,397 | |
| | | | | | | | | | | | | | | | |
| | | | |
| | | | | | | | | | | | | | | 1,187,933 | |
| | | | | | | | | | | | | | | | |
| | | | |
New Jersey - 1.4% | | | | | | | | | | | | | | | | |
| | | | |
NJ Hsg. & Mtg. Finance Agy. Single Family Mtg. Rev. | | | 735,000 | | | | 2.30 | | | | 10/1/46 | | | | 497,066 | |
| | | | |
NJ Hsg. & Mtg. Finance Agy. Single Family Mtg. Rev. | | | 285,000 | | | | 4.50 | | | | 10/1/48 | | | | 285,544 | |
| | | | |
NJ Hsg. & Mtg. Finance Agy. Single Family Mtg. Rev. | | | 795,000 | | | | 2.45 | | | | 10/1/50 | | | | 536,021 | |
| | | | |
NJ Hsg. & Mtg. Finance Agy. Single Family Mtg. Rev. | | | 1,000,000 | | | | 4.80 | | | | 10/1/53 | | | | 1,000,850 | |
| | | | | | | | | | | | | | | | |
| | | | |
| | | | | | | | | | | | | | | 2,319,481 | |
| | | | | | | | | | | | | | | | |
| | | | |
New Mexico - 1.6% | | | | | | | | | | | | | | | | |
| | | | |
NM Mtg. Fin. Auth. Single Family Mtg. Rev. (GNMA/FNMA/FHLMC Collateralized) | | | 360,000 | | | | 2.70 | | | | 9/1/47 | | | | 261,115 | |
| | | | |
NM Mtg. Fin. Auth. Single Family Mtg. Rev. (GNMA/FNMA/FHLMC Collateralized) | | | 700,000 | | | | 3.35 | | | | 7/1/49 | | | | 616,322 | |
| | | | |
NM Mtg. Fin. Auth. Single Family Mtg. Rev. (GNMA/FNMA/FHLMC Collateralized) | | | 445,000 | | | | 3.00 | | | | 7/1/50 | | | | 370,859 | |
| | | | |
NM Mtg. Fin. Auth. Single Family Mtg. Rev. (GNMA/FNMA/FHLMC Collateralized) | | | 495,000 | | | | 2.35 | | | | 7/1/51 | | | | 325,997 | |
| | | | |
NM Mtg. Fin. Auth. Single Family Mtg. Rev. (GNMA/FNMA/FHLMC Collateralized) | | | 600,000 | | | | 2.63 | | | | 7/1/51 | | | | 418,416 | |
| | | | |
NM Mtg. Fin. Auth. Single Family Mtg. Rev. (GNMA/FNMA/FHLMC Collateralized) | | | 985,000 | | | | 2.80 | | | | 9/1/52 | | | | 698,168 | |
| | | | | | | | | | | | | | | | |
| | | | |
| | | | | | | | | | | | | | | 2,690,877 | |
| | | | | | | | | | | | | | | | |
| | | | |
New York - 6.0% | | | | | | | | | | | | | | | | |
| | | | |
Hempstead Town Local Development Corp. Rev. (Hofstra University Proj.) | | | 350,000 | | | | 4.00 | | | | 7/1/33 | | | | 350,228 | |
| | | | |
New York City Housing Development Corp. Multifamily Mtg. Rev. | | | 300,000 | | | | 4.05 | | | | 11/1/41 | | | | 300,075 | |
| | | | |
New York Transportation Dev. Corp. Rev. (AGM Insured) | | | 300,000 | | | | 5.50 | | | | 6/30/44 | | | | 329,925 | |
| | | | |
NY Monroe Co. Industrial Development Corp. Rev. (St. Ann’s Community Proj.) | | | 535,000 | | | | 4.00 | | | | 1/1/30 | | | | 487,235 | |
| | | | |
NY State Dormitory Auth. Rev. Ref. (N. Shore-Long Island Jewish Obligation) | | | 300,000 | | | | 5.00 | | | | 5/1/33 | | | | 304,257 | |
| | | | |
NY State Mortgage Agency Homeowner Mortgage Rev. | | | 580,000 | | | | 2.20 | | | | 4/1/36 | | | | 483,065 | |
| | | | |
NY State Mortgage Agency Homeowner Mortgage Rev. | | | 1,000,000 | | | | 4.70 | | | | 10/1/38 | | | | 1,019,980 | |
| | | | |
NY State Mortgage Agency Homeowner Mortgage Rev. | | | 1,000,000 | | | | 2.45 | | | | 10/1/45 | | | | 712,730 | |
| | | | |
NY State Mortgage Agency Homeowner Mortgage Rev. | | | 980,000 | | | | 2.50 | | | | 10/1/46 | | | | 689,881 | |
| | | | |
NY State Mortgage Agency Homeowner Mortgage Rev. | | | 975,000 | | | | 3.30 | | | | 10/1/47 | | | | 821,242 | |
| | | | |
NY State Mortgage Agency Homeowner Mortgage Rev. | | | 1,500,000 | | | | 4.80 | | | | 10/1/48 | | | | 1,518,960 | |
| | | | |
NY State Mortgage Agency Homeowner Mortgage Rev. | | | 1,625,000 | | | | 2.55 | | | | 4/1/50 | | | | 1,106,934 | |
| | | | |
NY State Mortgage Agency Homeowner Mortgage Rev. | | | 600,000 | | | | 4.90 | | | | 10/1/53 | | | | 608,844 | |
| | | | |
Westchester Co. Local Dev. Corp. Rev. (Purchase Senior Learning Community Inc. Proj.) 4 | | | 350,000 | | | | 3.60 | | | | 7/1/29 | | | | 340,315 | |
| | | | |
Westchester Co. Local Dev. Corp. Rev. (Purchase Senior Learning Community Inc. Proj.) 4 | | | 350,000 | | | | 5.00 | | | | 7/1/46 | | | | 338,121 | |
| | | | |
Western Regional Off-Track Betting Corp. Rev. 4 | | | 500,000 | | | | 4.13 | | | | 12/1/41 | | | | 396,390 | |
| | | | | | | | | | | | | | | | |
| | | | |
| | | | | | | | | | | | | | | 9,808,182 | |
| | | | | | | | | | | | | | | | |
| | | | |
North Carolina - 1.9% | | | | | | | | | | | | | | | | |
| | | | |
Mecklenburg Co. Rev. (Little Rock Apts) | | | 465,000 | | | | 5.38 | | | | 1/1/36 | | | | 466,023 | |
| | | | |
NC Education Assistance Auth. Senior Bond-Student Loan Rev. | | | 10,000 | | | | 3.13 | | | | 6/1/39 | | | | 9,404 | |
| | | | |
NC Housing Finance Agency Rev. (GNMA/FNMA/FHLMC Collateralized) | | | 500,000 | | | | 5.00 | | | | 7/1/46 | | | | 519,745 | |
| | | | |
NC Housing Finance Agency Rev. (GNMA/FNMA/FHLMC Collateralized) | | | 645,000 | | | | 3.63 | | | | 7/1/49 | | | | 566,097 | |
| | | | |
NC Housing Finance Agency Rev. (GNMA/FNMA/FHLMC Collateralized) | | | 500,000 | | | | 4.55 | | | | 1/1/50 | | | | 498,955 | |
| | | | |
NC Housing Finance Agency Rev. (GNMA/FNMA/FHLMC Collateralized) | | | 490,000 | | | | 6.00 | | | | 7/1/53 | | | | 521,272 | |
| | | | |
NC Medical Care Comm. Rev. (Deerfield Episcopal Retirement) | | | 500,000 | | | | 5.00 | | | | 11/1/37 | | | | 510,180 | |
| | | | | | | | | | | | | | | | |
| | | | |
| | | | | | | | | | | | | | | 3,091,676 | |
| | | | | | | | | | | | | | | | |
| | | | |
North Dakota - 0.7% | | | | | | | | | | | | | | | | |
| | | | |
ND Housing Finance Agency Rev. | | | 925,000 | | | | 2.50 | | | | 7/1/44 | | | | 679,579 | |
| | |
| |
| See accompanying notes to financial statements. | | |
| | |
| MARCH 31, 2024 | | 25 |
SCHEDULE OF INVESTMENTS
March 31, 2024
Sit Tax-Free Income Fund (Continued)
| | | | | | | | | | | | | | | | |
| |
| | | | |
| Name of Issuer | | Principal Amount ($) | | | Coupon Rate (%) | | | Maturity Date | | | Fair Value ($) | |
| |
| | | | |
ND Housing Finance Agency Rev. | | | 500,000 | | | | 5.10 | | | | 7/1/48 | | | | 513,345 | |
| | | | | | | | | | | | | | | | |
| | | | |
| | | | | | | | | | | | | | | 1,192,924 | |
| | | | | | | | | | | | | | | | |
| | | | |
Ohio - 3.4% | | | | | | | | | | | | | | | | |
| | | | |
Cleveland-Cuyahoga County Port Auth. Rev. (Cleveland Museum of Natural History Proj.) | | | 500,000 | | | | 4.00 | | | | 7/1/46 | | | | 480,380 | |
| | | | |
Lake Co. Port & Economic Dev. Auth. Rev. (Tapestry Wickliffe Proj.) 2, 4, 5 | | | 250,000 | | | | 6.50 | | | | 12/1/37 | | | | 72,500 | |
| | | | |
OH Housing Finance Agency Rev. | | | 1,800,000 | | | | 2.45 | | | | 9/1/51 | | | | 1,216,656 | |
| | | | |
OH Housing Finance Agency Rev. (GNMA/FNMA/FHLMC Collateralized) | | | 1,470,000 | | | | 2.85 | | | | 9/1/46 | | | | 1,131,518 | |
| | | | |
OH Housing Finance Agency Rev. (GNMA/FNMA/FHLMC Collateralized) | | | 1,385,000 | | | | 5.10 | | | | 9/1/47 | | | | 1,444,056 | |
| | | | |
OH Housing Finance Agency Rev. (GNMA/FNMA/FHLMC Collateralized) | | | 965,000 | | | | 2.75 | | | | 9/1/51 | | | | 672,953 | |
| | | | |
OH Housing Finance Agency Rev. (Middletown Phase Two Proj.) 4 | | | 500,000 | | | | 6.25 | | | | 3/1/26 | | | | 504,865 | |
| | | | | | | | | | | | | | | | |
| | | | |
| | | | | | | | | | | | | | | 5,522,928 | |
| | | | | | | | | | | | | | | | |
| | | | |
Oregon - 0.8% | | | | | | | | | | | | | | | | |
| | | | |
OR Hsg. & Community Services Dept. Rev. (Single Family Mtg. Program) | | | 500,000 | | | | 2.35 | | | | 1/1/44 | | | | 352,190 | |
| | | | |
OR Hsg. & Community Services Dept. Rev. (Single Family Mtg. Program) | | | 1,000,000 | | | | 2.38 | | | | 1/1/45 | | | | 705,400 | |
| | | | |
OR Hsg. & Community Services Dept. Rev. (Single Family Mtg. Program) | | | 280,000 | | | | 3.75 | | | | 7/1/48 | | | | 253,574 | |
| | | | | | | | | | | | | | | | |
| | | | |
| | | | | | | | | | | | | | | 1,311,164 | |
| | | | | | | | | | | | | | | | |
| | | | |
Pennsylvania - 1.9% | | | | | | | | | | | | | | | | |
| | | | |
Butler Co. General Authority Rev. (School District Proj.) (AGM G.O. of District) 1 | | | 460,000 | | | | 4.46 | | | | 10/1/34 | | | | 443,012 | |
| | | | |
PA Higher Educational Assistance Agy. Rev. | | | 400,000 | | | | 2.63 | | | | 6/1/42 | | | | 345,552 | |
| | | | |
PA Hsg. Finance Agency Rev. | | | 1,000,000 | | | | 5.00 | | | | 10/1/50 | | | | 1,031,710 | |
| | | | |
PA Hsg. Finance Agency Rev. | | | 500,000 | | | | 6.25 | | | | 10/1/53 | | | | 546,815 | |
| | | | |
Philadelphia Industrial Dev. Auth. Rev. (Charter School Proj.) | | | 350,000 | | | | 5.63 | | | | 8/1/36 | | | | 358,361 | |
| | | | |
West Cornwall Township Municipal Auth. Rev. (Lebanon Valley Brethren Home Proj.) | | | 525,000 | | | | 4.00 | | | | 11/15/46 | | | | 428,458 | |
| | | | | | | | | | | | | | | | |
| | | | |
| | | | | | | | | | | | | | | 3,153,908 | |
| | | | | | | | | | | | | | | | |
| | | | |
South Carolina - 1.8% | | | | | | | | | | | | | | | | |
| | | | |
Berkeley Co. Nexton Improvement District Special Assessment | | | 350,000 | | | | 4.25 | | | | 11/1/40 | | | | 309,092 | |
| | | | |
SC Jobs-Economic Dev. Auth. Rev. (Bishop Gadsden Episcopal Retirement Community) | | | 500,000 | | | | 4.00 | | | | 4/1/54 | | | | 379,085 | |
| | | | |
SC Jobs-Economic Dev. Auth. Rev. (River Academy Proj.) 4 | | | 325,000 | | | | 7.00 | | | | 6/15/43 | | | | 336,531 | |
| | | | |
SC Jobs-Economic Dev. Auth. Rev. (Seafields at Kiawah Island Proj.) | | | 500,000 | | | | 7.50 | | | | 11/15/53 | | | | 526,160 | |
| | | | |
SC State Hsg. Finance & Dev. Auth. Rev. | | | 445,000 | | | | 3.05 | | | | 7/1/45 | | | | 363,899 | |
| | | | |
SC State Hsg. Finance & Dev. Auth. Rev. | | | 1,000,000 | | | | 4.95 | | | | 7/1/53 | | | | 1,020,170 | |
| | | | | | | | | | | | | | | | |
| | | | |
| | | | | | | | | | | | | | | 2,934,937 | |
| | | | | | | | | | | | | | | | |
| | | | |
South Dakota - 0.5% | | | | | | | | | | | | | | | | |
| | | | |
SD Housing Dev. Auth. Rev. | | | 1,000,000 | | | | 2.50 | | | | 11/1/42 | | | | 762,410 | |
| | | | | | | | | | | | | | | | |
| | | | |
Tennessee - 3.6% | | | | | | | | | | | | | | | | |
| | | | |
Franklin Health & Education Facs. Board Rev. (Provision Cares Proton Therapy Center) 2, 4, 5 | | | 500,000 | | | | 6.50 | | | | 6/1/27 | | | | 55,000 | |
| | | | |
Metropolitan Govt. Nashville & Davidson County Health & Edu. Facs. Board Rev. (Blakford at Green Hills) | | | 895,000 | | | | 4.00 | | | | 11/1/45 | | | | 690,734 | |
| | | | |
Nashville Metropolitan Dev. & Hsg. Agency Tax Allocation 4 | | | 300,000 | | | | 5.13 | | | | 6/1/36 | | | | 305,826 | |
| | | | |
Shelby Co. Health, Education & Hsg. Facs. Rev. (CME Memphis Apts. Proj.) 2, 5, 15 | | | 1,850,000 | | | | 5.35 | | | | N/A | | | | 19 | |
| | | | |
Shelby Co. Health, Education & Hsg. Facs. Rev. (CME Memphis Apts. Proj.) 2, 5 | | | 7,875,000 | | | | 5.55 | | | | 1/1/29 | | | | 79 | |
| | | | |
Shelby Co. Health, Education & Hsg. Facs. Rev. (CME Memphis Apts. Proj.) 2, 5 | | | 1,630,000 | | | | 6.00 | | | | 1/1/29 | | | | 16 | |
| | | | |
TN Hsg. Dev. Agency Rev. | | | 815,000 | | | | 2.55 | | | | 1/1/45 | | | | 592,733 | |
| | | | |
TN Hsg. Dev. Agency Rev. | | | 1,485,000 | | | | 2.38 | | | | 7/1/46 | | | | 1,025,140 | |
| | | | |
TN Hsg. Dev. Agency Rev. | | | 385,000 | | | | 2.55 | | | | 7/1/46 | | | | 274,478 | |
| | | | |
TN Hsg. Dev. Agency Rev. | | | 495,000 | | | | 4.70 | | | | 7/1/48 | | | | 500,411 | |
| | | | |
TN Hsg. Dev. Agency Rev. | | | 730,000 | | | | 5.05 | | | | 7/1/48 | | | | 740,636 | |
| | |
| |
| See accompanying notes to financial statements. | | |
| | |
| 26 | | SIT MUTUAL FUNDS ANNUAL REPORT |
| | | | | | | | | | | | | | | | |
| |
| | | | |
| Name of Issuer | | Principal Amount ($) | | | Coupon Rate (%) | | | Maturity Date | | | Fair Value ($) | |
| |
| | | | |
TN Hsg. Dev. Agency Rev. | | | 990,000 | | | | 2.50 | | | | 7/1/51 | | | | 635,461 | |
| | | | |
TN Hsg. Dev. Agency Rev. | | | 500,000 | | | | 4.80 | | | | 7/1/54 | | | | 500,765 | |
| | | | |
TN Hsg. Dev. Agency Rev. (GNMA/FNMA/FHLMC Collateralized) | | | 500,000 | | | | 5.35 | | | | 7/1/48 | | | | 522,970 | |
| | | | | | | | | | | | | | | | |
| | | | |
| | | | | | | | | | | | | | | 5,844,268 | |
| | | | | | | | | | | | | | | | |
| | | | |
Texas - 9.2% | | | | | | | | | | | | | | | | |
| | | | |
Arlington Higher Education Finance Corp., Education Rev. (Pineywoods Community Academy) | | | 750,000 | | | | 2.38 | | | | 8/15/51 | | | | 463,410 | |
| | | | |
Brazos Higher Education Auth., Inc. Rev. (Subordinate Student Loan) | | | 1,000,000 | | | | 3.00 | | | | 4/1/40 | | | | 821,670 | |
| | | | |
Dallas Special Tax (Fair Park Venue Proj.) 1, 4 | | | 250,000 | | | | 6.25 | | | | 8/15/53 | | | | 252,592 | |
| | | | |
Houston Airport System Rev. (AGM Insured) | | | 1,000,000 | | | | 5.25 | | | | 7/1/48 | | | | 1,077,090 | |
| | | | |
New Hope Cultural Education Fac. Corp. Rev. (Cardinal Bay) 2, 5, 15 | | | 260,000 | | | | 4.00 | | | | N/A | | | | 119,600 | |
| | | | |
New Hope Cultural Education Fac. Corp. Rev. (Cardinal Bay) 2, 5 | | | 460,000 | | | | 4.00 | | | | 7/1/26 | | | | 211,600 | |
| | | | |
New Hope Cultural Education Facs. Corp. Rev. (Presbyterian Village North Proj.) | | | 500,000 | | | | 5.00 | | | | 10/1/34 | | | | 471,875 | |
| | | | |
New Hope Cultural Education Facs. Finance Corp. Rev. (Buckingham Senior Living Community, Inc.) 1 | | | 519,871 | | | | 2.00 | | | | 11/15/61 | | | | 194,323 | |
| | | | |
New Hope Cultural Education Facs. Finance Corp. Rev. (Cityscape Schools, Inc.) 4 | | | 300,000 | | | | 5.00 | | | | 8/15/39 | | | | 291,144 | |
| | | | |
New Hope Cultural Education Facs. Finance Corp. Rev. (Cityscape Schools, Inc.) 4 | | | 670,000 | | | | 5.00 | | | | 8/15/51 | | | | 610,698 | |
| | | | |
New Hope Cultural Education Facs. Finance Corp. Rev. (Presbyterian Village North Proj.) | | | 350,000 | | | | 5.25 | | | | 10/1/49 | | | | 293,962 | |
| | | | |
New Hope Cultural Education Facs. Finance Corp. Rev. (Wesleyan Homes, Inc. Proj.) | | | 750,000 | | | | 5.00 | | | | 1/1/55 | | | | 551,850 | |
| | | | |
New Hope Cultural Education Facs. Finance Corp. Rev. (Westminster Proj.) | | | 500,000 | | | | 4.00 | | | | 11/1/49 | | | | 442,760 | |
| | | | |
New Hope Cultural Education Facs. Finance Corp. Rev. (Windhaven Proj.) | | | 500,000 | | | | 5.50 | | | | 10/1/27 | | | | 492,215 | |
| | | | |
New Hope Cultural Education Facs. Finance Corp. Rev. (Windhaven Proj.) | | | 500,000 | | | | 6.50 | | | | 10/1/33 | | | | 502,260 | |
| | | | |
North Central Texas Health Facility Development Corp. (CC Young Memorial Home) 5 | | | 204,000 | | | | 5.38 | | | | 2/15/25 | | | | 112,200 | |
| | | | |
TX Affordable Hsg. Corp. Rev. (GNMA Collateralized) | | | 500,000 | | | | 5.00 | | | | 3/1/49 | | | | 508,785 | |
| | | | |
TX Affordable Hsg. Corp. Rev. (GNMA Collateralized) | | | 1,000,000 | | | | 4.88 | | | | 3/1/53 | | | | 1,005,040 | |
| | | | |
TX Department of Housing & Community Affairs (GNMA Collateralized) | | | 500,000 | | | | 3.00 | | | | 9/1/45 | | | | 403,245 | |
| | | | |
TX Department of Housing & Community Affairs (GNMA Collateralized) | | | 985,000 | | | | 2.50 | | | | 7/1/51 | | | | 670,125 | |
| | | | |
TX Department of Housing & Community Affairs (GNMA Collateralized) | | | 1,750,000 | | | | 3.13 | | | | 1/1/52 | | | | 1,321,880 | |
| | | | |
TX Department of Housing & Community Affairs (GNMA Collateralized) | | | 500,000 | | | | 5.00 | | | | 1/1/49 | | | | 513,665 | |
| | | | |
TX Department of Housing & Community Affairs (GNMA Collateralized) | | | 500,000 | | | | 3.00 | | | | 3/1/50 | | | | 379,335 | |
| | | | |
TX Department of Housing & Community Affairs (GNMA Collateralized) | | | 750,000 | | | | 5.25 | | | | 9/1/52 | | | | 782,460 | |
| | | | |
TX Department of Housing & Community Affairs (GNMA Collateralized) | | | 1,500,000 | | | | 5.25 | | | | 1/1/53 | | | | 1,565,145 | |
| | | | |
TX Department of Housing & Community Affairs (GNMA Collateralized) | | | 1,000,000 | | | | 5.25 | | | | 9/1/53 | | | | 1,043,800 | |
| | | | | | | | | | | | | | | | |
| | | | |
| | | | | | | | | | | | | | | 15,102,729 | |
| | | | | | | | | | | | | | | | |
| | | | |
Utah - 2.4% | | | | | | | | | | | | | | | | |
| | | | |
Black Desert Public Infrastructure District G.O. 4 | | | 500,000 | | | | 4.00 | | | | 3/1/51 | | | | 378,305 | |
| | | | |
Jordanelle Ridge Public Infrastructure District No. 2 G.O. 4 | | | 500,000 | | | | 7.75 | | | | 3/1/54 | | | | 505,175 | |
| | | | |
Military Installation Dev. Auth. Rev. | | | 400,000 | | | | 4.00 | | | | 6/1/41 | | | | 330,348 | |
| | | | |
Military Installation Dev. Auth. Rev. | | | 1,000,000 | | | | 4.00 | | | | 6/1/52 | | | | 736,730 | |
| | | | |
UT Charter School Finance Auth. Rev. (Mountain Sunrise Academy) 4 | | | 515,000 | | | | 3.50 | | | | 12/15/31 | | | | 444,831 | |
| | | | |
UT Hospital Auth. Rev. (IHC Health Services, Inc.) | | | 500,000 | | | | 5.00 | | | | 5/15/45 | | | | 500,450 | |
| | | | |
UT Hsg. Corp. Single Family Mtg. Rev. | | | 5,000 | | | | 5.75 | | | | 1/1/33 | | | | 5,007 | |
| | | | |
UT Hsg. Corp. Single Family Mtg. Rev. (GNMA/FNMA/FHLMC Collateralized) | | | 500,000 | | | | 4.70 | | | | 1/1/54 | | | | 494,645 | |
| | | | |
UT Hsg. Corp. Single Family Mtg. Rev. (GNMA/FNMA/FHLMC Collateralized) | | | 500,000 | | | | 5.00 | | | | 1/1/54 | | | | 511,585 | |
| | | | | | | | | | | | | | | | |
| | | | |
| | | | | | | | | | | | | | | 3,907,076 | |
| | | | | | | | | | | | | | | | |
| | | | |
Virginia - 1.0% | | | | | | | | | | | | | | | | |
| | | | |
Botetourt Co. Glebe Inc. Rev. | | | 500,000 | | | | 6.00 | | | | 7/1/44 | | | | 500,405 | |
| | | | |
VA Beach Dev. Auth. Rev. (Westminster Canterbury Proj.) | | | 320,000 | | | | 6.25 | | | | 9/1/30 | | | | 332,656 | |
| | |
| |
| See accompanying notes to financial statements. | | |
| | |
| MARCH 31, 2024 | | 27 |
SCHEDULE OF INVESTMENTS
March 31, 2024
Sit Tax-Free Income Fund (Continued)
| | | | | | | | | | | | | | | | |
| |
| | | | |
| Name of Issuer | | Principal Amount ($) | | | Coupon Rate (%) | | | Maturity Date | | | Fair Value ($) | |
| |
| | | | |
VA Beach Dev. Auth. Rev. (Westminster Canterbury Proj.) | | | 250,000 | | | | 6.50 | | | | 9/1/43 | | | | 277,860 | |
| | | | |
VA Hsg. Dev. Auth. Rev. | | | 500,000 | | | | 4.55 | | | | 10/1/49 | | | | 501,485 | |
| | | | | | | | | | | | | | | | |
| | | | |
| | | | | | | | | | | | | | | 1,612,406 | |
| | | | | | | | | | | | | | | | |
| | | | |
Washington - 0.2% | | | | | | | | | | | | | | | | |
| | | | |
Kalispel Tribe of Indians Rev. 4 | | | 300,000 | | | | 5.25 | | | | 1/1/38 | | | | 309,720 | |
| | | | | | | | | | | | | | | | |
| | | | |
West Virginia - 0.4% | | | | | | | | | | | | | | | | |
| | | | |
WV Hsg. Dev. Fund Rev. | | | 945,000 | | | | 2.50 | | | | 11/1/51 | | | | 654,384 | |
| | | | | | | | | | | | | | | | |
| | | | |
Wisconsin - 1.8% | | | | | | | | | | | | | | | | |
| | | | |
Public Finance Auth. Rev. (Grand Hyatt San Antonio Hotel Acquisition Proj.) | | | 500,000 | | | | 5.00 | | | | 2/1/52 | | | | 504,495 | |
| | | | |
Public Finance Auth. Rev. (Grand Hyatt San Antonio Hotel Acquisition Proj.) 4 | | | 500,000 | | | | 6.00 | | | | 2/1/62 | | | | 513,855 | |
| | | | |
WI Health & Educational Facs. Auth. Rev. (Benevolent Corp. Cedar Community) | | | 300,000 | | | | 5.00 | | | | 6/1/37 | | | | 289,320 | |
| | | | |
WI Public Finance Auth. Rev. (Delray Beach Radiation Therapy) 2, 4, 5 | | | 750,000 | | | | 6.25 | | | | 11/1/28 | | | | 412,500 | |
| | | | |
WI Public Finance Auth. Rev. (Lombard Public Facilities Corp.) 2, 4, 6 | | | 16,520 | | | | 9.00 | | | | 1/1/46 | | | | 447 | |
| | | | |
WI Public Finance Auth. Rev. (Lombard Public Facilities Corp.) 2, 4, 6 | | | 16,287 | | | | 9.00 | | | | 1/1/47 | | | | 409 | |
| | | | |
WI Public Finance Auth. Rev. (Lombard Public Facilities Corp.) 2, 4, 6 | | | 447 | | | | 12.00 | | | | 1/1/47 | | | | 11 | |
| | | | |
WI Public Finance Auth. Rev. (Lombard Public Facilities Corp.) 2, 4, 6 | | | 16,171 | | | | 9.00 | | | | 1/1/48 | | | | 385 | |
| | | | |
WI Public Finance Auth. Rev. (Lombard Public Facilities Corp.) 2, 4, 6 | | | 390 | | | | 12.00 | | | | 1/1/48 | | | | 9 | |
| | | | |
WI Public Finance Auth. Rev. (Lombard Public Facilities Corp.) 2, 4, 6 | | | 16,055 | | | | 9.00 | | | | 1/1/49 | | | | 360 | |
| | | | |
WI Public Finance Auth. Rev. (Lombard Public Facilities Corp.) 2, 4, 6 | | | 384 | | | | 11.00 | | | | 1/1/49 | | | | 9 | |
| | | | |
WI Public Finance Auth. Rev. (Lombard Public Facilities Corp.) 2, 4, 6 | | | 15,822 | | | | 9.00 | | | | 1/1/50 | | | | 330 | |
| | | | |
WI Public Finance Auth. Rev. (Lombard Public Facilities Corp.) 2, 4, 6 | | | 372 | | | | 11.00 | | | | 1/1/50 | | | | 8 | |
| | | | |
WI Public Finance Auth. Rev. (Lombard Public Facilities Corp.) 2, 4, 6 | | | 17,334 | | | | 9.00 | | | | 1/1/51 | | | | 343 | |
| | | | |
WI Public Finance Auth. Rev. (Lombard Public Facilities Corp.) 2, 4, 6 | | | 365 | | | | 11.00 | | | | 1/1/51 | | | | 7 | |
| | | | |
WI Public Finance Auth. Rev. (Lombard Public Facilities Corp.) 1, 2, 4, 5 | | | 446,246 | | | | 3.75 | | | | 7/1/51 | | | | 315,389 | |
| | | | |
WI Public Finance Auth. Rev. (Lombard Public Facilities Corp.) 2, 4, 6 | | | 17,218 | | | | 9.00 | | | | 1/1/52 | | | | 317 | |
| | | | |
WI Public Finance Auth. Rev. (Lombard Public Facilities Corp.) 2, 4, 6 | | | 475 | | | | 10.00 | | | | 1/1/52 | | | | 9 | |
| | | | |
WI Public Finance Auth. Rev. (Lombard Public Facilities Corp.) 2, 4, 6 | | | 16,985 | | | | 9.00 | | | | 1/1/53 | | | | 296 | |
| | | | |
WI Public Finance Auth. Rev. (Lombard Public Facilities Corp.) 2, 4, 6 | | | 469 | | | | 10.00 | | | | 1/1/53 | | | | 8 | |
| | | | |
WI Public Finance Auth. Rev. (Lombard Public Facilities Corp.) 2, 4, 6 | | | 16,869 | | | | 9.00 | | | | 1/1/54 | | | | 277 | |
| | | | |
WI Public Finance Auth. Rev. (Lombard Public Facilities Corp.) 2, 4, 6 | | | 453 | | | | 10.00 | | | | 1/1/54 | | | | 7 | |
| | | | |
WI Public Finance Auth. Rev. (Lombard Public Facilities Corp.) 2, 4, 6 | | | 16,636 | | | | 9.00 | | | | 1/1/55 | | | | 259 | |
| | | | |
WI Public Finance Auth. Rev. (Lombard Public Facilities Corp.) 2, 4, 6 | | | 444 | | | | 9.00 | | | | 1/1/55 | | | | 7 | |
| | | | |
WI Public Finance Auth. Rev. (Lombard Public Facilities Corp.) 2, 4, 6 | | | 16,404 | | | | 9.00 | | | | 1/1/56 | | | | 243 | |
| | | | |
WI Public Finance Auth. Rev. (Lombard Public Facilities Corp.) 2, 4, 6 | | | 434 | | | | 9.00 | | | | 1/1/56 | | | | 6 | |
| | | | |
WI Public Finance Auth. Rev. (Lombard Public Facilities Corp.) 2, 4, 5 | | | 23,656 | | | | 5.50 | | | | 7/1/56 | | | | 17,884 | |
| | | | |
WI Public Finance Auth. Rev. (Lombard Public Facilities Corp.) 2, 4, 6 | | | 16,287 | | | | 9.00 | | | | 1/1/57 | | | | 227 | |
| | | | |
WI Public Finance Auth. Rev. (Lombard Public Facilities Corp.) 2, 4, 6 | | | 481 | | | | 9.00 | | | | 1/1/57 | | | | 7 | |
| | | | |
WI Public Finance Auth. Rev. (Lombard Public Facilities Corp.) 2, 4, 6 | | | 16,055 | | | | 9.00 | | | | 1/1/58 | | | | 212 | |
| | | | |
WI Public Finance Auth. Rev. (Lombard Public Facilities Corp.) 2, 4, 6 | | | 469 | | | | 9.00 | | | | 1/1/58 | | | | 6 | |
| | | | |
WI Public Finance Auth. Rev. (Lombard Public Facilities Corp.) 2, 4, 6 | | | 15,938 | | | | 9.00 | | | | 1/1/59 | | | | 200 | |
| | | | |
WI Public Finance Auth. Rev. (Lombard Public Facilities Corp.) 2, 4, 6 | | | 456 | | | | 9.00 | | | | 1/1/59 | | | | 6 | |
| | | | |
WI Public Finance Auth. Rev. (Lombard Public Facilities Corp.) 2, 4, 6 | | | 447 | | | | 8.00 | | | | 1/1/60 | | | | 5 | |
| | | | |
WI Public Finance Auth. Rev. (Lombard Public Facilities Corp.) 2, 4, 6 | | | 15,822 | | | | 9.00 | | | | 1/1/60 | | | | 187 | |
| | | | |
WI Public Finance Auth. Rev. (Lombard Public Facilities Corp.) 2, 4, 6 | | | 440 | | | | 8.00 | | | | 1/1/61 | | | | 5 | |
| | | | |
WI Public Finance Auth. Rev. (Lombard Public Facilities Corp.) 2, 4, 6 | | | 15,589 | | | | 9.00 | | | | 1/1/61 | | | | 174 | |
| | | | |
WI Public Finance Auth. Rev. (Lombard Public Facilities Corp.) 2, 4, 6 | | | 428 | | | | 8.00 | | | | 1/1/62 | | | | 5 | |
| | |
| |
| See accompanying notes to financial statements. | | |
| | |
| 28 | | SIT MUTUAL FUNDS ANNUAL REPORT |
| | | | | | | | | | | | | | | | |
| |
| | | | |
| Name of Issuer | | Principal Amount ($) | | | Coupon Rate (%) | | | Maturity Date | | | Fair Value ($) | |
| |
| | | | |
WI Public Finance Auth. Rev. (Lombard Public Facilities Corp.) 2, 4, 6 | | | 15,473 | | | | 9.00 | | | | 1/1/62 | | | | 163 | |
| | | | |
WI Public Finance Auth. Rev. (Lombard Public Facilities Corp.) 2, 4, 6 | | | 419 | | | | 8.00 | | | | 1/1/63 | | | | 4 | |
| | | | |
WI Public Finance Auth. Rev. (Lombard Public Facilities Corp.) 2, 4, 6 | | | 15,240 | | | | 9.00 | | | | 1/1/63 | | | | 153 | |
| | | | |
WI Public Finance Auth. Rev. (Lombard Public Facilities Corp.) 2, 4, 6 | | | 409 | | | | 8.00 | | | | 1/1/64 | | | | 4 | |
| | | | |
WI Public Finance Auth. Rev. (Lombard Public Facilities Corp.) 2, 4, 6 | | | 15,124 | | | | 9.00 | | | | 1/1/64 | | | | 145 | |
| | | | |
WI Public Finance Auth. Rev. (Lombard Public Facilities Corp.) 2, 4, 6 | | | 403 | | | | 7.00 | | | | 1/1/65 | | | | 4 | |
| | | | |
WI Public Finance Auth. Rev. (Lombard Public Facilities Corp.) 2, 4, 6 | | | 15,008 | | | | 9.00 | | | | 1/1/65 | | | | 135 | |
| | | | |
WI Public Finance Auth. Rev. (Lombard Public Facilities Corp.) 2, 4, 6 | | | 434 | | | | 7.00 | | | | 1/1/66 | | | | 4 | |
| | | | |
WI Public Finance Auth. Rev. (Lombard Public Facilities Corp.) 2, 4, 6 | | | 14,775 | | | | 9.00 | | | | 1/1/66 | | | | 123 | |
| | | | |
WI Public Finance Auth. Rev. (Lombard Public Facilities Corp.) 2, 4, 6 | | | 5,235 | | | | 5.00 | | | | 1/1/67 | | | | 39 | |
| | | | |
WI Public Finance Auth. Rev. (Lombard Public Facilities Corp.) 2, 4, 6 | | | 192,429 | | | | 9.00 | | | | 1/1/67 | | | | 1,451 | |
| | | | |
WI Public Finance Auth. Rev. (MD Proton Treatment Center) 4 | | | 500,000 | | | | 6.13 | | | | 1/1/33 | | | | 225,000 | |
| | | | |
WI Public Finance Auth. Rev. (Searstone CCRC Project) 4 | | | 750,000 | | | | 3.00 | | | | 6/1/28 | | | | 707,685 | |
| | | | | | | | | | | | | | | | |
| | | | |
| | | | | | | | | | | | | | | 2,993,134 | |
| | | | | | | | | | | | | | | | |
| | | | |
Total Municipal Bonds
(Cost: $178,234,664) | | | | | | | | | | | | | | | 141,893,627 | |
| | | | | | | | | | | | | | | | |
|
| |
| | | | |
| | | Quantity | | | | | | | | | | |
| |
| | | | |
Investment Companies - 5.1% | | | | | | | | | | | | | | | | |
| | | | |
BlackRock Municipal Income Fund, Inc. (MUI) | | | 32,166 | | | | | | | | | | | | 387,922 | |
| | | | |
BlackRock MuniHoldings Fund, Inc. (MHD) | | | 33,512 | | | | | | | | | | | | 404,825 | |
| | | | |
BlackRock MuniHoldings Quality Fund II, Inc. (MUE) | | | 30,464 | | | | | | | | | | | | 310,124 | |
| | | | |
BlackRock MuniYield Quality Fund III, Inc. (MYI) | | | 43,083 | | | | | | | | | | | | 493,731 | |
| | | | |
DWS Municipal Income Trust (KTF) | | | 76,592 | | | | | | | | | | | | 691,626 | |
| | | | |
DWS Strategic Municipal Income Trust (KSM) | | | 29,351 | | | | | | | | | | | | 262,398 | |
| | | | |
Invesco Advantage Municipal Income Trust II (VKI) | | | 55,874 | | | | | | | | | | | | 474,929 | |
| | | | |
Invesco Municipal Opportunity Trust (VMO) | | | 62,240 | | | | | | | | | | | | 605,595 | |
| | | | |
Invesco Municipal Trust (VKQ) | | | 67,772 | | | | | | | | | | | | 657,388 | |
| | | | |
Invesco Pennsylvania Value Municipal Income Trust (VPV) | | | 31,500 | | | | | | | | | | | | 322,875 | |
| | | | |
Invesco Quality Municipal Income Trust (IQI) | | | 78,114 | | | | | | | | | | | | 756,144 | |
| | | | |
Invesco Trust for Investment Grade Municipals (VGM) | | | 56,447 | | | | | | | | | | | | 556,567 | |
| | | | |
Nuveen AMT-Free Municipal Credit Income Fund (NVG) | | | 32,623 | | | | | | | | | | | | 396,369 | |
| | | | |
Nuveen AMT-Free Quality Municipal Income Fund (NEA) | | | 100,639 | | | | | | | | | | | | 1,114,074 | |
| | | | |
Nuveen Quality Municipal Income Fund (NAD) | | | 81,295 | | | | | | | | | | | | 931,641 | |
| | | | | | | | | | | | | | | | |
| | | | |
Total Investment Companies
(cost: $10,412,156) | | | | | | | | | | | | | | | 8,366,208 | |
| | | | | | | | | | | | | | | | |
| | | | |
Total Investments in Securities - 91.7%
(cost: $188,646,820) | | | | | | | | | | | | | | | 150,259,835 | |
| | | | | | | | | | | | | | | | |
| | | | |
Other Assets and Liabilities, net - 8.3% | | | | | | | | | | | | | | | 13,630,669 | |
| | | | | | | | | | | | | | | | |
| | | | |
Net Assets - 100.0% | | | | | | | | | | | | | | | $163,890,504 | |
| | | | | | | | | | | | | | | | |
| | |
| |
| See accompanying notes to financial statements. | | |
| | |
| MARCH 31, 2024 | | 29 |
SCHEDULE OF INVESTMENTS
March 31, 2024
Sit Tax-Free Income Fund (Continued)
| 1 | Variable rate security. Rate disclosed is as of March 31, 2024. Certain variable rate securities are not based on a published reference rate and spread but are determined by the issuer or agent and are based on current market conditions, or, for mortgage-backed securities, are impacted by the individual mortgages which are paying off over time. These securities do not indicate a reference rate and spread in their descriptions. |
| 2 | Security considered illiquid by the Investment Adviser. The total value of such securities as of March 31, 2024 was $3,447,822 and represented 2.1% of net assets. |
| 4 | 144A Restricted Security. The total value of such securities as of March 31, 2024 was $18,739,969 and represented 11.4% of net assets. These securities have been determined to be liquid by the Adviser in accordance with guidelines established by the Board of Directors. |
| 5 | The issuer is in default of interest or principal payments, or other debt covenants. Income is not being accrued. The total value of such securities as of March 31, 2024 was $3,302,478 and represented 2.0% of net assets. |
| 6 | Zero coupon or convertible capital appreciation bond, for which the rate disclosed is either the effective yield on purchase date or the coupon rate to be paid upon conversion to coupon paying. |
| 9 | Municipal Lease Security. The total value of such securities as of March 31, 2024 was $709,633 and represented 0.4% of net assets. These securities have been determined to be liquid by the Adviser in accordance with guidelines established by the Board of Directors. |
| 15 | Securities with a “N/A” maturity date have passed their stated maturity date and have pending restructuring arrangements. |
Numeric footnotes not disclosed are not applicable to this Schedule of Investments.
Short futures contracts outstanding as of March 31, 2024 were as follows:
| | | | | | | | | | | | | | | | |
| Type | | Contracts | | | Expiration Date | | | Notional Amount ($) | | | Value/ Unrealized Appreciation (Depreciation) ($) | |
| |
Short Futures: 10 | | | | | | | | | | | | | | | | |
U.S. Treasury Long Bond | | | 29 | | | | June 2024 | | | | (3,492,687 | ) | | | (72,736) | |
U.S. Treasury 2-Year | | | 49 | | | | June 2024 | | | | (10,019,734 | ) | | | 6,630 | |
U.S. Treasury 5-Year | | | 90 | | | | June 2024 | | | | (9,631,407 | ) | | | (30,597) | |
U.S. Treasury 10-Year | | | 145 | | | | June 2024 | | | | (16,065,548 | ) | | | (118,050) | |
| | | | | | | | | | | | | | | | |
| | | | |
| | | | | | | | | | | | | | | (214,753) | |
| | | | | | | | | | | | | | | | |
| 10 | The amount of $6,000,000 in cash was segregated with the broker to cover margin requirements for derivative transactions as of March 31, 2024. |
A summary of the levels for the Fund’s investments as of March 31, 2024 is as follows (see Note 2 - significant accounting policies in the notes to financial statements):
| | | | | | | | | | | | | | | | |
| | | Investment in Securities | |
| | | | |
| | | | |
| | | Level 1 Quoted
Prices ($) | | | Level 2 Other significant
observable inputs ($) | | | Level 3 Significant
unobservable inputs ($) | | | Total ($) |
| | | | |
Assets | | | | | | | | | | | | | | | | |
Municipal Bonds | | | — | | | | 141,893,627 | | | | — | | | | 141,893,627 | |
Investment Companies | | | 8,366,208 | | | | — | | | | — | | | | 8,366,208 | |
Futures | | | 6,630 | | | | — | | | | — | | | | 6,630 | |
| | | | |
Total: | | | 8,372,838 | | | | 141,893,627 | | | | — | | | | 150,266,465 | |
| | | | |
Liabilities | | | | | | | | | | | | | | | | |
Futures | | | (221,383 | ) | | | — | | | | — | | | | (221,383) | |
| | | | |
There were no transfers into or out of level 3 during the reporting period.
| | |
| |
| See accompanying notes to financial statements. | | |
| | |
| 30 | | SIT MUTUAL FUNDS ANNUAL REPORT |
[This page is intentionally left blank.]
|
|
Sit Minnesota Tax-Free Income Fund |
OBJECTIVE & STRATEGY
The investment objective of the Sit Minnesota Tax-Free Income Fund is to provide a high level of current income exempt from federal regular income tax and Minnesota regular personal income tax as is consistent with the preservation of capital.
During normal market conditions, the Fund invests 100% of its net assets in municipal securities that generate interest income that is exempt from federal regular income tax and Minnesota regular personal income tax. The Fund anticipates that substantially all of its distributions to its shareholders will be exempt as such. For investors subject to the alternative minimum tax (“AMT”), up to 20% of the Fund’s income may be alternative minimum taxable income.
Fund Performance
The Sit Minnesota Tax-Free Income Fund provided a return of +3.64% during the 12-month period ended March 31, 2024, versus a return of +1.95% for its benchmark, the Bloomberg 5-year Municipal Bond Index. As of March 31, 2024, the Fund’s 30-day SEC yield was 3.34%, compared to the yield of 3.06% for the benchmark index. The Fund’s 12-month distribution rate was 3.15%.
Factors that Influenced the Fund’s Performance
U.S. Treasury yields rose roughly 55 to 75 basis points throughout the period, with the yield curve remaining inverted. Similarly, the tax-exempt yield curve remained partially inverted as well. Yields for short tax-exempt maturities rose approximately 60 basis points from the beginning of the period. Meanwhile, yields for intermediate and long maturities rose by about 25 to 30 basis points and 40 basis points, respectively. Tax-exempt bond outflows exceeded $18B for the period with steady outflows during most of 2023, before turning positive in early 2024. Municipal issuance for the period was almost $400B, which exceeded the prior year by approximately 9%. In comparison, Minnesota issuance declined more than 10% from the prior period. Credit spreads for most tax-exempt bonds narrowed throughout the period, thereby providing strong support for municipal bond prices.
Minnesota’s budget and economic outlook remain strong. The February forecast for the 2024-25 biennium showed a projected surplus of $3.7 billion. Minnesota’s unemployment rate remains well below the 3.8% national rate as of March 2024 and the state’s GO bond rating remains at the highest level with both Standard & Poor’s Corp. at AAA and Moody’s at Aaa.
The Fund’s exposure to BBB-rated bonds as well as significant allocation to below investment grade and non-rated bonds were the biggest reasons the Fund outperformed its benchmark for the period. Performance was directly correlated with credit quality as BBB-rated bonds were the best-performing part of the index and AAA-rated bonds the worst. As for duration, longer bonds generally outperformed shorter bonds despite the slight backup in tax-exempt yields. As such, the Fund benefited from a larger weighting of long duration bonds relative to the benchmark over the last year. In addition, the Fund’s hedge in U.S. Treasury futures was a positive contributor to performance as Treasury yields rose meaningfully during the period, especially during 3Q23. From a sector perspective, the Fund’s overweight in multi-family housing bonds, with a large concentration in senior living, outperformed largely due to narrowing credit spreads and higher coupons. Education/student loan bonds and healthcare bonds boosted performance as well. Conversely, the Fund’s significant weighting in single-family mortgage revenue bonds lagged the benchmark mostly due to low coupon structures.
HYPOTHETICAL GROWTH OF $10,000
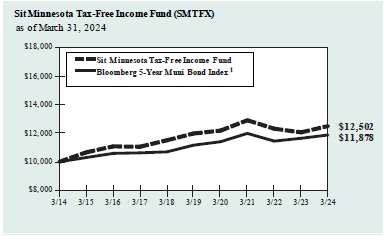
The chart above illustrates the total value of a hypothetical $10,000 investment in the Fund over the past 10 years (or for the life of the Fund if shorter) as compared to the performance of the Bloomberg 5-Year Municipal Bond Index. Past performance does not guarantee future results. Returns include the reinvestment of distributions. The chart does not reflect the deduction of taxes that a shareholder would pay on Fund distributions or the redemption of Fund shares.
1 The Bloomberg 5-Year Municipal Bond Index is the 5 year (4-6) component of the Bloomberg Municipal Bond Index, an unmanaged, rules-based, market-value-weighted index for the long-term tax-exempt bond market. The index includes bonds with a minimum credit rating of BBB. The returns include the reinvestment of income and do not include any transaction costs, management fees or other costs. It is not possible to invest directly in an index. This is the Fund’s primary index.
Outlook and Positioning
Municipal credit remains strong in general, although we are mindful that the economy continues to experience higher-than-target inflation. The Fund’s core strategy continues to emphasize current income as the primary driver of returns over the long run and the Fund maintains a yield advantage over the benchmark. The Fund’s longer than benchmark duration, sizeable allocation to non-rated bonds, emphasis on revenue bonds, and focus on bond structures with attractive prepayment characteristics all contribute to this yield advantage. We will continue to add higher coupon bonds and focus deeply on credit analysis to differentiate opportunities as they arise. The Fund remains diversified on an issuer basis to mitigate credit and liquidity risk, and we believe the Fund is well-positioned to achieve attractive risk-adjusted returns going forward.
| | |
| Paul J. Jungquist, CFA | | Todd S. Emerson, CFA |
| Senior Portfolio Manager | | Kevin P. O’Brien, CFA |
| | Portfolio Managers |
| | |
| |
| Information on this page is unaudited. | | |
| | |
| 32 | | SIT MUTUAL FUNDS ANNUAL REPORT |
COMPARATIVE RATES OF RETURNS
as of March 31, 2024
| | | | | | |
| | | Sit Minnesota
Tax-Free Income
Fund | | Bloomberg
5-Year Muni
Bond Index1 | | Lipper MN
Muni. Bond
Fund Index2 |
One Year | | 3.64% | | 1.95% | | 3.10% |
Five Year | | 0.85 | | 1.25 | | 0.94 |
Ten Year | | 2.26 | | 1.74 | | 2.17 |
| Since Inception (12/1/93) | | 4.02 | | 3.72 | | 3.82 |
Performance figures are historical and do not guarantee future results. Investment returns and principal value will vary, and you may have a gain or loss when you sell shares. Current performance may be lower or higher than the performance data quoted. Contact the Fund for performance data current to the most recent month-end. Returns include changes in share price as well as reinvestment of all dividends and capital gains. Returns do not reflect the deduction of taxes that a shareholder would pay on Fund distributions or the redemption of Fund shares. Management fees and administrative expenses are included in the Fund’s performance. Returns for periods greater than one year are compounded average annual rates of return.
1 The Bloomberg 5-Year Municipal Bond Index is the 5 year (4-6) component of the Bloomberg Municipal Bond Index, unmanaged rules-based, market-value-weighted index for the long-term tax-exempt bond market. The index includes bonds with a minimum credit rating of BBB. The returns include the reinvestment of income and do not include any transaction costs, management fees or other costs. It is not possible to invest directly in an index.
2 The Lipper returns are obtained from Lipper Analytical Services, Inc., a large independent evaluator of mutual funds.
FUND DIVERSIFICATION
| | | | |
Single Family Mortgage | | | 23.0 | % |
Multifamily Mortgage | | | 21.4 | |
Education/Student Loan | | | 17.0 | |
Hospital/Health Care | | | 13.7 | |
General Obligation | | | 9.5 | |
Sectors less than 5% | | | 10.6 | |
Cash & Other Net Assets | | | 4.8 | |
Based on net assets as of March 31, 2024.
PORTFOLIO SUMMARY
| | | | |
Net Asset Value 3/31/24: | | $9.47 | | Per Share |
Net Asset Value 3/31/23: | | $9.43 | | Per Share |
Net Assets: | | $406.0 | | Million |
Average Maturity | | 16.2 | | Years |
Effective Duration:3 | | 5.6 | | Years |
3 Duration is a measure of estimated price sensitivity relative to changes in interest rates. Portfolios with longer durations are typically more sensitive to changes in interest rates. For example, if interest rates rise by 1%, the fair value of a security with an effective duration of 5 years would decrease by 5%, with all other factors being constant. The correlation between duration and price sensitivity is greater for securities rated investment-grade than it is for securities rated below investment-grade. Duration estimates are based on assumptions by Sit Investment Associates, Inc. (the “Adviser”) and are subject to a number of limitations. Effective duration is calculated based on historical price changes of securities held by the Fund, and therefore is a more accurate estimate of price sensitivity provided interest rates remain within their historical range.
QUALITY RATINGS (% of Net Assets)
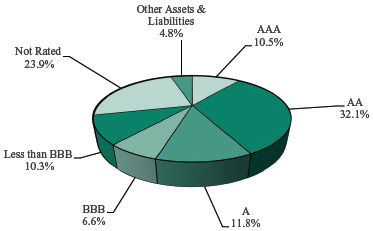
Lower of Moody’s, S&P, Fitch or Duff & Phelps ratings used.
Adviser’s Assessment of Non-Rated Securities
| | | | |
| |
A | | | 0.9% | |
| |
BBB | | | 7.4 | |
| |
BB | | | 13.4 | |
| |
<BB | | | 2.2 | |
| | | | |
| |
Total | | | 23.9% | |
| | |
| |
| Information on this page is unaudited. | | |
| | |
| MARCH 31, 2024 | | 33 |
SCHEDULE OF INVESTMENTS
March 31, 2024
Sit Minnesota Tax-Free Income Fund
| | | | | | | | | | | | | | | | |
| | | | |
| Name of Issuer | | Principal Amount ($) | | | Coupon Rate (%) | | | Maturity Date | | | Fair Value ($) | |
| |
| | | | |
Municipal Bonds - 94.8% | | | | | | | | | | | | | | | | |
| | | | |
Education/Student Loan - 17.0% | | | | | | | | | | | | | | | | |
| | | | |
Baytown Township Rev. (St. Croix Prep) | | | 1,000,000 | | | | 4.00 | | | | 8/1/36 | | | | 920,000 | |
| | | | |
Bethel Charter School Lease Rev. (Spectrum High School Proj.) | | | 1,100,000 | | | | 4.00 | | | | 7/1/37 | | | | 1,000,274 | |
| | | | |
Bethel Charter School Lease Rev. (Spectrum High School Proj.) | | | 1,750,000 | | | | 4.25 | | | | 7/1/47 | | | | 1,483,125 | |
| | | | |
Brooklyn Park Charter School Lease Rev. (Athlos Leadership Academy Proj.) | | | 605,000 | | | | 5.25 | | | | 7/1/30 | | | | 590,486 | |
| | | | |
Cologne Charter School Lease Rev. (Cologne Academy Proj.) | | | 320,000 | | | | 4.00 | | | | 7/1/24 | | | | 319,658 | |
| | | | |
Cologne Charter School Lease Rev. (Cologne Academy Proj.) | | | 575,000 | | | | 5.00 | | | | 7/1/29 | | | | 575,322 | |
| | | | |
Deephaven Charter School Lease Rev. (Eagle Ridge Academy Proj.) | | | 855,000 | | | | 5.25 | | | | 7/1/37 | | | | 861,489 | |
| | | | |
Deephaven Charter School Lease Rev. (Eagle Ridge Academy Proj.) | | | 600,000 | | | | 5.25 | | | | 7/1/40 | | | | 602,676 | |
| | | | |
Deephaven Charter School Lease Rev. (Eagle Ridge Academy Proj.) | | | 1,000,000 | | | | 5.50 | | | | 7/1/50 | | | | 1,002,890 | |
| | | | |
Duluth Hsg. & Redevelopment Auth. Rev. (Public School Academy Proj.) | | | 1,100,000 | | | | 5.00 | | | | 11/1/38 | | | | 1,013,122 | |
| | | | |
Duluth Hsg. & Redevelopment Auth. Rev. (Public School Academy Proj.) | | | 350,000 | | | | 5.00 | | | | 11/1/48 | | | | 296,562 | |
| | | | |
Forest Lake Charter School Lease Rev. (Lake International Language Academy) | | | 310,000 | | | | 4.50 | | | | 8/1/26 | | | | 308,965 | |
| | | | |
Forest Lake Charter School Lease Rev. (Lake International Language Academy) | | | 850,000 | | | | 5.50 | | | | 8/1/36 | | | | 852,006 | |
| | | | |
Ham Lake Charter School Lease Rev. (Davinci Academy Proj.) | | | 875,000 | | | | 5.00 | | | | 7/1/31 | | | | 868,114 | |
| | | | |
Ham Lake Charter School Lease Rev. (Parnassus Prep. Sch. Proj.) | | | 625,000 | | | | 4.00 | | | | 11/1/26 | | | | 612,681 | |
| | | | |
Ham Lake Charter School Lease Rev. (Parnassus Prep. Sch. Proj.) | | | 2,720,000 | | | | 5.00 | | | | 11/1/36 | | | | 2,723,128 | |
| | | | |
Hugo Charter School Lease Rev. (Noble Academy Proj.) | | | 750,000 | | | | 5.00 | | | | 7/1/29 | | | | 750,825 | |
| | | | |
Hugo Charter School Lease Rev. (Noble Academy Proj.) | | | 1,000,000 | | | | 5.00 | | | | 7/1/34 | | | | 1,000,780 | |
| | | | |
Independence Charter School Lease Rev. (Beacon Academy Proj.) | | | 235,000 | | | | 4.25 | | | | 7/1/26 | | | | 230,939 | |
| | | | |
Independence Charter School Lease Rev. (Beacon Academy Proj.) | | | 750,000 | | | | 4.75 | | | | 7/1/31 | | | | 727,133 | |
| | | | |
Independence Charter School Lease Rev. (Beacon Academy Proj.) | | | 1,200,000 | | | | 5.00 | | | | 7/1/36 | | | | 1,155,204 | |
| | | | |
Independence Charter School Lease Rev. (Paladin High School Proj.) | | | 225,000 | | | | 3.25 | | | | 6/1/31 | | | | 196,195 | |
| | | | |
Independence Charter School Lease Rev. (Paladin High School Proj.) | | | 1,410,000 | | | | 4.00 | | | | 6/1/51 | | | | 1,010,617 | |
| | | | |
Minneapolis School Lease Rev. (Friendship Academy of the Arts) 4 | | | 560,000 | | | | 4.00 | | | | 12/1/31 | | | | 504,745 | |
| | | | |
Minneapolis School Lease Rev. (Friendship Academy of the Arts) 4 | | | 1,385,000 | | | | 5.25 | | | | 12/1/43 | | | | 1,225,046 | |
| | | | |
Minneapolis School Lease Rev. (Twin Cities International School) 4 | | | 825,000 | | | | 4.25 | | | | 12/1/27 | | | | 816,412 | |
| | | | |
Minneapolis School Lease Rev. (Twin Cities International School) 4 | | | 1,000,000 | | | | 5.00 | | | | 12/1/37 | | | | 1,001,250 | |
| | | | |
MN Higher Education Fac. Auth. Rev. (Augsburg College) | | | 3,075,000 | | | | 4.25 | | | | 5/1/40 | | | | 2,606,585 | |
| | | | |
MN Higher Education Fac. Auth. Rev. (Bethel Univ.) | | | 1,500,000 | | | | 5.00 | | | | 5/1/47 | | | | 1,339,560 | |
| | | | |
MN Higher Education Fac. Auth. Rev. (College of St. Benedict) | | | 1,900,000 | | | | 5.00 | | | | 3/1/37 | | | | 1,929,203 | |
| | | | |
MN Higher Education Fac. Auth. Rev. (College of St. Olaf) | | | 2,530,000 | | | | 3.00 | | | | 10/1/41 | | | | 2,143,340 | |
| | | | |
MN Higher Education Fac. Auth. Rev. (Univ. of St. Thomas) | | | 2,000,000 | | | | 5.00 | | | | 10/1/47 | | | | 2,097,480 | |
| | | | |
MN Higher Education Fac. Auth. Rev. (Univ. of St. Thomas) | | | 4,000,000 | | | | 5.00 | | | | 10/1/47 | | | | 4,194,960 | |
| | | | |
MN Higher Education Fac. Auth. Rev. (Univ. of St. Thomas) | | | 750,000 | | | | 5.00 | | | | 4/1/35 | | | | 775,553 | |
| | | | |
MN Higher Education Fac. Auth. Rev. (Univ. of St. Thomas) | | | 1,150,000 | | | | 4.00 | | | | 4/1/39 | | | | 1,144,491 | |
| | | | |
MN Higher Education Fac. Auth. Rev. (Univ. of St. Thomas) | | | 850,000 | | | | 5.00 | | | | 10/1/40 | | | | 902,454 | |
| | | | |
MN Higher Education Fac. Auth. Rev. (Univ. of St. Thomas) | | | 4,000,000 | | | | 4.00 | | | | 10/1/44 | | | | 3,886,360 | |
| | | | |
MN Higher Education Fac. Auth. Rev. (Univ. of St. Thomas) | | | 3,650,000 | | | | 5.00 | | | | 10/1/49 | | | | 3,898,565 | |
| | | | |
MN Office of Higher Education Rev. 8 | | | 2,000,000 | | | | 4.00 | | | | 11/1/42 | | | | 1,932,620 | |
| | | | |
MN Office of Higher Education Rev. 8 | | | 2,260,000 | | | | 2.65 | | | | 11/1/38 | | | | 1,993,953 | |
| | | | |
MN Office of Higher Education Rev. 8 | | | 990,000 | | | | 4.00 | | | | 11/1/37 | | | | 978,387 | |
| | | | |
Moorhead Educational Fac. Rev. (Concordia College Corp. Proj.) | | | 1,250,000 | | | | 5.00 | | | | 12/1/40 | | | | 1,261,125 | |
| | | | |
Savage Charter School Lease Rev. (Aspen Academy) | | | 325,000 | | | | 4.00 | | | | 10/1/26 | | | | 318,052 | |
| | | | |
St. Cloud Charter School Lease Rev. (Stride Academy Proj.) | | | 1,850,000 | | | | 5.00 | | | | 4/1/36 | | | | 1,687,441 | |
| | |
| |
| See accompanying notes to financial statements. | | |
| | |
| 34 | | SIT MUTUAL FUNDS ANNUAL REPORT |
| | | | | | | | | | | | | | | | |
| |
| | | | |
| Name of Issuer | | Principal Amount ($) | | | Coupon Rate (%) | | | Maturity Date | | | Fair Value ($) | |
| |
| | | | |
St. Paul Hsg. & Redev. Auth. | | | 700,000 | | | | 5.00 | | | | 12/1/30 | | | | 702,989 | |
| | | | |
St. Paul Hsg. & Redev. Auth. | | | 1,150,000 | | | | 5.00 | | | | 12/1/37 | | | | 1,151,576 | |
| | | | |
St. Paul Hsg. & Redev. Auth. | | | 705,000 | | | | 5.00 | | | | 12/1/46 | | | | 673,444 | |
| | | | |
St. Paul Hsg. & Redev. Auth. (German Immersion School) | | | 855,000 | | | | 5.00 | | | | 7/1/33 | | | | 855,103 | |
| | | | |
St. Paul Hsg. & Redev. Auth. (Hope Community Academy Proj.) | | | 720,000 | | | | 4.50 | | | | 12/1/29 | | | | 665,467 | |
| | | | |
St. Paul Hsg. & Redev. Auth. (Math & Science Academy) 4 | | | 900,000 | | | | 3.00 | | | | 6/1/31 | | | | 772,542 | |
| | | | |
St. Paul Hsg. & Redev. Auth. (Math & Science Academy) 4 | | | 1,225,000 | | | | 4.00 | | | | 6/1/51 | | | | 847,320 | |
| | | | |
St. Paul Hsg. & Redev. Auth. (Nova Classical Academy Proj.) | | | 250,000 | | | | 2.00 | | | | 9/1/26 | | | | 235,412 | |
| | | | |
St. Paul Hsg. & Redev. Auth. (Nova Classical Academy Proj.) | | | 350,000 | | | | 4.00 | | | | 9/1/31 | | | | 338,628 | |
| | | | |
St. Paul Hsg. & Redev. Auth. (St. Paul Conservatory for Performing Artists) | | | 1,135,000 | | | | 4.63 | | | | 3/1/43 | | | | 981,809 | |
| | | | |
St. Paul Hsg. & Redev. Auth. (Twin Cities Academy Proj.) | | | 500,000 | | | | 4.00 | | | | 7/1/25 | | | | 495,060 | |
| | | | |
St. Paul Hsg. & Redev. Auth. (Twin Cities Academy Proj.) | | | 955,000 | | | | 5.00 | | | | 7/1/35 | | | | 940,408 | |
| | | | |
St. Paul Hsg. & Redev. Auth. Rev. (Community of Peace Academy Proj.) | | | 880,000 | | | | 3.00 | | | | 12/1/29 | | | | 810,286 | |
| | | | |
St. Paul Hsg. & Redev. Auth. Rev. (Community of Peace Academy Proj.) | | | 600,000 | | | | 4.00 | | | | 12/1/39 | | | | 527,448 | |
| | | | |
St. Paul Hsg. & Redev. Auth. Rev. (Community of Peace Academy Proj.) | | | 1,000,000 | | | | 4.00 | | | | 12/1/49 | | | | 793,240 | |
| | | | |
St. Paul Hsg. & Redev. Auth. Rev. (Metro Deaf School Proj.) 4 | | | 700,000 | | | | 5.00 | | | | 6/15/38 | | | | 688,765 | |
| | | | |
St. Paul Hsg. & Redev. Auth. Rev. (Nova Classical Academy Proj.) | | | 1,000,000 | | | | 4.13 | | | | 9/1/47 | | | | 843,400 | |
| | | | |
Woodbury Charter School Lease Rev. | | | 400,000 | | | | 3.00 | | | | 12/1/30 | | | | 354,276 | |
| | | | |
Woodbury Charter School Lease Rev. | | | 400,000 | | | | 4.00 | | | | 12/1/40 | | | | 337,384 | |
| | | | |
Woodbury Charter School Lease Rev. | | | 555,000 | | | | 4.00 | | | | 12/1/50 | | | | 423,926 | |
| | | | | | | | | | | | | | | | |
| | | | |
| | | | | | | | | | | | | | | 69,178,256 | |
| | | | | | | | | | | | | | | | |
| | | | |
Escrowed To Maturity/Prerefunded - 0.3% | | | | | | | | | | | | | | | | |
| | | | |
Lakeville Hsg. & Redev. Auth. Parking Rev. (Ice Arena. Proj.) | | | 1,250,000 | | | | 4.00 | | | | 2/1/32 | | | | 1,263,650 | |
| | | | | | | | | | | | | | | | |
| | | | |
General Obligation - 9.5% | | | | | | | | | | | | | | | | |
| | | | |
Beltrami G.O. | | | 1,000,000 | | | | 4.00 | | | | 12/1/44 | | | | 993,540 | |
| | | | |
Blooming Prairie Independent School District No. 756 | | | 1,300,000 | | | | 2.25 | | | | 2/1/45 | | | | 892,255 | |
| | | | |
Itasca County Independent School District No. 318 | | | 4,050,000 | | | | 2.00 | | | | 2/1/39 | | | | 2,852,131 | |
| | | | |
Itasca County Independent School District No. 318 | | | 4,250,000 | | | | 2.00 | | | | 2/1/40 | | | | 2,921,450 | |
| | | | |
Itasca G.O. | | | 2,500,000 | | | | 2.38 | | | | 2/1/45 | | | | 1,751,625 | |
| | | | |
Itasca G.O. | | | 4,000,000 | | | | 2.50 | | | | 2/1/50 | | | | 2,687,480 | |
| | | | |
Madison Lake G.O. | | | 590,000 | | | | 2.13 | | | | 2/1/42 | | | | 412,145 | |
| | | | |
Minnetonka Independent School District No. 276 | | | 1,900,000 | | | | 5.00 | | | | 2/1/41 | | | | 1,912,084 | |
| | | | |
Moorhead G.O. | | | 510,000 | | | | 2.13 | | | | 2/1/42 | | | | 350,446 | |
| | | | |
Morrison Co. Education District No. 6979 | | | 1,000,000 | | | | 4.50 | | | | 2/1/34 | | | | 1,003,750 | |
| | | | |
Norwood Young America Independent School District No. 108 | | | 1,400,000 | | | | 2.13 | | | | 2/1/42 | | | | 979,762 | |
| | | | |
Norwood Young America Independent School District No. 108 | | | 1,500,000 | | | | 2.25 | | | | 2/1/45 | | | | 1,020,375 | |
| | | | |
Owatonna Independent School District No. 761 | | | 750,000 | | | | 2.13 | | | | 2/1/40 | | | | 552,495 | |
| | | | |
Richfield Independent School District No. 280 | | | 2,000,000 | | | | 4.00 | | | | 2/1/37 | | | | 2,027,720 | |
| | | | |
Robbinsdale Independent School District No. 281 | | | 1,000,000 | | | | 2.25 | | | | 2/1/41 | | | | 737,900 | |
| | | | |
Roseau Independent School District No. 682 | | | 400,000 | | | | 2.25 | | | | 2/1/46 | | | | 268,652 | |
| | | | |
Sauk Centre Independent School District No. 743 | | | 1,000,000 | | | | 2.00 | | | | 2/1/40 | | | | 718,380 | |
| | | | |
St. Cloud G.O. | | | 1,090,000 | | | | 2.00 | | | | 2/1/41 | | | | 812,628 | |
| | | | |
St. Paul Independent School District No. 625 | | | 2,475,000 | | | | 2.00 | | | | 2/1/40 | | | | 1,775,862 | |
| | | | |
State of Minnesota G.O. | | | 5,550,000 | | | | 2.00 | | | | 9/1/41 | | | | 3,861,579 | |
| | | | |
White Bear Lake Independent School District No. 624 | | | 10,850,000 | | | | 3.00 | | | | 2/1/43 | | | | 9,146,225 | |
| | |
| |
| See accompanying notes to financial statements. | | |
| | |
| MARCH 31, 2024 | | 35 |
SCHEDULE OF INVESTMENTS
March 31, 2024
Sit Minnesota Tax-Free Income Fund (Continued)
| | | | | | | | | | | | | | | | |
| | | | |
| Name of Issuer | | Principal Amount ($) | | | Coupon Rate (%) | | | Maturity Date | | | Fair Value ($) | |
| |
| | | | |
Zumbrota-Mazeppa Independent School District No. 2805 | | | 1,500,000 | | | | 2.50 | | | | 2/1/44 | | | | 1,096,650 | |
| | | | | | | | | | | | | | | | |
| | | | |
| | | | | | | | | | | | | | | 38,775,134 | |
| | | | | | | | | | | | | | | | |
| | | | |
Hospital/Health Care - 13.7% | | | | | | | | | | | | | | | | |
| | | | |
Center City Heath Care Facs. Rev. (Hazelden Betty Ford Foundation Proj.) | | | 250,000 | | | | 5.00 | | | | 11/1/29 | | | | 251,355 | |
| | | | |
Center City Heath Care Facs. Rev. (Hazelden Betty Ford Foundation Proj.) | | | 500,000 | | | | 5.00 | | | | 11/1/44 | | | | 501,140 | |
| | | | |
Chatfield Health Care and Hsg. Facs. Rev. (Chosen Valley Care Center) | | | 1,225,000 | | | | 5.00 | | | | 9/1/52 | | | | 990,841 | |
| | | | |
Chippewa Co. Rev. (Monte Video Hospital Proj.) | | | 1,000,000 | | | | 4.00 | | | | 3/1/32 | | | | 976,850 | |
| | | | |
Crookston Health Care Facs. Rev. (Riverview Health Care Proj.) | | | 1,000,000 | | | | 4.00 | | | | 5/1/32 | | | | 800,100 | |
| | | | |
Cuyuna Range Hospital District Health Care Facs. Rev. | | | 1,000,000 | | | | 5.50 | | | | 5/1/48 | | | | 1,015,160 | |
| | | | |
Dakota Co. Community Dev. Agy. (Sanctuary at W. St. Paul Proj.) | | | 1,300,000 | | | | 5.75 | | | | 8/1/30 | | | | 988,091 | |
| | | | |
Dakota Co. Community Dev. Agy. (Sanctuary at W. St. Paul Proj.) | | | 1,050,000 | | | | 6.00 | | | | 8/1/35 | | | | 732,701 | |
| | | | |
Duluth Economic Dev. Auth. Rev. (St. Luke Hospital of Duluth) | | | 400,000 | | | | 4.00 | | | | 6/15/35 | | | | 404,408 | |
| | | | |
Duluth Economic Dev. Auth. Rev. (St. Luke Hospital of Duluth) | | | 170,000 | | | | 4.00 | | | | 6/15/35 | | | | 171,673 | |
| | | | |
Duluth Economic Dev. Auth. Rev. (St. Luke Hospital of Duluth) | | | 170,000 | | | | 4.00 | | | | 6/15/36 | | | | 170,564 | |
| | | | |
Duluth Economic Dev. Auth. Rev. (St. Luke Hospital of Duluth) | | | 350,000 | | | | 4.00 | | | | 6/15/37 | | | | 347,221 | |
| | | | |
Duluth Economic Dev. Auth. Rev. (St. Luke Hospital of Duluth) | | | 170,000 | | | | 4.00 | | | | 6/15/37 | | | | 168,650 | |
| | | | |
Duluth Economic Dev. Auth. Rev. (St. Luke Hospital of Duluth) | | | 375,000 | | | | 4.00 | | | | 6/15/38 | | | | 366,244 | |
| | | | |
Duluth Economic Dev. Auth. Rev. (St. Luke Hospital of Duluth) | | | 150,000 | | | | 4.00 | | | | 6/15/38 | | | | 146,497 | |
| | | | |
Duluth Economic Dev. Auth. Rev. (St. Luke Hospital of Duluth) | | | 225,000 | | | | 4.00 | | | | 6/15/39 | | | | 217,215 | |
| | | | |
Duluth Economic Dev. Auth. Rev. (St. Luke Hospital of Duluth) | | | 150,000 | | | | 4.00 | | | | 6/15/39 | | | | 144,810 | |
| | | | |
Duluth Economic Dev. Auth. Rev. (St. Luke Hospital of Duluth) | | | 850,000 | | | | 3.00 | | | | 6/15/44 | | | | 663,281 | |
| | | | |
Hayward Hsg. & Health Care Fac. Rev. (St. Johns Lutheran Home of Albert Lea Proj.) | | | 1,900,000 | | | | 5.00 | | | | 10/1/34 | | | | 1,159,000 | |
| | | | |
Maple Grove Health Care System Rev. (Maple Grove Hospital Corp.) | | | 825,000 | | | | 5.00 | | | | 5/1/32 | | | | 851,086 | |
| | | | |
Maple Grove Health Care System Rev. (Maple Grove Hospital Corp.) | | | 2,175,000 | | | | 4.00 | | | | 5/1/37 | | | | 2,071,535 | |
| | | | |
Minneapolis Health Care System Rev. (Fairview Health Services) | | | 2,590,000 | | | | 5.00 | | | | 11/15/34 | | | | 2,645,245 | |
| | | | |
Minneapolis Health Care System Rev. (Fairview Health Services) | | | 2,500,000 | | | | 5.00 | | | | 11/15/49 | | | | 2,513,675 | |
| | | | |
MN Agricultural & Economic Dev. Board Rev. (HealthPartners Oblig. Group Proj.) | | | 2,000,000 | | | | 5.25 | | | | 1/1/54 | | | | 2,171,060 | |
| | | | |
Moorhead Economic Dev. Auth. Rev. | | | 550,000 | | | | 4.60 | | | | 9/1/25 | | | | 540,259 | |
| | | | |
Oak Park Heights Nursing Home Rev. (Boutwells Landing Care Center) | | | 1,500,000 | | | | 5.50 | | | | 8/1/28 | | | | 1,487,925 | |
| | | | |
Oak Park Heights Nursing Home Rev. (Boutwells Landing Care Center) | | | 1,000,000 | | | | 6.00 | | | | 8/1/36 | | | | 986,210 | |
| | | | |
Puerto Rico Industrial Tourist Educational Medical & Environmental Ctl. Facs. Fin. Auth. Rev. 11 | | | 175,000 | | | | 4.00 | | | | 7/1/37 | | | | 166,458 | |
| | | | |
Puerto Rico Industrial Tourist Educational Medical & Environmental Ctl. Facs. Fin. Auth. Rev. 11 | | | 200,000 | | | | 4.00 | | | | 7/1/39 | | | | 186,270 | |
| | | | |
Puerto Rico Industrial Tourist Educational Medical & Environmental Ctl. Facs. Fin. Auth. Rev. 11 | | | 220,000 | | | | 4.00 | | | | 7/1/41 | | | | 202,468 | |
| | | | |
Rochester Health Care Facs. Rev. (Mayo Clinic) | | | 7,500,000 | | | | 4.00 | | | | 11/15/48 | | | | 7,342,125 | |
| | | | |
Rochester Health Care Facs. Rev. (Mayo Clinic) | | | 5,000,000 | | | | 5.00 | | | | 11/15/34 | | | | 6,010,000 | |
| | | | |
St. Cloud Health Care Rev. (CentraCare Health System Proj.) | | | 3,750,000 | | | | 5.00 | | | | 5/1/46 | | | | 3,802,538 | |
| | | | |
St. Cloud Health Care Rev. (CentraCare Health System Proj.) | | | 500,000 | | | | 5.00 | | | | 5/1/48 | | | | 520,295 | |
| | | | |
St. Louis Park Health Care Facs. Rev. (Mount Olivet Careview Home Health Proj.) 1 | | | 2,250,000 | | | | 4.60 | | | | 6/1/41 | | | | 2,017,507 | |
| | | | |
St. Paul Hsg. & Redev. Auth. Health Care Rev. (Fairview Health Services Proj.) | | | 2,000,000 | | | | 4.00 | | | | 11/15/43 | | | | 1,822,700 | |
| | | | |
St. Paul Hsg. & Redev. Auth. Health Care Rev. (HealthPartners Oblig. Group Proj.) | | | 4,800,000 | | | | 5.00 | | | | 7/1/32 | | | | 4,869,504 | |
| | | | |
St. Paul Hsg. & Redev. Auth. Health Care Rev. (HealthPartners Oblig. Group Proj.) | | | 2,000,000 | | | | 5.00 | | | | 7/1/33 | | | | 2,029,120 | |
| | | | |
St. Paul Hsg. & Redev. Auth. Health Care Rev. (Senior Episcopal Homes Proj.) | | | 2,150,000 | | | | 5.00 | | | | 5/1/38 | | | | 1,941,730 | |
| | | | |
Victoria Health Care Facs. Rev. (Augustana Emerald Care LLC) | | | 110,000 | | | | 4.25 | | | | 8/1/24 | | | | 109,342 | |
| | | | |
Wadena Rev. (Wadena Cancer Center Proj.) | | | 1,000,000 | | | | 5.00 | | | | 12/1/45 | | | | 1,068,500 | |
| | | | | | | | | | | | | | | | |
| | | | |
| | | | | | | | | | | | | | | 55,571,353 | |
| | | | | | | | | | | | | | | | |
| | |
| |
| See accompanying notes to financial statements. | | |
| | |
| 36 | | SIT MUTUAL FUNDS ANNUAL REPORT |
| | | | | | | | | | | | | | | | |
| | | | |
| Name of Issuer | | Principal Amount ($) | | | Coupon Rate (%) | | | Maturity Date | | | Fair Value ($) | |
| |
| | | | |
Industrial/Pollution Control - 0.5% 8 | | | | | | | | | | | | | | | | |
| | | | |
St. Paul Port Auth. Rev. | | | 1,000,000 | | | | 4.00 | | | | 10/1/40 | | | | 907,090 | |
| | | | |
St. Paul Port Auth. Solid Waste Disposal Rev. (Gerdau St. Paul Steel Mill Proj.) 4 | | | 1,000,000 | | | | 4.50 | | | | 10/1/37 | | | | 966,580 | |
| | | | | | | | | | | | | | | | |
| | | | |
| | | | | | | | | | | | | | | 1,873,670 | |
| | | | | | | | | | | | | | | | |
| | | | |
Multifamily Mortgage - 21.4% | | | | | | | | | | | | | | | | |
| | | | |
Anoka Hsg. Rev. (Homestead at Anoka, Inc. Proj.) | | | 1,000,000 | | | | 5.50 | | | | 11/1/46 | | | | 948,000 | |
| | | | |
Apple Valley Economic Dev. Auth. Rev. (Augustana Healthcare Center) | | | 500,000 | | | | 4.15 | | | | 2/1/36 | | | | 405,080 | |
| | | | |
Apple Valley Rev. (Orchard Path Phase II Proj.) | | | 260,000 | | | | 4.00 | | | | 9/1/30 | | | | 258,393 | |
| | | | |
Apple Valley Rev. (Orchard Path Phase II Proj.) | | | 300,000 | | | | 4.00 | | | | 9/1/36 | | | | 285,291 | |
| | | | |
Apple Valley Rev. (Orchard Path Phase II Proj.) | | | 440,000 | | | | 4.00 | | | | 9/1/41 | | | | 397,786 | |
| | | | |
Apple Valley Rev. (Orchard Path Phase II Proj.) | | | 830,000 | | | | 4.00 | | | | 9/1/51 | | | | 695,955 | |
| | | | |
Apple Valley Rev. (Orchard Path Phase II Proj.) | | | 750,000 | | | | 4.00 | | | | 9/1/61 | | | | 591,990 | |
| | | | |
Apple Valley Senior Hsg. Rev. (Orchard Path Proj.) | | | 2,000,000 | | | | 5.00 | | | | 9/1/58 | | | | 1,945,480 | |
| | | | |
Apple Valley Senior Hsg. Rev. (Presbyterian Homes) | | | 1,500,000 | | | | 5.00 | | | | 9/1/43 | | | | 1,501,755 | |
| | | | |
Apple Valley Senior Living Rev. (Senior Living LLC Proj.) | | | 1,045,000 | | | | 4.00 | | | | 1/1/25 | | | | 1,027,486 | |
| | | | |
Apple Valley Senior Living Rev. (Senior Living LLC Proj.) | | | 475,000 | | | | 4.00 | | | | 1/1/25 | | | | 459,748 | |
| | | | |
Apple Valley Senior Living Rev. (Senior Living LLC Proj.) | | | 1,175,000 | | | | 4.00 | | | | 1/1/26 | | | | 1,130,467 | |
| | | | |
Apple Valley Senior Living Rev. (Senior Living LLC Proj.) | | | 680,000 | | | | 6.75 | | | | 1/1/27 | | | | 593,613 | |
| | | | |
Apple Valley Senior Living Rev. (Senior Living LLC Proj.) | | | 950,000 | | | | 4.00 | | | | 1/1/30 | | | | 842,964 | |
| | | | |
Apple Valley Senior Living Rev. (Senior Living LLC Proj.) | | | 1,430,000 | | | | 4.25 | | | | 1/1/37 | | | | 1,135,835 | |
| | | | |
Apple Valley Senior Living Rev. (Senior Living LLC Proj.) | | | 950,000 | | | | 7.00 | | | | 1/1/37 | | | | 606,508 | |
| | | | |
Apple Valley Senior Living Rev. (Senior Living LLC Proj.) | | | 1,640,000 | | | | 4.38 | | | | 1/1/47 | | | | 1,130,698 | |
| | | | |
Apple Valley Senior Living Rev. (Senior Living LLC Proj.) | | | 2,850,000 | | | | 5.00 | | | | 1/1/47 | | | | 1,711,168 | |
| | | | |
Bethel Rev. (Grandview Christian Home Proj.) | | | 3,000,000 | | | | 5.00 | | | | 10/1/41 | | | | 2,875,050 | |
| | | | |
Blaine Senior Hsg. & Health Care Fac. Rev. (Crest View Senior Community Proj.) 2 | | | 1,250,000 | | | | 5.13 | | | | 7/1/25 | | | | 812,500 | |
| | | | |
Blaine Senior Hsg. & Health Care Fac. Rev. (Crest View Senior Community Proj.) 2 | | | 1,645,000 | | | | 5.75 | | | | 7/1/35 | | | | 1,069,250 | |
| | | | |
Blaine Senior Hsg. & Health Care Fac. Rev. (Crest View Senior Community Proj.) 2 | | | 2,000,000 | | | | 6.13 | | | | 7/1/45 | | | | 1,300,000 | |
| | | | |
Champlin Multifamily Hsg. Rev. (Champlin Drive Apts.) | | | 270,000 | | | | 6.00 | | | | 1/1/27 | | | | 270,095 | |
| | | | |
Chisago Hsg. and Health Care Rev. (CDL Homes LLC) | | | 750,000 | | | | 6.00 | | | | 8/1/33 | | | | 750,210 | |
| | | | |
Cloquet Rev. (HADC Cloquet, LLC Proj.) | | | 180,000 | | | | 2.20 | | | | 8/1/28 | | | | 159,550 | |
| | | | |
Cloquet Rev. (HADC Cloquet, LLC Proj.) | | | 250,000 | | | | 2.60 | | | | 8/1/30 | | | | 214,573 | |
| | | | |
Cloquet Rev. (HADC Cloquet, LLC Proj.) | | | 200,000 | | | | 2.80 | | | | 8/1/31 | | | | 169,834 | |
| | | | |
Cloquet Rev. (HADC Cloquet, LLC Proj.) | | | 200,000 | | | | 3.20 | | | | 8/1/34 | | | | 164,658 | |
| | | | |
Cloquet Rev. (HADC Cloquet, LLC Proj.) | | | 500,000 | | | | 4.00 | | | | 8/1/41 | | | | 388,140 | |
| | | | |
Cloquet Rev. (HADC Cloquet, LLC Proj.) | | | 500,000 | | | | 4.00 | | | | 8/1/48 | | | | 356,320 | |
| | | | |
Dakota Co. Community Dev. Agy. Multifamily Hsg. Rev. | | | 3,500,000 | | | | 4.00 | | | | 1/1/42 | | | | 3,498,005 | |
| | | | |
Dakota Co. Community Dev. Agy. Multifamily Hsg. Rev. (The Quill Proj.) 4 | | | 2,500,000 | | | | 3.55 | | | | 4/1/39 | | | | 1,995,475 | |
| | | | |
Fridley Multifamily Hsg. Rev. (Village Green Apartments Proj.) | | | 3,272,205 | | | | 3.75 | | | | 11/1/34 | | | | 3,225,118 | |
| | | | |
Hayward Health Care Fac. Rev. (American Baptist Homes Midwest Proj.) | | | 1,350,000 | | | | 5.38 | | | | 8/1/34 | | | | 1,208,736 | |
| | | | |
Hayward Health Care Fac. Rev. (American Baptist Homes Midwest Proj.) | | | 500,000 | | | | 5.75 | | | | 2/1/44 | | | | 415,745 | |
| | | | |
Independence Health Care Facs. Rev. (Augustana Chapel View Home) | | | 250,000 | | | | 4.00 | | | | 12/1/32 | | | | 221,240 | |
| | | | |
Lauderdale Multifamily Hsg. Rev. (The Fern Senior Affordable Housing Proj.) | | | 2,000,000 | | | | 5.13 | | | | 1/1/40 | | | | 1,927,600 | |
| | | | |
Minneapolis & St. Paul Hsg. & Redev. Auth. Multifamily Hsg. Rev. (GNMA Collateralized) 8 | | | 2,765,000 | | | | 4.75 | | | | 1/20/42 | | | | 2,765,968 | |
| | | | |
Minneapolis Multifamily Hsg. Rev. (14th & Central LLLP Proj.) (FNMA Collateralized) | | | 4,635,502 | | | | 2.35 | | | | 2/1/38 | | | | 3,683,370 | |
| | | | |
Minneapolis Multifamily Hsg. Rev. (Greenway Heights Family Housing) | | | 1,015,000 | | | | 5.75 | | | | 7/15/31 | | | | 1,014,970 | |
| | |
| |
| See accompanying notes to financial statements. | | |
| | |
| MARCH 31, 2024 | | 37 |
SCHEDULE OF INVESTMENTS
March 31, 2024
Sit Minnesota Tax-Free Income Fund (Continued)
| | | | | | | | | | | | | | | | |
| |
| | | | |
| Name of Issuer | | Principal
Amount ($) | | | Coupon Rate (%) | | | Maturity Date | | | Fair Value ($) | |
| |
| | | | |
Minneapolis Senior Hsg. & Health Care Rev. (Ecumen Mill City Quarter) | | | 375,000 | | | | 4.75 | | | | 11/1/28 | | | | 362,404 | |
| | | | |
Minneapolis Senior Hsg. & Health Care Rev. (Ecumen Mill City Quarter) | | | 1,500,000 | | | | 5.00 | | | | 11/1/35 | | | | 1,398,540 | |
| | | | |
Minneapolis Senior Hsg. & Health Care Rev. (Ecumen Mill City Quarter) | | | 750,000 | | | | 4.00 | | | | 11/1/25 | | | | 733,822 | |
| | | | |
Minnetonka MF Hsg. Rev. (Elmbrooke & Golden Valley Townhome Proj.) (FNMA Collateralized) | | | 1,825,972 | | | | 3.00 | | | | 11/1/34 | | | | 1,714,843 | |
| | | | |
MN Hsg. Fin. Agy. Rental Hsg. Rev. | | | 1,000,000 | | | | 5.20 | | | | 8/1/43 | | | | 1,000,870 | |
| | | | |
Moorhead Economic Dev. Auth. Rev. Ref. (EverCare Sr. Living LLC) | | | 280,000 | | | | 4.65 | | | | 9/1/26 | | | | 271,790 | |
| | | | |
Moorhead Health Care Rev. Ref. (EverCare Sr. Living LLC) | | | 1,000,000 | | | | 5.00 | | | | 9/1/32 | | | | 911,760 | |
| | | | |
Moorhead Health Care Rev. Ref. (EverCare Sr. Living LLC) | | | 250,000 | | | | 5.13 | | | | 9/1/37 | | | | 217,900 | |
| | | | |
New Ulm Economic Dev. Auth. Rev. (HADC Ridgeway Proj.) | | | 1,500,000 | | | | 5.00 | | | | 8/1/39 | | | | 1,220,535 | |
| | | | |
North Oaks Rev. (Waverly Gardens Proj.) | | | 150,000 | | | | 4.25 | | | | 10/1/41 | | | | 137,474 | |
| | | | |
North Oaks Senior Hsg. Rev. (Waverly Gardens Proj.) | | | 2,000,000 | | | | 4.00 | | | | 10/1/33 | | | | 1,896,660 | |
| | | | |
North Oaks Senior Hsg. Rev. (Waverly Gardens Proj.) | | | 1,500,000 | | | | 5.00 | | | | 10/1/35 | | | | 1,518,225 | |
| | | | |
North Oaks Senior Hsg. Rev. (Waverly Gardens Proj.) | | | 1,000,000 | | | | 5.00 | | | | 10/1/47 | | | | 990,440 | |
| | | | |
Rochester Health Care & Hsg. Rev. (Homestead Rochester, Inc.) | | | 1,950,000 | | | | 5.00 | | | | 12/1/30 | | | | 1,830,757 | |
| | | | |
Rochester Health Care & Hsg. Rev. (The Homestead at Rochester) | | | 720,000 | | | | 6.38 | | | | 12/1/33 | | | | 720,209 | |
| | | | |
Rochester Health Care & Hsg. Rev. (The Homestead at Rochester) | | | 2,500,000 | | | | 6.50 | | | | 12/1/35 | | | | 2,500,750 | |
| | | | |
Rochester Health Care & Hsg. Rev. (The Homestead at Rochester) | | | 250,000 | | | | 6.88 | | | | 12/1/48 | | | | 249,988 | |
| | | | |
Sartell Health Care & Hsg. Fac. Rev. (Country Manor Campus LLC Proj.) | | | 2,150,000 | | | | 5.30 | | | | 9/1/37 | | | | 2,147,828 | |
| | | | |
Sartell Health Care & Hsg. Fac. Rev. (Country Manor Campus LLC Proj.) | | | 500,000 | | | | 5.00 | | | | 9/1/35 | | | | 493,985 | |
| | | | |
Sauk Rapids Health Care & Hsg. Facs. Rev. (Good Shepherd Lutheran Home Proj.) | | | 1,715,000 | | | | 5.13 | | | | 1/1/39 | | | | 1,484,470 | |
| | | | |
St. Anthony Multifamily Hsg. Rev. (Silver Lake Village Hsg.) | | | 250,000 | | | | 5.75 | | | | 12/1/28 | | | | 250,057 | |
| | | | |
St. Anthony Multifamily Hsg. Rev. (Silver Lake Village Hsg.) | | | 2,000,000 | | | | 6.00 | | | | 12/1/30 | | | | 2,000,460 | |
| | | | |
St. Joseph Senior Hsg. & Health Care Rev. (Woodcrest of Country Manor Proj.) | | | 1,500,000 | | | | 5.00 | | | | 7/1/55 | | | | 1,249,035 | |
| | | | |
St. Paul Hsg. & Redev. Auth. (Higher Ground Academy Proj.) | | | 1,000,000 | | | | 5.50 | | | | 12/1/38 | | | | 1,042,420 | |
| | | | |
St. Paul Hsg. & Redev. Auth. Health Care Rev. (Carondelet Village Proj.) | | | 2,400,000 | | | | 4.25 | | | | 12/1/27 | | | | 2,352,840 | |
| | | | |
St. Paul Hsg. & Redev. Auth. Health Care Rev. (Carondelet Village Proj.) | | | 2,400,000 | | | | 5.00 | | | | 12/1/47 | | | | 2,338,104 | |
| | | | |
St. Paul Hsg. & Redev. Auth. Multifamily Housing Rev. (Marian Center Proj.) | | | 895,000 | | | | 5.30 | | | | 11/1/30 | | | | 876,975 | |
| | | | |
St. Paul Hsg. & Redev. Auth. Multifamily Housing Rev. (Marian Center Proj.) | | | 2,590,000 | | | | 5.38 | | | | 5/1/43 | | | | 2,302,329 | |
| | | | |
St. Paul Park Senior Hsg. Rev. (Presbyterian Homes Bloomin Proj.) | | | 1,500,000 | | | | 5.00 | | | | 9/1/42 | | | | 1,491,000 | |
| | | | |
St. Peter Hsg. & Health Care Fac. Rev. (Ecumen Second Century & Owatonna Senior Living Proj.) | | | 875,000 | | | | 5.00 | | | | 3/1/40 | | | | 814,030 | |
| | | | |
Vergas Hsg. & Healthcare Facs. Rev. (CDL Homes Proj.) | | | 1,000,000 | | | | 4.25 | | | | 8/1/43 | | | | 780,130 | |
| | | | |
Vergas Rev. (CDL Homes Proj.) | | | 120,000 | | | | 4.00 | | | | 8/1/25 | | | | 117,893 | |
| | | | |
Wayzata Senior Hsg. Rev. (Folkestone Senior Living Community) | | | 1,500,000 | | | | 4.00 | | | | 8/1/44 | | | | 1,329,135 | |
| | | | |
Wayzata Senior Hsg. Rev. (Folkestone Senior Living Community) | | | 1,000,000 | | | | 5.00 | | | | 8/1/49 | | | | 1,000,580 | |
| | | | |
Wayzata Senior Hsg. Rev. (Folkestone Senior Living Community) | | | 2,750,000 | | | | 5.00 | | | | 8/1/54 | | | | 2,737,020 | |
| | | | | | | | | | | | | | | | |
| | | | |
| | | | | | | | | | | | | | | 86,639,882 | |
| | | | | | | | | | | | | | | | |
| | | | |
Municipal Lease - 3.1% 9 | | | | | | | | | | | | | | | | |
| | | | |
Duluth Independent School District No. 709 | | | 1,875,000 | | | | 2.60 | | | | 3/1/28 | | | | 1,848,337 | |
| | | | |
Duluth Independent School District No. 709 | | | 920,000 | | | | 3.00 | | | | 3/1/32 | | | | 924,471 | |
| | | | |
Lake Agassiz Education Cooperative No. 0397-52 | | | 645,000 | | | | 2.50 | | | | 2/1/32 | | | | 557,190 | |
| | | | |
Lake Agassiz Education Cooperative No. 0397-52 | | | 365,000 | | | | 2.75 | | | | 2/1/36 | | | | 309,524 | |
| | | | |
Minnetonka Independent School District No. 276 | | | 1,410,000 | | | | 2.25 | | | | 2/1/44 | | | | 985,942 | |
| | | | |
Minnetonka Independent School District No. 276 | | | 1,000,000 | | | | 2.13 | | | | 2/1/41 | | | | 723,770 | |
| | | | |
Minnetonka Independent School District No. 276 | | | 750,000 | | | | 2.38 | | | | 7/1/51 | | | | 481,230 | |
| | | | |
MN Hsg. Fin. Agy. Rev. | | | 2,065,000 | | | | 3.00 | | | | 8/1/43 | | | | 1,628,748 | |
| | | | |
MN Hsg. Fin. Agy. Rev. (State Appropriation) | | | 2,000,000 | | | | 5.00 | | | | 8/1/34 | | | | 2,008,600 | |
| | |
| |
| See accompanying notes to financial statements. | | |
| | |
| 38 | | SIT MUTUAL FUNDS ANNUAL REPORT |
| | | | | | | | | | | | | | | | |
| |
| | | | |
| Name of Issuer | | Principal
Amount ($) | | | Coupon
Rate (%) | | | Maturity
Date | | | Fair Value ($) | |
| |
| | | | |
Northeastern Metropolitan Intermediate School District No. 916 | | | 1,000,000 | | | | 5.00 | | | | 2/1/34 | | | | 1,010,760 | |
| | | | |
Pine Island Independent School District No. 255 | | | 525,000 | | | | 2.00 | | | | 2/1/40 | | | | 378,021 | |
| | | | |
Pine Island Independent School District No. 255 | | | 1,110,000 | | | | 2.20 | | | | 2/1/44 | | | | 762,193 | |
| | | | |
Pine Island Independent School District No. 255 | | | 895,000 | | | | 2.25 | | | | 2/1/47 | | | | 587,514 | |
| | | | |
Waconia Independent School District No. 110 | | | 500,000 | | | | 5.00 | | | | 2/1/37 | | | | 501,215 | |
| | | | |
Winona School District No. 861 Lease Purchase | | | 50,245 | | | | 6.04 | | | | 8/1/24 | | | | 50,288 | |
| | | | | | | | | | | | | | | | |
| | | | |
| | | | | | | | | | | | | | | 12,757,803 | |
| | | | | | | | | | | | | | | | |
| | | | |
Other Revenue Bonds - 2.8% | | | | | | | | | | | | | | | | |
| | | | |
Crystal Governmental Fac. Rev. | | | 176,567 | | | | 5.10 | | | | 12/15/26 | | | | 168,352 | |
| | | | |
Mound Hsg. & Redev. Auth. Tax Increment Rev. Ref. (Metroplain Proj.) | | | 203,000 | | | | 5.00 | | | | 2/15/27 | | | | 199,145 | |
| | | | |
Northeastern Metropolitan Intermediate School District No. 916 | | | 2,500,000 | | | | 4.00 | | | | 2/1/38 | | | | 2,502,625 | |
| | | | |
St. Paul Hsg. & Redev. Auth. Rev. (Amherst H Wilder Foundation Proj.) | | | 1,750,000 | | | | 5.00 | | | | 12/1/36 | | | | 1,767,658 | |
| | | | |
St. Paul Hsg. & Redev. Auth. Tax Increment Rev. (9th St. Lofts Proj.) | | | 306,000 | | | | 6.38 | | | | 2/15/28 | | | | 306,190 | |
| | | | |
St. Paul Hsg. & Redev. Auth. Tax Increment Rev. (Emerald Gardens Proj.) | | | 405,000 | | | | 6.50 | | | | 3/1/29 | | | | 405,117 | |
| | | | |
St. Paul Hsg. & Redev. Auth. Tax Increment Rev. (North Quadrant Owner Occupied Proj.) | | | 636,000 | | | | 7.00 | | | | 2/15/28 | | | | 637,310 | |
| | | | |
St. Paul Hsg. & Redev. Auth. Tax Increment Rev. (North Quadrant Owner Occupied Proj.) | | | 340,000 | | | | 7.50 | | | | 2/15/28 | | | | 340,054 | |
| | | | |
St. Paul Port Auth. Lease Rev. (Regions Hospital Parking Ramp Proj.) | | | 3,510,000 | | | | 5.00 | | | | 8/1/36 | | | | 3,512,106 | |
| | | | |
Virgin Islands Public Fin. Auth. (Gross Receipts Taxes Loan Note) 11 | | | 2,000,000 | | | | 5.00 | | | | 10/1/42 | | | | 1,712,460 | |
| | | | | | | | | | | | | | | | |
| | | | |
| | | | | | | | | | | | | | | 11,551,017 | |
| | | | | | | | | | | | | | | | |
| | | | |
Sales Tax Revenue - 1.2% 11 | | | | | | | | | | | | | | | | |
| | | | |
American Samoa Economic Development Authority Rev. | | | 2,000,000 | | | | 6.25 | | | | 9/1/29 | | | | 2,057,840 | |
| | | | |
Guam Govt. Business Privilege Tax Rev. | | | 2,750,000 | | | | 5.00 | | | | 11/15/35 | | | | 2,791,030 | |
| | | | | | | | | | | | | | | | |
| | | | |
| | | | | | | | | | | | | | | 4,848,870 | |
| | | | | | | | | | | | | | | | |
| | | | |
Single Family Mortgage - 23.0% | | | | | | | | | | | | | | | | |
| | | | |
Dakota Co. Community Dev. Agy. Single Family Mtg. Rev. (GNMA) | | | 490,000 | | | | 4.45 | | | | 12/1/32 | | | | 490,073 | |
| | | | |
Dakota Co. Community Dev. Agy. Single Family Mtg. Rev. (GNMA) | | | 20,000 | | | | 4.63 | | | | 12/1/30 | | | | 20,004 | |
| | | | |
Dakota Co. Community Dev. Agy. Single Family Mtg. Rev. (GNMA-FNMA-FHLMC) | | | 245,000 | | | | 4.88 | | | | 12/1/33 | | | | 245,054 | |
| | | | |
Minneapolis St. Paul Hsg. Fin. Board Single Family Mtg. Rev. (GNMA-FNMA) | | | 65,000 | | | | 4.45 | | | | 12/1/27 | | | | 64,848 | |
| | | | |
MN Hsg. Fin. Agy. Homeownership Fin. | | | 7,295,000 | | | | 2.25 | | | | 7/1/41 | | | | 5,292,523 | |
| | | | |
MN Hsg. Fin. Agy. Homeownership Fin. | | | 8,270,000 | | | | 2.40 | | | | 7/1/46 | | | | 5,753,853 | |
| | | | |
MN Hsg. Fin. Agy. Homeownership Fin. (GNMA-FNMA-FHLMC) | | | 3,130,000 | | | | 2.45 | | | | 7/1/45 | | | | 2,235,696 | |
| | | | |
MN Hsg. Fin. Agy. Homeownership Fin. (GNMA-FNMA-FHLMC) | | | 4,985,000 | | | | 2.45 | | | | 7/1/46 | | | | 3,453,010 | |
| | | | |
MN Hsg. Fin. Agy. Homeownership Fin. (GNMA-FNMA-FHLMC) | | | 1,548,632 | | | | 3.30 | | | | 3/1/48 | | | | 1,469,527 | |
| | | | |
MN Hsg. Fin. Agy. Homeownership Fin. (GNMA-FNMA-FHLMC) | | | 1,626,622 | | | | 3.30 | | | | 5/1/48 | | | | 1,493,353 | |
| | | | |
MN Hsg. Fin. Agy. Homeownership Fin. (GNMA-FNMA-FHLMC) | | | 519,492 | | | | 3.75 | | | | 11/1/48 | | | | 496,468 | |
| | | | |
MN Hsg. Fin. Agy. Homeownership Fin. (GNMA-FNMA-FHLMC) | | | 527,165 | | | | 3.60 | | | | 1/1/49 | | | | 498,377 | |
| | | | |
MN Hsg. Fin. Agy. Homeownership Fin. (GNMA-FNMA-FHLMC) | | | 550,498 | | | | 3.45 | | | | 3/1/49 | | | | 517,628 | |
| | | | |
MN Hsg. Fin. Agy. Homeownership Fin. (GNMA-FNMA-FHLMC) | | | 914,621 | | | | 3.15 | | | | 6/1/49 | | | | 829,388 | |
| | | | |
MN Hsg. Fin. Agy. Homeownership Fin. (GNMA-FNMA-FHLMC) | | | 961,781 | | | | 2.47 | | | | 1/1/50 | | | | 841,067 | |
| | | | |
MN Hsg. Fin. Agy. Homeownership Fin. (GNMA-FNMA-FHLMC) | | | 8,585,000 | | | | 2.55 | | | | 1/1/51 | | | | 5,995,421 | |
| | | | |
MN Hsg. Fin. Agy. Homeownership Fin. (GNMA-FNMA-FHLMC) | | | 4,290,000 | | | | 2.50 | | | | 7/1/51 | | | | 2,907,161 | |
| | | | |
MN Hsg. Fin. Agy. Homeownership Fin. (GNMA-FNMA-FHLMC) | | | 475,000 | | | | 2.38 | | | | 7/1/46 | | | | 327,907 | |
| | | | |
MN Hsg. Fin. Agy. Homeownership Fin. (GNMA-FNMA-FHLMC) | | | 9,340,000 | | | | 2.45 | | | | 1/1/52 | | | | 6,271,530 | |
| | | | |
MN Hsg. Fin. Agy. Homeownership Fin. (GNMA-FNMA-FHLMC) | | | 3,440,000 | | | | 2.40 | | | | 1/1/35 | | | | 2,924,241 | |
| | | | |
MN Hsg. Fin. Agy. Homeownership Fin. (GNMA-FNMA-FHLMC) | | | 3,410,000 | | | | 2.75 | | | | 7/1/42 | | | | 2,681,794 | |
| | |
| |
| See accompanying notes to financial statements. | | |
| | |
| MARCH 31, 2024 | | 39 |
SCHEDULE OF INVESTMENTS
March 31, 2024
Sit Minnesota Tax-Free Income Fund (Continued)
| | | | | | | | | | | | | | | | |
| |
| | | | |
| Name of Issuer | | Principal
Amount ($) | | | Coupon
Rate (%) | | | Maturity
Date | | | Fair Value ($) | |
| |
| | | | |
MN Hsg. Fin. Agy. Homeownership Fin. (GNMA-FNMA-FHLMC) | | | 1,270,000 | | | | 2.90 | | | | 1/1/45 | | | | 986,523 | |
| | | | |
MN Hsg. Fin. Agy. Homeownership Fin. (GNMA-FNMA-FHLMC) | | | 2,300,000 | | | | 3.00 | | | | 7/1/43 | | | | 1,931,517 | |
| | | | |
MN Hsg. Fin. Agy. Residential Hsg. Rev. (GNMA-FNMA-FHLMC) | | | 1,340,000 | | | | 2.45 | | | | 7/1/34 | | | | 1,155,884 | |
| | | | |
MN Hsg. Fin. Agy. Residential Hsg. Rev. (GNMA-FNMA-FHLMC) | | | 32,000 | | | | 3.80 | | | | 7/1/38 | | | | 31,332 | |
| | | | |
MN Hsg. Fin. Agy. Residential Hsg. Rev. (GNMA-FNMA-FHLMC) | | | 4,290,000 | | | | 2.55 | | | | 7/1/39 | | | | 3,412,824 | |
| | | | |
MN Hsg. Fin. Agy. Residential Hsg. Rev. (GNMA-FNMA-FHLMC) | | | 2,885,000 | | | | 2.80 | | | | 1/1/44 | | | | 2,206,217 | |
| | | | |
MN Hsg. Fin. Agy. Residential Hsg. Rev. (GNMA-FNMA-FHLMC) | | | 2,775,000 | | | | 2.70 | | | | 7/1/44 | | | | 2,127,787 | |
| | | | |
MN Hsg. Fin. Agy. Residential Hsg. Rev. (GNMA-FNMA-FHLMC) | | | 3,130,000 | | | | 2.75 | | | | 7/1/44 | | | | 2,425,093 | |
| | | | |
MN Hsg. Fin. Agy. Rev. 8 | | | 1,000,000 | | | | 5.35 | | | | 7/1/36 | | | | 1,061,620 | |
| | | | |
MN Hsg. Fin. Agy. Rev. | | | 3,611,361 | | | | 2.05 | | | | 12/1/51 | | | | 3,094,792 | |
| | | | |
MN Hsg. Fin. Agy. Rev. | | | 3,165,000 | | | | 2.00 | | | | 7/1/40 | | | | 2,232,749 | |
| | | | |
MN Hsg. Fin. Agy. Rev. | | | 3,850,000 | | | | 2.15 | | | | 7/1/45 | | | | 2,561,405 | |
| | | | |
MN Hsg. Fin. Agy. Rev. | | | 6,205,000 | | | | 2.20 | | | | 1/1/51 | | | | 3,934,777 | |
| | | | |
MN Hsg. Fin. Agy. Rev. | | | 9,360,000 | | | | 2.35 | | | | 7/1/41 | | | | 6,974,698 | |
| | | | |
MN Hsg. Fin. Agy. Rev. | | | 5,580,000 | | | | 2.55 | | | | 1/1/46 | | | | 3,994,666 | |
| | | | |
MN Hsg. Fin. Agy. Rev. | | | 2,380,000 | | | | 5.00 | | | | 7/1/53 | | | | 2,443,284 | |
| | | | |
MN Hsg. Fin. Agy. Rev. | | | 1,000,000 | | | | 6.00 | | | | 7/1/53 | | | | 1,078,380 | |
| | | | |
MN Hsg. Fin. Agy. Rev. | | | 1,000,000 | | | | 6.25 | | | | 1/1/54 | | | | 1,097,710 | |
| | | | |
MN Hsg. Fin. Agy. Rev. | | | 1,250,000 | | | | 5.10 | | | | 7/1/42 | | | | 1,334,287 | |
| | | | |
MN Hsg. Fin. Agy. Rev. | | | 1,715,000 | | | | 5.15 | | | | 7/1/45 | | | | 1,798,057 | |
| | | | |
MN Hsg. Fin. Agy. Rev. | | | 1,460,000 | | | | 6.00 | | | | 1/1/53 | | | | 1,554,024 | |
| | | | |
MN Hsg. Fin. Agy. Rev. (GNMA-FNMA-FHLMC) | | | 1,000,000 | | | | 4.60 | | | | 7/1/45 | | | | 1,005,270 | |
| | | | | | | | | | | | | | | | |
| | | | |
| | | | | | | | | | | | | | | 93,251,819 | |
| | | | | | | | | | | | | | | | |
| | | | |
Transportation - 0.7% 8 | | | | | | | | | | | | | | | | |
| | | | |
Minneapolis & St. Paul Metro Airport Commission Sub. Rev. | | | 675,000 | | | | 5.00 | | | | 1/1/25 | | | | 679,495 | |
| | | | |
Minneapolis & St. Paul Metro Airport Commission Sub. Rev. | | | 450,000 | | | | 5.00 | | | | 1/1/26 | | | | 458,415 | |
| | | | |
Minneapolis & St. Paul Metro Airport Commission Sub. Rev. | | | 1,000,000 | | | | 5.00 | | | | 1/1/47 | | | | 1,051,690 | |
| | | | |
Minneapolis & St. Paul Metro Airport Commission Sub. Rev. | | | 500,000 | | | | 5.25 | | | | 1/1/47 | | | | 534,035 | |
| | | | | | | | | | | | | | | | |
| | | | |
| | | | | | | | | | | | | | | 2,723,635 | |
| | | | | | | | | | | | | | | | |
| | | | |
Utility - 1.6% | | | | | | | | | | | | | | | | |
| | | | |
Guam Govt. Waterworks Auth. Rev. 11 | | | 2,000,000 | | | | 5.00 | | | | 1/1/46 | | | | 2,039,320 | |
| | | | |
Rochester Electric Utility Rev. | | | 500,000 | | | | 5.00 | | | | 12/1/42 | | | | 510,875 | |
| | | | |
Southern Minnesota Municipal Power Agency | | | 1,000,000 | | | | 5.00 | | | | 1/1/41 | | | | 1,017,110 | |
| | | | |
St. Paul Hsg. & Redev. Auth. | | | 900,000 | | | | 3.38 | | | | 10/1/37 | | | | 840,726 | |
| | | | |
St. Paul Port Auth. Rev. 8 | | | 750,000 | | | | 5.25 | | | | 10/1/42 | | | | 773,925 | |
| | | | |
Western MN Municipal Power Agy. Rev. | | | 550,000 | | | | 5.00 | | | | 1/1/25 | | | | 556,380 | |
| | | | |
Western MN Municipal Power Agy. Rev. | | | 600,000 | | | | 5.00 | | | | 1/1/35 | | | | 613,836 | |
| | | | | | | | | | | | | | | | |
| | | | |
| | | | | | | | | | | | | | | 6,352,172 | |
| | | | | | | | | | | | | | | | |
| | | | |
Total Municipal Bonds
(cost: $440,710,886) | | | | | | | | | | | | | | | 384,787,261 | |
| | | | | | | | | | | | | | | | |
| | |
| |
| See accompanying notes to financial statements. | | |
| | |
| 40 | | SIT MUTUAL FUNDS ANNUAL REPORT |
| | | | | | | | | | | | | | | | |
| | | | |
| Name of Issuer | | Quantity | | | | | | | | | Fair Value ($) | |
| |
| | | | |
Investment Companies - 0.4% | | | | | | | | | | | | | | | | |
| | | | |
Nuveen Minnesota Quality Municipal Income Fund (NMS) | | | 132,458 | | | | | | | | | | | | 1,489,318 | |
| | | | | | | | | | | | | | | | |
| | | | |
Total Investment Companies
(cost: $1,829,974) | | | | | | | | | | | | | | | 1,489,318 | |
| | | | | | | | | | | | | | | | |
| | | | |
Total Investments in Securities - 95.2%
(cost: $442,540,860) | | | | | | | | | | | | | | | 386,276,579 | |
| | | | | | | | | | | | | | | | |
| | | | |
Other Assets and Liabilities, net - 4.8% | | | | | | | | | | | | | | | 19,707,116 | |
| | | | | | | | | | | | | | | | |
| | | | |
Net Assets - 100.0% | | | | | | | | | | | | | | | $405,983,695 | |
| | | | | | | | | | | | | | | | |
| | | | | | | | | | | | | | | | |
| 1 | Variable rate security. Rate disclosed is as of March 31, 2024. Certain variable rate securities are not based on a published reference rate and spread but are determined by the issuer or agent and are based on current market conditions, or, for mortgage-backed securities, are impacted by the individual mortgages which are paying off over time. These securities do not indicate a reference rate and spread in their descriptions. | |
| 2 | Security considered illiquid by the Investment Adviser. The total value of such securities as of March 31, 2024 was $3,181,750 and represented 0.8% of net assets. | |
| 4 | 144A Restricted Security. The total value of such securities as of March 31, 2024 was $8,818,135 and represented 2.2% of net assets. These securities have been determined to be liquid by the Adviser in accordance with guidelines established by the Board of Directors. | |
| 8 | Securities the income from which is treated as a tax preference that is included in alternative minimum taxable income for purposes of computing federal alternative minimum tax (AMT). At March 31, 2024, 3.5% of net assets in the Fund was invested in such securities. | |
| 9 | Municipal Lease Security. The total value of such securities as of March 31, 2024 was $12,757,803 and represented 3.1% of net assets. These securities have been determined to be liquid by the Adviser in accordance with guidelines established by the Board of Directors. | |
| 11 | The Fund may invest in obligations issued by U.S. territories, for example Guam, Puerto Rico, and Virgin Islands. The total value of such securities as of March 31, 2024 was $9,155,846 and represented 2.3% of net assets. | |
Numeric footnotes not disclosed are not applicable to this Schedule of Investments.
Short futures contracts outstanding as of March 31, 2024 were as follows:
| | | | | | | | | | | | | | | | | | | | |
| Type | | Contracts | | | Expiration Date | | | Notional Amount ($) | | | | | Value/ Unrealized Appreciation (Depreciation) ($) | | |
Short Futures: 10 | | | | | | | | | | | | | | | | | | | | |
U.S. Treasury Long Bond | | | 94 | | | | June 2024 | | | | (11,321,125 | ) | | | | | (235,766) | | | |
U.S. Treasury 2-Year | | | 158 | | | | June 2024 | | | | (32,308,531 | ) | | | | | 21,380 | | | |
U.S. Treasury 5-Year | | | 290 | | | | June 2024 | | | | (31,034,533 | ) | | | | | (98,591) | | | |
U.S. Treasury 10-Year | | | 469 | | | | June 2024 | | | | (51,963,737 | ) | | | | | (381,832) | | | |
| | | | | | | | | | | | | | |
| | | | | | | | | | | | | | | | | (694,809) | | | |
| | | | | | | | | | | | | | |
| 10 | The amount of $8,000,000 in cash was segregated with the broker to cover margin requirements for derivative transactions as of March 31, 2024. |
| | |
| |
| See accompanying notes to financial statements. | | |
| | |
| MARCH 31, 2024 | | 41 |
SCHEDULE OF INVESTMENTS
March 31, 2024
Sit Minnesota Tax-Free Income Fund (Continued)
A summary of the levels for the Fund’s investments as of March 31, 2024 is as follows (see Note 2 - significant accounting policies in the notes to financial statements):
| | | | | | | | | | | | | | | | |
| | | Investment in Securities | |
| | | | |
| | | | |
| | | Level 1 Quoted Prices ($) | | | Level 2 Other significant observable inputs ($) | | | Level 3 Significant
unobservable inputs ($) | | | Total ($) | |
| | | | |
Assets | | | | | | | | | | | | | | | | |
Municipal Bonds | | | — | | | | 384,787,261 | | | | — | | | | 384,787,261 | |
Investment Companies | | | 1,489,318 | | | | — | | | | — | | | | 1,489,318 | |
Futures | | | 21,380 | | | | — | | | | — | | | | 21,380 | |
| | | | |
Total: | | | 1,510,698 | | | | 384,787,261 | | | | — | | | | 386,297,959 | |
| | | | |
Liabilities | | | | | | | | | | | | | | | | |
Futures | | | (716,189 | ) | | | — | | | | — | | | | (716,189) | |
| | | | |
There were no transfers into or out of level 3 during the reporting period.
| | |
| |
| See accompanying notes to financial statements. | | |
| | |
| 42 | | SIT MUTUAL FUNDS ANNUAL REPORT |
[This page is intentionally left blank.]
STATEMENTS OF ASSETS AND LIABILITIES
March 31, 2024
| | | | | | | | | | | | | | | | |
| | | Sit U.S.
Government
Securities
Fund | | Sit Quality
Income
Fund | | Sit Tax-Free
Income
Fund | | Sit
Minnesota
Tax-Free
Income
Fund |
ASSETS | | | | | | | | | | | | | | | | |
Investments in securities, at identified cost | | | $266,992,513 | | | | $133,887,029 | | | | $188,646,820 | | | | $442,540,860 | |
| | | | | | | | | | | | | | | | |
| | | | |
Investments in securities, at fair value - see accompanying schedule for detail | | | $248,980,346 | | | | $132,017,323 | | | | $150,259,835 | | | | $386,276,579 | |
Cash in bank on demand deposit | | | — | | | | — | | | | 7,662,272 | | | | 9,506,522 | |
Cash collateral held at broker | | | — | | | | 400,000 | | | | 6,000,000 | | | | 8,000,000 | |
Accrued interest and dividends receivable | | | 1,158,580 | | | | 991,656 | | | | 2,004,070 | | | | 4,543,530 | |
Receivable for investment securities sold | | | 5,531 | | | | 20,111 | | | | — | | | | — | |
Receivable for Fund shares sold | | | 328,250 | | | | 4,609 | | | | 12,414 | | | | 202,545 | |
| | | | | | | | | | | | | | | | |
| | | | |
Total assets | | | 250,472,707 | | | | 133,433,699 | | | | 165,938,591 | | | | 408,529,176 | |
| | | | | | | | | | | | | | | | |
| | | | |
LIABILITIES | | | | | | | | | | | | | | | | |
Payable for investment securities purchased | | | 2,436,445 | | | | — | | | | 1,518,205 | | | | 1,000,000 | |
Payable for Fund shares redeemed | | | 435,653 | | | | 24,012 | | | | 115,321 | | | | 434,919 | |
Cash portion of dividends payable to shareholders | | | 40,423 | | | | 780 | | | | 102,711 | | | | 142,295 | |
Variation margin on futures contracts | | | — | | | | 15,236 | | | | 214,127 | | | | 692,787 | |
Accrued supervisory and administrative fees | | | 112,933 | | | | 45,963 | | | | 69,921 | | | | 206,610 | |
Accrued investment management fees | | | 42,315 | | | | 22,483 | | | | 27,802 | | | | 68,870 | |
| | | | | | | | | | | | | | | | |
| | | | |
Total liabilities | | | 3,067,769 | | | | 108,474 | | | | 2,048,087 | | | | 2,545,481 | |
| | | | | | | | | | | | | | | | |
| | | | |
Net assets applicable to outstanding capital stock | | | $247,404,938 | | | | $133,325,225 | | | | $163,890,504 | | | | $405,983,695 | |
| | | | | | | | | | | | | | | | |
| | | | |
Net assets consist of: | | | | | | | | | | | | | | | | |
Capital (par value and paid-in surplus) | | | $291,665,140 | | | | $141,048,977 | | | | $224,172,657 | | | | $471,702,617 | |
Total distributable earnings (loss), including unrealized appreciation (depreciation) | | | (44,260,202) | | | | (7,723,752) | | | | (60,282,153) | | | | (65,718,922) | |
| | | | | | | | | | | | | | | | |
| | | | |
| | | $247,404,938 | | | | $133,325,225 | | | | $163,890,504 | | | | $405,983,695 | |
| | | | | | | | | | | | | | | | |
| | | | |
Outstanding shares: | | | | | | | | | | | | | | | | |
Class S Shares (Class S)* | | | 17,905,164 | | | | 3,336,433 | | | | 11,596,365 | | | | 42,890,556 | |
| | | | | | | | | | | | | | | | |
| | | | |
Class Y Shares (Class Y)* | | | 6,417,887 | | | | 10,737,457 | | | | 7,374,352 | | | | — | |
| | | | | | | | | | | | | | | | |
| | | | |
Net assets applicable to outstanding shares: | | | | | | | | | | | | | | | | |
Net Assets (Class S)* | | | $182,150,189 | | | | $31,574,205 | | | | $100,185,015 | | | | $405,983,695 | |
| | | | | | | | | | | | | | | | |
| | | | |
Net Assets (Class Y)* | | | 65,254,749 | | | | 101,751,020 | | | | 63,705,489 | | | | — | |
| | | | | | | | | | | | | | | | |
| | | | |
Net asset value per share of outstanding capital stock: | | | | | | | | | | | | | | | | |
Net Assets Value (Class S)* | | | $10.17 | | | | $9.46 | | | | $8.64 | | | | $9.47 | |
| | | | | | | | | | | | | | | | |
| | | | |
Net Assets Value (Class Y)* | | | 10.17 | | | | 9.48 | | | | 8.64 | | | | — | |
| | | | | | | | | | | | | | | | |
| * | Sit U.S. Government Securities Fund, Sit Quality Income Fund and Sit Tax-Free Income Fund offer multiple share classes (S and Y). Sit Minnesota Tax-Free Income Fund offers a single share class. |
| | |
| |
| See accompanying notes to financial statements. | | |
| | |
| 44 | | SIT MUTUAL FUNDS ANNUAL REPORT |
STATEMENTS OF OPERATIONS
Year Ended March 31, 2024
| | | | | | | | | | | | | | | | |
| | | Sit U.S.
Government
Securities
Fund | | | Sit Quality
Income
Fund | | | Sit Tax-Free
Income
Fund | | | Sit
Minnesota
Tax-Free
Income
Fund | |
Investment income: | | | | | | | | | | | | | | | | |
Income: | | | | | | | | | | | | | | | | |
Dividends | | | — | | | | — | | | | $335,926 | | | | $61,726 | |
Interest | | | $12,283,884 | | | | $6,482,914 | | | | 7,389,624 | | | | 16,986,162 | |
| | | | | | | | | | | | | | | | |
| | | | |
Total income | | | 12,283,884 | | | | 6,482,914 | | | | 7,725,550 | | | | 17,047,888 | |
| | | | | | | | | | | | | | | | |
| | | | |
Expenses (note 4): | | | | | | | | | | | | | | | | |
Investment management fee | | | 600,700 | | | | 305,082 | | | | 357,113 | | | | 863,263 | |
Supervisory and administrative fee | | | 1,603,238 | | | | 559,287 | | | | 902,887 | | | | 2,589,787 | |
| | | | | | | | | | | | | | | | |
| | | | |
Total expenses | | | 2,203,938 | | | | 864,369 | | | | 1,260,000 | | | | 3,453,050 | |
| | | | | | | | | | | | | | | | |
| | | | |
Less fees and expenses waived by investment adviser | | | — | | | | (33,859) | | | | — | | | | — | |
| | | | | | | | | | | | | | | | |
| | | | |
Total net expenses | | | 2,203,938 | | | | 830,510 | | | | 1,260,000 | | | | 3,453,050 | |
| | | | | | | | | | | | | | | | |
| | | | |
Net investment income | | | 10,079,946 | | | | 5,652,404 | | | | 6,465,550 | | | | 13,594,838 | |
| | | | | | | | | | | | | | | | |
| | | | |
Realized and unrealized gain (loss): | | | | | | | | | | | | | | | | |
Net realized gain (loss) on investments | | | (11,190,435) | | | | (2,068,634) | | | | (12,629,932) | | | | (8,482,003) | |
Net realized gain (loss) on futures | | | — | | | | 460,047 | | | | 569,438 | | | | 3,463,565 | |
| | | | |
Net change in unrealized appreciation (depreciation) on investments | | | 4,712,885 | | | | 1,631,056 | | | | 11,566,642 | | | | 1,760,682 | |
Net change in unrealized appreciation (depreciation) on futures | | | — | | | | (4,233) | | | | 2,211,726 | | | | 3,260,391 | |
| | | | | | | | | | | | | | | | |
| | | | |
Net gain (loss) | | | (6,477,550) | | | | 18,236 | | | | 1,717,874 | | | | 2,635 | |
| | | | | | | | | | | | | | | | |
| | | | |
Net increase (decrease) in net assets resulting from operations | | | $3,602,396 | | | | $5,670,640 | | | | $8,183,424 | | | | $13,597,473 | |
| | | | | | | | | | | | | | | | |
| | |
| |
| | See accompanying notes to financial statements. |
| | |
| MARCH 31, 2024 | | 45 |
STATEMENTS OF CHANGES IN NET ASSETS
| | | | | | | | | | | | | | | | |
| | | Sit U.S. Government
Securities Fund | |
| | | Year
Ended
March 31, 2024 | | | Year
Ended
March 31, 2023 | |
Operations: | | | | | | | | | | | | | | | | |
Net investment income | | | $10,079,946 | | | | | | | | $10,559,550 | | | | | |
Net realized gain (loss) on investments, written options and futures | | | (11,190,435) | | | | | | | | (4,670,563) | | | | | |
Net change in unrealized appreciation (depreciation) of investments and futures | | | 4,712,885 | | | | | | | | (14,255,543) | | | | | |
| | | | | | | | | | | | | | | | |
| | | | |
Net increase (decrease) in net assets resulting from operations | | | 3,602,396 | | | | | | | | (8,366,556) | | | | | |
| | | | | | | | | | | | | | | | |
| | | | |
Distributions from: | | | | | | | | | | | | | | | | |
Net investment income and net realized gains | | | | | | | | | | | | | | | | |
Common shares (Class S) | | | (7,293,135) | | | | | | | | (7,510,551) | | | | | |
Common shares (Class Y) | | | (2,829,577) | | | | | | | | (3,046,524) | | | | | |
| | | | | | | | | | | | | | | | |
| | | | |
Total distributions | | | (10,122,712) | | | | | | | | (10,557,075) | | | | | |
| | | | | | | | | | | | | | | | |
| | | | |
Capital share transactions: | | | | | | | | | | | | | | | | |
Proceeds from shares sold | | | | | | | | | | | | | | | | |
Class S Shares | | | 20,177,580 | | | | | | | | 63,247,916 | | | | | |
Class Y Shares | | | 11,876,193 | | | | | | | | 56,647,662 | | | | | |
Reinvested distributions | | | | | | | | | | | | | | | | |
Class S Shares | | | 6,807,918 | | | | | | | | 7,103,157 | | | | | |
Class Y Shares | | | 2,828,929 | | | | | | | | 3,046,421 | | | | | |
Payments for shares redeemed | | | | | | | | | | | | | | | | |
Class S Shares | | | (106,055,986) | | | | | | | | (108,707,441) | | | | | |
Class Y Shares | | | (39,415,212) | | | | | | | | (72,452,694) | | | | | |
| | | | | | | | | | | | | | | | |
| | | | |
Increase (decrease) in net assets from capital transactions | | | (103,780,578) | | | | | | | | (51,114,979) | | | | | |
| | | | | | | | | | | | | | | | |
| | | | |
Total increase (decrease) in net assets | | | (110,300,894) | | | | | | | | (70,038,610) | | | | | |
| | | | |
Net assets: | | | | | | | | | | | | | | | | |
Beginning of year | | | 357,705,832 | | | | | | | | 427,744,442 | | | | | |
| | | | | | | | | | | | | | | | |
| | | | |
End of year | | | $247,404,938 | | | | | | | | $357,705,832 | | | | | |
| | | | | | | | | | | | | | | | |
| | | | |
Capital transactions in shares: | | | | | | | | | | | | | | | | |
Sold | | | | | | | | | | | | | | | | |
Class S Shares | | | 1,985,070 | | | | | | | | 5,994,952 | | | | | |
Class Y Shares | | | 1,164,099 | | | | | | | | 5,381,137 | | | | | |
Reinvested distributions | | | | | | | | | | | | | | | | |
Class S Shares | | | 671,102 | | | | | | | | 679,640 | | | | | |
Class Y Shares | | | 279,148 | | | | | | | | 291,581 | | | | | |
Redeemed | | | | | | | | | | | | | | | | |
Class S Shares | | | (10,448,210) | | | | | | | | (10,367,882) | | | | | |
Class Y Shares | | | (3,880,008) | | | | | | | | (6,909,643) | | | | | |
| | | | | | | | | | | | | | | | |
| | | | |
Net increase (decrease) | | | (10,228,799) | | | | | | | | (4,930,215) | | | | | |
| | | | | | | | | | | | | | | | |
| | |
| |
| See accompanying notes to financial statements. | | |
| | |
| 46 | | SIT MUTUAL FUNDS ANNUAL REPORT |
| | | | | | | | | | | | | | | | | | | | | | | | | | | | | | | | | | | | | | | | | | | | | | | | | | | | | | | | | | | | | | | | | | |
Sit Quality
Income Fund | | | | Sit Tax-Free
Income Fund | | | | | Sit Minnesota Tax-Free
Income Fund |
Year
Ended
March 31, 2024 | | | | | Year
Ended
March 31, 2023 | | | | Year
Ended
March 31, 2024 | | | | | | | | Year
Ended
March 31, 2023 | | | | | Year
Ended
March 31, 2024 | | | | | | | | Year
Ended
March 31, 2023 |
| | | | | | | | | | | | | | | | | | | | | | | | | | | | | | | | | | | | | | | | | | | | | | | | | | | | | | | | | | | | | | | | | | | |
| | $5,652,404 | | | | | | | | | | | | | | $4,488,076 | | | | | | | | $6,465,550 | | | | | | | | | | | | | | $9,021,930 | | | | | | | | | | | | $13,594,838 | | | | | | | | | | | | | | $14,876,124 | | | |
| | (1,608,587) | | | | | | | | | | | | | | (3,469,408) | | | | | | | | (12,060,494) | | | | | | | | | | | | | | (2,166,379) | | | | | | | | | | | | (5,018,438) | | | | | | | | | | | | | | 630,442 | | | |
| | 1,626,823 | | | | | | | | | | | | | | (1,227,808) | | | | | | | | 13,778,368 | | | | | | | | | | | | | | (22,398,044) | | | | | | | | | | | | 5,021,073 | | | | | | | | | | | | | | (32,475,457) | | | |
| | | | | | | | | | | | | | | | | | | | | | | | | | | | | | | | | | | | | | | | | | | | | | | | | | | | | | | | | | | | | | | | | | |
| | | | | | | | | | | | | | | | | | | | |
| | 5,670,640 | | | | | | | | | | | | | | (209,140) | | | | | | | | 8,183,424 | | | | | | | | | | | | | | (15,542,493) | | | | | | | | | | | | 13,597,473 | | | | | | | | | | | | | | (16,968,891) | | | |
| | | | | | | | | | | | | | | | | | | | | | | | | | | | | | | | | | | | | | | | | | | | | | | | | | | | | | | | | | | | | | | | | | |
| | | | | | | | | | | | | | | | | | | | |
| | | | | | | | | | | | | | | | | | | | | | | | | | | | | | | | | | | | | | | | | | | | | | | | | | | | | | | | | | | | | | | | | | | |
| | | | | | | | | | | | | | | | | | | | | | | | | | | | | | | | | | | | | | | | | | | | | | | | | | | | | | | | | | | | | | | | | | |
| | (1,342,313) | | | | | | | | | | | | | | (2,292,234) | | | | | | | | (4,014,442) | | | | | | | | | | | | | | (4,670,105) | | | | | | | | | | | | (13,592,526) | | | | | | | | | | | | | | (16,123,197) | | | |
| | (4,307,744) | | | | | | | | | | | | | | (4,867,214) | | | | | | | | (2,578,845) | | | | | | | | | | | | | | (4,351,818) | | | | | | | | | | | | — | | | | | | | | | | | | | | — | | | |
| | | | | | | | | | | | | | | | | | | | | | | | | | | | | | | | | | | | | | | | | | | | | | | | | | | | | | | | | | | | | | | | | | |
| | | | | | | | | | | | | | | | | | | | |
| | (5,650,057) | | | | | | | | | | | | | | (7,159,448) | | | | | | | | (6,593,287) | | | | | | | | | | | | | | (9,021,923) | | | | | | | | | | | | (13,592,526) | | | | | | | | | | | | | | (16,123,197) | | | |
| | | | | | | | | | | | | | | | | | | | | | | | | | | | | | | | | | | | | | | | | | | | | | | | | | | | | | | | | | | | | | | | | | |
| | | | | | | | | | | | | | | | | | | | |
| | | | | | | | | | | | | | | | | | | | | | | | | | | | | | | | | | | | | | | | | | | | | | | | | | | | | | | | | | | | | | | | | | | |
| | | | | | | | | | | | | | | | | | | | | | | | | | | | | | | | | | | | | | | | | | | | | | | | | | | | | | | | | | | | | | | | | | |
| | 33,030,170 | | | | | | | | | | | | | | 78,842,647 | | | | | | | | 19,018,981 | | | | | | | | | | | | | | 42,103,767 | | | | | | | | | | | | 69,229,675 | | | | | | | | | | | | | | 151,918,760 | | | |
| | 35,603,788 | | | | | | | | | | | | | | 152,397,219 | | | | | | | | 12,714,745 | | | | | | | | | | | | | | 42,133,790 | | | | | | | | | | | | — | | | | | | | | | | | | | | — | | | |
| | | | | | | | | | | | | | | | | | | | | | | | | | | | | | | | | | | | | | | | | | | | | | | | | | | | | | | | | | | | | | | | | | |
| | 1,302,057 | | | | | | | | | | | | | | 2,248,505 | | | | | | | | 3,668,309 | | | | | | | | | | | | | | 4,243,407 | | | | | | | | | | | | 11,949,011 | | | | | | | | | | | | | | 14,361,442 | | | |
| | 4,276,482 | | | | | | | | | | | | | | 4,801,019 | | | | | | | | 1,566,067 | | | | | | | | | | | | | | 1,330,553 | | | | | | | | | | | | — | | | | | | | | | | | | | | — | | | |
| | | | | | | | | | | | | | | | | | | | | | | | | | | | | | | | | | | | | | | | | | | | | | | | | | | | | | | | | | | | | | | | | | |
| | (37,138,682) | | | | | | | | | | | | | | (179,130,345) | | | | | | | | (49,436,791) | | | | | | | | | | | | | | (92,461,765) | | | | | | | | | | | | (142,194,612) | | | | | | | | | | | | | | (294,357,293) | | | |
| | (48,452,739) | | | | | | | | | | | | | | (42,352,437) | | | | | | | | (68,386,288) | | | | | | | | | | | | | | (84,043,355) | | | | | | | | | | | | — | | | | | | | | | | | | | | — | | | |
| | | | | | | | | | | | | | | | | | | | | | | | | | | | | | | | | | | | | | | | | | | | | | | | | | | | | | | | | | | | | | | | | | |
| | | | | | | | | | | | | | | | | | | | |
| | (11,378,924) | | | | | | | | | | | | | | 16,806,608 | | | | | | | | (80,854,977) | | | | | | | | | | | | | | (86,693,603) | | | | | | | | | | | | (61,015,926) | | | | | | | | | | | | | | (128,077,091) | | | |
| | | | | | | | | | | | | | | | | | | | | | | | | | | | | | | | | | | | | | | | | | | | | | | | | | | | | | | | | | | | | | | | | | |
| | | | | | | | | | | | | | | | | | | | |
| | (11,358,341) | | | | | | | | | | | | | | 9,438,020 | | | | | | | | (79,264,840) | | | | | | | | | | | | | | (111,258,019) | | | | | | | | | | | | (61,010,979) | | | | | | | | | | | | | | (161,169,179) | | | |
| | | | | | | | | | | | | | | | | | | | |
| | | | | | | | | | | | | | | | | | | | | | | | | | | | | | | | | | | | | | | | | | | | | | | | | | | | | | | | | | | | | | | | | | | |
| | 144,683,566 | | | | | | | | | | | | | | 135,245,546 | | | | | | | | 243,155,344 | | | | | | | | | | | | | | 354,413,363 | | | | | | | | | | | | 466,994,674 | | | | | | | | | | | | | | 628,163,853 | | | |
| | | | | | | | | | | | | | | | | | | | | | | | | | | | | | | | | | | | | | | | | | | | | | | | | | | | | | | | | | | | | | | | | | |
| | | | | | | | | | | | | | | | | | | | |
| | $133,325,225 | | | | | | | | | | | | | | $144,683,566 | | | | | | | | $163,890,504 | | | | | | | | | | | | | | $243,155,344 | | | | | | | | | | | | $405,983,695 | | | | | | | | | | | | | | $466,994,674 | | | |
| | | | | | | | | | | | | | | | | | | | | | | | | | | | | | | | | | | | | | | | | | | | | | | | | | | | | | | | | | | | | | | | | | |
| | | | | | | | | | | | | | | | | | | | |
| | | | | | | | | | | | | | | | | | | | | | | | | | | | | | | | | | | | | | | | | | | | | | | | | | | | | | | | | | | | | | | | | | | |
| | | | | | | | | | | | | | | | | | | | | | | | | | | | | | | | | | | | | | | | | | | | | | | | | | | | | | | | | | | | | | | | | | |
| | 3,508,914 | | | | | | | | | | | | | | 8,044,596 | | | | | | | | 2,258,896 | | | | | | | | | | | | | | 4,851,251 | | | | | | | | | | | | 7,424,302 | | | | | | | | | | | | | | 16,072,878 | | | |
| | 3,784,819 | | | | | | | | | | | | | | 15,511,420 | | | | | | | | 1,508,593 | | | | | | | | | | | | | | 4,902,907 | | | | | | | | | | | | — | | | | | | | | | | | | | | — | | | |
| | | | | | | | | | | | | | | | | | | | | | | | | | | | | | | | | | | | | | | | | | | | | | | | | | | | | | | | | | | | | | | | | | |
| | 138,480 | | | | | | | | | | | | | | 234,244 | | | | | | | | 434,225 | | | | | | | | | | | | | | 495,017 | | | | | | | | | | | | 1,282,330 | | | | | | | | | | | | | | 1,526,031 | | | |
| | 454,099 | | | | | | | | | | | | | | 500,524 | | | | | | | | 185,619 | | | | | | | | | | | | | | 155,263 | | | | | | | | | | | | — | | | | | | | | | | | | | | — | | | |
| | | | | | | | | | | | | | | | | | | | | | | | | | | | | | | | | | | | | | | | | | | | | | | | | | | | | | | | | | | | | | | | | | |
| | (3,949,930) | | | | | | | | | | | | | | (18,194,974) | | | | | | | | (5,850,712) | | | | | | | | | | | | | | (10,709,335) | | | | | | | | | | | | (15,362,397) | | | | | | | | | | | | | | (31,230,947) | | | |
| | (5,135,746) | | | | | | | | | | | | | | (4,377,659) | | | | | | | | (8,030,855) | | | | | | | | | | | | | | (9,738,767) | | | | | | | | | | | | — | | | | | | | | | | | | | | — | | | |
| | | | | | | | | | | | | | | | | | | | | | | | | | | | | | | | | | | | | | | | | | | | | | | | | | | | | | | | | | | | | | | | | | |
| | | | | | | | | | | | | | | | | | | | |
| | (1,199,364) | | | | | | | | | | | | | | 1,718,151 | | | | | | | | (9,494,234) | | | | | | | | | | | | | | (10,043,664) | | | | | | | | | | | | (6,655,765) | | | | | | | | | | | | | | (13,632,038) | | | |
| | | | | | | | | | | | | | | | | | | | | | | | | | | | | | | | | | | | | | | | | | | | | | | | | | | | | | | | | | | | | | | | | | |
FINANCIAL HIGHLIGHTS
Per share income and capital changes for a share outstanding throughout the period. See accompanying notes to financial statements.
| | | | | | | | | | | | | | | | | | | | | | | | |
Sit U.S. Government Securities Fund | | | | | | | | | | | | | |
| | |
| Class S | | Year Ended March 31, | | | | |
| | | 2024 | | | 2023 | | | 2022 | | | 2021 | | | 2020 | | | | |
| | | | | | |
Net Asset Value: | | | | | | | | | | | | | | | | | | | | | | | | |
Beginning of period | | | $10.35 | | | | $10.83 | | | | $11.17 | | | | $11.26 | | | | $10.92 | | | | | |
| | | | | | |
Operations: | | | | | | | | | | | | | | | | | | | | | | | | |
Net investment income 1 | | | 0.33 | | | | 0.27 | | | | 0.10 | | | | 0.14 | | | | 0.22 | | | | | |
Net realized and unrealized gains (losses) on investments and written options | | | (0.17 | ) | | | (0.48 | ) | | | (0.34 | ) | | | (0.09 | ) | | | 0.34 | | | | | |
| | | | | | |
Total from operations | | | 0.16 | | | | (0.21 | ) | | | (0.24 | ) | | | 0.05 | | | | 0.56 | | | | | |
Distributions from: | | | | | | | | | | | | | | | | | | | | | | | | |
Net investment income | | | (0.34 | ) | | | (0.27 | ) | | | (0.10 | ) | | | (0.14 | ) | | | (0.22 | ) | | | | |
| | | | | | |
Net Asset Value | | | | | | | | | | | | | | | | | | | | | | | | |
End of period | | | $10.17 | | | | $10.35 | | | | $10.83 | | | | $11.17 | | | | $11.26 | | | | | |
| | | | | | |
Total investment return 2 | | | 1.64 | % | | | (1.89 | %) | | | (2.16 | %) | | | 0.44 | % | | | 5.25 | % | | | | |
| | | | | | |
Net assets at end of period (000’s omitted) | | | $182,150 | | | | $266,067 | | | | $318,439 | | | | $398,821 | | | | $404,985 | | | | | |
| | | | | | |
Ratios: 3 | | | | | | | | | | | | | | | | | | | | | | | | |
Expenses | | | 0.80 | % | | | 0.80 | % | | | 0.80 | % | | | 0.80 | % | | | 0.80 | % | | | | |
Net investment income | | | 3.29 | % | | | 2.55 | % | | | 0.90 | % | | | 1.25 | % | | | 2.06 | % | | | | |
| | | | | | |
Portfolio turnover rate (excluding short-term securities) | | | 18.08 | % | | | 56.81 | % | | | 40.96 | % | | | 39.29 | % | | | 29.91 | % | | | | |
| 1 | The net investment income per share is based on average shares outstanding for the period. |
| 2 | Total investment return is based on the change in net asset value of a share during the period (not annualized) and assumes reinvestment of distributions at net asset value. |
| 3 | Ratios are annualized for periods less than one year. In addition to fees and expenses which the Fund bears directly, the Fund indirectly bears a pro rata share of the fees and expenses of the acquired funds in which it invests. Such indirect expenses are not included in the above reported expense ratios. |
| | |
| |
| | |
| | |
| 48 | | SIT MUTUAL FUNDS ANNUAL REPORT |
FINANCIAL HIGHLIGHTS
Per share income and capital changes for a share outstanding throughout the period. See accompanying notes to financial statements.
| | | | | | | | | | | | | | | | | | | | |
Sit U.S. Government Securities Fund | | | | | |
| | |
| Class Y | | Year Ended March 31, | | | Period Ended March 31, 2020 1 | |
| | | 2024 | | | 2023 | | | 2022 | | | 2021 | |
| | | | | |
Net Asset Value: | | | | | | | | | | | | | | | | | | | | |
Beginning of period | | | $10.35 | | | | $10.83 | | | | $11.17 | | | | $11.26 | | | | $10.97 | |
| | | | | |
Operations: | | | | | | | | | | | | | | | | | | | | |
Net investment income 2 | | | 0.36 | | | | 0.29 | | | | 0.13 | | | | 0.17 | | | | 0.06 | |
Net realized and unrealized gains (losses) on investments and written options | | | (0.17 | ) | | | (0.47 | ) | | | (0.34 | ) | | | (0.09 | ) | | | 0.29 | |
| | | | | |
Total from operations | | | 0.19 | | | | (0.18 | ) | | | (0.21 | ) | | | 0.08 | | | | 0.35 | |
Distributions from: | | | | | | | | | | | | | | | | | | | | |
Net investment income | | | (0.37 | ) | | | (0.30 | ) | | | (0.13 | ) | | | (0.17 | ) | | | (0.06) | |
| | | | | |
Net Asset Value | | | | | | | | | | | | | | | | | | | | |
End of period | | | $10.17 | | | | $10.35 | | | | $10.83 | | | | $11.17 | | | | $11.26 | |
| | | | | |
Total investment return 3 | | | 1.91 | % | | | (1.67 | %) | | | (1.91 | %) | | | 0.72 | % | | | 3.20% | |
| | | | | |
Net assets at end of period (000’s omitted) | | | $65,255 | | | | $91,639 | | | | $109,305 | | | | $128,449 | | | | $13,085 | |
| | | | | |
Ratios: 4 | | | | | | | | | | | | | | | | | | | | |
Expenses | | | 0.55 | % | | | 0.55 | % | | | 0.55 | % | | | 0.55 | % | | | 0.55% | |
Net investment income | | | 3.54 | % | | | 2.80 | % | | | 1.14 | % | | | 1.44 | % | | | 2.19% | |
| | | | | |
Portfolio turnover rate (excluding short-term securities) | | | 18.08 | % | | | 56.81 | % | | | 40.96 | % | | | 39.29 | % | | | 29.91% | |
| 1 | The inception date of Class Y shares was January 1, 2020. |
| 2 | The net investment income per share is based on average shares outstanding for the period. |
| 3 | Total investment return is based on the change in net asset value of a share during the period (not annualized) and assumes reinvestment of distributions at net asset value. |
| 4 | Ratios are annualized for periods less than one year. In addition to fees and expenses which the Fund bears directly, the Fund indirectly bears a pro rata share of the fees and expenses of the acquired funds in which it invests. Such indirect expenses are not included in the above reported expense ratios. |
FINANCIAL HIGHLIGHTS
Per share income and capital changes for a share outstanding throughout the period. See accompanying notes to financial statements.
| | | | | | | | | | | | | | | | | | | | | | | | |
| Sit Quality Income Fund | | | | | | | | | | | | | | | | | | | | | | | | |
| | | |
| Class S | | Year Ended March 31, | | | | |
| | 2024 | | | 2023 | | | 2022 | | | 2021 | | | 2020 | | | | |
| | | | | | |
Net Asset Value: | | | | | | | | | | | | | | | | | | | | | | | | |
Beginning of period | | | $9.46 | | | | $9.98 | | | | $10.04 | | | | $9.82 | | | | $9.80 | | | | | |
| | | | | | |
Operations: | | | | | | | | | | | | | | | | | | | | | | | | |
Net investment income 1 | | | 0.37 | | | | 0.28 | | | | 0.15 | | | | 0.10 | | | | 0.18 | | | | | |
Net realized and unrealized gains (losses) on investments, written options and futures | | | 0.01 | | | | (0.33 | ) | | | (0.05 | ) | | | 0.22 | | | | 0.02 | | | | | |
| | | | | | |
Total from operations | | | 0.38 | | | | (0.05 | ) | | | 0.10 | | | | 0.32 | | | | 0.20 | | | | | |
Distributions from: | | | | | | | | | | | | | | | | | | | | | | | | |
Net investment income | | | (0.38 | ) | | | (0.29 | ) | | | (0.15 | ) | | | (0.10 | ) | | | (0.18 | ) | | | | |
From net realized gains | | | — | | | | (0.18 | ) | | | (0.01 | ) | | | — | | | | — | | | | | |
| | | | | | |
Total distributions | | | (0.38 | ) | | | (0.47 | ) | | | (0.16 | ) | | | (0.10 | ) | | | (0.18 | ) | | | | |
Net Asset Value | | | | | | | | | | | | | | | | | | | | | | | | |
End of period | | | $9.46 | | | | $9.46 | | | | $9.98 | | | | $10.04 | | | | $9.82 | | | | | |
| | | | | | |
Total investment return 2 | | | 4.05 | % | | | (0.47 | %) | | | 0.92 | % | | | 3.32 | % | | | 2.04 | % | | | | |
| | | | | | |
Net assets at end of period (000’s omitted) | | | $31,574 | | | | $34,440 | | | | $135,246 | | | | $108,794 | | | | $90,273 | | | | | |
| | | | | | |
Ratios: 3 | | | | | | | | | | | | | | | | | | | | | | | | |
Expenses (without waiver) | | | 0.90 | %4 | | | 0.90 | % | | | 0.90 | % | | | 0.90 | % | | | 0.90 | % | | | | |
Expenses (with waiver) | | | 0.80 | %4 | | | 0.80 | % | | | — | | | | — | | | | — | | | | | |
Net investment income (without waiver) | | | 3.87 | % | | | 2.76 | % | | | 1.51 | % | | | 1.05 | % | | | 1.80 | % | | | | |
Net investment income (with waiver) | | | 3.97 | % | | | 2.86 | % | | | — | | | | — | | | | — | | | | | |
| | | | | | |
Portfolio turnover rate (excluding short-term securities) | | | 89.98 | % | | | 109.93 | % | | | 63.03 | % | | | 77.96 | % | | | 117.52 | % | | | | |
| 1 | The net investment income per share is based on average shares outstanding for the period. |
| 2 | Total investment return is based on the change in net asset value of a share during the period (not annualized) and assumes reinvestment of distributions at net asset value. |
| 3 | Ratios are annualized for periods less than one year. In addition to fees and expenses which the Fund bears directly, the Fund indirectly bears a pro rata share of the fees and expenses of the acquired funds in which it invests. Such indirect expenses are not included in the above reported expense ratios. |
| 4 | Total Fund expenses are limited to 0.90% of average daily net assets. However, during the period above, the investment adviser voluntarily absorbed expenses that were otherwise payable by the Fund. |
| | |
| |
| | |
| | |
| 50 | | SIT MUTUAL FUNDS ANNUAL REPORT |
FINANCIAL HIGHLIGHTS
Per share income and capital changes for a share outstanding throughout the period. See accompanying notes to financial statements.
Sit Quality Income Fund
| | | | | | | | | | |
| | | |
| Class Y | | Year Ended
March 31, 2024 | | Year Ended
March 31, 2023 1 |
| | | |
Net Asset Value: | | | | | | | | | | |
Beginning of period | | | $9.48 | | | | $9.97 | | | |
| | | |
Operations: | | | | | | | | | | |
Net investment income 2 | | | 0.40 | | | | 0.32 | | | |
Net realized and unrealized losses on investments, written options and futures | | | — | | | | (0.32 | ) | | |
| | | |
Total from operations | | | 0.40 | | | | – | | | |
Distributions from: | | | | | | | | | | |
Net investment income | | | (0.40 | ) | | | (0.31 | ) | | |
From net realized gains | | | — | | | | (0.18 | ) | | |
| | | |
Total distributions | | | (0.40 | ) | | | (0.49 | ) | | |
Net Asset Value | | | | | | | | | | |
End of period | | | $9.48 | | | | $9.48 | | | |
| | | |
Total investment return 3 | | | 4.42 | % | | | (0.11 | %) | | |
| | | |
Net assets at end of period (000’s omitted) | | | $101,751 | | | | $110,243 | | | |
| | | |
Ratios: 4 | | | | | | | | | | |
Expenses | | | 0.55 | % | | | 0.55 | % | | |
Net investment income | | | 4.24 | % | | | 3.28 | % | | |
| | | |
Portfolio turnover rate (excluding short-term securities) | | | 89.98 | % | | | 109.93 | % | | |
| 1 | The inception date of Class Y shares was March 31, 2022. |
| 2 | The net investment income per share is based on average shares outstanding for the period. |
| 3 | Total investment return is based on the change in net asset value of a share during the period (not annualized) and assumes reinvestment of distributions at net asset value. |
| 4 | Ratios are annualized for periods less than one year. In addition to fees and expenses which the Fund bears directly, the Fund indirectly bears a pro rata share of the fees and expenses of the acquired funds in which it invests. Such indirect expenses are not included in the above reported expense ratios. |
FINANCIAL HIGHLIGHTS
Per share income and capital changes for a share outstanding throughout the period. See accompanying notes to financial statements.
Sit Tax-Free Income Fund
| | | | | | | | | | | | | | | | | | | | | | | | |
| | | |
| Class S | | Year Ended March 31, | | | | |
| | 2024 | | | 2023 | | | 2022 | | | 2021 | | | 2020 | | | | |
| | | | | | |
Net Asset Value: | | | | | | | | | | | | | | | | | | | | | | | | |
Beginning of period | | | $8.54 | | | | $9.20 | | | | $9.91 | | | | $9.56 | | | | $9.69 | | | | | |
| | | | | | |
Operations: | | | | | | | | | | | | | | | | | | | | | | | | |
Net investment income 1 | | | 0.30 | | | | 0.27 | | | | 0.27 | | | | 0.29 | | | | 0.29 | | | | | |
Net realized and unrealized gains (losses) on investments and futures | | | 0.10 | | | | (0.66 | ) | | | (0.71 | ) | | | 0.35 | | | | (0.13 | ) | | | | |
| | | | | | |
Total from operations | | | 0.40 | | | | (0.39 | ) | | | (0.44 | ) | | | 0.64 | | | | 0.16 | | | | | |
Distributions from: | | | | | | | | | | | | | | | | | | | | | | | | |
Net investment income | | | (0.30 | ) | | | (0.27 | ) | | | (0.27 | ) | | | (0.29 | ) | | | (0.29 | ) | | | | |
| | | | | | |
Net Asset Value | | | | | | | | | | | | | | | | | | | | | | | | |
End of period | | | $8.64 | | | | $8.54 | | | | $9.20 | | | | $9.91 | | | | $9.56 | | | | | |
| | | | | | |
Total investment return 2 | | | 4.88 | % | | | (4.17 | %) | | | (4.62 | %) | | | 6.73 | % | | | 1.66 | % | | | | |
| | | | | | |
Net assets at end of period (000’s omitted) | | | $100,185 | | | | $126,041 | | | | $185,151 | | | | $348,230 | | | | $313,296 | | | | | |
| | | | | | |
Ratios: 3 | | | | | | | | | | | | | | | | | | | | | | | | |
Expenses | | | 0.80 | % | | | 0.80 | % | | | 0.80 | % | | | 0.80 | % | | | 0.80 | % | | | | |
Net investment income | | | 3.54 | % | | | 3.18 | % | | | 2.68 | % | | | 2.92 | % | | | 2.95 | % | | | | |
| | | | | | |
Portfolio turnover rate (excluding short-term securities) | | | 21.77 | % | | | 15.05 | % | | | 20.78 | % | | | 21.22 | % | | | 14.33 | % | | | | |
| 1 | The net investment income per share is based on average shares outstanding for the period. |
| 2 | Total investment return is based on the change in net asset value of a share during the period (not annualized) and assumes reinvestment of distributions at net asset value. |
| 3 | Ratios are annualized for periods less than one year. In addition to fees and expenses which the Fund bears directly, the Fund indirectly bears a pro rata share of the fees and expenses of the acquired funds in which it invests. Such indirect expenses are not included in the above reported expense ratios. |
| | |
| |
| | |
| | |
| 52 | | SIT MUTUAL FUNDS ANNUAL REPORT |
FINANCIAL HIGHLIGHTS
Per share income and capital changes for a share outstanding throughout the period. See accompanying notes to financial statements.
Sit Tax-Free Income Fund
| | | | | | | | | | | | |
| | | |
| Class Y | | Year Ended March 31, | | | Period Ended | |
| | 2024 | | | 2023 | | | March 31, 2022 1 | |
| | | |
Net Asset Value: | | | | | | | | | | | | |
Beginning of period | | | $8.54 | | | | $9.20 | | | | $10.04 | |
| | | |
Operations: | | | | | | | | | | | | |
Net investment income 2 | | | 0.32 | | | | 0.30 | | | | 0.24 | |
Net realized and unrealized gains (losses) on investments and futures | | | 0.11 | | | | (0.67 | ) | | | (0.84) | |
| | | |
Total from operations | | | 0.43 | | | | (0.37 | ) | | | (0.60) | |
Distributions from: | | | | | | | | | | | | |
Net investment income | | | (0.33 | ) | | | (0.29 | ) | | | (0.24) | |
| | | |
Net Asset Value | | | | | | | | | | | | |
End of period | | | $8.64 | | | | $8.54 | | | | $9.20 | |
| | | |
Total investment return 3 | | | 5.13 | % | | | (3.93 | %) | | | (6.06%) | |
| | | |
Net assets at end of period (000’s omitted) | | | $63,705 | | | | $117,115 | | | | $169,263 | |
| | | |
Ratios: 4 | | | | | | | | | | | | |
Expenses | | | 0.55 | % | | | 0.55 | % | | | 0.55% | |
Net investment income | | | 3.79 | % | | | 3.43 | % | | | 3.57% | |
| | | |
Portfolio turnover rate (excluding short-term securities) | | | 21.77 | % | | | 15.05 | % | | | 20.78% | |
| 1 | The inception date of Class Y shares was June 1, 2021. |
| 2 | The net investment income per share is based on average shares outstanding for the period. |
| 3 | Total investment return is based on the change in net asset value of a share during the period (not annualized) and assumes reinvestment of distributions at net asset value. |
| 4 | Ratios are annualized for periods less than one year. In addition to fees and expenses which the Fund bears directly, the Fund indirectly bears a pro rata share of the fees and expenses of the acquired funds in which it invests. Such indirect expenses are not included in the above reported expense ratios. |
FINANCIAL HIGHLIGHTS
Per share income and capital changes for a share outstanding throughout the period. See accompanying notes to financial statements.
| | | | | | | | | | | | | | | | | | | | | | | | |
| Sit Minnesota Tax-Free Income Fund | | | | | | | | | |
| | | |
| | | Year Ended March 31, | | | | |
| | | | | | |
| | | 2024 | | | 2023 | | | 2022 | | | 2021 | | | 2020 | | | | |
| | | | | | |
Net Asset Value: | | | | | | | | | | | | | | | | | | | | | | | | |
Beginning of period | | | $9.43 | | | | $9.94 | | | | $10.68 | | | | $10.37 | | | | $10.49 | | | | | |
| | | | | | |
Operations: | | | | | | | | | | | | | | | | | | | | | | | | |
Net investment income 1 | | | 0.29 | | | | 0.27 | | | | 0.27 | | | | 0.30 | | | | 0.30 | | | | | |
Net realized and unrealized gains (losses) on investments and futures | | | 0.04 | | | | (0.49 | ) | | | (0.74 | ) | | | 0.31 | | | | (0.12 | ) | | | | |
| | | | | | |
Total from operations | | | 0.33 | | | | (0.22 | ) | | | (0.47 | ) | | | 0.61 | | | | 0.18 | | | | | |
Distributions from: | | | | | | | | | | | | | | | | | | | | | | | | |
Net investment income | | | (0.29 | ) | | | (0.27 | ) | | | (0.27 | ) | | | (0.30 | ) | | | (0.30 | ) | | | | |
From net realized gains | | | — | | | | (0.02 | ) | | | — | | | | — | | | | — | | | | | |
| | | | | | |
Total distributions | | | (0.29 | ) | | | (0.29 | ) | | | (0.27 | ) | | | (0.30 | ) | | | (0.30 | ) | | | | |
Net Asset Value | | | | | | | | | | | | | | | | | | | | | | | | |
End of period | | | $9.47 | | | | $9.43 | | | | $9.94 | | | | $10.68 | | | | $10.37 | | | | | |
| | | | | | |
Total investment return 2 | | | 3.64 | % | | | (2.08 | %) | | | (4.56 | %) | | | 5.94 | % | | | 1.46 | % | | | | |
| | | | | | |
Net assets at end of period (000’s omitted) | | | $405,984 | | | | $466,995 | | | | $628,164 | | | | $680,301 | | | | $642,022 | | | | | |
| | | | | | |
Ratios: 3 | | | | | | | | | | | | | | | | | | | | | | | | |
Expenses | | | 0.80 | % | | | 0.80 | % | | | 0.80 | % | | | 0.80 | % | | | 0.80 | % | | | | |
Net investment income | | | 3.15 | % | | | 2.90 | % | | | 2.50 | % | | | 2.83 | % | | | 2.80 | % | | | | |
| | | | | | |
Portfolio turnover rate (excluding short-term securities) | | | 5.34 | % | | | 8.50 | % | | | 20.82 | % | | | 12.04 | % | | | 10.05 | % | | | | |
| 1 | The net investment income per share is based on average shares outstanding for the period. |
| 2 | Total investment return is based on the change in net asset value of a share during the period (not annualized) and assumes reinvestment of distributions at net asset value. |
| 3 | Ratios are annualized for periods less than one year. In addition to fees and expenses which the Fund bears directly, the Fund indirectly bears a pro rata share of the fees and expenses of the acquired funds in which it invests. Such indirect expenses are not included in the above reported expense ratios. |
| | |
| |
| | |
| | |
| 54 | | SIT MUTUAL FUNDS ANNUAL REPORT |
[This page is intentionally left blank.]
NOTES TO FINANCIAL STATEMENTS
Year Ended March 31, 2024
The Sit Mutual Funds covered by this report are Sit U.S. Government Securities Fund, Sit Quality Income Fund, Sit Tax-Free Income Fund and Sit Minnesota Tax-Free Income Fund (each a “Fund” and collectively, the “Funds”). The Funds are no-load funds, and are registered under the Investment Company Act of 1940 (as amended) as diversified (except Sit Minnesota Tax-Free Income Fund which is non-diversified), open-end management investment companies, or series thereof. The Sit Quality Income Fund, Sit Tax-Free Income Fund and Sit Minnesota Tax-Free Income Fund are series funds of Sit Mutual Funds II, Inc. Each Fund has 10 billion authorized shares of capital stock. Shares in the Sit U.S. Government Securities Fund have a par value of $0.01, and shares in other Funds have a par value of $0.001. This report covers the bond funds of the Sit Mutual Funds.
The investment objective for each Fund is as follows:
| | |
| Fund | | Investment Objective |
U.S. Government Securities Fund | | High current income and safety of principal. |
Quality Income Fund | | High current income and safety of principal. |
Tax-Free Income Fund | | High current income that is exempt from federal income tax, consistent with the preservation of capital. |
Minnesota Tax-Free Income Fund | | High current income that is exempt from federal regular income tax and Minnesota regular personal income tax, consistent with the preservation of capital. |
The U.S. Government Securities Fund, Quality Income Fund and Tax-Free Income Fund offer Class S and Class Y shares. Both classes of shares have identical voting, dividend and liquidation rights. Income, expenses (other than class specific expenses) and realized and unrealized gains or losses on investments are allocated to each class of shares based upon its relative net assets.
| (2) | Significant Accounting Policies |
The Funds are investment companies and follow accounting and reporting guidance under Financial Accounting Standards Board (“FASB”) Accounting Standards Codification (“ASC”) Topic 946, “Financial Services-Investment Companies”. The following is a summary of significant accounting policies consistently followed by the Funds in the preparation of their financial statements in conformity with U.S. generally accepted accounting principles (“GAAP”).
Investments in Securities
Investment securities are carried at fair value based upon closing market quotations on the last business day of the period. Investments in securities traded on national or international securities exchanges are valued at the last reported sales price prior to the time when assets are valued. Equity securities traded on the over-the-counter market are valued at the last reported sales price or if the last sales price is not available, at the last reported bid price. The sale and bid prices or prices deemed best to reflect fair value quoted by dealers who make markets in these securities are obtained from independent pricing services. Consistent with the Funds’ valuation policies and procedures, the current fair value of certain fixed income securities is provided by an independent pricing service. Fixed income securities for which prices are not available from an independent pricing service but where an active market exists are valued using market quotations obtained from broker-dealers or quotation systems. Securities for which market quotations are not available, such as private placement securities, are valued at fair value according to methods selected in good faith by Sit Investment Associates, Inc. (the “Adviser” or “SIA”) and may include dealer-supplied valuations or other inputs and assumptions that pricing services would typically utilize. Short-term investments of sufficient credit quality with maturities of 60 days or less when acquired, or which subsequently are within 60 days of maturity, are valued at amortized cost, which approximates fair value. Options and futures contracts entered into and held by the Funds are valued at the close of the securities and commodities exchange on which they are traded.
Security transactions are accounted for on the date the securities are purchased or sold. Gains and losses are calculated on the identified cost basis. Interest, including level-yield amortization of long-term bond premium and discount, is recorded on the accrual basis. Amortization of long-term bond premium and discount is calculated using the effective interest rate method. Dividends received from closed-end fund holdings are included in Dividend Income and distributions from capital gains, if any, are included in Net Realized Gain (Loss).
| | |
| |
| | |
| | |
| 56 | | SIT MUTUAL FUNDS ANNUAL REPORT |
Delivery and payment for securities which have been purchased by the Funds on a forward commitment or when-issued basis can take place two weeks or more after the transaction date. During this period, such securities are subject to market fluctuations and may increase or decrease in value prior to delivery.
The Minnesota Tax-Free Income Fund concentrates its investments in Minnesota, and therefore may have more credit risk related to the economic conditions in the state of Minnesota than a portfolio with broader geographical diversification.
Derivative Instruments
The Funds apply derivative instrument disclosure standards in order to enable investors to understand how and why the Funds use derivatives, how derivatives are accounted for, and how derivative instruments affect the Funds’ financial statements.
To hedge interest rate risk, the Funds used Treasury options and futures traded on a U.S. exchange. Risks of entering into futures and options contracts include the possibility of an illiquid market and that a change in the value of the option may not correlate with changes in the value of the underlying securities.
The premiums paid for the options represent the cost of the investment and the options are valued daily at their closing price. The Funds recognize a realized gain or loss when the option is sold or expired. Option holdings within the Funds, which may include put options and call options, are subject to loss of value with the passage of time, and may experience a total loss of value upon expiration. With options, there is minimal counterparty risk to the Funds since they are exchange traded.
Upon entering into a futures contract, a Fund is required to deposit either cash or securities in an amount (initial margin) equal to a certain percentage of the contract value. Subsequent payments (variation margin) are made or received by the Fund each day. The variation margin payments are equal to the daily changes in the contract value and are recorded as unrealized gains and losses. The Fund recognizes a realized gain or loss when the contract is closed or expired. With futures contracts, there is minimal counterparty risk to the Fund since futures are exchange traded and the exchange’s clearinghouse, as counterparty to all exchange-traded futures, guarantees the futures against default.
During the year ended March 31, 2024, the average volume of derivative activity, calculated on a quarterly basis, was as follows:
| | | | | | | | | | | | |
| | | Average Cost | | | Average Premium Received | | | Average Notional Amount | |
U.S. Government Securities Fund | | | | | | | | | | | | |
Purchased put options | | | $593,069 | | | | $349,313 | | | | $84,321,700 | |
| | | |
Quality Income Fund | | | | | | | | | | | | |
Purchased put options | | | | | | | | | | | | |
Treasury futures - short | | | 69,180 | | | | 42,803 | | | | 10,029,850 | |
| | | |
Tax-Free Income Fund | | | — | | | | — | | | | 11,010,727 | |
Treasury futures - short | | | | | | | | | | | | |
| | | |
Minnesota Tax-Free Income Fund | | | — | | | | — | | | | 57,641,707 | |
Treasury futures - short | | | | | | | | | | | | |
| | | — | | | | — | | | | 145,253,306 | |
The number of open option contracts and open futures contracts outstanding as of March 31, 2024 also serve as indicators of the volume of activity for the Funds throughout the period.
NOTES TO FINANCIAL STATEMENTS
Year Ended March 31, 2024 (Continued)
Statement of Assets and Liabilities – Values of derivatives as of March 31, 2024:
| | | | | | | | |
| | | Asset Derivatives Value | | | Liability Derivatives Value | |
| | | | |
Interest rate risk: | | | | | | | | |
U.S. Government Securities Fund | | | | | | | | |
Put Options Purchased | | | $406,8751 | | | | — | |
Quality Income Fund | | | | | | | | |
Put Options Purchased | | | 52,0311 | | | | — | |
Treasury futures | | | — | | | | $15,2362 | |
Tax-Free Income Fund | | | | | | | | |
Treasury futures | | | — | | | | 214,1272 | |
Minnesota Tax-Free Income Fund | | | | | | | | |
Treasury futures | | | — | | | | 692,7872 | |
| 1 | Statement of Assets and Liabilities location: Investments in Securities, at fair value. | |
| 2 | Statement of Assets and Liabilities location: Variation margin receivable/payable. Includes cumulative appreciation (depreciation) of futures as reported in the Schedule of Investments. | |
The effect of derivative instruments on the Statement of Operations for the year ended March 31, 2024:
| | | | | | | | |
| | | Amount of Realized Gain (Loss) on Derivatives 3 | | | Change in Unrealized Appreciation (Depreciation) on Derivatives 4 | |
Interest rate risk: | | | | | | | | |
U.S. Government Securities Fund | | | | | | | | |
Purchased put options | | | ($1,994,728) | | | | $459,384 | |
Quality Income Fund | | | | | | | | |
Purchased put options | | | (218,663) | | | | (17,951) | |
Treasury futures | | | 460,047 | | | | (4,233) | |
Tax-Free Income Fund | | | | | | | | |
Treasury futures | | | 569,438 | | | | 2,211,726 | |
Minnesota Tax-Free Income Fund | | | | | | | | |
Treasury futures | | | 3,463,565 | | | | 3,260,391 | |
| 3 | Statement of Operations location: Net realized gain (loss) on investments and net realized gain (loss) on futures, respectively. | |
| 4 | Statement of Operations location: Net change in unrealized appreciation (depreciation) on investments and net change in unrealized appreciation (depreciation) on futures, respectively. | |
Fair Value Measurements
The inputs and valuation techniques used to measure fair value of the Funds’ net assets are summarized into three levels as described in the hierarchy below:
• Level 1 – quoted prices in active markets for identical securities. An active market for the security is a market in which transactions occur with sufficient frequency and volume to provide pricing information on an ongoing basis. A quoted price in an active market provides the most reliable evidence of fair value.
• Level 2 – debt securities are valued based on evaluated prices received from independent pricing services or from dealers who make markets in such securities. For corporate bonds, U.S. government and government agency obligations, and municipal securities the pricing services utilize matrix pricing which considers yield or price of bonds of comparable quality, coupon, maturity, and type as well as dealer supplied prices. For asset-backed securities and mortgage-backed securities, the pricing services utilize matrix pricing which considers
| | |
| |
| | |
| | |
| 58 | | SIT MUTUAL FUNDS ANNUAL REPORT |
prepayment speed assumptions, attributes of the collateral, yield or price of bonds of comparable quality, coupon, maturity, and type as well as dealer supplied prices. All of these inputs are derived principally from or corroborated by observable market data. An adjustment to any observable input that is significant to the fair value may render the measurement a Level 3 measurement.
• Level 3 – significant unobservable inputs, including the Adviser’s own assumptions in determining the fair value of investments.
The inputs or methodology used for valuing securities are not necessarily an indication of the risk associated with investing in those securities.
At the end of each calendar quarter, management evaluates the Level 2 and 3 assets and liabilities for changes in liquidity, including but not limited to: whether a broker is willing to execute at the quoted price, the depth and consistency of prices from third party services, and the existence of contemporaneous, observable trades in the market. Additionally, management evaluates the Level 1 and 2 assets and liabilities on a quarterly basis for changes in listings or delistings on national exchanges. Due to the inherent uncertainty of determining the fair value of investments that do not have a readily available market value, the fair value of the Funds’ investments may fluctuate from period to period. Additionally, the fair value of investments may differ significantly from the values that would have been used had a ready market existed for such investments and may differ materially from the values the Fund may ultimately realize. Further, such investments may be subject to legal and other restrictions on resale or otherwise are less liquid than publicly traded securities.
A summary of the levels for the Funds’ investments as of March 31, 2024 is included with the Funds’ schedules of investments.
Federal Taxes
The Funds’ policy is to comply with the requirements of the Internal Revenue Code applicable to regulated investment companies and to distribute all of their taxable income to shareholders. The Funds have recorded in their financial statements the full benefit of their tax positions taken in connection with the Registered Investment Company (RIC) qualification and distribution requirements of the Internal Revenue Code. Therefore, no income tax provision is required. Also, in order to avoid the payment of any federal excise taxes, the Funds will distribute substantially all of their net investment income and net realized gains on a calendar year basis.
Management has analyzed the Funds’ tax positions taken in federal tax returns for all open tax years and has concluded that as of March 31, 2024, no provision for income tax would be required in the Funds’ financial statements. The Funds’ federal and state income and federal excise tax returns remain subject to examination by the Internal Revenue Service and state departments of revenue until such time as the applicable statute of limitations for audit has expired. For example, U.S. tax returns are generally subject to audit for three years from the date they are filed.
At March 31, 2024, the gross unrealized appreciation (depreciation) on investments and cost of investments on a tax basis for federal income tax purposes were as follows:
| | | | | | | | | | | | | | | | |
| | | Unrealized Appreciation | | | Unrealized Depreciation | | | Net Unrealized Appreciation (Depreciation) | | | Cost (Proceeds) of Investments on a Tax Basis | |
U.S. Government Securities Fund - Investments | | | $468,428 | | | | ($18,413,143) | | | | ($17,944,715 | ) | | | $267,211,274 | |
Quality Income Fund - Investments | | | 594,968 | | | | (2,432,203) | | | | (1,837,235 | ) | | | 133,891,159 | |
Tax-Free Income Fund - Investments | | | 1,886,112 | | | | (40,389,114) | | | | (38,503,002 | ) | | | 188,762,837 | |
Minnesota Tax-Free Income Fund - Investments | | | 3,007,598 | | | | (59,168,796) | | | | (56,161,198 | ) | | | 442,437,777 | |
NOTES TO FINANCIAL STATEMENTS
Year Ended March 31, 2024 (Continued)
Net investment income and net realized gains (losses) may differ for financial statement and tax purposes. The character of distributions made during the year from net investment income or net realized gains (losses) may also differ from its ultimate characterization for tax purposes. The tax character of distributions paid during the fiscal years ended March 31, 2024 and 2023 was as follows:
| | | | | | | | | | | | | | | | |
| Year Ended March 31, 2024: | | | | | | | | |
| | | Ordinary Income | | Tax-Exempt Income | | Long Term
Capital Gain | | Total |
U.S. Government Securities Fund | | | $10,122,712 | | | | — | | | | — | | | | $10,122,712 | |
Quality Income Fund | | | 5,650,057 | | | | — | | | | — | | | | 5,650,057 | |
Tax-Free Income Fund* | | | 32,379 | | | | $6,718,290 | | | | — | | | | 6,750,669 | |
Minnesota Tax-Free Income Fund* | | | 139,205 | | | | 13,459,633 | | | | — | | | | 13,598,838 | |
|
| *99.5% and 99.0% of dividends were derived from interest on tax-exempt securities for the Tax-Free Income and Minnesota Tax-Free Income Funds, respectively. | |
| | | | |
| Year Ended March 31, 2023: | | | | | | | | |
| | | Ordinary Income | | Tax-Exempt
Income | | Long Term
Capital Gain | | Total |
U.S. Government Securities Fund | | | $10,557,075 | | | | — | | | | — | | | | $10,557,075 | |
Quality Income Fund | | | 5,260,552 | | | | — | | | | $1,898,896 | | | | 7,159,448 | |
Tax-Free Income Fund* | | | 37,474 | | | | $8,984,449 | | | | — | | | | 9,021,923 | |
Minnesota Tax-Free Income Fund* | | | 1,213,125 | | | | 14,910,072 | | | | — | | | | 16,123,197 | |
|
| *99.6% and 92.5% of dividends were derived from interest on tax-exempt securities for the Tax-Free Income and Minnesota Tax-Free Income Funds, respectively. | |
As of March 31, 2024, the components of distributable earnings on a tax basis were as follows:
| | | | | | | | | | | | | | | | |
| | | Undistributed
Ordinary
Income | | Undistributed Tax-Exempt Income | | Accumulated
Gain (Loss) | | Unrealized
Appreciation
(Depreciation) |
U.S. Government Securities Fund | | | — | | | | — | | | | ($26,275,064 | ) | | | ($17,944,715 | ) |
Quality Income Fund | | | $2,749 | | | | — | | | | (5,888,486 | ) | | | (1,837,235 | ) |
Tax-Free Income Fund | | | — | | | | $91,173 | | | | (21,767,613 | ) | | | (38,503,002 | ) |
Minnesota Tax-Free Income Fund | | | — | | | | — | | | | (9,415,429 | ) | | | (56,161,198 | ) |
Net capital loss carryovers and late year losses, if any, as of March 31, 2024, are available to offset future realized capital gains and thereby reduce future capital gains distributions. The Funds are permitted to carry forward capital losses for an unlimited period. Capital losses that are carried forward retain their character as either short-term or long-term capital losses. The net capital loss carryovers and the late year losses deferred as of March 31, 2024, were as follows:
| | | | | | | | | | | | | | | | |
| | | Unlimited Period of Net | | Late Year | | | Accumulated |
| | | Capital Loss Carryover | | Losses | | | Capital and |
| | | Short-Term | | Long-Term | | Deferred | | | Other Losses |
U.S. Government Securities Fund | | | $5,656,698 | | | | $20,618,366 | | | | — | | | | $26,275,064 | |
Quality Income Fund | | | 2,304,742 | | | | 3,583,744 | | | | — | | | | 5,888,486 | |
Tax-Free Income Fund | | | 2,776,508 | | | | 18,991,105 | | | | — | | | | 21,767,613 | |
Minnesota Tax-Free Income Fund | | | — | | | | 9,415,429 | | | | — | | | | 9,415,429 | |
| | |
| |
| | |
| | |
| 60 | | SIT MUTUAL FUNDS ANNUAL REPORT |
Distributions
Distributions to shareholders are recorded as of the close of business on the record date. Such distributions are payable in cash or reinvested in additional shares of the Funds’ capital stock. Distributions from net investment income are declared daily and paid monthly for the Funds. Distributions from net realized gains, if any, will be made annually for each of the Funds.
Use of Estimates
The preparation of financial statements in conformity with U.S. generally accepted accounting principles requires management to make certain estimates and assumptions that affect the reported amounts of assets and liabilities and disclosure of contingent assets and liabilities at the date of the financial statements and the reported results for the respective periods. Actual results could differ from those estimates.
Guarantees and Indemnifications
Under each Fund’s organizational documents, its officers and directors are indemnified against certain liability arising out of the performance of their duties to each Fund. In addition, certain of each Fund’s contracts with its service providers contain general indemnification clauses. Each Fund’s maximum exposure under these arrangements is unknown since the amount of any future claims that may be made against each Fund cannot be determined and each Fund has no historical basis for predicting the likelihood of any such claims.
| (3) | Investment Security Transactions |
The cost of purchases and proceeds from sales and maturities of investment securities, other than short-term securities, for the year ended March 31, 2024, were as follows:
| | | | | | | | | | | | | | | | |
| | | Purchases | | | Proceeds | |
| | | | |
| | | U.S. Government | | | Other | | | U.S. Government | | | Other |
U.S. Government Securities Fund | | | $53,512,051 | | | | $180,019 | | | | $150,875,903 | | | | $2,526,284 | |
Quality Income Fund | | | 70,402,535 | | | | 44,044,789 | | | | 75,019,710 | | | | 47,180,262 | |
Tax-Free Income Fund | | | — | | | | 35,547,893 | | | | — | | | | 113,656,765 | |
Minnesota Tax-Free Income Fund | | | — | | | | 21,869,075 | | | | — | | | | 74,198,794 | |
NOTES TO FINANCIAL STATEMENTS
Year Ended March 31, 2024 (Continued)
| (4) | Affiliated Fees and Transactions |
Investment Adviser
The Funds each have entered into an investment management agreement with Sit Investment Associates Inc., under which SIA manages the Funds’ assets and provides research, statistical and advisory services, and pays related office rental, executive expenses and executive salaries. In addition, the Funds have entered into separate supervision and administration agreements with SIA. SIA also is obligated to pay all of the Funds’ expenses (excluding extraordinary expenses, stock transfer taxes, interest, brokerage commissions, and other transaction charges relating to investing activities). The fees charged to each Fund by SIA are based on the average daily net assets of the Funds at the annual rate of:
| | | | | | |
| | | Advisory
Fees | | Supervisory and
Administrative Fees | | Total
Management Fees |
U.S. Government Securities Fund Class S | | 0.20% | | 0.60% | | 0.80% |
U.S. Government Securities Fund Class Y | | 0.20% | | 0.35% | | 0.55% |
Quality Income Fund Class S1 | | 0.20% | | 0.60% | | 0.80% |
Quality Income Fund Class Y1 | | 0.20% | | 0.35% | | 0.55% |
Tax-Free Income Fund Class S | | 0.20% | | 0.60% | | 0.80% |
Tax-Free Income Fund Class Y | | 0.20% | | 0.35% | | 0.55% |
Minnesota Tax-Free Income Fund | | 0.20% | | 0.60% | | 0.80% |
| 1 | Effective April 1, 2022, the advisory fee for Sit Quality Income Fund was voluntarily reduced from 0.30% to 0.20%; the fees presented reflect the fees net of the Adviser’s voluntary fee waiver. | |
Transactions with affiliates
The Adviser, affiliates of the Adviser, directors and officers of the Funds as a whole owned the following shares as of March 31, 2024:
| | | | |
| | | Shares | | % Shares Outstanding |
U.S. Government Securities Fund Class S | | 170,641 | | 1.0 |
U.S. Government Securities Fund Class Y | | 1,038,447 | | 16.2 |
Quality Income Fund Class S | | 1,155,448 | | 34.6 |
Quality Income Fund Class Y | | 10,005,156 | | 93.2 |
Tax-Free Income Fund Class S | | 271,903 | | 2.3 |
Tax-Free Income Fund Class Y | | 728,925 | | 9.9 |
Minnesota Tax-Free Income Fund | | 1,318,082 | | 3.1 |
The Funds, together with the 10 equity Sit Mutual Funds managed by SIA, are borrowers in a $20 million credit facility (Credit Facility) maturing November 28, 2024. The Credit Facility provides a source of funds to the Borrowers for temporary and emergency purposes, including the ability to meet future unanticipated or unusually large redemption requests. Under the terms of the Credit Facility, each Fund shall pay interest charged on any borrowings made by the Fund. During the year ended March 31, 2024, the Funds did not use the Credit Facility.
| | |
| |
| | |
| | |
| 62 | | SIT MUTUAL FUNDS ANNUAL REPORT |
REPORT OF INDEPENDENT REGISTERED PUBLIC ACCOUNTING FIRM
To the Shareholders and Board of Directors
Sit U.S. Government Securities Fund, Inc.
Sit Mutual Funds II, Inc.:
Opinion on the Financial Statements
We have audited the accompanying statements of assets and liabilities of the Sit U.S. Government Securities Fund and Sit Quality Income Fund, Sit Tax-Free Income Fund, and Sit Minnesota Tax-Free Income Fund (each a Series of Sit Mutual Funds II, Inc.) (collectively, the Funds), including the schedules of investments, as of March 31, 2024, the related statements of operations for the year then ended, the statements of changes in net assets for each of the years in the two-year period then ended, and the related notes (collectively, the financial statements) and the financial highlights for each of the years or periods in the five-year period then ended. In our opinion, the financial statements and financial highlights present fairly, in all material respects, the financial position of the Funds as of March 31, 2024, the results of their operations for the year then ended, the changes in their net assets for each of the years in the two-year period then ended, and the financial highlights for each of the years or periods in the five-year period then ended, in conformity with U.S. generally accepted accounting principles.
Basis for Opinion
These financial statements and financial highlights are the responsibility of the Funds’ management. Our responsibility is to express an opinion on these financial statements and financial highlights based on our audits. We are a public accounting firm registered with the Public Company Accounting Oversight Board (United States) (PCAOB) and are required to be independent with respect to the Funds in accordance with the U.S. federal securities laws and the applicable rules and regulations of the Securities and Exchange Commission and the PCAOB.
We conducted our audits in accordance with the standards of the PCAOB. Those standards require that we plan and perform the audit to obtain reasonable assurance about whether the financial statements and financial highlights are free of material misstatement, whether due to error or fraud. Our audits included performing procedures to assess the risks of material misstatement of the financial statements and financial highlights, whether due to error or fraud, and performing procedures that respond to those risks. Such procedures included examining, on a test basis, evidence regarding the amounts and disclosures in the financial statements and financial highlights. Such procedures also included confirmation of securities owned as of March 31, 2024, by correspondence with custodians and brokers. Our audits also included evaluating the accounting principles used and significant estimates made by management, as well as evaluating the overall presentation of the financial statements and financial highlights. We believe that our audits provide a reasonable basis for our opinion.
/s/KPMG LLP
We have served as the auditor of one or more Sit Mutual Funds investment companies since 1982.
Minneapolis, Minnesota
May 16, 2024
EXPENSE EXAMPLE (Unaudited)
As a shareholder of the Funds, you incur two types of costs: (1) transaction costs, including redemption fees and (2) ongoing costs, including management fees; and other Fund expenses. This Example is intended to help you understand your ongoing costs (in dollars) of investing in the Funds and to compare these costs with the ongoing costs of investing in other mutual funds.
The Example is based on an investment of $1,000 invested at the beginning of the period and held for the entire period October 1, 2023 to March 31, 2024.
Actual Expenses
The first line of the following table provides information about actual account values and actual expenses. You may use the information in this line, together with the amount you invested, to estimate the expenses that you paid over the period. Simply divide your account value by $1,000 (for example, an $8,600 account value divided by $1,000 = 8.6), then multiply the result by the number in the first line under the heading entitled “Expenses Paid During Period” to estimate the expenses you paid on your account during this period.
Hypothetical Example for Comparison Purposes
The second line of the table provides information about hypothetical account values and hypothetical expenses based on the Fund’s actual expense ratio and an assumed rate of return of 5% per year before expenses, which is not the Fund’s actual return. The hypothetical account values and expenses may not be used to estimate the actual ending account balance or expenses you paid for the period. You may use this information to compare the ongoing costs of investing in the Fund and other funds. To do so, compare this 5% hypothetical example with the 5% hypothetical examples that appear in the shareholder reports of the other funds.
Please note that the expenses shown in the table are meant to highlight your ongoing costs only and do not reflect any transactional costs, such as redemption fees. Therefore, the second line of the table is useful in comparing ongoing costs only, and will not help you determine the relative total costs of owning different funds. In addition, if these transactional costs (redemption fees) were included, your costs would have been higher.
| | | | | | | | |
| | | Beginning
Account
Value
(10/1/23) | | | Ending
Account
Value
(3/31/24) | | Expenses
Paid During
Period
(10/1/23-
3/31/24)* |
| |
U.S. Government Securities Fund |
Actual | | | | | | | | |
Class S | | | $1,000 | | | $1,042.00 | | $4.08 |
Class Y | | | $1,000 | | | $1,044.40 | | $2.81 |
Hypothetical | | | | | | | | |
Class S | | | $1,000 | | | $1,021.00 | | $4.04 |
Class Y | | | $1,000 | | | $1,022.25 | | $2.78 |
| | | | | | | | |
| |
Quality Income Fund |
Actual | | | | | | | | |
Class S | | | $1,000 | | | $1,038.10 | | $4.08 |
Class Y | | | $1,000 | | | $1,040.50 | | $2.81 |
Hypothetical | | | | | | | | |
Class S | | | $1,000 | | | $1,021.00 | | $4.04 |
Class Y | | | $1,000 | | | $1,022.25 | | $2.78 |
| | | | | | | | |
| |
Tax-Free Income Fund |
Actual | | | | | | | | |
Class S | | | $1,000 | | | $1,083.40 | | $4.17 |
Class Y | | | $1,000 | | | $1,084.70 | | $2.87 |
Hypothetical | | | | | | | | |
Class S | | | $1,000 | | | $1,021.00 | | $4.04 |
Class Y | | | $1,000 | | | $1,022.25 | | $2.78 |
| | | | | | | | |
| |
Minnesota Tax-Free Income Fund |
Actual | | | $1,000 | | | $1,064.50 | | $4.13 |
Hypothetical | | | $1,000 | | | $1,021.00 | | $4.04 |
| * | Expenses are equal to the Funds’ annualized expense ratios of 0.80% for the U.S. Government Securities, Class S, Quality Income, Class S, Tax-Free Income, Class S, and Minnesota Tax-Free Income Funds; 0.55% for the U.S. Government Securities, Class Y, Quality Income, Class Y, and Tax-Free Income Funds, Class Y; multiplied by the average account value over the period, multiplied by 183/366 (to reflect the one-half year period.) |
| | |
| |
| | |
| | |
| 64 | | SIT MUTUAL FUNDS ANNUAL REPORT |
FEDERAL TAX INFORMATION (Unaudited)
Sit Bond Funds
For corporate shareholders, the percentage of investment income (dividend income and short-term gains, if any), for each of the Funds that qualify for the dividends-received deductions for the period of April 1, 2023 to March 31, 2024 is as follows:
| | | | |
| Fund | | Percentage | |
U.S. Government Securities Fund | | | 0.0 | % |
Quality Income Fund | | | 0.0 | |
Tax-Free Income Fund | | | 0.0 | |
Minnesota Tax-Free Income Fund | | | 0.0 | |
For the year ended March 31, 2024, certain dividends paid by the Funds may be subject to a maximum tax rate of 15%, as provided by the Jobs and Growth Tax Relief Reconciliation Act of 2003. Of the distributions made by the following Funds, the corresponding percentages represent the amount of each distribution which may qualify for the 15% dividend income tax rate.
| | | | |
| Fund | | Percentage | |
U.S. Government Securities Fund | | | 0.0 | % |
Quality Income Fund | | | 0.0 | |
Tax-Free Income Fund | | | 0.0 | |
Minnesota Tax-Free Income Fund | | | 0.0 | |
There were no funds that designated amounts as long-term capital gain dividends during the year ended March 31, 2024. Distributable long-term gains are based on net realized long term gains determined on a tax basis and may differ from such amounts for financial reporting purposes.
For the year ended March 31, 2024, 99.5% and 99.0% of dividends were derived from interest on tax-exempt securities for the Tax-Free Income Fund and Minnesota Tax-Free Income Fund, respectively. This portion of exempt-interest dividends is exempt from federal taxes and should not be included in shareholders’ gross income. Exempt-interest dividends may be subject to state and local taxes. Each shareholder should consult a tax adviser about reporting this income for state and local tax purposes.
INFORMATION ABOUT DIRECTORS AND OFFICERS
The Sit Mutual Funds are a family of no-load mutual funds. The bond Funds described in this Annual Report are the Sit U.S. Government Securities Fund, Sit Tax-Free Income Fund, Sit Minnesota Tax-Free Income Fund, and the Sit Quality Income Fund (the “Funds” or individually, a “Fund”). The stock funds within the Sit Mutual Fund family are described in a separate Annual Report. The Sit U.S. Government Securities Fund and the corporate issuer of the Sit Tax-Free Income Fund, Sit Minnesota Tax-Free Income Fund and Sit Quality Income Fund each have a Board of Directors (together, the “Boards”) and officers. Pursuant to Minnesota law, the Boards are responsible for the management of the Funds and the establishment of the Funds’ policies. The officers of the Funds manage the day-to-day operation of the Funds. Information pertaining to the directors and officers of the Funds is set forth below. The business address is that of the Funds’ investment adviser – 3300 IDS Center, 80 South Eighth Street, Minneapolis, Minnesota 55402. The Boards have a separate Audit Committee. The bond Funds’ Statement of Additional Information has additional information about the directors and is available without charge upon request by calling the Sit Funds at 800-332-5580.
| | | | | | | | | | |
Name, Age, and Position with Funds | | Term of Office (1) and Length of Time Served | | Principal Occupations During Past Five Years | | Number of Funds
Overseen in Fund Complex | | | Other Directorships
Held by Director (3) |
INTERESTED DIRECTOR: | | | | | | |
Roger J. Sit (2) Age: 62 Chairman and President | | Chairman since 10/2008; Officer since 1998. | | Chairman, President, CEO and Global CIO of Sit Investment Associates, Inc. (the “Adviser”); Chairman and CEO of Sit Fixed Income Advisors II, LLC (“SFI”); Chairman of SIA Securities Corp. (the “Distributor”). | | | 14 | | | The Huntington National Bank. |
| INDEPENDENT DIRECTORS: | | | | | | | | |
Edward M. Giles Age: 88 Director | | Director since 2012 or the Fund’s inception, if later. | | Senior Vice President of Peter B. Cannell & Co., July 2011 to present. | | | 14 | | | None. |
Sidney L. Jones Age: 90 Director | | Director from 1988 to 1989 and since 1993 or the Fund’s inception, if later. | | Lecturer, Washington Campus Consortium of 17 Universities. | | | 14 | | | None. |
Bruce C. Lueck Age: 83 Director | | Director since 2004 or the Fund’s inception, if later. | | Consultant for Zephyr Management, L.P. (investment management) and committee member of several investment funds and foundations. | | | 14 | | | None. |
Donald W. Phillips Age: 75 Director | | Director of the International Fund since1993, and since 1990 or the Fund’s inception, if later for all other Funds. | | Chairman and CEO of WP Global Partners Inc., July 2005 to present. | | | 14 | | | None. |
Barry N. Winslow Age: 76 Director | | Director since 2010 or the Fund’s inception, if later. | | Board member, TCF Financial Corporation, July 2014 to July 2019. | | | 14 | | | None. |
| | |
| |
| | |
| | |
| 66 | | SIT MUTUAL FUNDS ANNUAL REPORT |
| | | | | | | | | | |
Name, Age, and Position with Funds | | Term of Office (1) and Length of Time Served | | Principal Occupations During Past Five Years | | Number of Funds
Overseen in Fund Complex | | | Other Directorships
Held by Director (3) |
| OFFICERS: | | | | | | | | | | |
Mark H. Book Age: 60 Vice President – Investments | | Officer since 2002; Re-Elected by the Boards annually. | | Vice President and Portfolio Manager of SFI. | | | N/A | | | N/A |
Kelly K. Boston Age: 55 Assistant Secretary & Assistant Treasurer | | Officer since 2000; Re-Elected by the Boards annually. | | Staff Attorney of the Adviser; Secretary of the Distributor. | | | N/A | | | N/A |
Bryce A. Doty Age: 57 Vice President - Investments | | Officer since 1996; Re-Elected by the Boards annually. | | Senior Vice President and Senior Portfolio Manager of SFI. | | | N/A | | | N/A |
Paul J. Jungquist Age: 62 Vice President - Investments | | Officer since 1996; Re-Elected by the Boards annually. | | Senior Vice President and Senior Portfolio Manager of SFI. | | | N/A | | | N/A |
Paul E. Rasmussen Age: 63 Vice President, Treasurer, Secretary & Chief Compliance Officer | | Officer since 1994; Re-Elected by the Boards annually. | | Vice President, Secretary, Controller and Chief Compliance Officer of the Adviser; Vice President, Secretary, and Chief Compliance Officer of SFI; President and Treasurer of the Distributor. | | | N/A | | | N/A |
Carla J. Rose Age: 57 Vice President, Assistant Secretary & Assistant Treasurer | | Officer since 2000; Re-Elected by the Boards annually. | | Vice President, Administration & Deputy Controller of the Adviser; Vice President, Controller, Treasurer & Assistant Secretary of SFI; Vice President and Assistant Secretary of the Distributor. | | | N/A | | | N/A |
| 1 | Directors serve until their death, resignation, removal or the next meeting of the shareholders at which election of directors is an agenda item and a successor is duly elected and qualified. |
| 2 | Director who is deemed to be an “interested person” of the Funds as that term is defined by the Investment Company Act of 1940. Mr. Sit is considered an “interested person” because he is an officer of Sit Investment Associates, Inc., the Funds’ investment adviser. |
| 3 | Includes only directorships of companies required to report under the Securities Exchange Act of 1934 (i.e., public companies) or other investment companies registered under the 1940 Act. |
ADDITIONAL INFORMATION
PROXY VOTING
A description of the policies and procedures that the Adviser uses to vote proxies related to the Funds’ portfolio securities is set forth in the Funds’ Statement of Additional Information, which is available on the Funds’ website at www.sitfunds.com, without charge by calling 800-332-5580 and on the Securities and Exchange Commission’s (SEC) website at www.sec.gov. The Funds’ proxy voting record is available without charge by calling 800-332-5580 and on the SEC’s website at www.sec.gov no later than August 31 for the prior 12 months ending June.
QUARTERLY SCHEDULES OF INVESTMENTS
Each Fund files a complete schedule of investments with the SEC for the first and third quarters of each fiscal year on Form N-PORT. The Funds’ Form N-PORT is available on the SEC’s website at www.sec.gov. Each Fund’s complete schedule of investments, as filed on Form N-PORT, is also available on its website at www.sitfunds.com, or without charge by calling 800-332-5580.
STATEMENT REGARDING LIQUIDITY RISK MANAGEMENT PROGRAM
The Securities and Exchange Commission adopted Rule 22e-4 under the Investment Company Act of 1940, as amended (the “Liquidity Rule”), to promote effective liquidity risk management throughout the open-end investment company industry, thereby reducing the risk that a fund will be unable to meet requests to redeem its shares without significant dilution of remaining investors’ interest in the fund (“Liquidity Risk”).
At their joint meeting held on October 30, 2023, the Boards of Directors (the “Boards”) of the Sit Mutual Funds (each a “Fund and together, the “Funds”) reviewed the Funds’ liquidity risk management program (the “Program”) pursuant to the Liquidity Rule. In connection with this review, Sit Investment Associates, Inc. (“SIA”), the investment adviser to the Funds and administrator of the Program, provided the Boards with a written report that addressed the operation of the Program and assessed its adequacy and effectiveness of implementation during the prior year (the “Report”).
The Report described SIA’s liquidity classification methodology with respect to the Funds and noted SIA’s determination that a Highly Liquid Investment Minimum was not currently necessary for any Fund. The Report also summarized factors considered by SIA in assessing, managing, and periodically reviewing each Fund’s Liquidity Risk and the effectiveness of the Program with respect to each Fund. Such information and factors included, among other things: (i) evaluations of each Fund’s investment strategy and liquidity of investments during both normal and reasonably foreseeable stressed conditions; (ii) SIA’s determination that each Fund’s strategy remained appropriate for an open-end mutual fund; (iii) analyses of the Funds’ short-term and long-term cash flow projections during both normal and reasonably foreseeable stressed conditions, taking into account each Fund’s historical net redemption activity, shareholder ownership concentration, distribution channels and reasonably anticipated trading size; (iv) analyses of each Fund’s holdings of cash and cash equivalents, available borrowing arrangements, and other funding sources; (v) that each Fund held primarily highly liquid investments (investments that the Fund anticipates can be converted to cash within 3 business days or less in current market conditions without significantly changing their market value); (vi) that no Fund held more than 3% of its net assets in illiquid investments (investments that cannot be sold or disposed of in seven days or less in current market conditions without the sale of the investment significantly changing the market value of the investment) during normal market conditions; (vii) confirmation that each Fund had complied with the requirements of the Program; and (viii) that the Program had operated adequately and SIA recommended no changes to the Program at that time.
Based on the review, the Report concluded that the Program was operating as intended and is effective in implementing the requirements of the Liquidity Rule.
There can be no assurance that the Program will achieve its objectives under all circumstances in the future. Please refer to the Funds’ prospectuses for more information regarding a Fund’s exposure to Liquidity Risk and other risks to which it may be subject.
| | |
| |
| | |
| | |
| 68 | | SIT MUTUAL FUNDS ANNUAL REPORT |
BOARD RE-APPROVAL OF INVESTMENT MANAGEMENT AGREEMENTS
At their joint meeting held on October 30, 2023, the Boards of Directors (the “Boards”) of the Sit Tax-Free Income Fund, Sit Minnesota Tax-Free Income Fund, Sit Quality Income Fund and Sit U.S. Government Securities Fund, Inc. (each a “Fund” and collectively, the “Funds”) unanimously approved the continuation for another one-year period of the investment management agreements entered into by and between Sit Investment Associates, Inc. (“SIA”) and each of Sit Mutual Funds II, Inc., dated November 1, 1992; and Sit U.S. Government Securities Fund, Inc., dated November 1, 1992 (collectively, the “Agreements”).
In advance of the October 30, 2023 meeting, the Boards requested and received materials from SIA to assist them in considering the re-approval of the Agreements. The Boards, including all of the Directors who are not “interested persons” (as such term is defined in the Investment Company Act of 1940, as amended (the “1940 Act”)) of the Funds (the “non-interested Directors”) approved the Agreements after discussion and consideration of various factors relating to both the Boards’ selection of SIA as the Funds’ investment adviser and the Boards’ approval of the fees to be paid under the Agreements. In evaluating the Agreements, the Directors relied upon their knowledge, resulting from their meetings and other interactions throughout the year, of SIA and its services and personnel. The Directors did not consider any single factor as controlling in determining whether to approve the Agreements, and the items described herein are not all-encompassing of the matters considered by the Directors.
Investment Adviser Criteria. The Directors began their analysis by discussing their criteria for determining the quality of an investment adviser. In this regard, the Directors noted that their criteria were similar to those used by institutional investors in evaluating and selecting investment advisers. The Directors discussed several factors in assessing the nature, extent and quality of the services performed by SIA, including the following:
Investment Philosophy and Process. The Directors considered SIA’s philosophy of managing assets. With respect to fixed income securities, the Directors noted that SIA stresses the consistent attainment of superior risk-adjusted returns using a conservative investment management approach that seeks to identify pricing anomalies in the market and manage portfolio duration.
With respect to fixed income securities, the Directors considered that SIA seeks securities with a special emphasis on interest income and significant stability of principal value. They noted that SIA’s investment style seeks to avoid excessive return volatility and generate consistent results over an economic cycle. The Directors also noted that a component of each Fund’s objective is to seek high current income. The Directors reviewed each Fund’s portfolio characteristics and noted that SIA has consistently managed the Fund in accordance with its investment objective. The Directors noted that, because the Funds emphasize interest income, they may at times not rank highly in total return comparisons with funds that pursue different investment objectives.
The Directors discussed SIA’s consistent and well-defined investment process. With respect to fixed income securities, the Directors considered that the SIA’s portfolio managers are responsible for implementing the strategy set forth in SIA’s duration targets and interest rate projections.
Investment Professionals. The Directors discussed the experience, knowledge and organizational stability of SIA and its investment professionals. The Directors noted that SIA’s senior professionals are actively involved in the investment process and have significant investment industry experience.
The Directors discussed the depth of SIA’s investment staff, noting that SIA has over 35 investment professionals. Given the investment products offered by SIA and SIA’s amount of assets under management, the Directors determined that SIA’s investment staff is well positioned to meet the current needs of its clients, including the Funds, and to accommodate growth in its number of clients and assets under management for the near future. The Directors concluded that the depth of SIA’s investment staff, and in particular senior management and investment analysts, is actually greater than the Funds currently require at their present asset size. The Directors noted that SIA has the resources of an investment firm with over $16.6 billion in assets under management working for the benefit of the Funds’ shareholders. The Directors concluded that SIA has substantial resources to provide services to the Funds and that SIA’s services had been acceptable.
ADDITIONAL INFORMATION (Continued)
Investment Performance. The Directors reviewed and discussed the Funds’ investment performance on an absolute and comparable basis for various periods as discussed below. The Directors noted that the investment performance of the Funds has generally been competitive with indices and other funds with similar investment styles as the Funds, such as fixed income funds seeking to maximize income.
Corporate Culture. The Directors discussed SIA’s corporate values and commitment to operate under the highest ethical and professional standards. They considered that SIA’s culture is set and practiced by senior management of SIA who insist that all SIA professionals exhibit honesty and integrity. The Directors noted that SIA’s values are evident in the services it provides to the Funds.
Review of Specific Factors. The Directors continued their analysis by reviewing specific information on SIA and the Funds, and the specific terms of the Agreements, including the following:
Investment Performance. The Directors reviewed the investment performance of each Fund for the 3-month, 6-month, 1-year, 3-year, 5-year, 10-year (as applicable) and since inception periods ended September 30, 2023, both on an absolute basis and on a comparative basis to indices and mutual funds within the same investment categories. As noted above, the Directors concluded that the investment performance of the Funds has been competitive in relation to funds with similar objectives and strategies.
Fees and Expenses. The Directors noted that the Funds pay SIA a monthly fee and SIA is responsible for all of the Funds’ expenses except for supervisory and administrative fees paid to SIA pursuant to Supervision and Administration Agreements, interest, brokerage commissions and transaction charges and certain extraordinary expenses. The Directors considered fees paid in prior years and the fees to be paid under the Agreements and Supervision and Administration Agreements.
The Directors compared each Fund’s expense ratio to (i) the average and median expense ratios of no-load mutual funds within the same Morningstar, Inc. (“Morningstar”) investment category, (ii) the average expense ratio for load funds within the Fund’s Morningstar category, and (iii) the average expense ratio for all funds within the Fund’s Morningstar category. The Directors also compared each Fund’s management fees to (i) the average and median actual management fees of no-load mutual funds within the same Morningstar investment category, (ii) the average actual management fees for load funds within the Fund’s Morningstar category, and (iii) the average actual management fees for all funds within the Fund’s Morningstar category. Generally, the Funds’ expense ratios were higher than the averages. The Directors noted that the Morningstar no-load categories include funds of various asset sizes, some of which are significantly larger in assets than the Funds. The Directors concluded that the fees paid by the Funds are reasonable and appropriate.
The Directors reviewed the extent to which the fees to be paid under the Agreements by each Fund may be affected by an increase in the Fund’s assets, which included reviewing each Fund’s current and historical assets and the likelihood and magnitude of future increases in the Fund’s assets. The Directors agreed that it is appropriate that the Funds benefit from improved economies of scale as the Funds’ assets increase. However, the Directors concluded that, given the amount of the Funds’ current assets and the likelihood and magnitude of future increases in the Funds’ assets, a graduated fee structure for each Fund was unnecessary at the time because the fees to be paid under the current Agreements were reasonable and appropriate.
The Directors reviewed the expenses paid by SIA relating to the operations of the Funds, and SIA’s income with respect to its management of the Funds for the past two calendar years. The Directors concluded that the expenses paid were appropriate and that SIA’s profit margin with respect to the management of the Funds was acceptable.
The Directors reviewed SIA’s investment advisory fee schedule for investment management services provided to other clients. The Directors compared the services provided to the Funds and other clients of SIA and its affiliates and recognized that the Funds’ expenses are borne by SIA except as noted above. The Directors concluded that the fees paid by the Funds in relation to the fees paid by other clients of SIA and its affiliates were appropriate and reasonable.
The Directors discussed the extent to which SIA receives ancillary benefits from its relationship with the Funds, such as soft dollar arrangements by which brokers provide research services to SIA as a result of brokerage generated by the Funds. The Boards concluded that any benefits SIA receives from its relationship with the Funds are well within industry norms, are reflected in the amount of the fees paid by the Funds to SIA and are appropriate and reasonable.
| | |
| |
| | |
| | |
| 70 | | SIT MUTUAL FUNDS ANNUAL REPORT |
Non-Advisory Services. The Directors considered the quality of non-advisory services which SIA provides to the Funds (and their shareholders), including pursuant to the Supervision and Administration Agreements applicable to the Funds, and the quality and depth of SIA’s non-investment personnel who provide such services. The Directors concluded that the level of such services and the quality and depth of such personnel are acceptable and consistent with industry standards.
Finally, the Directors considered the compliance staff and the regulatory history of SIA and the Funds and concluded that both are acceptable and consistent with industry standards.
Based on these conclusions, without any single conclusion being dispositive, the Directors, including the non-interested Directors by separate vote, determined that renewal of the Agreements was in the interest of each Fund and its shareholders.
[This page is intentionally left blank.]
| | |
| |
| | |
| | |
| 72 | | SIT MUTUAL FUNDS ANNUAL REPORT |
Annual Report March 31, 2024 INVESTMENT ADVISER Sit Investment Associates, Inc. 80 S. Eighth Street Suite 3300 Minneapolis, MN 55402 CUSTODIAN The Bank Of New York Mellon 111 Sanders Creek Parkway Syracuse, NY 13057 TRANSFER AGENT AND DISBURSING AGENT Sit Mutual Funds Attention: 534459 500 Ross Street, 154-0520 Pittsburgh, PA 15262 INDEPENDENT REGISTERED PUBLIC ACCOUNTING FIRM KPMG LLP Minneapolis, MN GENERAL COUNSEL Faegre Drinker Biddle & Reath LLP Minneapolis, MN Sit Mutual Funds 1-800-332-5580 www.sitfunds.com SIT BOND 3-2024
Item 2: Code of Ethics.
The registrant has adopted a code of ethics that applies to the registrant’s principal executive officer, principal financial officer, principal accounting officer, and persons performing similar functions. The registrant has not made any amendment to its code of ethics during the period covered by this report which must be described herein pursuant to Item 2. The registrant has not granted any waivers from any provisions of the code of ethics during the period covered by this report.
A copy of the registrant’s code of ethics is available without charge upon request by calling the registrant at 612-332-3223 or 1-800-332-5580, or by mail at Sit Mutual Funds, 3300 IDS Center, 80 South Eighth Street, Minneapolis, MN 55402.
Item 3: Audit Committee Financial Expert.
The registrant’s Board of Directors has determined that Mr. Edward M. Giles, Mr. Sidney L. Jones, Mr. Bruce C. Lueck, Mr. Donald W. Phillips, and Mr. Barry N. Winslow are audit committee financial experts serving on its audit
committee. Mr. Giles, Mr. Jones, Mr. Lueck, Mr. Phillips, and Mr. Winslow are independent for purposes of this item.
| Item | 4: Principal Accountant Fees and Services. |
(a) – (d) Aggregate fees billed to the registrant for the last two fiscal years for professional services rendered by the registrant’s principal accountant were as follows:
| | | | | | | | | | | | | | | | | | | | | | | | | | | | | | | | | | | | | | | | |
| | | 2024 | | 2023 |
| | | Audit
Fees (a) | | Audit
Related
Fees (b) | | Tax
Fees(c) | | Other
Fees (d) | | Audit Fees (a) | | Audit
Related
Fees (b) | | Tax
Fees (c) | | Other
Fees (d) |
Fiscal year ended March 31 | | | | | | | | | | | | | | | | | | | | | | | | | | | | | | | | | | | | | | | | |
Sit Mutual Funds II, Inc. | | | | | | | | | | | | | | | | | | | | | | | | | | | | | | | | | | | | | | | | |
Sit Tax-Free Income Fund (series A) | | | $ | 32,150 | | | | | $0 | | | | $ | 5,935 | | | | | $0 | | | | $ | 37,000 | | | | | $0 | | | | $ | 6,825 | | | | | $0 | |
Sit Minnesota Tax-Free Income Fund (series B) | | | $ | 31,050 | | | | | $0 | | | | $ | 5,935 | | | | | $0 | | | | $ | 35,600 | | | | | $0 | | | | $ | 6,825 | | | | | $0 | |
Sit Quality Income Fund (Series E) | | | $ | 19,500 | | | | | $0 | | | | $ | 5,935 | | | | | $0 | | | | $ | 22,400 | | | | | $0 | | | | $ | 6,825 | | | | | $0 | |
| | | | | | | | | | | | | | | | | | | | | | | | | | | | | | | | | | | | | | | | |
Total Mutual Funds II, Inc. | | | $ | 82,700 | | | | | $0 | | | | $ | 17,805 | | | | | $0 | | | | $ | 95,000 | | | | | $0 | | | | $ | 20,475 | | | | | $0 | |
Audit fees include amounts related to the audit of the registrant’s annual financial statements and services normally provided by the accountant in connection with statutory and regulatory filings. Audit-related fees include amounts reasonably related to the performance of the audit of the registrant’s financial statements, and/or are traditionally performed by the auditor. Tax fees include amounts related to tax compliance, tax planning, and tax advice.
(e) (1) The Audit Committee is required to pre-approve audit and non-audit services performed for the registrant by the independent auditor in order to assure that the provision of such services does not impair the auditor’s independence. The audit committee also is required to pre-approve certain non-audit services performed by the registrant’s independent auditor for the registrant’s investment adviser and certain of the adviser’s affiliates if the services relate directly to the operations and financial reporting of the registrant. Services to be provided by the auditor must receive general pre- approval or specific pre-approval by the audit committee. Any proposed services exceeding pre-approved cost levels will require separate pre-approval by the audit committee.
The audit committee may delegate pre-approval authority to the audit committee chairman. The chairman shall report any pre-approval decisions to the audit committee at its next scheduled meeting. The audit committee does not delegate its responsibility to pre-approve services performed by the independent auditor to management.
(2) No services included in (b) – (d) were approved pursuant to paragraph (c)(7)(i)(C) of Rule 2-01 of Regulation S-X.
(f) Not applicable.
(g) The aggregate fees billed for the most recent fiscal year and the preceding fiscal year by the registrant’s principal accountant for non-audit services rendered to the registrant, its investment adviser, and any entity controlling, controlled by, or under common control with the investment adviser that provides ongoing services to the registrant were $0 and $0 respectively.
(h) The registrant’s audit committee has determined that the provision of non-audit services rendered to the registrant’s investment adviser, and any entity controlling, controlled by, or under common control with the investment adviser that provides ongoing services to the registrant, that were not pre-approved pursuant to paragraph (c)(7)(ii) of Rule 2-01 of
Regulation S-X is considered compatible with maintaining the principal accountant’s independence.
Item 5: Audit Committee of Listed Registrants.
Not applicable to open-end investment companies.
Item 6: Schedule of Investments.
The schedule of investments is included as part of the report to shareholders filed under Item 1 of this Form.
Item 7: Disclosure of Proxy Voting Policies and Procedures for Closed-End Management Investment Companies.
Not applicable to open-end investment companies.
Item 8: Portfolio Managers of Closed-End Management Investments Companies. Not applicable to open-end investment companies.
Item 9: Purchases of Equity Securities by Closed-End Management Investment Company and Affiliated Purchasers.
Not applicable to open-end investment companies.
Item 10. Submission of Matters to a vote of Security Holders.
There have been no material changes to the procedures by which shareholders may recommend nominees to the registrant’s board of directors.
Item 11: Controls and Procedures -
(a) Based on their evaluation of the Registrant’s Disclosure Controls and Procedures as of a date within 90 days of the Filing Date, the Registrant’s Chairman and Treasurer have determined that the Disclosure Controls and Procedures (as defined in Rule 30a-2(c) under the Act) are designed to ensure that information required to be disclosed by the Registrant is recorded, processed, summarized and reported by the filing Date, and that information required to be disclosed in the report is communicated to the Registrant’s management, as appropriate, to allow timely decisions regarding required disclosure.
(b) There were no significant changes in the Registrant’s internal controls or in other factors that could significantly affect these controls subsequent to the date of their evaluation, and there were no corrective actions with regard to significant deficiencies and material weaknesses.
Item 12: Exhibits:
(a) The following exhibits are attached to this Form N-CSR:
(2) A separate certification for each principal executive and principal financial officer of the registrant as required by Rule 30a-2(a) under the Act (17 CFR 270.30a-2)(certification required by Section 302 of the Sarbanes- Oxley Act of 2002).
(b) Certification required by Rule 30a-2(b) under the Act (certification required by Section 906 of the Sarbanes-Oxley Act of 2002).
SIGNATURES
Pursuant to the requirements of the Securities Exchange Act of 1934 and the Investment Company Act of 1940, the registrant has duly caused this report to be signed on its behalf by the undersigned, thereunto duly authorized.
| | | | |
| Sit Mutual Funds II, Inc. | | | | |
By (Signature and Title) | | /s/ Paul E. Rasmussen | | |
| | Paul E. Rasmussen | | |
| | Vice President, Treasurer | | |
| Date May 17, 2024 | | | | |
Pursuant to the requirements of the Securities Exchange Act of 1934 and the Investment Company Act of 1940, this report has been signed below by the following persons on behalf of the registrant and in the capacities and on the dates indicated.
| | | | |
| By (Signature and Title) | | /s/ Paul E. Rasmussen | | |
| | Paul E. Rasmussen | | |
| | Vice President, Treasurer | | |
| | |
| Date May 17, 2024 | | | | |
| | |
| By (Signature and Title) | | /s/ Roger J. Sit | | |
| | Roger J. Sit | | |
| | Chairman | | |
| Date May 17, 2024 | | | | |