UNITED STATES
SECURITIES AND EXCHANGE COMMISSION
Washington, D.C. 20549
Form N-CSR
CERTIFIED SHAREHOLDER REPORT OF REGISTERED
MANAGEMENT INVESTMENT COMPANIES
Investment Company Act File Number: 811-02258
Eaton Vance Series Trust II
(Exact Name of Registrant as Specified in Charter)
Two International Place, Boston, Massachusetts 02110
(Address of Principal Executive Offices)
Maureen A. Gemma
Two International Place, Boston, Massachusetts 02110
(Name and Address of Agent for Services)
(617) 482-8260
(Registrant’s Telephone Number)
June 30
Date of Fiscal Year End
December 31, 2020
Date of Reporting Period
| Item 1. | Reports to Stockholders |

Parametric
Tax-Managed Emerging Markets Fund
Semiannual Report
December 31, 2020

Commodity Futures Trading Commission Registration. The Commodity Futures Trading Commission (“CFTC”) has adopted regulations that subject registered investment companies and advisers to regulation by the CFTC if a fund invests more than a prescribed level of its assets in certain CFTC-regulated instruments (including futures, certain options and swap agreements) or markets itself as providing investment exposure to such instruments. The investment adviser has claimed an exclusion from the definition of “commodity pool operator” under the Commodity Exchange Act with respect to its management of the Fund. Accordingly, neither the Fund nor the adviser with respect to the operation of the Fund is subject to CFTC regulation. Because of its management of other strategies, the Fund’s adviser and Parametric Portfolio Associates LLC (Parametric), sub-adviser to the Fund, are registered with the CFTC as commodity pool operators. The adviser and Parametric are also registered as commodity trading advisors.
Fund shares are not insured by the FDIC and are not deposits or other obligations of, or guaranteed by, any depository institution. Shares are subject to investment risks, including possible loss of principal invested.
This report must be preceded or accompanied by a current summary prospectus or prospectus. Before investing, investors should consider carefully the investment objective, risks, and charges and expenses of a mutual fund. This and other important information is contained in the summary prospectus and prospectus, which can be obtained from a financial intermediary. Prospective investors should read the prospectus carefully before investing. For further information, please call 1-800-260-0761.
Semiannual Report December 31, 2020
Parametric
Tax-Managed Emerging Markets Fund
Parametric
Tax-Managed Emerging Markets Fund
December 31, 2020
Performance1,2
Portfolio Managers Thomas C. Seto, Paul W. Bouchey, CFA and Jennifer Sireklove, CFA, each of Parametric Portfolio Associates LLC
| | | | | | | | | | | | | | | | | | | | | | | | |
| % Average Annual Total Returns | | Class
Inception Date | | | Performance
Inception Date | | | Six Months | | | One Year | | | Five Years | | | Ten Years | |
| | | | | | |
Institutional Class at NAV | | | 06/30/1998 | | | | 06/30/1998 | | | | 25.89 | % | | | 4.46 | % | | | 7.76 | % | | | 1.72 | % |
|
| |
| | | | | | |
MSCI Emerging Markets Index | | | — | | | | — | | | | 31.14 | % | | | 18.31 | % | | | 12.79 | % | | | 3.63 | % |
| | | | | | |
| % After-Tax Returns | | | | | Class
Inception Date | | | Performance
Inception Date | | | One Year | | | Five Years | | | Ten Years | |
| | | | | | |
Return After Taxes on Distributions | | | | | | | 06/30/1998 | | | | 06/30/1998 | | | | 4.41 | % | | | 7.56 | % | | | 1.53 | % |
Return After Taxes on Distributions and Sales of Fund Shares | | | | | | | — | | | | — | | | | 3.34 | | | | 6.58 | | | | 1.54 | |
| | | | | | |
| % Total Annual Operating Expense Ratio3 | | | | | | | | | | | | | | | | | Institutional
Class | |
| | | | | | |
| | | | | | | | | | | | | | | | | | | | | | | 0.96 | % |
See Endnotes and Additional Disclosures in this report.
Past performance is no guarantee of future results. Returns are historical and are calculated by determining the percentage change in net asset value (NAV) or offering price (as applicable) with all distributions reinvested. Investment return and principal value will fluctuate so that shares, when redeemed, may be worth more or less than their original cost. Performance for periods less than or equal to one year is cumulative. Performance is for the stated time period only; due to market volatility, current Fund performance may be lower or higher than the quoted return. For performance as of the most recent month-end, please refer to eatonvance.com.
Parametric
Tax-Managed Emerging Markets Fund
December 31, 2020
Fund Profile
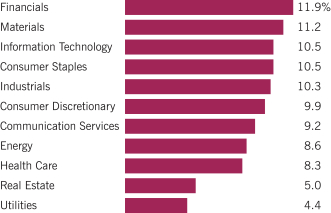
Sector Allocation (% of net assets)4
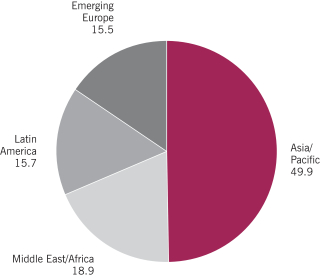
Geographic Allocation (% of common stocks)
Top 10 Holdings (% of net assets)4
| | | | |
Tencent Holdings, Ltd. | | | 1.2 | % |
| |
Samsung Electronics Co., Ltd. | | | 1.0 | |
| |
Delta Electronics (Thailand) PCL | | | 1.0 | |
| |
Taiwan Semiconductor Manufacturing Co., Ltd. | | | 0.9 | |
| |
Naspers, Ltd., Class N | | | 0.7 | |
| |
America Movil SAB de CV, Series L | | | 0.7 | |
| |
Alibaba Group Holding, Ltd. ADR | | | 0.6 | |
| |
Xiaomi Corp., Class B | | | 0.6 | |
| |
MercadoLibre, Inc. | | | 0.6 | |
| |
Yandex NV, Class A | | | 0.5 | |
| |
Total | | | 7.8 | % |
See Endnotes and Additional Disclosures in this report.
Parametric
Tax-Managed Emerging Markets Fund
December 31, 2020
Endnotes and Additional Disclosures
| 1 | MSCI Emerging Markets Index is an unmanaged index of emerging markets common stocks. MSCI indexes are net of foreign withholding taxes. Source: MSCI. MSCI data may not be reproduced or used for any other purpose. MSCI provides no warranties, has not prepared or approved this report, and has no liability hereunder. Unless otherwise stated, index returns do not reflect the effect of any applicable sales charges, commissions, expenses, taxes or leverage, as applicable. It is not possible to invest directly in an index. |
| 2 | Institutional Class shares are offered at net asset value (NAV). Prior to September 1, 2016, Institutional Class shares were subject to a 2% redemption fee at the time of exchange or redemption. Returns are historical and are calculated by determining the percentage change in NAV with all distributions reinvested. Unless otherwise stated, performance does not reflect the deduction of taxes on Fund distributions or redemptions of Fund shares. After-tax returns are calculated using certain assumptions, including using the highest historical individual federal income tax rates, and do not reflect the impact of state/local taxes. Actual after-tax returns depend on a shareholder’s tax situation and the actual characterization of distributions and may differ from those shown. After-tax returns are not relevant to shareholders who hold shares in tax-deferred accounts or shares held by nontaxable entities. Return After Taxes on Distributions may be the same as Return Before Taxes for the same period because no taxable distributions were made during that period. Return After Taxes on Distributions and Sale of Fund Shares may be greater than or equal to Return After Taxes on Distributions for the same period because of losses realized on the sale of Fund shares. The Fund’s after-tax returns also may reflect foreign tax credits passed by the Fund to its shareholders. |
| 3 | Source: Fund prospectus. The expense ratios for the current reporting period can be found in the Financial Highlights section of this report. |
| 4 | Excludes cash and cash equivalents. |
Fund profile subject to change due to active management.
Parametric
Tax-Managed Emerging Markets Fund
December 31, 2020
Fund Expenses
Example: As a Fund shareholder, you incur two types of costs: (1) transaction costs, including sales charges (loads) on purchases and redemption fees (if applicable); and (2) ongoing costs, including management fees; distribution and/or service fees; and other Fund expenses. This Example is intended to help you understand your ongoing costs (in dollars) of Fund investing and to compare these costs with the ongoing costs of investing in other mutual funds. The Example is based on an investment of $1,000 invested at the beginning of the period and held for the entire period (July 1, 2020 – December 31, 2020).
Actual Expenses: The first section of the table below provides information about actual account values and actual expenses. You may use the information in this section, together with the amount you invested, to estimate the expenses that you paid over the period. Simply divide your account value by $1,000 (for example, an $8,600 account value divided by $1,000 = 8.6), then multiply the result by the number in the first section under the heading entitled “Expenses Paid During Period” to estimate the expenses you paid on your account during this period.
Hypothetical Example for Comparison Purposes: The second section of the table below provides information about hypothetical account values and hypothetical expenses based on the actual Fund expense ratio and an assumed rate of return of 5% per year (before expenses), which is not the actual Fund return. The hypothetical account values and expenses may not be used to estimate the actual ending account balance or expenses you paid for the period. You may use this information to compare the ongoing costs of investing in your Fund and other funds. To do so, compare this 5% hypothetical example with the 5% hypothetical examples that appear in the shareholder reports of the other funds.
Please note that the expenses shown in the table are meant to highlight your ongoing costs only and do not reflect any transactional costs, such as sales charges (loads) or redemption fees (if applicable). Therefore, the second section of the table is useful in comparing ongoing costs only, and will not help you determine the relative total costs of owning different funds. In addition, if these transactional costs were included, your costs would be higher.
| | | | | | | | | | | | | | | | |
| | | Beginning
Account Value
(7/1/20) | | | Ending
Account Value
(12/31/20) | | | Expenses Paid
During Period*
(7/1/20 – 12/31/20) | | | Annualized
Expense
Ratio | |
| | | |
Actual | | | | | | | | | | | | | |
Institutional Class | | $ | 1,000.00 | | | $ | 1,258.90 | | | $ | 5.47 | | | | 0.96 | % |
| | | | |
Hypothetical | | | | | | | | | | | | | |
(5% return per year before expenses) | | | | | | | | | | | | | |
Institutional Class | | $ | 1,000.00 | | | $ | 1,020.40 | | | $ | 4.89 | | | | 0.96 | % |
| * | Expenses are equal to the Fund’s annualized expense ratio for the indicated Class, multiplied by the average account value over the period, multiplied by 184/365 (to reflect the one-half year period). The Example assumes that the $1,000 was invested at the net asset value per share determined at the close of business on June 30, 2020. |
Parametric
Tax-Managed Emerging Markets Fund
December 31, 2020
Portfolio of Investments (Unaudited)
| | | | | | | | |
| Common Stocks — 99.8% | |
| Security | | Shares | | | Value | |
|
| Argentina — 0.8% | |
| | |
Banco BBVA Argentina S.A.(1) | | | 76,594 | | | $ | 82,052 | |
| | |
Banco Macro S.A., Class B(1) | | | 130,676 | | | | 209,128 | |
| | |
IRSA Inversiones y Representaciones S.A.(1) | | | 119,544 | | | | 54,123 | |
| | |
IRSA Propiedades Comerciales S.A. | | | 2,120 | | | | 4,863 | |
| | |
Ledesma SAAI(1) | | | 259,501 | | | | 54,242 | |
| | |
MercadoLibre, Inc.(1) | | | 3,131 | | | | 5,245,114 | |
| | |
Molinos Agro S.A. | | | 18,283 | | | | 85,754 | |
| | |
Molinos Rio de la Plata S.A., Class B(1) | | | 75,026 | | | | 45,915 | |
| | |
Pampa Energia S.A. ADR(1)(2) | | | 10,175 | | | | 140,211 | |
| | |
Ternium Argentina S.A.(1) | | | 2,005,200 | | | | 648,856 | |
| | |
Transportadora de Gas del Sur S.A.(1) | | | 262,657 | | | | 281,831 | |
| | |
| | | | | | | $ | 6,852,089 | |
|
| Bahrain — 0.8% | |
| | |
Ahli United Bank BSC | | | 5,761,255 | | | $ | 4,310,108 | |
| | |
Al Salam Bank-Bahrain BSC | | | 6,187,186 | | | | 1,198,363 | |
| | |
GFH Financial Group BSC | | | 1,581,727 | | | | 262,848 | |
| | |
Ithmaar Holding BSC(1) | | | 21,954,746 | | | | 1,514,320 | |
| | |
| | | | | | | $ | 7,285,639 | |
|
| Bangladesh — 0.6% | |
| | |
Al-Arafah Islami Bank, Ltd. | | | 329,780 | | | $ | 86,054 | |
| | |
Bangladesh Export Import Co., Ltd. | | | 972,613 | | | | 655,849 | |
| | |
Beximco Pharmaceuticals, Ltd. | | | 79,073 | | | | 177,879 | |
| | |
British American Tobacco Bangladesh Co., Ltd. | | | 22,713 | | | | 316,559 | |
| | |
Grameenphone, Ltd. | | | 129,381 | | | | 530,228 | |
| | |
Heidelberger Cement Bangladesh, Ltd.(1) | | | 32,500 | | | | 57,151 | |
| | |
Islami Bank Bangladesh, Ltd. | | | 194,041 | | | | 61,330 | |
| | |
Jamuna Oil Co., Ltd. | | | 73,522 | | | | 144,080 | |
| | |
Khulna Power Co., Ltd. | | | 231,595 | | | | 123,845 | |
| | |
LafargeHolcim Bangladesh, Ltd. | | | 194,809 | | | | 109,851 | |
| | |
LankaBangla Finance, Ltd. | | | 859,779 | | | | 317,602 | |
| | |
Meghna Petroleum, Ltd. | | | 59,059 | | | | 138,042 | |
| | |
Olympic Industries, Ltd. | | | 99,202 | | | | 223,936 | |
| | |
Padma Oil Co., Ltd.(1) | | | 75,914 | | | | 183,553 | |
| | |
Pubali Bank, Ltd. | | | 1,761,286 | | | | 510,740 | |
| | |
Social Islami Bank, Ltd. | | | 1,264,818 | | | | 194,082 | |
| | |
Southeast Bank, Ltd. | | | 60,387 | | | | 8,904 | |
| | |
Square Pharmaceuticals, Ltd. | | | 292,370 | | | | 756,886 | |
| | |
Summit Power, Ltd. | | | 597,049 | | | | 279,114 | |
| | |
Titas Gas Transmission & Distribution Co., Ltd. | | | 302,869 | | | | 110,204 | |
| | |
Unique Hotel & Resorts, Ltd. | | | 394,668 | | | | 184,824 | |
| | |
United Commercial Bank, Ltd. | | | 1,467,687 | | | | 247,224 | |
| | |
| | | | | | | $ | 5,417,937 | |
| | | | | | | | |
| Security | | Shares | | | Value | |
|
| Botswana — 0.6% | |
| | |
Absa Bank Botswana, Ltd. | | | 773,249 | | | $ | 363,984 | |
| | |
Botswana Insurance Holdings, Ltd. | | | 560,747 | | | | 907,709 | |
| | |
First National Bank of Botswana, Ltd. | | | 5,711,600 | | | | 1,157,773 | |
| | |
Letshego Holdings, Ltd. | | | 4,193,706 | | | | 279,695 | |
| | |
Sechaba Breweries Holdings, Ltd. | | | 1,086,400 | | | | 2,075,160 | |
| | |
| | | | | | | $ | 4,784,321 | |
|
| Brazil — 4.8% | |
| | |
Aliansce Sonae Shopping Centers S.A.(1) | | | 29,996 | | | $ | 169,164 | |
| | |
AMBEV S.A. | | | 307,425 | | | | 929,387 | |
| | |
Atacadao S.A. | | | 41,200 | | | | 153,623 | |
| | |
B2W Cia Digital(1) | | | 32,528 | | | | 473,692 | |
| | |
B3 S.A. - Brasil Bolsa Balcao | | | 56,285 | | | | 673,888 | |
| | |
Banco Bradesco S.A., PFC Shares | | | 162,083 | | | | 852,495 | |
| | |
Banco do Brasil S.A. | | | 56,600 | | | | 425,501 | |
| | |
BR Malls Participacoes S.A.(1) | | | 79,954 | | | | 152,965 | |
| | |
Braskem S.A., PFC Shares | | | 39,300 | | | | 179,104 | |
| | |
BRF S.A.(1) | | | 48,966 | | | | 208,368 | |
| | |
CCR S.A. | | | 160,000 | | | | 416,240 | |
| | |
Centrais Eletricas Brasileiras S.A., PFC Shares | | | 65,766 | | | | 471,941 | |
| | |
Cia Brasileira de Distribuicao | | | 17,556 | | | | 253,836 | |
| | |
Cia de Saneamento Basico do Estado de Sao Paulo ADR | | | 48,898 | | | | 420,034 | |
| | |
Cia de Transmissao de Energia Eletrica Paulista, PFC Shares | | | 54,852 | | | | 294,289 | |
| | |
Cielo S.A. | | | 523,500 | | | | 404,563 | |
| | |
Cosan S.A. | | | 18,884 | | | | 275,802 | |
| | |
Cyrela Brazil Realty S.A. Empreendimentos e Participacoes | | | 64,624 | | | | 368,538 | |
| | |
EDP-Energias do Brasil S.A. | | | 91,800 | | | | 349,100 | |
| | |
Embraer S.A. ADR(1)(2) | | | 3,652 | | | | 24,870 | |
| | |
Engie Brasil Energia S.A. | | | 30,425 | | | | 258,446 | |
| | |
Equatorial Energia S.A. | | | 54,600 | | | | 244,632 | |
| | |
Ez Tec Empreendimentos e Participacoes S.A. | | | 37,357 | | | | 310,325 | |
| | |
Fleury S.A. | | | 70,600 | | | | 368,413 | |
| | |
Gol Linhas Aereas Inteligentes S.A., PFC Shares(1) | | | 103,400 | | | | 496,139 | |
| | |
Hapvida Participacoes e Investimentos S.A.(3) | | | 290,500 | | | | 857,049 | |
| | |
Hypera S.A. | | | 162,000 | | | | 1,071,358 | |
| | |
Iguatemi Empresa de Shopping Centers S.A. | | | 12,000 | | | | 86,170 | |
| | |
Instituto Hermes Pardini S.A. | | | 81,900 | | | | 357,417 | |
| | |
Itau Unibanco Holding S.A., PFC Shares | | | 100,193 | | | | 613,191 | |
| | |
Itausa S.A., PFC Shares | | | 110,154 | | | | 249,975 | |
| | |
JBS S.A. | | | 96,402 | | | | 439,369 | |
| | |
Klabin S.A., PFC Shares | | | 498,200 | | | | 498,846 | |
| | |
Linx S.A. | | | 60,800 | | | | 440,277 | |
| | |
Localiza Rent a Car S.A. | | | 65,232 | | | | 869,371 | |
| | |
Lojas Americanas S.A., PFC Shares | | | 142,784 | | | | 722,742 | |
| | | | |
| | 6 | | See Notes to Financial Statements. |
Parametric
Tax-Managed Emerging Markets Fund
December 31, 2020
Portfolio of Investments (Unaudited) — continued
| | | | | | | | |
| Security | | Shares | | | Value | |
|
| Brazil (continued) | |
| | |
Lojas Renner S.A. | | | 82,050 | | | $ | 689,918 | |
| | |
Magazine Luiza S.A. | | | 225,872 | | | | 1,083,093 | |
| | |
MRV Engenharia e Participacoes S.A. | | | 75,500 | | | | 276,464 | |
| | |
Multiplan Empreendimentos Imobiliarios S.A. | | | 44,500 | | | | 202,311 | |
| | |
Natura & Co. Holding S.A.(1) | | | 58,700 | | | | 595,902 | |
| | |
Notre Dame Intermedica Participacoes S.A. | | | 183,700 | | | | 2,784,640 | |
| | |
Odontoprev S.A. | | | 109,000 | | | | 305,725 | |
| | |
Pagseguro Digital, Ltd., Class A(1) | | | 72,200 | | | | 4,106,736 | |
| | |
Petroleo Brasileiro S.A., PFC Shares | | | 764,791 | | | | 4,151,943 | |
| | |
Raia Drogasil S.A. | | | 89,500 | | | | 430,233 | |
| | |
Rumo S.A.(1) | | | 174,299 | | | | 644,619 | |
| | |
StoneCo, Ltd., Class A(1) | | | 49,200 | | | | 4,128,864 | |
| | |
Suzano S.A.(1) | | | 31,841 | | | | 357,577 | |
| | |
Telefonica Brasil S.A. | | | 74,605 | | | | 670,766 | |
| | |
TIM S.A. | | | 266,675 | | | | 755,720 | |
| | |
Totvs S.A. | | | 206,500 | | | | 1,144,066 | |
| | |
Transmissora Alianca de Energia Electrica S.A. | | | 73,176 | | | | 470,617 | |
| | |
Ultrapar Participacoes S.A. | | | 73,348 | | | | 335,775 | |
| | |
Vale S.A. | | | 127,518 | | | | 2,146,286 | |
| | |
Weg S.A. | | | 96,014 | | | | 1,402,268 | |
| | |
| | | | | | | $ | 42,064,643 | |
|
| Bulgaria — 0.2% | |
| | |
Bulgartabak Holding(1) | | | 3,450 | | | $ | 9,805 | |
| | |
CB First Investment Bank AD(1) | | | 54,000 | | | | 62,079 | |
| | |
Chimimport AD(1) | | | 697,285 | | | | 409,649 | |
| | |
Industrial Holding Bulgaria PLC(1) | | | 576,865 | | | | 285,585 | |
| | |
Petrol AD(1) | | | 19,052 | | | | 3,665 | |
| | |
Sopharma AD | | | 303,500 | | | | 606,376 | |
| | |
| | | | | | | $ | 1,377,159 | |
|
| Chile — 2.5% | |
| | |
Banco de Chile | | | 12,373,880 | | | $ | 1,262,976 | |
| | |
Banco de Credito e Inversiones S.A. | | | 12,617 | | | | 495,771 | |
| | |
Banco Santander Chile ADR | | | 43,749 | | | | 830,794 | |
| | |
Besalco S.A. | | | 309,151 | | | | 158,676 | |
| | |
CAP S.A. | | | 25,648 | | | | 344,849 | |
| | |
Cencosud S.A. | | | 381,660 | | | | 680,067 | |
| | |
Cencosud Shopping S.A. | | | 328,092 | | | | 526,726 | |
| | |
Cia Cervecerias Unidas S.A. ADR | | | 59,200 | | | | 870,240 | |
| | |
Cia Sud Americana de Vapores S.A.(1) | | | 27,760,187 | | | | 1,120,685 | |
| | |
Colbun S.A. | | | 2,705,331 | | | | 477,721 | |
| | |
Embotelladora Andina S.A., Series B ADR | | | 34,372 | | | | 513,641 | |
| | |
Empresa Nacional de Telecomunicaciones S.A. | | | 61,526 | | | | 382,250 | |
| | |
Empresas CMPC S.A. | | | 387,590 | | | | 1,020,556 | |
| | | | | | | | |
| Security | | Shares | | | Value | |
|
| Chile (continued) | |
| | |
Empresas COPEC S.A. | | | 284,657 | | | $ | 2,883,317 | |
| | |
Enel Americas S.A. | | | 4,048,040 | | | | 660,098 | |
| | |
Enel Americas S.A. ADR(2) | | | 37,771 | | | | 310,478 | |
| | |
Enel Chile S.A. | | | 2,225,685 | | | | 173,250 | |
| | |
Enel Chile S.A. ADR | | | 116,106 | | | | 451,652 | |
| | |
Engie Energia Chile S.A. | | | 272,651 | | | | 333,878 | |
| | |
Falabella S.A. | | | 657,442 | | | | 2,433,877 | |
| | |
Inversiones Aguas Metropolitanas S.A. | | | 204,719 | | | | 169,852 | |
| | |
Parque Arauco S.A. | | | 795,081 | | | | 1,304,001 | |
| | |
Plaza S.A. | | | 195,358 | | | | 307,238 | |
| | |
Quinenco S.A. | | | 108,178 | | | | 190,130 | |
| | |
Ripley Corp. S.A. | | | 711,208 | | | | 221,332 | |
| | |
Salfacorp S.A. | | | 244,063 | | | | 140,140 | |
| | |
Sociedad Matriz SAAM S.A. | | | 4,132,200 | | | | 326,494 | |
| | |
Sociedad Quimica y Minera de Chile S.A. ADR | | | 37,400 | | | | 1,835,966 | |
| | |
Sonda S.A. | | | 466,435 | | | | 286,069 | |
| | |
Vina Concha y Toro S.A. | | | 351,578 | | | | 610,547 | |
| | |
| | | | | | | $ | 21,323,271 | |
|
| China — 19.5% | |
| | |
21Vianet Group, Inc. ADR(1) | | | 8,500 | | | $ | 294,865 | |
| | |
3SBio, Inc.(1)(3) | | | 527,000 | | | | 481,105 | |
| | |
AAC Technologies Holdings, Inc.(2) | | | 86,000 | | | | 476,689 | |
| | |
AECC Aviation Power Co., Ltd. | | | 66,500 | | | | 604,439 | |
| | |
Agile Group Holdings, Ltd. | | | 178,000 | | | | 236,921 | |
| | |
Air China, Ltd., Class H | | | 466,000 | | | | 367,377 | |
| | |
Aisino Corp. | | | 73,800 | | | | 142,265 | |
| | |
Alibaba Group Holding, Ltd. ADR(1) | | | 24,100 | | | | 5,608,793 | |
| | |
Aluminum Corp. of China, Ltd., Class H(1) | | | 1,578,000 | | | | 555,551 | |
| | |
Anhui Conch Cement Co., Ltd., Class H | | | 318,000 | | | | 1,992,926 | |
| | |
ANTA Sports Products, Ltd. | | | 69,143 | | | | 1,097,099 | |
| | |
AVIC Xi’an Aircraft Industry Group Co., Ltd., Class A | | | 162,200 | | | | 910,969 | |
| | |
Baidu, Inc. ADR(1) | | | 7,900 | | | | 1,708,296 | |
| | |
Bank of Beijing Co., Ltd. | | | 395,520 | | | | 292,835 | |
| | |
Bank of China, Ltd., Class H | | | 927,275 | | | | 313,839 | |
| | |
Bank of Ningbo Co., Ltd., Class A | | | 42,571 | | | | 230,155 | |
| | |
BBMG Corp., Class H | | | 1,283,000 | | | | 248,422 | |
| | |
BeiGene, Ltd. ADR(1) | | | 4,425 | | | | 1,143,376 | |
| | |
Beijing Capital International Airport Co., Ltd., Class H | | | 596,000 | | | | 497,454 | |
| | |
Beijing Enterprises Holdings, Ltd. | | | 95,500 | | | | 311,879 | |
| | |
Beijing Oriental Yuhong Waterproof Technology Co., Ltd., Class A | | | 123,928 | | | | 735,751 | |
| | |
Beijing Originwater Technology Co., Ltd., Class A | | | 171,376 | | | | 200,734 | |
| | |
Beijing Sanju Environmental Protection and New Material Co., Ltd., Class A | | | 459,880 | | | | 399,842 | |
| | |
Beijing Tongrentang Co., Ltd. | | | 47,000 | | | | 171,915 | |
| | | | |
| | 7 | | See Notes to Financial Statements. |
Parametric
Tax-Managed Emerging Markets Fund
December 31, 2020
Portfolio of Investments (Unaudited) — continued
| | | | | | | | |
| Security | | Shares | | | Value | |
|
| China (continued) | |
| | |
BOE Technology Group Co., Ltd., Class A | | | 911,100 | | | $ | 837,506 | |
| | |
BYD Co., Ltd., Class H(2) | | | 13,672 | | | | 359,960 | |
| | |
BYD Electronic (International) Co., Ltd.(2) | | | 92,500 | | | | 485,282 | |
| | |
CGN Power Co., Ltd., Class H(3) | | | 1,844,000 | | | | 397,654 | |
| | |
Changchun High & New Technology Industry Group, Inc., Class A | | | 11,600 | | | | 796,345 | |
| | |
Chaozhou Three-Circle Group Co., Ltd., Class A | | | 49,900 | | | | 284,682 | |
| | |
China Aoyuan Group, Ltd. | | | 236,000 | | | | 229,624 | |
| | |
China Bluechemical, Ltd., Class H | | | 674,000 | | | | 107,062 | |
| | |
China Communications Services Corp., Ltd., Class H | | | 560,000 | | | | 247,387 | |
| | |
China Conch Venture Holdings, Ltd. | | | 173,000 | | | | 841,829 | |
| | |
China Construction Bank Corp., Class H | | | 2,509,745 | | | | 1,893,048 | |
| | |
China Dongxiang Group Co., Ltd. | | | 878,000 | | | | 91,865 | |
| | |
China Eastern Airlines Corp., Ltd., Class H | | | 1,436,000 | | | | 622,341 | |
| | |
China Everbright Environment Group, Ltd. | | | 875,148 | | | | 494,349 | |
| | |
China Evergrande Group | | | 378,000 | | | | 726,542 | |
| | |
China Fortune Land Development Co., Ltd. | | | 68,120 | | | | 134,746 | |
| | |
China Gas Holdings, Ltd. | | | 517,200 | | | | 2,049,508 | |
| | |
China International Marine Containers Co., Ltd. | | | 496,574 | | | | 723,116 | |
| | |
China Jinmao Holdings Group, Ltd. | | | 422,000 | | | | 194,378 | |
| | |
China Life Insurance Co., Ltd., Class H | | | 146,000 | | | | 321,416 | |
| | |
China Longyuan Power Group Corp., Ltd., Class H | | | 678,000 | | | | 681,730 | |
| | |
China Mengniu Dairy Co., Ltd. | | | 294,000 | | | | 1,772,569 | |
| | |
China Merchants Bank Co., Ltd., Class H | | | 96,500 | | | | 610,463 | |
| | |
China Merchants Port Holdings Co., Ltd. | | | 424,000 | | | | 519,005 | |
| | |
China Merchants Shekou Industrial Zone Holdings Co., Ltd.(4) | | | 935,251 | | | | 0 | |
| | |
China Minsheng Banking Corp., Ltd., Class H | | | 359,420 | | | | 204,887 | |
| | |
China Mobile, Ltd. | | | 139,920 | | | | 797,607 | |
| | |
China Modern Dairy Holdings, Ltd.(1)(2) | | | 1,762,000 | | | | 422,447 | |
| | |
China Molybdenum Co., Ltd., Class H | | | 1,020,000 | | | | 667,383 | |
| | |
China National Building Material Co., Ltd., Class H | | | 872,000 | | | | 1,049,618 | |
| | |
China National Nuclear Power Co., Ltd. | | | 227,000 | | | | 170,835 | |
| | |
China Northern Rare Earth Group High-Tech Co., Ltd.(1) | | | 185,300 | | | | 371,460 | |
| | |
China Oilfield Services, Ltd., Class H | | | 1,274,000 | | | | 1,079,893 | |
| | |
China Overseas Land & Investment, Ltd. | | | 355,860 | | | | 773,104 | |
| | |
China Pacific Insurance (Group) Co., Ltd., Class H | | | 74,600 | | | | 291,684 | |
| | |
China Petroleum & Chemical Corp., Class H | | | 5,166,200 | | | | 2,300,715 | |
| | |
China Railway Construction Corp., Ltd., Class H | | | 442,500 | | | | 242,498 | |
| | |
China Railway Group, Ltd., Class H | | | 1,372,000 | | | | 605,471 | |
| | |
China Resources Beer Holdings Co., Ltd. | | | 214,000 | | | | 1,967,903 | |
| | |
China Resources Cement Holdings, Ltd. | | | 712,000 | | | | 795,257 | |
| | |
China Resources Gas Group, Ltd. | | | 198,000 | | | | 1,052,457 | |
| | |
China Resources Land, Ltd. | | | 307,111 | | | | 1,265,570 | |
| | |
China Resources Pharmaceutical Group, Ltd.(3) | | | 278,000 | | | | 142,952 | |
| | |
China Shenhua Energy Co., Ltd., Class H | | | 371,074 | | | | 699,469 | |
| | | | | | | | |
| Security | | Shares | | | Value | |
|
| China (continued) | |
| | |
China Shipbuilding Industry Co., Ltd.(1) | | | 375,300 | | | $ | 240,404 | |
| | |
China Southern Airlines Co., Ltd., Class H(1)(2) | | | 846,500 | | | | 505,968 | |
| | |
China State Construction Engineering Corp., Ltd. | | | 331,520 | | | | 252,098 | |
| | |
China Tourism Group Duty Free Corp., Ltd. | | | 11,076 | | | | 479,398 | |
| | |
China United Network Communications, Ltd., Class A | | | 421,766 | | | | 287,927 | |
| | |
China Vanke Co., Ltd., Class H | | | 293,517 | | | | 1,013,282 | |
| | |
China Yangtze Power Co., Ltd. | | | 236,900 | | | | 693,927 | |
| | |
Chinasoft International, Ltd. | | | 294,000 | | | | 328,578 | |
| | |
CIFI Holdings Group Co., Ltd. | | | 514,000 | | | | 435,568 | |
| | |
CITIC Guoan Information Industry Co., Ltd., Class A(1) | | | 585,250 | | | | 211,486 | |
| | |
CNOOC, Ltd. | | | 1,737,316 | | | | 1,593,851 | |
| | |
COSCO SHIPPING Energy Transportation Co., Ltd., Class H | | | 1,068,000 | | | | 420,349 | |
| | |
COSCO SHIPPING Holdings Co., Ltd., Class H(1) | | | 597,150 | | | | 715,914 | |
| | |
Country Garden Holdings Co., Ltd. | | | 859,000 | | | | 1,185,655 | |
| | |
Country Garden Services Holdings Co., Ltd. | | | 153,425 | | | | 1,038,006 | |
| | |
CSPC Pharmaceutical Group, Ltd. | | | 1,538,560 | | | | 1,566,469 | |
| | |
Daqin Railway Co., Ltd. | | | 370,862 | | | | 366,444 | |
| | |
Daqo New Energy Corp. ADR(1) | | | 9,500 | | | | 544,920 | |
| | |
Dawning Information Industry Co., Ltd., Class A | | | 30,316 | | | | 158,880 | |
| | |
Digital China Holdings, Ltd.(2) | | | 225,000 | | | | 184,789 | |
| | |
Dong-E-E-Jiao Co., Ltd., Class A | | | 25,300 | | | | 149,760 | |
| | |
Dongfeng Motor Group Co., Ltd., Class H | | | 586,000 | | | | 684,759 | |
| | |
East Money Information Co., Ltd., Class A | | | 55,145 | | | | 261,283 | |
| | |
Financial Street Holdings Co., Ltd., Class A | | | 173,966 | | | | 171,629 | |
| | |
Ganfeng Lithium Co., Ltd., Class A | | | 31,100 | | | | 481,973 | |
| | |
GD Power Development Co., Ltd. | | | 566,200 | | | | 194,962 | |
| | |
GDS Holdings, Ltd. ADR(1) | | | 8,900 | | | | 833,396 | |
| | |
GEM Co., Ltd., Class A | | | 217,400 | | | | 232,588 | |
| | |
Gemdale Corp. | | | 128,201 | | | | 264,529 | |
| | |
GoerTek, Inc., Class A | | | 251,200 | | | | 1,435,607 | |
| | |
Golden Eagle Retail Group, Ltd. | | | 203,000 | | | | 184,423 | |
| | |
Gotion High-tech Co., Ltd., Class A(1) | | | 63,830 | | | | 382,659 | |
| | |
Great Wall Motor Co., Ltd., Class H | | | 561,759 | | | | 1,932,782 | |
| | |
Gree Electric Appliances, Inc. of Zhuhai, Class A | | | 94,600 | | | | 896,663 | |
| | |
Guangdong Baolihua New Energy Stock Co., Ltd., Class A | | | 257,300 | | | | 287,345 | |
| | |
Guangdong Investment, Ltd. | | | 646,829 | | | | 1,166,030 | |
| | |
Guanghui Energy Co., Ltd.(1) | | | 682,345 | | | | 295,625 | |
| | |
Guangzhou Automobile Group Co., Ltd., Class H | | | 709,199 | | | | 790,943 | |
| | |
Guangzhou Baiyunshan Pharmaceutical Holdings Co., Ltd., Class H | | | 210,000 | | | | 513,801 | |
| | |
Guosen Securities Co., Ltd., Class A | | | 94,600 | | | | 197,287 | |
| | |
Haier Smart Home Co., Ltd. | | | 135,829 | | | | 608,117 | |
| | |
Han’s Laser Technology Industry Group Co., Ltd., Class A | | | 46,800 | | | | 306,410 | |
| | |
Hangzhou Hikvision Digital Technology Co., Ltd., Class A | | | 102,900 | | | | 763,649 | |
| | |
Hansoh Pharmaceutical Group Co., Ltd.(1)(3) | | | 56,000 | | | | 271,390 | |
| | |
Hengan International Group Co., Ltd. | | | 144,000 | | | | 1,019,605 | |
| | | | |
| | 8 | | See Notes to Financial Statements. |
Parametric
Tax-Managed Emerging Markets Fund
December 31, 2020
Portfolio of Investments (Unaudited) — continued
| | | | | | | | |
| Security | | Shares | | | Value | |
|
| China (continued) | |
| | |
Hengtong Optic-electric Co., Ltd. | | | 98,560 | | | $ | 211,118 | |
| | |
Hesteel Co., Ltd., Class A(1) | | | 1,141,600 | | | | 391,442 | |
| | |
Hua Hong Semiconductor, Ltd.(1)(2)(3) | | | 58,000 | | | | 330,204 | |
| | |
Huadong Medicine Co., Ltd., Class A | | | 53,160 | | | | 215,974 | |
| | |
Hualan Biological Engineering, Inc., Class A | | | 59,670 | | | | 385,788 | |
| | |
Huaneng Power International, Inc., Class H | | | 1,338,000 | | | | 488,413 | |
| | |
Huayu Automotive Systems Co., Ltd. | | | 82,100 | | | | 362,547 | |
| | |
Hubei Energy Group Co., Ltd., Class A | | | 272,100 | | | | 161,449 | |
| | |
Huishan Dairy(2)(4) | | | 1,750,000 | | | | 0 | |
| | |
Hundsun Technologies, Inc. | | | 37,433 | | | | 601,085 | |
| | |
Iflytek Co., Ltd., Class A | | | 37,950 | | | | 237,427 | |
| | |
Industrial & Commercial Bank of China, Ltd., Class H | | | 2,308,000 | | | | 1,482,865 | |
| | |
Industrial Bank Co., Ltd. | | | 93,482 | | | | 298,561 | |
| | |
Inner Mongolia BaoTou Steel Union Co., Ltd.(1) | | | 737,800 | | | | 132,098 | |
| | |
Inner Mongolia Yili Industrial Group Co., Ltd., Class A | | | 34,300 | | | | 232,759 | |
| | |
Innovent Biologics, Inc.(1)(3) | | | 122,000 | | | | 1,288,333 | |
| | |
JD.com, Inc. ADR(1) | | | 16,000 | | | | 1,406,400 | |
| | |
Jiangsu Expressway Co., Ltd., Class H | | | 480,000 | | | | 536,879 | |
| | |
Jiangsu Hengrui Medicine Co., Ltd. | | | 72,310 | | | | 1,231,971 | |
| | |
Jiangsu Yanghe Brewery Joint-Stock Co., Ltd., Class A | | | 15,400 | | | | 556,076 | |
| | |
Jiangsu Yuyue Medical Equipment & Supply Co., Ltd., Class A | | | 81,550 | | | | 351,891 | |
| | |
Jiangxi Copper Co., Ltd., Class H | | | 255,000 | | | | 401,402 | |
| | |
Jinke Properties Group Co., Ltd., Class A | | | 244,151 | | | | 264,634 | |
| | |
Jinyu Bio-Technology Co., Ltd. | | | 73,710 | | | | 235,392 | |
| | |
Jizhong Energy Resources Co., Ltd., Class A | | | 283,400 | | | | 180,510 | |
| | |
Jonjee Hi-Tech Industrial & Commercial Holding Co., Ltd. | | | 41,300 | | | | 420,912 | |
| | |
Kangde Xin Composite Material Group Co., Ltd., Class A(1)(4) | | | 56,492 | | | | 0 | |
| | |
Kingboard Holdings., Ltd. | | | 71,200 | | | | 300,407 | |
| | |
Kingboard Laminates Holdings, Ltd. | | | 180,500 | | | | 294,921 | |
| | |
Kingdee International Software Group Co., Ltd. | | | 296,000 | | | | 1,208,437 | |
| | |
Kingsoft Corp, Ltd. | | | 98,000 | | | | 633,643 | |
| | |
Kunlun Energy Co., Ltd. | | | 330,000 | | | | 286,006 | |
| | |
Kweichow Moutai Co., Ltd. | | | 9,410 | | | | 2,875,682 | |
| | |
KWG Group Holdings, Ltd. | | | 165,500 | | | | 226,119 | |
| | |
KWG Living Group Holdings, Ltd.(1) | | | 82,750 | | | | 67,246 | |
| | |
Lee & Man Paper Manufacturing, Ltd. | | | 876,000 | | | | 718,809 | |
| | |
Lenovo Group, Ltd. | | | 632,000 | | | | 597,487 | |
| | |
Lepu Medical Technology Beijing Co., Ltd., Class A | | | 69,200 | | | | 287,636 | |
| | |
Li Ning Co., Ltd. | | | 70,312 | | | | 483,828 | |
| | |
Logan Group Co., Ltd. | | | 232,000 | | | | 380,057 | |
| | |
Longfor Group Holdings, Ltd.(3) | | | 161,000 | | | | 941,765 | |
| | |
LONGi Green Energy Technology Co., Ltd. | | | 123,033 | | | | 1,737,098 | |
| | |
Lonking Holdings, Ltd. | | | 1,300,000 | | | | 402,283 | |
| | |
Luxshare Precision Industry Co., Ltd., Class A | | | 205,651 | | | | 1,767,427 | |
| | | | | | | | |
| Security | | Shares | | | Value | |
|
| China (continued) | |
| | |
Luye Pharma Group, Ltd.(2)(3) | | | 1,117,000 | | | $ | 519,592 | |
| | |
Luzhou Laojiao Co., Ltd., Class A | | | 31,300 | | | | 1,082,896 | |
| | |
Maanshan Iron & Steel Co., Ltd., Class H | | | 2,099,000 | | | | 579,939 | |
| | |
MMG, Ltd.(1) | | | 2,016,000 | | | | 877,758 | |
| | |
NARI Technology Co., Ltd. | | | 85,600 | | | | 348,409 | |
| | |
NetEase, Inc. ADR | | | 11,000 | | | | 1,053,470 | |
| | |
New Oriental Education & Technology Group, Inc. ADR(1) | | | 6,105 | | | | 1,134,370 | |
| | |
Nine Dragons Paper Holdings, Ltd. | | | 473,000 | | | | 672,392 | |
| | |
Oceanwide Holdings Co., Ltd., Class A | | | 270,200 | | | | 135,542 | |
| | |
OneConnect Financial Technology Co., Ltd. ADR(1) | | | 7,900 | | | | 155,709 | |
| | |
Oriental Pearl Group Co., Ltd., Class A | | | 171,295 | | | | 234,418 | |
| | |
Ourpalm Co., Ltd., Class A(1) | | | 213,800 | | | | 167,166 | |
| | |
Perfect World Co. Ltd., Class A | | | 54,600 | | | | 246,492 | |
| | |
PetroChina Co., Ltd., Class H | | | 5,480,300 | | | | 1,696,939 | |
| | |
Ping An Bank Co., Ltd., Class A | | | 161,100 | | | | 476,715 | |
| | |
Ping An Insurance (Group) Co. of China, Ltd., Class H | | | 158,046 | | | | 1,923,359 | |
| | |
Pingdingshan Tianan Coal Mining Co., Ltd. | | | 262,515 | | | | 238,365 | |
| | |
Poly Developments and Holdings Group Co., Ltd., Class A | | | 132,100 | | | | 319,131 | |
| | |
Poly Property Group Co., Ltd. | | | 482,000 | | | | 140,921 | |
| | |
Qingling Motors Co., Ltd., Class H | | | 1,448,966 | | | | 288,065 | |
| | |
SAIC Motor Corp., Ltd. | | | 135,500 | | | | 507,026 | |
| | |
Sanan Optoelectronics Co., Ltd. | | | 132,000 | | | | 545,700 | |
| | |
SDIC Power Holdings Co., Ltd. | | | 112,800 | | | | 149,028 | |
| | |
Seazen Group, Ltd. | | | 316,000 | | | | 263,962 | |
| | |
Semiconductor Manufacturing International Corp.(1) | | | 388,200 | | | | 1,088,612 | |
| | |
Shandong Gold Mining Co., Ltd. | | | 86,844 | | | | 314,163 | |
| | |
Shandong Weigao Group Medical Polymer Co., Ltd., Class H | | | 328,000 | | | | 742,072 | |
| | |
Shanghai Electric Group Co., Ltd., Class H(1) | | | 1,644,000 | | | | 505,304 | |
| | |
Shanghai Fosun Pharmaceutical Group Co., Ltd. | | | 232,500 | | | | 1,111,354 | |
| | |
Shanghai Industrial Holdings, Ltd. | | | 291,000 | | | | 397,698 | |
| | |
Shanghai Industrial Urban Development Group, Ltd. | | | 58,200 | | | | 6,163 | |
| | |
Shanghai Pudong Development Bank Co., Ltd., Class A | | | 153,926 | | | | 227,913 | |
| | |
Shanxi Coking Coal Energy Group Co., Ltd., Class A | | | 301,730 | | | | 260,572 | |
| | |
Shanxi Lu’an Environmental Energy Development Co., Ltd. | | | 152,200 | | | | 151,520 | |
| | |
Shenergy Co., Ltd. | | | 227,799 | | | | 181,817 | |
| | |
Shengyi Technology Co., Ltd., Class A | | | 46,800 | | | | 201,946 | |
| | |
Shenwan Hongyuan Group Co., Ltd., Class A | | | 357,100 | | | | 288,416 | |
| | |
Shenzhen Energy Group Co., Ltd., Class A | | | 290,352 | | | | 270,421 | |
| | |
Shenzhen Inovance Technology Co., Ltd., Class A | | | 60,600 | | | | 865,433 | |
| | |
Shenzhen Salubris Pharmaceuticals Co., Ltd., Class A | | | 56,300 | | | | 243,688 | |
| | |
Shenzhen Sunway Communication Co., Ltd., Class A | | | 52,400 | | | | 287,955 | |
| | |
Shenzhen Zhongjin Lingnan Nonfemet Co., Ltd., Class A | | | 219,739 | | | | 162,132 | |
| | |
Shimao Group Holdings, Ltd. | | | 137,000 | | | | 436,387 | |
| | |
Sichuan Chuantou Energy Co., Ltd. | | | 152,000 | | | | 233,711 | |
| | |
Sino Biopharmaceutical, Ltd. | | | 1,654,750 | | | | 1,595,825 | |
| | | | |
| | 9 | | See Notes to Financial Statements. |
Parametric
Tax-Managed Emerging Markets Fund
December 31, 2020
Portfolio of Investments (Unaudited) — continued
| | | | | | | | |
| Security | | Shares | | | Value | |
|
| China (continued) | |
| | |
Sino-Ocean Group Holding, Ltd. | | | 739,000 | | | $ | 147,495 | |
| | |
Sinopec Oilfield Service Corp., Class H(1) | | | 2,725,500 | | | | 214,825 | |
| | |
Sinopec Shanghai Petrochemical Co., Ltd., Class H | | | 1,272,000 | | | | 270,971 | |
| | |
Sinopharm Group Co., Ltd., Class H | | | 398,400 | | | | 966,448 | |
| | |
Sunac China Holdings, Ltd. | | | 267,000 | | | | 986,957 | |
| | |
Sunac Services Holdings, Ltd.(1)(3) | | | 8,590 | | | | 19,014 | |
| | |
Sunny Optical Technology Group Co., Ltd. | | | 68,800 | | | | 1,503,176 | |
| | |
TBEA Co., Ltd. | | | 168,219 | | | | 261,448 | |
| | |
TCL Technology Group Corp., Class A | | | 372,800 | | | | 403,857 | |
| | |
Tencent Holdings, Ltd. | | | 141,211 | | | | 10,160,664 | |
| | |
Tianqi Lithium Corp., Class A(1) | | | 41,411 | | | | 248,887 | |
| | |
Tingyi (Cayman Islands) Holding Corp. | | | 366,000 | | | | 626,047 | |
| | |
Tonghua Dongbao Pharmaceutical Co., Ltd. | | | 106,833 | | | | 218,573 | |
| | |
Tongling Nonferrous Metals Group Co., Ltd., Class A | | | 443,200 | | | | 174,330 | |
| | |
TravelSky Technology, Ltd., Class H | | | 93,000 | | | | 224,680 | |
| | |
Trip.com Group, Ltd. ADR(1) | | | 12,900 | | | | 435,117 | |
| | |
Tsingtao Brewery Co., Ltd., Class H | | | 98,000 | | | | 1,026,736 | |
| | |
Uni-President China Holdings, Ltd. | | | 290,000 | | | | 295,300 | |
| | |
United Laboratories International Holdings, Ltd. (The) | | | 362,000 | | | | 256,570 | |
| | |
Wanhua Chemical Group Co., Ltd. | | | 52,720 | | | | 734,592 | |
| | |
Want Want China Holdings, Ltd. | | | 1,092,000 | | | | 789,497 | |
| | |
Weichai Power Co., Ltd., Class H | | | 222,200 | | | | 446,781 | |
| | |
Weimob, Inc.(1)(2)(3) | | | 164,000 | | | | 295,643 | |
| | |
Wens Foodstuffs Group Co., Ltd., Class A | | | 90,033 | | | | 251,234 | |
| | |
WH Group, Ltd.(3) | | | 1,203,500 | | | | 1,009,197 | |
| | |
Will Semiconductor Co., Ltd. Shanghai, Class A | | | 6,500 | | | | 230,099 | |
| | |
Wuliangye Yibin Co., Ltd., Class A | | | 31,400 | | | | 1,402,335 | |
| | |
Wuxi Biologics Cayman, Inc.(1)(3) | | | 309,000 | | | | 4,097,751 | |
| | |
Xiaomi Corp., Class B(1)(3) | | | 1,303,400 | | | | 5,539,813 | |
| | |
Xinjiang Zhongtai Chemical Co., Ltd., Class A | | | 388,800 | | | | 366,124 | |
| | |
Xinyi Solar Holdings, Ltd. | | | 488,000 | | | | 1,279,637 | |
| | |
Yang Quan Coal Industry Group Co., Ltd. | | | 189,257 | | | | 162,581 | |
| | |
Yangzijiang Shipbuilding Holdings, Ltd. | | | 316,000 | | | | 228,437 | |
| | |
Yanzhou Coal Mining Co., Ltd., Class H | | | 1,388,000 | | | | 1,112,393 | |
| | |
Yihai International Holding, Ltd. | | | 81,000 | | | | 1,202,916 | |
| | |
Yonghui Superstores Co., Ltd. | | | 140,200 | | | | 154,038 | |
| | |
Yonyou Network Technology Co., Ltd., Class A | | | 37,300 | | | | 250,467 | |
| | |
Yuexiu Property Co., Ltd. | | | 1,520,000 | | | | 305,836 | |
| | |
Yunnan Baiyao Group Co., Ltd., Class A | | | 19,521 | | | | 339,271 | |
| | |
Zhaojin Mining Industry Co., Ltd., Class H | | | 409,500 | | | | 487,989 | |
| | |
Zhejiang Dahua Technology Co., Ltd., Class A | | | 94,600 | | | | 287,860 | |
| | |
Zhejiang Expressway Co., Ltd., Class H | | | 274,000 | | | | 231,681 | |
| | |
Zhejiang Huahai Pharmaceutical Co., Ltd. | | | 77,088 | | | | 398,970 | |
| | |
Zhejiang Longsheng Group Co., Ltd. | | | 220,600 | | | | 459,897 | |
| | |
Zhongjin Gold Corp., Ltd. | | | 120,570 | | | | 162,614 | |
| | |
Zhuzhou CRRC Times Electric Co., Ltd., Class H | | | 60,800 | | | | 265,673 | |
| | | | | | | | |
| Security | | Shares | | | Value | |
|
| China (continued) | |
| | |
Zijin Mining Group Co., Ltd., Class H | | | 1,382,000 | | | $ | 1,565,769 | |
| | |
ZTE Corp., Class H(2) | | | 172,939 | | | | 435,571 | |
| | |
ZTO Express Cayman, Inc. ADR | | | 40,900 | | | | 1,192,644 | |
| | |
| | | | | | | $ | 168,972,094 | |
|
| Colombia — 1.2% | |
| | |
Banco Davivienda S.A., PFC Shares | | | 28,259 | | | $ | 302,217 | |
| | |
Bancolombia S.A. | | | 54,507 | | | | 560,554 | |
| | |
Bancolombia S.A. ADR, PFC Shares | | | 23,100 | | | | 928,158 | |
| | |
Celsia S.A. ESP | | | 192,204 | | | | 267,059 | |
| | |
Cementos Argos S.A. | | | 409,358 | | | | 743,120 | |
| | |
Corporacion Financiera Colombiana S.A.(1) | | | 20,792 | | | | 197,611 | |
| | |
Ecopetrol S.A. | | | 1,958,138 | | | | 1,292,719 | |
| | |
Ecopetrol S.A. ADR(2) | | | 104,000 | | | | 1,342,640 | |
| | |
Grupo Argos S.A. | | | 311,062 | | | | 1,270,540 | |
| | |
Grupo Aval Acciones y Valores S.A., PFC Shares | | | 733,748 | | | | 257,271 | |
| | |
Grupo de Inversiones Suramericana S.A. | | | 65,118 | | | | 484,034 | |
| | |
Grupo Energia Bogota S.A. ESP | | | 707,211 | | | | 549,399 | |
| | |
Grupo Nutresa S.A. | | | 205,474 | | | | 1,446,634 | |
| | |
Interconexion Electrica S.A. | | | 125,281 | | | | 944,526 | |
| | |
| | | | | | | $ | 10,586,482 | |
|
| Croatia — 0.6% | |
| | |
AD Plastik DD(1) | | | 38,787 | | | $ | 1,004,210 | |
| | |
Adris Grupa DD, PFC Shares(1) | | | 19,843 | | | | 1,227,296 | |
| | |
Atlantic Grupa DD | | | 2,582 | | | | 559,837 | |
| | |
Ericsson Nikola Tesla DD | | | 2,151 | | | | 522,190 | |
| | |
Hrvatski Telekom DD | | | 29,021 | | | | 852,023 | |
| | |
Koncar-Elektroindustrija DD(1) | | | 2,519 | | | | 236,626 | |
| | |
Podravka Prehrambena Ind DD | | | 1,386 | | | | 108,821 | |
| | |
Valamar Riviera DD(1) | | | 132,515 | | | | 634,877 | |
| | |
Zagrebacka Banka DD(1) | | | 30,550 | | | | 268,060 | |
| | |
| | | | | | | $ | 5,413,940 | |
|
| Czech Republic — 0.6% | |
| | |
CEZ AS | | | 131,110 | | | $ | 3,144,555 | |
| | |
Komercni Banka AS(1) | | | 43,654 | | | | 1,334,739 | |
| | |
New World Resources PLC, Class A(1)(4) | | | 860,500 | | | | 0 | |
| | |
O2 Czech Republic AS | | | 29,400 | | | | 343,451 | |
| | |
Philip Morris CR AS | | | 807 | | | | 563,230 | |
| | |
| | | | | | | $ | 5,385,975 | |
|
| Egypt — 0.5% | |
| | |
Commercial International Bank Egypt SAE | | | 375,498 | | | $ | 1,418,488 | |
| | |
Eastern Co. SAE | | | 996,298 | | | | 829,219 | |
| | | | |
| | 10 | | See Notes to Financial Statements. |
Parametric
Tax-Managed Emerging Markets Fund
December 31, 2020
Portfolio of Investments (Unaudited) — continued
| | | | | | | | |
| Security | | Shares | | | Value | |
|
| Egypt (continued) | |
| | |
Egypt Kuwait Holding Co. SAE | | | 594,062 | | | $ | 606,678 | |
| | |
Egyptian Financial Group-Hermes Holding Co.(1) | | | 182,934 | | | | 167,947 | |
| | |
Egyptian International Pharmaceuticals EIPICO | | | 37,035 | | | | 101,632 | |
| | |
ElSewedy Electric Co. | | | 557,611 | | | | 343,996 | |
| | |
Medinet Nasr Housing | | | 624,187 | | | | 150,880 | |
| | |
Oriental Weavers | | | 872,035 | | | | 377,509 | |
| | |
Six of October Development & Investment Co. | | | 151,330 | | | | 142,692 | |
| | |
Talaat Moustafa Group | | | 1,012,938 | | | | 418,616 | |
| | |
| | | | | | | $ | 4,557,657 | |
|
| Estonia — 0.6% | |
| | |
AS Merko Ehitus(1) | | | 10,598 | | | $ | 122,529 | |
| | |
AS Tallink Grupp(1) | | | 3,453,838 | | | | 3,116,355 | |
| | |
AS Tallinna Kaubamaja Grupp | | | 149,458 | | | | 1,670,093 | |
| | |
AS Tallinna Vesi | | | 35,235 | | | | 570,728 | |
| | |
| | | | | | | $ | 5,479,705 | |
|
| Ghana — 0.3% | |
| | |
Aluworks, Ltd.(1) | | | 5,176,100 | | | $ | 96,997 | |
| | |
CalBank PLC | | | 5,036,062 | | | | 591,673 | |
| | |
Ghana Commercial Bank, Ltd. | | | 1,285,170 | | | | 875,348 | |
| | |
Societe Generale Ghana, Ltd. | | | 1,345,362 | | | | 146,769 | |
| | |
Standard Chartered Bank of Ghana, Ltd. | | | 283,150 | | | | 796,321 | |
| | |
Unilever Ghana PLC(1) | | | 249,000 | | | | 351,654 | |
| | |
| | | | | | | $ | 2,858,762 | |
|
| Greece — 1.2% | |
| | |
Aegean Airlines S.A.(1) | | | 37,740 | | | $ | 237,352 | |
| | |
Athens Water Supply & Sewage Co. S.A. | | | 36,893 | | | | 309,721 | |
| | |
Costamare, Inc. | | | 34,966 | | | | 289,518 | |
| | |
Eurobank Ergasias Services and Holdings S.A.(1) | | | 834,244 | | | | 586,079 | |
| | |
FF Group(1)(4) | | | 43,721 | | | | 0 | |
| | |
GEK Terna Holding Real Estate Construction S.A.(1) | | | 51,756 | | | | 496,190 | |
| | |
Hellenic Exchanges - Athens Stock Exchange S.A. | | | 32,613 | | | | 154,790 | |
| | |
Hellenic Petroleum S.A. | | | 55,867 | | | | 367,904 | |
| | |
Hellenic Telecommunications Organization S.A. | | | 69,932 | | | | 1,124,549 | |
| | |
Holding Co. ADMIE IPTO S.A. | | | 39,952 | | | | 129,446 | |
| | |
JUMBO S.A. | | | 70,998 | | | | 1,224,361 | |
| | |
LAMDA Development S.A.(1) | | | 23,069 | | | | 200,147 | |
| | |
Motor Oil (Hellas) Corinth Refineries S.A. | | | 75,521 | | | | 1,085,811 | |
| | |
Mytilineos S.A. | | | 75,802 | | | | 1,100,384 | |
| | |
National Bank of Greece S.A.(1) | | | 121,470 | | | | 332,550 | |
| | |
OPAP S.A. | | | 114,774 | | | | 1,534,521 | |
| | |
Piraeus Bank S.A.(1) | | | 169,722 | | | | 266,208 | |
| | |
Public Power Corp. S.A.(1) | | | 35,851 | | | | 325,539 | |
| | | | | | | | |
| Security | | Shares | | | Value | |
|
| Greece (continued) | |
| | |
Terna Energy S.A. | | | 5,946 | | | $ | 95,904 | |
| | |
Titan Cement International S.A. | | | 29,410 | | | | 494,102 | |
| | |
| | | | | | | $ | 10,355,076 | |
|
| Hungary — 0.6% | |
| | |
Magyar Telekom Telecommunications PLC | | | 60,229 | | | $ | 77,115 | |
| | |
MOL Hungarian Oil & Gas PLC(1) | | | 225,304 | | | | 1,661,080 | |
| | |
OTP Bank Nyrt.(1) | | | 35,063 | | | | 1,580,099 | |
| | |
Richter Gedeon Nyrt. | | | 86,654 | | | | 2,174,631 | |
| | |
| | | | | | | $ | 5,492,925 | |
|
| India — 4.8% | |
| | |
ABB India, Ltd. | | | 13,800 | | | $ | 229,051 | |
| | |
ACC, Ltd. | | | 10,684 | | | | 237,184 | |
| | |
Adani Enterprises, Ltd. | | | 58,300 | | | | 381,491 | |
| | |
Adani Gas, Ltd. | | | 119,200 | | | | 615,511 | |
| | |
Adani Ports and Special Economic Zone, Ltd. | | | 56,675 | | | | 373,618 | |
| | |
Adani Power, Ltd.(1) | | | 277,511 | | | | 188,870 | |
| | |
Apollo Hospitals Enterprise, Ltd. | | | 10,409 | | | | 342,496 | |
| | |
Ashok Leyland, Ltd. | | | 170,067 | | | | 223,261 | |
| | |
Asian Paints, Ltd. | | | 22,272 | | | | 842,420 | |
| | |
Aurobindo Pharma, Ltd. | | | 41,848 | | | | 526,235 | |
| | |
Axis Bank, Ltd.(1) | | | 50,638 | | | | 430,020 | |
| | |
Bajaj Auto, Ltd. | | | 13,052 | | | | 614,410 | |
| | |
Bharat Forge, Ltd. | | | 38,772 | | | | 278,997 | |
| | |
Bharat Petroleum Corp., Ltd. | | | 36,600 | | | | 191,387 | |
| | |
Bharti Airtel, Ltd. | | | 214,317 | | | | 1,496,119 | |
| | |
Biocon, Ltd.(1) | | | 105,688 | | | | 672,335 | |
| | |
Bosch, Ltd. | | | 1,400 | | | | 245,192 | |
| | |
Cadila Healthcare, Ltd. | | | 39,469 | | | | 257,549 | |
| | |
Century Textiles & Industries, Ltd. | | | 50,000 | | | | 281,804 | |
| | |
CESC, Ltd. | | | 24,742 | | | | 208,237 | |
| | |
Cipla, Ltd. | | | 84,769 | | | | 950,872 | |
| | |
Colgate-Palmolive (India), Ltd. | | | 7,700 | | | | 165,153 | |
| | |
Container Corp. of India, Ltd. | | | 67,087 | | | | 365,937 | |
| | |
Dabur India, Ltd. | | | 16,400 | | | | 119,792 | |
| | |
Divi’s Laboratories, Ltd. | | | 13,619 | | | | 715,526 | |
| | |
DLF, Ltd. | | | 86,670 | | | | 275,641 | |
| | |
Dr. Reddy’s Laboratories, Ltd. | | | 13,678 | | | | 975,503 | |
| | |
GAIL (India), Ltd. | | | 158,191 | | | | 267,728 | |
| | |
GlaxoSmithKline Pharmaceuticals, Ltd. | | | 16,000 | | | | 355,138 | |
| | |
Glenmark Pharmaceuticals, Ltd. | | | 49,900 | | | | 336,333 | |
| | |
Godrej Consumer Products, Ltd. | | | 21,460 | | | | 218,162 | |
| | |
Grasim Industries, Ltd. | | | 39,759 | | | | 502,891 | |
| | |
Havells India, Ltd. | | | 26,800 | | | | 336,536 | |
| | | | |
| | 11 | | See Notes to Financial Statements. |
Parametric
Tax-Managed Emerging Markets Fund
December 31, 2020
Portfolio of Investments (Unaudited) — continued
| | | | | | | | |
| Security | | Shares | | | Value | |
|
| India (continued) | |
| | |
HCL Technologies, Ltd. | | | 73,177 | | | $ | 950,008 | |
| | |
HDFC Bank, Ltd.(1) | | | 10,638 | | | | 209,845 | |
| | |
Hero MotoCorp, Ltd. | | | 11,538 | | | | 491,113 | |
| | |
Hindustan Petroleum Corp., Ltd. | | | 84,030 | | | | 252,838 | |
| | |
Hindustan Unilever, Ltd. | | | 29,373 | | | | 963,723 | |
| | |
Hindustan Zinc, Ltd. | | | 79,702 | | | | 261,119 | |
| | |
Housing Development Finance Corp., Ltd. | | | 21,092 | | | | 736,465 | |
| | |
ICICI Bank, Ltd.(1) | | | 69,167 | | | | 507,613 | |
| | |
Indian Oil Corp., Ltd. | | | 221,690 | | | | 276,417 | |
| | |
Indus Towers, Ltd. | | | 49,905 | | | | 157,495 | |
| | |
Infosys, Ltd. | | | 220,039 | | | | 3,765,172 | |
| | |
Ipca Laboratories, Ltd. | | | 14,898 | | | | 447,459 | |
| | |
ITC, Ltd. | | | 113,658 | | | | 325,653 | |
| | |
Jindal Steel & Power, Ltd.(1) | | | 90,000 | | | | 329,595 | |
| | |
JSW Steel, Ltd. | | | 71,838 | | | | 380,632 | |
| | |
Kotak Mahindra Bank, Ltd.(1) | | | 23,341 | | | | 637,861 | |
| | |
Larsen & Toubro, Ltd. | | | 63,749 | | | | 1,126,515 | |
| | |
Lupin, Ltd. | | | 27,586 | | | | 369,537 | |
| | |
Mahindra & Mahindra, Ltd. | | | 64,285 | | | | 636,124 | |
| | |
Maruti Suzuki India, Ltd. | | | 6,387 | | | | 670,500 | |
| | |
Mphasis, Ltd. | | | 18,625 | | | | 393,262 | |
| | |
Nestle India, Ltd. | | | 1,800 | | | | 453,320 | |
| | |
NTPC, Ltd. | | | 154,160 | | | | 210,117 | |
| | |
Petronet LNG, Ltd. | | | 70,400 | | | | 238,728 | |
| | |
Piramal Enterprises, Ltd. | | | 18,076 | | | | 352,251 | |
| | |
Power Grid Corporation of India, Ltd. | | | 217,950 | | | | 562,583 | |
| | |
Reliance Industries, Ltd. | | | 120,312 | | | | 3,267,788 | |
| | |
Siemens, Ltd. | | | 19,300 | | | | 415,404 | |
| | |
State Bank of India GDR(1)(5) | | | 8,912 | | | | 334,682 | |
| | |
Sun Pharmaceutical Industries, Ltd. | | | 107,380 | | | | 869,016 | |
| | |
Tata Communications, Ltd. | | | 33,686 | | | | 507,297 | |
| | |
Tata Consultancy Services, Ltd. | | | 63,547 | | | | 2,497,099 | |
| | |
Tata Consumer Products, Ltd. | | | 50,772 | | | | 411,298 | |
| | |
Tata Motors, Ltd.(1) | | | 97,516 | | | | 245,564 | |
| | |
Tech Mahindra, Ltd. | | | 51,695 | | | | 691,497 | |
| | |
Titan Co., Ltd. | | | 26,876 | | | | 574,820 | |
| | |
Torrent Pharmaceuticals, Ltd. | | | 7,307 | | | | 280,113 | |
| | |
UPL, Ltd. | | | 25,559 | | | | 163,544 | |
| | |
Voltas, Ltd. | | | 52,121 | | | | 585,999 | |
| | |
Wipro, Ltd. | | | 147,018 | | | | 778,241 | |
| | |
WNS Holdings, Ltd. ADR(1) | | | 6,100 | | | | 439,505 | |
| | |
| | | | | | | $ | 41,989,211 | |
|
| Indonesia — 2.5% | |
| | |
Ace Hardware Indonesia Tbk PT | | | 2,611,600 | | | $ | 319,199 | |
| | |
Adaro Energy Tbk PT | | | 8,410,800 | | | | 857,148 | |
| | | | | | | | |
| Security | | Shares | | | Value | |
|
| Indonesia (continued) | |
| | |
Aneka Tambang Tbk | | | 4,809,500 | | | $ | 663,301 | |
| | |
Astra Argo Lestari Tbk PT | | | 213,500 | | | | 187,546 | |
| | |
Astra International Tbk PT | | | 8,932,100 | | | | 3,839,204 | |
| | |
Bank Central Asia Tbk PT | | | 447,700 | | | | 1,079,194 | |
| | |
Bank Mandiri Persero Tbk PT | | | 1,991,000 | | | | 898,437 | |
| | |
Bank Negara Indonesia Persero Tbk PT | | | 849,200 | | | | 373,934 | |
| | |
Bank Rakyat Indonesia Persero Tbk PT | | | 3,280,900 | | | | 975,422 | |
| | |
Bukit Asam Tbk PT | | | 1,322,400 | | | | 264,896 | |
| | |
Charoen Pokphand Indonesia Tbk PT | | | 1,280,500 | | | | 595,515 | |
| | |
Gudang Garam Tbk PT(1) | | | 100,500 | | | | 293,354 | |
| | |
Hanson International Tbk PT(1)(4) | | | 110,720,800 | | | | 0 | |
| | |
Indah Kiat Pulp & Paper Corp. Tbk PT | | | 912,300 | | | | 677,887 | |
| | |
Indocement Tunggal Prakarsa Tbk PT | | | 778,500 | | | | 802,667 | |
| | |
Indofood CBP Sukses Makmur Tbk PT | | | 340,600 | | | | 232,212 | |
| | |
Indofood Sukses Makmur Tbk PT | | | 819,000 | | | | 399,463 | |
| | |
Jasa Marga (Persero) Tbk PT | | | 1,299,900 | | | | 428,595 | |
| | |
Kalbe Farma Tbk PT | | | 11,037,700 | | | | 1,162,890 | |
| | |
Mitra Keluarga Karyasehat Tbk PT | | | 935,900 | | | | 181,942 | |
| | |
Pakuwon Jati Tbk PT(1) | | | 7,972,000 | | | | 289,412 | |
| | |
Perusahaan Gas Negara Tbk PT | | | 2,389,000 | | | | 281,797 | |
| | |
Semen Indonesia Persero Tbk PT | | | 863,000 | | | | 763,897 | |
| | |
Sigmagold Inti Perkasa Tbk PT(1)(4) | | | 27,503,000 | | | | 0 | |
| | |
Telkom Indonesia Persero Tbk PT | | | 14,162,300 | | | | 3,338,972 | |
| | |
Unilever Indonesia Tbk PT | | | 1,096,200 | | | | 573,756 | |
| | |
United Tractors Tbk PT | | | 680,600 | | | | 1,289,939 | |
| | |
Vale Indonesia Tbk PT(1) | | | 1,492,700 | | | | 542,862 | |
| | |
| | | | | | | $ | 21,313,441 | |
|
| Jordan — 0.5% | |
| | |
Arab Bank PLC(1) | | | 398,340 | | | $ | 2,317,152 | |
| | |
Arab Potash Co. PLC | | | 42,467 | | | | 1,258,564 | |
| | |
Bank of Jordan(1) | | | 129,775 | | | | 353,405 | |
| | |
Capital Bank of Jordan(4) | | | 81,573 | | | | 112,648 | |
| | |
Jordan Islamic Bank(1) | | | 32,236 | | | | 140,237 | |
| | |
Jordan Petroleum Refinery | | | 80,389 | | | | 283,517 | |
| | |
Jordanian Electric Power Co. | | | 150,431 | | | | 256,693 | |
| | |
| | | | | | | $ | 4,722,216 | |
|
| Kazakhstan — 0.6% | |
| | |
Halyk Savings Bank of Kazakhstan JSC GDR(5) | | | 86,823 | | | $ | 1,011,952 | |
| | |
KAZ Minerals PLC | | | 278,195 | | | | 2,496,933 | |
| | |
Kcell JSC GDR(5) | | | 262,322 | | | | 1,828,141 | |
| | |
| | | | | | | $ | 5,337,026 | |
| | | | |
| | 12 | | See Notes to Financial Statements. |
Parametric
Tax-Managed Emerging Markets Fund
December 31, 2020
Portfolio of Investments (Unaudited) — continued
| | | | | | | | |
| Security | | Shares | | | Value | |
|
| Kenya — 0.6% | |
| | |
ABSA Bank Kenya PLC | | | 1,204,620 | | | $ | 104,046 | |
| | |
ARM Cement, Ltd.(1)(4) | | | 1,677,000 | | | | 0 | |
| | |
East African Breweries, Ltd. | | | 900,076 | | | | 1,286,068 | |
| | |
Equity Group Holdings PLC(1) | | | 1,017,400 | | | | 340,356 | |
| | |
KCB Group, Ltd. | | | 1,031,560 | | | | 363,683 | |
| | |
Safaricom PLC | | | 8,590,600 | | | | 2,686,360 | |
| | |
Standard Chartered Bank Kenya, Ltd. | | | 76,415 | | | | 100,394 | |
| | |
| | | | | | | $ | 4,880,907 | |
|
| Kuwait — 1.1% | |
| | |
Agility Public Warehousing Co. KSC | | | 655,535 | | | $ | 1,459,104 | |
| | |
Boubyan Petrochemicals Co. KSCP | | | 276,626 | | | | 583,677 | |
| | |
Gulf Bank KSCP | | | 303,877 | | | | 218,923 | |
| | |
Humansoft Holding Co. KSC(1) | | | 35,701 | | | | 446,373 | |
| | |
Kuwait Finance House KSCP | | | 683,049 | | | | 1,522,128 | |
| | |
Kuwait International Bank KSCP | | | 372,153 | | | | 254,855 | |
| | |
Mabanee Co. KPSC | | | 190,212 | | | | 410,600 | |
| | |
Mobile Telecommunications Co. KSCP | | | 832,348 | | | | 1,659,900 | |
| | |
National Bank of Kuwait SAK | | | 1,010,293 | | | | 2,793,789 | |
| | |
National Industries Group Holding SAK | | | 477,963 | | | | 277,417 | |
| | |
| | | | | | | $ | 9,626,766 | |
|
| Lebanon — 0.0% | |
| | |
Bank Audi SAL GDR(1)(4)(5) | | | 15,000 | | | $ | 0 | |
| | |
| | | | | | | $ | 0 | |
|
| Lithuania — 0.3% | |
| | |
Apranga PVA(1) | | | 257,243 | | | $ | 565,710 | |
| | |
Klaipedos Nafta AB | | | 1,576,663 | | | | 616,726 | |
| | |
Panevezio Statybos Trestas(1) | | | 201,949 | | | | 140,733 | |
| | |
Rokiskio Suris | | | 177,000 | | | | 631,482 | |
| | |
Siauliu Bankas(1) | | | 1,523,204 | | | | 925,800 | |
| | |
| | | | | | | $ | 2,880,451 | |
|
| Malaysia — 2.2% | |
| | |
Axiata Group Bhd | | | 392,075 | | | $ | 364,873 | |
| | |
Berjaya Sports Toto Bhd | | | 473,582 | | | | 258,041 | |
| | |
Bursa Malaysia Bhd | | | 117,800 | | | | 243,707 | |
| | |
Capitaland Malaysia Mall Trust | | | 488,900 | | | | 75,881 | |
| | |
CIMB Group Holdings Bhd | | | 205,024 | | | | 219,511 | |
| | |
Dialog Group Bhd | | | 1,499,650 | | | | 1,287,695 | |
| | |
Digi.com Bhd | | | 243,800 | | | | 251,089 | |
| | |
Fraser & Neave Holdings Bhd | | | 26,000 | | | | 207,661 | |
| | |
Gamuda Bhd | | | 558,200 | | | | 541,054 | |
| | | | | | | | |
| Security | | Shares | | | Value | |
|
| Malaysia (continued) | |
| | |
Genting Bhd | | | 391,000 | | | $ | 434,292 | |
| | |
Genting Malaysia Bhd | | | 569,900 | | | | 382,084 | |
| | |
Globetronics Technology Bhd | | | 839,766 | | | | 565,556 | |
| | |
Hartalega Holdings Bhd | | | 324,500 | | | | 982,180 | |
| | |
Hong Leong Bank Bhd | | | 56,700 | | | | 256,824 | |
| | |
IHH Healthcare Bhd | | | 593,400 | | | | 812,469 | |
| | |
IJM Corp. Bhd | | | 818,440 | | | | 352,907 | |
| | |
Inari Amertron Bhd | | | 1,714,650 | | | | 1,180,692 | |
| | |
Kossan Rubber Industries | | | 319,200 | | | | 358,865 | |
| | |
KPJ Healthcare Bhd | | | 870,300 | | | | 216,401 | |
| | |
Kuala Lumpur Kepong Bhd | | | 39,450 | | | | 232,376 | |
| | |
Magnum Bhd | | | 624,119 | | | | 354,166 | |
| | |
Malayan Banking Bhd | | | 188,486 | | | | 396,799 | |
| | |
Maxis Bhd | | | 161,200 | | | | 202,542 | |
| | |
MISC Bhd | | | 172,240 | | | | 294,635 | |
| | |
Muhibbah Engineering (M) Bhd | | | 1,044,500 | | | | 260,483 | |
| | |
My EG Services Bhd | | | 2,351,600 | | | | 1,125,615 | |
| | |
Pavilion Real Estate Investment Trust | | | 771,100 | | | | 287,486 | |
| | |
Petronas Dagangan Bhd | | | 122,000 | | | | 649,962 | |
| | |
Petronas Gas Bhd | | | 50,974 | | | | 217,876 | |
| | |
PPB Group Bhd | | | 54,460 | | | | 250,876 | |
| | |
Press Metal Aluminium Holdings Bhd | | | 323,700 | | | | 676,276 | |
| | |
Public Bank Bhd | | | 93,598 | | | | 479,933 | |
| | |
RHB Bank Bhd | | | 70,159 | | | | 95,207 | |
| | |
Sapura Energy Bhd(1) | | | 8,974,600 | | | | 279,381 | |
| | |
Serba Dinamik Holdings Bhd | | | 719,500 | | | | 315,857 | |
| | |
Sime Darby Bhd | | | 531,945 | | | | 306,177 | |
| | |
Sime Darby Plantation Bhd | | | 207,609 | | | | 258,054 | |
| | |
Sunway Real Estate Investment Trust | | | 512,000 | | | | 191,018 | |
| | |
Supermax Corp. Bhd(1) | | | 334,368 | | | | 502,338 | |
| | |
Tenaga Nasional Bhd | | | 117,331 | | | | 304,364 | |
| | |
Top Glove Corp. Bhd | | | 866,420 | | | | 1,323,817 | |
| | |
UMW Holdings Bhd | | | 92,500 | | | | 78,378 | |
| | |
VS Industry Bhd | | | 850,875 | | | | 550,344 | |
| | |
Yinson Holdings Bhd | | | 270,700 | | | | 387,607 | |
| | |
| | | | | | | $ | 19,013,349 | |
|
| Mauritius — 0.6% | |
| | |
Alteo, Ltd. | | | 628,964 | | | $ | 329,408 | |
| | |
Attitude Property, Ltd. | | | 629,246 | | | | 180,866 | |
| | |
CIEL, Ltd. | | | 5,598,020 | | | | 527,965 | |
| | |
CIM Financial Services, Ltd. | | | 2,411,765 | | | | 390,052 | |
| | |
ENL, Ltd. | | | 508,787 | | | | 193,258 | |
| | |
IBL, Ltd. | | | 309,981 | | | | 370,325 | |
| | |
Lavastone, Ltd. | | | 2,649,077 | | | | 102,431 | |
| | |
MCB Group, Ltd. | | | 148,006 | | | | 887,609 | |
| | | | |
| | 13 | | See Notes to Financial Statements. |
Parametric
Tax-Managed Emerging Markets Fund
December 31, 2020
Portfolio of Investments (Unaudited) — continued
| | | | | | | | |
| Security | | Shares | | | Value | |
|
| Mauritius (continued) | |
| | |
Phoenix Beverages, Ltd. | | | 33,742 | | | $ | 502,642 | |
| | |
Rogers & Co., Ltd. | | | 608,300 | | | | 344,791 | |
| | |
SBM Holdings, Ltd. | | | 3,504,538 | | | | 317,858 | |
| | |
Terra Mauricia, Ltd. | | | 506,473 | | | | 252,918 | |
| | |
United Basalt Products, Ltd. | | | 187,150 | | | | 571,190 | |
| | |
| | | | | | | $ | 4,971,313 | |
|
| Mexico — 4.9% | |
| | |
Alfa SAB de CV, Series A | | | 1,398,720 | | | $ | 1,006,541 | |
| | |
America Movil SAB de CV, Series L | | | 8,221,090 | | | | 5,986,261 | |
| | |
Arca Continental SAB de CV | | | 162,800 | | | | 778,514 | |
| | |
Cemex SAB de CV, Series CPO(1) | | | 2,836,418 | | | | 1,466,707 | |
| | |
Coca-Cola Femsa SAB de CV, Series L | | | 82,400 | | | | 379,505 | |
| | |
Concentradora Fibra Danhos S.A. de CV | | | 357,100 | | | | 439,657 | |
| | |
Controladora Nemak SAB de CV(1)(2) | | | 1,398,720 | | | | 185,563 | |
| | |
Corp. Inmobiliaria Vesta SAB de CV | | | 384,400 | | | | 753,366 | |
| | |
El Puerto de Liverpool SAB de CV(1) | | | 71,700 | | | | 251,281 | |
| | |
Empresas ICA SAB de CV(1)(2)(4) | | | 2,075,736 | | | | 0 | |
| | |
Fibra Uno Administracion S.A. de CV | | | 895,567 | | | | 1,013,051 | |
| | |
Fomento Economico Mexicano SAB de CV, Series UBD | | | 462,200 | | | | 3,505,608 | |
| | |
Genomma Lab Internacional SAB de CV(1)(2) | | | 1,018,000 | | | | 958,172 | |
| | |
Grupo Aeroportuario del Centro Norte SAB de CV(1) | | | 78,300 | | | | 505,107 | |
| | |
Grupo Aeroportuario del Pacifico SAB de CV, Class B(1) | | | 183,900 | | | | 2,051,599 | |
| | |
Grupo Aeroportuario del Sureste SAB de CV, Class B(1) | | | 119,944 | | | | 1,987,805 | |
| | |
Grupo Bimbo SAB de CV, Series A | | | 527,108 | | | | 1,142,979 | |
| | |
Grupo Carso SAB de CV, Series A1(1) | | | 467,500 | | | | 1,549,367 | |
| | |
Grupo Cementos de Chihuahua SAB de CV | | | 66,700 | | | | 403,964 | |
| | |
Grupo Elektra SAB de CV(2) | | | 34,564 | | | | 2,288,403 | |
| | |
Grupo Financiero Banorte SAB de CV, Class O(1) | | | 149,800 | | | | 825,426 | |
| | |
Grupo Financiero Inbursa SAB de CV, Class O(1) | | | 629,516 | | | | 633,328 | |
| | |
Grupo Mexico SAB de CV, Series B | | | 882,456 | | | | 3,742,328 | |
| | |
Grupo Televisa SAB, Series CPO(1) | | | 260,471 | | | | 426,974 | |
| | |
Industrias Penoles SAB de CV | | | 51,449 | | | | 874,655 | |
| | |
Infraestructura Energetica Nova SAB de CV(1) | | | 79,200 | | | | 310,639 | |
| | |
Kimberly-Clark de Mexico SAB de CV, Class A | | | 506,510 | | | | 864,652 | |
| | |
Macquarie Mexico Real Estate Management S.A. de CV(3) | | | 321,500 | | | | 453,989 | |
| | |
Orbia Advance Corp., SAB de CV | | | 485,267 | | | | 1,141,016 | |
| | |
PLA Administradora Industrial S de RL de CV | | | 211,200 | | | | 325,192 | |
| | |
Prologis Property Mexico S.A. de CV | | | 240,200 | | | | 540,886 | |
| | |
Promotora y Operadora de Infraestructura SAB de CV | | | 125,065 | | | | 1,108,896 | |
| | |
Telesites SAB de CV(1)(2) | | | 879,564 | | | | 950,307 | |
| | |
Ternium S.A. ADR(1) | | | 15,322 | | | | 445,564 | |
| | |
Wal-Mart de Mexico SAB de CV, Series V | | | 1,121,364 | | | | 3,150,041 | |
| | |
| | | | | | | $ | 42,447,343 | |
| | | | | | | | |
| Security | | Shares | | | Value | |
|
| Morocco — 0.6% | |
| | |
Attijariwafa Bank | | | 13,579 | | | $ | 644,566 | |
| | |
Bank of Africa | | | 11,215 | | | | 195,826 | |
| | |
Banque Centrale Populaire | | | 4,384 | | | | 122,701 | |
| | |
Banque Marocaine Pour Le Commerce et L’Industrie(1) | | | 1,376 | | | | 98,473 | |
| | |
Co Sucrerie Marocaine et de Raffinage | | | 25,202 | | | | 593,765 | |
| | |
Label Vie | | | 406 | | | | 145,989 | |
| | |
LafargeHolcim Maroc S.A. | | | 4,384 | | | | 786,323 | |
| | |
Lesieur Cristal | | | 8,686 | | | | 157,706 | |
| | |
Managem S.A.(1) | | | 2,645 | | | | 339,900 | |
| | |
Maroc Telecom | | | 75,590 | | | | 1,226,542 | |
| | |
Societe d’Exploitation des Ports | | | 23,655 | | | | 556,935 | |
| | |
TAQA Morocco S.A. | | | 1,963 | | | | 201,651 | |
| | |
| | | | | | | $ | 5,070,377 | |
|
| Nigeria — 1.0% | |
| | |
Access Bank PLC(4) | | | 32,908,148 | | | $ | 597,081 | |
| | |
Dangote Cement PLC(4) | | | 4,167,837 | | | | 1,974,662 | |
| | |
Dangote Sugar Refinery PLC(4) | | | 4,385,654 | | | | 165,179 | |
| | |
FBN Holdings PLC(4) | | | 21,879,762 | | | | 335,194 | |
| | |
Guaranty Trust Bank PLC(4) | | | 13,844,766 | | | | 960,965 | |
| | |
Lafarge Africa PLC(4) | | | 3,044,633 | | | | 138,644 | |
| | |
Lekoil, Ltd.(1) | | | 1,110,205 | | | | 26,292 | |
| | |
Nestle Nigeria PLC(4) | | | 496,712 | | | | 1,537,110 | |
| | |
Nigerian Breweries PLC(4) | | | 5,467,425 | | | | 655,158 | |
| | |
SEPLAT Petroleum Development Co. PLC(3) | | | 435,022 | | | | 386,410 | |
| | |
Stanbic IBTC Holdings PLC(4) | | | 3,126,624 | | | | 297,226 | |
| | |
Transnational Corp. of Nigeria PLC(4) | | | 22,334,373 | | | | 43,004 | |
| | |
United Bank for Africa PLC(4) | | | 20,664,553 | | | | 385,466 | |
| | |
Zenith Bank PLC(4) | | | 17,411,456 | | | | 927,725 | |
| | |
| | | | | | | $ | 8,430,116 | |
|
| Oman — 0.6% | |
| | |
Bank Dhofar SAOG | | | 1,038,913 | | | $ | 261,846 | |
| | |
Bank Muscat SAOG | | | 1,061,296 | | | | 1,093,220 | |
| | |
Bank Nizwa SAOG(1) | | | 941,624 | | | | 235,093 | |
| | |
Dhofar International Development & Investment Holding SAOG(1) | | | 286,164 | | | | 214,131 | |
| | |
National Bank of Oman SAOG | | | 368,936 | | | | 153,330 | |
| | |
Oman Cement Co. SAOG | | | 367,946 | | | | 235,089 | |
| | |
Oman Flour Mills Co. SAOG | | | 283,279 | | | | 550,541 | |
| | |
Oman Telecommunications Co. SAOG | | | 534,354 | | | | 1,004,087 | |
| | |
Omani Qatari Telecommunications Co. SAOG | | | 539,969 | | | | 551,949 | |
| | |
Renaissance Services SAOG | | | 128,153 | | | | 113,658 | |
| | |
Sembcorp Salalah Power & Water Co. | | | 377,934 | | | | 97,196 | |
| | |
Sohar International Bank SAOG | | | 1,477,945 | | | | 349,605 | |
| | |
| | | | | | | $ | 4,859,745 | |
| | | | |
| | 14 | | See Notes to Financial Statements. |
Parametric
Tax-Managed Emerging Markets Fund
December 31, 2020
Portfolio of Investments (Unaudited) — continued
| | | | | | | | |
| Security | | Shares | | | Value | |
|
| Pakistan — 0.5% | |
| | |
Bank Alfalah, Ltd. | | | 611,933 | | | $ | 135,243 | |
| | |
Engro Corp., Ltd. | | | 173,692 | | | | 334,653 | |
| | |
Fauji Fertilizer Co., Ltd. | | | 369,388 | | | | 251,738 | |
| | |
Frieslandcampina Engro Pakistan, Ltd.(1) | | | 186,100 | | | | 96,096 | |
| | |
Habib Bank, Ltd. | | | 357,983 | | | | 297,326 | |
| | |
Hub Power Co., Ltd. (The) | | | 149,215 | | | | 73,819 | |
| | |
Lucky Cement, Ltd.(1) | | | 111,546 | | | | 486,222 | |
| | |
Mari Petroleum Co., Ltd. | | | 35,322 | | | | 297,748 | |
| | |
MCB Bank, Ltd. | | | 239,187 | | | | 281,023 | |
| | |
Millat Tractors, Ltd. | | | 51,326 | | | | 350,279 | |
| | |
Nishat Mills, Ltd. | | | 593,280 | | | | 373,401 | |
| | |
Oil & Gas Development Co., Ltd. | | | 568,127 | | | | 369,169 | |
| | |
Pakistan Petroleum, Ltd. | | | 1,196,818 | | | | 672,409 | |
| | |
Pakistan State Oil Co., Ltd.(1) | | | 332,619 | | | | 445,964 | |
| | |
Searle Co., Ltd. (The) | | | 189,244 | | | | 294,426 | |
| | |
| | | | | | | $ | 4,759,516 | |
|
| Panama — 0.2% | |
| | |
Banco Latinoamericano de Comercio Exterior S.A., Class E | | | 49,900 | | | $ | 789,917 | |
| | |
Copa Holdings S.A., Class A | | | 14,608 | | | | 1,128,176 | |
| | |
| | | | | | | $ | 1,918,093 | |
|
| Peru — 1.2% | |
| | |
Cia de Minas Buenaventura SAA ADR | | | 192,956 | | | $ | 2,352,134 | |
| | |
Credicorp, Ltd. | | | 20,396 | | | | 3,345,352 | |
| | |
Enel Generacion Peru SAA | | | 277,207 | | | | 154,302 | |
| | |
Ferreycorp SAA | | | 872,283 | | | | 416,864 | |
| | |
Southern Copper Corp. | | | 66,255 | | | | 4,314,525 | |
| | |
| | | | | | | $ | 10,583,177 | |
|
| Philippines — 2.3% | |
| | |
Aboitiz Equity Ventures, Inc. | | | 590,350 | | | $ | 580,374 | |
| | |
Aboitiz Power Corp. | | | 1,105,000 | | | | 611,801 | |
| | |
Alliance Global Group, Inc. | | | 764,400 | | | | 168,766 | |
| | |
Ayala Corp. | | | 57,648 | | | | 991,899 | |
| | |
Ayala Land, Inc. | | | 988,108 | | | | 841,970 | |
| | |
Ayala Land, Inc. GDR, PFC Shares(4) | | | 3,534,608 | | | | 0 | |
| | |
Bank of the Philippine Islands | | | 409,653 | | | | 693,239 | |
| | |
BDO Unibank, Inc. | | | 241,429 | | | | 537,532 | |
| | |
Bloomberry Resorts Corp. | | | 2,458,700 | | | | 415,244 | |
| | |
Century Pacific Food, Inc. | | | 1,007,500 | | | | 367,244 | |
| | |
Cosco Capital, Inc. | | | 920,800 | | | | 108,566 | |
| | |
Filinvest Land, Inc. | | | 6,230,546 | | | | 145,347 | |
| | |
First Philippine Holdings Corp. | | | 203,730 | | | | 326,850 | |
| | | | | | | | |
| Security | | Shares | | | Value | |
|
| Philippines (continued) | |
| | |
Globe Telecom, Inc. | | | 15,745 | | | $ | 666,275 | |
| | |
International Container Terminal Services, Inc. | | | 184,440 | | | | 474,379 | |
| | |
JG Summit Holdings, Inc. | | | 814,632 | | | | 1,216,339 | |
| | |
Jollibee Foods Corp. | | | 369,150 | | | | 1,501,847 | |
| | |
Manila Electric Co. | | | 130,884 | | | | 796,687 | |
| | |
Megaworld Corp. | | | 2,140,300 | | | | 181,780 | |
| | |
Metropolitan Bank & Trust Co. | | | 401,959 | | | | 410,661 | |
| | |
Nickel Asia Corp. | | | 4,696,888 | | | | 548,980 | |
| | |
PLDT, Inc. | | | 46,600 | | | | 1,301,179 | |
| | |
Puregold Price Club, Inc. | | | 617,440 | | | | 527,712 | |
| | |
Robinsons Land Corp. | | | 526,315 | | | | 232,157 | |
| | |
San Miguel Corp. | | | 135,700 | | | | 361,797 | |
| | |
Semirara Mining & Power Corp. | | | 1,187,120 | | | | 340,760 | |
| | |
SM Investments Corp. | | | 101,960 | | | | 2,228,397 | |
| | |
SM Prime Holdings, Inc. | | | 1,912,250 | | | | 1,533,309 | |
| | |
Universal Robina Corp. | | | 498,530 | | | | 1,582,251 | |
| | |
| | | | | | | $ | 19,693,342 | |
|
| Poland — 2.5% | |
| | |
AmRest Holdings SE(1) | | | 68,905 | | | $ | 511,450 | |
| | |
Asseco Poland S.A. | | | 67,757 | | | | 1,235,895 | |
| | |
Bank Millennium S.A.(1) | | | 355,533 | | | | 311,505 | |
| | |
Bank Polska Kasa Opieki S.A.(1) | | | 28,994 | | | | 476,240 | |
| | |
Budimex S.A. | | | 22,305 | | | | 1,839,643 | |
| | |
CCC S.A.(1) | | | 27,466 | | | | 645,700 | |
| | |
CD Projekt S.A.(1)(2) | | | 18,361 | | | | 1,353,947 | |
| | |
Ciech S.A.(1) | | | 21,668 | | | | 187,367 | |
| | |
Cyfrowy Polsat S.A. | | | 79,099 | | | | 644,921 | |
| | |
Dino Polska S.A.(1)(3) | | | 15,869 | | | | 1,230,698 | |
| | |
Enea S.A.(1) | | | 145,490 | | | | 256,038 | |
| | |
Eurocash S.A.(1) | | | 82,861 | | | | 311,779 | |
| | |
Globe Trade Centre S.A.(1) | | | 139,840 | | | | 270,627 | |
| | |
Grupa Azoty S.A.(1) | | | 14,855 | | | | 109,576 | |
| | |
Grupa Lotos S.A. | | | 55,743 | | | | 618,841 | |
| | |
KGHM Polska Miedz S.A.(1) | | | 46,738 | | | | 2,302,341 | |
| | |
LPP S.A.(1) | | | 1,027 | | | | 2,286,317 | |
| | |
mBank S.A.(1) | | | 4,424 | | | | 213,419 | |
| | |
Orange Polska S.A.(1) | | | 240,332 | | | | 426,029 | |
| | |
PGE S.A.(1) | | | 122,861 | | | | 214,714 | |
| | |
Polski Koncern Naftowy ORLEN S.A. | | | 166,523 | | | | 2,578,005 | |
| | |
Polskie Gornictwo Naftowe i Gazownictwo S.A. | | | 891,505 | | | | 1,331,193 | |
| | |
Powszechna Kasa Oszczednosci Bank Polski S.A.(1) | | | 168,792 | | | | 1,302,972 | |
| | |
Powszechny Zaklad Ubezpieczen S.A.(1) | | | 48,144 | | | | 418,265 | |
| | |
Tauron Polska Energia S.A.(1) | | | 992,903 | | | | 725,702 | |
| | |
| | | | | | | $ | 21,803,184 | |
| | | | |
| | 15 | | See Notes to Financial Statements. |
Parametric
Tax-Managed Emerging Markets Fund
December 31, 2020
Portfolio of Investments (Unaudited) — continued
| | | | | | | | |
| Security | | Shares | | | Value | |
|
| Qatar — 1.1% | |
| | |
Al Meera Consumer Goods Co. | | | 27,717 | | | $ | 155,682 | |
| | |
Barwa Real Estate Co. | | | 735,909 | | | | 679,762 | |
| | |
Commercial Bank PSQC (The) | | | 183,085 | | | | 218,725 | |
| | |
Gulf International Services QSC(1) | | | 697,440 | | | | 324,852 | |
| | |
Gulf Warehousing Co. | | | 90,829 | | | | 125,952 | |
| | |
Industries Qatar | | | 655,447 | | | | 1,933,225 | |
| | |
Masraf Al Rayan QSC | | | 315,573 | | | | 387,917 | |
| | |
Medicare Group | | | 133,820 | | | | 321,629 | |
| | |
Ooredoo QPSC | | | 309,240 | | | | 630,266 | |
| | |
Qatar Electricity & Water Co. QSC | | | 73,498 | | | | 355,899 | |
| | |
Qatar Gas Transport Co., Ltd. | | | 1,461,437 | | | | 1,259,903 | |
| | |
Qatar Insurance Co. | | | 278,111 | | | | 178,078 | |
| | |
Qatar International Islamic Bank | | | 65,027 | | | | 159,550 | |
| | |
Qatar Islamic Bank | | | 106,122 | | | | 492,696 | |
| | |
Qatar National Bank QPSC | | | 343,273 | | | | 1,659,984 | |
| | |
Qatar National Cement Co. QSC | | | 133,280 | | | | 150,150 | |
| | |
United Development Co. QSC | | | 491,981 | | | | 220,619 | |
| | |
Vodafone Qatar QSC | | | 665,921 | | | | 242,156 | |
| | |
| | | | | | | $ | 9,497,045 | |
|
| Romania — 0.9% | |
| | |
Banca Transilvania S.A. | | | 1,580,646 | | | $ | 894,552 | |
| | |
BRD-Groupe Societe Generale S.A.(1) | | | 115,089 | | | | 430,060 | |
| | |
NEPI Rockcastle PLC | | | 488,356 | | | | 3,088,605 | |
| | |
OMV Petrom S.A. | | | 17,932,392 | | | | 1,635,522 | |
| | |
Societatea Energetica Electrica S.A. | | | 76,047 | | | | 240,834 | |
| | |
Societatea Nationala de Gaze Naturale ROMGAZ S.A. | | | 117,669 | | | | 830,223 | |
| | |
Societatea Nationala Nuclearelectrica S.A. | | | 48,496 | | | | 217,672 | |
| | |
Transelectrica S.A. | | | 41,350 | | | | 266,026 | |
| | |
Transgaz S.A. Medias | | | 6,563 | | | | 467,136 | |
| | |
| | | | | | | $ | 8,070,630 | |
|
| Russia — 4.8% | |
| | |
Aeroflot PJSC(1) | | | 91,240 | | | $ | 88,464 | |
| | |
Etalon Group PLC GDR(5) | | | 78,319 | | | | 135,408 | |
| | |
Evraz PLC | | | 192,475 | | | | 1,230,093 | |
| | |
Federal Grid Co. Unified Energy System PJSC | | | 267,560,600 | | | | 811,768 | |
| | |
Gazprom PJSC ADR | | | 591,852 | | | | 3,304,390 | |
| | |
Globaltrans Investment PLC GDR(5)(6) | | | 136,358 | | | | 813,963 | |
| | |
Globaltrans Investment PLC GDR(5)(6) | | | 77 | | | | 460 | |
| | |
Inter RAO UES PJSC | | | 26,529,001 | | | | 1,916,915 | |
| | |
Lukoil PJSC ADR | | | 36,448 | | | | 2,478,938 | |
| | |
Magnit PJSC | | | 38,428 | | | | 2,949,932 | |
| | |
Magnitogorsk Iron & Steel Works PJSC | | | 873,600 | | | | 662,139 | |
| | |
Mail.Ru Group, Ltd. GDR(1)(5) | | | 29,865 | | | | 782,689 | |
| | | | | | | | |
| Security | | Shares | | | Value | |
|
| Russia (continued) | |
| | |
MMC Norilsk Nickel PJSC ADR(6) | | | 100,172 | | | $ | 3,122,219 | |
| | |
MMC Norilsk Nickel PJSC ADR(6) | | | 2,948 | | | | 92,803 | |
| | |
Mobile TeleSystems PJSC | | | 215,893 | | | | 966,637 | |
| | |
Moscow Exchange MICEX-RTS PJSC | | | 127,251 | | | | 274,437 | |
| | |
Mosenergo PJSC | | | 12,772,962 | | | | 358,715 | |
| | |
Novatek PJSC GDR(5) | | | 10,758 | | | | 1,751,914 | |
| | |
Novolipetskiy Metallurgicheskiy Kombinat PAO GDR | | | 36,499 | | | | 1,009,863 | |
| | |
OGK-2 PJSC | | | 20,114,000 | | | | 199,433 | |
| | |
PhosAgro PJSC GDR(5) | | | 44,866 | | | | 611,855 | |
| | |
PIK Group PJSC | | | 113,450 | | | | 918,514 | |
| | |
Polymetal International PLC | | | 34,770 | | | | 800,413 | |
| | |
QIWI PLC ADR(2) | | | 13,700 | | | | 141,110 | |
| | |
Rosneft Oil Co. PJSC GDR(5) | | | 111,200 | | | | 627,017 | |
| | |
Rosseti PJSC | | | 19,631,873 | | | | 469,493 | |
| | |
Rostelecom PJSC(1) | | | 154,538 | | | | 202,843 | |
| | |
RusHydro PJSC | | | 30,272,952 | | | | 322,639 | |
| | |
Sberbank of Russia PJSC | | | 542,510 | | | | 1,989,251 | |
| | |
Severstal PAO GDR(5) | | | 44,425 | | | | 780,801 | |
| | |
Sistema PJSFC | | | 595,500 | | | | 232,792 | |
| | |
Sistema PJSFC GDR(5) | | | 33,906 | | | | 253,547 | |
| | |
Surgutneftegas PJSC ADR | | | 104,795 | | | | 484,101 | |
| | |
Surgutneftegas PJSC, PFC Shares | | | 954,217 | | | | 537,956 | |
| | |
Tatneft PJSC ADR | | | 26,223 | | | | 1,067,888 | |
| | |
Transneft PJSC, PFC Shares | | | 233 | | | | 444,658 | |
| | |
Unipro PJSC | | | 4,995,000 | | | | 189,245 | |
| | |
VEON, Ltd. ADR | | | 97,500 | | | | 147,225 | |
| | |
X5 Retail Group NV GDR(5)(6) | | | 92,747 | | | | 3,349,013 | |
| | |
X5 Retail Group NV GDR(5)(6) | | | 10,696 | | | | 386,339 | |
| | |
Yandex NV, Class A(1)(2) | | | 65,800 | | | | 4,578,364 | |
| | |
| | | | | | | $ | 41,486,244 | |
|
| Saudi Arabia — 4.4% | |
| | |
Abdullah Al Othaim Markets Co. | | | 20,923 | | | $ | 685,163 | |
| | |
Advanced Petrochemical Co. | | | 12,100 | | | | 216,211 | |
| | |
Al Babtain Power & Telecommunication Co. | | | 16,768 | | | | 141,500 | |
| | |
Al Hammadi Co. for Development and Investment(1) | | | 40,420 | | | | 311,986 | |
| | |
Al Rajhi Bank | | | 62,545 | | | | 1,227,655 | |
| | |
Alandalus Property Co. | | | 48,435 | | | | 273,181 | |
| | |
Aldrees Petroleum and Transport Services Co. | | | 53,394 | | | | 924,171 | |
| | |
Alinma Bank(1) | | | 81,556 | | | | 351,665 | |
| | |
Almarai Co. JSC | | | 111,419 | | | | 1,632,596 | |
| | |
Arabian Centres Co., Ltd. | | | 49,400 | | | | 330,196 | |
| | |
Arriyadh Development Co. | | | 70,726 | | | | 324,027 | |
| | |
Ayyan Investment Co.(1) | | | 51,400 | | | | 271,682 | |
| | |
Bank AlBilad | | | 24,288 | | | | 183,607 | |
| | |
Banque Saudi Fransi | | | 14,851 | | | | 125,161 | |
| | | | |
| | 16 | | See Notes to Financial Statements. |
Parametric
Tax-Managed Emerging Markets Fund
December 31, 2020
Portfolio of Investments (Unaudited) — continued
| | | | | | | | |
| Security | | Shares | | | Value | |
|
| Saudi Arabia (continued) | |
| | |
Batic Investments and Logistic Co.(1) | | | 28,296 | | | $ | 263,429 | |
| | |
Bawan Co. | | | 29,236 | | | | 193,551 | |
| | |
Dallah Healthcare Co. | | | 27,634 | | | | 356,324 | |
| | |
Dar Al Arkan Real Estate Development Co.(1) | | | 348,064 | | | | 801,632 | |
| | |
Dr Sulaiman Al Habib Medical Services Group Co. | | | 33,300 | | | | 966,077 | |
| | |
Dur Hospitality Co. | | | 59,246 | | | | 452,521 | |
| | |
Emaar Economic City(1) | | | 321,925 | | | | 790,092 | |
| | |
Etihad Etisalat Co.(1) | | | 109,257 | | | | 834,231 | |
| | |
Fawaz Abdulaziz Al Hokair & Co.(1) | | | 41,797 | | | | 243,099 | |
| | |
Herfy Food Services Co. | | | 12,431 | | | | 197,566 | |
| | |
Jarir Marketing Co. | | | 48,115 | | | | 2,224,498 | |
| | |
Leejam Sports Co. JSC | | | 13,120 | | | | 270,183 | |
| | |
Maharah Human Resources Co. | | | 11,400 | | | | 229,536 | |
| | |
Middle East Healthcare Co.(1) | | | 36,220 | | | | 338,778 | |
| | |
Mouwasat Medical Services Co. | | | 29,966 | | | | 1,101,823 | |
| | |
National Agriculture Development Co. (The)(1) | | | 21,203 | | | | 168,322 | |
| | |
National Commercial Bank | | | 48,831 | | | | 564,190 | |
| | |
National Gas & Industrialization Co. | | | 15,924 | | | | 129,475 | |
| | |
National Medical Care Co. | | | 37,993 | | | | 542,292 | |
| | |
Rabigh Refining & Petrochemical Co.(1) | | | 144,000 | | | | 530,773 | |
| | |
Riyad Bank | | | 68,732 | | | | 370,314 | |
| | |
Riyad REIT Fund | | | 60,724 | | | | 137,612 | |
| | |
Sahara International Petrochemical Co. | | | 69,037 | | | | 318,783 | |
| | |
Samba Financial Group | | | 42,224 | | | | 343,964 | |
| | |
Saudi Airlines Catering Co. | | | 25,239 | | | | 518,779 | |
| | |
Saudi Arabian Fertilizer Co. | | | 17,133 | | | | 368,180 | |
| | |
Saudi Arabian Mining Co.(1) | | | 32,944 | | | | 355,964 | |
| | |
Saudi Arabian Oil Co.(3) | | | 385,399 | | | | 3,596,670 | |
| | |
Saudi Automotive Services Co. | | | 34,664 | | | | 284,510 | |
| | |
Saudi Basic Industries Corp. | | | 80,149 | | | | 2,167,379 | |
| | |
Saudi Cement Co. | | | 15,800 | | | | 258,689 | |
| | |
Saudi Ceramic Co.(1) | | | 11,075 | | | | 141,720 | |
| | |
Saudi Chemical Co. Holding(1) | | | 44,268 | | | | 412,366 | |
| | |
Saudi Co. for Hardware CJSC | | | 14,700 | | | | 228,200 | |
| | |
Saudi Electricity Co. | | | 336,759 | | | | 1,913,314 | |
| | |
Saudi Ground Services Co.(1) | | | 47,512 | | | | 406,014 | |
| | |
Saudi Industrial Investment Group | | | 49,800 | | | | 363,977 | |
| | |
Saudi Industrial Services Co. | | | 15,031 | | | | 129,970 | |
| | |
Saudi Kayan Petrochemical Co.(1) | | | 56,284 | | | | 214,754 | |
| | |
Saudi Public Transport Co.(1) | | | 35,777 | | | | 170,929 | |
| | |
Saudi Real Estate Co.(1) | | | 60,549 | | | | 243,722 | |
| | |
Saudi Research & Marketing Group(1) | | | 12,391 | | | | 259,493 | |
| | |
Saudi Telecom Co. | | | 119,820 | | | | 3,387,333 | |
| | |
Saudia Dairy & Foodstuff Co. | | | 4,822 | | | | 225,168 | |
| | |
Savola Group (The) | | | 112,367 | | | | 1,273,639 | |
| | |
Seera Group Holding(1) | | | 121,028 | | | | 611,546 | |
| | | | | | | | |
| Security | | Shares | | | Value | |
|
| Saudi Arabia (continued) | |
| | |
United Electronics Co. | | | 30,155 | | | $ | 695,201 | |
| | |
United International Transportation Co. | | | 24,521 | | | | 248,263 | |
| | |
Yanbu National Petrochemical Co. | | | 21,617 | | | | 368,153 | |
| | |
| | | | | | | $ | 38,211,799 | |
|
| Slovenia — 0.6% | |
| | |
Cinkarna Celje DD | | | 574 | | | $ | 124,713 | |
| | |
KRKA DD | | | 33,464 | | | | 3,739,932 | |
| | |
Luka Koper | | | 8,004 | | | | 180,012 | |
| | |
Petrol | | | 772 | | | | 305,628 | |
| | |
Pozavarovalnica Sava DD(1) | | | 21,534 | | | | 486,791 | |
| | |
Zavarovalnica Triglav DD(1) | | | 6,869 | | | | 251,345 | |
| | |
| | | | | | | $ | 5,088,421 | |
|
| South Africa — 4.5% | |
| | |
Anglo American Platinum, Ltd. | | | 5,100 | | | $ | 501,849 | |
| | |
AngloGold Ashanti, Ltd. | | | 35,047 | | | | 807,779 | |
| | |
AngloGold Ashanti, Ltd. ADR | | | 5,299 | | | | 119,863 | |
| | |
Aspen Pharmacare Holdings, Ltd.(1) | | | 224,102 | | | | 1,916,216 | |
| | |
AVI, Ltd. | | | 121,529 | | | | 606,502 | |
| | |
Bid Corp., Ltd. | | | 70,947 | | | | 1,274,951 | |
| | |
Bidvest Group, Ltd. (The) | | | 297,624 | | | | 3,186,759 | |
| | |
Clicks Group, Ltd. | | | 60,244 | | | | 1,034,668 | |
| | |
DataTec, Ltd.(1) | | | 131,630 | | | | 220,008 | |
| | |
Discovery, Ltd. | | | 41,702 | | | | 435,964 | |
| | |
Equites Property Fund, Ltd. | | | 201,368 | | | | 238,480 | |
| | |
Exxaro Resources, Ltd. | | | 36,655 | | | | 347,796 | |
| | |
FirstRand, Ltd. | | | 405,123 | | | | 1,411,614 | |
| | |
Fortress REIT, Ltd., Class A | | | 808,158 | | | | 749,374 | |
| | |
Gold Fields, Ltd. | | | 81,557 | | | | 757,101 | |
| | |
Growthpoint Properties, Ltd. | | | 784,159 | | | | 671,737 | |
| | |
Hyprop Investments, Ltd.(1) | | | 193,251 | | | | 388,935 | |
| | |
Impala Platinum Holdings, Ltd. | | | 99,325 | | | | 1,367,120 | |
| | |
Imperial Logistics, Ltd. | | | 96,084 | | | | 243,889 | |
| | |
JSE, Ltd. | | | 21,700 | | | | 164,882 | |
| | |
Kumba Iron Ore, Ltd. | | | 7,137 | | | | 303,605 | |
| | |
Life Healthcare Group Holdings, Ltd.(1) | | | 374,426 | | | | 427,463 | |
| | |
Mediclinic International PLC | | | 148,487 | | | | 576,230 | |
| | |
MiX Telematics, Ltd. ADR(2) | | | 11,300 | | | | 142,267 | |
| | |
Momentum Metropolitan Holdings | | | 137,550 | | | | 147,541 | |
| | |
Mr Price Group, Ltd. | | | 16,841 | | | | 195,441 | |
| | |
MTN Group, Ltd.(2) | | | 326,923 | | | | 1,349,268 | |
| | |
MultiChoice Group, Ltd. | | | 222,122 | | | | 2,027,603 | |
| | |
Naspers, Ltd., Class N | | | 31,431 | | | | 6,436,270 | |
| | |
Netcare, Ltd. | | | 141,074 | | | | 119,547 | |
| | | | |
| | 17 | | See Notes to Financial Statements. |
Parametric
Tax-Managed Emerging Markets Fund
December 31, 2020
Portfolio of Investments (Unaudited) — continued
| | | | | | | | |
| Security | | Shares | | | Value | |
|
| South Africa (continued) | |
| | |
Northam Platinum, Ltd.(1) | | | 36,209 | | | $ | 517,977 | |
| | |
Pick’n Pay Stores, Ltd. | | | 105,331 | | | | 359,445 | |
| | |
PSG Group, Ltd. | | | 114,733 | | | | 470,753 | |
| | |
Redefine Properties, Ltd. | | | 3,215,829 | | | | 736,090 | |
| | |
Resilient REIT, Ltd. | | | 127,790 | | | | 369,055 | |
| | |
Reunert, Ltd. | | | 83,241 | | | | 204,196 | |
| | |
Sanlam, Ltd. | | | 47,771 | | | | 190,672 | |
| | |
Santam, Ltd. | | | 14,928 | | | | 258,022 | |
| | |
Sasol, Ltd.(1) | | | 83,836 | | | | 762,500 | |
| | |
Shoprite Holdings, Ltd. | | | 141,928 | | | | 1,349,789 | |
| | |
Sibanye Stillwater, Ltd. | | | 294,669 | | | | 1,187,609 | |
| | |
SPAR Group, Ltd. (The) | | | 55,560 | | | | 715,434 | |
| | |
Standard Bank Group, Ltd. | | | 30,572 | | | | 264,783 | |
| | |
Telkom S.A. SOC, Ltd. | | | 209,252 | | | | 437,214 | |
| | |
Tiger Brands, Ltd. | | | 40,729 | | | | 578,972 | |
| | |
Vodacom Group, Ltd. | | | 224,500 | | | | 1,896,139 | |
| | |
Vukile Property Fund, Ltd. | | | 351,912 | | | | 191,256 | |
| | |
Wilson Bayly Holmes-Ovcon, Ltd.(1) | | | 43,265 | | | | 266,976 | |
| | |
Woolworths Holdings, Ltd. | | | 68,586 | | | | 184,669 | |
| | |
| | | | | | | $ | 39,112,273 | |
|
| South Korea — 5.0% | |
| | |
Alteogen, Inc.(1) | | | 1,600 | | | $ | 265,132 | |
| | |
AMOREPACIFIC Corp. | | | 3,554 | | | | 674,837 | |
| | |
AMOREPACIFIC Group | | | 5,071 | | | | 256,579 | |
| | |
Bukwang Pharmaceutical Co., Ltd. | | | 8,877 | | | | 230,123 | |
| | |
Celltrion Healthcare Co., Ltd.(1) | | | 5,343 | | | | 803,427 | |
| | |
Celltrion Pharm, Inc.(1) | | | 1,986 | | | | 436,921 | |
| | |
Celltrion, Inc.(1) | | | 5,698 | | | | 1,886,024 | |
| | |
Chabiotech Co., Ltd.(1) | | | 12,772 | | | | 236,126 | |
| | |
Cheil Worldwide, Inc. | | | 11,267 | | | | 214,062 | |
| | |
CJ CheilJedang Corp. | | | 810 | | | | 284,489 | |
| | |
CJ Corp. | | | 2,998 | | | | 254,510 | |
| | |
Coway Co., Ltd.(1) | | | 3,444 | | | | 230,800 | |
| | |
Daelim Industrial Co., Ltd. | | | 4,257 | | | | 328,135 | |
| | |
Daewoo Industrial Development Co., Ltd.(1) | | | 3,501 | | | | 13,391 | |
| | |
Dong-A ST Co., Ltd. | | | 3,213 | | | | 262,171 | |
| | |
E-MART, Inc. | | | 1,921 | | | | 268,252 | |
| | |
Genexine Inc.(1) | | | 2,500 | | | | 286,978 | |
| | |
GS Engineering & Construction Corp. | | | 9,470 | | | | 330,045 | |
| | |
GS Holdings Corp. | | | 7,122 | | | | 246,416 | |
| | |
Hana Financial Group, Inc. | | | 6,353 | | | | 202,352 | |
| | |
Hankook Tire and Technology Co., Ltd. | | | 9,517 | | | | 345,755 | |
| | |
Hanmi Pharm Co., Ltd. | | | 1,284 | | | | 433,891 | |
| | |
Hanmi Science Co., Ltd. | | | 3,060 | | | | 214,691 | |
| | |
Hanwha Corp. | | | 10,423 | | | | 272,200 | |
| | | | | | | | |
| Security | | Shares | | | Value | |
|
| South Korea (continued) | |
| | |
Hanwha Solutions Corp. | | | 8,434 | | | $ | 372,850 | |
| | |
HLB, Inc.(1) | | | 2,300 | | | | 196,143 | |
| | |
Hotel Shilla Co., Ltd. | | | 5,077 | | | | 385,165 | |
| | |
Hugel, Inc.(1) | | | 1,400 | | | | 242,208 | |
| | |
Hyosung TNC Co., Ltd. | | | 2,316 | | | | 450,774 | |
| | |
Hyundai Engineering & Construction Co., Ltd. | | | 7,403 | | | | 255,630 | |
| | |
Hyundai Glovis Co., Ltd. | | | 2,728 | | | | 462,892 | |
| | |
Hyundai Mobis Co., Ltd. | | | 2,818 | | | | 663,261 | |
| | |
Hyundai Motor Co.(1) | | | 7,190 | | | | 1,274,449 | |
| | |
Ilyang Pharmaceutical Co., Ltd. | | | 3,500 | | | | 212,399 | |
| | |
Kangwon Land, Inc. | | | 9,384 | | | | 203,330 | |
| | |
KB Financial Group, Inc.(1) | | | 4,943 | | | | 196,321 | |
| | |
Kia Motors Corp. | | | 15,362 | | | | 885,108 | |
| | |
KIWOOM Securities Co., Ltd. | | | 2,085 | | | | 243,570 | |
| | |
KMW Co., Ltd.(1) | | | 3,700 | | | | 275,081 | |
| | |
Korea Shipbuilding & Offshore Engineering Co., Ltd.(1) | | | 1,784 | | | | 178,671 | |
| | |
Korea Zinc Co., Ltd. | | | 995 | | | | 368,468 | |
| | |
Korean Air Lines Co., Ltd.(1) | | | 6,176 | | | | 155,015 | |
| | |
KT&G Corp.(1) | | | 9,317 | | | | 713,362 | |
| | |
Kumho Petrochemical Co., Ltd. | | | 2,530 | | | | 338,492 | |
| | |
LG Chem, Ltd. | | | 1,592 | | | | 1,210,583 | |
| | |
LG Corp. | | | 5,822 | | | | 469,794 | |
| | |
LG Display Co., Ltd.(1) | | | 15,100 | | | | 258,106 | |
| | |
LG Electronics, Inc.(1) | | | 5,219 | | | | 649,878 | |
| | |
LG Household & Health Care, Ltd. | | | 582 | | | | 868,649 | |
| | |
LG Innotek Co., Ltd. | | | 1,400 | | | | 235,817 | |
| | |
LG Uplus Corp. | | | 22,484 | | | | 243,465 | |
| | |
Lotte Chemical Corp. | | | 1,508 | | | | 383,970 | |
| | |
LS Corp. | | | 3,961 | | | | 260,983 | |
| | |
LS Electric Co., Ltd. | | | 4,500 | | | | 261,957 | |
| | |
MedPacto, Inc.(1) | | | 2,253 | | | | 244,730 | |
| | |
Medytox, Inc. | | | 1,518 | | | | 245,128 | |
| | |
Mezzion Pharma Co., Ltd.(1) | | | 1,300 | | | | 210,750 | |
| | |
Naver Corp. | | | 5,654 | | | | 1,524,143 | |
| | |
NCsoft Corp. | | | 883 | | | | 758,101 | |
| | |
Nong Shim Co., Ltd. | | | 480 | | | | 132,691 | |
| | |
Orion Corp. of Republic of Korea | | | 1,101 | | | | 125,737 | |
| | |
Pharmicell Co., Ltd.(1) | | | 12,700 | | | | 202,685 | |
| | |
POSCO | | | 3,029 | | | | 756,885 | |
| | |
S-Oil Corp. | | | 8,414 | | | | 536,442 | |
| | |
S1 Corp. | | | 2,867 | | | | 224,488 | |
| | |
Samsung Biologics Co., Ltd.(1)(3) | | | 1,264 | | | | 962,369 | |
| | |
Samsung C&T Corp. | | | 5,241 | | | | 667,148 | |
| | |
Samsung Electro-Mechanics Co., Ltd. | | | 2,349 | | | | 385,760 | |
| | |
Samsung Electronics Co., Ltd. | | | 116,024 | | | | 8,664,147 | |
| | |
Samsung SDI Co., Ltd.(1) | | | 1,221 | | | | 707,628 | |
| | | | |
| | 18 | | See Notes to Financial Statements. |
Parametric
Tax-Managed Emerging Markets Fund
December 31, 2020
Portfolio of Investments (Unaudited) — continued
| | | | | | | | |
| Security | | Shares | | | Value | |
|
| South Korea (continued) | |
| | |
Samsung SDS Co., Ltd. | | | 1,271 | | | $ | 209,199 | |
| | |
Seegene, Inc. | | | 1,939 | | | | 345,077 | |
| | |
Shin Poong Pharmaceutical Co., Ltd.(1) | | | 2,300 | | | | 262,584 | |
| | |
Shinhan Financial Group Co., Ltd.(1) | | | 5,915 | | | | 175,516 | |
| | |
Shinsegae, Inc. | | | 779 | | | | 172,062 | |
| | |
SK Chemicals Co., Ltd. | | | 770 | | | | 279,072 | |
| | |
SK Holdings Co., Ltd. | | | 1,665 | | | | 369,396 | |
| | |
SK Hynix, Inc.(1) | | | 11,063 | | | | 1,208,394 | |
| | |
SK Innovation Co., Ltd. | | | 6,751 | | | | 1,184,128 | |
| | |
SK Telecom Co., Ltd. | | | 2,557 | | | | 561,940 | |
| | |
Yuhan Corp. | | | 3,178 | | | | 220,055 | |
| | |
Zyle Motor Sales Corp.(1) | | | 4,895 | | | | 5,407 | |
| | |
| | | | | | | $ | 43,235,360 | |
|
| Sri Lanka — 0.6% | |
| | |
Access Engineering PLC | | | 1,978,107 | | | $ | 263,625 | |
| | |
Ceylon Tobacco Co. PLC | | | 96,609 | | | | 536,020 | |
| | |
Chevron Lubricants Lanka PLC | | | 216,091 | | | | 125,982 | |
| | |
Commercial Bank of Ceylon PLC | | | 602,056 | | | | 262,635 | |
| | |
Dialog Axiata PLC | | | 10,448,265 | | | | 701,025 | |
| | |
Hatton National Bank PLC | | | 284,990 | | | | 194,552 | |
| | |
Hemas Holdings PLC | | | 342,755 | | | | 184,988 | |
| | |
John Keells Holdings PLC | | | 1,826,099 | | | | 1,474,957 | |
| | |
National Development Bank PLC | | | 493,898 | | | | 208,035 | |
| | |
Nations Trust Bank PLC | | | 295,833 | | | | 95,961 | |
| | |
Nestle Lanka PLC | | | 15,593 | | | | 107,267 | |
| | |
Sampath Bank PLC | | | 308,671 | | | | 230,211 | |
| | |
Teejay Lanka PLC | | | 1,870,121 | | | | 384,323 | |
| | |
| | | | | | | $ | 4,769,581 | |
|
| Taiwan — 4.9% | |
| | |
Adimmune Corp.(1) | | | 79,000 | | | $ | 156,928 | |
| | |
Advantech Co., Ltd. | | | 15,357 | | | | 191,707 | |
| | |
ASE Technology Holding Co., Ltd. | | | 133,247 | | | | 386,526 | |
| | |
Asia Cement Corp. | | | 126,967 | | | | 195,550 | |
| | |
Asustek Computer, Inc. | | | 18,174 | | | | 162,307 | |
| | |
AU Optronics Corp.(1) | | | 597,000 | | | | 298,706 | |
| | |
Catcher Technology Co., Ltd. | | | 27,100 | | | | 199,267 | |
| | |
Cathay Financial Holding Co., Ltd. | | | 142,351 | | | | 214,349 | |
| | |
Center Laboratories, Inc. | | | 81,709 | | | | 201,342 | |
| | |
Cheng Shin Rubber Industry Co., Ltd. | | | 394,010 | | | | 618,631 | |
| | |
China Airlines, Ltd.(1) | | | 452,963 | | | | 194,754 | |
| | |
China Petrochemical Development Corp. | | | 691,199 | | | | 287,284 | |
| | |
China Steel Corp. | | | 579,815 | | | | 511,152 | |
| | |
Chunghwa Telecom Co., Ltd. | | | 510,780 | | | | 1,981,494 | |
| | | | | | | | |
| Security | | Shares | | | Value | |
|
| Taiwan (continued) | |
| | |
Clevo Co. | | | 107,579 | | | $ | 115,418 | |
| | |
Delta Electronics, Inc. | | | 46,356 | | | | 434,724 | |
| | |
E.Sun Financial Holding Co., Ltd. | | | 240,859 | | | | 219,225 | |
| | |
EVA Airways Corp. | | | 442,334 | | | | 207,610 | |
| | |
Evergreen Marine Corp.(1) | | | 1,295,283 | | | | 1,880,706 | |
| | |
Far Eastern Department Stores, Ltd. | | | 288,642 | | | | 246,791 | |
| | |
Far Eastern New Century Corp. | | | 688,313 | | | | 710,398 | |
| | |
Far EasTone Telecommunications Co., Ltd. | | | 188,776 | | | | 411,552 | |
| | |
Feng Hsin Steel Co., Ltd. | | | 116,000 | | | | 293,744 | |
| | |
First Financial Holding Co., Ltd. | | | 176,565 | | | | 134,360 | |
| | |
Formosa Chemicals & Fibre Corp. | | | 295,755 | | | | 892,397 | |
| | |
Formosa Petrochemical Corp. | | | 262,153 | | | | 932,372 | |
| | |
Formosa Plastics Corp. | | | 220,959 | | | | 758,934 | |
| | |
Formosa Taffeta Co., Ltd. | | | 364,000 | | | | 402,776 | |
| | |
Fubon Financial Holding Co., Ltd. | | | 121,439 | | | | 202,239 | |
| | |
Giant Manufacturing Co., Ltd. | | | 69,531 | | | | 681,312 | |
| | |
Globalwafers Co., Ltd. | | | 14,000 | | | | 353,665 | |
| | |
Great Wall Enterprise Co., Ltd. | | | 211,329 | | | | 382,418 | |
| | |
Highwealth Construction Corp. | | | 112,811 | | | | 184,186 | |
| | |
Hiwin Technologies Corp. | | | 73,487 | | | | 1,008,869 | |
| | |
Hon Hai Precision Industry Co., Ltd. | | | 264,806 | | | | 868,284 | |
| | |
Hotai Motor Co., Ltd. | | | 42,000 | | | | 963,831 | |
| | |
Hua Nan Financial Holdings Co., Ltd. | | | 198 | | | | 129 | |
| | |
Innolux Corp. | | | 402,000 | | | | 202,316 | |
| | |
Largan Precision Co., Ltd. | | | 2,042 | | | | 232,711 | |
| | |
Lite-On Technology Corp. | | | 89,048 | | | | 157,992 | |
| | |
MediaTek, Inc. | | | 31,664 | | | | 844,393 | |
| | |
Medigen Vaccine Biologics Corp.(1) | | | 52,925 | | | | 192,648 | |
| | |
Mega Financial Holding Co., Ltd. | | | 178,688 | | | | 189,657 | |
| | |
Merida Industry Co., Ltd. | | | 53,907 | | | | 452,998 | |
| | |
Micro-Star International Co., Ltd. | | | 20,000 | | | | 94,536 | |
| | |
Nan Kang Rubber Tire Co., Ltd. | | | 100,819 | | | | 150,815 | |
| | |
Nan Ya Plastics Corp. | | | 263,378 | | | | 674,748 | |
| | |
Nanya Technology Corp. | | | 51,165 | | | | 158,627 | |
| | |
Novatek Microelectronics Corp., Ltd. | | | 15,479 | | | | 203,677 | |
| | |
OBI Pharma, Inc.(1) | | | 42,000 | | | | 207,686 | |
| | |
Parade Technologies, Ltd. | | | 5,000 | | | | 197,957 | |
| | |
Pegatron Corp. | | | 81,486 | | | | 195,630 | |
| | |
Pharmally International Holding Co., Ltd.(1)(4) | | | 38,000 | | | | 38,273 | |
| | |
Pou Chen Corp. | | | 501,309 | | | | 560,819 | |
| | |
President Chain Store Corp. | | | 85,716 | | | | 813,451 | |
| | |
Quanta Computer, Inc. | | | 66,000 | | | | 190,438 | |
| | |
Radiant Opto-Electronics Corp. | | | 41,350 | | | | 168,414 | |
| | |
Realtek Semiconductor Corp. | | | 27,542 | | | | 383,700 | |
| | |
Ruentex Development Co., Ltd. | | | 124,114 | | | | 180,780 | |
| | |
Ruentex Industries, Ltd. | | | 83,016 | | | | 206,123 | |
| | | | |
| | 19 | | See Notes to Financial Statements. |
Parametric
Tax-Managed Emerging Markets Fund
December 31, 2020
Portfolio of Investments (Unaudited) — continued
| | | | | | | | |
| Security | | Shares | | | Value | |
|
| Taiwan (continued) | |
| | |
Sanyang Motor Co., Ltd. | | | 479,000 | | | $ | 609,179 | |
| | |
Savior Lifetec Corp.(1) | | | 147,000 | | | | 181,864 | |
| | |
ScinoPharm Taiwan, Ltd. | | | 157,000 | | | | 161,615 | |
| | |
Simplo Technology Co., Ltd. | | | 12,652 | | | | 157,974 | |
| | |
St. Shine Optical Co., Ltd. | | | 17,000 | | | | 169,698 | |
| | |
Synnex Technology International Corp. | | | 117,569 | | | | 196,986 | |
| | |
TaiMed Biologics, Inc.(1) | | | 56,000 | | | | 168,144 | |
| | |
Tainan Spinning Co., Ltd. | | | 734,407 | | | | 392,640 | |
| | |
Taishin Financial Holding Co., Ltd. | | | 282,671 | | | | 133,510 | |
| | |
Taiwan Cement Corp. | | | 370,565 | | | | 570,519 | |
| | |
Taiwan Mobile Co., Ltd. | | | 236,858 | | | | 833,720 | |
| | |
Taiwan Semiconductor Manufacturing Co., Ltd. | | | 413,747 | | | | 7,827,043 | |
| | |
Taiwan Tea Corp.(1) | | | 382,711 | | | | 243,965 | |
| | |
Teco Electric & Machinery Co., Ltd. | | | 604,000 | | | | 595,232 | |
| | |
Tong Yang Industry Co., Ltd. | | | 95,199 | | | | 132,418 | |
| | |
TTY Biopharm Co., Ltd. | | | 167,780 | | | | 409,744 | |
| | |
U-Ming Marine Transport Corp. | | | 202,000 | | | | 265,733 | |
| | |
Uni-President Enterprises Corp. | | | 719,588 | | | | 1,730,735 | |
| | |
United Microelectronics Corp. | | | 252,323 | | | | 424,347 | |
| | |
Vanguard International Semiconductor Corp. | | | 54,544 | | | | 225,678 | |
| | |
Walsin Lihwa Corp. | | | 1,085,980 | | | | 747,720 | |
| | |
Wan Hai Lines, Ltd. | | | 339,570 | | | | 640,785 | |
| | |
Win Semiconductors Corp. | | | 18,000 | | | | 222,181 | |
| | |
Yageo Corp. | | | 14,362 | | | | 265,837 | |
| | |
Yieh Phui Enterprise Co., Ltd.(1) | | | 447,348 | | | | 216,858 | |
| | |
Yuanta Financial Holding Co., Ltd. | | | 323,694 | | | | 237,135 | |
| | |
YungShin Global Holding Corp. | | | 119,000 | | | | 189,502 | |
| | |
Zhen Ding Technology Holding, Ltd. | | | 42,000 | | | | 170,913 | |
| | |
| | | | | | | $ | 42,706,001 | |
|
| Thailand — 5.2% | |
| | |
Advanced Info Service PCL(7) | | | 221,200 | | | $ | 1,300,163 | |
| | |
Airports of Thailand PCL(7) | | | 1,043,700 | | | | 2,165,806 | |
| | |
Amata Corp. PCL(7) | | | 203,300 | | | | 110,332 | |
| | |
AP Thailand PCL(7) | | | 1,506,660 | | | | 363,926 | |
| | |
Bangkok Bank PCL(7) | | | 64,400 | | | | 254,644 | |
| | |
Bangkok Chain Hospital PCL(7) | | | 1,548,300 | | | | 702,833 | |
| | |
Bangkok Dusit Medical Services PCL(7) | | | 4,109,900 | | | | 2,846,176 | |
| | |
Bangkok Expressway & Metro PCL(7) | | | 2,095,654 | | | | 580,022 | |
| | |
Banpu PCL(7) | | | 695,700 | | | | 255,602 | |
| | |
Berli Jucker PCL(7) | | | 219,700 | | | | 254,498 | |
| | |
BTS Group Holdings PCL(7) | | | 1,650,200 | | | | 512,359 | |
| | |
Bumrungrad Hospital PCL(7) | | | 371,500 | | | | 1,487,128 | |
| | |
Central Pattana PCL(7) | | | 527,700 | | | | 840,198 | |
| | |
Central Retail Corp. PCL(1)(7) | | | 846,100 | | | | 869,426 | |
| | |
CH. Karnchang PCL(1)(7) | | | 194,800 | | | | 107,868 | |
| | | | | | | | |
| Security | | Shares | | | Value | |
|
| Thailand (continued) | |
| | |
Charoen Pokphand Foods PCL(7) | | | 487,600 | | | $ | 435,338 | |
| | |
Chularat Hospital PCL(7) | | | 5,372,700 | | | | 441,150 | |
| | |
CP ALL PCL(1)(7) | | | 474,700 | | | | 922,565 | |
| | |
Delta Electronics (Thailand) PCL(7) | | | 525,600 | | | | 8,514,979 | |
| | |
Electricity Generating PCL(7) | | | 33,200 | | | | 213,100 | |
| | |
Energy Absolute PCL(7) | | | 295,900 | | | | 484,118 | |
| | |
Global Power Synergy PCL(7) | | | 116,000 | | | | 284,852 | |
| | |
Gulf Energy Development PCL(7) | | | 927,900 | | | | 1,059,149 | |
| | |
Hana Microelectronics PCL(7) | | | 1,138,400 | | | | 1,509,929 | |
| | |
Home Product Center PCL(7) | | | 1,565,760 | | | | 713,267 | |
| | |
Indorama Ventures PCL(7) | | | 540,871 | | | | 667,803 | |
| | |
Intouch Holdings PCL(7) | | | 233,071 | | | | 437,344 | |
| | |
Jasmine International PCL(7) | | | 2,504,800 | | | | 266,076 | |
| | |
Kasikornbank PCL(7) | | | 117,400 | | | | 442,657 | |
| | |
Kiatnakin Phatra Bank PCL(7) | | | 144,700 | | | | 249,787 | |
| | |
Krung Thai Bank PCL(7) | | | 1,007,025 | | | | 372,806 | |
| | |
Land & Houses PCL(7) | | | 1,957,300 | | | | 519,719 | |
| | |
Mega Lifesciences PCL(7) | | | 487,100 | | | | 579,418 | |
| | |
Minor International PCL(1)(7) | | | 2,887,336 | | | | 2,478,228 | |
| | |
PTT Exploration & Production PCL(7) | | | 391,616 | | | | 1,284,283 | |
| | |
PTT Global Chemical PCL(7) | | | 431,705 | | | | 843,282 | |
| | |
PTT PCL(7) | | | 1,998,600 | | | | 2,837,441 | |
| | |
Quality House PCL(7) | | | 3,330,683 | | | | 257,980 | |
| | |
Ratch Group PCL(7) | | | 101,600 | | | | 179,432 | |
| | |
Siam Cement PCL(7) | | | 110,911 | | | | 1,399,140 | |
| | |
Siam Commercial Bank PCL(7) | | | 150,900 | | | | 440,367 | |
| | |
Siam Global House PCL(7) | | | 477,600 | | | | 270,596 | |
| | |
Sino-Thai Engineering & Construction PCL(7) | | | 241,100 | | | | 102,111 | |
| | |
Star Petroleum Refining PCL(7) | | | 881,700 | | | | 236,920 | |
| | |
Supalai PCL(7) | | | 473,400 | | | | 323,766 | |
| | |
SVI PCL(7) | | | 1,450,800 | | | | 207,112 | |
| | |
Thai Beverage PCL(7) | | | 1,328,700 | | | | 739,677 | |
| | |
Thai Oil PCL(7) | | | 175,500 | | | | 304,348 | |
| | |
Thai Union Group PCL(7) | | | 480,092 | | | | 218,100 | |
| | |
TOA Paint Thailand PCL(7) | | | 174,300 | | | | 195,032 | |
| | |
Total Access Communication PCL(7) | | | 96,800 | | | | 107,345 | |
| | |
TPI Polene PCL(7) | | | 2,914,200 | | | | 178,878 | |
| | |
True Corp. PCL(7) | | | 5,185,982 | | | | 595,241 | |
| | |
TTW PCL(7) | | | 544,700 | | | | 225,526 | |
| | |
VGI PCL(7) | | | 1,361,600 | | | | 302,493 | |
| | |
WHA Corp. PCL(7) | | | 4,338,900 | | | | 439,499 | |
| | |
| | | | | | | $ | 44,931,835 | |
|
| Tunisia — 0.6% | |
| | |
Attijari Bank(1) | | | 28,110 | | | $ | 289,865 | |
| | |
Banque de Tunisie(1) | | | 118,510 | | | | 299,240 | |
| | | | |
| | 20 | | See Notes to Financial Statements. |
Parametric
Tax-Managed Emerging Markets Fund
December 31, 2020
Portfolio of Investments (Unaudited) — continued
| | | | | | | | |
| Security | | Shares | | | Value | |
|
| Tunisia (continued) | |
| | |
Banque Internationale Arabe de Tunisie(1) | | | 18,636 | | | $ | 651,949 | |
| | |
Banque Nationale Agricole(1) | | | 25,291 | | | | 82,976 | |
| | |
Carthage Cement(1) | | | 469,841 | | | | 331,778 | |
| | |
Euro Cycles S.A. | | | 38,028 | | | | 361,840 | |
| | |
Poulina Group | | | 112,565 | | | | 433,596 | |
| | |
Societe d’Articles Hygieniques S.A. | | | 120,815 | | | | 551,515 | |
| | |
Societe Frigorifique et Brasserie de Tunis S.A. | | | 190,193 | | | | 1,341,641 | |
| | |
Telnet Holding | | | 121,453 | | | | 379,755 | |
| | |
Union Internationale de Banques S.A.(1) | | | 42,491 | | | | 270,460 | |
| | |
| | | | | | | $ | 4,994,615 | |
|
| Turkey — 2.4% | |
| | |
Akbank T.A.S.(1) | | | 630,171 | | | $ | 584,484 | |
| | |
Aksa Akrilik Kimya Sanayii AS | | | 99,477 | | | | 195,291 | |
| | |
Anadolu Efes Biracilik ve Malt Sanayii AS | | | 77,000 | | | | 239,876 | |
| | |
Arcelik AS(1) | | | 254,719 | | | | 1,043,504 | |
| | |
Aselsan Elektronik Sanayi Ve Ticaret AS | | | 155,921 | | | | 382,291 | |
| | |
Aygaz AS | | | 124,388 | | | | 245,524 | |
| | |
Bera Holding AS(1) | | | 79,200 | | | | 215,730 | |
| | |
BIM Birlesik Magazalar AS | | | 140,277 | | | | 1,418,832 | |
| | |
Coca-Cola Icecek AS(1) | | | 32,819 | | | | 290,226 | |
| | |
Dogan Sirketler Grubu Holding AS | | | 250,600 | | | | 103,245 | |
| | |
EGE Endustri VE Ticaret AS | | | 1,386 | | | | 329,090 | |
| | |
Emlak Konut Gayrimenkul Yatirim Ortakligi AS | | | 1,653,095 | | | | 475,140 | |
| | |
Enerjisa Enerji AS(3) | | | 148,893 | | | | 250,672 | |
| | |
Enka Insaat ve Sanayi AS | | | 555,226 | | | | 551,134 | |
| | |
Eregli Demir ve Celik Fabrikalari TAS | | | 426,593 | | | | 856,116 | |
| | |
Ford Otomotiv Sanayi AS | | | 57,565 | | | | 976,746 | |
| | |
Haci Omer Sabanci Holding AS | | | 188,084 | | | | 289,705 | |
| | |
Ipek Dogal Enerji Kaynaklari Arastirma Ve Uretim AS(1) | | | 241,900 | | | | 427,022 | |
| | |
Is Gayrimenkul Yatirim Ortakligi AS(1) | | | 1,173,115 | | | | 400,510 | |
| | |
Kardemir Karabuk Demir Celik Sanayi ve Ticaret AS, Class D | | | 383,016 | | | | 296,606 | |
| | |
KOC Holding AS | | | 286,812 | | | | 813,953 | |
| | |
Koza Altin Isletmeleri AS(1) | | | 28,400 | | | | 369,246 | |
| | |
Koza Anadolu Metal Madencilik Isletmeleri AS(1) | | | 124,600 | | | | 259,483 | |
| | |
Logo Yazilim Sanayi Ve Ticaret AS(1) | | | 15,901 | | | | 268,584 | |
| | |
Mavi Giyim Sanayi Ve Ticaret AS, Class B(1)(3) | | | 57,200 | | | | 401,516 | |
| | |
Migros Ticaret AS(1) | | | 33,597 | | | | 193,596 | |
| | |
MLP Saglik Hizmetleri AS(1)(3) | | | 225,692 | | | | 600,972 | |
| | |
Petkim Petrokimya Holding AS(1) | | | 631,618 | | | | 422,584 | |
| | |
Sasa Polyester Sanayi AS(1) | | | 96,200 | | | | 262,279 | |
| | |
Selcuk Ecza Deposu Ticaret ve Sanayi AS | | | 243,000 | | | | 447,052 | |
| | |
TAV Havalimanlari Holding AS | | | 59,867 | | | | 171,337 | |
| | |
Tekfen Holding AS | | | 122,106 | | | | 270,973 | |
| | |
Tofas Turk Otomobil Fabrikasi AS | | | 105,830 | | | | 483,168 | |
| | |
Turk Hava Yollari AO(1) | | | 185,117 | | | | 321,627 | |
| | | | | | | | |
| Security | | Shares | | | Value | |
|
| Turkey (continued) | |
| | |
Turk Telekomunikasyon AS | | | 323,392 | | | $ | 370,391 | |
| | |
Turkcell Iletisim Hizmetleri AS | | | 885,893 | | | | 1,913,768 | |
| | |
Turkiye Petrol Rafinerileri AS(1) | | | 197,685 | | | | 2,869,328 | |
| | |
Turkiye Sise ve Cam Fabrikalari AS | | | 405,026 | | | | 398,526 | |
| | |
Ulker Biskuvi Sanayi AS(1) | | | 66,561 | | | | 206,409 | |
| | |
Vestel Elektronik Sanayi ve Ticaret AS(1) | | | 94,007 | | | | 266,416 | |
| | |
Yapi ve Kredi Bankasi AS(1) | | | 422,243 | | | | 174,839 | |
| | |
| | | | | | | $ | 21,057,791 | |
|
| United Arab Emirates — 1.2% | |
| | |
Abu Dhabi Commercial Bank PJSC | | | 534,173 | | | $ | 904,068 | |
| | |
Abu Dhabi National Hotels | | | 357,043 | | | | 272,130 | |
| | |
Agthia Group PJSC | | | 268,661 | | | | 310,330 | |
| | |
Air Arabia PJSC | | | 646,580 | | | | 225,766 | |
| | |
Aldar Properties PJSC | | | 1,543,088 | | | | 1,326,073 | |
| | |
Dana Gas PJSC | | | 1,556,182 | | | | 303,176 | |
| | |
Dubai Investments PJSC | | | 1,379,272 | | | | 546,399 | |
| | |
Emaar Properties PJSC(1) | | | 1,388,701 | | | | 1,338,857 | |
| | |
Emirates Telecommunications Group Co. PJSC | | | 608,255 | | | | 2,801,831 | |
| | |
First Abu Dhabi Bank PJSC | | | 645,518 | | | | 2,276,288 | |
| | |
| | | | | | | $ | 10,304,918 | |
|
| Vietnam — 1.2% | |
| | |
Bank for Foreign Trade of Vietnam JSC | | | 146,769 | | | $ | 623,705 | |
| | |
Bank for Investment and Development of Vietnam JSC | | | 40,630 | | | | 84,508 | |
| | |
Development Investment Construction Corp.(1) | | | 9 | | | | 11 | |
| | |
FLC Faros Construction JSC(1) | | | 6 | | | | 1 | |
| | |
HAGL JSC(1) | | | 505,340 | | | | 114,972 | |
| | |
Hoa Phat Group JSC | | | 1,362,179 | | | | 2,452,437 | |
| | |
KIDO Group Corp. | | | 40,276 | | | | 64,615 | |
| | |
Kinh Bac City Development Share Holding Corp.(1) | | | 245,370 | | | | 259,506 | |
| | |
Masan Group Corp. | | | 181,260 | | | | 698,484 | |
| | |
PetroVietnam Drilling & Well Services JSC(1) | | | 8 | | | | 6 | |
| | |
PetroVietnam Gas JSC | | | 65,130 | | | | 244,906 | |
| | |
PetroVietnam Technical Services Corp. | | | 297,972 | | | | 230,349 | |
| | |
SSI Securities Corp. | | | 2 | | | | 3 | |
| | |
Vietjet Aviation JSC(1) | | | 196,894 | | | | 1,066,994 | |
| | |
Vietnam Construction and Import-Export JSC | | | 87,800 | | | | 175,325 | |
| | |
Vietnam Dairy Products JSC | | | 250,848 | | | | 1,183,508 | |
| | |
Vietnam National Petroleum Group | | | 71,730 | | | | 169,970 | |
| | |
Vincom Retail JSC(1) | | | 170,213 | | | | 231,942 | |
| | |
Vingroup JSC(1) | | | 560,804 | | | | 2,632,705 | |
| | |
Vinh Son - Song Hinh Hydropower JSC(1) | | | 77,420 | | | | 63,130 | |
| | |
| | | | | | | $ | 10,297,077 | |
| |
Total Common Stocks
(identified cost $510,301,980) | | | $ | 866,270,838 | |
| | | | |
| | 21 | | See Notes to Financial Statements. |
Parametric
Tax-Managed Emerging Markets Fund
December 31, 2020
Portfolio of Investments (Unaudited) — continued
| | | | | | | | |
| Rights (1) — 0.0% | |
| Security | | Shares | | | Value | |
| | |
Banque Nationale Agricole, Exp. 4/15/49 | | | 35 | | | $ | 0 | |
| | |
Telnet Holding, Exp. 7/1/49 | | | 2 | | | | 0 | |
| |
Total Rights
(identified cost $0) | | | $ | 0 | |
|
| Short-Term Investments — 0.5% | |
| Description | | Shares | | | Value | |
| | |
State Street Navigator Securities Lending Government Money Market Portfolio, 0.08%(8) | | | 4,614,273 | | | $ | 4,614,273 | |
| |
Total Short-Term Investments
(identified cost $4,614,273) | | | $ | 4,614,273 | |
| |
Total Investments — 100.3%
(identified cost $514,916,253) | | | $ | 870,885,111 | |
| |
Other Assets, Less Liabilities — (0.3)% | | | $ | (2,566,336 | ) |
| |
Net Assets — 100.0% | | | $ | 868,318,775 | |
The percentage shown for each investment category in the Portfolio of Investments is based on net assets.
| (1) | Non-income producing security. |
| (2) | All or a portion of this security was on loan at December 31, 2020. The aggregate market value of securities on loan at December 31, 2020 was $14,722,378. |
| (3) | Security exempt from registration under Rule 144A of the Securities Act of 1933, as amended. These securities may be sold in certain transactions in reliance on an exemption from registration (normally to qualified institutional buyers). At December 31, 2020, the aggregate value of these securities is $24,074,758 or 2.8% of the Fund’s net assets. |
| (4) | For fair value measurement disclosure purposes, security is categorized as Level 3 (see Note 8). |
| (5) | Security exempt from registration under Regulation S of the Securities Act of 1933, as amended, which exempts from registration securities offered and sold outside the United States. Security may not be offered or sold in the United States except pursuant to an exemption from, or in a transaction not subject to, the registration requirements of the Securities Act of 1933, as amended. At December 31, 2020, the aggregate value of these securities is $12,667,781 or 1.5% of the Fund’s net assets. |
| (6) | Securities are traded on separate exchanges for the same entity. |
| (7) | Indicates a foreign registered security. Shares issued to foreign investors in markets that have foreign ownership limits. |
| (8) | Represents investment of cash collateral received in connection with securities lending. |
| | | | | | | | |
| Sector Classification of Portfolio | |
| Sector | | Percentage
of Net Assets | | | Value | |
| | |
Financials | | | 11.9 | % | | $ | 103,611,432 | |
| | |
Materials | | | 11.2 | | | | 97,557,145 | |
| | |
Information Technology | | | 10.5 | | | | 91,082,711 | |
| | |
Consumer Staples | | | 10.5 | | | | 90,691,077 | |
| | |
Industrials | | | 10.3 | | | | 89,102,899 | |
| | |
Consumer Discretionary | | | 9.9 | | | | 85,551,506 | |
| | |
Communication Services | | | 9.2 | | | | 80,186,841 | |
| | |
Energy | | | 8.6 | | | | 74,734,354 | |
| | |
Health Care | | | 8.3 | | | | 71,965,817 | |
| | |
Real Estate | | | 5.0 | | | | 43,475,833 | |
| | |
Utilities | | | 4.4 | | | | 38,311,223 | |
| | |
Short-Term Investments | | | 0.5 | | | | 4,614,273 | |
| | |
Total Investments | | | 100.3 | % | | $ | 870,885,111 | |
Abbreviations:
| | | | |
| | |
| ADR | | – | | American Depositary Receipt |
| | |
| GDR | | – | | Global Depositary Receipt |
| | |
| PCL | | – | | Public Company Ltd. |
| | |
| PFC Shares | | – | | Preference Shares |
| | | | |
| | 22 | | See Notes to Financial Statements. |
Parametric
Tax-Managed Emerging Markets Fund
December 31, 2020
Statement of Assets and Liabilities (Unaudited)
| | | | |
| Assets | | December 31, 2020 | |
| |
Unaffiliated investments, at value including $14,722,378 of securities on loan (identified cost, $514,916,253) | | $ | 870,885,111 | |
| |
Cash | | | 44,850 | |
| |
Foreign currency, at value (identified cost, $6,921,166) | | | 6,353,469 | |
| |
Dividends receivable | | | 907,084 | |
| |
Receivable for investments sold | | | 7,074,060 | |
| |
Receivable for Fund shares sold | | | 99,923 | |
| |
Securities lending income receivable | | | 15,024 | |
| |
Tax reclaims receivable | | | 119,080 | |
| |
Total assets | | $ | 885,498,601 | |
|
| Liabilities | |
| |
Demand note payable | | $ | 8,100,000 | |
| |
Collateral for securities loaned | | | 4,614,273 | |
| |
Payable for investments purchased | | | 1,120,115 | |
| |
Payable for Fund shares redeemed | | | 789,589 | |
| |
Payable to affiliates: | | | | |
| |
Investment adviser fee | | | 328,467 | |
| |
Administration fee | | | 364,963 | |
| |
Accrued foreign capital gains taxes | | | 1,845,801 | |
| |
Accrued expenses | | | 16,618 | |
| |
Total liabilities | | $ | 17,179,826 | |
| |
Net Assets | | $ | 868,318,775 | |
|
| Sources of Net Assets | |
| |
Paid-in capital | | $ | 541,897,548 | |
| |
Distributable earnings | | | 326,421,227 | |
| |
Total | | $ | 868,318,775 | |
|
| Institutional Class Shares | |
| |
Net Assets | | $ | 868,318,775 | |
| |
Shares Outstanding | | | 17,393,176 | |
| |
Net Asset Value, Offering Price and Redemption Price Per Share | | | | |
| |
(net assets ÷ shares of beneficial interest outstanding) | | $ | 49.92 | |
| | | | |
| | 23 | | See Notes to Financial Statements. |
Parametric
Tax-Managed Emerging Markets Fund
December 31, 2020
Statement of Operations (Unaudited)
| | | | |
| Investment Income | | Six Months Ended
December 31, 2020 | |
| |
Dividends (net of foreign taxes, $1,314,077) | | $ | 10,115,476 | |
| |
Securities lending income, net | | | 73,553 | |
| |
Total investment income | | $ | 10,189,029 | |
| |
| Expenses | | | | |
| |
Investment adviser fee | | $ | 1,988,544 | |
| |
Administration fee | | | 2,209,493 | |
| |
Interest expense and fees | | | 52,594 | |
| |
Total expenses | | $ | 4,250,631 | |
| |
Net investment income | | $ | 5,938,398 | |
| |
| Realized and Unrealized Gain (Loss) | | | | |
| |
Net realized gain (loss) — | | | | |
| |
Investment transactions (net of foreign capital gains taxes of $42,374) | | $ | 89,817,695 | |
| |
Foreign currency transactions | | | (662,426 | ) |
| |
Net realized gain | | $ | 89,155,269 | |
| |
Change in unrealized appreciation (depreciation) — | | | | |
| |
Investments (including net increase in accrued foreign capital gains taxes of $1,282,231) | | $ | 109,978,080 | |
| |
Foreign currency | | | (441,492 | ) |
| |
Net change in unrealized appreciation (depreciation) | | $ | 109,536,588 | |
| |
Net realized and unrealized gain | | $ | 198,691,857 | |
| |
Net increase in net assets from operations | | $ | 204,630,255 | |
| | | | |
| | 24 | | See Notes to Financial Statements. |
Parametric
Tax-Managed Emerging Markets Fund
December 31, 2020
Statements of Changes in Net Assets
| | | | | | | | |
| Increase (Decrease) in Net Assets | | Six Months Ended
December 31, 2020
(Unaudited) | | | Year Ended
June 30, 2020 | |
| | |
From operations — | | | | | | | | |
| | |
Net investment income | | $ | 5,938,398 | | | $ | 44,815,292 | |
| | |
Net realized gain (loss) | | | 89,155,269 | | | | (57,538,384 | ) |
| | |
Net change in unrealized appreciation (depreciation) | | | 109,536,588 | | | | (318,911,414 | ) |
| | |
Net increase (decrease) in net assets from operations | | $ | 204,630,255 | | | $ | (331,634,506 | ) |
| | |
Distributions to shareholders — | | | | | | | | |
| | |
Institutional Class | | $ | (15,418,818 | ) | | $ | (54,952,373 | ) |
| | |
Total distributions to shareholders | | $ | (15,418,818 | ) | | $ | (54,952,373 | ) |
| | |
Transactions in shares of beneficial interest — | | | | | | | | |
| | |
Proceeds from sale of shares | | $ | 14,832,619 | | | $ | 156,113,242 | |
| | |
Net asset value of shares issued to shareholders in payment of distributions declared | | | 12,356,736 | | | | 47,680,561 | |
| | |
Cost of shares redeemed | | | (449,540,900 | ) | | | (1,057,428,277 | ) |
| | |
Net decrease in net assets from Fund share transactions | | $ | (422,351,545 | ) | | $ | (853,634,474 | ) |
| | |
Net decrease in net assets | | $ | (233,140,108 | ) | | $ | (1,240,221,353 | ) |
|
| Net Assets | |
| | |
At beginning of period | | $ | 1,101,458,883 | | | $ | 2,341,680,236 | |
| | |
At end of period | | $ | 868,318,775 | | | $ | 1,101,458,883 | |
| | | | |
| | 25 | | See Notes to Financial Statements. |
Parametric
Tax-Managed Emerging Markets Fund
December 31, 2020
Financial Highlights
| | | | | | | | | | | | | | | | | | | | | | | | |
| | | Institutional Class | |
| | |
| | | Six Months Ended
December 31, 2020
(Unaudited) | | | Year Ended June 30, | |
| | | 2020 | | | 2019 | | | 2018 | | | 2017 | | | 2016 | |
| | | | | | | |
Net asset value — Beginning of period | | $ | 40.370 | | | $ | 48.520 | | | $ | 48.590 | | | $ | 47.740 | | | $ | 41.370 | | | $ | 46.230 | |
|
| Income (Loss) From Operations | |
| | | | | | |
Net investment income(1) | | $ | 0.300 | | | $ | 1.100 | | | $ | 1.042 | | | $ | 0.967 | | | $ | 0.777 | | | $ | 0.799 | |
| | | | | | |
Net realized and unrealized gain (loss) | | | 10.143 | | | | (7.971 | ) | | | (0.110 | ) | | | 0.811 | | | | 6.232 | | | | (5.019 | ) |
| | | | | | |
Total income (loss) from operations | | $ | 10.443 | | | $ | (6.871 | ) | | $ | 0.932 | | | $ | 1.778 | | | $ | 7.009 | | | $ | (4.220 | ) |
|
| Less Distributions | |
| | | | | | |
From net investment income | | $ | (0.893 | ) | | $ | (1.279 | ) | | $ | (1.002 | ) | | $ | (0.939 | ) | | $ | (0.699 | ) | | $ | (0.802 | ) |
| | | | | | |
Total distributions | | $ | (0.893 | ) | | $ | (1.279 | ) | | $ | (1.002 | ) | | $ | (0.939 | ) | | $ | (0.699 | ) | | $ | (0.802 | ) |
| | | | | | |
Redemption fees(1)(2) | | $ | — | | | $ | — | | | $ | — | | | $ | 0.011 | (3) | | $ | 0.060 | | | $ | 0.162 | |
| | | | | | |
Net asset value — End of period | | $ | 49.920 | | | $ | 40.370 | | | $ | 48.520 | | | $ | 48.590 | | | $ | 47.740 | | | $ | 41.370 | |
| | | | | | |
Total Return(4) | | | 25.89 | %(5) | | | (14.61 | )% | | | 2.12 | % | | | 3.63 | % | | | 17.34 | % | | | (8.64 | )% |
|
| Ratios/Supplemental Data | |
| | | | | | |
Net assets, end of period (000’s omitted) | | $ | 868,319 | | | $ | 1,101,459 | | | $ | 2,341,680 | | | $ | 3,257,773 | | | $ | 3,410,698 | | | $ | 2,850,969 | |
| | | | | | |
Ratios (as a percentage of average daily net assets): | | | | | | | | | | | | | | | | | | | | | | | | |
| | | | | | |
Expenses | | | 0.96 | %(6) | | | 0.96 | % | | | 0.96 | % | | | 0.95 | % | | | 0.95 | % | | | 0.95 | % |
| | | | | | |
Net investment income | | | 1.35 | %(6) | | | 2.46 | % | | | 2.21 | % | | | 1.86 | % | | | 1.75 | % | | | 1.99 | % |
| | | | | | |
Portfolio Turnover | | | 14 | %(5) | | | 2 | % | | | 4 | % | | | 6 | % | | | 8 | % | | | 2 | % |
| (1) | Computed using average shares outstanding. |
| (2) | Redemption fees were discontinued as of September 1, 2016. |
| (3) | Represents redemption fees that were inadvertently not charged in prior years that were paid to the Fund by the investment adviser. |
| (4) | Returns are historical and are calculated by determining the percentage change in net asset value with all distributions reinvested. |
| | | | |
| | 26 | | See Notes to Financial Statements. |
Parametric
Tax-Managed Emerging Markets Fund
December 31, 2020
Notes to Financial Statements (Unaudited)
1 Significant Accounting Policies
Parametric Tax-Managed Emerging Markets Fund (the Fund) is a diversified series of Eaton Vance Series Trust II (the Trust). The Trust is a Massachusetts business trust registered under the Investment Company Act of 1940, as amended (the 1940 Act), as an open-end management investment company. The Fund’s investment objective is to seek long-term, after-tax returns for its shareholders. The Fund offers Institutional Class shares, which are sold at net asset value and are not subject to a sales charge.
The following is a summary of significant accounting policies of the Fund. The policies are in conformity with accounting principles generally accepted in the United States of America (U.S. GAAP). The Fund is an investment company and follows accounting and reporting guidance in the Financial Accounting Standards Board (FASB) Accounting Standards Codification Topic 946.
A Investment Valuation — The following methodologies are used to determine the market value or fair value of investments.
Equity Securities. Equity securities listed on a U.S. securities exchange generally are valued at the last sale or closing price on the day of valuation or, if no sales took place on such date, at the mean between the closing bid and ask prices on the exchange where such securities are principally traded. Equity securities listed on the NASDAQ Global or Global Select Market generally are valued at the NASDAQ official closing price. Unlisted or listed securities for which closing sales prices or closing quotations are not available are valued at the mean between the latest available bid and ask prices.
Foreign Securities and Currencies. Foreign securities and currencies are valued in U.S. dollars, based on foreign currency exchange rate quotations supplied by a third party pricing service. The pricing service uses a proprietary model to determine the exchange rate. Inputs to the model include reported trades and implied bid/ask spreads. The daily valuation of exchange-traded foreign securities generally is determined as of the close of trading on the principal exchange on which such securities trade. Events occurring after the close of trading on foreign exchanges may result in adjustments to the valuation of foreign securities to more accurately reflect their fair value as of the close of regular trading on the New York Stock Exchange. When valuing foreign equity securities that meet certain criteria, the Fund’s Trustees have approved the use of a fair value service that values such securities to reflect market trading that occurs after the close of the applicable foreign markets of comparable securities or other instruments that have a strong correlation to the fair-valued securities.
Other. Investments in registered investment companies (including money market funds) that do not trade on an exchange are valued at the net asset value per share on the valuation day.
Fair Valuation. Investments for which valuations or market quotations are not readily available or are deemed unreliable are valued at fair value using methods determined in good faith by or at the direction of the Trustees of the Fund in a manner that most fairly reflects the security’s “fair value”, which is the amount that the Fund might reasonably expect to receive for the security upon its current sale in the ordinary course. Each such determination is based on a consideration of relevant factors, which are likely to vary from one pricing context to another. These factors may include, but are not limited to, the type of security, the existence of any contractual restrictions on the security’s disposition, the price and extent of public trading in similar securities of the issuer or of comparable companies or entities, quotations or relevant information obtained from broker/dealers or other market participants, information obtained from the issuer, analysts, and/or the appropriate stock exchange (for exchange-traded securities), an analysis of the company’s or entity’s financial statements, and an evaluation of the forces that influence the issuer and the market(s) in which the security is purchased and sold.
B Investment Transactions — Investment transactions for financial statement purposes are accounted for on a trade date basis. Realized gains and losses on investments sold are determined on the basis of identified cost.
C Income — Dividend income is recorded on the ex-dividend date for dividends received in cash and/or securities. However, if the ex-dividend date has passed, certain dividends from foreign securities are recorded as the Fund is informed of the ex-dividend date. Non-cash dividends are recorded at the fair value of the securities received. Withholding taxes on foreign dividends and capital gains have been provided for in accordance with the Fund’s understanding of the applicable countries’ tax rules and rates. In consideration of recent decisions rendered by European courts, the Fund has filed additional tax reclaims for previously withheld taxes on dividends earned in certain European Union countries. These filings are subject to various administrative and judicial proceedings within these countries. Due to the uncertainty as to the ultimate resolution of these proceedings, the likelihood of receipt of these reclaims, and the potential timing of payment, no amounts are reflected in the financial statements for such outstanding reclaims.
D Federal and Other Taxes — The Fund’s policy is to comply with the provisions of the Internal Revenue Code applicable to regulated investment companies and to distribute to shareholders each year substantially all of its net investment income, and all or substantially all of its net realized capital gains. Accordingly, no provision for federal income or excise tax is necessary.
In addition to the requirements of the Internal Revenue Code, the Fund may also be subject to local taxes on the recognition of capital gains in certain countries. In determining the daily net asset value, the Fund estimates the accrual for such taxes, if any, based on the unrealized appreciation on certain portfolio securities and the related tax rates. Taxes attributable to unrealized appreciation are included in the change in unrealized appreciation (depreciation) on investments. Capital gains taxes on securities sold are included in net realized gain (loss) on investments.
As of December 31, 2020, the Fund had no uncertain tax positions that would require financial statement recognition, de-recognition, or disclosure. The Fund files a U.S. federal income tax return annually after its fiscal year-end, which is subject to examination by the Internal Revenue Service for a period of three years from the date of filing.
Parametric
Tax-Managed Emerging Markets Fund
December 31, 2020
Notes to Financial Statements (Unaudited) — continued
E Expenses — The majority of expenses of the Trust are directly identifiable to an individual fund. Expenses which are not readily identifiable to a specific fund are allocated taking into consideration, among other things, the nature and type of expense and the relative size of the funds.
F Foreign Currency Translation — Investment valuations, other assets, and liabilities initially expressed in foreign currencies are translated each business day into U.S. dollars based upon current exchange rates. Purchases and sales of foreign investment securities and income and expenses denominated in foreign currencies are translated into U.S. dollars based upon currency exchange rates in effect on the respective dates of such transactions. Recognized gains or losses on investment transactions attributable to changes in foreign currency exchange rates are recorded for financial statement purposes as net realized gains and losses on investments. That portion of unrealized gains and losses on investments that results from fluctuations in foreign currency exchange rates is not separately disclosed.
G Use of Estimates — The preparation of the financial statements in conformity with U.S. GAAP requires management to make estimates and assumptions that affect the reported amounts of assets and liabilities at the date of the financial statements and the reported amounts of income and expense during the reporting period. Actual results could differ from those estimates.
H Indemnifications — Under the Trust’s organizational documents, its officers and Trustees may be indemnified against certain liabilities and expenses arising out of the performance of their duties to the Fund. Under Massachusetts law, if certain conditions prevail, shareholders of a Massachusetts business trust (such as the Trust) could be deemed to have personal liability for the obligations of the Trust. However, the Trust’s Declaration of Trust contains an express disclaimer of liability on the part of Fund shareholders and the By-laws provide that the Trust shall assume, upon request by the shareholder, the defense on behalf of any Fund shareholders. Moreover, the By-laws also provide for indemnification out of Fund property of any shareholder held personally liable solely by reason of being or having been a shareholder for all loss or expense arising from such liability. Additionally, in the normal course of business, the Fund enters into agreements with service providers that may contain indemnification clauses. The Fund’s maximum exposure under these arrangements is unknown as this would involve future claims that may be made against the Fund that have not yet occurred.
I Interim Financial Statements — The interim financial statements relating to December 31, 2020 and for the six months then ended have not been audited by an independent registered public accounting firm, but in the opinion of the Fund’s management, reflect all adjustments, consisting only of normal recurring adjustments, necessary for the fair presentation of the financial statements.
2 Distributions to Shareholders and Income Tax Information
It is the present policy of the Fund to make at least one distribution annually (normally in December) of all or substantially all of its net investment income and to distribute annually all or substantially all of its net realized capital gains. Distributions to shareholders are recorded on the ex-dividend date. Shareholders may reinvest income and capital gain distributions in additional shares of the Fund at the net asset value as of the ex-dividend date or, at the election of the shareholder, receive distributions in cash. Distributions to shareholders are determined in accordance with income tax regulations, which may differ from U.S. GAAP. As required by U.S. GAAP, only distributions in excess of tax basis earnings and profits are reported in the financial statements as a return of capital. Permanent differences between book and tax accounting relating to distributions are reclassified to paid-in capital. For tax purposes, distributions from short-term capital gains are considered to be from ordinary income.
At June 30, 2020, the Fund, for federal income tax purposes, had deferred capital losses of $96,518,626 which would reduce its taxable income arising from future net realized gains on investment transactions, if any, to the extent permitted by the Internal Revenue Code, and thus would reduce the amount of distributions to shareholders, which would otherwise be necessary to relieve the Fund of any liability for federal income or excise tax. The deferred capital losses are treated as arising on the first day of the Fund’s next taxable year and retain the same short-term or long-term character as when originally deferred. Of the deferred capital losses at June 30, 2020, $20,115,142 are short-term and $76,403,484 are long-term.
The cost and unrealized appreciation (depreciation) of investments, of the Fund at December 31, 2020, as determined on a federal income tax basis, were as follows:
| | | | |
| |
Aggregate cost | | $ | 539,350,231 | |
| |
Gross unrealized appreciation | | $ | 390,876,948 | |
| |
Gross unrealized depreciation | | | (59,342,068 | ) |
| |
Net unrealized appreciation | | $ | 331,534,880 | |
3 Investment Adviser Fee and Other Transactions with Affiliates
The investment adviser fee is earned by Eaton Vance Management (EVM), a wholly-owned subsidiary of Eaton Vance Corp., as compensation for management and investment advisory services rendered to the Fund. The fee is computed at an annual rate of 0.45% of the Fund’s average daily net assets and is payable monthly. For the six months ended December 31, 2020, the investment adviser fee amounted to $1,988,544. Pursuant to a
Parametric
Tax-Managed Emerging Markets Fund
December 31, 2020
Notes to Financial Statements (Unaudited) — continued
sub-advisory agreement, EVM has delegated the investment management of the Fund to Parametric Portfolio Associates LLC (Parametric), a wholly-owned indirect subsidiary of Eaton Vance Corp. EVM pays Parametric a portion of its investment adviser fee for sub-advisory services provided to the Fund.
The administration fee is earned by EVM for administering the business affairs of the Fund and is computed at an annual rate of 0.50% of the Fund’s average daily net assets. For the six months ended December 31, 2020, the administration fee amounted to $2,209,493. Pursuant to a sub-administrative services agreement with Parametric, EVM pays Parametric a portion of its administration fee for sub-administrative services provided to the Fund. EVM also pays all ordinary operating expenses of the Fund (excluding the investment adviser and administration fees). EVM serves as the sub-transfer agent of the Fund, at no additional cost to the Fund.
Trustees and officers of the Fund who are members of EVM’s organization receive remuneration for their services to the Fund out of the investment adviser fee. Trustees of the Fund who are not affiliated with EVM are paid for their services to the Fund by EVM and may elect to defer receipt of all or a percentage of their annual fees in accordance with the terms of the Trustees Deferred Compensation Plan. For the six months ended December 31, 2020, no significant amounts have been deferred. Certain officers and Trustees of the Fund are officers of EVM.
4 Purchases and Sales of Investments
Purchases and sales of investments, other than short-term obligations, aggregated $126,296,111 and $555,628,149, respectively, for the six months ended December 31, 2020.
5 Shares of Beneficial Interest
The Fund’s Declaration of Trust permits the Trustees to issue an unlimited number of full and fractional shares of beneficial interest (without par value). Transactions in Fund shares were as follows:
| | | | | | | | |
| | | Six Months Ended
December 31, 2020
(Unaudited) | | | Year Ended
June 30, 2020 | |
| | |
Sales | | | 335,948 | | | | 3,784,063 | |
| | |
Issued to shareholders electing to receive payments of distributions in Fund shares | | | 249,681 | | | | 980,275 | |
| | |
Redemptions | | | (10,475,365 | ) | | | (25,746,578 | ) |
| | |
Net decrease | | | (9,889,736 | ) | | | (20,982,240 | ) |
6 Line of Credit
The Fund participates with other portfolios and funds managed by EVM and its affiliates in an $800 million unsecured line of credit agreement with a group of banks, which is in effect through October 26, 2021. Borrowings are made by the Fund solely for temporary purposes related to redemptions and other short-term cash needs. Interest is charged to the Fund based on its borrowings at an amount above either the Eurodollar rate or Federal Funds rate. In addition, a fee computed at an annual rate of 0.15% on the daily unused portion of the line of credit is allocated among the participating portfolios and funds at the end of each quarter. In connection with the renewal of the agreement in October 2020, an upfront fee and arrangement fee totaling $950,000 was incurred that was allocated to the participating portfolios and funds. Because the line of credit is not available exclusively to the Fund, it may be unable to borrow some or all of its requested amounts at any particular time. At December 31, 2020, the Fund had a balance outstanding pursuant to this line of credit of $8,100,000 at an annual interest rate of 1.34%. Based on the short-term nature of the borrowings under the line of credit and variable interest rate, the carrying value of the borrowings approximated its fair value at December 31, 2020. If measured at fair value, borrowings under the line of credit would have been considered as Level 2 in the fair value hierarchy (see Note 8) at December 31, 2020. Average borrowings and the average annual interest rate (excluding fees) for the six months ended December 31, 2020 were $8,075,543 and 1.14%, respectively.
7 Securities Lending Agreement
The Fund has established a securities lending agreement with State Street Bank and Trust Company (SSBT) as securities lending agent in which the Fund lends portfolio securities to qualified borrowers in exchange for collateral consisting of either cash or securities issued or guaranteed by the U.S. government or its agencies or instrumentalities in an amount at least equal to the market value of the securities on loan. The market value of securities loaned is determined daily and any additional required collateral is delivered to the Fund on the next business day. Cash collateral is invested in the State Street Navigator Securities Lending Government Money Market Portfolio, a money market fund registered under the 1940 Act. The Fund earns interest on the amount invested but it must pay (and at times receive from) the broker a loan rebate fee computed as a varying percentage of the collateral received. For security loans secured by non-cash collateral, the Fund earns a negotiated lending fee from the borrower. A portion of the income earned by the Fund from its investment of cash collateral, net of rebate fees, and lending fees received is allocated to SSBT for its services as lending agent and the portion
Parametric
Tax-Managed Emerging Markets Fund
December 31, 2020
Notes to Financial Statements (Unaudited) — continued
allocated to the Fund is presented as securities lending income, net on the Statement of Operations. Non-cash collateral is held by the lending agent on behalf of the Fund and cannot be sold or re-pledged by the Fund; accordingly, such collateral is not reflected in the Statement of Assets and Liabilities.
The Fund is subject to possible delay in the recovery of loaned securities. Pursuant to the securities lending agreement, SSBT has provided indemnification to the Fund in the event of default by a borrower with respect to a loan. The Fund bears the risk of loss with respect to the investment of cash collateral.
At December 31, 2020, the value of the securities loaned and the value of the collateral received, which exceeded the value of the securities loaned, amounted to $14,722,378 and $15,482,125, respectively. Collateral received was comprised of cash of $4,614,273 and U.S. government and/or agencies securities of $10,867,852. The securities lending transactions have no contractual maturity date and each of the Fund and borrower has the option to terminate a loan at any time.
The following table provides a breakdown of securities lending transactions accounted for as secured borrowings, the obligations by class of collateral pledged, and the remaining contractual maturity of those transactions as of December 31, 2020.
| | | | | | | | | | | | | | | | | | | | |
| | | Remaining Contractual Maturity of the Transactions | |
| | | Overnight and
Continuous | | | <30 days | | | 30 to 90 days | | | >90 days | | | Total | |
| | | | | |
Common Stocks | | $ | 4,614,273 | | | $ | — | | | $ | — | | | $ | — | | | $ | 4,614,273 | |
The carrying amount of the liability for collateral for securities loaned at December 31, 2020 approximated its fair value. If measured at fair value, such liability would have been considered as Level 2 in the fair value hierarchy (see Note 8) at December 31, 2020.
8 Fair Value Measurements
Under generally accepted accounting principles for fair value measurements, a three-tier hierarchy to prioritize the assumptions, referred to as inputs, is used in valuation techniques to measure fair value. The three-tier hierarchy of inputs is summarized in the three broad levels listed below.
| • | | Level 1 – quoted prices in active markets for identical investments |
| • | | Level 2 – other significant observable inputs (including quoted prices for similar investments, interest rates, prepayment speeds, credit risk, etc.) |
| • | | Level 3 – significant unobservable inputs (including a fund’s own assumptions in determining the fair value of investments) |
In cases where the inputs used to measure fair value fall in different levels of the fair value hierarchy, the level disclosed is determined based on the lowest level input that is significant to the fair value measurement in its entirety. The inputs or methodology used for valuing securities are not necessarily an indication of the risk associated with investing in those securities.
At December 31, 2020, the hierarchy of inputs used in valuing the Fund’s investments, which are carried at value, were as follows:
| | | | | | | | | | | | | | | | |
| Asset Description | | Level 1 | | | Level 2 | | | Level 3* | | | Total | |
| | | | |
Common Stocks | | | | | | | | | | | | | | | | |
| | | | |
Asia/Pacific | | $ | 17,199,902 | | | $ | 415,197,595 | | | $ | 38,273 | | | $ | 432,435,770 | |
| | | | |
Emerging Europe | | | 5,649,289 | | | | 128,242,212 | | | | 0 | | | | 133,891,501 | |
| | | | |
Latin America | | | 76,098,011 | | | | 59,677,087 | | | | 0 | | | | 135,775,098 | |
| | | | |
Middle East/Africa | | | 3,693,650 | | | | 152,344,757 | | | | 8,130,062 | | | | 164,168,469 | |
| | | | |
Total Common Stocks | | $ | 102,640,852 | | | $ | 755,461,651 | ** | | $ | 8,168,335 | | | $ | 866,270,838 | |
| | | | |
Rights | | $ | 0 | | | $ | 0 | | | $ | — | | | $ | 0 | |
| | | | |
Short-Term Investments | | | 4,614,273 | | | | — | | | | — | | | | 4,614,273 | |
| | | | |
Total Investments | | $ | 107,255,125 | | | $ | 755,461,651 | | | $ | 8,168,335 | | | $ | 870,885,111 | |
| * | None of the unobservable inputs for Level 3 assets, individually or collectively, had a material impact on the Fund. |
| ** | Includes foreign equity securities whose values were adjusted to reflect market trading of comparable securities or other correlated instruments that occurred after the close of trading in their applicable foreign markets. |
Parametric
Tax-Managed Emerging Markets Fund
December 31, 2020
Notes to Financial Statements (Unaudited) — continued
Level 3 investments at the beginning and/or end of the period in relation to net assets were not significant and accordingly, a reconciliation of Level 3 assets for the six months ended December 31, 2020 is not presented.
9 Risks and Uncertainties
Risks Associated with Foreign Investments
Investments in foreign issuers could be affected by factors not present in the United States, including expropriation, armed conflict, confiscatory taxation, lack of uniform accounting and auditing standards, less publicly available financial and other information, and potential difficulties in enforcing contractual obligations. Settlements of securities transactions in foreign countries are subject to risk of loss, may be delayed and are generally less frequent than in the United States. Evidence of ownership of certain foreign investments may be held outside the United States, and the Fund may be subject to the risks associated with the holding of such property overseas. Foreign issuers may become subject to sanctions imposed by the United States or another country, which could result in the immediate freeze of the foreign issuers’ assets or securities. Trading in certain foreign markets is also subject to liquidity risk. Political events in foreign countries may cause market disruptions.
The risks of foreign investments can be more significant in emerging markets. Political and economic structures in emerging market countries generally lack the social, political and economic stability of developed countries. Securities markets within emerging market countries may experience low or non-existent trading volume. Governmental actions can have a significant effect on the economic conditions in emerging market countries. In particular, trade disputes may result in governmental actions, including but not limited to restrictions on investments in, or required divestment of, particular issuers or industries. There may be less publicly available information about issuers in emerging markets than would be available about issuers in more developed capital markets. The laws of emerging market countries relating to the limited liability of corporate shareholders, fiduciary duties of officers and directors, and bankruptcy of state enterprises are generally less developed than or different from such laws in the United States. It may be more difficult to make a claim or obtain a judgment in the courts of these countries than it is in the United States. The possibility of fraud, negligence, undue influence being exerted by an issuer or refusal to recognize ownership exists in some emerging markets. The prices at which investments may be acquired may be affected by trading by persons with information that is not publicly available and by securities transactions by brokers in anticipation of transactions in particular securities. Disruptions due to work stoppages and trading improprieties in foreign securities markets have caused such markets to close. Emerging market securities are also subject to speculative trading, which contributes to their volatility. These foregoing risks may be even greater in frontier markets.
Pandemic Risk
An outbreak of respiratory disease caused by a novel coronavirus was first detected in China in December 2019 and subsequently spread internationally. This coronavirus has resulted in closing borders, enhanced health screenings, changes to healthcare service preparation and delivery, quarantines, cancellations, disruptions to supply chains and customer activity, as well as general concern and uncertainty. Health crises caused by outbreaks, such as the coronavirus outbreak, may exacerbate other pre-existing political, social and economic risks and disrupt normal market conditions and operations. The impact of this outbreak has negatively affected the worldwide economy, the economies of individual countries, individual companies, and the market in general, and may continue to do so in significant and unforeseen ways, as may other epidemics and pandemics that may arise in the future. Any such impact could adversely affect the Fund’s performance, or the performance of the securities in which the Fund invests.
10 Additional Information
On October 8, 2020, Morgan Stanley and Eaton Vance Corp. (“Eaton Vance”) announced that they had entered into a definitive agreement under which Morgan Stanley would acquire Eaton Vance. Under the Investment Company Act of 1940, as amended, consummation of this transaction may be deemed to result in the automatic termination of an Eaton Vance Fund’s investment advisory agreement and, where applicable, any related sub-advisory agreement. On November 24, 2020, the Fund’s Board approved a new investment advisory agreement and a new sub-advisory agreement. The new investment advisory agreement and new sub-advisory agreement were approved by Fund shareholders at a joint special meeting of shareholders held on February 18, 2021, and would take effect upon consummation of the transaction.
Parametric
Tax-Managed Emerging Markets Fund
December 31, 2020
Board of Trustees’ Contract Approval
Overview of the Contract Review Process
Even though the following description of the Board’s (as defined below) consideration of investment advisory and, as applicable, sub-advisory agreements covers multiple funds, for purposes of this shareholder report, the description is only relevant as to Parametric Tax-Managed Emerging Markets Fund.
| | | | |
| Fund | | Investment Adviser | | Investment Sub-Adviser |
| | |
Parametric Tax-Managed Emerging Markets Fund | | Eaton Vance Management | | Parametric Portfolio Associates LLC |
At a meeting held on November 24, 2020 (the “November Meeting”), the Board of each Eaton Vance open-end Fund and portfolios in which each such Fund invests, as applicable (each, a “Fund” and, collectively, the “Funds”), including a majority of the Board members (the “Independent Trustees”) who are not “interested persons” (as defined in the Investment Company Act of 1940 (the “1940 Act”)) of the Funds, Eaton Vance Management (“EVM”) or Boston Management and Research (“BMR” and, together with EVM, the “Advisers”), voted to approve a new investment advisory agreement between each Fund and either EVM or BMR (the “New Investment Advisory Agreements”) and, for certain Funds, a new investment sub-advisory agreement between an Adviser and the applicable Sub-Adviser (the “New Investment Sub-Advisory Agreements”(1) and, together with the New Investment Advisory Agreements, the “New Agreements”), each of which is intended to go into effect upon the completion of the Transaction (as defined below), as more fully described below. In voting its approval of the New Agreements at the November Meeting, the Board relied on an order issued by the Securities and Exchange Commission in response to the impacts of the COVID-19 pandemic that provided temporary relief from the in-person meeting requirements under Section 15 of the 1940 Act.
In voting its approval of the New Agreements, the Board of each Fund relied upon the recommendation of its Contract Review Committee, which is a committee comprised exclusively of Independent Trustees. Prior to and during meetings leading up to the November Meeting, the Contract Review Committee reviewed and discussed information furnished by the Advisers, the Sub-Advisers, and Morgan Stanley, as requested by the Independent Trustees, that the Contract Review Committee considered reasonably necessary to evaluate the terms of the New Agreements and to form its recommendation. Such information included, among other things, the terms and anticipated impacts of Morgan Stanley’s pending acquisition of Eaton Vance Corp. (the “Transaction”) on the Funds and their shareholders. In addition to considering information furnished specifically to evaluate the impact of the Transaction on the Funds and their respective shareholders, the Board and its Contract Review Committee also considered information furnished for prior meetings of the Board and its committees, including information provided in connection with the annual contract review process for the Funds, which most recently culminated in April 2020 (the “2020 Annual Approval Process”).
The Board of each Fund, including the Independent Trustees, concluded that the applicable New Investment Advisory Agreement and, as applicable, New Investment Sub-Advisory Agreement, including the fees payable thereunder, was fair and reasonable, and it voted to approve the New Investment Advisory Agreement and, as applicable, New Investment Sub-Advisory Agreement and to recommend that shareholders do so as well.
Shortly after the announcement of the Transaction, the Board, including all of the Independent Trustees, met with senior representatives from the Advisers and Morgan Stanley at its meeting held on October 13, 2020 to discuss certain aspects of the Transaction and the expected impacts of the Transaction on the Funds and their shareholders. As part of the Board’s evaluation process, counsel to the Independent Trustees, on behalf of the Contract Review Committee, requested additional information to assist the Independent Trustees in their evaluation of the New Agreements and the implications of the Transaction, as well as other contractual arrangements that may be affected by the Transaction. The Contract Review Committee considered information furnished by the Advisers and Morgan Stanley, their respective affiliates, and, as applicable, the Sub-Advisers during meetings on November 5, 2020, November 10, 2020, November 13, 2020, November 17, 2020 and November 24, 2020.
During its meetings on November 10, 2020 and November 17, 2020, the Contract Review Committee further discussed the approval of the New Agreements with senior representatives of the Advisers, the Affiliated Sub-Advisers, and Morgan Stanley. The representatives from the Advisers, the Affiliated Sub-Advisers, and Morgan Stanley each made presentations to, and responded to questions from, the Independent Trustees. The Contract Review Committee considered the Advisers’, the Affiliated Sub-Advisers’ and Morgan Stanley’s responses related to the Transaction and specifically to the Funds, as well as information received in connection with the 2020 Annual Approval Process, with respect to its evaluation of the New Agreements. Among other information, the Board considered:
Information about the Transaction and its Terms
| | • | | Information about the material terms and conditions, and expected impacts, of the Transaction that relate to the Funds, including the expected impacts on the businesses conducted by the Advisers, the Affiliated Sub-Advisers and Eaton Vance Distributors, Inc., as the distributor of Fund shares; |
| | • | | Information about the advantages of the Transaction as they relate to the Funds and their shareholders; |
| (1) | With respect to certain of the Funds, the applicable Adviser is currently a party to a sub-advisory agreement (collectively, the “Current Sub-Advisory Agreements”) with Atlanta Capital Management Company, LLC (“Atlanta Capital”), BMO Global Asset Management (Asia) Limited, Eaton Vance Advisers International Ltd. (“EVAIL”), Goldman Sachs Asset Management, L.P., Hexavest Inc. (“Hexavest”), Parametric Portfolio Associates LLC (“Parametric”) or Richard Bernstein Advisors LLC (collectively, the “Sub-Advisers” and, with respect to Atlanta Capital, EVAIL, Hexavest and Parametric, each an affiliate of the Advisers, the “Affiliated Sub-Advisers”). Accordingly, references to the “Sub-Advisers,” the “Affiliated Sub-Advisers” or the “New Sub-Advisory Agreements” are not applicable to all Funds. |
Parametric
Tax-Managed Emerging Markets Fund
December 31, 2020
Board of Trustees’ Contract Approval — continued
| | • | | A commitment that the Funds would not bear any expenses, directly or indirectly, in connection with the Transaction; |
| | • | | A commitment that, for a period of three years after the Closing, at least 75% of each Fund’s Board members must not be “interested persons” (as defined in the 1940 Act) of the investment adviser (or predecessor investment adviser, if applicable) pursuant to Section 15(f)(1)(A) of the 1940 Act; |
| | • | | A commitment that Morgan Stanley would use its reasonable best efforts to ensure that it did not impose any “unfair burden” (as that term is used in section 15(f)(1)(B) of the 1940 Act) on the Funds as a result of the Transaction; |
| | • | | Information with respect to personnel and/or other resources of the Advisers and their affiliates, including the Affiliated Sub-Advisers, as a result of the Transaction, as well as any expected changes to compensation, including any retention-based compensation intended to incentivize key personnel at the Advisers and their affiliates, including the Affiliated Sub-Advisers; |
| | • | | Information regarding any changes that are expected with respect to the Funds’ slate of officers as a result of the Transaction; |
Information about Morgan Stanley
| | • | | Information about Morgan Stanley’s overall business, including information about the advisory, brokerage and related businesses that Morgan Stanley operates; |
| | • | | Information about Morgan Stanley’s financial condition, including its access to capital and other resources required to support the investment advisory businesses related to the Funds; |
| | • | | Information on how the Funds are expected to fit within Morgan Stanley’s overall business strategy, and any changes that Morgan Stanley contemplates implementing to the Funds in the short- or long-term following the closing of the Transaction (the “Closing”); |
| | • | | Information regarding risk management functions at Morgan Stanley and its affiliates, including how existing risk management protocols and procedures may impact the Funds and/or the businesses of the Advisers and their affiliates, including the Affiliated Sub-Advisers, as they relate to the Funds; |
| | • | | Information on the anticipated benefits of the Transaction to the Funds with respect to potential additional distribution capabilities and the ability to access new markets and customer segments through Morgan Stanley’s distribution network, including, in particular, its institutional client base; |
| | • | | Information regarding the financial condition and reputation of Morgan Stanley, its worldwide presence, experience as a fund sponsor and manager, commitment to maintain a high level of cooperation with, and support to, the Funds, strong client service capabilities, and relationships in the asset management industry; |
Information about the New Agreements for Funds
| | • | | A representation that, after the Closing, all of the Funds will continue to be advised by their current Adviser and Sub-Adviser, as applicable; |
| | • | | Information regarding the terms of the New Agreements, including certain changes as compared to the current investment advisory agreement between each Fund and its Adviser (collectively, the “Current Advisory Agreements”) and, as applicable, the current investment sub-advisory agreement between a Fund and a Sub-Adviser (together with the Current Advisory Agreements, the “Current Agreements”); |
| | • | | Information confirming that the fee rates payable under the New Agreements are not changed as compared to the Current Agreements; |
| | • | | A representation that the New Agreements will not cause any diminution in the nature, extent and quality of services provided by the Advisers and the Sub-Advisers to the Funds and their respective shareholders, including with respect to compliance and other non-advisory services; |
Information about Fund Performance, Fees and Expenses
| | • | | A report from an independent data provider comparing the investment performance of each Fund (including, as relevant, total return data, income data, Sharpe ratios and information ratios) to the investment performance of comparable funds and, as applicable, benchmark indices, over various time periods as of the 2020 Annual Approval Process, as well as performance information as of a more recent date; |
| | • | | A report from an independent data provider comparing each Fund’s total expense ratio (and its components) to those of comparable funds as of the 2020 Annual Approval Process, as well as fee and expense information as of a more recent date; |
| | • | | In certain instances, data regarding investment performance relative to customized groups of peer funds and blended indices identified by the Advisers in consultation with the Portfolio Management Committee of the Board as of the 2020 Annual Approval Process, as well as corresponding performance information as of a more recent date; |
| | • | | Comparative information concerning the fees charged and services provided by the Adviser and the Sub-Adviser to each Fund in managing other accounts (which may include other mutual funds, collective investment funds and institutional accounts) using investment strategies and techniques similar to those used in managing such Fund(s), if any; |
| | • | | Profitability analyses of the Advisers and the Affiliated Sub-Advisers, as applicable, with respect to each of the Funds as of the 2020 Annual Approval Process, as well as information regarding the impact of the Transaction on profitability; |
Information about Portfolio Management and Trading
| | • | | Descriptions of the investment management services currently provided and expected to be provided to each Fund after the Transaction, as well as each of the Funds’ investment strategies and policies; |
| | • | | The procedures and processes used to determine the fair value of Fund assets, when necessary, and actions taken to monitor and test the effectiveness of such procedures and processes; |
Parametric
Tax-Managed Emerging Markets Fund
December 31, 2020
Board of Trustees’ Contract Approval — continued
| | • | | Information about any changes to the policies and practices of the Advisers and, as applicable, each Fund’s Sub-Adviser with respect to trading, including their processes for seeking best execution of portfolio transactions; |
| | • | | Information regarding the impact on trading and access to capital markets associated with the Funds’ affiliations with Morgan Stanley and its affiliates, including potential restrictions with respect to the Funds’ ability to execute portfolio transactions with Morgan Stanley and its affiliates; |
Information about the Advisers and the Sub-Advisers
| | • | | Information about the financial results and condition of the Advisers and the Affiliated Sub-Advisers since the culmination of the 2020 Annual Approval Process and any material changes in financial condition that are reasonably expected to occur before and after the Closing; |
| | • | | Information regarding contemplated changes to the individual investment professionals whose responsibilities include portfolio management and investment research for the Funds, and, for portfolio managers and certain other investment professionals, information relating to their responsibilities with respect to managing other mutual funds and investment accounts, as applicable, post-Closing; |
| | • | | The Code of Ethics of the Advisers and their affiliates, including the Affiliated Sub-Advisers, together with information relating to compliance with, and the administration of, such codes; |
| | • | | Policies and procedures relating to proxy voting and the handling of corporate actions and class actions; |
| | • | | Information concerning the resources devoted to compliance efforts undertaken by the Advisers and their affiliates, including the Affiliated Sub-Advisers, including descriptions of their various compliance programs and their record of compliance; |
| | • | | Information concerning the business continuity and disaster recovery plans of the Advisers and their affiliates, including the Affiliated Sub-Advisers; |
| | • | | A description of the Advisers’ oversight of the Sub-Advisers, including with respect to regulatory and compliance issues, investment management and other matters; |
Other Relevant Information
| | • | | Information concerning the nature, cost and character of the administrative and other non-investment advisory services provided by the Advisers and their affiliates; |
| | • | | Information concerning oversight of the relationship with the custodian, subcustodians and fund accountants by EVM and/or administrator to each of the Funds; |
| | • | | Confirmation that the Advisers intend to continue to manage the Funds in a manner materially consistent with each Fund’s current investment objective(s) and principal investment strategies; |
| | • | | Information regarding Morgan Stanley’s commitment to maintaining competitive compensation arrangements to attract and retain highly qualified personnel; |
| | • | | Confirmation that the Advisers’ current senior management teams have indicated their strong support of the Transaction; and |
| | • | | Information regarding the fact that Morgan Stanley and Eaton Vance Corp. will each derive benefits from the Transaction and that, as a result, they have a financial interest in the matters that were being considered. |
As indicated above, the Board and its Contract Review Committee also considered information received at its regularly scheduled meetings throughout the year, which included information from portfolio managers and other investment professionals of the Advisers and the Sub-Advisers regarding investment and performance matters, and considered various investment and trading strategies used in pursuing the Funds’ investment objectives. The Board also received information regarding risk management techniques employed in connection with the management of the Funds. The Board and its committees evaluated issues pertaining to industry and regulatory developments, compliance procedures, fund governance and other issues with respect to the Funds, and received and participated in reports and presentations provided by the Advisers and their affiliates, including the Affiliated Sub-Advisers, with respect to such matters.
The Contract Review Committee was advised throughout the evaluation process by Goodwin Procter LLP, independent legal counsel for the Independent Trustees. The members of the Contract Review Committee, with the advice of such counsel, exercised their own business judgment in determining the material factors to be considered in evaluating the New Agreements and the weight to be given to each such factor. The conclusions reached with respect to the New Agreements were based on a comprehensive evaluation of all the information provided and not any single factor. Moreover, each Independent Trustee may have placed varying emphasis on particular factors in reaching conclusions with respect to the New Agreements.
Nature, Extent and Quality of Services
In considering whether to approve the New Agreements, the Board evaluated the nature, extent and quality of services currently provided to each Fund by the Advisers and, as applicable, the Sub-Advisers under the Current Agreements. In evaluating the nature, extent and quality of services to be provided by the Advisers and the Sub-Advisers under the New Agreements, the Board considered, among other information, the expected impact, if any, of the Transaction on the operations, facilities, organization and personnel of the Advisers and the Sub-Advisers, and that Morgan Stanley and the Advisers have advised the Board that, following the Transaction, there is not expected to be any diminution in the nature, extent and quality of services provided by the Advisers and the Sub-Advisers, as applicable, to the Funds and their shareholders, including compliance and other non-advisory services, and that there are not expected to be any changes in portfolio management personnel as a result of the Transaction.
Parametric
Tax-Managed Emerging Markets Fund
December 31, 2020
Board of Trustees’ Contract Approval — continued
The Board also considered the financial resources of Morgan Stanley and the Advisers and the importance of having a Fund manager with, or with access to, significant organizational and financial resources. The Board considered the benefits to the Funds of being part of a larger combined organization with greater financial resources following the Transaction, particularly during periods of market disruptions and volatility. In this regard, the Board considered information provided by Morgan Stanley regarding its business and operating structure, scale of operation, leadership and reputation, distribution capabilities, and financial condition, as well as information on how the Funds are expected to fit within Morgan Stanley’s overall business strategy and any changes that Morgan Stanley contemplates in the short- or long-term following the Closing. The Board also noted Morgan Stanley’s and the Advisers’ commitment to keep the Board apprised of developments with respect to its long-term integration plans for the Advisers, the Affiliated Sub-Advisers, and existing Morgan Stanley affiliates and their respective personnel.
The Board considered the Advisers’ and the Sub-Advisers’ management capabilities and investment processes in light of the types of investments held by each Fund, including the education, experience and number of investment professionals and other personnel who provide portfolio management, investment research, and similar services to each Fund. In particular, the Board considered the abilities and experience of the Advisers’ and, as applicable, the Sub-Advisers’ investment professionals in implementing each Fund’s investment strategies. The Board also took into account the resources dedicated to portfolio management and other services, the compensation methods of the Advisers and other factors, including the reputation and resources of the Advisers to recruit and retain highly qualified research, advisory and supervisory investment professionals. With respect to the recruitment and retention of key personnel, the Board noted information from Morgan Stanley and the Advisers regarding the benefits of joining Morgan Stanley. In addition, the Board considered the time and attention devoted to the Funds by senior management, as well as the infrastructure, operational capabilities and support staff in place to assist in the portfolio management and operations of the Funds, including the provision of administrative services. With respect to the foregoing, the Board also considered information from the Advisers and Morgan Stanley regarding the anticipated impact of the Transaction on such matters. The Board also considered the business-related and other risks to which the Advisers or their affiliates may be subject in managing the Funds and in connection with the Transaction.
The Board considered the compliance programs of the Advisers and relevant affiliates thereof, including the Affiliated Sub-Advisers. The Board considered compliance and reporting matters regarding, among other things, personal trading by investment professionals, disclosure of portfolio holdings, late trading, frequent trading, portfolio valuation, business continuity and the allocation of investment opportunities. The Board also considered the responses of the Advisers and their affiliates to requests in recent years from regulatory authorities, such as the Securities and Exchange Commission and the Financial Industry Regulatory Authority. The Board also considered certain information relating to the compliance record of Morgan Stanley and its affiliates, including information requests in recent years from regulatory authorities. With respect to the foregoing, including the compliance programs of the Advisers and the Sub-Advisers, the Board noted information regarding the impacts of the Transaction, as well as the Advisers’ and Morgan Stanley’s commitment to keep the Board apprised of developments with respect to its long-term integration plans for the Advisers, the Affiliated Sub-Advisers and existing Morgan Stanley affiliates and their respective personnel.
The Board considered other administrative services provided and to be provided or overseen by the Advisers and their affiliates, including transfer agency and accounting services. The Board evaluated the benefits to shareholders of investing in a fund that is a part of a large fund complex offering exposure to a variety of asset classes and investment disciplines, as well as the ability, in many cases, to exchange an investment among different funds without incurring additional sales charges. The Board noted information that the Transaction was not expected to have any material impact on such matters in the near-term.
In evaluating the nature, extent and quality of the services to be provided under the New Agreements, the Board also considered investment performance information provided for each Fund in connection with the 2020 Annual Approval Process, as well as information provided as of a more recent date. In this regard, the Board compared each Fund’s investment performance to that of comparable funds identified by an independent data provider (the peer group), as well as appropriate benchmark indices and, for certain Funds, a custom peer group of similarly managed funds. The Board also considered, where applicable, Fund-specific performance explanations based on criteria established by the Board in connection with the 2020 Annual Approval Process and, where applicable, performance explanations as of a more recent date. In addition to the foregoing information, it was also noted that the Board has received and discussed with management information throughout the year at periodic intervals comparing each Fund’s performance against applicable benchmark indices and peer groups. In addition, the Board considered each Fund’s performance in light of overall financial market conditions. Where a Fund’s relative underperformance to its peers was significant during one or more specified periods, the Board noted the explanation from the applicable Adviser concerning the Fund’s relative performance versus its peer group.
After consideration of the foregoing factors, among others, and based on their review of the materials provided and the assurances received from, and recommendations of, the Advisers and Morgan Stanley, the Board determined that the Transaction was not expected to adversely affect the nature, extent and quality of services provided to the Funds by the Advisers and their affiliates, including the Affiliated Sub-Advisers, and that the Transaction was not expected to have an adverse effect on the ability of the Advisers and their affiliates, including the Affiliated Sub-Advisers, to provide those services. The Board concluded that the nature, extent and quality of services expected to be provided by the Advisers and the Sub-Advisers, taken as a whole, are appropriate and expected to be consistent with the terms of the New Agreements.
Management Fees and Expenses
The Board considered contractual fee rates payable by each Fund for advisory and administrative services (referred to collectively as “management fees”) in connection with the 2020 Annual Approval Process, as well as information provided as of a more recent date. As part of its review, the Board considered
Parametric
Tax-Managed Emerging Markets Fund
December 31, 2020
Board of Trustees’ Contract Approval — continued
each Fund’s management fees and total expense ratio over various periods, as compared to those of comparable funds, before and after giving effect to any undertaking to waive fees or reimburse expenses. The Board also considered factors, and, where applicable, certain Fund-specific factors, that had an impact on a Fund’s total expense ratio relative to comparable funds, as identified by the Advisers in response to inquiries from the Contract Review Committee. The Board considered that the New Agreements do not change a Fund’s management fee rate or the computation method for calculating such fees, including any separately executed permanent contractual management fee reduction currently in place for the Fund.
The Board also received and considered, where applicable, information about the services offered and the fee rates charged by the Advisers and the Sub-Advisers to other types of accounts with investment objectives and strategies that are substantially similar to and/or managed in a similar investment style as a Fund. In this regard, the Board received information about the differences in the nature and scope of services the Advisers and the Sub-Advisers, as applicable, provide to the Funds as compared to other types of accounts and the material differences in compliance, reporting and other legal burdens and risks to the Advisers and such Sub-Advisers as between each Fund and other types of accounts.
After considering the foregoing information, and in light of the nature, extent and quality of the services expected to be provided by the Advisers and the Sub-Advisers, the Board concluded that the management fees charged for advisory and related services are reasonable with respect to its approval of the New Agreements.
Profitability and “Fall-Out” Benefits
During the 2020 Annual Approval Process, the Board considered the level of profits realized by the Advisers and relevant affiliates thereof, including the Affiliated Sub-Advisers, in providing investment advisory and administrative services to the Funds and to all Eaton Vance funds as a group. The Board considered the level of profits realized without regard to marketing support or other payments by the Advisers and their affiliates to third parties in respect of distribution or other services. In light of the foregoing factors and the nature, extent and quality of the services rendered, the profits realized by the Advisers and their affiliates, including the Sub-Advisers, were not deemed to be excessive by the Board.
The Board noted that Morgan Stanley and the Advisers are expected to realize, over time, cost savings from the Transaction based on eliminating duplicate corporate overhead expenses. The Board considered, however, information from the Advisers and Morgan Stanley that such cost savings are not expected to be realized immediately upon the Closing and that, accordingly, there are currently no specific expected changes in the levels of profitability associated with the advisory and other services provided to the Funds that are contemplated as a result of the Transaction. The Board noted that it will continue to receive information regarding profitability during its annual contract review processes, including the extent to which cost savings and/or other efficiencies result in changes to profitability levels.
The Board also considered direct or indirect fall-out benefits received by the Advisers and their affiliates, including the Affiliated Sub-Advisers, in connection with their respective relationships with the Funds, including the benefits of research services that may be available to the Advisers and their affiliates as a result of securities transactions effected for the Funds and other investment advisory clients. In evaluating the fall-out benefits to be received by the Advisers and their affiliates under the New Agreements, the Board considered whether the Transaction would have an impact on the fall-out benefits currently realized by the Advisers and their affiliates in connection with services provided pursuant to the Current Advisory Agreements.
The Board of each Fund considered that Morgan Stanley may derive reputational and other benefits from its ability to use the names of the Advisers and their affiliates in connection with operating and marketing the Funds. The Board considered that the Transaction, if completed, would significantly increase Morgan Stanley’s assets under management and expand Morgan Stanley’s investment capabilities.
Economies of Scale
The Board also considered the extent to which the Advisers and their affiliates, on the one hand, and the Funds, on the other hand, can expect to realize benefits from economies of scale as the assets of the Funds increase. The Board acknowledged the difficulty in accurately measuring the benefits resulting from economies of scale, if any, with respect to the management of any specific Fund or group of funds. As part of the 2020 Annual Approval Process, the Board reviewed data summarizing the increases and decreases in the assets of the Funds and of all Eaton Vance funds as a group over various time periods, and evaluated the extent to which the total expense ratio of each Fund and the profitability of the Advisers and their affiliates may have been affected by such increases or decreases.
The Board noted that Morgan Stanley and the Advisers are expected to benefit from possible growth of the Funds resulting from enhanced distribution capabilities, including with respect to the Funds’ potential access to Morgan Stanley’s institutional client base. Based upon the foregoing, the Board concluded that the Funds currently share in the benefits from economies of scale, if any, when they are realized by the Advisers, and that the Transaction is not expected to impede a Fund from continuing to benefit from any future economies of scale realized by its Adviser.
Conclusion
Based on its consideration of the foregoing, and such other information it deemed relevant, including the factors and conclusions described above, the Contract Review Committee recommended to the Board approval of the New Agreements. Based on the recommendation of the Contract Review Committee, the Board, including a majority of the Independent Trustees, unanimously voted to approve the New Agreements for the Funds and recommended that shareholders approve the New Agreements.
Parametric
Tax-Managed Emerging Markets Fund
December 31, 2020
Officers and Trustees
Officers of Parametric Tax-Managed Emerging Markets Fund
Eric A. Stein
President
Deidre E. Walsh
Vice President
Maureen A. Gemma
Secretary and Chief Legal Officer
James F. Kirchner
Treasurer
Richard F. Froio
Chief Compliance Officer
Trustees of Parametric Tax-Managed Emerging Markets Fund
William H. Park
Chairperson
Thomas E. Faust Jr.*
Mark R. Fetting
Cynthia E. Frost
George J. Gorman
Valerie A. Mosley
Helen Frame Peters
Keith Quinton
Marcus L. Smith
Susan J. Sutherland
Scott E. Wennerholm
Eaton Vance Funds
IMPORTANT NOTICES
Privacy. The Eaton Vance organization is committed to ensuring your financial privacy. Each entity listed below has adopted privacy policy and procedures (“Privacy Program”) Eaton Vance believes is reasonably designed to protect your personal information and to govern when and with whom Eaton Vance may share your personal information.
| • | | At the time of opening an account, Eaton Vance generally requires you to provide us with certain information such as name, address, social security number, tax status, account numbers, and account balances. This information is necessary for us to both open an account for you and to allow us to satisfy legal requirements such as applicable anti-money laundering reviews and know-your-customer requirements. |
| • | | On an ongoing basis, in the normal course of servicing your account, Eaton Vance may share your information with unaffiliated third parties that perform various services for Eaton Vance and/or your account. These third parties include transfer agents, custodians, broker/dealers and our professional advisers including auditors, accountants, and legal counsel. Eaton Vance may share your personal information with our affiliates. Eaton Vance may also share your information as required or permitted by applicable law. |
| • | | We have adopted a Privacy Program we believe is reasonably designed to protect the confidentiality of your personal information and to prevent unauthorized access to your information. |
| • | | We reserve the right to change our Privacy Program at any time upon proper notification to you. You may want to review our Privacy Program periodically for changes by accessing the link on our homepage: www.eatonvance.com. |
Our pledge of protecting your personal information applies to the following entities within the Eaton Vance organization: the Eaton Vance Family of Funds, Eaton Vance Management, Eaton Vance WaterOak Advisors, Eaton Vance Distributors, Inc., Eaton Vance Trust Company, Eaton Vance Management (International) Limited, Eaton Vance Advisers International Ltd., Eaton Vance Global Advisors Limited, Eaton Vance Management’s Real Estate Investment Group, Boston Management and Research, Calvert Research and Management, and Calvert Funds. This notice supersedes all previously issued privacy disclosures. For more information about Eaton Vance’s Privacy Program or about how your personal information may be used, please call 1-800-262-1122.
Delivery of Shareholder Documents. The Securities and Exchange Commission (SEC) permits funds to deliver only one copy of shareholder documents, including prospectuses, proxy statements and shareholder reports, to fund investors with multiple accounts at the same residential or post office box address. This practice is often called “householding” and it helps eliminate duplicate mailings to shareholders. Eaton Vance, or your financial intermediary, may household the mailing of your documents indefinitely unless you instruct Eaton Vance, or your financial intermediary, otherwise. If you would prefer that your Eaton Vance documents not be householded, please contact Eaton Vance at 1-800-260-0761, or contact your financial intermediary. Your instructions that householding not apply to delivery of your Eaton Vance documents will typically be effective within 30 days of receipt by Eaton Vance or your financial intermediary.
Portfolio Holdings. Each Eaton Vance Fund and its underlying Portfolio(s) (if applicable) files a schedule of portfolio holdings on Part F to Form N-PORT with the SEC. Certain information filed on Form N-PORT may be viewed on the Eaton Vance website at www.eatonvance.com, by calling Eaton Vance at 1-800-260-0761 or in the EDGAR database on the SEC’s website at www.sec.gov.
Proxy Voting. From time to time, funds are required to vote proxies related to the securities held by the funds. The Eaton Vance Funds or their underlying Portfolios (if applicable) vote proxies according to a set of policies and procedures approved by the Funds’ and Portfolios’ Boards. You may obtain a description of these policies and procedures and information on how the Funds or Portfolios voted proxies relating to portfolio securities during the most recent 12-month period ended June 30, without charge, upon request, by calling 1-800-260-0761 and by accessing the SEC’s website at www.sec.gov.
This Page Intentionally Left Blank
This Page Intentionally Left Blank
Investment Adviser and Administrator
Eaton Vance Management
Two International Place
Boston, MA 02110
Investment Sub-Adviser
Parametric Portfolio Associates LLC
800 Fifth Avenue, Suite 2800
Seattle, WA 98104
Principal Underwriter*
Eaton Vance Distributors, Inc.
Two International Place
Boston, MA 02110
(617) 482-8260
Custodian
State Street Bank and Trust Company
State Street Financial Center, One Lincoln Street
Boston, MA 02111
Transfer Agent
BNY Mellon Investment Servicing (US) Inc.
Attn: Eaton Vance Funds
P.O. Box 9653
Providence, RI 02940-9653
(800) 260-0761
Fund Offices
Two International Place
Boston, MA 02110
| * | FINRA BrokerCheck. Investors may check the background of their Investment Professional by contacting the Financial Industry Regulatory Authority (FINRA). FINRA BrokerCheck is a free tool to help investors check the professional background of current and former FINRA-registered securities firms and brokers. FINRA BrokerCheck is available by calling 1-800-289-9999 and at www.FINRA.org. The FINRA BrokerCheck brochure describing this program is available to investors at www.FINRA.org. |

7736 12.31.20
Not required in this filing
| Item 3. | Audit Committee Financial Expert |
Not required in this filing
| Item 4. | Principal Accountant Fees and Services |
Not required in this filing
| Item 5. | Audit Committee of Listed Registrants |
Not applicable.
| Item 6. | Schedule of Investments |
Please see schedule of investments contained in the Report to Stockholders included under Item 1 of this Form N-CSR.
| Item 7. | Disclosure of Proxy Voting Policies and Procedures for Closed-End Management Investment Companies |
Not applicable.
| Item 8. | Portfolio Managers of Closed-End Management Investment Companies |
Not applicable.
| Item 9. | Purchases of Equity Securities by Closed-End Management Investment Company and Affiliated Purchasers |
Not applicable.
| Item 10. | Submission of Matters to a Vote of Security Holders |
No material changes.
| Item 11. | Controls and Procedures |
(a) It is the conclusion of the registrant’s principal executive officer and principal financial officer that the effectiveness of the registrant’s current disclosure controls and procedures (such disclosure controls and procedures having been evaluated within 90 days of the date of this filing) provide reasonable assurance that the information required to be disclosed by the registrant has been recorded, processed, summarized and reported within the time period specified in the Commission’s rules and forms and that the information required to be disclosed by the registrant has been accumulated and communicated to the registrant’s principal executive officer and principal financial officer in order to allow timely decisions regarding required disclosure.
(b) There have been no changes in the registrant’s internal controls over financial reporting during the period covered by this report that has materially affected, or is reasonably likely to materially affect, the registrant’s internal control over financial reporting.
| Item 12. | Disclosure of Securities Lending Activities for Closed-End Management Investment Companies |
Not applicable.
Signatures
Pursuant to the requirements of the Securities Exchange Act of 1934 and the Investment Company Act of 1940, the registrant has duly caused this report to be signed on its behalf by the undersigned, thereunto duly authorized.
| | |
| Eaton Vance Series Trust II |
| |
| By: | | /s/ Eric A. Stein |
| | Eric A. Stein |
| | President |
| |
| Date: | | February 24, 2021 |
Pursuant to the requirements of the Securities Exchange Act of 1934 and the Investment Company Act of 1940, this report has been signed below by the following persons on behalf of the registrant and in the capacities and on the dates indicated.
| | |
| By: | | /s/ James F. Kirchner |
| | James F. Kirchner |
| | Treasurer |
| |
| Date: | | February 24, 2021 |
| |
| By: | | /s/ Eric A. Stein |
| | Eric A. Stein |
| | President |
| |
| Date: | | February 24, 2021 |