UNITED STATES
SECURITIES AND EXCHANGE COMMISSION
Washington, D.C. 20549
Form N-CSR
CERTIFIED SHAREHOLDER REPORT OF REGISTERED
MANAGEMENT INVESTMENT COMPANIES
Investment Company Act File Number: 811-02258
Eaton Vance Series Trust II
(Exact Name of Registrant as Specified in Charter)
Two International Place, Boston, Massachusetts 02110
(Address of Principal Executive Offices)
Deidre E. Walsh
Two International Place, Boston, Massachusetts 02110
(Name and Address of Agent for Services)
(617) 482-8260
(Registrant’s Telephone Number)
October 31
Date of Fiscal Year End
October 31, 2021
Date of Reporting Period
Item 1. Reports to Stockholders

Eaton Vance
Income Fund of Boston
Annual Report
October 31, 2021

Commodity Futures Trading Commission Registration. The Commodity Futures Trading Commission (“CFTC”) has adopted regulations that subject registered investment companies and advisers to regulation by the CFTC if a fund invests more than a prescribed level of its assets in certain CFTC-regulated instruments (including futures, certain options and swap agreements) or markets itself as providing investment exposure to such instruments. The investment adviser has claimed an exclusion from the definition of “commodity pool operator” under the Commodity Exchange Act with respect to its management of the Fund. Accordingly, neither the Fund nor the adviser with respect to the operation of the Fund is subject to CFTC regulation. Because of its management of other strategies, the Fund’s adviser is registered with the CFTC as a commodity pool operator. The adviser is also registered as a commodity trading advisor.
Fund shares are not insured by the FDIC and are not deposits or other obligations of, or guaranteed by, any depository institution. Shares are subject to investment risks, including possible loss of principal invested.
This report must be preceded or accompanied by a current summary prospectus or prospectus. Before investing, investors should consider carefully the investment objective, risks, and charges and expenses of a mutual fund. This and other important information is contained in the summary prospectus and prospectus, which can be obtained from a financial intermediary. Prospective investors should read the prospectus carefully before investing. For further information, please call 1-800-262-1122.
Annual Report October 31, 2021
Eaton Vance
Income Fund of Boston
Eaton Vance
Income Fund of Boston
October 31, 2021
Management’s Discussion of Fund Performance1
Economic and Market Conditions
For the 12-month period ended October 31, 2021, the U.S. high yield market rebounded from the prior COVID-19 pandemic-hampered year on the strength of a recovering economy and widespread vaccinations.
In the final months of calendar 2020, the outcome of the U.S. presidential election and the development of vaccines were bullish for high yield markets and riskier assets. Performance across the global high yield landscape was also buoyed in late 2020 by congressional passage of a new fiscal stimulus package. Meanwhile, global central banks reaffirmed that their monetary policies would remain accommodative for the foreseeable future.
In the first quarter of calendar 2021, the introduction of vaccines, government stimulus, and accommodative central banks were supportive for risk markets. However, concerns that increased fiscal spending and surging growth might hasten increases in short-term interest rates moderated returns.
In the second quarter of calendar 2021, U.S. and global high yield markets posted strong returns amid successful vaccine rollouts, accommodative central bank policies, and a robust economic rebound. This good news was tempered by elevated inflation readings in the U.S.
U.S. and global high yield markets were modest in the third quarter of calendar 2021. Global growth remained above trend, and the fundamentals of high yield issuers continued to improve. However, inflation numbers increased and investors became unsettled by a potential economic slowdown in China and increased private sector intervention by the Chinese Communist Party. In the final month of the period, a report showed inflation rising faster than anticipated, sending high yield bond returns into negative territory for the month.
Nevertheless, the ICE BofA U.S. High Yield Index returned 10.74% for the one-year period ended October 31, 2021. During the same period, the Bloomberg U.S. Aggregate Bond Index returned -0.48%.
High yield issuance during the 12-month period totaled $500 billion, up from $485 billion in the prior one-year period. By period-end, the trailing 12-month par-weighted default rate decreased to 0.36% from 6.34% at the end of the prior one-year period.
Fund Performance
For the 12-month period ended October 31, 2021, Eaton Vance Income Fund of Boston (the Fund) returned 10.23% for Class A shares at net asset value (NAV), underperforming its primary benchmark, the ICE BofA U.S. High Yield Index (the Index), which returned 10.74%.
The Fund’s sector allocations detracted from performance relative to the Index during the period, particularly overweight exposures to the health care and insurance sectors. The Fund’s allocation to cash also weighed on relative returns.
Although the Fund’s credit selection by sector contributed overall, its selections in the technology and health care sectors detracted from relative returns. Selections in the services, energy, gaming, and environmental sectors had a positive impact on performance relative to the Index. Credit selections within the energy sector was aided by the strong recovery in the energy market during the period and the Fund’s focus on exploration and production companies with higher quality assets.
Selections by credit rating detracted from relative performance during the period, with B rated and CCC rated securities the most detrimental to Fund returns relative to the Index during the period. While allocations by credit-rating categories had an overall positive impact on relative performance, an underweight exposure to the C rated sector detracted from relative returns as those issuers posted the best performance within the Index. An out-of-Index allocation to nonrated credits, an underweight exposure to BB rated credits, and an overweight exposure to CCC rated credits benefited relative returns during the period.
The Fund’s shorter-than-Index duration hurt returns during the period. An underweight exposure to bonds with durations of more than 10 years and an overweight exposure to bonds with durations of less than 2 years detracted most. While credit selection by duration segment overall contributed to relative performance, selections within bonds with durations between 2-5 years detracted. Bond selections with durations between 5-10 years added to relative returns during the period.
See Endnotes and Additional Disclosures in this report.
Past performance is no guarantee of future results. Returns are historical and are calculated by determining the percentage change in net asset value (NAV) or offering price (as applicable) with all distributions reinvested. Investment return and principal value will fluctuate so that shares, when redeemed, may be worth more or less than their original cost. Performance for periods less than or equal to one year is cumulative. Performance is for the stated time period only; due to market volatility, current Fund performance may be lower or higher than the quoted return. For performance as of the most recent month-end, please refer to eatonvance.com.
Eaton Vance
Income Fund of Boston
October 31, 2021
Performance2,3
Portfolio Managers Kelley Baccei Gerrity, Stephen C. Concannon, CFA and Jeffrey D. Mueller
| | | | | | | | | | | | | | | | | | | | |
| % Average Annual Total Returns | | Class
Inception Date | | | Performance
Inception Date | | | One Year | | | Five Years | | | Ten Years | |
| | | | | |
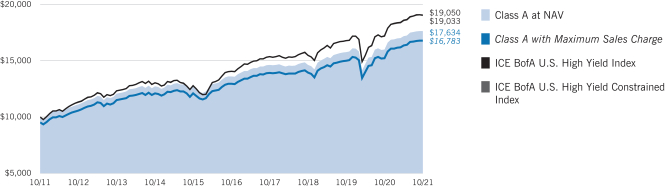
Class A at NAV | | | 06/15/1972 | | | | 06/15/1972 | | | | 10.23 | % | | | 5.34 | % | | | 5.83 | % |
Class A with 4.75% Maximum Sales Charge | | | — | | | | — | | | | 4.92 | | | | 4.33 | | | | 5.31 | |
Class C at NAV | | | 06/21/2002 | | | | 06/15/1972 | | | | 9.39 | | | | 4.53 | | | | 5.05 | |
Class C with 1% Maximum Sales Charge | | | — | | | | — | | | | 8.39 | | | | 4.53 | | | | 5.05 | |
Class I at NAV | | | 07/01/1999 | | | | 06/15/1972 | | | | 10.50 | | | | 5.60 | | | | 6.09 | |
Class R at NAV | | | 01/05/2004 | | | | 06/15/1972 | | | | 9.95 | | | | 5.10 | | | | 5.58 | |
Class R6 at NAV | | | 07/01/2014 | | | | 06/15/1972 | | | | 10.39 | | | | 5.69 | | | | 6.16 | |
|
| |
| | | | | |
ICE BofA U.S. High Yield Index | | | — | | | | — | | | | 10.74 | % | | | 6.25 | % | | | 6.65 | % |
ICE BofA U.S. High Yield Constrained Index | | | — | | | | — | | | | 10.75 | | | | 6.23 | | | | 6.64 | |
| | | | | |
| % Total Annual Operating Expense Ratios4 | | Class A | | | Class C | | | Class I | | | Class R | | | Class R6 | |
| | | | | |
Gross | | | 1.03 | % | | | 1.78 | % | | | 0.78 | % | | | 1.28 | % | | | 0.69 | % |
Net | | | 1.00 | | | | 1.75 | | | | 0.75 | | | | 1.25 | | | | 0.66 | |
Growth of $10,000
This graph shows the change in value of a hypothetical investment of $10,000 in Class A of the Fund for the period indicated. For comparison, the same investment is shown in the indicated index.
| | | | | | | | | | | | | | | | |
| Growth of Investment3 | | Amount Invested | | | Period Beginning | | | At NAV | | | With Maximum Sales Charge | |
| | | | |
Class C | | | $10,000 | | | | 10/31/2011 | | | | $16,372 | | | | N.A. | |
Class I | | | $250,000 | | | | 10/31/2011 | | | | $451,931 | | | | N.A. | |
Class R | | | $10,000 | | | | 10/31/2011 | | | | $17,218 | | | | N.A. | |
Class R6 | | | $1,000,000 | | | | 10/31/2011 | | | | $1,819,341 | | | | N.A. | |
See Endnotes and Additional Disclosures in this report.
Past performance is no guarantee of future results. Returns are historical and are calculated by determining the percentage change in net asset value (NAV) or offering price (as applicable) with all distributions reinvested. Investment return and principal value will fluctuate so that shares, when redeemed, may be worth more or less than their original cost. Performance for periods less than or equal to one year is cumulative. Performance is for the stated time period only; due to market volatility, current Fund performance may be lower or higher than the quoted return. For performance as of the most recent month-end, please refer to eatonvance.com.
Eaton Vance
Income Fund of Boston
October 31, 2021
Fund Profile5
Credit Quality (% of total investments)6,7
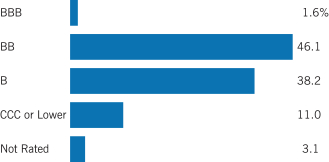
See Endnotes and Additional Disclosures in this report.
Eaton Vance
Income Fund of Boston
October 31, 2021
Endnotes and Additional Disclosures
| 1 | The views expressed in this report are those of the portfolio manager(s) and are current only through the date stated at the top of this page. These views are subject to change at any time based upon market or other conditions, and Eaton Vance and the Fund(s) disclaim any responsibility to update such views. These views may not be relied upon as investment advice and, because investment decisions are based on many factors, may not be relied upon as an indication of trading intent on behalf of any Eaton Vance fund. This commentary may contain statements that are not historical facts, referred to as “forward-looking statements.” The Fund’s actual future results may differ significantly from those stated in any forward-looking statement, depending on factors such as changes in securities or financial markets or general economic conditions, the volume of sales and purchases of Fund shares, the continuation of investment advisory, administrative and service contracts, and other risks discussed from time to time in the Fund’s filings with the Securities and Exchange Commission. |
| 2 | ICE BofA U.S. High Yield Index is an unmanaged index of below-investment grade U.S. corporate bonds. ICE BofA U.S. High Yield Constrained Index is an unmanaged index of below-investment grade U.S. corporate bonds, with issuer exposure capped at 2%. ICE® BofA® indices are not for redistribution or other uses; provided “as is”, without warranties, and with no liability. Eaton Vance has prepared this report and ICE Data Indices, LLC does not endorse it, or guarantee, review, or endorse Eaton Vance’s products. BofA® is a licensed registered trademark of Bank of America Corporation in the United States and other countries. Unless otherwise stated, index returns do not reflect the effect of any applicable sales charges, commissions, expenses, taxes or leverage, as applicable. It is not possible to invest directly in an index. |
| 3 | Total Returns at NAV do not include applicable sales charges. If sales charges were deducted, the returns would be lower. Total Returns shown with maximum sales charge reflect the stated maximum sales charge. Unless otherwise stated, performance does not reflect the deduction of taxes on Fund distributions or redemptions of Fund shares. |
Performance prior to the inception date of a class may be linked to the performance of an older class of the Fund. This linked performance is adjusted for any applicable sales charge, but is not adjusted for class expense differences. If adjusted for such differences, the performance would be different. The performance of Class R6 is linked to Class I. Performance presented in the Financial Highlights included in the financial statements is not linked.
| 4 | Source: Fund prospectus. Net expense ratios reflect a contractual expense reimbursement that continues through 2/28/22. Without the reimbursement, if applicable, performance would have been lower. The expense ratios for the current reporting period can be found in the Financial Highlights section of this report. |
| 6 | Ratings are based on Moody’s Investors Service, Inc. (“Moody’s”), S&P Global Ratings (“S&P”) or Fitch Ratings (“Fitch”), as applicable. For purposes of ratings restrictions, the average of Moody’s, S&P and Fitch is used. Ratings, which are subject to change, apply to the creditworthiness of the issuers of the underlying securities and not to the Fund or its shares. Credit ratings measure the quality of a bond based on the issuer’s creditworthiness, with ratings ranging from AAA, |
| | being the highest, to D, being the lowest based on S&P’s measures. Ratings of BBB or higher by S&P or Fitch (Baa or higher by Moody’s) are considered to be investment-grade quality. Credit ratings are based largely on the ratings agency’s analysis at the time of rating. The rating assigned to any particular security is not necessarily a reflection of the issuer’s current financial condition and does not necessarily reflect its assessment of the volatility of a security’s market value or of the liquidity of an investment in the security. Holdings designated as “Not Rated” (if any) are not rated by the national ratings agencies stated above. |
| 7 | Excludes cash and cash equivalents. |
Fund profile subject to change due to active management.
Additional Information
Bloomberg U.S. Aggregate Bond Index is an unmanaged index of domestic investment-grade bonds, including corporate, government and mortgage-backed securities.
Duration is a measure of the expected change in price of a bond — in percentage terms — given a one percent change in interest rates, all else being constant. Securities with lower durations tend to be less sensitive to interest rate changes.
Risk asset is a term broadly used to describe any asset that is not a high-quality government bond. A risk market refers to markets in these assets.
Eaton Vance
Income Fund of Boston
October 31, 2021
Fund Expenses
Example: As a Fund shareholder, you incur two types of costs: (1) transaction costs, including sales charges (loads) on purchases and redemption fees (if applicable); and (2) ongoing costs, including management fees; distribution and/or service fees; and other Fund expenses. This Example is intended to help you understand your ongoing costs (in dollars) of Fund investing and to compare these costs with the ongoing costs of investing in other mutual funds. The Example is based on an investment of $1,000 invested at the beginning of the period and held for the entire period (May 1, 2021 – October 31, 2021).
Actual Expenses: The first section of the table below provides information about actual account values and actual expenses. You may use the information in this section, together with the amount you invested, to estimate the expenses that you paid over the period. Simply divide your account value by $1,000 (for example, an $8,600 account value divided by $1,000 = 8.6), then multiply the result by the number in the first section under the heading entitled “Expenses Paid During Period” to estimate the expenses you paid on your account during this period.
Hypothetical Example for Comparison Purposes: The second section of the table below provides information about hypothetical account values and hypothetical expenses based on the actual Fund expense ratio and an assumed rate of return of 5% per year (before expenses), which is not the actual Fund return. The hypothetical account values and expenses may not be used to estimate the actual ending account balance or expenses you paid for the period. You may use this information to compare the ongoing costs of investing in your Fund and other funds. To do so, compare this 5% hypothetical example with the 5% hypothetical examples that appear in the shareholder reports of the other funds.
Please note that the expenses shown in the table are meant to highlight your ongoing costs only and do not reflect any transactional costs, such as sales charges (loads) or redemption fees (if applicable). Therefore, the second section of the table is useful in comparing ongoing costs only, and will not help you determine the relative total costs of owning different funds. In addition, if these transactional costs were included, your costs would be higher.
| | | | | | | | | | | | | | | | |
| | | Beginning
Account Value
(5/1/21) | | | Ending
Account Value
(10/31/21) | | | Expenses Paid
During Period*
(5/1/21 – 10/31/21) | | | Annualized
Expense
Ratio | |
|
Actual | |
Class A | | $ | 1,000.00 | | | $ | 1,026.80 | | | $ | 5.11 | ** | | | 1.00 | % |
Class C | | $ | 1,000.00 | | | $ | 1,021.20 | | | $ | 8.81 | ** | | | 1.73 | % |
Class I | | $ | 1,000.00 | | | $ | 1,026.20 | | | $ | 3.83 | ** | | | 0.75 | % |
Class R | | $ | 1,000.00 | | | $ | 1,025.60 | | | $ | 6.33 | ** | | | 1.24 | % |
Class R6 | | $ | 1,000.00 | | | $ | 1,026.70 | | | $ | 3.37 | ** | | | 0.66 | % |
| |
Hypothetical | |
(5% return per year before expenses) | |
Class A | | $ | 1,000.00 | | | $ | 1,020.16 | | | $ | 5.09 | ** | | | 1.00 | % |
Class C | | $ | 1,000.00 | | | $ | 1,016.48 | | | $ | 8.79 | ** | | | 1.73 | % |
Class I | | $ | 1,000.00 | | | $ | 1,021.43 | | | $ | 3.82 | ** | | | 0.75 | % |
Class R | | $ | 1,000.00 | | | $ | 1,018.96 | | | $ | 6.31 | ** | | | 1.24 | % |
Class R6 | | $ | 1,000.00 | | | $ | 1,021.90 | | | $ | 3.36 | ** | | | 0.66 | % |
| * | Expenses are equal to the Fund’s annualized expense ratio for the indicated Class, multiplied by the average account value over the period, multiplied by 184/365 (to reflect the one-half year period). The Example assumes that the $1,000 was invested at the net asset value per share determined at the close of business on April 30, 2021. |
| ** | Absent an allocation of certain expenses to affiliates, expenses would be higher. |
Eaton Vance
Income Fund of Boston
October 31, 2021
Portfolio of Investments
| | | | | | | | | | |
| Common Stocks — 1.4% | |
| Security | | | | Shares | | | Value | |
|
| Consumer Products — 0.0%(1) | |
| | | |
HF Holdings, Inc.(2)(3)(4) | | | | | 3,400 | | | $ | 1,837,836 | |
| |
| | | | $ | 1,837,836 | |
|
| Energy — 0.4% | |
| | | |
Ascent CNR Corp., Class A(2)(3)(4) | | | | | 32,029,863 | | | $ | 4,163,882 | |
| | | |
Cheniere Energy, Inc.(2) | | | | | 186,427 | | | | 19,276,552 | |
| | | |
Nine Point Energy Holdings, Inc.(2)(3)(4) | | | | | 157,059 | | | | 0 | |
| |
| | | | $ | 23,440,434 | |
|
| Environmental — 0.2% | |
| | | |
GFL Environmental, Inc. | | | | | 300,300 | | | $ | 12,357,345 | |
| |
| | | | $ | 12,357,345 | |
|
| Gaming — 0.0% | |
| | | |
New Cotai Participation Corp., Class B(2)(3)(4) | | | | | 36 | | | $ | 0 | |
| |
| | | | $ | 0 | |
|
| Homebuilders & Real Estate — 0.2% | |
| | | |
VICI Properties, Inc. | | | | | 524,000 | | | $ | 15,379,400 | |
| |
| | | | $ | 15,379,400 | |
|
| Services — 0.6% | |
| | | |
Hertz Global Holdings, Inc. (non-registered)(2)(5) | | | | | 1,962,210 | | | $ | 39,489,476 | |
| |
| | | | $ | 39,489,476 | |
| |
Total Common Stocks
(identified cost $63,635,923) | | | $ | 92,504,491 | |
|
| Convertible Bonds — 0.1% | |
| Security | | | | Principal
Amount
(000’s omitted) | | | Value | |
|
| Air Transportation — 0.1% | |
| | | |
Air Transport Services Group, Inc., 1.125%, 10/15/24 | | | | $ | 3,049 | | | $ | 3,239,562 | |
| |
| | | | $ | 3,239,562 | |
|
| Leisure — 0.0%(1) | |
| | | |
Royal Caribbean Cruises, Ltd., 4.25%, 6/15/23 | | | | $ | 1,533 | | | $ | 2,075,418 | |
| |
| | | | $ | 2,075,418 | |
| |
Total Convertible Bonds
(identified cost $4,354,208) | | | $ | 5,314,980 | |
| | | | | | | | | | |
| Convertible Preferred Stocks — 0.3% | |
| Security | | | | Shares | | | Value | |
|
| Energy — 0.0% | |
| | | |
Nine Point Energy Holdings, Inc., Series A, 12.00% (PIK)(2)(3)(4) | | | | | 2,928 | | | $ | 0 | |
| |
| | | | $ | 0 | |
|
| Environmental — 0.1% | |
| | | |
GFL Environmental, Inc., 6.00% | | | | | 98,016 | | | $ | 9,246,830 | |
| |
| | | | $ | 9,246,830 | |
|
| Healthcare — 0.2% | |
| | | |
Becton Dickinson and Co., Series B, 6.00% | | | | | 213,119 | | | $ | 11,210,059 | |
| |
| | | | $ | 11,210,059 | |
| |
Total Convertible Preferred Stocks
(identified cost $19,203,117) | | | $ | 20,456,889 | |
|
| Corporate Bonds — 86.2% | |
| Security | | | | Principal
Amount*
(000’s omitted) | | | Value | |
|
| Aerospace — 2.5% | |
|
| Bombardier, Inc.: | |
| | | |
7.125%, 6/15/26(6) | | | | | 7,440 | | | $ | 7,812,000 | |
| | | |
7.50%, 12/1/24(6) | | | | | 3,340 | | | | 3,481,950 | |
| | | |
7.875%, 4/15/27(6) | | | | | 14,584 | | | | 15,180,850 | |
|
| BWX Technologies, Inc.: | |
| | | |
4.125%, 6/30/28(6) | | | | | 8,345 | | | | 8,460,119 | |
| | | |
4.125%, 4/15/29(6) | | | | | 7,093 | | | | 7,207,056 | |
| | | |
Moog, Inc., 4.25%, 12/15/27(6) | | | | | 10,223 | | | | 10,536,642 | |
| | | |
Rolls-Royce PLC, 5.75%, 10/15/27(6) | | | | | 29,407 | | | | 32,577,075 | |
| | | |
Science Applications International Corp., 4.875%, 4/1/28(6) | | | | | 12,585 | | | | 12,978,281 | |
| | | |
TransDigm UK Holdings PLC, 6.875%, 5/15/26 | | | | | 5,020 | | | | 5,293,439 | |
|
| TransDigm, Inc.: | |
| | | |
4.625%, 1/15/29(6) | | | | | 11,770 | | | | 11,711,150 | |
| | | |
5.50%, 11/15/27 | | | | | 15,419 | | | | 15,804,475 | |
| | | |
6.25%, 3/15/26(6) | | | | | 16,947 | | | | 17,709,615 | |
| | | |
6.375%, 6/15/26 | | | | | 9,600 | | | | 9,936,000 | |
| | | |
7.50%, 3/15/27 | | | | | 7,253 | | | | 7,615,650 | |
| |
| | | | $ | 166,304,302 | |
|
| Air Transportation — 1.2% | |
|
| Air Canada: | |
| | | |
3.875%, 8/15/26(6) | | | | | 7,819 | | | $ | 7,926,511 | |
| | | |
4.625%, 8/15/29(6) | | CAD | | | 7,161 | | | | 5,786,199 | |
| | | | |
| | 7 | | See Notes to Financial Statements. |
Eaton Vance
Income Fund of Boston
October 31, 2021
Portfolio of Investments — continued
| | | | | | | | | | |
| Security | | | | Principal
Amount*
(000’s omitted) | | | Value | |
|
| Air Transportation (continued) | |
|
| American Airlines, Inc./AAdvantage Loyalty IP, Ltd.: | |
| | | |
5.50%, 4/20/26(6) | | | | | 19,773 | | | $ | 20,766,593 | |
| | | |
5.75%, 4/20/29(6) | | | | | 19,773 | | | | 21,305,408 | |
|
| United Airlines, Inc.: | |
| | | |
4.375%, 4/15/26(6) | | | | | 8,188 | | | | 8,480,476 | |
| | | |
4.625%, 4/15/29(6) | | | | | 12,596 | | | | 13,001,969 | |
| |
| | | | $ | 77,267,156 | |
|
| Automotive & Auto Parts — 4.9% | |
| | | |
Clarios Global, L.P., 6.75%, 5/15/25(6) | | | | | 3,642 | | | $ | 3,841,836 | |
|
| Clarios Global, L.P./Clarios US Finance Co.: | |
| | | |
4.375%, 5/15/26(7) | | EUR | | | 23,368 | | | | 27,691,982 | |
| | | |
6.25%, 5/15/26(6) | | | | | 7,212 | | | | 7,554,570 | |
| | | |
8.50%, 5/15/27(6) | | | | | 5,696 | | | | 6,057,810 | |
|
| Ford Motor Co.: | |
| | | |
4.75%, 1/15/43 | | | | | 19,531 | | | | 21,359,687 | |
| | | |
7.45%, 7/16/31 | | | | | 15,725 | | | | 20,835,625 | |
| | | |
8.50%, 4/21/23 | | | | | 14,165 | | | | 15,549,629 | |
| | | |
9.00%, 4/22/25 | | | | | 23,301 | | | | 28,048,579 | |
| | | |
9.625%, 4/22/30 | | | | | 9,753 | | | | 14,062,656 | |
|
| Ford Motor Credit Co., LLC: | |
| | | |
1.36%, (3 mo. USD LIBOR + 1.24%), 2/15/23(8) | | | | | 2,470 | | | | 2,473,081 | |
| | | |
2.90%, 2/16/28 | | | | | 4,218 | | | | 4,186,491 | |
| | | |
3.087%, 1/9/23 | | | | | 3,749 | | | | 3,818,169 | |
| | | |
3.37%, 11/17/23 | | | | | 4,486 | | | | 4,609,365 | |
| | | |
3.625%, 6/17/31 | | | | | 5,077 | | | | 5,140,462 | |
| | | |
3.815%, 11/2/27 | | | | | 20,089 | | | | 20,869,257 | |
| | | |
4.00%, 11/13/30 | | | | | 9,839 | | | | 10,281,755 | |
| | | |
4.125%, 8/17/27 | | | | | 35,978 | | | | 38,226,625 | |
| | | |
4.271%, 1/9/27 | | | | | 4,368 | | | | 4,641,393 | |
| | | |
4.375%, 8/6/23 | | | | | 2,493 | | | | 2,595,836 | |
| | | |
5.113%, 5/3/29 | | | | | 5,476 | | | | 6,092,050 | |
| | | |
5.125%, 6/16/25 | | | | | 9,083 | | | | 9,866,409 | |
| | | |
5.584%, 3/18/24 | | | | | 1,976 | | | | 2,131,610 | |
|
| Goodyear Tire & Rubber Co. (The): | |
| | | |
5.00%, 7/15/29(6) | | | | | 20,783 | | | | 21,952,044 | |
| | | |
5.25%, 7/15/31(6) | | | | | 16,742 | | | | 17,838,936 | |
| | | |
Real Hero Merger Sub 2, Inc., 6.25%, 2/1/29(6) | | | | | 6,463 | | | | 6,648,811 | |
| | | |
Wheel Pros, Inc., 6.50%, 5/15/29(6) | | | | | 12,984 | | | | 12,665,048 | |
| |
| | | | $ | 319,039,716 | |
|
| Banking & Thrifts — 0.2% | |
| | | |
JPMorgan Chase & Co., Series HH, 4.60% to 2/1/25(9)(10) | | | | | 12,584 | | | $ | 12,887,484 | |
| |
| | | | $ | 12,887,484 | |
| | | | | | | | | | |
| Security | | | | Principal
Amount*
(000’s omitted) | | | Value | |
|
| Broadcasting — 2.6% | |
| | | |
Audacy Capital Corp., 6.75%, 3/31/29(6) | | | | | 16,478 | | | $ | 16,358,782 | |
| | | |
Diamond Sports Group, LLC/Diamond Sports Finance Co., 5.375%, 8/15/26(6) | | | | | 19,767 | | | | 11,207,988 | |
| | | |
iHeartCommunications, Inc., 6.375%, 5/1/26 | | | | | 670 | | | | 697,729 | |
|
| Netflix, Inc.: | |
| | | |
4.875%, 6/15/30(6) | | | | | 13,181 | | | | 15,504,415 | |
| | | |
5.375%, 11/15/29(6) | | | | | 5,536 | | | | 6,684,526 | |
| | | |
5.50%, 2/15/22 | | | | | 8,685 | | | | 8,815,275 | |
| | | |
5.875%, 2/15/25 | | | | | 5,730 | | | | 6,503,550 | |
| | | |
5.875%, 11/15/28 | | | | | 12,610 | | | | 15,365,033 | |
| | | |
Playtika Holding Corp., 4.25%, 3/15/29(6) | | | | | 14,062 | | | | 14,118,951 | |
|
| Sirius XM Radio, Inc.: | |
| | | |
3.125%, 9/1/26(6) | | | | | 9,505 | | | | 9,528,762 | |
| | | |
3.875%, 9/1/31(6) | | | | | 9,550 | | | | 9,185,954 | |
| | | |
4.125%, 7/1/30(6) | | | | | 12,958 | | | | 12,916,405 | |
| | | |
5.00%, 8/1/27(6) | | | | | 16,487 | | | | 17,228,915 | |
| | | |
Townsquare Media, Inc., 6.875%, 2/1/26(6) | | | | | 15,374 | | | | 16,085,047 | |
| | | |
Univision Communications, Inc., 4.50%, 5/1/29(6) | | | | | 11,539 | | | | 11,688,430 | |
| |
| | | | $ | 171,889,762 | |
|
| Building Materials — 2.0% | |
|
| Builders FirstSource, Inc.: | |
| | | |
4.25%, 2/1/32(6) | | | | | 15,452 | | | $ | 15,596,940 | |
| | | |
5.00%, 3/1/30(6) | | | | | 10,586 | | | | 11,194,854 | |
| | | |
6.75%, 6/1/27(6) | | | | | 14,975 | | | | 15,798,625 | |
| | | |
Masonite International Corp., 5.375%, 2/1/28(6) | | | | | 12,664 | | | | 13,313,030 | |
| | | |
PGT Innovations, Inc., 4.375%, 10/1/29(6) | | | | | 13,118 | | | | 13,019,615 | |
| | | |
SRM Escrow Issuer, LLC, 6.00%, 11/1/28(6) | | | | | 30,485 | | | | 31,742,506 | |
|
| Standard Industries, Inc.: | |
| | | |
4.375%, 7/15/30(6) | | | | | 20,136 | | | | 20,161,170 | |
| | | |
4.75%, 1/15/28(6) | | | | | 5,000 | | | | 5,162,500 | |
| | | |
5.00%, 2/15/27(6) | | | | | 3,894 | | | | 4,001,085 | |
| |
| | | | $ | 129,990,325 | |
|
| Cable & Satellite TV — 2.4% | |
|
| CCO Holdings, LLC/CCO Holdings Capital Corp.: | |
| | | |
4.25%, 2/1/31(6) | | | | | 6,415 | | | $ | 6,394,985 | |
| | | |
4.50%, 8/15/30(6) | | | | | 34,399 | | | | 35,057,053 | |
| | | |
4.75%, 3/1/30(6) | | | | | 23,215 | | | | 23,998,506 | |
| | | |
5.375%, 6/1/29(6) | | | | | 4,414 | | | | 4,748,361 | |
|
| CSC Holdings, LLC: | |
| | | |
3.375%, 2/15/31(6) | | | | | 8,257 | | | | 7,530,384 | |
| | | |
4.125%, 12/1/30(6) | | | | | 18,990 | | | | 18,208,656 | |
| | | |
5.75%, 1/15/30(6) | | | | | 3,619 | | | | 3,575,391 | |
| | | | |
| | 8 | | See Notes to Financial Statements. |
Eaton Vance
Income Fund of Boston
October 31, 2021
Portfolio of Investments — continued
| | | | | | | | | | | | |
| Security | | | | | Principal
Amount*
(000’s omitted) | | | Value | |
|
| Cable & Satellite TV (continued) | |
|
| CSC Holdings, LLC: (continued) | |
| | | |
5.875%, 9/15/22 | | | | | | | 15,715 | | | $ | 16,225,738 | |
| | | |
6.50%, 2/1/29(6) | | | | | | | 3,831 | | | | 4,113,536 | |
| | | |
7.50%, 4/1/28(6) | | | | | | | 4,369 | | | | 4,652,985 | |
|
| Ziggo B.V.: | |
| | | |
4.875%, 1/15/30(6) | | | | | | | 6,539 | | | | 6,657,519 | |
| | | |
5.50%, 1/15/27(6) | | | | | | | 18,403 | | | | 18,886,079 | |
| | | |
Ziggo Bond Co., B.V., 6.00%, 1/15/27(6) | | | | | | | 3,310 | | | | 3,421,713 | |
| | | |
| | | | | | | | | | | $ | 153,470,906 | |
|
| Capital Goods — 0.7% | |
| | | |
Madison IAQ, LLC: | | | | | | | | | | | | |
| | | |
4.125%, 6/30/28(6) | | | | | | | 9,379 | | | $ | 9,342,141 | |
| | | |
5.875%, 6/30/29(6) | | | | | | | 16,016 | | | | 15,915,900 | |
| | | |
Patrick Industries, Inc., 4.75%, 5/1/29(6) | | | | | | | 12,106 | | | | 12,030,337 | |
| | | |
Roller Bearing Co. of America, Inc., 4.375%, 10/15/29(6) | | | | | | | 11,398 | | | | 11,625,960 | |
| | | |
| | | | | | | | | | | $ | 48,914,338 | |
|
| Chemicals — 1.9% | |
| | | |
Chemours Co. (The), 4.625%, 11/15/29(6) | | | | | | | 11,230 | | | $ | 10,822,913 | |
| | | |
Compass Minerals International, Inc., 6.75%, 12/1/27(6) | | | | | | | 25,050 | | | | 26,553,000 | |
| | | |
NOVA Chemicals Corp., 4.25%, 5/15/29(6) | | | | | | | 12,262 | | | | 12,117,921 | |
| | | |
Nufarm Australia, Ltd./Nufarm Americas, Inc., 5.75%, 4/30/26(6) | | | | | | | 24,828 | | | | 25,402,147 | |
| | | |
Unifrax Escrow Issuer Corp., 5.25%, 9/30/28(6) | | | | | | | 5,739 | | | | 5,731,826 | |
| | | |
Valvoline, Inc.: | | | | | | | | | | | | |
| | | |
3.625%, 6/15/31(6) | | | | | | | 7,931 | | | | 7,742,639 | |
| | | |
4.25%, 2/15/30(6) | | | | | | | 11,891 | | | | 12,085,834 | |
| | | |
W.R. Grace & Co.: | | | | | | | | | | | | |
| | | |
4.875%, 6/15/27(6) | | | | | | | 14,574 | | | | 14,821,758 | |
| | | |
5.625%, 10/1/24(6) | | | | | | | 2,019 | | | | 2,167,901 | |
| | | |
5.625%, 8/15/29(6) | | | | | | | 5,859 | | | | 5,924,914 | |
| | | |
| | | | | | | | | | | $ | 123,370,853 | |
|
| Consumer Products — 0.1% | |
| | | |
Tempur Sealy International, Inc., 3.875%, 10/15/31(6) | | | | | | | 6,401 | | | $ | 6,351,072 | |
| | | |
| | | | | | | | | | | $ | 6,351,072 | |
|
| Containers — 0.8% | |
|
| Ardagh Packaging Finance PLC/Ardagh Holdings USA, Inc.: | |
| | | |
4.125%, 8/15/26(6) | | | | | | | 5,255 | | | $ | 5,366,826 | |
| | | |
5.25%, 8/15/27(6) | | | | | | | 19,072 | | | | 19,048,160 | |
| | | | | | | | | | | | |
| Security | | | | | Principal
Amount*
(000’s omitted) | | | Value | |
|
| Containers (continued) | |
| | | |
Crown Americas, LLC/Crown Americas Capital Corp. V, 4.25%, 9/30/26 | | | | | | | 4,555 | | | $ | 4,859,638 | |
| | | |
Crown Americas, LLC/Crown Americas Capital Corp. VI, 4.75%, 2/1/26 | | | | | | | 5,205 | | | | 5,369,218 | |
| | | |
LABL, Inc.: | | | | | | | | | | | | |
| | | |
5.875%, 11/1/28(6) | | | | | | | 5,099 | | | | 5,138,900 | |
| | | |
8.25%, 11/1/29(6) | | | | | | | 10,223 | | | | 10,065,515 | |
| | | |
| | | | | | | | | | | $ | 49,848,257 | |
|
| Diversified Financial Services — 2.6% | |
| | | |
Alliance Data Systems Corp., 4.75%, 12/15/24(6) | | | | | | | 8,162 | | | $ | 8,359,870 | |
| | | |
Ally Financial, Inc., Series B, 4.70% to 5/15/26(9)(10) | | | | | | | 14,324 | | | | 14,888,007 | |
| | | |
Cargo Aircraft Management, Inc., 4.75%, 2/1/28(6) | | | | | | | 14,762 | | | | 15,057,240 | |
| | | |
Coinbase Global, Inc.: | | | | | | | | | | | | |
| | | |
3.375%, 10/1/28(6) | | | | | | | 13,367 | | | | 12,915,864 | |
| | | |
3.625%, 10/1/31(6) | | | | | | | 11,141 | | | | 10,625,729 | |
|
| Icahn Enterprises, L.P./Icahn Enterprises Finance Corp.: | |
| | | |
5.25%, 5/15/27 | | | | | | | 9,293 | | | | 9,676,336 | |
| | | |
6.25%, 5/15/26 | | | | | | | 11,803 | | | | 12,378,396 | |
| | | |
6.375%, 12/15/25 | | | | | | | 5,685 | | | | 5,805,806 | |
| | | |
Jefferson Capital Holdings, LLC, 6.00%, 8/15/26(6) | | | | | | | 12,728 | | | | 12,904,983 | |
| | | |
Mav Acquisition Corp., 8.00%, 8/1/29(6) | | | | | | | 15,394 | | | | 14,997,451 | |
| | | |
MoneyGram International, Inc., 5.375%, 8/1/26(6) | | | | | | | 11,320 | | | | 11,362,450 | |
| | | |
MSCI, Inc., 3.875%, 2/15/31(6) | | | | | | | 11,022 | | | | 11,385,255 | |
| | | |
PRA Group, Inc.: | | | | | | | | | | | | |
| | | |
5.00%, 10/1/29(6) | | | | | | | 8,474 | | | | 8,384,515 | |
| | | |
7.375%, 9/1/25(6) | | | | | | | 19,462 | | | | 20,775,685 | |
| | | |
| | | | | | | | | | | $ | 169,517,587 | |
|
| Diversified Media — 1.7% | |
| | | |
Cars.com, Inc., 6.375%, 11/1/28(6) | | | | | | | 11,371 | | | $ | 11,915,102 | |
| | | |
Clear Channel Outdoor Holdings, Inc.: | | | | | | | | | | | | |
| | | |
7.50%, 6/1/29(6) | | | | | | | 11,778 | | | | 12,065,148 | |
| | | |
7.75%, 4/15/28(6) | | | | | | | 15,386 | | | | 15,954,513 | |
| | | |
Clear Channel Worldwide Holdings, Inc., 5.125%, 8/15/27(6) | | | | | | | 12,883 | | | | 13,230,841 | |
| | | |
National CineMedia, LLC: | | | | | | | | | | | | |
| | | |
5.75%, 8/15/26 | | | | | | | 12,070 | | | | 9,708,806 | |
| | | |
5.875%, 4/15/28(6) | | | | | | | 15,402 | | | | 14,237,840 | |
| | | |
Terrier Media Buyer, Inc., 8.875%, 12/15/27(6) | | | | | | | 17,406 | | | | 18,434,347 | |
| | | |
Urban One, Inc., 7.375%, 2/1/28(6) | | | | | | | 14,834 | | | | 15,591,127 | |
| | | |
| | | | | | | | | | | $ | 111,137,724 | |
| | | | |
| | 9 | | See Notes to Financial Statements. |
Eaton Vance
Income Fund of Boston
October 31, 2021
Portfolio of Investments — continued
| | | | | | | | | | |
| Security | | | | Principal
Amount*
(000’s omitted) | | | Value | |
|
| Energy — 13.7% | |
| | | |
Aethon III BR, LLC, 9.00%, (1 mo. USD LIBOR + 7.50%, Floor 1.50%), 10/1/25(8) | | | | | 23,440 | | | $ | 23,834,378 | |
| | | |
Aethon United BR, L.P./Aethon United Finance Corp., 8.25%, 2/15/26(6) | | | | | 21,695 | | | | 23,332,105 | |
|
| Antero Midstream Partners, L.P./Antero Midstream Finance Corp.: | |
| | | |
5.75%, 3/1/27(6) | | | | | 19,535 | | | | 20,194,306 | |
| | | |
7.875%, 5/15/26(6) | | | | | 3,595 | | | | 3,936,525 | |
| | | |
Archrock Partners, L.P./Archrock Partners Finance Corp., 6.25%, 4/1/28(6) | | | | | 5,842 | | | | 6,053,773 | |
| | | |
Buckeye Partners, L.P., 4.50%, 3/1/28(6) | | | | | 11,934 | | | | 11,799,742 | |
| | | |
Callon Petroleum Co., 8.00%, 8/1/28(6) | | | | | 12,674 | | | | 12,789,967 | |
| | | |
Centennial Resource Production, LLC: | | | | | | | | | | |
| | | |
5.375%, 1/15/26(6) | | | | | 2,391 | | | | 2,387,354 | |
| | | |
6.875%, 4/1/27(6) | | | | | 14,801 | | | | 15,152,524 | |
| | | |
Cheniere Energy Partners, L.P.: | | | | | | | | | | |
| | | |
4.00%, 3/1/31(6) | | | | | 18,911 | | | | 19,691,381 | |
| | | |
4.50%, 10/1/29 | | | | | 12,403 | | | | 13,257,939 | |
| | | |
Cheniere Energy, Inc., 4.625%, 10/15/28 | | | | | 10,687 | | | | 11,220,816 | |
| | | |
CNX Resources Corp., 6.00%, 1/15/29(6) | | | | | 13,053 | | | | 13,787,231 | |
| | | |
Colgate Energy Partners III, LLC: | | | | | | | | | | |
| | | |
5.875%, 7/1/29(6) | | | | | 19,529 | | | | 20,017,225 | |
| | | |
7.75%, 2/15/26(6) | | | | | 11,543 | | | | 12,336,581 | |
| | | |
Continental Resources, Inc.: | | | | | | | | | | |
| | | |
4.375%, 1/15/28 | | | | | 6,145 | | | | 6,713,413 | |
| | | |
4.90%, 6/1/44 | | | | | 407 | | | | 462,383 | |
| | | |
5.75%, 1/15/31(6) | | | | | 14,411 | | | | 17,275,186 | |
| | | |
CrownRock, L.P./CrownRock Finance, Inc.: | | | | | | | | | | |
| | | |
5.00%, 5/1/29(6) | | | | | 17,028 | | | | 17,560,125 | |
| | | |
5.625%, 10/15/25(6) | | | | | 12,448 | | | | 12,743,640 | |
| | | |
CVR Energy, Inc., 5.75%, 2/15/28(6) | | | | | 28,358 | | | | 27,968,077 | |
| | | |
DT Midstream, Inc., 4.125%, 6/15/29(6) | | | | | 14,661 | | | | 14,784,152 | |
| | | |
Endeavor Energy Resources, L.P./EER Finance, Inc., 5.75%, 1/30/28(6) | | | | | 6,019 | | | | 6,327,474 | |
| | | |
EQM Midstream Partners, L.P.: | | | | | | | | | | |
| | | |
4.50%, 1/15/29(6) | | | | | 8,599 | | | | 8,857,013 | |
| | | |
4.75%, 1/15/31(6) | | | | | 8,599 | | | | 8,913,723 | |
| | | |
6.00%, 7/1/25(6) | | | | | 6,182 | | | | 6,715,198 | |
| | | |
6.50%, 7/1/27(6) | | | | | 6,208 | | | | 6,914,532 | |
| | | |
EQT Corp.: | | | | | | | | | | |
| | | |
5.00%, 1/15/29 | | | | | 3,261 | | | | 3,626,868 | |
| | | |
6.625%, 2/1/25 | | | | | 3,437 | | | | 3,870,921 | |
| | | |
7.50%, 2/1/30 | | | | | 5,041 | | | | 6,459,789 | |
| | | |
Genesis Energy, L.P./Genesis Energy Finance Corp., 8.00%, 1/15/27 | | | | | 10,743 | | | | 10,810,359 | |
| | | |
Great Western Petroleum, LLC/Great Western Finance Corp., 12.00%, 9/1/25(6) | | | | | 10,546 | | | | 10,726,969 | |
| | | | | | | | | | |
| Security | | | | Principal
Amount*
(000’s omitted) | | | Value | |
|
| Energy (continued) | |
| | | |
Hilcorp Energy I, L.P./Hilcorp Finance Co.: | | | | | | | | | | |
| | | |
5.75%, 2/1/29(6) | | | | | 6,919 | | | $ | 7,031,434 | |
| | | |
6.00%, 2/1/31(6) | | | | | 5,536 | | | | 5,690,252 | |
| | | |
Laredo Petroleum, Inc.: | | | | | | | | | | |
| | | |
9.50%, 1/15/25 | | | | | 3,120 | | | | 3,212,570 | |
| | | |
10.125%, 1/15/28 | | | | | 4,701 | | | | 5,030,070 | |
| | | |
Nabors Industries, Inc., 9.00%, 2/1/25(6) | | | | | 6,462 | | | | 6,698,703 | |
| | | |
Nabors Industries, Ltd.: | | | | | | | | | | |
| | | |
7.25%, 1/15/26(6) | | | | | 4,657 | | | | 4,525,184 | |
| | | |
7.50%, 1/15/28(6) | | | | | 5,019 | | | | 4,776,582 | |
| | | |
Neptune Energy Bondco PLC, 6.625%, 5/15/25(6) | | | | | 31,848 | | | | 32,604,390 | |
| | | |
New Fortress Energy, Inc., 6.50%, 9/30/26(6) | | | | | 22,943 | | | | 22,333,175 | |
| | | |
Oasis Petroleum, Inc., 6.375%, 6/1/26(6) | | | | | 11,243 | | | | 11,903,526 | |
| | | |
Occidental Petroleum Corp.: | | | | | | | | | | |
| | | |
3.00%, 2/15/27 | | | | | 2,220 | | | | 2,222,775 | |
| | | |
3.40%, 4/15/26 | | | | | 6,949 | | | | 7,099,029 | |
| | | |
3.50%, 8/15/29 | | | | | 5,213 | | | | 5,297,711 | |
| | | |
4.20%, 3/15/48 | | | | | 8,139 | | | | 7,943,705 | |
| | | |
4.40%, 8/15/49 | | | | | 6,626 | | | | 6,632,825 | |
| | | |
4.625%, 6/15/45 | | | | | 4,425 | | | | 4,585,716 | |
| | | |
6.125%, 1/1/31 | | | | | 11,929 | | | | 14,299,889 | |
| | | |
6.20%, 3/15/40 | | | | | 4,187 | | | | 5,078,831 | |
| | | |
6.375%, 9/1/28 | | | | | 5,072 | | | | 5,951,383 | |
| | | |
6.45%, 9/15/36 | | | | | 12,234 | | | | 15,585,504 | |
| | | |
6.625%, 9/1/30 | | | | | 13,861 | | | | 16,978,339 | |
| | | |
8.50%, 7/15/27 | | | | | 17,429 | | | | 21,720,891 | |
| | | |
8.875%, 7/15/30 | | | | | 14,937 | | | | 20,258,306 | |
| | | |
Ovintiv, Inc.: | | | | | | | | | | |
| | | |
6.50%, 2/1/38 | | | | | 5,737 | | | | 7,788,723 | |
| | | |
6.625%, 8/15/37 | | | | | 1,183 | | | | 1,609,333 | |
| | | |
8.125%, 9/15/30 | | | | | 2,450 | | | | 3,363,733 | |
| | | |
PBF Holding Co., LLC/PBF Finance Corp., 9.25%, 5/15/25(6) | | | | | 25,684 | | | | 24,969,600 | |
| | | |
Plains All American Pipeline, L.P., Series B, 6.125% to 11/15/22(9)(10) | | | | | 19,813 | | | | 17,980,297 | |
| | | |
Precision Drilling Corp.: | | | | | | | | | | |
| | | |
6.875%, 1/15/29(6) | | | | | 9,418 | | | | 9,740,802 | |
| | | |
7.125%, 1/15/26(6) | | | | | 5,844 | | | | 6,018,054 | |
| | | |
Shelf Drilling Holdings, Ltd.: | | | | | | | | | | |
| | | |
8.25%, 2/15/25(6) | | | | | 15,620 | | | | 12,085,975 | |
| | | |
8.875%, 11/15/24(6) | | | | | 4,469 | | | | 4,632,186 | |
| | | |
Southwestern Energy Co., 8.375%, 9/15/28 | | | | | 9,390 | | | | 10,481,588 | |
| | | |
Suburban Propane Partners, L.P./Suburban Energy Finance Corp., 5.00%, 6/1/31(6) | | | | | 8,331 | | | | 8,549,689 | |
| | | | |
| | 10 | | See Notes to Financial Statements. |
Eaton Vance
Income Fund of Boston
October 31, 2021
Portfolio of Investments — continued
| | | | | | | | | | |
| Security | | | | Principal
Amount*
(000’s omitted) | | | Value | |
|
| Energy (continued) | |
| | | |
Sunoco, L.P./Sunoco Finance Corp.: | | | | | | | | | | |
| | | |
4.50%, 5/15/29 | | | | | 8,737 | | | $ | 8,846,213 | |
| | | |
4.50%, 4/30/30(6) | | | | | 17,021 | | | | 17,192,401 | |
| | | |
Superior Plus, L.P./Superior General Partner, Inc., 4.50%, 3/15/29(6) | | | | | 12,540 | | | | 12,840,333 | |
| | | |
Tap Rock Resources, LLC, 7.00%, 10/1/26(6) | | | | | 18,571 | | | | 19,145,215 | |
|
Targa Resources Partners, L.P./Targa Resources Partners
Finance Corp.: | |
| | | |
4.00%, 1/15/32(6) | | | | | 16,134 | | | | 16,669,971 | |
| | | |
4.875%, 2/1/31 | | | | | 856 | | | | 924,035 | |
| | | |
5.875%, 4/15/26 | | | | | 6,450 | | | | 6,742,314 | |
| | | |
6.50%, 7/15/27 | | | | | 4,107 | | | | 4,404,758 | |
| | | |
6.875%, 1/15/29 | | | | | 8,212 | | | | 9,207,705 | |
| | | |
TechnipFMC PLC, 6.50%, 2/1/26(6) | | | | | 898 | | | | 957,935 | |
| | | |
Tervita Corp., 11.00%, 12/1/25(6) | | | | | 7,618 | | | | 8,770,604 | |
| | | |
Transocean Pontus, Ltd., 6.125%, 8/1/25(6) | | | | | 3,343 | | | | 3,356,356 | |
| | | |
Transocean Poseidon, Ltd., 6.875%, 2/1/27(6) | | | | | 11,027 | | | | 11,016,083 | |
| | | |
Venture Global Calcasieu Pass, LLC: | | | | | | | | | | |
| | | |
3.875%, 8/15/29(6) | | | | | 11,144 | | | | 11,352,950 | |
| | | |
4.125%, 8/15/31(6) | | | | | 9,904 | | | | 10,262,525 | |
| | | |
Weatherford International, Ltd., 8.625%, 4/30/30(6) | | | | | 15,598 | | | | 16,043,869 | |
| | | |
Western Midstream Operating, L.P., 5.30%, 2/1/30 | | | | | 9,985 | | | | 10,958,537 | |
| |
| | | | $ | 893,894,243 | |
|
| Entertainment & Film — 0.6% | |
| | | |
AMC Entertainment Holdings, Inc.: | | | | | | | | | | |
| | | |
10.50%, 4/15/25(6) | | | | | 5,705 | | | $ | 6,132,875 | |
| | | |
12.00%, (10.00% cash or 12.00% PIK), 6/15/26(6)(11) | | | | | 12,717 | | | | 12,672,999 | |
| | | |
Cinemark USA, Inc.: | | | | | | | | | | |
| | | |
5.25%, 7/15/28(6) | | | | | 12,691 | | | | 12,397,521 | |
| | | |
5.875%, 3/15/26(6) | | | | | 4,218 | | | | 4,233,817 | |
| | | |
8.75%, 5/1/25(6) | | | | | 3,076 | | | | 3,295,165 | |
| |
| | | | $ | 38,732,377 | |
|
| Environmental — 1.0% | |
| | | |
Clean Harbors, Inc.: | | | | | | | | | | |
| | | |
4.875%, 7/15/27(6) | | | | | 4,075 | | | $ | 4,248,188 | |
| | | |
5.125%, 7/15/29(6) | | | | | 4,445 | | | | 4,817,269 | |
| | | |
GFL Environmental, Inc.: | | | | | | | | | | |
| | | |
3.50%, 9/1/28(6) | | | | | 14,830 | | | | 14,774,387 | |
| | | |
3.75%, 8/1/25(6) | | | | | 7,155 | | | | 7,371,081 | |
| | | |
4.25%, 6/1/25(6) | | | | | 11,354 | | | | 11,721,253 | |
| | | |
4.75%, 6/15/29(6) | | | | | 21,153 | | | | 21,364,530 | |
| |
| | | | $ | 64,296,708 | |
| | | | | | | | | | |
| Security | | | | Principal
Amount*
(000’s omitted) | | | Value | |
|
| Food & Drug Retail — 0.9% | |
|
| Albertsons Cos., Inc./Safeway, Inc./New Albertsons, L.P./Albertsons, LLC: | |
| | | |
4.875%, 2/15/30(6) | | | | | 5,881 | | | $ | 6,310,901 | |
| | | |
5.875%, 2/15/28(6) | | | | | 7,375 | | | | 7,845,156 | |
| | | |
7.50%, 3/15/26(6) | | | | | 4,000 | | | | 4,315,000 | |
| | | |
Arko Corp., 5.125%, 11/15/29(6) | | | | | 13,069 | | | | 12,772,987 | |
| | | |
Ingles Markets, Inc., 4.00%, 6/15/31(6) | | | | | 8,368 | | | | 8,337,290 | |
| | | |
Murphy Oil USA, Inc.: | | | | | | | | | | |
| | | |
4.75%, 9/15/29 | | | | | 5,305 | | | | 5,595,184 | |
| | | |
5.625%, 5/1/27 | | | | | 10,031 | | | | 10,437,506 | |
| |
| | | | $ | 55,614,024 | |
|
| Food, Beverage & Tobacco — 4.0% | |
| | | |
Herbalife Nutrition, Ltd./HLF Financing, Inc., 7.875%, 9/1/25(6) | | | | | 9,939 | | | $ | 10,684,028 | |
| | | |
HLF Financing S.a.r.l., LLC/Herbalife International, Inc., 4.875%, 6/1/29(6) | | | | | 15,117 | | | | 15,245,192 | |
| | | |
JBS USA LUX S.A./JBS USA Food Co./JBS USA Finance, Inc., 5.50%, 1/15/30(6) | | | | | 23,143 | | | | 25,370,514 | |
| | | |
Kraft Heinz Foods Co.: | | | | | | | | | | |
| | | |
3.875%, 5/15/27 | | | | | 10,085 | | | | 10,940,742 | |
| | | |
4.25%, 3/1/31 | | | | | 22,490 | | | | 25,415,795 | |
| | | |
4.375%, 6/1/46 | | | | | 23,604 | | | | 27,593,978 | |
| | | |
4.625%, 1/30/29 | | | | | 3,000 | | | | 3,414,587 | |
| | | |
4.625%, 10/1/39 | | | | | 4,208 | | | | 4,906,687 | |
| | | |
4.875%, 10/1/49 | | | | | 6,500 | | | | 8,059,997 | |
| | | |
5.50%, 6/1/50 | | | | | 10,085 | | | | 13,528,211 | |
| | | |
Performance Food Group, Inc.: | | | | | | | | | | |
| | | |
4.25%, 8/1/29(6) | | | | | 24,007 | | | | 24,037,009 | |
| | | |
5.50%, 10/15/27(6) | | | | | 15,524 | | | | 16,203,175 | |
| | | |
6.875%, 5/1/25(6) | | | | | 9,425 | | | | 9,955,156 | |
| | | |
Pilgrim’s Pride Corp., 3.50%, 3/1/32(6) | | | | | 21,708 | | | | 21,789,405 | |
| | | |
Post Holdings, Inc.: | | | | | | | | | | |
| | | |
4.50%, 9/15/31(6) | | | | | 14,331 | | | | 14,061,792 | |
| | | |
4.625%, 4/15/30(6) | | | | | 15,117 | | | | 15,211,481 | |
| | | |
US Foods, Inc., 4.75%, 2/15/29(6) | | | | | 12,666 | | | | 12,830,911 | |
| |
| | | | $ | 259,248,660 | |
|
| Gaming — 1.9% | |
| | | |
Caesars Entertainment, Inc.: | | | | | | | | | | |
| | | |
4.625%, 10/15/29(6) | | | | | 5,260 | | | $ | 5,291,823 | |
| | | |
6.25%, 7/1/25(6) | | | | | 22,288 | | | | 23,471,493 | |
| | | |
8.125%, 7/1/27(6) | | | | | 23,616 | | | | 26,480,621 | |
| | | |
Gateway Casinos & Entertainment, Ltd., 8.25%, 3/1/24(6) | | | | | 25,715 | | | | 26,510,365 | |
| | | | |
| | 11 | | See Notes to Financial Statements. |
Eaton Vance
Income Fund of Boston
October 31, 2021
Portfolio of Investments — continued
| | | | | | | | | | |
| Security | | | | Principal
Amount*
(000’s omitted) | | | Value | |
|
| Gaming (continued) | |
| | | |
MGM Resorts International, 4.75%, 10/15/28 | | | | | 15,992 | | | $ | 16,643,014 | |
| | | |
Peninsula Pacific Entertainment, LLC/Peninsula Pacific Entertainment Finance, Inc., 8.50%, 11/15/27(6) | | | | | 22,795 | | | | 24,356,571 | |
| |
| | | | $ | 122,753,887 | |
|
| Healthcare — 9.3% | |
| | | |
180 Medical, Inc., 3.875%, 10/15/29(6) | | | | | 7,642 | | | $ | 7,694,634 | |
| | | |
AdaptHealth, LLC: | | | | | | | | | | |
| | | |
4.625%, 8/1/29(6) | | | | | 4,011 | | | | 3,970,890 | |
| | | |
5.125%, 3/1/30(6) | | | | | 5,262 | | | | 5,294,888 | |
| | | |
6.125%, 8/1/28(6) | | | | | 6,030 | | | | 6,391,800 | |
| | | |
AMN Healthcare, Inc.: | | | | | | | | | | |
| | | |
4.00%, 4/15/29(6) | | | | | 6,004 | | | | 6,102,105 | |
| | | |
4.625%, 10/1/27(6) | | | | | 4,205 | | | | 4,325,978 | |
| | | |
Bausch Health Americas, Inc.: | | | | | | | | | | |
| | | |
8.50%, 1/31/27(6) | | | | | 18,651 | | | | 19,816,687 | |
| | | |
9.25%, 4/1/26(6) | | | | | 4,735 | | | | 5,036,856 | |
| | | |
Bausch Health Cos., Inc.: | | | | | | | | | | |
| | | |
5.25%, 1/30/30(6) | | | | | 4,352 | | | | 3,935,967 | |
| | | |
5.25%, 2/15/31(6) | | | | | 4,352 | | | | 3,919,585 | |
| | | |
5.50%, 11/1/25(6) | | | | | 7,041 | | | | 7,162,950 | |
| | | |
5.75%, 8/15/27(6) | | | | | 2,927 | | | | 3,068,184 | |
| | | |
6.25%, 2/15/29(6) | | | | | 4,594 | | | | 4,457,489 | |
| | | |
7.00%, 1/15/28(6) | | | | | 3,834 | | | | 3,889,114 | |
| | | |
7.25%, 5/30/29(6) | | | | | 4,201 | | | | 4,265,275 | |
| | | |
9.00%, 12/15/25(6) | | | | | 16,210 | | | | 17,025,687 | |
| | | |
Centene Corp.: | | | | | | | | | | |
| | | |
2.50%, 3/1/31 | | | | | 23,695 | | | | 23,132,718 | |
| | | |
3.00%, 10/15/30 | | | | | 21,528 | | | | 21,908,830 | |
| | | |
3.375%, 2/15/30 | | | | | 29,751 | | | | 30,570,789 | |
| | | |
4.25%, 12/15/27 | | | | | 7,680 | | | | 8,054,400 | |
| | | |
4.625%, 12/15/29 | | | | | 14,039 | | | | 15,162,120 | |
| | | |
CHS/Community Health Systems, Inc.: | | | | | | | | | | |
| | | |
6.125%, 4/1/30(6) | | | | | 10,912 | | | | 10,741,773 | |
| | | |
6.875%, 4/15/29(6) | | | | | 11,855 | | | | 12,213,792 | |
| | | |
DaVita, Inc., 3.75%, 2/15/31(6) | | | | | 8,486 | | | | 8,051,093 | |
| | | |
Emergent BioSolutions, Inc., 3.875%, 8/15/28(6) | | | | | 14,350 | | | | 13,793,937 | |
| | | |
Encompass Health Corp.: | | | | | | | | | | |
| | | |
4.50%, 2/1/28 | | | | | 3,433 | | | | 3,499,420 | |
| | | |
4.625%, 4/1/31 | | | | | 7,698 | | | | 7,843,569 | |
| | | |
4.75%, 2/1/30 | | | | | 18,501 | | | | 18,987,484 | |
| | | |
Endo Luxembourg Finance Co. I S.a.r.l./Endo US, Inc., 6.125%, 4/1/29(6) | | | | | 12,949 | | | | 12,773,800 | |
| | | |
Grifols Escrow Issuer S.A., 4.75%, 10/15/28(6) | | | | | 11,137 | | | | 11,317,976 | |
| | | | | | | | | | |
| Security | | | | Principal
Amount*
(000’s omitted) | | | Value | |
|
| Healthcare (continued) | |
| | | |
HCA, Inc.: | | | | | | | | | | |
| | | |
3.50%, 9/1/30 | | | | | 9,000 | | | $ | 9,475,425 | |
| | | |
5.375%, 9/1/26 | | | | | 11,055 | | | | 12,603,788 | |
| | | |
5.625%, 9/1/28 | | | | | 8,537 | | | | 10,015,864 | |
| | | |
5.875%, 2/15/26 | | | | | 13,250 | | | | 15,105,000 | |
| | | |
5.875%, 2/1/29 | | | | | 7,681 | | | | 9,151,604 | |
| | | |
HealthEquity, Inc., 4.50%, 10/1/29(6) | | | | | 11,778 | | | | 11,925,225 | |
| | | |
Jazz Securities DAC, 4.375%, 1/15/29(6) | | | | | 13,519 | | | | 13,907,671 | |
| | | |
Legacy LifePoint Health, LLC, 4.375%, 2/15/27(6) | | | | | 3,593 | | | | 3,561,561 | |
| | | |
LifePoint Health, Inc., 5.375%, 1/15/29(6) | | | | | 14,111 | | | | 13,846,419 | |
| | | |
ModivCare Escrow Issuer, Inc., 5.00%, 10/1/29(6) | | | | | 7,580 | | | | 7,719,624 | |
| | | |
ModivCare, Inc., 5.875%, 11/15/25(6) | | | | | 11,006 | | | | 11,570,058 | |
| | | |
Molina Healthcare, Inc.: | | | | | | | | | | |
| | | |
3.875%, 11/15/30(6) | | | | | 27,471 | | | | 28,366,005 | |
| | | |
4.375%, 6/15/28(6) | | | | | 17,866 | | | | 18,513,642 | |
| | | |
Mozart Debt Merger Sub, Inc., 5.25%, 10/1/29(6) | | | | | 36,466 | | | | 37,058,572 | |
| | | |
Option Care Health, Inc., 4.375%, 10/31/29(6) | | | | | 14,497 | | | | 14,656,902 | |
| | | |
Owens & Minor, Inc., 4.50%, 3/31/29(6) | | | | | 8,390 | | | | 8,431,950 | |
| | | |
Team Health Holdings, Inc., 6.375%, 2/1/25(6) | | | | | 18,643 | | | | 16,530,002 | |
| | | |
Tenet Healthcare Corp.: | | | | | | | | | | |
| | | |
4.625%, 9/1/24(6) | | | | | 1,949 | | | | 1,992,853 | |
| | | |
4.875%, 1/1/26(6) | | | | | 11,694 | | | | 12,000,968 | |
| | | |
5.125%, 11/1/27(6) | | | | | 11,694 | | | | 12,234,848 | |
| | | |
US Acute Care Solutions, LLC, 6.375%, 3/1/26(6) | | | | | 20,558 | | | | 21,354,622 | |
| | | |
Varex Imaging Corp., 7.875%, 10/15/27(6) | | | | | 11,104 | | | | 12,369,301 | |
| |
| | | | $ | 606,801,694 | |
|
| Homebuilders & Real Estate — 4.8% | |
| | | |
APi Escrow Corp., 4.75%, 10/15/29(6) | | | | | 6,535 | | | $ | 6,657,531 | |
|
Brookfield Property REIT, Inc./BPR Cumulus, LLC/BPR
Nimbus, LLC/GGSI Sellco, LLC: | |
| | | |
4.50%, 4/1/27(6) | | | | | 19,209 | | | | 18,752,786 | |
| | | |
5.75%, 5/15/26(6) | | | | | 11,701 | | | | 12,119,311 | |
| | | |
Brundage-Bone Concrete Pumping Holdings, Inc., 6.00%, 2/1/26(6) | | | | | 10,480 | | | | 10,985,660 | |
| | | |
Dycom Industries, Inc., 4.50%, 4/15/29(6) | | | | | 13,448 | | | | 13,666,530 | |
| | | |
Empire Communities Corp., 7.00%, 12/15/25(6) | | | | | 16,548 | | | | 17,147,865 | |
| | | |
Greystar Real Estate Partners, LLC, 5.75%, 12/1/25(6) | | | | | 16,834 | | | | 17,128,595 | |
| | | |
HAT Holdings I, LLC/HAT Holdings II, LLC: | | | | | | | | | | |
| | | |
3.75%, 9/15/30(6) | | | | | 8,341 | | | | 8,299,962 | |
| | | |
6.00%, 4/15/25(6) | | | | | 12,725 | | | | 13,268,357 | |
| | | |
M/I Homes, Inc., 4.95%, 2/1/28 | | | | | 12,706 | | | | 13,230,122 | |
|
MGM Growth Properties Operating Partnership, L.P./MGP
Finance Co-Issuer, Inc.: | |
| | | |
4.50%, 9/1/26 | | | | | 6,735 | | | | 7,314,210 | |
| | | |
5.625%, 5/1/24 | | | | | 11,505 | | | | 12,495,560 | |
| | | |
5.75%, 2/1/27 | | | | | 4,084 | | | | 4,660,865 | |
| | | | |
| | 12 | | See Notes to Financial Statements. |
Eaton Vance
Income Fund of Boston
October 31, 2021
Portfolio of Investments — continued
| | | | | | | | | | |
| Security | | | | Principal
Amount*
(000’s omitted) | | | Value | |
|
| Homebuilders & Real Estate (continued) | |
|
| Outfront Media Capital, LLC/Outfront Media Capital Corp.: | |
| | | |
4.625%, 3/15/30(6) | | | | | 1,263 | | | $ | 1,264,200 | |
| | | |
6.25%, 6/15/25(6) | | | | | 8,819 | | | | 9,237,902 | |
| | | |
Service Properties Trust: | | | | | | | | | | |
| | | |
3.95%, 1/15/28 | | | | | 15,523 | | | | 14,455,794 | |
| | | |
4.95%, 10/1/29 | | | | | 516 | | | | 497,295 | |
| | | |
5.00%, 8/15/22 | | | | | 8,403 | | | | 8,455,519 | |
| | | |
5.50%, 12/15/27 | | | | | 3,029 | | | | 3,170,200 | |
| | | |
7.50%, 9/15/25 | | | | | 15,222 | | | | 16,852,420 | |
| | | |
Taylor Morrison Communities, Inc.: | | | | | | | | | | |
| | | |
5.75%, 1/15/28(6) | | | | | 6,217 | | | | 6,852,750 | |
| | | |
5.875%, 6/15/27(6) | | | | | 10,898 | | | | 12,206,414 | |
| | | |
TopBuild Corp., 4.125%, 2/15/32(6) | | | | | 11,775 | | | | 11,892,750 | |
| | | |
VICI Properties, L.P./VICI Note Co., Inc.: | | | | | | | | | | |
| | | |
3.75%, 2/15/27(6) | | | | | 2,441 | | | | 2,511,179 | |
| | | |
4.125%, 8/15/30(6) | | | | | 8,359 | | | | 8,787,399 | |
| | | |
4.25%, 12/1/26(6) | | | | | 12,627 | | | | 13,095,209 | |
| | | |
4.625%, 12/1/29(6) | | | | | 17,945 | | | | 19,167,503 | |
| | | |
Vivion Investments S.a.r.l.: | | | | | | | | | | |
| | | |
3.00%, 8/8/24(7) | | EUR | | | 27,700 | | | | 30,921,589 | |
| | | |
3.50%, 11/1/25(7) | | EUR | | | 700 | | | | 780,545 | |
| |
| | | | $ | 315,876,022 | |
|
| Insurance — 0.6% | |
| | | |
Alliant Holdings Intermediate, LLC/Alliant Holdings Co-Issuer, 6.75%, 10/15/27(6) | | | | | 12,777 | | | $ | 13,208,224 | |
| | | |
AmWINS Group, Inc., 4.875%, 6/30/29(6) | | | | | 2,122 | | | | 2,118,032 | |
| | | |
BroadStreet Partners, Inc., 5.875%, 4/15/29(6) | | | | | 12,128 | | | | 11,934,680 | |
| | | |
GTCR AP Finance, Inc., 8.00%, 5/15/27(6) | | | | | 11,039 | | | | 11,632,346 | |
| |
| | | | $ | 38,893,282 | |
|
| Leisure — 2.7% | |
| | | |
Carnival Corp.: | | | | | | | | | | |
| | | |
5.75%, 3/1/27(6) | | | | | 13,340 | | | $ | 13,590,125 | |
| | | |
6.00%, 5/1/29(6)(12) | | | | | 16,544 | | | | 16,564,680 | |
| | | |
7.625%, 3/1/26(6) | | | | | 5,348 | | | | 5,641,284 | |
| | | |
Life Time, Inc.: | | | | | | | | | | |
| | | |
5.75%, 1/15/26(6) | | | | | 12,585 | | | | 12,935,744 | |
| | | |
8.00%, 4/15/26(6) | | | | | 13,100 | | | | 13,776,615 | |
| | | |
NCL Corp., Ltd.: | | | | | | | | | | |
| | | |
3.625%, 12/15/24(6) | | | | | 2,984 | | | | 2,812,420 | |
| | | |
5.875%, 3/15/26(6) | | | | | 6,558 | | | | 6,582,592 | |
| | | |
10.25%, 2/1/26(6) | | | | | 8,375 | | | | 9,631,669 | |
| | | |
NCL Finance, Ltd., 6.125%, 3/15/28(6) | | | | | 3,490 | | | | 3,524,900 | |
| | | | | | | | | | |
| Security | | | | Principal
Amount*
(000’s omitted) | | | Value | |
|
| Leisure (continued) | |
| | | |
Powdr Corp., 6.00%, 8/1/25(6) | | | | | 13,768 | | | $ | 14,425,422 | |
| | | |
Royal Caribbean Cruises, Ltd., 3.70%, 3/15/28 | | | | | 6,862 | | | | 6,510,322 | |
| | | |
SeaWorld Parks & Entertainment, Inc., 5.25%, 8/15/29(6) | | | | | 11,375 | | | | 11,602,500 | |
| | | |
Speedway Motorsports, LLC/Speedway Funding II, Inc., 4.875%, 11/1/27(6) | | | | | 13,854 | | | | 14,175,136 | |
| | | |
Viking Cruises, Ltd.: | | | | | | | | | | |
| | | |
5.875%, 9/15/27(6) | | | | | 28,925 | | | | 28,001,280 | |
| | | |
6.25%, 5/15/25(6) | | | | | 8,680 | | | | 8,649,924 | |
| | | |
7.00%, 2/15/29(6) | | | | | 6,622 | | | | 6,665,937 | |
| | | |
Viking Ocean Cruises Ship VII, Ltd., 5.625%, 2/15/29(6) | | | | | 4,238 | | | | 4,211,513 | |
| |
| | | | $ | 179,302,063 | |
|
| Metals & Mining — 2.0% | |
| | | |
Constellium SE: | | | | | | | | | | |
| | | |
5.625%, 6/15/28(6) | | | | | 3,000 | | | $ | 3,150,540 | |
| | | |
5.875%, 2/15/26(6) | | | | | 4,920 | | | | 5,007,330 | |
| | | |
Eldorado Gold Corp., 6.25%, 9/1/29(6) | | | | | 13,023 | | | | 13,238,531 | |
| | | |
First Quantum Minerals, Ltd., 7.50%, 4/1/25(6) | | | | | 11,684 | | | | 12,107,545 | |
| | | |
Freeport-McMoRan, Inc., 5.45%, 3/15/43 | | | | | 16,137 | | | | 20,320,517 | |
| | | |
Hudbay Minerals, Inc.: | | | | | | | | | | |
| | | |
4.50%, 4/1/26(6) | | | | | 10,856 | | | | 10,842,430 | |
| | | |
6.125%, 4/1/29(6) | | | | | 13,706 | | | | 14,442,697 | |
| | | |
New Gold, Inc.: | | | | | | | | | | |
| | | |
6.375%, 5/15/25(6) | | | | | 3,592 | | | | 3,702,436 | |
| | | |
7.50%, 7/15/27(6) | | | | | 20,492 | | | | 22,156,975 | |
| | | |
Novelis Corp.: | | | | | | | | | | |
| | | |
3.25%, 11/15/26(6) | | | | | 6,885 | | | | 6,876,394 | |
| | | |
4.75%, 1/30/30(6) | | | | | 15,432 | | | | 16,068,570 | |
| |
| | | | $ | 127,913,965 | |
|
| Paper — 0.4% | |
| | | |
Enviva Partners, L.P./Enviva Partners Finance Corp., 6.50%, 1/15/26(6) | | | | | 25,273 | | | $ | 26,170,450 | |
| |
| | | | $ | 26,170,450 | |
|
| Restaurant — 1.5% | |
|
| 1011778 B.C. Unlimited Liability Company/New Red Finance, Inc.: | |
| | | |
3.875%, 1/15/28(6) | | | | | 17,005 | | | $ | 16,985,104 | |
| | | |
4.00%, 10/15/30(6) | | | | | 21,200 | | | | 20,563,788 | |
| | | |
4.375%, 1/15/28(6) | | | | | 7,702 | | | | 7,752,063 | |
| | | |
5.75%, 4/15/25(6) | | | | | 2,861 | | | | 2,975,440 | |
| | | |
Carrols Restaurant Group, Inc., 5.875%, 7/1/29(6) | | | | | 7,045 | | | | 6,457,905 | |
| | | | |
| | 13 | | See Notes to Financial Statements. |
Eaton Vance
Income Fund of Boston
October 31, 2021
Portfolio of Investments — continued
| | | | | | | | | | |
| Security | | | | Principal
Amount*
(000’s omitted) | | | Value | |
|
| Restaurant (continued) | |
| | | |
Dave & Buster’s, Inc., 7.625%, 11/1/25(6) | | | | | 24,574 | | | $ | 26,419,753 | |
| | | |
IRB Holding Corp., 7.00%, 6/15/25(6) | | | | | 5,836 | | | | 6,171,570 | |
| | | |
Yum! Brands, Inc., 3.625%, 3/15/31 | | | | | 10,596 | | | | 10,485,802 | |
| |
| | | | $ | 97,811,425 | |
|
| Services — 4.9% | |
| | | |
Adtalem Global Education, Inc., 5.50%, 3/1/28(6) | | | | | 18,724 | | | $ | 18,934,645 | |
|
| Allied Universal Holdco, LLC/Allied Universal Finance Corp.: | |
| | | |
6.00%, 6/1/29(6) | | | | | 12,150 | | | | 11,975,526 | |
| | | |
6.625%, 7/15/26(6) | | | | | 22,670 | | | | 23,846,120 | |
| | | |
9.75%, 7/15/27(6) | | | | | 16,398 | | | | 17,648,347 | |
|
Allied Universal Holdco, LLC/Allied Universal Finance
Corp./Atlas Luxco 4 S.a.r.l.: | |
| | | |
4.625%, 6/1/28(6) | | | | | 11,768 | | | | 11,687,625 | |
| | | |
4.625%, 6/1/28(6) | | | | | 7,816 | | | | 7,755,035 | |
|
| Avis Budget Car Rental, LLC/Avis Budget Finance, Inc.: | |
| | | |
5.75%, 7/15/27(6) | | | | | 6,080 | | | | 6,374,485 | |
| | | |
5.75%, 7/15/27(6) | | | | | 4,829 | | | | 5,052,341 | |
| | | |
BCPE Empire Holdings, Inc., 7.625%, 5/1/27(6) | | | | | 29,593 | | | | 29,345,750 | |
| | | |
Gartner, Inc.: | | | | | | | | | | |
| | | |
3.625%, 6/15/29(6) | | | | | 4,186 | | | | 4,212,163 | |
| | | |
3.75%, 10/1/30(6) | | | | | 6,252 | | | | 6,345,780 | |
| | | |
4.50%, 7/1/28(6) | | | | | 8,049 | | | | 8,390,680 | |
| | | |
GEMS MENASA Cayman, Ltd./GEMS Education Delaware, LLC, 7.125%, 7/31/26(6) | | | | | 26,286 | | | | 27,238,867 | |
| | | |
Korn Ferry, 4.625%, 12/15/27(6) | | | | | 12,207 | | | | 12,603,728 | |
| | | |
NESCO Holdings II, Inc., 5.50%, 4/15/29(6) | | | | | 12,412 | | | | 12,582,665 | |
| | | |
Sabre GLBL, Inc., 9.25%, 4/15/25(6) | | | | | 8,938 | | | | 10,341,221 | |
| | | |
SRS Distribution, Inc., 6.125%, 7/1/29(6) | | | | | 12,045 | | | | 12,406,350 | |
| | | |
Summer (BC) Bidco B, LLC, 5.50%, 10/31/26(6) | | | | | 14,929 | | | | 15,208,919 | |
| | | |
Terminix Co., LLC (The), 7.45%, 8/15/27 | | | | | 19,140 | | | | 23,015,850 | |
| | | |
Univar Solutions USA, Inc., 5.125%, 12/1/27(6) | | | | | 13,390 | | | | 13,975,813 | |
| | | |
WASH Multifamily Acquisition, Inc., 5.75%, 4/15/26(6) | | | | | 12,048 | | | | 12,469,680 | |
| | | |
WESCO Distribution, Inc.: | | | | | | | | | | |
| | | |
7.125%, 6/15/25(6) | | | | | 8,903 | | | | 9,448,309 | |
| | | |
7.25%, 6/15/28(6) | | | | | 7,946 | | | | 8,773,655 | |
| | | |
White Cap Parent, LLC, 8.25%, (8.25% cash or 9.00% PIK), 3/15/26(6)(11) | | | | | 6,938 | | | | 7,024,794 | |
| |
| | | | $ | 316,658,348 | |
|
| Steel — 1.2% | |
| | | |
Allegheny Ludlum, LLC, 6.95%, 12/15/25 | | | | | 9,369 | | | $ | 10,247,344 | |
| | | |
Allegheny Technologies, Inc., 5.875%, 12/1/27 | | | | | 2,447 | | | | 2,572,409 | |
| | | |
Big River Steel, LLC/BRS Finance Corp., 6.625%, 1/31/29(6) | | | | | 5,508 | | | | 5,989,950 | |
| | | | | | | | | | | | |
| Security | | | | | Principal
Amount*
(000’s omitted) | | | Value | |
|
| Steel (continued) | |
| | | |
Cleveland-Cliffs, Inc., 6.75%, 3/15/26(6) | | | | | | | 24,527 | | | $ | 26,151,913 | |
| | | |
Infrabuild Australia Pty, Ltd., 12.00%, 10/1/24(6) | | | | | | | 18,189 | | | | 19,294,436 | |
| | | |
Joseph T. Ryerson & Son, Inc., 8.50%, 8/1/28(6) | | | | | | | 8,081 | | | | 9,000,214 | |
| | | |
TMS International Corp., 6.25%, 4/15/29(6) | | | | | | | 6,021 | | | | 6,224,209 | |
| |
| | | | $ | 79,480,475 | |
|
| Super Retail — 2.8% | |
| | | |
Bath & Body Works, Inc.: | | | | | | | | | | | | |
| | | |
6.625%, 10/1/30(6) | | | | | | | 8,425 | | | $ | 9,436,590 | |
| | | |
6.75%, 7/1/36 | | | | | | | 3,883 | | | | 4,666,881 | |
| | | |
6.875%, 11/1/35 | | | | | | | 10,342 | | | | 12,578,147 | |
| | | |
6.95%, 3/1/33 | | | | | | | 8,487 | | | | 9,606,266 | |
| | | |
7.60%, 7/15/37 | | | | | | | 1,923 | | | | 2,285,985 | |
| | | |
9.375%, 7/1/25(6) | | | | | | | 1,599 | | | | 1,984,759 | |
|
| Gap, Inc. (The): | |
| | | |
3.625%, 10/1/29(6) | | | | | | | 8,132 | | | | 7,979,525 | |
| | | |
3.875%, 10/1/31(6) | | | | | | | 4,783 | | | | 4,693,319 | |
| | | |
Group 1 Automotive, Inc., 4.00%, 8/15/28(6) | | | | | | | 12,459 | | | | 12,477,066 | |
| | | |
Ken Garff Automotive, LLC, 4.875%, 9/15/28(6) | | | | | | | 9,199 | | | | 9,325,486 | |
| | | |
LCM Investments Holdings II, LLC, 4.875%, 5/1/29(6) | | | | | | | 16,322 | | | | 16,780,158 | |
| | | |
Lithia Motors, Inc.: | | | | | | | | | | | | |
| | | |
3.875%, 6/1/29(6) | | | | | | | 6,549 | | | | 6,794,653 | |
| | | |
4.375%, 1/15/31(6) | | | | | | | 11,784 | | | | 12,564,160 | |
| | | |
4.625%, 12/15/27(6) | | | | | | | 3,872 | | | | 4,098,493 | |
| | | |
PetSmart, Inc./PetSmart Finance Corp.: | | | | | | | | | | | | |
| | | |
4.75%, 2/15/28(6) | | | | | | | 15,916 | | | | 16,373,585 | |
| | | |
7.75%, 2/15/29(6) | | | | | | | 12,810 | | | | 13,860,036 | |
| | | |
Sonic Automotive, Inc.: | | | | | | | | | | | | |
| | | |
4.625%, 11/15/29(6) | | | | | | | 13,075 | | | | 13,129,261 | |
| | | |
4.875%, 11/15/31(6) | | | | | | | 10,894 | | | | 10,907,617 | |
| | | |
Victoria’s Secret & Co., 4.625%, 7/15/29(6) | | | | | | | 14,346 | | | | 14,427,055 | |
| | | |
| | | | | | | | | | | $ | 183,969,042 | |
|
| Technology — 2.5% | |
| | | |
Black Knight InfoServ, LLC, 3.625%, 9/1/28(6) | | | | | | | 13,576 | | | $ | 13,525,090 | |
| | | |
Booz Allen Hamilton, Inc.: | | | | | | | | | | | | |
| | | |
3.875%, 9/1/28(6) | | | | | | | 17,280 | | | | 17,549,568 | |
| | | |
4.00%, 7/1/29(6) | | | | | | | 7,232 | | | | 7,331,440 | |
| | | |
CDK Global, Inc., 5.25%, 5/15/29(6) | | | | | | | 8,350 | | | | 8,965,812 | |
| | | |
Imola Merger Corp., 4.75%, 5/15/29(6) | | | | | | | 26,825 | | | | 27,594,877 | |
| | | |
LogMeIn, Inc., 5.50%, 9/1/27(6) | | | | | | | 19,097 | | | | 19,137,868 | |
| | | |
ON Semiconductor Corp., 3.875%, 9/1/28(6) | | | | | | | 14,229 | | | | 14,406,862 | |
| | | |
Open Text Corp., 3.875%, 2/15/28(6) | | | | | | | 7,623 | | | | 7,689,701 | |
| | | | |
| | 14 | | See Notes to Financial Statements. |
Eaton Vance
Income Fund of Boston
October 31, 2021
Portfolio of Investments — continued
| | | | | | | | | | | | |
| Security | | | | | Principal
Amount*
(000’s omitted) | | | Value | |
|
| Technology (continued) | |
| | | |
Open Text Holdings, Inc., 4.125%, 2/15/30(6) | | | | | | | 6,669 | | | $ | 6,788,044 | |
| | | |
Presidio Holdings, Inc.: | | | | | | | | | | | | |
| | | |
4.875%, 2/1/27(6) | | | | | | | 1,858 | | | | 1,892,838 | |
| | | |
8.25%, 2/1/28(6) | | | | | | | 14,939 | | | | 15,892,108 | |
| | | |
Viavi Solutions, Inc., 3.75%, 10/1/29(6) | | | | | | | 8,715 | | | | 8,663,146 | |
| | | |
VM Consolidated, Inc., 5.50%, 4/15/29(6) | | | | | | | 14,552 | | | | 14,770,280 | |
| | | |
| | | | | | | | | | | $ | 164,207,634 | |
|
| Telecommunications — 4.7% | |
| | | |
Altice France Holding S.A., 10.50%, 5/15/27(6) | | | | | | | 11,966 | | | $ | 12,983,110 | |
| | | |
Altice France S.A.: | | | | | | | | | | | | |
| | | |
5.125%, 7/15/29(6) | | | | | | | 7,505 | | | | 7,318,726 | |
| | | |
5.50%, 1/15/28(6) | | | | | | | 6,163 | | | | 6,186,111 | |
| | | |
5.50%, 10/15/29(6) | | | | | | | 7,934 | | | | 7,786,983 | |
| | | |
8.125%, 2/1/27(6) | | | | | | | 23,848 | | | | 25,666,410 | |
| | | |
Connect Finco S.a.r.l./Connect US Finco, LLC, 6.75%, 10/1/26(6) | | | | | | | 25,353 | | | | 26,335,429 | |
| | | |
Iliad Holding S.A.S.: | | | | | | | | | | | | |
| | | |
6.50%, 10/15/26(6) | | | | | | | 9,925 | | | | 10,239,325 | |
| | | |
7.00%, 10/15/28(6) | | | | | | | 9,671 | | | | 9,980,859 | |
| | | |
LCPR Senior Secured Financing DAC, 5.125%, 7/15/29(6) | | | | | | | 8,082 | | | | 8,153,526 | |
| | | |
Level 3 Financing, Inc.: | | | | | | | | | | | | |
| | | |
4.25%, 7/1/28(6) | | | | | | | 24,265 | | | | 24,021,501 | |
| | | |
5.25%, 3/15/26 | | | | | | | 8,495 | | | | 8,766,415 | |
| | | |
Sprint Capital Corp., 6.875%, 11/15/28 | | | | | | | 21,921 | | | | 27,745,190 | |
| | | |
Sprint Corp.: | | | | | | | | | | | | |
| | | |
7.125%, 6/15/24 | | | | | | | 7,445 | | | | 8,422,156 | |
| | | |
7.625%, 2/15/25 | | | | | | | 14,960 | | | | 17,409,700 | |
| | | |
7.625%, 3/1/26 | | | | | | | 6,584 | | | | 7,901,788 | |
| | | |
7.875%, 9/15/23 | | | | | | | 20,119 | | | | 22,332,090 | |
| | | |
T-Mobile USA, Inc.: | | | | | | | | | | | | |
| | | |
2.25%, 2/15/26 | | | | | | | 8,420 | | | | 8,472,625 | |
| | | |
2.625%, 2/15/29 | | | | | | | 10,523 | | | | 10,444,077 | |
| | | |
2.875%, 2/15/31 | | | | | | | 6,314 | | | | 6,282,430 | |
| | | |
Telecom Italia Capital S.A., 6.00%, 9/30/34 | | | | | | | 7,220 | | | | 8,042,466 | |
| | | |
Telecom Italia SpA, 5.303%, 5/30/24(6) | | | | | | | 9,431 | | | | 10,055,804 | |
| | | |
Virgin Media Finance PLC, 5.00%, 7/15/30(6) | | | | | | | 8,222 | | | | 8,185,720 | |
| | | |
Virgin Media Vendor Financing Notes III DAC, 4.875%, 7/15/28(7) | | | GBP | | | | 7,258 | | | | 9,986,331 | |
| | | |
Virgin Media Vendor Financing Notes IV DAC, 5.00%, 7/15/28(6) | | | | | | | 6,250 | | | | 6,355,469 | |
| | | |
Zayo Group Holdings, Inc., 6.125%, 3/1/28(6) | | | | | | | 6,246 | | | | 6,105,465 | |
| |
| | | | $ | 305,179,706 | |
| | | | | | | | | | |
| Security | | | | Principal
Amount*
(000’s omitted) | | | Value | |
|
| Transport Excluding Air & Rail — 0.3% | |
| | |
Seaspan Corp., 5.50%, 8/1/29(6) | | | 16,368 | | | $ | 16,550,667 | |
| |
| | | | $ | 16,550,667 | |
|
| Utility — 2.8% | |
| | | |
Calpine Corp.: | | | | | | | | | | |
| | | |
4.50%, 2/15/28(6) | | | | | 8,179 | | | $ | 8,295,633 | |
| | | |
4.625%, 2/1/29(6) | | | | | 9,552 | | | | 9,277,380 | |
| | | |
5.00%, 2/1/31(6) | | | | | 11,673 | | | | 11,456,232 | |
| | | |
5.125%, 3/15/28(6) | | | | | 11,510 | | | | 11,466,837 | |
| | | |
5.25%, 6/1/26(6) | | | | | 4,855 | | | | 5,001,622 | |
| | | |
Drax Finco PLC, 6.625%, 11/1/25(6) | | | | | 8,565 | | | | 8,811,244 | |
| | | |
FirstEnergy Corp., Series B, 4.40%, 7/15/27 | | | | | 16,324 | | | | 17,719,297 | |
| | | |
Leeward Renewable Energy Operations, LLC, 4.25%, 7/1/29(6) | | | | | 8,263 | | | | 8,314,809 | |
| | | |
NRG Energy, Inc.: | | | | | | | | | | |
| | | |
3.375%, 2/15/29(6) | | | | | 6,548 | | | | 6,392,485 | |
| | | |
3.625%, 2/15/31(6) | | | | | 10,913 | | | | 10,634,718 | |
| | | |
3.875%, 2/15/32(6) | | | | | 14,645 | | | | 14,370,406 | |
| | | |
5.25%, 6/15/29(6) | | | | | 4,920 | | | | 5,245,950 | |
| | | |
5.75%, 1/15/28 | | | | | 8,150 | | | | 8,649,188 | |
| | | |
Pattern Energy Operations, L.P./Pattern Energy Operations, Inc., 4.50%, 8/15/28(6) | | | | | 10,699 | | | | 11,086,839 | |
| | | |
TerraForm Power Operating, LLC: | | | | | | | | | | |
| | | |
4.25%, 1/31/23(6) | | | | | 4,625 | | | | 4,723,281 | |
| | | |
4.75%, 1/15/30(6) | | | | | 5,000 | | | | 5,186,825 | |
| | | |
5.00%, 1/31/28(6) | | | | | 13,722 | | | | 14,631,220 | |
| | | |
Vistra Operations Co., LLC: | | | | | | | | | | |
| | | |
4.375%, 5/1/29(6) | | | | | 14,285 | | | | 14,160,006 | |
| | | |
5.00%, 7/31/27(6) | | | | | 9,285 | | | | 9,528,731 | |
| |
| | | | $ | 184,952,703 | |
| |
Total Corporate Bonds
(identified cost $5,420,830,048) | | | $ | 5,618,296,857 | |
|
| Preferred Stocks — 0.4% | |
| Security | | | | Shares | | | Value | |
| | | |
| Services — 0.4% | | | | | | | | |
| | | |
WESCO International, Inc., Series A, 10.625% to 6/22/25(9) | | | | | 898,591 | | | $ | 28,215,758 | |
| |
Total Preferred Stocks
(identified cost $25,216,937) | | | $ | 28,215,758 | |
| | | | |
| | 15 | | See Notes to Financial Statements. |
Eaton Vance
Income Fund of Boston
October 31, 2021
Portfolio of Investments — continued
| | | | | | | | | | |
| Senior Floating-Rate Loans — 7.2%(13) | |
| Borrower/Description | | | | Principal
Amount
(000’s omitted) | | | Value | |
|
| Aerospace — 0.1% | |
| | | |
TransDigm, Inc., Term Loan, 2.337%, (1 mo. USD LIBOR + 2.25%), 5/30/25 | | | | $ | 5,168 | | | $ | 5,113,110 | |
| |
| | | | $ | 5,113,110 | |
|
| Air Transportation — 0.7% | |
| | | |
Air Canada, Term Loan, 4.25%, (6 mo. USD LIBOR + 3.50%, Floor 0.75%), 8/11/28 | | | | $ | 12,529 | | | $ | 12,675,176 | |
| | | |
Mileage Plus Holdings, LLC, Term Loan, 6.25%, (3 mo. USD LIBOR + 5.25%, Floor 1.00%), 6/21/27 | | | | | 23,010 | | | | 24,530,820 | |
| | | |
SkyMiles IP, Ltd., Term Loan, 4.75%, (3 mo. USD LIBOR + 3.75%, Floor 1.00%), 10/20/27 | | | | | 10,000 | | | | 10,660,620 | |
| |
| | | | $ | 47,866,616 | |
|
| Automotive & Auto Parts — 0.4% | |
| | | |
Truck Hero, Inc., Term Loan, 4.00%, (1 mo. USD LIBOR + 3.25%, Floor 0.75%), 1/31/28 | | | | $ | 14,985 | | | $ | 14,940,690 | |
| | | |
Wheel Pros, LLC, Term Loan, 5.25%, (1 mo. USD LIBOR + 4.50%, Floor 0.75%), 5/11/28 | | | | | 11,995 | | | | 11,964,185 | |
| |
| | | | $ | 26,904,875 | |
|
| Broadcasting — 0.2% | |
| | | |
Playtika Holding Corp., Term Loan, 2.837%, (1 mo. USD LIBOR + 2.75%), 3/13/28 | | | | $ | 13,318 | | | $ | 13,315,423 | |
| |
| | | | $ | 13,315,423 | |
|
| Cable & Satellite TV — 0.2% | |
| | | |
DIRECTV Financing, LLC, Term Loan, 5.75%, (3 mo. USD LIBOR + 5.00%, Floor 0.75%), 7/22/27 | | | | $ | 10,186 | | | $ | 10,205,099 | |
| |
| | | | $ | 10,205,099 | |
|
| Food, Beverage & Tobacco — 0.3% | |
| | | |
Post Holdings, Inc., Term Loan, 4.75%, (1 mo. USD LIBOR + 4.00%, Floor 0.75%), 10/21/24 | | | | $ | 22,351 | | | $ | 22,470,425 | |
| |
| | | | $ | 22,470,425 | |
|
| Gaming — 0.2% | |
| | | |
Gateway Casinos & Entertainment Limited, Term Loan, 12/1/23(14) | | | | $ | 4,626 | | | $ | 4,631,429 | |
| | | |
Golden Nugget, Inc., Term Loan, 13.00%, (3 mo. USD LIBOR + 12.00%, Floor 1.00%), 10/4/23 | | | | | 126 | | | | 137,171 | |
| | | | | | | | | | | | |
| Borrower/Description | | | | | Principal
Amount
(000’s omitted) | | | Value | |
|
| Gaming (continued) | |
|
| Spectacle Gary Holdings, LLC: | |
| | | |
Term Loan, 11.00%, (1 mo. USD LIBOR + 9.00%, Floor 2.00%), 12/23/25 | | | | | | $ | 6,796 | | | $ | 7,424,904 | |
| | | |
Term Loan, 11.00%, (1 mo. USD LIBOR + 9.00%, Floor 2.00%), 12/23/25 | | | | | | | 492 | | | | 538,036 | |
| | | |
| | | | | | | | | | | $ | 12,731,540 | |
|
| Healthcare — 1.1% | |
| | | |
Envision Healthcare Corporation, Term Loan, 3.837%, (1 mo. USD LIBOR + 3.75%), 10/10/25 | | | | | | $ | 14,866 | | | $ | 12,329,422 | |
| | | |
Jazz Financing Lux S.a.r.l., Term Loan, 4.00%, (1 mo. USD LIBOR + 3.50%, Floor 0.50%), 5/5/28 | | | | | | | 34,164 | | | | 34,249,786 | |
| | | |
RegionalCare Hospital Partners Holdings, Inc., Term Loan, 3.837%, (1 mo. USD LIBOR + 3.75%), 11/16/25 | | | | | | | 8,124 | | | | 8,113,838 | |
| | | |
Verscend Holding Corp., Term Loan, 4.087%, (1 mo. USD LIBOR + 4.00%), 8/27/25 | | | | | | | 15,600 | | | | 15,646,702 | |
| | | |
| | | | | | | | | | | $ | 70,339,748 | |
|
| Hotels — 0.3% | |
| | | |
Playa Resorts Holding B.V., Term Loan, 3.75%, (1 mo. USD LIBOR + 2.75%, Floor 1.00%), 4/29/24 | | | | | | $ | 18,680 | | | $ | 18,270,176 | |
| | | |
| | | | | | | | | | | $ | 18,270,176 | |
|
| Insurance — 0.8% | |
| | | |
Asurion, LLC: | | | | | | | | | | | | |
| | | |
Term Loan - Second Lien, 5.337%, (1 mo. USD LIBOR + 5.25%), 1/31/28 | | | | | | $ | 26,480 | | | $ | 26,416,554 | |
| | | |
Term Loan - Second Lien, 5.337%, (1 mo. USD LIBOR + 5.25%), 1/20/29 | | | | | | | 13,286 | | | | 13,247,245 | |
| | | |
Sedgwick Claims Management Services, Inc., Term Loan, 3.337%, (1 mo. USD LIBOR + 3.25%), 12/31/25 | | | | | | | 11,399 | | | | 11,302,490 | |
| | | |
| | | | | | | | | | | $ | 50,966,289 | |
|
| Restaurant — 0.4% | |
| | | |
IRB Holding Corp.: | | | | | | | | | | | | |
| | | |
Term Loan, 3.75%, (USD LIBOR + 2.75%, Floor 1.00%), 2/5/25(15) | | | | | | $ | 14,770 | | | $ | 14,755,637 | |
| | | |
Term Loan, 4.25%, (3 mo. USD LIBOR + 3.25%, Floor 1.00%), 12/15/27 | | | | | | | 14,843 | | | | 14,862,935 | |
| | | |
| | | | | | | | | | | $ | 29,618,572 | |
| | | | |
| | 16 | | See Notes to Financial Statements. |
Eaton Vance
Income Fund of Boston
October 31, 2021
Portfolio of Investments — continued
| | | | | | | | | | | | |
| Borrower/Description | | | | | Principal
Amount
(000’s omitted) | | | Value | |
|
| Services — 0.9% | |
| | | |
AlixPartners, LLP, Term Loan, 3.25%, (1 mo. USD LIBOR + 2.75%, Floor 0.50%), 2/4/28 | | | | | | $ | 13,471 | | | $ | 13,448,848 | |
| | | |
Spin Holdco, Inc., Term Loan, 4.75%, (3 mo. USD LIBOR + 4.00%, Floor 0.75%), 3/4/28 | | | | | | | 10,239 | | | | 10,282,251 | |
| | | |
SRS Distribution, Inc., Term Loan, 4.25%, (6 mo. USD LIBOR + 3.75%, Floor 0.50%), 6/2/28 | | | | | | | 15,911 | | | | 15,929,023 | |
| | | |
Travelport Finance (Luxembourg) S.a.r.l., Term Loan, 2/28/25(14) | | | | | | | 15,977 | | | | 16,586,536 | |
| | | |
| | | | | | | | | | | $ | 56,246,658 | |
|
| Super Retail — 0.4% | |
| | | |
PetSmart, Inc., Term Loan, 4.50%, (6 mo. USD LIBOR + 3.75%, Floor 0.75%), 2/11/28 | | | | | | $ | 24,018 | | | $ | 24,079,987 | |
| | | |
| | | | | | | | | | | $ | 24,079,987 | |
|
| Technology — 1.1% | |
| | | |
LogMeIn, Inc., Term Loan, 4.834%, (1 mo. USD LIBOR + 4.75%), 8/31/27 | | | | | | $ | 25,803 | | | $ | 25,796,947 | |
| | | |
Presidio Holdings, Inc., Term Loan, 3.628%, (USD LIBOR + 3.50%), 1/22/27(15) | | | | | | | 7,912 | | | | 7,918,554 | |
| | | |
RealPage, Inc., Term Loan, 3.75%, (1 mo. USD LIBOR + 3.25%, Floor 0.50%), 4/24/28 | | | | | | | 14,340 | | | | 14,323,566 | |
| | | |
Riverbed Technology, Inc.: | | | | | | | | | | | | |
| | | |
Term Loan, 7.00%, (1 mo. USD LIBOR + 6.00%, Floor 1.00%), 12/31/25 | | | | | | | 10,694 | | | | 9,794,033 | |
| | | |
Term Loan - Second Lien, 12.00%, (1 mo. USD LIBOR + 11.00%, Floor 1.00%), 7.50% cash, 4.50% PIK, 12/31/26 | | | | | | | 11,358 | | | | 3,645,997 | |
| | | |
SS&C Technologies, Inc., Term Loan, 1.837%, (1 mo. USD LIBOR + 1.75%), 4/16/25 | | | | | | | 13,809 | | | | 13,701,886 | |
| | | |
| | | | | | | | | | | $ | 75,180,983 | |
|
| Telecommunications — 0.1% | |
| | | |
Intelsat Jackson Holdings S.A., DIP Loan, 5.392%, (3 mo. USD LIBOR + 4.75%, Floor 1.00%), 10/13/22(16) | | | | | | $ | 7,724 | | | $ | 7,762,879 | |
| | | |
| | | | | | | | | | | $ | 7,762,879 | |
| |
Total Senior Floating-Rate Loans
(identified cost $478,673,767) | | | $ | 471,072,380 | |
| | | | | | | | | | | | |
| Miscellaneous — 0.6% | |
| Security | | | | | Principal
Amount/
Shares | | | Value | |
|
| Cable & Satellite TV — 0.0% | |
| | | |
ACC Claims Holdings, LLC(4) | | | | | | $ | 11,599,560 | | | $ | 0 | |
| | | |
| | | | | | | | | | | $ | 0 | |
|
| Gaming — 0.6% | |
| | | |
PGP Investors, LLC, Membership Interests(2)(3)(4) | | | | | | | 55,373 | | | $ | 36,326,090 | |
| | | |
| | | | | | | | | | | $ | 36,326,090 | |
|
| Services — 0.0%(1) | |
| | | |
Hertz Corp., Escrow Certificates(2) | | | | | | $ | 3,679,000 | | | $ | 257,530 | |
| | | |
| | | | | | | | | | | $ | 257,530 | |
| |
Total Miscellaneous
(identified cost $6,486,941) | | | $ | 36,583,620 | |
|
| Short-Term Investments — 3.0% | |
| Description | | | | | Units | | | Value | |
| | | |
Eaton Vance Cash Reserves Fund, LLC, 0.09%(17) | | | | | | | 197,587,104 | | | $ | 197,587,104 | |
| |
Total Short-Term Investments
(identified cost $197,587,104) | | | $ | 197,587,104 | |
| |
Total Investments — 99.2%
(identified cost $6,215,988,045) | | | $ | 6,470,032,079 | |
| |
Less Unfunded Loan Commitments—(0.0)%(1) | | | $ | (1,287,376 | ) |
| |
Net Investments — 99.2%
(identified cost $6,214,700,669) | | | $ | 6,468,744,703 | |
| |
Other Assets, Less Liabilities — 0.8% | | | $ | 49,184,964 | |
| |
Net Assets — 100.0% | | | $ | 6,517,929,667 | |
The percentage shown for each investment category in the Portfolio of Investments is based on net assets.
| | * | In U.S. dollars unless otherwise indicated. |
| | (1) | Amount is less than 0.05%. |
| | (2) | Non-income producing security. |
| | (3) | Restricted security. (see Note 8). |
| | (4) | For fair value measurement disclosure purposes, security is categorized as Level 3 (see Note 12). |
| | | | |
| | 17 | | See Notes to Financial Statements. |
Eaton Vance
Income Fund of Boston
October 31, 2021
Portfolio of Investments — continued
| | (5) | Shares have not been registered under the Securities Act of 1933, as amended, or any other applicable state securities laws and may only be sold in certain transactions in reliance on an exemption from registration. |
| | (6) | Security exempt from registration under Rule 144A of the Securities Act of 1933, as amended. These securities may be sold in certain transactions in reliance on an exemption from registration (normally to qualified institutional buyers). At October 31, 2021, the aggregate value of these securities is $4,220,179,863 or 64.7% of the Fund’s net assets. |
| | (7) | Security exempt from registration under Regulation S of the Securities Act of 1933, as amended, which exempts from registration securities offered and sold outside the United States. Security may not be offered or sold in the United States except pursuant to an exemption from, or in a transaction not subject to, the registration requirements of the Securities Act of 1933, as amended. At October 31, 2021, the aggregate value of these securities is $69,380,447 or 1.1% of the Fund’s net assets. |
| | (8) | Variable rate security. The stated interest rate represents the rate in effect at October 31, 2021. |
| | (9) | Security converts to variable rate after the indicated fixed-rate coupon period. |
| (10) | Perpetual security with no stated maturity date but may be subject to calls by the issuer. |
| (11) | Represents a payment-in-kind security which may pay interest in additional principal at the issuer’s discretion. |
| (12) | When-issued security. |
| (13) | Senior floating-rate loans (Senior Loans) often require prepayments from excess cash flows or permit the borrowers to repay at their election. The degree to which borrowers repay, whether as a contractual requirement or at their election, cannot be predicted with accuracy. As a result, the actual remaining maturity may be substantially less than the stated maturities shown. However, Senior Loans will typically have an expected average life of approximately two to four years. Senior Loans typically have rates of interest which are redetermined periodically by reference to a base lending rate, plus a spread. These base lending rates are primarily the London Interbank Offered Rate (“LIBOR”) and secondarily, the prime rate offered by one or more major United States banks (the “Prime Rate”). Base lending rates may be subject to a floor, or minimum rate. Senior Loans are generally subject to contractual restrictions that must be satisfied before they can be bought or sold. |
| (14) | This Senior Loan will settle after October 31, 2021, at which time the interest rate will be determined. |
| (15) | The stated interest rate represents the weighted average interest rate at October 31, 2021 of contracts within the senior loan facility. Interest rates on contracts are primarily redetermined either weekly, monthly or quarterly by reference to the indicated base lending rate and spread and the reset period. |
| (16) | Unfunded or partially unfunded loan commitments. The stated interest rate reflects the weighted average of the reference rate and spread for the funded portion, if any. and the commitment fees on the portion of the loan that is unfunded. At October 31, 2021, the total value of unfunded loan commitments is $1,293,813. See Note 1F for description. |
| (17) | Affiliated investment company, available to Eaton Vance portfolios and funds, which invests in high quality, U.S. dollar denominated money market instruments. The rate shown is the annualized seven-day yield as of October 31, 2021. |
| | | | | | | | | | | | | | | | | | | | | | | | |
| Forward Foreign Currency Exchange Contracts | |
| | | | | |
| Currency Purchased | | | Currency Sold | | | Counterparty | | Settlement
Date | | | Unrealized
Appreciation | | | Unrealized
(Depreciation) | |
| | | | | | | |
| USD | | | 5,868,954 | | | CAD | | | 7,249,000 | | | State Street Bank and Trust Company | | | 1/31/22 | | | $ | 11,071 | | | $ | — | |
| | | | | | | |
| USD | | | 19,339,676 | | | EUR | | | 16,620,969 | | | State Street Bank and Trust Company | | | 1/31/22 | | | | 82,242 | | | | — | |
| | | | | | | |
| USD | | | 18,147,999 | | | EUR | | | 15,600,000 | | | State Street Bank and Trust Company | | | 1/31/22 | | | | 73,483 | | | | — | |
| | | | | | | |
| USD | | | 22,724,201 | | | EUR | | | 19,556,789 | | | State Street Bank and Trust Company | | | 1/31/22 | | | | 65,258 | | | | — | |
| | | | | | | |
| USD | | | 873,354 | | | EUR | | | 748,606 | | | State Street Bank and Trust Company | | | 1/31/22 | | | | 6,002 | | | | — | |
| | | | | | | |
| USD | | | 10,126,566 | | | GBP | | | 7,357,268 | | | State Street Bank and Trust Company | | | 1/31/22 | | | | 55,514 | | | | — | |
| | |
| | | | $ | 293,570 | | | $ | — | |
Abbreviations:
| | | | |
| | |
| DIP | | – | | Debtor In Possession |
| | |
| LIBOR | | – | | London Interbank Offered Rate |
| | |
| PIK | | – | | Payment In Kind |
Currency Abbreviations:
| | | | |
| | |
| CAD | | – | | Canadian Dollar |
| | |
| EUR | | – | | Euro |
| | |
| GBP | | – | | British Pound Sterling |
| | |
| USD | | – | | United States Dollar |
| | | | |
| | 18 | | See Notes to Financial Statements. |
Eaton Vance
Income Fund of Boston
October 31, 2021
Statement of Assets and Liabilities
| | | | |
| Assets | | October 31, 2021 | |
| |
Unaffiliated investments, at value (identified cost, $6,017,113,565) | | $ | 6,271,157,599 | |
| |
Affiliated investment, at value (identified cost, $197,587,104) | | | 197,587,104 | |
| |
Cash | | | 1,644,214 | |
| |
Deposits for derivatives collateral — forward foreign currency exchange contracts | | | 130,000 | |
| |
Foreign currency, at value (identified cost, $2,421) | | | 2,417 | |
| |
Interest receivable | | | 78,610,186 | |
| |
Dividends receivable from affiliated investment | | | 8,013 | |
| |
Receivable for investments sold | | | 19,830,680 | |
| |
Receivable for Fund shares sold | | | 10,547,075 | |
| |
Receivable for open forward foreign currency exchange contracts | | | 293,570 | |
| |
Total assets | | $ | 6,579,810,858 | |
|
| Liabilities | |
| |
Payable for investments purchased | | $ | 25,649,491 | |
| |
Payable for when-issued securities | | | 16,544,000 | |
| |
Payable for Fund shares redeemed | | | 12,727,483 | |
| |
Distributions payable | | | 849,824 | |
|
Payable to affiliates: | |
| |
Investment adviser fee | | | 3,223,388 | |
| |
Distribution and service fees | | | 248,721 | |
| |
Trustees’ fees | | | 9,042 | |
| |
Other | | | 225,070 | |
| |
Accrued expenses | | | 2,404,172 | |
| |
Total liabilities | | $ | 61,881,191 | |
| |
Net Assets | | $ | 6,517,929,667 | |
|
| Sources of Net Assets | |
| |
Paid-in capital | | $ | 6,630,332,043 | |
| |
Accumulated loss | | | (112,402,376 | ) |
| |
Total | | $ | 6,517,929,667 | |
| | | | |
| | 19 | | See Notes to Financial Statements. |
Eaton Vance
Income Fund of Boston
October 31, 2021
Statement of Assets and Liabilities — continued
| | | | |
| Class A Shares | | October 31, 2021 | |
| |
Net Assets | | $ | 841,709,472 | |
| |
Shares Outstanding | | | 150,571,788 | |
|
Net Asset Value and Redemption Price Per Share | |
| |
(net assets ÷ shares of beneficial interest outstanding) | | $ | 5.59 | |
|
Maximum Offering Price Per Share | |
| |
(100 ÷ 95.25 of net asset value per share) | | $ | 5.87 | |
|
| Class C Shares | |
| |
Net Assets | | $ | 65,596,263 | |
| |
Shares Outstanding | | | 11,709,054 | |
|
Net Asset Value and Offering Price Per Share* | |
| |
(net assets ÷ shares of beneficial interest outstanding) | | $ | 5.60 | |
|
| Class I Shares | |
| |
Net Assets | | $ | 4,267,314,429 | |
| |
Shares Outstanding | | | 763,117,286 | |
|
Net Asset Value, Offering Price and Redemption Price Per Share | |
| |
(net assets ÷ shares of beneficial interest outstanding) | | $ | 5.59 | |
|
| Class R Shares | |
| |
Net Assets | | $ | 25,010,264 | |
| |
Shares Outstanding | | | 4,469,372 | |
|
Net Asset Value, Offering Price and Redemption Price Per Share | |
| |
(net assets ÷ shares of beneficial interest outstanding) | | $ | 5.60 | |
|
| Class R6 Shares | |
| |
Net Assets | | $ | 1,318,299,239 | |
| |
Shares Outstanding | | | 235,684,304 | |
|
Net Asset Value, Offering Price and Redemption Price Per Share | |
| |
(net assets ÷ shares of beneficial interest outstanding) | | $ | 5.59 | |
On sales of $50,000 or more, the offering price of Class A shares is reduced.
| * | Redemption price per share is equal to the net asset value less any applicable contingent deferred sales charge. |
| | | | |
| | 20 | | See Notes to Financial Statements. |
Eaton Vance
Income Fund of Boston
October 31, 2021
Statement of Operations
| | | | |
| Investment Income | | Year Ended
October 31, 2021 | |
| |
Interest and other income | | $ | 336,557,961 | |
| |
Dividends (net of foreign taxes, $1,937) | | | 6,634,322 | |
| |
Dividends from affiliated investment | | | 205,808 | |
| |
Total investment income | | $ | 343,398,091 | |
|
| Expenses | |
| |
Investment adviser fee | | $ | 38,411,651 | |
|
Distribution and service fees | |
| |
Class A | | | 2,261,279 | |
| |
Class C | | | 696,659 | |
| |
Class R | | | 130,294 | |
| |
Trustees’ fees and expenses | | | 108,500 | |
| |
Custodian fee | | | 1,052,847 | |
| |
Transfer and dividend disbursing agent fees | | | 5,523,084 | |
| |
Legal and accounting services | | | 232,764 | |
| |
Printing and postage | | | 2,864,397 | |
| |
Registration fees | | | 227,425 | |
| |
Miscellaneous | | | 190,138 | |
| |
Total expenses | | $ | 51,699,038 | |
|
Deduct — | |
| |
Allocation of expenses to affiliates | | $ | 336,879 | |
| |
Total expense reductions | | $ | 336,879 | |
| |
Net expenses | | $ | 51,362,159 | |
| |
Net investment income | | $ | 292,035,932 | |
|
| Realized and Unrealized Gain (Loss) | |
|
Net realized gain (loss) — | |
| |
Investment transactions | | $ | 150,535,184 | |
| |
Investment transactions — affiliated investment | | | (2,415 | ) |
| |
Foreign currency transactions | | | 135,548 | |
| |
Forward foreign currency exchange contracts | | | (1,715,277 | ) |
| |
Net realized gain | | $ | 148,953,040 | |
|
Change in unrealized appreciation (depreciation) — | |
| |
Investments | | $ | 208,842,571 | |
| |
Foreign currency | | | (39,379 | ) |
| |
Forward foreign currency exchange contracts | | | (1,147,872 | ) |
| |
Net change in unrealized appreciation (depreciation) | | $ | 207,655,320 | |
| |
Net realized and unrealized gain | | $ | 356,608,360 | |
| |
Net increase in net assets from operations | | $ | 648,644,292 | |
| | | | |
| | 21 | | See Notes to Financial Statements. |
Eaton Vance
Income Fund of Boston
October 31, 2021
Statements of Changes in Net Assets
| | | | | | | | |
| | | Year Ended October 31, | |
| Increase (Decrease) in Net Assets | | 2021 | | | 2020 | |
|
From operations — | |
| | |
Net investment income | | $ | 292,035,932 | | | $ | 255,685,463 | |
| | |
Net realized gain (loss) | | | 148,953,040 | | | | (74,368,247 | ) |
| | |
Net change in unrealized appreciation (depreciation) | | | 207,655,320 | | | | (43,368,051 | ) |
| | |
Net increase in net assets from operations | | $ | 648,644,292 | | | $ | 137,949,165 | |
|
Distributions to shareholders — | |
| | |
Class A | | $ | (39,199,473 | ) | | $ | (35,921,711 | ) |
| | |
Class C | | | (2,600,246 | ) | | | (4,081,625 | ) |
| | |
Class I | | | (197,793,426 | ) | | | (203,904,380 | ) |
| | |
Class R | | | (1,078,291 | ) | | | (1,388,008 | ) |
| | |
Class R6 | | | (57,506,391 | ) | | | (17,666,105 | ) |
| | |
Total distributions to shareholders | | $ | (298,177,827 | ) | | $ | (262,961,829 | ) |
| | |
Tax return of capital to shareholders — | | | | | | | | |
| | |
Class A | | $ | (7,651,401 | ) | | $ | (7,952,433 | ) |
| | |
Class C | | | (489,604 | ) | | | (881,906 | ) |
| | |
Class I | | | (38,226,041 | ) | | | (46,447,912 | ) |
| | |
Class R | | | (207,702 | ) | | | (299,409 | ) |
| | |
Class R6 | | | (11,284,242 | ) | | | (4,214,638 | ) |
| | |
Total tax return of capital to shareholders | | $ | (57,858,990 | ) | | $ | (59,796,298 | ) |
|
Transactions in shares of beneficial interest — | |
|
Proceeds from sale of shares | |
| | |
Class A | | $ | 210,057,479 | | | $ | 294,230,449 | |
| | |
Class C | | | 12,252,032 | | | | 12,812,158 | |
| | |
Class I | | | 1,562,389,912 | | | | 2,541,440,716 | |
| | |
Class R | | | 4,982,533 | | | | 5,627,135 | |
| | |
Class R6 | | | 336,510,111 | | | | 1,027,476,800 | |
|
Net asset value of shares issued to shareholders in payment of distributions declared | |
| | |
Class A | | | 44,153,073 | | | | 40,867,967 | |
| | |
Class C | | | 3,021,535 | | | | 4,711,285 | |
| | |
Class I | | | 227,382,206 | | | | 240,420,535 | |
| | |
Class R | | | 1,273,847 | | | | 1,627,126 | |
| | |
Class R6 | | | 68,682,371 | | | | 21,832,651 | |
|
Cost of shares redeemed | |
| | |
Class A | | | (317,809,111 | ) | | | (233,179,025 | ) |
| | |
Class C | | | (16,200,823 | ) | | | (29,376,445 | ) |
| | |
Class I | | | (1,960,568,725 | ) | | | (2,097,941,525 | ) |
| | |
Class R | | | (9,583,380 | ) | | | (13,776,517 | ) |
| | |
Class R6 | | | (292,825,754 | ) | | | (125,136,164 | ) |
|
Net asset value of shares converted | |
| | |
Class A | | | 22,330,112 | | | | 10,482,076 | |
| | |
Class C | | | (22,330,112 | ) | | | (10,482,076 | ) |
| | |
Net increase (decrease) in net assets from Fund share transactions | | $ | (126,282,694 | ) | | $ | 1,691,637,146 | |
| | |
Net increase in net assets | | $ | 166,324,781 | | | $ | 1,506,828,184 | |
| |
| Net Assets | | | | |
| | |
At beginning of year | | $ | 6,351,604,886 | | | $ | 4,844,776,702 | |
| | |
At end of year | | $ | 6,517,929,667 | | | $ | 6,351,604,886 | |
| | | | |
| | 22 | | See Notes to Financial Statements. |
Eaton Vance
Income Fund of Boston
October 31, 2021
Financial Highlights
| | | | | | | | | | | | | | | | | | | | |
| | | Class A | |
| |
| | | Year Ended October 31, | |
| | | 2021 | | | 2020 | | | 2019 | | | 2018 | | | 2017 | |
| | | | | |
Net asset value — Beginning of year | | $ | 5.340 | | | $ | 5.580 | | | $ | 5.490 | | | $ | 5.800 | | | $ | 5.700 | |
| | | | | |
| Income (Loss) From Operations | | | | | | | | | | | | | | | | | | | | |
| | | | | |
Net investment income(1) | | $ | 0.235 | | | $ | 0.251 | | | $ | 0.281 | | | $ | 0.290 | | | $ | 0.298 | |
| | | | | |
Net realized and unrealized gain (loss) | | | 0.304 | | | | (0.173 | ) | | | 0.127 | | | | (0.282 | ) | | | 0.122 | |
| | | | | |
Total income from operations | | $ | 0.539 | | | $ | 0.078 | | | $ | 0.408 | | | $ | 0.008 | | | $ | 0.420 | |
| | | | | |
| Less Distributions | | | | | | | | | | | | | | | | | | | | |
| | | | | |
From net investment income | | $ | (0.242 | ) | | $ | (0.260 | ) | | $ | (0.287 | ) | | $ | (0.296 | ) | | $ | (0.304 | ) |
| | | | | |
Tax return of capital | | | (0.047 | ) | | | (0.058 | ) | | | (0.031 | ) | | | (0.022 | ) | | | (0.016 | ) |
| | | | | |
Total distributions | | $ | (0.289 | ) | | $ | (0.318 | ) | | $ | (0.318 | ) | | $ | (0.318 | ) | | $ | (0.320 | ) |
| | | | | |
Net asset value — End of year | | $ | 5.590 | | | $ | 5.340 | | | $ | 5.580 | | | $ | 5.490 | | | $ | 5.800 | |
| | | | | |
Total Return(2) | | | 10.23 | %(3) | | | 1.56 | %(3) | | | 7.63 | % | | | 0.13 | % | | | 7.52 | % |
| | | | | |
| Ratios/Supplemental Data | | | | | | | | | | | | | | | | | | | | |
| | | | | |
Net assets, end of year (000’s omitted) | | $ | 841,709 | | | $ | 843,097 | | | $ | 767,671 | | | $ | 813,970 | | | $ | 1,020,935 | |
| | | | | |
Ratios (as a percentage of average daily net assets):(4) | | | | | | | | | | | | | | | | | | | | |
| | | | | |
Expenses | | | 1.00 | %(3) | | | 1.01 | %(3) | | | 1.04 | % | | | 0.99 | % | | | 1.00 | % |
| | | | | |
Net investment income | | | 4.21 | % | | | 4.68 | % | | | 5.08 | % | | | 5.13 | % | | | 5.16 | % |
| | | | | |
Portfolio Turnover of the Portfolio(5) | | | — | | | | 32 | % | | | 38 | % | | | 39 | % | | | 41 | % |
| | | | | |
Portfolio Turnover of the Fund | | | 63 | % | | | 18 | %(6) | | | — | | | | — | | | | — | |
| (1) | Computed using average shares outstanding. |
| (2) | Returns are historical and are calculated by determining the percentage change in net asset value with all distributions reinvested and do not reflect the effect of sales charges. |
| (3) | The investment adviser and administrator reimbursed certain operating expenses (equal to 0.01% and 0.02% of average daily net assets for the years ended October 31, 2021 and 2020, respectively). Absent this reimbursement, total return would be lower. |
| (4) | Includes the Fund’s share of the Portfolio’s allocated expenses for the period while the Fund was investing in the Portfolio. |
| (5) | Portfolio turnover represents the rate of portfolio activity for the period while the Fund was investing in the Portfolio. |
| (6) | For the period from June 15, 2020 through October 31, 2020 when the Fund was making investments directly in securities. |
References to Portfolio herein are to Boston Income Portfolio, a Massachusetts business trust in which the Fund invested all of its investable assets prior to the close of business on June 12, 2020 and which had the same investment objectives and policies as the Fund during such period.
| | | | |
| | 23 | | See Notes to Financial Statements. |
Eaton Vance
Income Fund of Boston
October 31, 2021
Financial Highlights — continued
| | | | | | | | | | | | | | | | | | | | |
| | | Class C | |
| |
| | | Year Ended October 31, | |
| | | 2021 | | | 2020 | | | 2019 | | | 2018 | | | 2017 | |
| | | | | |
Net asset value — Beginning of year | | $ | 5.350 | | | $ | 5.590 | | | $ | 5.500 | | | $ | 5.810 | | | $ | 5.710 | |
| | | | | |
| Income (Loss) From Operations | | | | | | | | | | | | | | | | | | | | |
| | | | | |
Net investment income(1) | | $ | 0.194 | | | $ | 0.212 | | | $ | 0.241 | | | $ | 0.248 | | | $ | 0.253 | |
| | | | | |
Net realized and unrealized gain (loss) | | | 0.303 | | | | (0.177 | ) | | | 0.124 | | | | (0.283 | ) | | | 0.124 | |
| | | | | |
Total income (loss) from operations | | $ | 0.497 | | | $ | 0.035 | | | $ | 0.365 | | | $ | (0.035 | ) | | $ | 0.377 | |
| | | | | |
| Less Distributions | | | | | | | | | | | | | | | | | | | | |
| | | | | |
From net investment income | | $ | (0.207 | ) | | $ | (0.225 | ) | | $ | (0.248 | ) | | $ | (0.256 | ) | | $ | (0.263 | ) |
| | | | | |
Tax return of capital | | | (0.040 | ) | | | (0.050 | ) | | | (0.027 | ) | | | (0.019 | ) | | | (0.014 | ) |
| | | | | |
Total distributions | | $ | (0.247 | ) | | $ | (0.275 | ) | | $ | (0.275 | ) | | $ | (0.275 | ) | | $ | (0.277 | ) |
| | | | | |
Net asset value — End of year | | $ | 5.600 | | | $ | 5.350 | | | $ | 5.590 | | | $ | 5.500 | | | $ | 5.810 | |
| | | | | |
Total Return(2) | | | 9.39 | %(3) | | | 0.74 | %(3) | | | 6.79 | % | | | (0.62 | )% | | | 6.72 | % |
| | | | | |
| Ratios/Supplemental Data | | | | | | | | | | | | | | | | | | | | |
| | | | | |
Net assets, end of year (000’s omitted) | | $ | 65,596 | | | $ | 85,246 | | | $ | 112,343 | | | $ | 184,383 | | | $ | 231,504 | |
| | | | | |
Ratios (as a percentage of average daily net assets):(4) | | | | | | | | | | | | | | | | | | | | |
| | | | | |
Expenses | | | 1.75 | %(3) | | | 1.76 | %(3) | | | 1.79 | % | | | 1.74 | % | | | 1.75 | % |
| | | | | |
Net investment income | | | 3.47 | % | | | 3.95 | % | | | 4.36 | % | | | 4.38 | % | | | 4.38 | % |
| | | | | |
Portfolio Turnover of the Portfolio(5) | | | — | | | | 32 | % | | | 38 | % | | | 39 | % | | | 41 | % |
| | | | | |
Portfolio Turnover of the Fund | | | 63 | % | | | 18 | %(6) | | | — | | | | — | | | | — | |
| (1) | Computed using average shares outstanding. |
| (2) | Returns are historical and are calculated by determining the percentage change in net asset value with all distributions reinvested and do not reflect the effect of sales charges. |
| (3) | The investment adviser and administrator reimbursed certain operating expenses (equal to 0.01% and 0.02% of average daily net assets for the years ended October 31, 2021 and 2020, respectively). Absent this reimbursement, total return would be lower. |
| (4) | Includes the Fund’s share of the Portfolio’s allocated expenses for the period while the Fund was investing in the Portfolio. |
| (5) | Portfolio turnover represents the rate of portfolio activity for the period while the Fund was investing in the Portfolio. |
| (6) | For the period from June 15, 2020 through October 31, 2020 when the Fund was making investments directly in securities. |
References to Portfolio herein are to Boston Income Portfolio, a Massachusetts business trust in which the Fund invested all of its investable assets prior to the close of business on June 12, 2020 and which had the same investment objectives and policies as the Fund during such period.
| | | | |
| | 24 | | See Notes to Financial Statements. |
Eaton Vance
Income Fund of Boston
October 31, 2021
Financial Highlights — continued
| | | | | | | | | | | | | | | | | | | | |
| | | Class I | |
| |
| | | Year Ended October 31, | |
| | | 2021 | | | 2020 | | | 2019 | | | 2018 | | | 2017 | |
| | | | | |
Net asset value — Beginning of year | | $ | 5.340 | | | $ | 5.590 | | | $ | 5.500 | | | $ | 5.810 | | | $ | 5.700 | |
| | | | | |
| Income (Loss) From Operations | | | | | | | | | | | | | | | | | | | | |
| | | | | |
Net investment income(1) | | $ | 0.249 | | | $ | 0.263 | | | $ | 0.294 | | | $ | 0.304 | | | $ | 0.311 | |
| | | | | |
Net realized and unrealized gain (loss) | | | 0.304 | | | | (0.181 | ) | | | 0.128 | | | | (0.282 | ) | | | 0.133 | |
| | | | | |
Total income from operations | | $ | 0.553 | | | $ | 0.082 | | | $ | 0.422 | | | $ | 0.022 | | | $ | 0.444 | |
| | | | | |
| Less Distributions | | | | | | | | | | | | | | | | | | | | |
| | | | | |
From net investment income | | $ | (0.254 | ) | | $ | (0.272 | ) | | $ | (0.300 | ) | | $ | (0.309 | ) | | $ | (0.317 | ) |
| | | | | |
Tax return of capital | | | (0.049 | ) | | | (0.060 | ) | | | (0.032 | ) | | | (0.023 | ) | | | (0.017 | ) |
| | | | | |
Total distributions | | $ | (0.303 | ) | | $ | (0.332 | ) | | $ | (0.332 | ) | | $ | (0.332 | ) | | $ | (0.334 | ) |
| | | | | |
Net asset value — End of year | | $ | 5.590 | | | $ | 5.340 | | | $ | 5.590 | | | $ | 5.500 | | | $ | 5.810 | |
| | | | | |
Total Return(2) | | | 10.50 | %(3) | | | 1.64 | %(3) | | | 7.90 | % | | | 0.38 | % | | | 7.96 | % |
| | | | | |
| Ratios/Supplemental Data | | | | | | | | | | | | | | | | | | | | |
| | | | | |
Net assets, end of year (000’s omitted) | | $ | 4,267,314 | | | $ | 4,242,893 | | | $ | 3,678,145 | | | $ | 3,415,432 | | | $ | 4,217,385 | |
| | | | | |
Ratios (as a percentage of average daily net assets):(4) | | | | | | | | | | | | | | | | | | | | |
| | | | | |
Expenses | | | 0.75 | %(3) | | | 0.76 | %(3) | | | 0.79 | % | | | 0.74 | % | | | 0.75 | % |
| | | | | |
Net investment income | | | 4.47 | % | | | 4.91 | % | | | 5.32 | % | | | 5.38 | % | | | 5.39 | % |
| | | | | |
Portfolio Turnover of the Portfolio(5) | | | — | | | | 32 | % | | | 38 | % | | | 39 | % | | | 41 | % |
| | | | | |
Portfolio Turnover of the Fund | | | 63 | % | | | 18 | %(6) | | | — | | | | — | | | | — | |
| (1) | Computed using average shares outstanding. |
| (2) | Returns are historical and are calculated by determining the percentage change in net asset value with all distributions reinvested. |
| (3) | The investment adviser and administrator reimbursed certain operating expenses (equal to 0.01% and 0.02% of average daily net assets for the years ended October 31, 2021 and 2020, respectively). Absent this reimbursement, total return would be lower. |
| (4) | Includes the Fund’s share of the Portfolio’s allocated expenses for the period while the Fund was investing in the Portfolio. |
| (5) | Portfolio turnover represents the rate of portfolio activity for the period while the Fund was investing in the Portfolio. |
| (6) | For the period from June 15, 2020 through October 31, 2020 when the Fund was making investments directly in securities. |
References to Portfolio herein are to Boston Income Portfolio, a Massachusetts business trust in which the Fund invested all of its investable assets prior to the close of business on June 12, 2020 and which had the same investment objectives and policies as the Fund during such period.
| | | | |
| | 25 | | See Notes to Financial Statements. |
Eaton Vance
Income Fund of Boston
October 31, 2021
Financial Highlights — continued
| | | | | | | | | | | | | | | | | | | | |
| | | Class R | |
| |
| | | Year Ended October 31, | |
| | | 2021 | | | 2020 | | | 2019 | | | 2018 | | | 2017 | |
| | | | | |
Net asset value — Beginning of year | | $ | 5.350 | | | $ | 5.590 | | | $ | 5.500 | | | $ | 5.810 | | | $ | 5.700 | |
| | | | | |
| Income (Loss) From Operations | | | | | | | | | | | | | | | | | | | | |
| | | | | |
Net investment income(1) | | $ | 0.221 | | | $ | 0.239 | | | $ | 0.267 | | | $ | 0.276 | | | $ | 0.282 | |
| | | | | |
Net realized and unrealized gain (loss) | | | 0.304 | | | | (0.176 | ) | | | 0.126 | | | | (0.283 | ) | | | 0.133 | |
| | | | | |
Total income (loss) from operations | | $ | 0.525 | | | $ | 0.063 | | | $ | 0.393 | | | $ | (0.007 | ) | | $ | 0.415 | |
| | | | | |
| Less Distributions | | | | | | | | | | | | | | | | | | | | |
| | | | | |
From net investment income | | $ | (0.230 | ) | | $ | (0.248 | ) | | $ | (0.274 | ) | | $ | (0.282 | ) | | $ | (0.290 | ) |
| | | | | |
Tax return of capital | | | (0.045 | ) | | | (0.055 | ) | | | (0.029 | ) | | | (0.021 | ) | | | (0.015 | ) |
| | | | | |
Total distributions | | $ | (0.275 | ) | | $ | (0.303 | ) | | $ | (0.303 | ) | | $ | (0.303 | ) | | $ | (0.305 | ) |
| | | | | |
Net asset value — End of year | | $ | 5.600 | | | $ | 5.350 | | | $ | 5.590 | | | $ | 5.500 | | | $ | 5.810 | |
| | | | | |
Total Return(2) | | | 9.95 | %(3) | | | 1.28 | %(3) | | | 7.34 | % | | | 0.04 | % | | | 7.25 | % |
| | | | | |
| Ratios/Supplemental Data | | | | | | | | | | | | | | | | | | | | |
| | | | | |
Net assets, end of year (000’s omitted) | | $ | 25,010 | | | $ | 27,105 | | | $ | 35,182 | | | $ | 40,116 | | | $ | 46,259 | |
| | | | | |
Ratios (as a percentage of average daily net assets):(4) | | | | | | | | | | | | | | | | | | | | |
| | | | | |
Expenses | | | 1.25 | %(3) | | | 1.26 | %(3) | | | 1.29 | % | | | 1.24 | % | | | 1.25 | % |
| | | | | |
Net investment income | | | 3.97 | % | | | 4.44 | % | | | 4.83 | % | | | 4.88 | % | | | 4.89 | % |
| | | | | |
Portfolio Turnover of the Portfolio(5) | | | — | | | | 32 | % | | | 38 | % | | | 39 | % | | | 41 | % |
| | | | | |
Portfolio Turnover of the Fund | | | 63 | % | | | 18 | %(6) | | | — | | | | — | | | | — | |
| (1) | Computed using average shares outstanding. |
| (2) | Returns are historical and are calculated by determining the percentage change in net asset value with all distributions reinvested. |
| (3) | The investment adviser and administrator reimbursed certain operating expenses (equal to 0.01% and 0.02% of average daily net assets for the years ended October 31, 2021 and 2020, respectively). Absent this reimbursement, total return would be lower. |
| (4) | Includes the Fund’s share of the Portfolio’s allocated expenses for the period while the Fund was investing in the Portfolio. |
| (5) | Portfolio turnover represents the rate of portfolio activity for the period while the Fund was investing in the Portfolio. |
| (6) | For the period from June 15, 2020 through October 31, 2020 when the Fund was making investments directly in securities. |
References to Portfolio herein are to Boston Income Portfolio, a Massachusetts business trust in which the Fund invested all of its investable assets prior to the close of business on June 12, 2020 and which had the same investment objectives and policies as the Fund during such period.
| | | | |
| | 26 | | See Notes to Financial Statements. |
Eaton Vance
Income Fund of Boston
October 31, 2021
Financial Highlights — continued
| | | | | | | | | | | | | | | | | | | | |
| | | Class R6 | |
| |
| | | Year Ended October 31, | |
| | | 2021 | | | 2020 | | | 2019 | | | 2018 | | | 2017 | |
| | | | | |
Net asset value — Beginning of year | | $ | 5.350 | | | $ | 5.590 | | | $ | 5.500 | | | $ | 5.810 | | | $ | 5.700 | |
| | | | | |
| Income (Loss) From Operations | | | | | | | | | | | | | | | | | | | | |
| | | | | |
Net investment income(1) | | $ | 0.254 | | | $ | 0.264 | | | $ | 0.300 | | | $ | 0.309 | | | $ | 0.314 | |
| | | | | |
Net realized and unrealized gain (loss) | | | 0.294 | | | | (0.167 | ) | | | 0.127 | | | | (0.282 | ) | | | 0.135 | |
| | | | | |
Total income from operations | | $ | 0.548 | | | $ | 0.097 | | | $ | 0.427 | | | $ | 0.027 | | | $ | 0.449 | |
| | | | | |
| Less Distributions | | | | | | | | | | | | | | | | | | | | |
| | | | | |
From net investment income | | $ | (0.258 | ) | | $ | (0.276 | ) | | $ | (0.304 | ) | | $ | (0.314 | ) | | $ | (0.322 | ) |
| | | | | |
Tax return of capital | | | (0.050 | ) | | | (0.061 | ) | | | (0.033 | ) | | | (0.023 | ) | | | (0.017 | ) |
| | | | | |
Total distributions | | $ | (0.308 | ) | | $ | (0.337 | ) | | $ | (0.337 | ) | | $ | (0.337 | ) | | $ | (0.339 | ) |
| | | | | |
Net asset value — End of year | | $ | 5.590 | | | $ | 5.350 | | | $ | 5.590 | | | $ | 5.500 | | | $ | 5.810 | |
| | | | | |
Total Return(2) | | | 10.39 | %(3) | | | 1.92 | %(3) | | | 8.00 | % | | | 0.47 | % | | | 8.06 | % |
| | | | | |
| Ratios/Supplemental Data | | | | | | | | | | | | | | | | | | | | |
| | | | | |
Net assets, end of year (000’s omitted) | | $ | 1,318,299 | | | $ | 1,153,264 | | | $ | 251,435 | | | $ | 207,830 | | | $ | 179,380 | |
| | | | | |
Ratios (as a percentage of average daily net assets):(4) | | | | | | | | | | | | | | | | | | | | |
| | | | | |
Expenses | | | 0.66 | %(3) | | | 0.66 | %(3) | | | 0.68 | % | | | 0.66 | % | | | 0.66 | % |
| | | | | |
Net investment income | | | 4.55 | % | | | 4.92 | % | | | 5.42 | % | | | 5.47 | % | | | 5.43 | % |
| | | | | |
Portfolio Turnover of the Portfolio(5) | | | — | | | | 32 | % | | | 38 | % | | | 39 | % | | | 41 | % |
| | | | | |
Portfolio Turnover of the Fund | | | 63 | % | | | 18 | %(6) | | | — | | | | — | | | | — | |
| (1) | Computed using average shares outstanding. |
| (2) | Returns are historical and are calculated by determining the percentage change in net asset value with all distributions reinvested. |
| (3) | The investment adviser and administrator reimbursed certain operating expenses (equal to 0.01% and 0.02% of average daily net assets for the years ended October 31, 2021 and 2020, respectively). Absent this reimbursement, total return would be lower. |
| (4) | Includes the Fund’s share of the Portfolio’s allocated expenses for the period while the Fund was investing in the Portfolio. |
| (5) | Portfolio turnover represents the rate of portfolio activity for the period while the Fund was investing in the Portfolio. |
| (6) | For the period from June 15, 2020 through October 31, 2020 when the Fund was making investments directly in securities. |
References to Portfolio herein are to Boston Income Portfolio, a Massachusetts business trust in which the Fund invested all of its investable assets prior to the close of business on June 12, 2020 and which had the same investment objectives and policies as the Fund during such period.
| | | | |
| | 27 | | See Notes to Financial Statements. |
Eaton Vance
Income Fund of Boston
October 31, 2021
Notes to Financial Statements
1 Significant Accounting Policies
Eaton Vance Income Fund of Boston (the Fund) is a diversified series of Eaton Vance Series Trust II (the Trust). The Trust is a Massachusetts business trust registered under the Investment Company Act of 1940, as amended (the 1940 Act), as an open-end management investment company. The Fund’s investment objective is to provide a high level of current income. The Fund’s secondary objectives are to seek growth of income and capital. The Fund offers five classes of shares. Class A shares are generally sold subject to a sales charge imposed at time of purchase. Class C shares are sold at net asset value and are generally subject to a contingent deferred sales charge (see Note 5). Effective January 25, 2019, Class C shares generally automatically convert to Class A shares ten years after their purchase and, effective November 5, 2020, automatically convert to Class A shares eight years after their purchase as described in the Fund’s prospectus. Class I, Class R and Class R6 shares are sold at net asset value and are not subject to a sales charge. Each class represents a pro-rata interest in the Fund, but votes separately on class-specific matters and (as noted below) is subject to different expenses. Realized and unrealized gains and losses are allocated daily to each class of shares based on the relative net assets of each class to the total net assets of the Fund. Net investment income, other than class-specific expenses, is allocated daily to each class of shares based upon the ratio of the value of each class’s paid shares to the total value of all paid shares. Sub-accounting, recordkeeping and similar administrative fees payable to financial intermediaries, which are a component of transfer and dividend disbursing agent fees on the Statement of Operations, are not allocated to Class R6 shares. Each class of shares differs in its distribution plan and certain other class-specific expenses.
The following is a summary of significant accounting policies of the Fund. The policies are in conformity with accounting principles generally accepted in the United States of America (U.S. GAAP). The Fund is an investment company and follows accounting and reporting guidance in the Financial Accounting Standards Board (FASB) Accounting Standards Codification Topic 946.
A Investment Valuation — The following methodologies are used to determine the market value or fair value of investments.
Debt Obligations. Debt obligations are generally valued on the basis of valuations provided by third party pricing services, as derived from such services’ pricing models. Inputs to the models may include, but are not limited to, reported trades, executable bid and ask prices, broker/dealer quotations, prices or yields of securities with similar characteristics, interest rates, anticipated prepayments, benchmark curves or information pertaining to the issuer, as well as industry and economic events. The pricing services may use a matrix approach, which considers information regarding securities with similar characteristics to determine the valuation for a security. Short-term debt obligations purchased with a remaining maturity of sixty days or less for which a valuation from a third party pricing service is not readily available may be valued at amortized cost, which approximates fair value.
Senior Floating-Rate Loans. Interests in senior floating-rate loans (Senior Loans) for which reliable market quotations are readily available are valued generally at the average mean of bid and ask quotations obtained from a third party pricing service. Other Senior Loans are valued at fair value by the investment adviser under procedures approved by the Trustees. In fair valuing a Senior Loan, the investment adviser utilizes one or more of the valuation techniques described in (i) through (iii) below to assess the likelihood that the borrower will make a full repayment of the loan underlying such Senior Loan relative to yields on other Senior Loans issued by companies of comparable credit quality. If the investment adviser believes that there is a reasonable likelihood of full repayment, the investment adviser will determine fair value using a matrix pricing approach that considers the yield on the Senior Loan. If the investment adviser believes there is not a reasonable likelihood of full repayment, the investment adviser will determine fair value using analyses that include, but are not limited to: (i) a comparison of the value of the borrower’s outstanding equity and debt to that of comparable public companies; (ii) a discounted cash flow analysis; or (iii) when the investment adviser believes it is likely that a borrower will be liquidated or sold, an analysis of the terms of such liquidation or sale. In certain cases, the investment adviser will use a combination of analytical methods to determine fair value, such as when only a portion of a borrower’s assets are likely to be sold. In conducting its assessment and analyses for purposes of determining fair value of a Senior Loan, the investment adviser will use its discretion and judgment in considering and appraising relevant factors. Fair value determinations are made by the portfolio managers of the Fund based on information available to such managers. The portfolio managers of other funds managed by the investment adviser that invest in Senior Loans may not possess the same information about a Senior Loan borrower as the portfolio managers of the Fund. At times, the fair value of a Senior Loan determined by the portfolio managers of other funds managed by the investment adviser that invest in Senior Loans may vary from the fair value of the same Senior Loan determined by the portfolio managers of the Fund. The fair value of each Senior Loan is periodically reviewed and approved by the investment adviser’s Valuation Committee and by the Trustees based upon procedures approved by the Trustees. Junior Loans (i.e., subordinated loans and second lien loans) are valued in the same manner as Senior Loans.
Equity Securities. Equity securities listed on a U.S. securities exchange generally are valued at the last sale or closing price on the day of valuation or, if no sales took place on such date, at the mean between the closing bid and ask prices on the exchange where such securities are principally traded. Equity securities listed on the NASDAQ National Market System are valued at the NASDAQ official closing price. Unlisted or listed securities for which closing sales prices or closing quotations are not available are valued at the mean between the latest available bid and ask prices or, in the case of preferred equity securities that are not listed or traded in the over-the-counter market, by a third party pricing service that uses various techniques that consider factors including, but not limited to, prices or yields of securities with similar characteristics, benchmark yields, broker/dealer quotes, quotes of underlying common stock, issuer spreads, as well as industry and economic events.
Derivatives. Forward foreign currency exchange contracts are generally valued at the mean of the average bid and average ask prices that are reported by currency dealers to a third party pricing service at the valuation time. Such third party pricing service valuations are supplied for specific settlement periods and the Fund’s forward foreign currency exchange contracts are valued at an interpolated rate between the closest preceding and subsequent settlement period reported by the third party pricing service.
Foreign Securities and Currencies. Foreign securities and currencies are valued in U.S. dollars, based on foreign currency exchange rate quotations supplied by a third party pricing service. The pricing service uses a proprietary model to determine the exchange rate. Inputs to the model include reported trades and implied bid/ask spreads.
Eaton Vance
Income Fund of Boston
October 31, 2021
Notes to Financial Statements — continued
Affiliated Fund. The Fund may invest in Eaton Vance Cash Reserves Fund, LLC (Cash Reserves Fund), an affiliated investment company managed by Eaton Vance Management (EVM). While Cash Reserves Fund is not a registered money market mutual fund, it conducts all of its investment activities in accordance with the requirements of Rule 2a-7 under the 1940 Act. Investments in Cash Reserves Fund are valued at the closing net asset value per unit on the valuation day. Cash Reserves Fund generally values its investment securities based on available market quotations provided by a third party pricing service.
Fair Valuation. Investments for which valuations or market quotations are not readily available or are deemed unreliable are valued at fair value using methods determined in good faith by or at the direction of the Trustees of the Fund in a manner that most fairly reflects the security’s “fair value”, which is the amount that the Fund might reasonably expect to receive for the security upon its current sale in the ordinary course. Each such determination is based on a consideration of relevant factors, which are likely to vary from one pricing context to another. These factors may include, but are not limited to, the type of security, the existence of any contractual restrictions on the security’s disposition, the price and extent of public trading in similar securities of the issuer or of comparable companies or entities, quotations or relevant information obtained from broker/dealers or other market participants, information obtained from the issuer, analysts, and/or the appropriate stock exchange (for exchange-traded securities), an analysis of the company’s or entity’s financial statements, and an evaluation of the forces that influence the issuer and the market(s) in which the security is purchased and sold.
B Investment Transactions — Investment transactions for financial statement purposes are accounted for on a trade date basis. Realized gains and losses on investments sold are determined on the basis of identified cost.
C Income — Interest income is recorded on the basis of interest accrued, adjusted for amortization of premium or accretion of discount. Fees associated with loan amendments are recognized immediately. Dividend income is recorded on the ex-dividend date for dividends received in cash and/or securities. Withholding taxes on foreign interest and dividends have been provided for in accordance with the Fund’s understanding of the applicable countries’ tax rules and rates. Distributions from investment companies are recorded as dividend income, capital gains or return of capital based on the nature of the distribution.
D Federal Taxes — The Fund’s policy is to comply with the provisions of the Internal Revenue Code applicable to regulated investment companies and to distribute to shareholders each year substantially all of its net investment income, and all or substantially all of its net realized capital gains. Accordingly, no provision for federal income or excise tax is necessary.
As of October 31, 2021, the Fund had no uncertain tax positions that would require financial statement recognition, de-recognition, or disclosure. The Fund files a U.S. federal income tax return annually after its fiscal year-end, which is subject to examination by the Internal Revenue Service for a period of three years from the date of filing.
E Expenses — The majority of expenses of the Trust are directly identifiable to an individual fund. Expenses which are not readily identifiable to a specific fund are allocated taking into consideration, among other things, the nature and type of expense and the relative size of the funds.
F Foreign Currency Translation — Investment valuations, other assets, and liabilities initially expressed in foreign currencies are translated each business day into U.S. dollars based upon current exchange rates. Purchases and sales of foreign investment securities and income and expenses denominated in foreign currencies are translated into U.S. dollars based upon currency exchange rates in effect on the respective dates of such transactions. Recognized gains or losses on investment transactions attributable to changes in foreign currency exchange rates are recorded for financial statement purposes as net realized gains and losses on investments. That portion of unrealized gains and losses on investments that results from fluctuations in foreign currency exchange rates is not separately disclosed.
G Unfunded Loan Commitments — The Fund may enter into certain loan agreements all or a portion of which may be unfunded. The Fund is obligated to fund these commitments at the borrower’s discretion. These commitments are disclosed in the accompanying Portfolio of Investments. At October 31, 2021, the Fund had sufficient cash and/or securities to cover these commitments.
H Use of Estimates — The preparation of the financial statements in conformity with U.S. GAAP requires management to make estimates and assumptions that affect the reported amounts of assets and liabilities at the date of the financial statements and the reported amounts of income and expense during the reporting period. Actual results could differ from those estimates.
I Indemnifications — Under the Trust’s organizational documents, its officers and Trustees may be indemnified against certain liabilities and expenses arising out of the performance of their duties to the Fund. Under Massachusetts law, if certain conditions prevail, shareholders of a Massachusetts business trust (such as the Trust) could be deemed to have personal liability for the obligations of the Trust. However, the Trust’s Declaration of Trust contains an express disclaimer of liability on the part of Fund shareholders and the By-laws provide that the Trust shall assume, upon request by the shareholder, the defense on behalf of any Fund shareholders. Moreover, the By-laws also provide for indemnification out of Fund property of any shareholder held personally liable solely by reason of being or having been a shareholder for all loss or expense arising from such liability. Additionally, in the normal course of business, the Fund enters into agreements with service providers that may contain indemnification clauses. The Fund’s maximum exposure under these arrangements is unknown as this would involve future claims that may be made against the Fund that have not yet occurred.
J Forward Foreign Currency Exchange Contracts — The Fund may enter into forward foreign currency exchange contracts for the purchase or sale of a specific foreign currency at a fixed price on a future date. The forward foreign currency exchange contracts are adjusted by the daily exchange rate of the underlying currency and any gains or losses are recorded as unrealized until such time as the contracts have been closed. Risks may arise upon entering
Eaton Vance
Income Fund of Boston
October 31, 2021
Notes to Financial Statements — continued
these contracts from the potential inability of counterparties to meet the terms of their contracts and from movements in the value of a foreign currency relative to the U.S. dollar.
K When-Issued Securities and Delayed Delivery Transactions — The Fund may purchase securities on a delayed delivery or when-issued basis. Payment and delivery may take place after the customary settlement period for that security. At the time the transaction is negotiated, the price of the security that will be delivered is fixed. The Fund maintains cash and/or security positions for these commitments such that sufficient liquid assets will be available to make payments upon settlement. Securities purchased on a delayed delivery or when-issued basis are marked-to-market daily and begin earning interest on settlement date. Such securities when-issued basis are subject to the risk that when delivered they will be worth less than the agreed upon payment price. Losses may also arise if the counterparty does not perform under the contract.
2 Distributions to Shareholders and Income Tax Information
The Fund declares dividends daily to shareholders of record at the time of declaration. Distributions are generally paid monthly. Distributions of realized capital gains are made at least annually. Distributions are declared separately for each class of shares. Shareholders may reinvest income and capital gain distributions in additional shares of the same class of the Fund at the net asset value as of the reinvestment date or, at the election of the shareholder, receive distributions in cash. Distributions to shareholders are determined in accordance with income tax regulations, which may differ from U.S. GAAP. As required by U.S. GAAP, only distributions in excess of tax basis earnings and profits are reported in the financial statements as a return of capital. Permanent differences between book and tax accounting relating to distributions are reclassified to paid-in capital. For tax purposes, distributions from short-term capital gains are considered to be from ordinary income.
The tax character of distributions declared for the years ended October 31, 2021 and October 31, 2020 was as follows:
| | | | | | | | |
| | | Year Ended October 31, | |
| | | 2021 | | | 2020 | |
| | |
Ordinary income | | $ | 298,177,827 | | | $ | 262,961,829 | |
| | |
Tax return of capital | | $ | 57,858,990 | | | $ | 59,796,298 | |
During the year ended October 31, 2021, accumulated loss was decreased by $325,726 and paid-in capital was decreased by $325,726 due to differences between book and tax accounting for the Fund’s investment in the Portfolio. These reclassifications had no effect on the net assets or net asset value per share of the Fund.
As of October 31, 2021, the components of distributable earnings (accumulated loss) on a tax basis were as follows:
| | | | |
| | |
Deferred capital losses | | $ | (254,262,109 | ) |
| |
Net unrealized appreciation | | | 142,709,557 | |
| |
Distributions payable | | | (849,824 | ) |
| |
Accumulated loss | | $ | (112,402,376 | ) |
At October 31, 2021, the Fund, for federal income tax purposes, had deferred capital losses of $254,262,109 which would reduce its taxable income arising from future net realized gains on investment transactions, if any, to the extent permitted by the Internal Revenue Code, and thus would reduce the amount of distributions to shareholders, which would otherwise be necessary to relieve the Fund of any liability for federal income or excise tax. The deferred capital losses are treated as arising on the first day of the Fund’s next taxable year and retain the same short-term or long-term character as when originally deferred. Of the deferred capital losses at October 31, 2021, $254,262,109 are long-term.
The cost and unrealized appreciation (depreciation) of investments, including open derivative contracts, of the Fund at October 31, 2021, as determined on a federal income tax basis, were as follows:
| | | | |
| |
Aggregate cost | | $ | 6,325,997,378 | |
| |
Gross unrealized appreciation | | $ | 201,558,132 | |
| |
Gross unrealized depreciation | | | (58,810,807 | ) |
| |
Net unrealized appreciation | | $ | 142,747,325 | |
Eaton Vance
Income Fund of Boston
October 31, 2021
Notes to Financial Statements — continued
3 Investment Adviser Fee and Other Transactions with Affiliates
The investment adviser fee is earned by Boston Management and Research (BMR) as compensation for investment advisory services rendered to the Fund. On March 1, 2021, Morgan Stanley acquired Eaton Vance Corp. (the “Transaction”) and BMR became an indirect, wholly-owned subsidiary of Morgan Stanley. In connection with the Transaction, the Fund entered into a new investment advisory agreement (the “New Agreement”) with BMR, which took effect on March 1, 2021. Pursuant to the New Agreement (and the Fund’s investment advisory agreement with BMR in effect prior to March 1, 2021), the investment adviser fee is computed at an annual rate as a percentage of average daily net assets as follows and is payable monthly:
| | | | |
| Average Daily Net Assets | | Annual Fee
Rate | |
| |
Up to $1.5 billion | | | 0.625 | % |
| |
$1.5 billion but less than $2 billion | | | 0.600 | % |
| |
$2 billion but less than $5 billion | | | 0.575 | % |
| |
$5 billion but less than $10 billion | | | 0.555 | % |
| |
$10 billion and over | | | 0.535 | % |
For the year ended October 31, 2021, the Fund’s investment adviser fee amounted to $38,411,651 or 0.58% of the Fund’s average daily net assets.
Pursuant to an investment sub-advisory agreement, BMR has delegated a portion of the investment management of the Fund to Eaton Vance Advisers International Ltd. (EVAIL), an affiliate of BMR and, effective March 1, 2021, an indirect, wholly-owned subsidiary of Morgan Stanley. In connection with the Transaction, BMR entered into a new sub-advisory agreement with EVAIL, which took effect on March 1, 2021. BMR pays EVAIL a portion of its investment adviser fee for sub-advisory services provided to the Fund. The Fund may invest its cash in Cash Reserves Fund. EVM does not currently receive a fee for advisory services provided to Cash Reserves Fund.
EVM, an affiliate of BMR, serves as the administrator of the Fund, but receives no compensation. BMR and EVM have agreed to reimburse the Fund’s expenses to the extent that total annual operating expenses (relating to ordinary operating expenses only and excluding such expenses as acquired fund fees and expenses of unaffiliated funds, borrowing costs, taxes or litigation expenses) exceed 1.00%, 1.75%, 0.75%, 1.25% and 0.66% of the Fund’s average daily net assets for Class A, Class C, Class I, Class R and Class R6, respectively. This agreement may be changed or terminated after February 28, 2022. Pursuant to this agreement, BMR and EVM were allocated $336,879 of the Fund’s operating expenses for the year ended October 31, 2021.
EVM provides sub-transfer agency and related services to the Fund pursuant to a Sub-Transfer Agency Support Services Agreement. For the year ended October 31, 2021, EVM earned $151,958 from the Fund pursuant to such agreement, which is included in transfer and dividend disbursing agent fees on the Statement of Operations. The Fund was informed that Eaton Vance Distributors, Inc. (EVD), an affiliate of EVM and the Fund’s principal underwriter, received $90,547 as its portion of the sales charge on sales of Class A shares for the year ended October 31, 2021. The Fund was informed that Morgan Stanley affiliated broker-dealers, which may be deemed to be affiliates of EVM, BMR and EVD, also received a portion of the sales charge on sales of Class A shares from March 1, 2021 through October 31, 2021 in the amount of $1,870. EVD also received distribution and service fees from Class A, Class C and Class R shares (see Note 4) and contingent deferred sales charges (see Note 5).
Trustees and officers of the Fund who are members of EVM’s or BMR’s organizations receive remuneration for their services to the Fund out of the investment adviser fee. Trustees of the Fund who are not affiliated with the investment adviser may elect to defer receipt of all or a percentage of their annual fees in accordance with the terms of the Trustees Deferred Compensation Plan. For the year ended October 31, 2021, no significant amounts have been deferred. Certain officers and Trustees of the Fund are officers of the above organizations.
4 Distribution Plans
The Fund has in effect a distribution plan for Class A shares (Class A Plan) pursuant to Rule 12b-1 under the 1940 Act. Pursuant to the Class A Plan, the Fund pays EVD a distribution and service fee of 0.25% per annum of its average daily net assets attributable to Class A shares for distribution services and facilities provided to the Fund by EVD, as well as for personal services and/or the maintenance of shareholder accounts. Distribution and service fees paid or accrued to EVD for the year ended October 31, 2021 amounted to $2,261,279 for Class A shares.
The Fund also has in effect distribution plans for Class C shares (Class C Plan) and Class R shares (Class R Plan) pursuant to Rule 12b-1 under the 1940 Act. Pursuant to the Class C Plan, the Fund pays EVD amounts equal to 0.75% per annum of its average daily net assets attributable to Class C shares for providing ongoing distribution services and facilities to the Fund. For the year ended October 31, 2021, the Fund paid or accrued to EVD $522,494 for Class C shares. The Class R Plan requires the Fund to pay EVD an amount up to 0.50% per annum of its average daily net assets attributable to Class R shares for providing ongoing distribution services and facilities to the Fund. The Trustees of the Trust have currently limited Class R distribution payments to 0.25% per annum of the average daily net assets attributable to Class R shares. For the year ended October 31, 2021, the Fund paid or accrued to EVD $65,147 for Class R shares.
Eaton Vance
Income Fund of Boston
October 31, 2021
Notes to Financial Statements — continued
Pursuant to the Class C and Class R Plans, the Fund also makes payments of service fees to EVD, financial intermediaries and other persons in amounts equal to 0.25% per annum of its average daily net assets attributable to that class. Service fees paid or accrued are for personal services and/or the maintenance of shareholder accounts. They are separate and distinct from the sales commissions and distribution fees payable to EVD. Service fees paid or accrued for the year ended October 31, 2021 amounted to $174,165 and $65,147 for Class C and Class R shares, respectively.
Distribution and service fees are subject to the limitations contained in the Financial Industry Regulatory Authority Rule 2341(d).
5 Contingent Deferred Sales Charges
A contingent deferred sales charge (CDSC) of 1% generally is imposed on redemptions of Class C shares made within 12 months of purchase. Class A shares may be subject to a 1% CDSC if redeemed within 18 months of purchase (depending on the circumstances of purchase). Generally, the CDSC is based upon the lower of the net asset value at date of redemption or date of purchase. No charge is levied on shares acquired by reinvestment of dividends or capital gain distributions. For the year ended October 31, 2021, the Fund was informed that EVD received approximately $31,000 and $3,000 of CDSCs paid by Class A and Class C shareholders, respectively.
6 Purchases and Sales of Investments
Purchases and sales of investments, other than short-term obligations and including maturities, paydowns and principal repayments on Senior Loans, aggregated $4,021,280,574 and $4,280,085,218, respectively, for the year ended October 31, 2021.
7 Shares of Beneficial Interest
The Fund’s Declaration of Trust permits the Trustees to issue an unlimited number of full and fractional shares of beneficial interest (without par value). Such shares may be issued in a number of different series (such as the Fund) and classes. Transactions in Fund shares were as follows:
| | | | | | | | |
| | | Year Ended October 31, | |
| Class A | | 2021 | | | 2020 | |
| | |
Sales | | | 37,672,016 | | | | 54,858,036 | |
| | |
Issued to shareholders electing to receive payments of distributions in Fund shares | | | 7,906,372 | | | | 7,637,957 | |
| | |
Redemptions | | | (56,849,721 | ) | | | (44,131,621 | ) |
| | |
Converted from Class C shares | | | 4,053,039 | | | | 1,952,060 | |
| | |
Net increase (decrease) | | | (7,218,294 | ) | | | 20,316,432 | |
| |
| | | Year Ended October 31, | |
| Class C | | 2021 | | | 2020 | |
| | |
Sales | | | 2,194,126 | | | | 2,387,526 | |
| | |
Issued to shareholders electing to receive payments of distributions in Fund shares | | | 539,968 | | | | 878,599 | |
| | |
Redemptions | | | (2,901,061 | ) | | | (5,481,377 | ) |
| | |
Converted to Class A shares | | | (4,044,724 | ) | | | (1,948,250 | ) |
| | |
Net decrease | | | (4,211,691 | ) | | | (4,163,502 | ) |
| |
| | | Year Ended October 31, | |
| Class I | | 2021 | | | 2020 | |
| | |
Sales | | | 280,103,106 | | | | 484,657,259 | |
| | |
Issued to shareholders electing to receive payments of distributions in Fund shares | | | 40,712,273 | | | | 44,972,575 | |
| | |
Redemptions | | | (351,573,741 | ) | | | (394,058,138 | ) |
| | |
Net increase (decrease) | | | (30,758,362 | ) | | | 135,571,696 | |
Eaton Vance
Income Fund of Boston
October 31, 2021
Notes to Financial Statements — continued
| | | | | | | | |
| | | Year Ended October 31, | |
| Class R | | 2021 | | | 2020 | |
| | |
Sales | | | 894,213 | | | | 1,044,009 | |
| | |
Issued to shareholders electing to receive payments of distributions in Fund shares | | | 227,969 | | | | 303,841 | |
| | |
Redemptions | | | (1,720,554 | ) | | | (2,576,243 | ) |
| | |
Net decrease | | | (598,372 | ) | | | (1,228,393 | ) |
| |
| | | Year Ended October 31, | |
| Class R6 | | 2021 | | | 2020 | |
| | |
Sales | | | 60,258,682 | | | | 190,215,833 | |
| | |
Issued to shareholders electing to receive payments of distributions in Fund shares | | | 12,290,761 | | | | 4,079,501 | |
| | |
Redemptions | | | (52,578,588 | ) | | | (23,575,712 | ) |
| | |
Net increase | | | 19,970,855 | | | | 170,719,622 | |
8 Restricted Securities
At October 31, 2021, the Fund owned the following securities (representing 0.6% of net assets) which were restricted as to public resale and not registered under the Securities Act of 1933 (excluding Rule 144A securities). The Fund has various registration rights (exercisable under a variety of circumstances) with respect to these securities. The value of these securities is determined based on valuations provided by brokers when available, or if not available, they are valued at fair value using methods determined in good faith by or at the direction of the Trustees.
| | | | | | | | | | | | | | | | |
| Description | | Date of
Acquisition | | | Shares | | | Cost | | | Value | |
| | | | |
Common Stocks | | | | | | | | | | | | | | | | |
| | | | |
Ascent CNR Corp., Class A | | | 4/25/16, 11/16/16 | | | | 32,029,863 | | | $ | 18,931 | | | $ | 4,163,882 | |
| | | | |
HF Holdings, Inc. | | | 10/27/09 | | | | 3,400 | | | | 182,661 | | | | 1,837,836 | |
| | | | |
New Cotai Participation Corp., Class B | | | 4/12/13 | | | | 36 | | | | 1,111,500 | | | | 0 | |
| | | | |
Nine Point Energy Holdings, Inc. | | | 7/15/14, 10/21/14 | | | | 157,059 | | | | 7,228,624 | | | | 0 | |
| | | | |
Total Common Stocks | | | | | | | | | | $ | 8,541,716 | | | $ | 6,001,718 | |
| | | | |
Convertible Preferred Stocks | | | | | | | | | | | | | | | | |
| | | | |
Nine Point Energy Holdings, Inc., Series A, 12.00% (PIK) | | | 5/26/17 | | | | 2,928 | | | $ | 2,928,000 | | | $ | 0 | |
| | | | |
Total Convertible Preferred Stocks | | | | | | | | | | $ | 2,928,000 | | | $ | 0 | |
| | | | |
Miscellaneous | | | | | | | | | | | | | | | | |
| | | | |
PGP Investors, LLC, Membership Interests | |
| 10/23/12, 2/18/15
4/23/18, 11/30/20 |
| | | 55,373 | | | $ | 6,486,941 | | | $ | 36,326,090 | |
| | | | |
Total Miscellaneous | | | | | | | | | | $ | 6,486,941 | | | $ | 36,326,090 | |
| | | | |
Total Restricted Securities | | | | | | | | | | $ | 17,956,657 | | | $ | 42,327,808 | |
Eaton Vance
Income Fund of Boston
October 31, 2021
Notes to Financial Statements — continued
9 Financial Instruments
The Fund may trade in financial instruments with off-balance sheet risk in the normal course of its investing activities. These financial instruments may include forward foreign currency exchange contracts and may involve, to a varying degree, elements of risk in excess of the amounts recognized for financial statement purposes. The notional or contractual amounts of these instruments represent the investment the Fund has in particular classes of financial instruments and do not necessarily represent the amounts potentially subject to risk. The measurement of the risks associated with these instruments is meaningful only when all related and offsetting transactions are considered. A summary of obligations under these financial instruments at October 31, 2021 is included in the Portfolio of Investments. At October 31, 2021, the Fund had sufficient cash and/or securities to cover commitments under these contracts.
The Fund is subject to foreign exchange risk in the normal course of pursuing its investment objective. Because the Fund holds foreign currency denominated investments, the value of these investments and related receivables and payables may change due to future changes in foreign currency exchange rates. To hedge against this risk, the Fund enters into forward foreign currency exchange contracts.
The Fund enters into forward foreign currency exchange contracts that may contain provisions whereby the counterparty may terminate the contract under certain conditions, including but not limited to a decline in the Fund’s net assets below a certain level over a certain period of time, which would trigger a payment by the Fund for those derivatives in a liability position. At October 31, 2021, the Fund had no open derivatives with credit-related contingent features in a net liability position.
The over-the-counter (OTC) derivatives in which the Fund invests are subject to the risk that the counterparty to the contract fails to perform its obligations under the contract. To mitigate this risk, the Fund has entered into an International Swaps and Derivatives Association, Inc. Master Agreement (“ISDA Master Agreement”) or similar agreement with substantially all its derivative counterparties. An ISDA Master Agreement is a bilateral agreement between the Fund and a counterparty that governs certain OTC derivatives and typically contains, among other things, set-off provisions in the event of a default and/or termination event as defined under the relevant ISDA Master Agreement. Under an ISDA Master Agreement, the Fund may, under certain circumstances, offset with the counterparty certain derivative financial instruments’ payables and/or receivables with collateral held and/or posted and create one single net payment. The provisions of the ISDA Master Agreement typically permit a single net payment in the event of default including the bankruptcy or insolvency of the counterparty. However, bankruptcy or insolvency laws of a particular jurisdiction may impose restrictions on or prohibitions against the right of offset in bankruptcy or insolvency. Certain ISDA Master Agreements allow counterparties to OTC derivatives to terminate derivative contracts prior to maturity in the event the Fund’s net assets decline by a stated percentage or the Fund fails to meet the terms of its ISDA Master Agreements, which would cause the counterparty to accelerate payment by the Fund of any net liability owed to it.
The collateral requirements for derivatives traded under an ISDA Master Agreement are governed by a Credit Support Annex to the ISDA Master Agreement. Collateral requirements are determined at the close of business each day and are typically based on changes in market values for each transaction under an ISDA Master Agreement and netted into one amount for such agreement. Generally, the amount of collateral due from or to a counterparty is subject to a minimum transfer threshold amount before a transfer is required, which may vary by counterparty. Collateral pledged for the benefit of the Fund and/or counterparty is held in segregated accounts by the Fund’s custodian and cannot be sold, re-pledged, assigned or otherwise used while pledged. The portion of such collateral representing cash, if any, is reflected as deposits for derivatives collateral and, in the case of cash pledged by a counterparty for the benefit of the Fund, a corresponding liability on the Statement of Assets and Liabilities. Securities pledged by the Fund as collateral, if any, are identified as such in the Portfolio of Investments.
The fair value of open derivative instruments (not considered to be hedging instruments for accounting disclosure purposes) and whose primary underlying risk exposure is foreign exchange risk at October 31, 2021 was as follows:
| | | | | | | | |
| | | Fair Value | |
| Derivative | | Asset Derivative | | | Liability Derivative | |
| | |
Forward foreign currency exchange contracts | | $ | 293,570 | (1) | | $ | — | |
| | |
Total Derivatives subject to master netting or similar agreements | | $ | 293,570 | | | $ | — | |
| (1) | Statement of Assets and Liabilities location: Receivable for open forward foreign currency exchange contracts. |
Eaton Vance
Income Fund of Boston
October 31, 2021
Notes to Financial Statements — continued
The Fund’s derivative assets at fair value by type, which are reported gross in the Statement of Assets and Liabilities, are presented in the table above. The following table presents the Fund’s derivative assets by counterparty, net of amounts available for offset under a master netting agreement and net of the related collateral received by the Fund for such assets as of October 31, 2021.
| | | | | | | | | | | | | | | | | | | | |
| Counterparty | | Derivative Assets
Subject to
Master Netting
Agreement | | | Derivatives
Available
for Offset | | | Non-cash
Collateral
Received(a) | | | Cash
Collateral Received(a) | | | Net Amount
of Derivative
Assets(b) | |
| | | | | |
State Street Bank and Trust Company | | $ | 293,570 | | | $ | — | | | $ | — | | | $ | — | | | $ | 293,570 | |
| (a) | In some instances, the total collateral received and/or pledged may be more than the amount shown due to overcollateralization. |
| (b) | Net amount represents the net amount due from the counterparty in the event of default. |
The effect of derivative instruments (not considered to be hedging instruments for accounting disclosure purposes) on the Statement of Operations and whose primary underlying risk exposure is foreign exchange risk for the year ended October 31, 2021 was as follows:
| | | | | | | | |
| Derivative | | Realized Gain (Loss)
on Derivatives Recognized
in Income(1) | | | Change in Unrealized
Appreciation (Depreciation) on
Derivatives Recognized in Income(2) | |
| | |
Forward foreign currency exchange contracts | | $ | (1,715,277 | ) | | $ | (1,147,872 | ) |
| (1) | Statement of Operations location: Net realized gain (loss) – Forward foreign currency exchange contracts. |
| (2) | Statement of Operations location: Change in unrealized appreciation (depreciation) – Forward foreign currency exchange contracts. |
The average notional amount of forward foreign currency exchange contracts (based on the absolute value of notional amounts of currency purchased and currency sold) outstanding during the year ended October 31, 2021, which is indicative of the volume of this derivative type, was approximately $135,756,000.
10 Line of Credit
The Fund participates with other portfolios and funds managed by EVM and its affiliates in an $800 million unsecured line of credit agreement with a group of banks, which is in effect through October 25, 2022. Borrowings are made by the Fund solely for temporary purposes related to redemptions and other short-term cash needs. Interest is charged to the Fund based on its borrowings at an amount above either the Secured Overnight Financing Rate (SOFR) or Federal Funds rate. In addition, a fee computed at an annual rate of 0.15% on the daily unused portion of the line of credit is allocated among the participating portfolios and funds at the end of each quarter. In connection with the renewal of the agreement in October 2021, an arrangement fee totaling $150,000 was incurred that was allocated to the participating portfolios and funds. Because the line of credit is not available exclusively to the Fund, it may be unable to borrow some or all of its requested amounts at any particular time. The Fund did not have any significant borrowings or allocated fees during the year ended October 31, 2021.
11 Investments in Affiliated Funds
At October 31, 2021, the value of the Fund’s investment in affiliated funds was $197,587,104, which represents 3.0% of the Fund’s net assets. Transactions in affiliated funds by the Fund for the year ended October 31, 2021 were as follows:
| | | | | | | | | | | | | | | | | | | | | | | | | | | | | | | | |
| Name | | Value,
beginning
of period | | | Purchases | | | Sales
proceeds | | | Net
realized
gain (loss) | | | Change in
unrealized
appreciation
(depreciation) | | | Value, end
of period | | | Dividend
income | | | Units, end
of period | |
|
Short-Term Investments | |
| | | | | | | | |
Eaton Vance Cash Reserves Fund, LLC | | $ | 156,720,062 | | | $ | 2,548,750,938 | | | $ | (2,507,881,481 | ) | | $ | (2,415 | ) | | $ | — | | | $ | 197,587,104 | | | $ | 205,808 | | | | 197,587,104 | |
Eaton Vance
Income Fund of Boston
October 31, 2021
Notes to Financial Statements — continued
12 Fair Value Measurements
Under generally accepted accounting principles for fair value measurements, a three-tier hierarchy to prioritize the assumptions, referred to as inputs, is used in valuation techniques to measure fair value. The three-tier hierarchy of inputs is summarized in the three broad levels listed below.
| • | | Level 1 – quoted prices in active markets for identical investments |
| • | | Level 2 – other significant observable inputs (including quoted prices for similar investments, interest rates, prepayment speeds, credit risk, etc.) |
| • | | Level 3 – significant unobservable inputs (including a fund’s own assumptions in determining the fair value of investments) |
In cases where the inputs used to measure fair value fall in different levels of the fair value hierarchy, the level disclosed is determined based on the lowest level input that is significant to the fair value measurement in its entirety. The inputs or methodology used for valuing securities are not necessarily an indication of the risk associated with investing in those securities.
At October 31, 2021, the hierarchy of inputs used in valuing the Fund’s investments and open derivative instruments, which are carried at value, were as follows:
| | | | | | | | | | | | | | | | |
| Asset Description | | Level 1 | | | Level 2 | | | Level 3* | | | Total | |
| | | | |
Common Stocks | | $ | 47,013,297 | | | $ | 39,489,476 | | | $ | 6,001,718 | | | $ | 92,504,491 | |
| | | | |
Convertible Bonds | | | — | | | | 5,314,980 | | | | — | | | | 5,314,980 | |
| | | | |
Convertible Preferred Stocks | | | 20,456,889 | | | | — | | | | 0 | | | | 20,456,889 | |
| | | | |
Corporate Bonds | | | — | | | | 5,618,296,857 | | | | — | | | | 5,618,296,857 | |
| | | | |
Preferred Stocks | | | 28,215,758 | | | | — | | | | — | | | | 28,215,758 | |
| | | | |
Senior Floating-Rate Loans (Less Unfunded Loan Commitments) | | | — | | | | 469,785,004 | | | | — | | | | 469,785,004 | |
| | | | |
Miscellaneous | | | — | | | | 257,530 | | | | 36,326,090 | | | | 36,583,620 | |
| | | | |
Short-Term Investments | | | — | | | | 197,587,104 | | | | — | | | | 197,587,104 | |
| | | | |
Total Investments | | $ | 95,685,944 | | | $ | 6,330,730,951 | | | $ | 42,327,808 | | | $ | 6,468,744,703 | |
| | | | |
Forward Foreign Currency Exchange Contracts | | $ | — | | | $ | 293,570 | | | $ | — | | | $ | 293,570 | |
| | | | |
Total | | $ | 95,685,944 | | | $ | 6,331,024,521 | | | $ | 42,327,808 | | | $ | 6,469,038,273 | |
| * | None of the unobservable inputs for Level 3 assets, individually or collectively, had a material impact on the Fund. |
Level 3 investments at the beginning and/or end of the period in relation to net assets were not significant and accordingly, a reconciliation of Level 3 assets for the year ended October 31, 2021 is not presented.
13 Risks and Uncertainties
Credit Risk
The Fund primarily invests in lower rated and comparable quality unrated high yield securities. These investments have different risks than investments in debt securities rated investment grade. Risk of loss upon default by the borrower is significantly greater with respect to such debt than with other debt securities because these securities are generally unsecured and are more sensitive to adverse economic conditions, such as recession or increasing interest rates, than are investment grade issuers.
Pandemic Risk
An outbreak of respiratory disease caused by a novel coronavirus was first detected in China in late 2019 and subsequently spread internationally. This coronavirus has resulted in closing borders, enhanced health screenings, changes to healthcare service preparation and delivery, quarantines, cancellations, disruptions to supply chains and customer activity, as well as general concern and uncertainty. Health crises caused by outbreaks, such as the coronavirus outbreak, may exacerbate other pre-existing political, social and economic risks and disrupt normal market conditions and operations. The impact of this outbreak has negatively affected the worldwide economy, the economies of individual countries, individual companies, and the market in general, and may continue to do so in significant and unforeseen ways, as may other epidemics and pandemics that may arise in the future. Any such impact could adversely affect the Fund’s performance, or the performance of the securities in which the Fund invests.
Eaton Vance
Income Fund of Boston
October 31, 2021
Report of Independent Registered Public Accounting Firm
To the Trustees of Eaton Vance Series Trust II and Shareholders of Eaton Vance Income Fund of Boston:
Opinion on the Financial Statements and Financial Highlights
We have audited the accompanying statement of assets and liabilities of Eaton Vance Income Fund of Boston (the “Fund”) (one of the funds constituting Eaton Vance Series Trust II), including the portfolio of investments, as of October 31, 2021, the related statement of operations for the year then ended, the statements of changes in net assets for each of the two years in the period then ended, the financial highlights for each of the five years in the period then ended, and the related notes. In our opinion, the financial statements and financial highlights present fairly, in all material respects, the financial position of the Fund as of October 31, 2021, and the results of its operations for the year then ended, the changes in its net assets for each of the two years in the period then ended, and the financial highlights for each of the five years in the period then ended, in conformity with accounting principles generally accepted in the United States of America.
Basis for Opinion
These financial statements and financial highlights are the responsibility of the Fund’s management. Our responsibility is to express an opinion on the Fund’s financial statements and financial highlights based on our audits. We are a public accounting firm registered with the Public Company Accounting Oversight Board (United States) (PCAOB) and are required to be independent with respect to the Fund in accordance with the U.S. federal securities laws and the applicable rules and regulations of the Securities and Exchange Commission and the PCAOB.
We conducted our audits in accordance with the standards of the PCAOB. Those standards require that we plan and perform the audit to obtain reasonable assurance about whether the financial statements and financial highlights are free of material misstatement, whether due to error or fraud. The Fund is not required to have, nor were we engaged to perform, an audit of its internal control over financial reporting. As part of our audits we are required to obtain an understanding of internal control over financial reporting but not for the purpose of expressing an opinion on the effectiveness of the Fund’s internal control over financial reporting. Accordingly, we express no such opinion.
Our audits included performing procedures to assess the risks of material misstatement of the financial statements and financial highlights, whether due to error or fraud, and performing procedures that respond to those risks. Such procedures included examining, on a test basis, evidence regarding the amounts and disclosures in the financial statements and financial highlights. Our audits also included evaluating the accounting principles used and significant estimates made by management, as well as evaluating the overall presentation of the financial statements and financial highlights. Our procedures included confirmation of securities and senior loans owned as of October 31, 2021, by correspondence with the custodian, brokers and selling or agent banks; when replies were not received from brokers and selling or agent banks, we performed other auditing procedures. We believe that our audits provide a reasonable basis for our opinion.
/s/ Deloitte & Touche LLP
Boston, Massachusetts
December 22, 2021
We have served as the auditor of one or more Eaton Vance investment companies since 1959.
Eaton Vance
Income Fund of Boston
October 31, 2021
Federal Tax Information (Unaudited)
The Form 1099-DIV you receive in February 2022 will show the tax status of all distributions paid to your account in calendar year 2021. Shareholders are advised to consult their own tax adviser with respect to the tax consequences of their investment in the Fund. As required by the Internal Revenue Code and/or regulations, shareholders must be notified regarding the status of qualified dividend income for individuals and 163(j) interest dividends.
Qualified Dividend Income. For the fiscal year ended October 31, 2021, the Fund designates approximately $3,575,438, or up to the maximum amount of such dividends allowable pursuant to the Internal Revenue Code, as qualified dividend income eligible for the reduced tax rate of 15%.
163(j) Interest Dividends. For the fiscal year ended October 31, 2021, the Fund designates 99.98% of distributions from net investment income as a 163(j) interest dividend.
Eaton Vance
Income Fund of Boston
October 31, 2021
Liquidity Risk Management Program
The Fund has implemented a written liquidity risk management program (Program) and related procedures to manage its liquidity in accordance with Rule 22e-4 under the Investment Company Act of 1940, as amended (Liquidity Rule). The Liquidity Rule defines “liquidity risk” as the risk that a fund could not meet requests to redeem shares issued by the fund without significant dilution of the remaining investors’ interests in the fund. The Fund’s Board of Trustees/Directors has designated the investment adviser to serve as the administrator of the Program and the related procedures. The administrator has established a Liquidity Risk Management Oversight Committee (Committee) to perform the functions necessary to administer the Program. As part of the Program, the administrator is responsible for identifying illiquid investments and categorizing the relative liquidity of the Fund’s investments in accordance with the Liquidity Rule. Under the Program, the administrator assesses, manages, and periodically reviews the Fund’s liquidity risk, and is responsible for making certain reports to the Fund’s Board of Trustees/Directors and the Securities and Exchange Commission (SEC) regarding the liquidity of the Fund’s investments, and to notify the Board of Trustees/Directors and the SEC of certain liquidity events specified in the Liquidity Rule. The liquidity of the Fund’s portfolio investments is determined based on a number of factors including, but not limited to, relevant market, trading and investment-specific considerations under the Program.
At a meeting of the Fund’s Board of Trustees/Directors on June 8, 2021, the Committee provided a written report to the Fund’s Board of Trustees/Directors pertaining to the operation, adequacy, and effectiveness of implementation of the Program, as well as the operation of the highly liquid investment minimum (if applicable) for the period January 1, 2020 through December 31, 2020 (Review Period). The Program operated effectively during the Review Period, supporting the administrator’s ability to assess, manage and monitor Fund liquidity risk, including during periods of market volatility and net redemptions. During the Review Period, the Fund met redemption requests on a timely basis.
There can be no assurance that the Program will achieve its objectives in the future. Please refer to the Fund’s prospectus for more information regarding the Fund’s exposure to liquidity risk and other principal risks to which an investment in the Fund may be subject.
Eaton Vance
Income Fund of Boston
October 31, 2021
Management and Organization
Fund Management. The Trustees of Eaton Vance Series Trust II (the Trust) are responsible for the overall management and supervision of the Trust’s affairs. The Trustees and officers of the Trust are listed below. Except as indicated, each individual has held the office shown or other offices in the same company for the last five years. Trustees and officers of the Trust hold indefinite terms of office. The “Noninterested Trustees” consist of those Trustees who are not “interested persons” of the Trust, as that term is defined under the 1940 Act. The business address of each Trustee and officer is Two International Place, Boston, Massachusetts 02110. As used below, “EVC” refers to Eaton Vance Corp., “EV” refers to EV LLC, “EVM” refers to Eaton Vance Management, “BMR” refers to Boston Management and Research and “EVD” refers to Eaton Vance Distributors, Inc. EV is the trustee of each of EVM and BMR. Effective March 1, 2021, each of EVM, BMR, EVD and EV are indirect, wholly owned subsidiaries of Morgan Stanley. Each officer affiliated with EVM may hold a position with other EVM affiliates that is comparable to his or her position with EVM listed below. Each Trustee oversees 138 portfolios (with the exception of Messrs. Faust and Wennerholm and Ms. Frost who oversee 137 portfolios) in the Eaton Vance Complex (including all master and feeder funds in a master feeder structure). Each officer serves as an officer of certain other Eaton Vance funds. Each Trustee and officer serves until his or her successor is elected.
| | | | | | |
| Name and Year of Birth | | Trust Position(s) | | Trustee Since(1) | | Principal Occupation(s) and Other Directorships During Past Five Years and Other Relevant Experience |
|
| Interested Trustee |
| | | |
Thomas E. Faust Jr. 1958 | | Trustee | | 2007 | | Chairman of Morgan Stanley Investment Management, Inc. (MSIM), member of the Board of Managers and President of EV, Chief Executive Officer of EVM and BMR, and Director of EVD. Formerly, Chairman, Chief Executive Officer and President of EVC. Trustee and/or officer of 137 registered investment companies. Mr. Faust is an interested person because of his positions with MSIM, BMR, EVM, EVD, and EV, which are affiliates of the Trust, and his former position with EVC, which was an affiliate of the Trust prior to March 1, 2021. Other Directorships in the Last Five Years. Formerly, Director of EVC (2007-2021) and Hexavest Inc. (investment management firm) (2012-2021). |
|
| Noninterested Trustees |
| | | |
Mark R. Fetting 1954 | | Trustee | | 2016 | | Private investor. Formerly held various positions at Legg Mason, Inc. (investment management firm) (2000-2012), including President, Chief Executive Officer, Director and Chairman (2008-2012), Senior Executive Vice President (2004-2008) and Executive Vice President (2001-2004). Formerly, President of Legg Mason family of funds (2001-2008). Formerly, Division President and Senior Officer of Prudential Financial Group, Inc. and related companies (investment management firm) (1991-2000). Other Directorships in the Last Five Years. None. |
| | | |
Cynthia E. Frost 1961 | | Trustee | | 2014 | | Private investor. Formerly, Chief Investment Officer of Brown University (university endowment) (2000-2012). Formerly, Portfolio Strategist for Duke Management Company (university endowment manager) (1995-2000). Formerly, Managing Director, Cambridge Associates (investment consulting company) (1989-1995). Formerly, Consultant, Bain and Company (management consulting firm) (1987-1989). Formerly, Senior Equity Analyst, BA Investment Management Company (1983-1985). Other Directorships in the Last Five Years. None. |
| | | |
George J. Gorman 1952 | | Chairperson of the Board and Trustee | | 2021 (Chairperson) and 2014 (Trustee) | | Principal at George J. Gorman LLC (consulting firm). Formerly, Senior Partner at Ernst & Young LLP (a registered public accounting firm) (1974-2009). Other Directorships in the Last Five Years. None. |
| | | |
Valerie A. Mosley 1960 | | Trustee | | 2014 | | Chairwoman and Chief Executive Officer of Valmo Ventures (a consulting and investment firm). Founder of Upward Wealth, Inc., dba BrightUP, a fintech platform. Formerly, Partner and Senior Vice President, Portfolio Manager and Investment Strategist at Wellington Management Company, LLP (investment management firm) (1992-2012). Formerly, Chief Investment Officer, PG Corbin Asset Management (1990-1992). Formerly worked in institutional corporate bond sales at Kidder Peabody (1986-1990). Other Directorships in the Last Five Years. Director of DraftKings, Inc. (digital sports entertainment and gaming company) (since September 2020). Director of Groupon, Inc. (e-commerce provider) (since April 2020). Director of Envestnet, Inc. (provider of intelligent systems for wealth management and financial wellness) (since 2018). Formerly, Director of Dynex Capital, Inc. (mortgage REIT) (2013-2020). |
Eaton Vance
Income Fund of Boston
October 31, 2021
Management and Organization — continued
| | | | | | |
| Name and Year of Birth | | Trust Position(s) | | Trustee Since(1) | | Principal Occupation(s) and Other Directorships During Past Five Years and Other Relevant Experience |
|
| Noninterested Trustees (continued) |
| | | |
William H. Park 1947 | | Trustee | | 2003 | | Private investor. Formerly, Consultant (management and transactional) (2012-2014). Formerly, Chief Financial Officer, Aveon Group L.P. (investment management firm) (2010-2011). Formerly, Vice Chairman, Commercial Industrial Finance Corp. (specialty finance company) (2006-2010). Formerly, President and Chief Executive Officer, Prizm Capital Management, LLC (investment management firm) (2002-2005). Formerly, Executive Vice President and Chief Financial Officer, United Asset Management Corporation (investment management firm) (1982-2001). Formerly, Senior Manager, Price Waterhouse (now PricewaterhouseCoopers) (a registered public accounting firm) (1972-1981). Other Directorships in the Last Five Years. None. |
| | | |
Helen Frame Peters 1948 | | Trustee | | 2008 | | Professor of Finance, Carroll School of Management, Boston College. Formerly, Dean, Carroll School of Management, Boston College (2000-2002). Formerly, Chief Investment Officer, Fixed Income, Scudder Kemper Investments (investment management firm) (1998-1999). Formerly, Chief Investment Officer, Equity and Fixed Income, Colonial Management Associates (investment management firm) (1991-1998). Other Directorships in the Last Five Years. None. |
| | | |
Keith Quinton 1958 | | Trustee | | 2018 | | Private investor, researcher and lecturer. Formerly, Independent Investment Committee Member at New Hampshire Retirement System (2017-2021). Formerly, Portfolio Manager and Senior Quantitative Analyst at Fidelity Investments (investment management firm) (2001-2014). Other Directorships in the Last Five Years. Formerly, Director (2016-2021) and Chairman (2019-2021) of New Hampshire Municipal Bond Bank. |
| | | |
Marcus L. Smith 1966 | | Trustee | | 2018 | | Private investor. Formerly, Portfolio Manager at MFS Investment Management (investment management firm) (1994-2017). Other Directorships in the Last Five Years. Director of First Industrial Realty Trust, Inc. (an industrial REIT) (since 2021). Director of MSCI Inc. (global provider of investment decision support tools) (since 2017). Formerly, Director of DCT Industrial Trust Inc. (logistics real estate company) (2017-2018). |
| | | |
Susan J. Sutherland 1957 | | Trustee | | 2015 | | Private investor. Director of Ascot Group Limited and certain of its subsidiaries (insurance and reinsurance) (since 2017). Formerly, Director of Hagerty Holding Corp. (insurance) (2015-2018) and Montpelier Re Holdings Ltd. (insurance and reinsurance) (2013-2015). Formerly, Associate, Counsel and Partner at Skadden, Arps, Slate, Meagher & Flom LLP (law firm) (1982-2013). Other Directorships in the Last Five Years. Director of Kairos Acquisition Corp. (insurance/InsurTech acquisition company) (since 2021). |
| | | |
Scott E. Wennerholm 1959 | | Trustee | | 2016 | | Private investor. Formerly, Trustee at Wheelock College (postsecondary institution) (2012-2018). Formerly, Consultant at GF Parish Group (executive recruiting firm) (2016-2017). Formerly, Chief Operating Officer and Executive Vice President at BNY Mellon Asset Management (investment management firm) (2005-2011). Formerly, Chief Operating Officer and Chief Financial Officer at Natixis Global Asset Management (investment management firm) (1997-2004). Formerly, Vice President at Fidelity Investments Institutional Services (investment management firm) (1994-1997). Other Directorships in the Last Five Years. None. |
| | | | | | |
| Name and Year of Birth | | Trust
Position(s) | | Officer
Since(2) | | Principal Occupation(s) During Past Five Years |
|
| Principal Officers who are not Trustees |
| | | |
Eric A. Stein 1980 | | President | | 2020 | | Vice President and Chief Investment Officer, Fixed Income of EVM and BMR. Prior to November 1, 2020, Mr. Stein was a co-Director of Eaton Vance’s Global Income Investments. Also Vice President of Calvert Research and Management (“CRM”). |
| | | |
Deidre E. Walsh 1971 | | Vice President and Chief Legal Officer | | 2009 | | Vice President of EVM and BMR. Also Vice President of CRM. |
| | | |
James F. Kirchner 1967 | | Treasurer | | 2007 | | Vice President of EVM and BMR. Also Vice President of CRM. |
Eaton Vance
Income Fund of Boston
October 31, 2021
Management and Organization — continued
| | | | | | |
| Name and Year of Birth | | Trust
Position(s) | | Officer
Since(2) | | Principal Occupation(s) During Past Five Years |
|
| Principal Officers who are not Trustees (continued) |
| | | |
Kimberly M. Roessiger 1985 | | Secretary | | 2021 | | Vice President of EVM and BMR. |
| | | |
Richard F. Froio 1968 | | Chief Compliance Officer | | 2017 | | Vice President of EVM and BMR since 2017. Formerly Deputy Chief Compliance Officer (Adviser/Funds) and Chief Compliance Officer (Distribution) at PIMCO (2012-2017) and Managing Director at BlackRock/Barclays Global Investors (2009-2012). |
| (1) | Year first appointed to serve as Trustee for a fund in the Eaton Vance family of funds. Each Trustee has served continuously since appointment unless indicated otherwise. |
| (2) | Year first elected to serve as officer of a fund in the Eaton Vance family of funds when the officer has served continuously. Otherwise, year of most recent election as an officer of a fund in the Eaton Vance family of funds. Titles may have changed since initial election. |
The SAI for the Fund includes additional information about the Trustees and officers of the Fund and can be obtained without charge on Eaton Vance’s website at www.eatonvance.com or by calling 1-800-262-1122.
Eaton Vance Funds
| | |
| Privacy Notice | | April 2021 |
| | |
| |
| FACTS | | WHAT DOES EATON VANCE DO WITH YOUR
PERSONAL INFORMATION? |
| | | |
| |
| | |
| Why? | | Financial companies choose how they share your personal information. Federal law gives consumers the right to limit some but not all sharing. Federal law also requires us to tell you how we collect, share, and protect your personal information. Please read this notice carefully to understand what we do. |
| | |
| | | |
| What? | | The types of personal information we collect and share depend on the product or service you have with us. This information can include: ∎ Social Security number and income ∎ investment experience and risk tolerance ∎ checking account number and wire transfer instructions |
| | |
| | | |
| How? | | All financial companies need to share customers’ personal information to run their everyday business. In the section below, we list the reasons financial companies can share their customers’ personal information; the reasons Eaton Vance chooses to share; and whether you can limit this sharing. |
| | |
| | | |
| | | | |
Reasons we can share your
personal information | | Does Eaton Vance share? | | Can you limit this sharing? |
| For our everyday business purposes — such as to process your transactions, maintain your account(s), respond to court orders and legal investigations, or report to credit bureaus | | Yes | | No |
| For our marketing purposes — to offer our products and services to you | | Yes | | No |
| For joint marketing with other financial companies | | No | | We don’t share |
| For our investment management affiliates’ everyday business purposes — information about your transactions, experiences, and creditworthiness | | Yes | | Yes |
| For our affiliates’ everyday business purposes — information about your transactions and experiences | | Yes | | No |
| For our affiliates’ everyday business purposes — information about your creditworthiness | | No | | We don’t share |
| For our investment management affiliates to market to you | | Yes | | Yes |
| For our affiliates to market to you | | No | | We don’t share |
| For nonaffiliates to market to you | | No | | We don’t share |
| | |
| To limit our sharing | | Call toll-free 1-800-262-1122 or email: EVPrivacy@eatonvance.com Please note: If you are a new customer, we can begin sharing your information 30 days from the date we sent this notice. When you are no longer our customer, we continue to share your information as described in this notice. However, you can contact us at any time to limit our sharing. |
| | |
| | | |
| | |
| Questions? | | Call toll-free 1-800-262-1122 or email: EVPrivacy@eatonvance.com |
| | |
| | | |
Eaton Vance Funds
| | |
| Privacy Notice — continued | | April 2021 |
| | |
| Who we are |
| Who is providing this notice? | | Eaton Vance Management, Eaton Vance Distributors, Inc., Eaton Vance Trust Company, Eaton Vance Management (International) Limited, Eaton Vance Advisers International Ltd., Eaton Vance Global Advisors Limited, Eaton Vance Management’s Real Estate Investment Group, Boston Management and Research, Calvert Research and Management, Eaton Vance and Calvert Fund Families and our investment advisory affiliates (“Eaton Vance”) (see Investment Management Affiliates definition below) |
| What we do |
| How does Eaton Vance protect my personal information? | | To protect your personal information from unauthorized access and use, we use security measures that comply with federal law. These measures include computer safeguards and secured files and buildings. We have policies governing the proper handling of customer information by personnel and requiring third parties that provide support to adhere to appropriate security standards with respect to such information. |
| How does Eaton Vance collect my personal information? | | We collect your personal information, for example, when you ∎ open an account or make deposits or withdrawals from your account ∎ buy securities from us or make a wire transfer ∎ give us your contact information We also collect your personal information from others, such as credit bureaus, affiliates, or other companies. |
| Why can’t I limit all sharing? | | Federal law gives you the right to limit only ∎ sharing for affiliates’ everyday business purposes — information about your creditworthiness ∎ affiliates from using your information to market to you ∎ sharing for nonaffiliates to market to you State laws and individual companies may give you additional rights to limit sharing. See below for more on your rights under state law. |
| Definitions |
| Investment Management Affiliates | | Eaton Vance Investment Management Affiliates include registered investment advisers, registered broker-dealers, and registered and unregistered funds. Investment Management Affiliates does not include entities associated with Morgan Stanley Wealth Management, such as Morgan Stanley Smith Barney LLC and Morgan Stanley & Co. |
| Affiliates | | Companies related by common ownership or control. They can be financial and nonfinancial companies. ∎ Our affiliates include companies with a Morgan Stanley name and financial companies such as Morgan Stanley Smith Barney LLC and Morgan Stanley & Co. |
| Nonaffiliates | | Companies not related by common ownership or control. They can be financial and nonfinancial companies. ∎ Eaton Vance does not share with nonaffiliates so they can market to you. |
| Joint marketing | | A formal agreement between nonaffiliated financial companies that together market financial products or services to you. ∎ Eaton Vance doesn’t jointly market. |
| Other important information |
Vermont: Except as permitted by law, we will not share personal information we collect about Vermont residents with Nonaffiliates unless you provide us with your written consent to share such information. California: Except as permitted by law, we will not share personal information we collect about California residents with Nonaffiliates and we will limit sharing such personal information with our Affiliates to comply with California privacy laws that apply to us. |
Eaton Vance Funds
IMPORTANT NOTICES
Delivery of Shareholder Documents. The Securities and Exchange Commission (SEC) permits funds to deliver only one copy of shareholder documents, including prospectuses, proxy statements and shareholder reports, to fund investors with multiple accounts at the same residential or post office box address. This practice is often called “householding” and it helps eliminate duplicate mailings to shareholders. Eaton Vance, or your financial intermediary, may household the mailing of your documents indefinitely unless you instruct Eaton Vance, or your financial intermediary, otherwise. If you would prefer that your Eaton Vance documents not be householded, please contact Eaton Vance at 1-800-262-1122, or contact your financial intermediary. Your instructions that householding not apply to delivery of your Eaton Vance documents will typically be effective within 30 days of receipt by Eaton Vance or your financial intermediary.
Portfolio Holdings. Each Eaton Vance Fund and its underlying Portfolio(s) (if applicable) files a schedule of portfolio holdings on Part F to Form N-PORT with the SEC. Certain information filed on Form N-PORT may be viewed on the Eaton Vance website at www.eatonvance.com, by calling Eaton Vance at 1-800-262-1122 or in the EDGAR database on the SEC’s website at www.sec.gov.
Proxy Voting. From time to time, funds are required to vote proxies related to the securities held by the funds. The Eaton Vance Funds or their underlying Portfolios (if applicable) vote proxies according to a set of policies and procedures approved by the Funds’ and Portfolios’ Boards. You may obtain a description of these policies and procedures and information on how the Funds or Portfolios voted proxies relating to portfolio securities during the most recent 12-month period ended June 30, without charge, upon request, by calling 1-800-262-1122 and by accessing the SEC’s website at www.sec.gov.
This Page Intentionally Left Blank
This Page Intentionally Left Blank
This Page Intentionally Left Blank
Investment Adviser
Boston Management and Research
Two International Place
Boston, MA 02110
Investment Sub-Adviser
Eaton Vance Advisers International Ltd.
125 Old Broad Street
London, EC2N 1AR
United Kingdom
Administrator
Eaton Vance Management
Two International Place
Boston, MA 02110
Principal Underwriter*
Eaton Vance Distributors, Inc.
Two International Place
Boston, MA 02110
(617) 482-8260
Custodian
State Street Bank and Trust Company
State Street Financial Center, One Lincoln Street
Boston, MA 02111
Transfer Agent
BNY Mellon Investment Servicing (US) Inc.
Attn: Eaton Vance Funds
P.O. Box 9653
Providence, RI 02940-9653
(800) 262-1122
Independent Registered Public Accounting Firm
Deloitte & Touche LLP
200 Berkeley Street
Boston, MA 02116-5022
Fund Offices
Two International Place
Boston, MA 02110
| * | FINRA BrokerCheck. Investors may check the background of their Investment Professional by contacting the Financial Industry Regulatory Authority (FINRA). FINRA BrokerCheck is a free tool to help investors check the professional background of current and former FINRA-registered securities firms and brokers. FINRA BrokerCheck is available by calling 1-800-289-9999 and at www.FINRA.org. The FINRA BrokerCheck brochure describing this program is available to investors at www.FINRA.org. |

443 10.31.21
Item 2. Code of Ethics
The registrant (sometimes referred to as the “Fund”) has adopted a code of ethics applicable to its Principal Executive Officer, Principal Financial Officer and Principal Accounting Officer. The registrant undertakes to provide a copy of such code of ethics to any person upon request, without charge, by calling 1-800-262-1122. The registrant has not amended the code of ethics as described in Form N-CSR during the period covered by this report. The registrant has not granted any waiver, including an implicit waiver, from a provision of the code of ethics as described in Form N-CSR during the period covered by this report.
Item 3. Audit Committee Financial Expert
The registrant’s Board of Trustees (the “Board”) has designated George J. Gorman, William H. Park and Scott E. Wennerholm, each an independent trustee, as audit committee financial experts. Mr. Gorman is a certified public accountant who is the Principal at George J. Gorman LLC (a consulting firm). Previously, Mr. Gorman served in various capacities at Ernst & Young LLP (a registered public accounting firm), including as Senior Partner. Mr. Gorman also has experience serving as an independent trustee and audit committee financial expert of other mutual fund complexes. Mr. Park is a certified public accountant who is a private investor. Previously, he served as a consultant, as the Chief Financial Officer of Aveon Group, L.P. (an investment management firm), as the Vice Chairman of Commercial Industrial Finance Corp. (specialty finance company), as President and Chief Executive Officer of Prizm Capital Management, LLC (investment management firm), as Executive Vice President and Chief Financial Officer of United Asset Management Corporation (an institutional investment management firm) and as a Senior Manager at Price Waterhouse (now PricewaterhouseCoopers) (a registered public accounting firm). Mr. Wennerholm is a private investor. Previously, Mr. Wennerholm served as a Trustee at Wheelock College (postsecondary institution), as a Consultant at GF Parish Group (executive recruiting firm), Chief Operating Officer and Executive Vice President at BNY Mellon Asset Management (investment management firm), Chief Operating Officer and Chief Financial Officer at Natixis Global Asset Management (investment management firm), and Vice President at Fidelity Investments Institutional Services (investment management firm).
Item 4. Principal Accountant Fees and Services
Eaton Vance Income Fund of Boston (the “Fund”) is a series of Eaton Vance Series Trust II (the “Trust”), a Massachusetts business trust, which, including the Fund, contains a total of 2 series (the “Series”). The Trust is registered under the Investment Company Act of 1940 as an open-end management investment company. This Form N-CSR relates to the Fund’s annual report.
(a)-(d)
The following table presents the aggregate fees billed to the fund for the fund’s fiscal years ended October 31, 2020 and October 31, 2021 by the registrant’s principal accountant, Deloitte & Touche LLP (“D&T”), for professional services rendered for the audit of the fund’s annual financial statements and fees billed for other services rendered by D&T during such periods.
Eaton Vance Income Fund of Boston
| | | | | | | | |
Fiscal Years Ended | | 10/31/20 | | | 10/31/21 | |
Audit Fees | | $ | 90,350 | | | $ | 90,461 | |
Audit-Related Fees(1) | | $ | 0 | | | $ | 0 | |
Tax Fees(2) | | $ | 14,791 | | | $ | 21,941 | |
All Other Fees(3) | | $ | 0 | | | $ | 0 | |
| | | | | | | | |
Total | | $ | 105,141 | | | $ | 112,402 | |
| | | | | | | | |
| (1) | Audit-related fees consist of the aggregate fees billed for assurance and related services that are reasonably related to the performance of the audit of financial statements and are not reported under the category of audit fees. |
| (2) | Tax fees consist of the aggregate fees billed for professional services rendered by the principal accountant relating to tax compliance, tax advice, and tax planning and specifically include fees for tax return preparation and other tax related compliance/planning matters. |
| (3) | All other fees consist of the aggregate fees billed for products and services provided by the principal accountant other than audit, audit-related, and tax services. |
The various Series comprising the Trust have differing fiscal year ends (October 31 or June 30). The following table presents the aggregate audit, audit-related, tax, and other fees billed to all of the Series in the Trust by D&T for the last two fiscal years of each Series.
| | | | | | | | | | | | | | | | |
Fiscal Years Ended | | 6/30/20 | | | 10/31/20 | | | 6/30/21 | | | 10/31/21 | |
Audit Fees | | $ | 79,250 | | | $ | 90,350 | | | $ | 79,250 | | | $ | 90,461 | |
Audit-Related Fees(1) | | $ | 0 | | | $ | 0 | | | $ | 0 | | | $ | 0 | |
Tax Fees(2) | | $ | 13,667 | | | $ | 14,791 | | | $ | 13,667 | | | $ | 21,941 | |
All Other Fees(3) | | $ | 0 | | | $ | 0 | | | $ | 0 | | | $ | 0 | |
| | | | | | | | | | | | | | | | |
Total | | $ | 92,917 | | | $ | 105,141 | | | $ | 92,917 | | | $ | 112,402 | |
| | | | | | | | | | | | | | | | |
| (1) | Audit-related fees consist of the aggregate fees billed for assurance and related services that are reasonably related to the performance of the audit of financial statements and are not reported under the category of audit fees. |
| (2) | Tax fees consist of the aggregate fees billed for professional services rendered by the principal accountant relating to tax compliance, tax advice, and tax planning and specifically include fees for tax return preparation and other tax related compliance/planning matters. |
| (3) | All other fees consist of the aggregate fees billed for products and services provided by the principal accountant other than audit, audit-related, and tax services. |
| (4) | Fees are paid by the Fund’s administrator pursuant to the terms of its administrative services agreement. |
(e)(1) The registrant’s audit committee has adopted policies and procedures relating to the pre-approval of services provided by the registrant’s principal accountant (the “Pre-Approval Policies”). The Pre-Approval Policies establish a framework intended to assist the audit committee in the proper discharge of its pre-approval responsibilities. As a general matter, the Pre-Approval Policies (i) specify certain types of audit, audit-related, tax, and other services determined to be pre-approved by the audit committee; and (ii) delineate specific procedures governing the mechanics of the pre-approval process, including the approval and monitoring of audit and non-audit service fees. Unless a service is specifically pre-approved under the Pre-Approval Policies, it must be separately pre-approved by the audit committee.
The Pre-Approval Policies and the types of audit and non-audit services pre-approved therein must be reviewed and ratified by the registrant’s audit committee at least annually. The registrant’s audit committee maintains full responsibility for the appointment, compensation, and oversight of the work of the registrant’s principal accountant.
(e)(2) No services described in paragraphs (b)-(d) above were approved by the registrant’s audit committee pursuant to the “de minimis exception” set forth in Rule 2-01(c)(7)(i)(C) of Regulation S-X.
(f) Not applicable.
(g) The following table presents (i) the aggregate non-audit fees (i.e., fees for audit-related, tax, and other services) billed for services rendered to all of the Series in the Trust by D&T for the last two fiscal years of each series; and (ii) the aggregate non-audit fees (i.e., fees for audit-related, tax, and other services) billed to the Eaton Vance organization by D&T for the last two fiscal years of each Series.
| | | | | | | | | | | | | | | | |
Fiscal Years Ended | | 6/30/20 | | | 10/31/20 | | | 6/30/21 | | | 10/31/21 | |
Registrant(1) | | $ | 13,667 | | | $ | 14,791 | | | $ | 13,667 | | | $ | 21,941 | |
Eaton Vance(2) | | $ | 103,703 | | | $ | 51,800 | | | $ | 98,500 | | | $ | 51,800 | |
| (1) | Includes all of the Series of the Trust. During the fiscal years reported above, certain of the Funds were “feeder” funds in a “master-feeder” fund structure or funds of funds. |
| (2) | Various subsidiaries of Morgan Stanley act in either an investment advisory and/or service provider capacity with respect to the Series and/or their respective “master” funds (if applicable). |
(h) The registrant’s audit committee has considered whether the provision by the registrant’s principal accountant of non-audit services to the registrant’s investment adviser and any entity controlling, controlled by, or under common control with the adviser that provides ongoing services to the registrant that were not pre-approved pursuant to Rule 2-01(c)(7)(ii) of Regulation S-X is compatible with maintaining the principal accountant’s independence.
Item 5. Audit Committee of Listed Registrants
Not applicable.
Item 6. Schedule of Investments
Please see schedule of investments contained in the Report to Stockholders included under Item 1 of this Form N-CSR.
Item 7. Disclosure of Proxy Voting Policies and Procedures for Closed-End Management Investment Companies
Not applicable.
Item 8. Portfolio Managers of Closed-End Management Investment Companies
Not applicable.
Item 9. Purchases of Equity Securities by Closed-End Management Investment Company and Affiliated Purchasers
Not applicable.
Item 10. Submission of Matters to a Vote of Security Holders
No material changes.
Item 11. Controls and Procedures
(a) It is the conclusion of the registrant’s principal executive officer and principal financial officer that the effectiveness of the registrant’s current disclosure controls and procedures (such disclosure controls and procedures having been evaluated within 90 days of the date of this filing) provide reasonable assurance that the information required to be disclosed by the registrant has been recorded, processed, summarized and reported within the time period specified in the Commission’s rules and forms and that the information required to be disclosed by the registrant has been accumulated and communicated to the registrant’s principal executive officer and principal financial officer in order to allow timely decisions regarding required disclosure.
(b) There have been no changes in the registrant’s internal controls over financial reporting during the period covered by this report that has materially affected, or is reasonably likely to materially affect, the registrant’s internal control over financial reporting.
Item 12. Disclosure of Securities Lending Activities for Closed-End Management Investment Companies
Not applicable.
Item 13. Exhibits
Signatures
Pursuant to the requirements of the Securities Exchange Act of 1934 and the Investment Company Act of 1940, the registrant has duly caused this report to be signed on its behalf by the undersigned, thereunto duly authorized.
| | |
| Eaton Vance Series Trust II |
| |
| By: | | /s/ Eric A. Stein |
| | Eric A. Stein |
| | President |
| |
| Date: | | December 23, 2021 |
Pursuant to the requirements of the Securities Exchange Act of 1934 and the Investment Company Act of 1940, this report has been signed below by the following persons on behalf of the registrant and in the capacities and on the dates indicated.
| | |
| By: | | /s/ James F. Kirchner |
| | James F. Kirchner |
| | Treasurer |
| |
| Date: | | December 23, 2021 |
| |
| By: | | /s/ Eric A. Stein |
| | Eric A. Stein |
| | President |
| |
| Date: | | December 23, 2021 |