0000074663eatonvance:EATONVANCEIndexICEBofAUSHighYieldConstrainedIndex19292AdditionalIndexMember2016-10-31
UNITED STATES
SECURITIES AND EXCHANGE COMMISSION
Washington, D.C. 20549
Form N-CSR
CERTIFIED SHAREHOLDER REPORT OF REGISTERED
MANAGEMENT INVESTMENT COMPANIES
Investment Company Act File Number: 811-02258
Eaton Vance Series Trust II
(Exact Name of Registrant as Specified in Charter)
One Post Office Square, Boston, Massachusetts 02109
(Address of Principal Executive Offices)
Deidre E. Walsh
One Post Office Square, Boston, Massachusetts 02109
(Name and Address of Agent for Services)
(617) 482-8260
(Registrant’s Telephone Number)
October 31
Date of Fiscal Year End
October 31, 2024
Date of Reporting Period
Item 1. Reports to Stockholders
Eaton Vance Income Fund of Boston
Annual Shareholder Report October 31, 2024
This annual shareholder report contains important information about the Eaton Vance Income Fund of Boston for the period of November 1, 2023 to October 31, 2024. You can find additional information about the Fund at www.eatonvance.com/open-end-mutual-fund-documents.php. You can also request this information by contacting us at 1-800-262-1122.
What were the Fund costs for the last year?
(based on a hypothetical $10,000 investment)
| Class Name | Costs of a $10,000 investment | Costs paid as a percentage of a $10,000 investment |
|---|
| Class A | $105 | 0.98% |
How did the Fund perform last year and what affected its performance?
Key contributors to (↑) and detractors from (↓) performance, relative to the ICE BofA U.S. High Yield Index (the Index):
↓ The Fund’s security selections by sector ― especially in the health care, gaming, and retail sectors ― detracted from Index-relative returns during the period
↓ Fund allocations by credit quality ― particularly a broad underweight exposure to distressed CCC-rated and lower-rated securities ― detracted from returns
↓ Security selections by credit quality ― especially selections in B-rated and CCC-rated securities ― detracted from Index-relative returns during the period
↓ Security selections by duration segment ― particularly selections in securities with durations of less than 5 years ― hampered returns relative to the Index
↑ An overweight exposure to the health care sector and an underweight allocation to the energy sector contributed to Index-relative returns during the period
↑ The Fund’s selections in lower-rated fixed-income investments contributed to performance relative to the Index during the period
↑ The Fund’s underweight exposure to BB-rated securities contributed to performance relative to the Index during the period
↑ The Fund’s overweight exposure to securities with durations between 5-10 years contributed to performance relative to the Index during the period
Comparison of the change in value of a $10,000 investment for the period indicated.
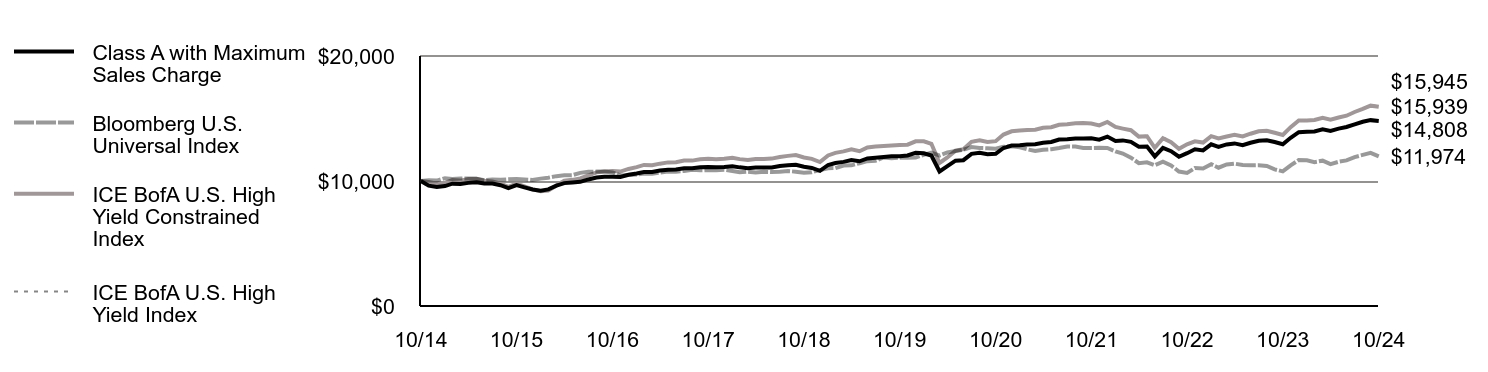
| Class A with Maximum Sales Charge | Bloomberg U.S. Universal Index | ICE BofA U.S. High Yield Constrained Index | ICE BofA U.S. High Yield Index |
|---|
| 10/14 | $10,000 | $10,000 | $10,000 | $10,000 |
| 11/14 | $9,625 | $10,054 | $9,929 | $9,929 |
| 12/14 | $9,513 | $10,036 | $9,783 | $9,782 |
| 1/15 | $9,594 | $10,227 | $9,850 | $9,850 |
| 2/15 | $9,785 | $10,167 | $10,085 | $10,085 |
| 3/15 | $9,753 | $10,209 | $10,032 | $10,031 |
| 4/15 | $9,850 | $10,197 | $10,152 | $10,151 |
| 5/15 | $9,900 | $10,180 | $10,182 | $10,181 |
| 6/15 | $9,799 | $10,066 | $10,027 | $10,026 |
| 7/15 | $9,799 | $10,125 | $9,966 | $9,964 |
| 8/15 | $9,665 | $10,095 | $9,789 | $9,789 |
| 9/15 | $9,427 | $10,134 | $9,538 | $9,535 |
| 10/15 | $9,665 | $10,167 | $9,797 | $9,795 |
| 11/15 | $9,491 | $10,130 | $9,579 | $9,575 |
| 12/15 | $9,318 | $10,079 | $9,332 | $9,328 |
| 1/16 | $9,230 | $10,190 | $9,184 | $9,180 |
| 2/16 | $9,329 | $10,263 | $9,227 | $9,223 |
| 3/16 | $9,624 | $10,388 | $9,635 | $9,631 |
| 4/16 | $9,830 | $10,459 | $10,020 | $10,016 |
| 5/16 | $9,881 | $10,467 | $10,092 | $10,088 |
| 6/16 | $9,931 | $10,652 | $10,202 | $10,197 |
| 7/16 | $10,125 | $10,739 | $10,459 | $10,455 |
| 8/16 | $10,281 | $10,751 | $10,692 | $10,688 |
| 9/16 | $10,348 | $10,753 | $10,761 | $10,757 |
| 10/16 | $10,343 | $10,682 | $10,795 | $10,790 |
| 11/16 | $10,319 | $10,442 | $10,752 | $10,748 |
| 12/16 | $10,497 | $10,473 | $10,964 | $10,959 |
| 1/17 | $10,603 | $10,510 | $11,111 | $11,106 |
| 2/17 | $10,721 | $10,591 | $11,284 | $11,280 |
| 3/17 | $10,716 | $10,588 | $11,260 | $11,256 |
| 4/17 | $10,839 | $10,675 | $11,388 | $11,384 |
| 5/17 | $10,907 | $10,758 | $11,489 | $11,485 |
| 6/17 | $10,919 | $10,749 | $11,501 | $11,497 |
| 7/17 | $11,026 | $10,802 | $11,634 | $11,630 |
| 8/17 | $11,020 | $10,895 | $11,631 | $11,627 |
| 9/17 | $11,108 | $10,857 | $11,736 | $11,732 |
| 10/17 | $11,121 | $10,870 | $11,781 | $11,777 |
| 11/17 | $11,095 | $10,854 | $11,750 | $11,745 |
| 12/17 | $11,127 | $10,901 | $11,784 | $11,779 |
| 1/18 | $11,179 | $10,797 | $11,860 | $11,855 |
| 2/18 | $11,091 | $10,694 | $11,749 | $11,744 |
| 3/18 | $11,026 | $10,748 | $11,677 | $11,672 |
| 4/18 | $11,077 | $10,676 | $11,754 | $11,750 |
| 5/18 | $11,071 | $10,735 | $11,753 | $11,748 |
| 6/18 | $11,083 | $10,719 | $11,793 | $11,788 |
| 7/18 | $11,197 | $10,741 | $11,925 | $11,920 |
| 8/18 | $11,251 | $10,794 | $12,011 | $12,006 |
| 9/18 | $11,303 | $10,748 | $12,081 | $12,076 |
| 10/18 | $11,136 | $10,658 | $11,883 | $11,878 |
| 11/18 | $11,046 | $10,706 | $11,775 | $11,771 |
| 12/18 | $10,816 | $10,874 | $11,517 | $11,513 |
| 1/19 | $11,281 | $11,024 | $12,046 | $12,041 |
| 2/19 | $11,434 | $11,036 | $12,249 | $12,245 |
| 3/19 | $11,531 | $11,235 | $12,370 | $12,365 |
| 4/19 | $11,669 | $11,251 | $12,543 | $12,538 |
| 5/19 | $11,579 | $11,423 | $12,383 | $12,378 |
| 6/19 | $11,801 | $11,585 | $12,687 | $12,682 |
| 7/19 | $11,858 | $11,619 | $12,752 | $12,747 |
| 8/19 | $11,915 | $11,882 | $12,802 | $12,797 |
| 9/19 | $11,971 | $11,830 | $12,842 | $12,837 |
| 10/19 | $11,985 | $11,869 | $12,872 | $12,867 |
| 11/19 | $12,041 | $11,866 | $12,907 | $12,902 |
| 12/19 | $12,251 | $11,884 | $13,177 | $13,172 |
| 1/20 | $12,222 | $12,097 | $13,177 | $13,172 |
| 2/20 | $12,038 | $12,278 | $12,973 | $12,968 |
| 3/20 | $10,762 | $12,039 | $11,446 | $11,443 |
| 4/20 | $11,193 | $12,280 | $11,882 | $11,878 |
| 5/20 | $11,629 | $12,394 | $12,421 | $12,421 |
| 6/20 | $11,665 | $12,498 | $12,539 | $12,542 |
| 7/20 | $12,172 | $12,717 | $13,134 | $13,142 |
| 8/20 | $12,255 | $12,644 | $13,265 | $13,271 |
| 9/20 | $12,133 | $12,621 | $13,127 | $13,133 |
| 10/20 | $12,172 | $12,576 | $13,187 | $13,194 |
| 11/20 | $12,642 | $12,740 | $13,715 | $13,722 |
| 12/20 | $12,841 | $12,784 | $13,977 | $13,984 |
| 1/21 | $12,857 | $12,704 | $14,031 | $14,037 |
| 2/21 | $12,913 | $12,540 | $14,079 | $14,086 |
| 3/21 | $12,944 | $12,394 | $14,104 | $14,110 |
| 4/21 | $13,067 | $12,498 | $14,259 | $14,265 |
| 5/21 | $13,121 | $12,546 | $14,300 | $14,306 |
| 6/21 | $13,315 | $12,637 | $14,495 | $14,502 |
| 7/21 | $13,347 | $12,764 | $14,545 | $14,553 |
| 8/21 | $13,402 | $12,756 | $14,626 | $14,633 |
| 9/21 | $13,409 | $12,647 | $14,632 | $14,638 |
| 10/21 | $13,417 | $12,636 | $14,604 | $14,612 |
| 11/21 | $13,303 | $12,652 | $14,453 | $14,462 |
| 12/21 | $13,552 | $12,643 | $14,725 | $14,734 |
| 1/22 | $13,197 | $12,366 | $14,321 | $14,329 |
| 2/22 | $13,248 | $12,197 | $14,193 | $14,200 |
| 3/22 | $13,135 | $11,870 | $14,063 | $14,069 |
| 4/22 | $12,749 | $11,427 | $13,552 | $13,557 |
| 5/22 | $12,757 | $11,490 | $13,584 | $13,591 |
| 6/22 | $11,972 | $11,261 | $12,659 | $12,666 |
| 7/22 | $12,651 | $11,544 | $13,421 | $13,429 |
| 8/22 | $12,385 | $11,244 | $13,100 | $13,107 |
| 9/22 | $11,941 | $10,759 | $12,574 | $12,580 |
| 10/22 | $12,226 | $10,641 | $12,932 | $12,938 |
| 11/22 | $12,536 | $11,038 | $13,172 | $13,180 |
| 12/22 | $12,443 | $11,001 | $13,074 | $13,081 |
| 1/23 | $12,937 | $11,342 | $13,585 | $13,593 |
| 2/23 | $12,735 | $11,063 | $13,411 | $13,417 |
| 3/23 | $12,924 | $11,323 | $13,560 | $13,568 |
| 4/23 | $13,007 | $11,392 | $13,692 | $13,699 |
| 5/23 | $12,862 | $11,274 | $13,561 | $13,569 |
| 6/23 | $13,056 | $11,256 | $13,782 | $13,789 |
| 7/23 | $13,223 | $11,267 | $13,979 | $13,986 |
| 8/23 | $13,261 | $11,200 | $14,020 | $14,026 |
| 9/23 | $13,115 | $10,932 | $13,856 | $13,863 |
| 10/23 | $12,941 | $10,768 | $13,683 | $13,691 |
| 11/23 | $13,462 | $11,253 | $14,307 | $14,314 |
| 12/23 | $13,907 | $11,680 | $14,835 | $14,842 |
| 1/24 | $13,944 | $11,652 | $14,838 | $14,844 |
| 2/24 | $13,956 | $11,512 | $14,882 | $14,888 |
| 3/24 | $14,135 | $11,625 | $15,059 | $15,066 |
| 4/24 | $14,011 | $11,353 | $14,909 | $14,915 |
| 5/24 | $14,191 | $11,542 | $15,078 | $15,084 |
| 6/24 | $14,319 | $11,647 | $15,223 | $15,230 |
| 7/24 | $14,529 | $11,911 | $15,522 | $15,529 |
| 8/24 | $14,741 | $12,087 | $15,769 | $15,776 |
| 9/24 | $14,869 | $12,253 | $16,027 | $16,034 |
| 10/24 | $14,808 | $11,974 | $15,939 | $15,945 |
Average Annual Total Returns (%)
| Fund | 1 Year | 5 Years | 10 Years |
|---|
| Class A | 14.38% | 4.31% | 4.34% |
| Class A with 3.25% Maximum Sales Charge | 10.71% | 3.61% | 4.00% |
Bloomberg U.S. Universal IndexFootnote Reference1 | 11.20% | 0.18% | 1.82% |
| ICE BofA U.S. High Yield Index | 16.47% | 4.38% | 4.77% |
| ICE BofA U.S. High Yield Constrained Index | 16.49% | 4.36% | 4.77% |
| Footnote | Description |
Footnote1 | In accordance with regulatory changes requiring the Fund’s primary benchmark to represent the overall applicable market, the Fund’s primary prospectus benchmark changed to the indicated benchmark effective May 1, 2024. |
Performance does not reflect the deduction of taxes that a shareholder would pay on Fund distributions or redemption of Fund shares. Performance assumes that all dividends and distributions, if any, were reinvested. For more recent performance information, visit www.eatonvance.com/performance.php.
THE FUND'S PAST PERFORMANCE IS NO GUARANTEE OF FUTURE RESULTS.
| Total Net Assets | $5,663,132,601 |
| # of Portfolio Holdings | 432 |
| Portfolio Turnover Rate | 45% |
| Total Advisory Fees Paid | $30,275,138 |
What did the Fund invest in?
The following tables reflect what the Fund invested in as of the report date.
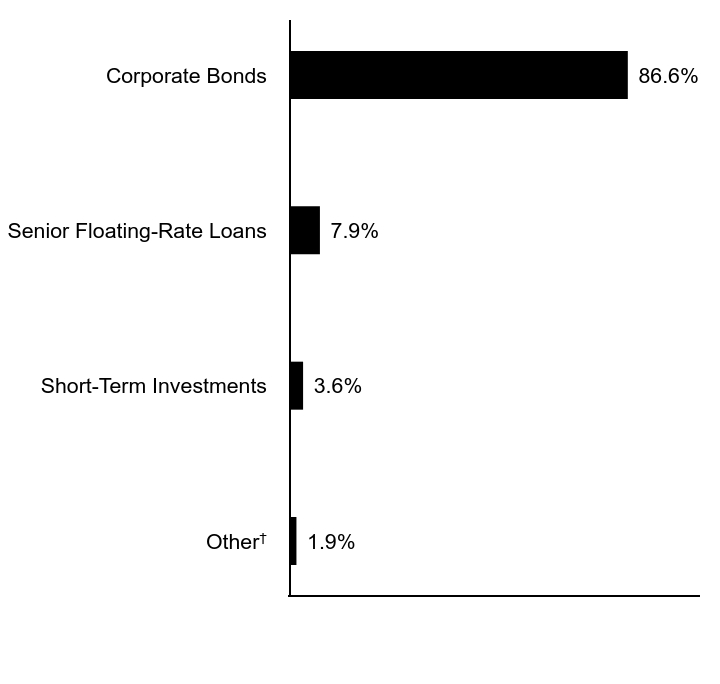
Asset Allocation (% of total investments)
| Value | Value |
|---|
OtherFootnote Reference† | 1.9% |
| Short-Term Investments | 3.6% |
| Senior Floating-Rate Loans | 7.9% |
| Corporate Bonds | 86.6% |
| Footnote | Description |
Footnote† | Investment types less than 1% each |
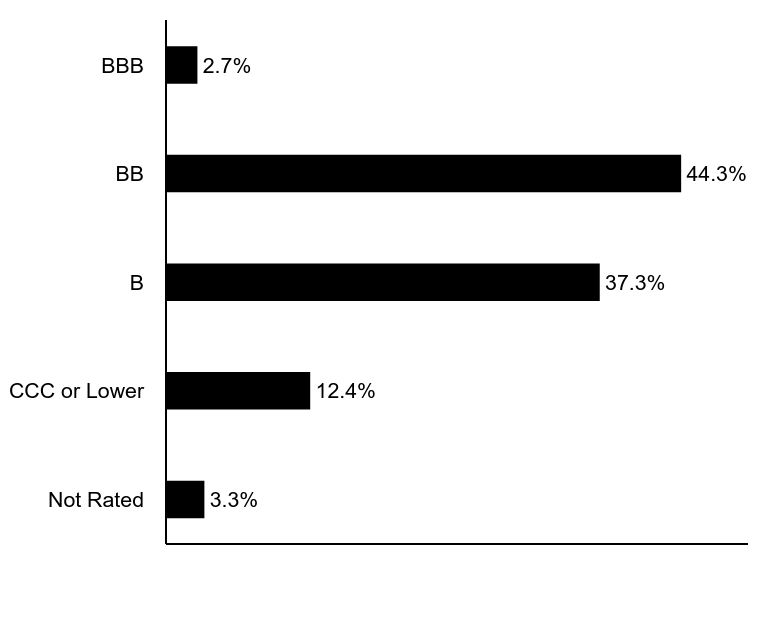
Credit Quality (% of total investments)Footnote Referencea
| Value | Value |
|---|
| Not Rated | 3.3% |
| CCC or Lower | 12.4% |
| B | 37.3% |
| BB | 44.3% |
| BBB | 2.7% |
| Footnote | Description |
Footnotea | Excludes Short-Term Investments. Ratings are based on Moody’s Investors Service, Inc. (“Moody’s”), S&P Global Ratings (“S&P”) or Fitch Ratings (“Fitch”). This breakdown assigns a numeric equivalent to the ratings from the aforementioned agencies and the mean is rounded to the nearest integer and converted to an equivalent S&P rating ranging from AAA, being the highest, to D, being the lowest. Ratings of BBB or higher are considered to be investment-grade quality. Holdings designated as “Not Rated” (if any) are not rated by the national ratings agencies stated above. |
If you wish to view additional information about the Fund, including the prospectus, statement of additional information, financial statements and holdings, please scan the QR code or visit www.eatonvance.com/open-end-mutual-fund-documents.php. For proxy information, please visit www.eatonvance.com/proxyvoting.
The Funds may deliver a single copy of certain required shareholder documents (including prospectuses, shareholder reports, and proxy materials) to investors with the same last name and the same address. Your participation will continue indefinitely unless you instruct otherwise by calling 1-800-262-1122 or by contacting your financial intermediary. Your instruction will typically be effective within 30 days of receipt.
Not FDIC Insured | May Lose Value | No Bank Guarantee
Annual Shareholder Report October 31, 2024
Eaton Vance Income Fund of Boston
Annual Shareholder Report October 31, 2024
This annual shareholder report contains important information about the Eaton Vance Income Fund of Boston for the period of November 1, 2023 to October 31, 2024. You can find additional information about the Fund at www.eatonvance.com/open-end-mutual-fund-documents.php. You can also request this information by contacting us at 1-800-262-1122.
What were the Fund costs for the last year?
(based on a hypothetical $10,000 investment)
| Class Name | Costs of a $10,000 investment | Costs paid as a percentage of a $10,000 investment |
|---|
| Class C | $184 | 1.73% |
How did the Fund perform last year and what affected its performance?
Key contributors to (↑) and detractors from (↓) performance, relative to the ICE BofA U.S. High Yield Index (the Index):
↓ The Fund’s security selections by sector ― especially in the health care, gaming, and retail sectors ― detracted from Index-relative returns during the period
↓ Fund allocations by credit quality ― particularly a broad underweight exposure to distressed CCC-rated and lower-rated securities ― detracted from returns
↓ Security selections by credit quality ― especially selections in B-rated and CCC-rated securities ― detracted from Index-relative returns during the period
↓ Security selections by duration segment ― particularly selections in securities with durations of less than 5 years ― hampered returns relative to the Index
↑ An overweight exposure to the health care sector and an underweight allocation to the energy sector contributed to Index-relative returns during the period
↑ The Fund’s selections in lower-rated fixed-income investments contributed to performance relative to the Index during the period
↑ The Fund’s underweight exposure to BB-rated securities contributed to performance relative to the Index during the period
↑ The Fund’s overweight exposure to securities with durations between 5-10 years contributed to performance relative to the Index during the period
Comparison of the change in value of a $10,000 investment for the period indicated.
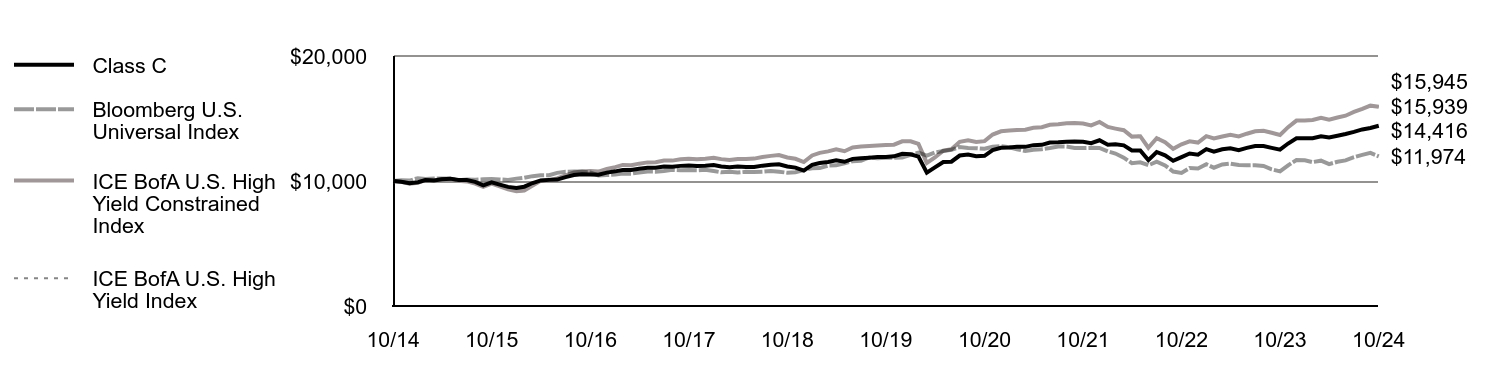
| Class C | Bloomberg U.S. Universal Index | ICE BofA U.S. High Yield Constrained Index | ICE BofA U.S. High Yield Index |
|---|
| 10/14 | $10,000 | $10,000 | $10,000 | $10,000 |
| 11/14 | $9,943 | $10,054 | $9,929 | $9,929 |
| 12/14 | $9,820 | $10,036 | $9,783 | $9,782 |
| 1/15 | $9,898 | $10,227 | $9,850 | $9,850 |
| 2/15 | $10,072 | $10,167 | $10,085 | $10,085 |
| 3/15 | $10,049 | $10,209 | $10,032 | $10,031 |
| 4/15 | $10,143 | $10,197 | $10,152 | $10,151 |
| 5/15 | $10,188 | $10,180 | $10,182 | $10,181 |
| 6/15 | $10,077 | $10,066 | $10,027 | $10,026 |
| 7/15 | $10,071 | $10,125 | $9,966 | $9,964 |
| 8/15 | $9,927 | $10,095 | $9,789 | $9,789 |
| 9/15 | $9,659 | $10,134 | $9,538 | $9,535 |
| 10/15 | $9,896 | $10,167 | $9,797 | $9,795 |
| 11/15 | $9,712 | $10,130 | $9,579 | $9,575 |
| 12/15 | $9,529 | $10,079 | $9,332 | $9,328 |
| 1/16 | $9,450 | $10,190 | $9,184 | $9,180 |
| 2/16 | $9,545 | $10,263 | $9,227 | $9,223 |
| 3/16 | $9,839 | $10,388 | $9,635 | $9,631 |
| 4/16 | $10,044 | $10,459 | $10,020 | $10,016 |
| 5/16 | $10,090 | $10,467 | $10,092 | $10,088 |
| 6/16 | $10,116 | $10,652 | $10,202 | $10,197 |
| 7/16 | $10,307 | $10,739 | $10,459 | $10,455 |
| 8/16 | $10,478 | $10,751 | $10,692 | $10,688 |
| 9/16 | $10,539 | $10,753 | $10,761 | $10,757 |
| 10/16 | $10,528 | $10,682 | $10,795 | $10,790 |
| 11/16 | $10,497 | $10,442 | $10,752 | $10,748 |
| 12/16 | $10,671 | $10,473 | $10,964 | $10,959 |
| 1/17 | $10,772 | $10,510 | $11,111 | $11,106 |
| 2/17 | $10,886 | $10,591 | $11,284 | $11,280 |
| 3/17 | $10,874 | $10,588 | $11,260 | $11,256 |
| 4/17 | $10,972 | $10,675 | $11,388 | $11,384 |
| 5/17 | $11,054 | $10,758 | $11,489 | $11,485 |
| 6/17 | $11,059 | $10,749 | $11,501 | $11,497 |
| 7/17 | $11,160 | $10,802 | $11,634 | $11,630 |
| 8/17 | $11,148 | $10,895 | $11,631 | $11,627 |
| 9/17 | $11,210 | $10,857 | $11,736 | $11,732 |
| 10/17 | $11,236 | $10,870 | $11,781 | $11,777 |
| 11/17 | $11,202 | $10,854 | $11,750 | $11,745 |
| 12/17 | $11,228 | $10,901 | $11,784 | $11,779 |
| 1/18 | $11,273 | $10,797 | $11,860 | $11,855 |
| 2/18 | $11,158 | $10,694 | $11,749 | $11,744 |
| 3/18 | $11,106 | $10,748 | $11,677 | $11,672 |
| 4/18 | $11,150 | $10,676 | $11,754 | $11,750 |
| 5/18 | $11,117 | $10,735 | $11,753 | $11,748 |
| 6/18 | $11,122 | $10,719 | $11,793 | $11,788 |
| 7/18 | $11,229 | $10,741 | $11,925 | $11,920 |
| 8/18 | $11,295 | $10,794 | $12,011 | $12,006 |
| 9/18 | $11,341 | $10,748 | $12,081 | $12,076 |
| 10/18 | $11,166 | $10,658 | $11,883 | $11,878 |
| 11/18 | $11,069 | $10,706 | $11,775 | $11,771 |
| 12/18 | $10,831 | $10,874 | $11,517 | $11,513 |
| 1/19 | $11,289 | $11,024 | $12,046 | $12,041 |
| 2/19 | $11,435 | $11,036 | $12,249 | $12,245 |
| 3/19 | $11,524 | $11,235 | $12,370 | $12,365 |
| 4/19 | $11,654 | $11,251 | $12,543 | $12,538 |
| 5/19 | $11,536 | $11,423 | $12,383 | $12,378 |
| 6/19 | $11,771 | $11,585 | $12,687 | $12,682 |
| 7/19 | $11,820 | $11,619 | $12,752 | $12,747 |
| 8/19 | $11,869 | $11,882 | $12,802 | $12,797 |
| 9/19 | $11,917 | $11,830 | $12,842 | $12,837 |
| 10/19 | $11,924 | $11,869 | $12,872 | $12,867 |
| 11/19 | $11,972 | $11,866 | $12,907 | $12,902 |
| 12/19 | $12,172 | $11,884 | $13,177 | $13,172 |
| 1/20 | $12,136 | $12,097 | $13,177 | $13,172 |
| 2/20 | $11,945 | $12,278 | $12,973 | $12,968 |
| 3/20 | $10,673 | $12,039 | $11,446 | $11,443 |
| 4/20 | $11,093 | $12,280 | $11,882 | $11,878 |
| 5/20 | $11,516 | $12,394 | $12,421 | $12,421 |
| 6/20 | $11,544 | $12,498 | $12,539 | $12,542 |
| 7/20 | $12,036 | $12,717 | $13,134 | $13,142 |
| 8/20 | $12,110 | $12,644 | $13,265 | $13,271 |
| 9/20 | $11,982 | $12,621 | $13,127 | $13,133 |
| 10/20 | $12,012 | $12,576 | $13,187 | $13,194 |
| 11/20 | $12,467 | $12,740 | $13,715 | $13,722 |
| 12/20 | $12,655 | $12,784 | $13,977 | $13,984 |
| 1/21 | $12,685 | $12,704 | $14,031 | $14,037 |
| 2/21 | $12,733 | $12,540 | $14,079 | $14,086 |
| 3/21 | $12,733 | $12,394 | $14,104 | $14,110 |
| 4/21 | $12,868 | $12,498 | $14,259 | $14,265 |
| 5/21 | $12,891 | $12,546 | $14,300 | $14,306 |
| 6/21 | $13,074 | $12,637 | $14,495 | $14,502 |
| 7/21 | $13,096 | $12,764 | $14,545 | $14,553 |
| 8/21 | $13,143 | $12,756 | $14,626 | $14,633 |
| 9/21 | $13,164 | $12,647 | $14,632 | $14,638 |
| 10/21 | $13,140 | $12,636 | $14,604 | $14,612 |
| 11/21 | $13,021 | $12,652 | $14,453 | $14,462 |
| 12/21 | $13,257 | $12,643 | $14,725 | $14,734 |
| 1/22 | $12,902 | $12,366 | $14,321 | $14,329 |
| 2/22 | $12,944 | $12,197 | $14,193 | $14,200 |
| 3/22 | $12,849 | $11,870 | $14,063 | $14,069 |
| 4/22 | $12,441 | $11,427 | $13,552 | $13,557 |
| 5/22 | $12,441 | $11,490 | $13,584 | $13,591 |
| 6/22 | $11,669 | $11,261 | $12,659 | $12,666 |
| 7/22 | $12,321 | $11,544 | $13,421 | $13,429 |
| 8/22 | $12,054 | $11,244 | $13,100 | $13,107 |
| 9/22 | $11,614 | $10,759 | $12,574 | $12,580 |
| 10/22 | $11,907 | $10,641 | $12,932 | $12,938 |
| 11/22 | $12,199 | $11,038 | $13,172 | $13,180 |
| 12/22 | $12,100 | $11,001 | $13,074 | $13,081 |
| 1/23 | $12,546 | $11,342 | $13,585 | $13,593 |
| 2/23 | $12,342 | $11,063 | $13,411 | $13,417 |
| 3/23 | $12,541 | $11,323 | $13,560 | $13,568 |
| 4/23 | $12,614 | $11,392 | $13,692 | $13,699 |
| 5/23 | $12,466 | $11,274 | $13,561 | $13,569 |
| 6/23 | $12,646 | $11,256 | $13,782 | $13,789 |
| 7/23 | $12,799 | $11,267 | $13,979 | $13,986 |
| 8/23 | $12,802 | $11,200 | $14,020 | $14,026 |
| 9/23 | $12,654 | $10,932 | $13,856 | $13,863 |
| 10/23 | $12,504 | $10,768 | $13,683 | $13,691 |
| 11/23 | $12,998 | $11,253 | $14,307 | $14,314 |
| 12/23 | $13,418 | $11,680 | $14,835 | $14,842 |
| 1/24 | $13,419 | $11,652 | $14,838 | $14,844 |
| 2/24 | $13,423 | $11,512 | $14,882 | $14,888 |
| 3/24 | $13,585 | $11,625 | $15,059 | $15,066 |
| 4/24 | $13,486 | $11,353 | $14,909 | $14,915 |
| 5/24 | $13,623 | $11,542 | $15,078 | $15,084 |
| 6/24 | $13,764 | $11,647 | $15,223 | $15,230 |
| 7/24 | $13,930 | $11,911 | $15,522 | $15,529 |
| 8/24 | $14,124 | $12,087 | $15,769 | $15,776 |
| 9/24 | $14,238 | $12,253 | $16,027 | $16,034 |
| 10/24 | $14,416 | $11,974 | $15,939 | $15,945 |
Average Annual Total Returns (%)
| Fund | 1 Year | 5 Years | 10 Years |
|---|
| Class C, with conversion to Class A after 8 years | 13.28% | 3.50% | 3.72% |
| Class C, with 1% Maximum Deferred Sales Charge and conversion to Class A after 8 years | 12.28% | 3.50% | 3.72% |
Bloomberg U.S. Universal IndexFootnote Reference1 | 11.20% | 0.18% | 1.82% |
| ICE BofA U.S. High Yield Index | 16.47% | 4.38% | 4.77% |
| ICE BofA U.S. High Yield Constrained Index | 16.49% | 4.36% | 4.77% |
| Footnote | Description |
Footnote1 | In accordance with regulatory changes requiring the Fund’s primary benchmark to represent the overall applicable market, the Fund’s primary prospectus benchmark changed to the indicated benchmark effective May 1, 2024. |
Performance does not reflect the deduction of taxes that a shareholder would pay on Fund distributions or redemption of Fund shares. Performance assumes that all dividends and distributions, if any, were reinvested. For more recent performance information, visit www.eatonvance.com/performance.php.
THE FUND'S PAST PERFORMANCE IS NO GUARANTEE OF FUTURE RESULTS.
| Total Net Assets | $5,663,132,601 |
| # of Portfolio Holdings | 432 |
| Portfolio Turnover Rate | 45% |
| Total Advisory Fees Paid | $30,275,138 |
What did the Fund invest in?
The following tables reflect what the Fund invested in as of the report date.
Asset Allocation (% of total investments)
| Value | Value |
|---|
OtherFootnote Reference† | 1.9% |
| Short-Term Investments | 3.6% |
| Senior Floating-Rate Loans | 7.9% |
| Corporate Bonds | 86.6% |
| Footnote | Description |
Footnote† | Investment types less than 1% each |
Credit Quality (% of total investments)Footnote Referencea
| Value | Value |
|---|
| Not Rated | 3.3% |
| CCC or Lower | 12.4% |
| B | 37.3% |
| BB | 44.3% |
| BBB | 2.7% |
| Footnote | Description |
Footnotea | Excludes Short-Term Investments. Ratings are based on Moody’s Investors Service, Inc. (“Moody’s”), S&P Global Ratings (“S&P”) or Fitch Ratings (“Fitch”). This breakdown assigns a numeric equivalent to the ratings from the aforementioned agencies and the mean is rounded to the nearest integer and converted to an equivalent S&P rating ranging from AAA, being the highest, to D, being the lowest. Ratings of BBB or higher are considered to be investment-grade quality. Holdings designated as “Not Rated” (if any) are not rated by the national ratings agencies stated above. |
If you wish to view additional information about the Fund, including the prospectus, statement of additional information, financial statements and holdings, please scan the QR code or visit www.eatonvance.com/open-end-mutual-fund-documents.php. For proxy information, please visit www.eatonvance.com/proxyvoting.
The Funds may deliver a single copy of certain required shareholder documents (including prospectuses, shareholder reports, and proxy materials) to investors with the same last name and the same address. Your participation will continue indefinitely unless you instruct otherwise by calling 1-800-262-1122 or by contacting your financial intermediary. Your instruction will typically be effective within 30 days of receipt.
Not FDIC Insured | May Lose Value | No Bank Guarantee
Annual Shareholder Report October 31, 2024
Eaton Vance Income Fund of Boston
Annual Shareholder Report October 31, 2024
This annual shareholder report contains important information about the Eaton Vance Income Fund of Boston for the period of November 1, 2023 to October 31, 2024. You can find additional information about the Fund at www.eatonvance.com/open-end-mutual-fund-documents.php. You can also request this information by contacting us at 1-800-262-1122.
What were the Fund costs for the last year?
(based on a hypothetical $10,000 investment)
| Class Name | Costs of a $10,000 investment | Costs paid as a percentage of a $10,000 investment |
|---|
| Class I | $78 | 0.73% |
How did the Fund perform last year and what affected its performance?
Key contributors to (↑) and detractors from (↓) performance, relative to the ICE BofA U.S. High Yield Index (the Index):
↓ The Fund’s security selections by sector ― especially in the health care, gaming, and retail sectors ― detracted from Index-relative returns during the period
↓ Fund allocations by credit quality ― particularly a broad underweight exposure to distressed CCC-rated and lower-rated securities ― detracted from returns
↓ Security selections by credit quality ― especially selections in B-rated and CCC-rated securities ― detracted from Index-relative returns during the period
↓ Security selections by duration segment ― particularly selections in securities with durations of less than 5 years ― hampered returns relative to the Index
↑ An overweight exposure to the health care sector and an underweight allocation to the energy sector contributed to Index-relative returns during the period
↑ The Fund’s selections in lower-rated fixed-income investments contributed to performance relative to the Index during the period
↑ The Fund’s underweight exposure to BB-rated securities contributed to performance relative to the Index during the period
↑ The Fund’s overweight exposure to securities with durations between 5-10 years contributed to performance relative to the Index during the period
Comparison of the change in value of a $1,000,000 investment for the period indicated.
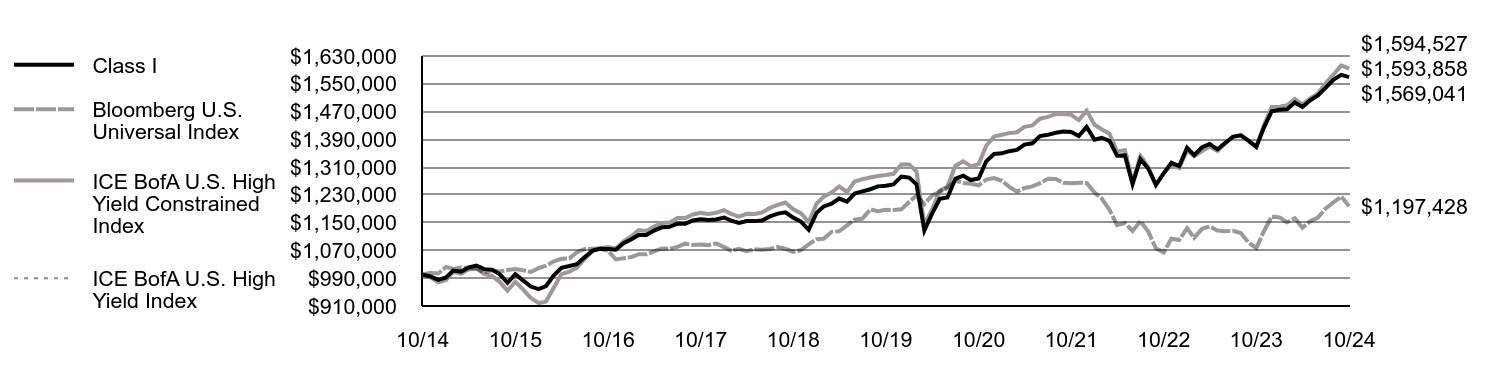
| Class I | Bloomberg U.S. Universal Index | ICE BofA U.S. High Yield Constrained Index | ICE BofA U.S. High Yield Index |
|---|
| 10/14 | $1,000,000 | $1,000,000 | $1,000,000 | $1,000,000 |
| 11/14 | $995,085 | $1,005,397 | $992,901 | $992,852 |
| 12/14 | $985,305 | $1,003,580 | $978,297 | $978,214 |
| 1/15 | $992,258 | $1,022,684 | $985,015 | $984,961 |
| 2/15 | $1,012,236 | $1,016,723 | $1,008,512 | $1,008,460 |
| 3/15 | $1,009,086 | $1,020,920 | $1,003,166 | $1,003,103 |
| 4/15 | $1,021,089 | $1,019,735 | $1,015,225 | $1,015,130 |
| 5/15 | $1,026,474 | $1,017,951 | $1,018,213 | $1,018,137 |
| 6/15 | $1,016,208 | $1,006,590 | $1,002,703 | $1,002,607 |
| 7/15 | $1,014,723 | $1,012,452 | $996,552 | $996,434 |
| 8/15 | $1,001,047 | $1,009,468 | $978,915 | $978,885 |
| 9/15 | $976,618 | $1,013,420 | $953,818 | $953,492 |
| 10/15 | $1,001,501 | $1,016,659 | $979,742 | $979,484 |
| 11/15 | $983,701 | $1,012,952 | $957,889 | $957,494 |
| 12/15 | $965,948 | $1,007,891 | $933,190 | $932,796 |
| 1/16 | $958,811 | $1,019,017 | $918,428 | $918,042 |
| 2/16 | $967,475 | $1,026,256 | $922,700 | $922,312 |
| 3/16 | $998,237 | $1,038,833 | $963,487 | $963,082 |
| 4/16 | $1,019,897 | $1,045,911 | $1,001,986 | $1,001,564 |
| 5/16 | $1,025,397 | $1,046,728 | $1,009,215 | $1,008,791 |
| 6/16 | $1,030,750 | $1,065,155 | $1,020,157 | $1,019,725 |
| 7/16 | $1,051,085 | $1,073,933 | $1,045,923 | $1,045,481 |
| 8/16 | $1,069,436 | $1,075,091 | $1,069,220 | $1,068,768 |
| 9/16 | $1,074,644 | $1,075,347 | $1,076,135 | $1,075,683 |
| 10/16 | $1,074,426 | $1,068,213 | $1,079,498 | $1,079,044 |
| 11/16 | $1,072,149 | $1,044,202 | $1,075,241 | $1,074,789 |
| 12/16 | $1,090,868 | $1,047,304 | $1,096,382 | $1,095,929 |
| 1/17 | $1,102,070 | $1,050,999 | $1,111,096 | $1,110,646 |
| 2/17 | $1,114,587 | $1,059,108 | $1,128,417 | $1,127,977 |
| 3/17 | $1,114,232 | $1,058,753 | $1,126,047 | $1,125,610 |
| 4/17 | $1,127,218 | $1,067,538 | $1,138,792 | $1,138,364 |
| 5/17 | $1,136,559 | $1,075,775 | $1,148,921 | $1,148,532 |
| 6/17 | $1,137,972 | $1,074,863 | $1,150,140 | $1,149,744 |
| 7/17 | $1,147,402 | $1,080,216 | $1,163,435 | $1,163,006 |
| 8/17 | $1,147,044 | $1,089,536 | $1,163,121 | $1,162,704 |
| 9/17 | $1,156,388 | $1,085,702 | $1,173,558 | $1,173,150 |
| 10/17 | $1,159,996 | $1,087,005 | $1,178,137 | $1,177,677 |
| 11/17 | $1,157,451 | $1,085,360 | $1,174,994 | $1,174,517 |
| 12/17 | $1,159,088 | $1,090,145 | $1,178,420 | $1,177,940 |
| 1/18 | $1,164,766 | $1,079,655 | $1,185,976 | $1,185,493 |
| 2/18 | $1,155,739 | $1,069,417 | $1,174,918 | $1,174,441 |
| 3/18 | $1,149,258 | $1,074,811 | $1,167,664 | $1,167,190 |
| 4/18 | $1,154,832 | $1,067,639 | $1,175,432 | $1,174,954 |
| 5/18 | $1,154,452 | $1,073,462 | $1,175,265 | $1,174,777 |
| 6/18 | $1,155,949 | $1,071,905 | $1,179,325 | $1,178,833 |
| 7/18 | $1,168,019 | $1,074,148 | $1,192,502 | $1,192,006 |
| 8/18 | $1,175,973 | $1,079,440 | $1,201,138 | $1,200,639 |
| 9/18 | $1,179,585 | $1,074,815 | $1,208,119 | $1,207,616 |
| 10/18 | $1,164,448 | $1,065,824 | $1,188,326 | $1,187,839 |
| 11/18 | $1,153,278 | $1,070,617 | $1,177,539 | $1,177,060 |
| 12/18 | $1,129,482 | $1,087,367 | $1,151,717 | $1,151,261 |
| 1/19 | $1,178,288 | $1,102,360 | $1,204,609 | $1,204,137 |
| 2/19 | $1,196,661 | $1,103,561 | $1,224,949 | $1,224,469 |
| 3/19 | $1,204,901 | $1,123,489 | $1,236,951 | $1,236,467 |
| 4/19 | $1,219,498 | $1,125,062 | $1,254,258 | $1,253,766 |
| 5/19 | $1,210,367 | $1,142,296 | $1,238,314 | $1,237,830 |
| 6/19 | $1,233,877 | $1,158,453 | $1,268,679 | $1,268,182 |
| 7/19 | $1,240,079 | $1,161,901 | $1,275,177 | $1,274,676 |
| 8/19 | $1,246,312 | $1,188,192 | $1,280,151 | $1,279,650 |
| 9/19 | $1,254,597 | $1,183,044 | $1,284,211 | $1,283,707 |
| 10/19 | $1,256,421 | $1,186,867 | $1,287,194 | $1,286,688 |
| 11/19 | $1,260,302 | $1,186,629 | $1,290,709 | $1,290,201 |
| 12/19 | $1,282,467 | $1,188,398 | $1,317,688 | $1,317,172 |
| 1/20 | $1,279,776 | $1,209,727 | $1,317,745 | $1,317,228 |
| 2/20 | $1,260,692 | $1,227,840 | $1,297,320 | $1,296,813 |
| 3/20 | $1,127,324 | $1,203,856 | $1,144,644 | $1,144,323 |
| 4/20 | $1,175,102 | $1,227,971 | $1,188,162 | $1,187,811 |
| 5/20 | $1,218,715 | $1,239,440 | $1,242,061 | $1,242,137 |
| 6/20 | $1,222,736 | $1,249,782 | $1,253,861 | $1,254,244 |
| 7/20 | $1,276,179 | $1,271,736 | $1,313,363 | $1,314,173 |
| 8/20 | $1,285,166 | $1,264,402 | $1,326,491 | $1,327,105 |
| 9/20 | $1,272,681 | $1,262,124 | $1,312,742 | $1,313,270 |
| 10/20 | $1,277,004 | $1,257,613 | $1,318,664 | $1,319,411 |
| 11/20 | $1,326,563 | $1,274,024 | $1,371,522 | $1,372,224 |
| 12/20 | $1,347,744 | $1,278,423 | $1,397,714 | $1,398,397 |
| 1/21 | $1,349,707 | $1,270,388 | $1,403,106 | $1,403,749 |
| 2/21 | $1,355,882 | $1,253,996 | $1,407,942 | $1,408,640 |
| 3/21 | $1,359,425 | $1,239,403 | $1,410,439 | $1,411,038 |
| 4/21 | $1,375,042 | $1,249,825 | $1,425,870 | $1,426,516 |
| 5/21 | $1,378,622 | $1,254,592 | $1,429,986 | $1,430,634 |
| 6/21 | $1,399,313 | $1,263,738 | $1,449,454 | $1,450,180 |
| 7/21 | $1,402,922 | $1,276,427 | $1,454,542 | $1,455,342 |
| 8/21 | $1,409,038 | $1,275,575 | $1,462,569 | $1,463,280 |
| 9/21 | $1,412,480 | $1,264,683 | $1,463,164 | $1,463,770 |
| 10/21 | $1,411,109 | $1,263,649 | $1,460,410 | $1,461,167 |
| 11/21 | $1,399,435 | $1,265,175 | $1,445,270 | $1,446,193 |
| 12/21 | $1,425,939 | $1,264,322 | $1,472,450 | $1,473,401 |
| 1/22 | $1,388,902 | $1,236,603 | $1,432,083 | $1,432,898 |
| 2/22 | $1,394,573 | $1,219,743 | $1,419,259 | $1,420,032 |
| 3/22 | $1,385,467 | $1,187,019 | $1,406,266 | $1,406,893 |
| 4/22 | $1,342,575 | $1,142,746 | $1,355,183 | $1,355,715 |
| 5/22 | $1,343,753 | $1,149,034 | $1,358,425 | $1,359,110 |
| 6/22 | $1,261,397 | $1,126,073 | $1,265,874 | $1,266,600 |
| 7/22 | $1,333,246 | $1,154,385 | $1,342,055 | $1,342,886 |
| 8/22 | $1,305,514 | $1,124,375 | $1,309,991 | $1,310,727 |
| 9/22 | $1,258,937 | $1,075,933 | $1,257,382 | $1,258,012 |
| 10/22 | $1,292,016 | $1,064,128 | $1,293,158 | $1,293,823 |
| 11/22 | $1,322,382 | $1,103,805 | $1,317,209 | $1,318,043 |
| 12/22 | $1,312,872 | $1,100,056 | $1,307,381 | $1,308,116 |
| 1/23 | $1,365,318 | $1,134,180 | $1,358,481 | $1,359,258 |
| 2/23 | $1,344,234 | $1,106,311 | $1,341,056 | $1,341,668 |
| 3/23 | $1,367,240 | $1,132,265 | $1,355,956 | $1,356,771 |
| 4/23 | $1,376,317 | $1,139,182 | $1,369,169 | $1,369,866 |
| 5/23 | $1,361,261 | $1,127,371 | $1,356,128 | $1,356,860 |
| 6/23 | $1,379,331 | $1,125,619 | $1,378,187 | $1,378,946 |
| 7/23 | $1,397,237 | $1,126,738 | $1,397,883 | $1,398,582 |
| 8/23 | $1,401,496 | $1,119,953 | $1,402,042 | $1,402,573 |
| 9/23 | $1,386,397 | $1,093,247 | $1,385,568 | $1,386,261 |
| 10/23 | $1,368,288 | $1,076,807 | $1,368,266 | $1,369,103 |
| 11/23 | $1,423,714 | $1,125,268 | $1,430,728 | $1,431,373 |
| 12/23 | $1,471,071 | $1,167,966 | $1,483,527 | $1,484,159 |
| 1/24 | $1,475,284 | $1,165,171 | $1,483,812 | $1,484,434 |
| 2/24 | $1,476,835 | $1,151,201 | $1,488,205 | $1,488,830 |
| 3/24 | $1,496,030 | $1,162,504 | $1,505,932 | $1,506,565 |
| 4/24 | $1,483,305 | $1,135,338 | $1,490,874 | $1,491,499 |
| 5/24 | $1,502,682 | $1,154,158 | $1,507,792 | $1,508,423 |
| 6/24 | $1,516,486 | $1,164,708 | $1,522,345 | $1,522,984 |
| 7/24 | $1,539,065 | $1,191,145 | $1,552,219 | $1,552,870 |
| 8/24 | $1,561,896 | $1,208,679 | $1,576,910 | $1,577,571 |
| 9/24 | $1,575,784 | $1,225,257 | $1,602,678 | $1,603,351 |
| 10/24 | $1,569,041 | $1,197,428 | $1,593,858 | $1,594,527 |
Average Annual Total Returns (%)
| Fund | 1 Year | 5 Years | 10 Years |
|---|
| Class I | 14.67% | 4.54% | 4.60% |
Bloomberg U.S. Universal IndexFootnote Reference1 | 11.20% | 0.18% | 1.82% |
| ICE BofA U.S. High Yield Index | 16.47% | 4.38% | 4.77% |
| ICE BofA U.S. High Yield Constrained Index | 16.49% | 4.36% | 4.77% |
| Footnote | Description |
Footnote1 | In accordance with regulatory changes requiring the Fund’s primary benchmark to represent the overall applicable market, the Fund’s primary prospectus benchmark changed to the indicated benchmark effective May 1, 2024. |
Performance does not reflect the deduction of taxes that a shareholder would pay on Fund distributions or redemption of Fund shares. Performance assumes that all dividends and distributions, if any, were reinvested. For more recent performance information, visit www.eatonvance.com/performance.php.
THE FUND'S PAST PERFORMANCE IS NO GUARANTEE OF FUTURE RESULTS.
| Total Net Assets | $5,663,132,601 |
| # of Portfolio Holdings | 432 |
| Portfolio Turnover Rate | 45% |
| Total Advisory Fees Paid | $30,275,138 |
What did the Fund invest in?
The following tables reflect what the Fund invested in as of the report date.
Asset Allocation (% of total investments)
| Value | Value |
|---|
OtherFootnote Reference† | 1.9% |
| Short-Term Investments | 3.6% |
| Senior Floating-Rate Loans | 7.9% |
| Corporate Bonds | 86.6% |
| Footnote | Description |
Footnote† | Investment types less than 1% each |
Credit Quality (% of total investments)Footnote Referencea
| Value | Value |
|---|
| Not Rated | 3.3% |
| CCC or Lower | 12.4% |
| B | 37.3% |
| BB | 44.3% |
| BBB | 2.7% |
| Footnote | Description |
Footnotea | Excludes Short-Term Investments. Ratings are based on Moody’s Investors Service, Inc. (“Moody’s”), S&P Global Ratings (“S&P”) or Fitch Ratings (“Fitch”). This breakdown assigns a numeric equivalent to the ratings from the aforementioned agencies and the mean is rounded to the nearest integer and converted to an equivalent S&P rating ranging from AAA, being the highest, to D, being the lowest. Ratings of BBB or higher are considered to be investment-grade quality. Holdings designated as “Not Rated” (if any) are not rated by the national ratings agencies stated above. |
If you wish to view additional information about the Fund, including the prospectus, statement of additional information, financial statements and holdings, please scan the QR code or visit www.eatonvance.com/open-end-mutual-fund-documents.php. For proxy information, please visit www.eatonvance.com/proxyvoting.
The Funds may deliver a single copy of certain required shareholder documents (including prospectuses, shareholder reports, and proxy materials) to investors with the same last name and the same address. Your participation will continue indefinitely unless you instruct otherwise by calling 1-800-262-1122 or by contacting your financial intermediary. Your instruction will typically be effective within 30 days of receipt.
Not FDIC Insured | May Lose Value | No Bank Guarantee
Annual Shareholder Report October 31, 2024
Eaton Vance Income Fund of Boston
Annual Shareholder Report October 31, 2024
This annual shareholder report contains important information about the Eaton Vance Income Fund of Boston for the period of November 1, 2023 to October 31, 2024. You can find additional information about the Fund at www.eatonvance.com/open-end-mutual-fund-documents.php. You can also request this information by contacting us at 1-800-262-1122.
What were the Fund costs for the last year?
(based on a hypothetical $10,000 investment)
| Class Name | Costs of a $10,000 investment | Costs paid as a percentage of a $10,000 investment |
|---|
| Class R | $132 | 1.23% |
How did the Fund perform last year and what affected its performance?
Key contributors to (↑) and detractors from (↓) performance, relative to the ICE BofA U.S. High Yield Index (the Index):
↓ The Fund’s security selections by sector ― especially in the health care, gaming, and retail sectors ― detracted from Index-relative returns during the period
↓ Fund allocations by credit quality ― particularly a broad underweight exposure to distressed CCC-rated and lower-rated securities ― detracted from returns
↓ Security selections by credit quality ― especially selections in B-rated and CCC-rated securities ― detracted from Index-relative returns during the period
↓ Security selections by duration segment ― particularly selections in securities with durations of less than 5 years ― hampered returns relative to the Index
↑ An overweight exposure to the health care sector and an underweight allocation to the energy sector contributed to Index-relative returns during the period
↑ The Fund’s selections in lower-rated fixed-income investments contributed to performance relative to the Index during the period
↑ The Fund’s underweight exposure to BB-rated securities contributed to performance relative to the Index during the period
↑ The Fund’s overweight exposure to securities with durations between 5-10 years contributed to performance relative to the Index during the period
Comparison of the change in value of a $10,000 investment for the period indicated.
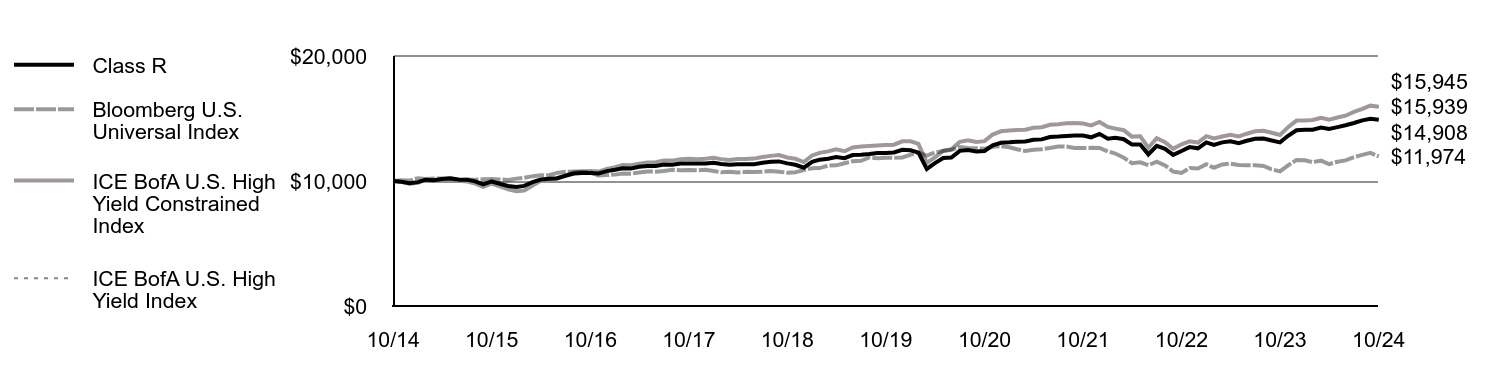
| Class R | Bloomberg U.S. Universal Index | ICE BofA U.S. High Yield Constrained Index | ICE BofA U.S. High Yield Index |
|---|
| 10/14 | $10,000 | $10,000 | $10,000 | $10,000 |
| 11/14 | $9,947 | $10,054 | $9,929 | $9,929 |
| 12/14 | $9,828 | $10,036 | $9,783 | $9,782 |
| 1/15 | $9,910 | $10,227 | $9,850 | $9,850 |
| 2/15 | $10,106 | $10,167 | $10,085 | $10,085 |
| 3/15 | $10,070 | $10,209 | $10,032 | $10,031 |
| 4/15 | $10,168 | $10,197 | $10,152 | $10,151 |
| 5/15 | $10,218 | $10,180 | $10,182 | $10,181 |
| 6/15 | $10,128 | $10,066 | $10,027 | $10,026 |
| 7/15 | $10,109 | $10,125 | $9,966 | $9,964 |
| 8/15 | $9,969 | $10,095 | $9,789 | $9,789 |
| 9/15 | $9,721 | $10,134 | $9,538 | $9,535 |
| 10/15 | $9,964 | $10,167 | $9,797 | $9,795 |
| 11/15 | $9,783 | $10,130 | $9,579 | $9,575 |
| 12/15 | $9,602 | $10,079 | $9,332 | $9,328 |
| 1/16 | $9,527 | $10,190 | $9,184 | $9,180 |
| 2/16 | $9,609 | $10,263 | $9,227 | $9,223 |
| 3/16 | $9,910 | $10,388 | $9,635 | $9,631 |
| 4/16 | $10,121 | $10,459 | $10,020 | $10,016 |
| 5/16 | $10,172 | $10,467 | $10,092 | $10,088 |
| 6/16 | $10,221 | $10,652 | $10,202 | $10,197 |
| 7/16 | $10,418 | $10,739 | $10,459 | $10,455 |
| 8/16 | $10,595 | $10,751 | $10,692 | $10,688 |
| 9/16 | $10,643 | $10,753 | $10,761 | $10,757 |
| 10/16 | $10,636 | $10,682 | $10,795 | $10,790 |
| 11/16 | $10,609 | $10,442 | $10,752 | $10,748 |
| 12/16 | $10,790 | $10,473 | $10,964 | $10,959 |
| 1/17 | $10,896 | $10,510 | $11,111 | $11,106 |
| 2/17 | $11,016 | $10,591 | $11,284 | $11,280 |
| 3/17 | $11,008 | $10,588 | $11,260 | $11,256 |
| 4/17 | $11,132 | $10,675 | $11,388 | $11,384 |
| 5/17 | $11,200 | $10,758 | $11,489 | $11,485 |
| 6/17 | $11,209 | $10,749 | $11,501 | $11,497 |
| 7/17 | $11,317 | $10,802 | $11,634 | $11,630 |
| 8/17 | $11,309 | $10,895 | $11,631 | $11,627 |
| 9/17 | $11,396 | $10,857 | $11,736 | $11,732 |
| 10/17 | $11,407 | $10,870 | $11,781 | $11,777 |
| 11/17 | $11,397 | $10,854 | $11,750 | $11,745 |
| 12/17 | $11,408 | $10,901 | $11,784 | $11,779 |
| 1/18 | $11,459 | $10,797 | $11,860 | $11,855 |
| 2/18 | $11,366 | $10,694 | $11,749 | $11,744 |
| 3/18 | $11,298 | $10,748 | $11,677 | $11,672 |
| 4/18 | $11,348 | $10,676 | $11,754 | $11,750 |
| 5/18 | $11,339 | $10,735 | $11,753 | $11,748 |
| 6/18 | $11,349 | $10,719 | $11,793 | $11,788 |
| 7/18 | $11,462 | $10,741 | $11,925 | $11,920 |
| 8/18 | $11,535 | $10,794 | $12,011 | $12,006 |
| 9/18 | $11,566 | $10,748 | $12,081 | $12,076 |
| 10/18 | $11,412 | $10,658 | $11,883 | $11,878 |
| 11/18 | $11,298 | $10,706 | $11,775 | $11,771 |
| 12/18 | $11,060 | $10,874 | $11,517 | $11,513 |
| 1/19 | $11,532 | $11,024 | $12,046 | $12,041 |
| 2/19 | $11,707 | $11,036 | $12,249 | $12,245 |
| 3/19 | $11,783 | $11,235 | $12,370 | $12,365 |
| 4/19 | $11,921 | $11,251 | $12,543 | $12,538 |
| 5/19 | $11,826 | $11,423 | $12,383 | $12,378 |
| 6/19 | $12,072 | $11,585 | $12,687 | $12,682 |
| 7/19 | $12,106 | $11,619 | $12,752 | $12,747 |
| 8/19 | $12,161 | $11,882 | $12,802 | $12,797 |
| 9/19 | $12,237 | $11,830 | $12,842 | $12,837 |
| 10/19 | $12,249 | $11,869 | $12,872 | $12,867 |
| 11/19 | $12,282 | $11,866 | $12,907 | $12,902 |
| 12/19 | $12,493 | $11,884 | $13,177 | $13,172 |
| 1/20 | $12,461 | $12,097 | $13,177 | $13,172 |
| 2/20 | $12,270 | $12,278 | $12,973 | $12,968 |
| 3/20 | $10,966 | $12,039 | $11,446 | $11,443 |
| 4/20 | $11,426 | $12,280 | $11,882 | $11,878 |
| 5/20 | $11,844 | $12,394 | $12,421 | $12,421 |
| 6/20 | $11,878 | $12,498 | $12,539 | $12,542 |
| 7/20 | $12,414 | $12,717 | $13,134 | $13,142 |
| 8/20 | $12,473 | $12,644 | $13,265 | $13,271 |
| 9/20 | $12,369 | $12,621 | $13,127 | $13,133 |
| 10/20 | $12,406 | $12,576 | $13,187 | $13,194 |
| 11/20 | $12,858 | $12,740 | $13,715 | $13,722 |
| 12/20 | $13,057 | $12,784 | $13,977 | $13,984 |
| 1/21 | $13,094 | $12,704 | $14,031 | $14,037 |
| 2/21 | $13,148 | $12,540 | $14,079 | $14,086 |
| 3/21 | $13,154 | $12,394 | $14,104 | $14,110 |
| 4/21 | $13,299 | $12,498 | $14,259 | $14,265 |
| 5/21 | $13,329 | $12,546 | $14,300 | $14,306 |
| 6/21 | $13,523 | $12,637 | $14,495 | $14,502 |
| 7/21 | $13,553 | $12,764 | $14,545 | $14,553 |
| 8/21 | $13,606 | $12,756 | $14,626 | $14,633 |
| 9/21 | $13,634 | $12,647 | $14,632 | $14,638 |
| 10/21 | $13,640 | $12,636 | $14,604 | $14,612 |
| 11/21 | $13,497 | $12,652 | $14,453 | $14,462 |
| 12/21 | $13,772 | $12,643 | $14,725 | $14,734 |
| 1/22 | $13,384 | $12,366 | $14,321 | $14,329 |
| 2/22 | $13,459 | $12,197 | $14,193 | $14,200 |
| 3/22 | $13,340 | $11,870 | $14,063 | $14,069 |
| 4/22 | $12,922 | $11,427 | $13,552 | $13,557 |
| 5/22 | $12,928 | $11,490 | $13,584 | $13,591 |
| 6/22 | $12,130 | $11,261 | $12,659 | $12,666 |
| 7/22 | $12,815 | $11,544 | $13,421 | $13,429 |
| 8/22 | $12,568 | $11,244 | $13,100 | $13,107 |
| 9/22 | $12,089 | $10,759 | $12,574 | $12,580 |
| 10/22 | $12,401 | $10,641 | $12,932 | $12,938 |
| 11/22 | $12,712 | $11,038 | $13,172 | $13,180 |
| 12/22 | $12,615 | $11,001 | $13,074 | $13,081 |
| 1/23 | $13,086 | $11,342 | $13,585 | $13,593 |
| 2/23 | $12,879 | $11,063 | $13,411 | $13,417 |
| 3/23 | $13,093 | $11,323 | $13,560 | $13,568 |
| 4/23 | $13,175 | $11,392 | $13,692 | $13,699 |
| 5/23 | $13,025 | $11,274 | $13,561 | $13,569 |
| 6/23 | $13,219 | $11,256 | $13,782 | $13,789 |
| 7/23 | $13,385 | $11,267 | $13,979 | $13,986 |
| 8/23 | $13,394 | $11,200 | $14,020 | $14,026 |
| 9/23 | $13,244 | $10,932 | $13,856 | $13,863 |
| 10/23 | $13,092 | $10,768 | $13,683 | $13,691 |
| 11/23 | $13,616 | $11,253 | $14,307 | $14,314 |
| 12/23 | $14,063 | $11,680 | $14,835 | $14,842 |
| 1/24 | $14,097 | $11,652 | $14,838 | $14,844 |
| 2/24 | $14,106 | $11,512 | $14,882 | $14,888 |
| 3/24 | $14,283 | $11,625 | $15,059 | $15,066 |
| 4/24 | $14,156 | $11,353 | $14,909 | $14,915 |
| 5/24 | $14,307 | $11,542 | $15,078 | $15,084 |
| 6/24 | $14,461 | $11,647 | $15,223 | $15,230 |
| 7/24 | $14,641 | $11,911 | $15,522 | $15,529 |
| 8/24 | $14,852 | $12,087 | $15,769 | $15,776 |
| 9/24 | $14,978 | $12,253 | $16,027 | $16,034 |
| 10/24 | $14,908 | $11,974 | $15,939 | $15,945 |
Average Annual Total Returns (%)
| Fund | 1 Year | 5 Years | 10 Years |
|---|
| Class R | 13.86% | 4.00% | 4.07% |
Bloomberg U.S. Universal IndexFootnote Reference1 | 11.20% | 0.18% | 1.82% |
| ICE BofA U.S. High Yield Index | 16.47% | 4.38% | 4.77% |
| ICE BofA U.S. High Yield Constrained Index | 16.49% | 4.36% | 4.77% |
| Footnote | Description |
Footnote1 | In accordance with regulatory changes requiring the Fund’s primary benchmark to represent the overall applicable market, the Fund’s primary prospectus benchmark changed to the indicated benchmark effective May 1, 2024. |
Performance does not reflect the deduction of taxes that a shareholder would pay on Fund distributions or redemption of Fund shares. Performance assumes that all dividends and distributions, if any, were reinvested. For more recent performance information, visit www.eatonvance.com/performance.php.
THE FUND'S PAST PERFORMANCE IS NO GUARANTEE OF FUTURE RESULTS.
| Total Net Assets | $5,663,132,601 |
| # of Portfolio Holdings | 432 |
| Portfolio Turnover Rate | 45% |
| Total Advisory Fees Paid | $30,275,138 |
What did the Fund invest in?
The following tables reflect what the Fund invested in as of the report date.
Asset Allocation (% of total investments)
| Value | Value |
|---|
OtherFootnote Reference† | 1.9% |
| Short-Term Investments | 3.6% |
| Senior Floating-Rate Loans | 7.9% |
| Corporate Bonds | 86.6% |
| Footnote | Description |
Footnote† | Investment types less than 1% each |
Credit Quality (% of total investments)Footnote Referencea
| Value | Value |
|---|
| Not Rated | 3.3% |
| CCC or Lower | 12.4% |
| B | 37.3% |
| BB | 44.3% |
| BBB | 2.7% |
| Footnote | Description |
Footnotea | Excludes Short-Term Investments. Ratings are based on Moody’s Investors Service, Inc. (“Moody’s”), S&P Global Ratings (“S&P”) or Fitch Ratings (“Fitch”). This breakdown assigns a numeric equivalent to the ratings from the aforementioned agencies and the mean is rounded to the nearest integer and converted to an equivalent S&P rating ranging from AAA, being the highest, to D, being the lowest. Ratings of BBB or higher are considered to be investment-grade quality. Holdings designated as “Not Rated” (if any) are not rated by the national ratings agencies stated above. |
If you wish to view additional information about the Fund, including the prospectus, statement of additional information, financial statements and holdings, please scan the QR code or visit www.eatonvance.com/open-end-mutual-fund-documents.php. For proxy information, please visit www.eatonvance.com/proxyvoting.
The Funds may deliver a single copy of certain required shareholder documents (including prospectuses, shareholder reports, and proxy materials) to investors with the same last name and the same address. Your participation will continue indefinitely unless you instruct otherwise by calling 1-800-262-1122 or by contacting your financial intermediary. Your instruction will typically be effective within 30 days of receipt.
Not FDIC Insured | May Lose Value | No Bank Guarantee
Annual Shareholder Report October 31, 2024
Eaton Vance Income Fund of Boston
Annual Shareholder Report October 31, 2024
This annual shareholder report contains important information about the Eaton Vance Income Fund of Boston for the period of November 1, 2023 to October 31, 2024. You can find additional information about the Fund at www.eatonvance.com/open-end-mutual-fund-documents.php. You can also request this information by contacting us at 1-800-262-1122.
What were the Fund costs for the last year?
(based on a hypothetical $10,000 investment)
| Class Name | Costs of a $10,000 investment | Costs paid as a percentage of a $10,000 investment |
|---|
| Class R6 | $69 | 0.64% |
How did the Fund perform last year and what affected its performance?
Key contributors to (↑) and detractors from (↓) performance, relative to the ICE BofA U.S. High Yield Index (the Index):
↓ The Fund’s security selections by sector ― especially in the health care, gaming, and retail sectors ― detracted from Index-relative returns during the period
↓ Fund allocations by credit quality ― particularly a broad underweight exposure to distressed CCC-rated and lower-rated securities ― detracted from returns
↓ Security selections by credit quality ― especially selections in B-rated and CCC-rated securities ― detracted from Index-relative returns during the period
↓ Security selections by duration segment ― particularly selections in securities with durations of less than 5 years ― hampered returns relative to the Index
↑ An overweight exposure to the health care sector and an underweight allocation to the energy sector contributed to Index-relative returns during the period
↑ The Fund’s selections in lower-rated fixed-income investments contributed to performance relative to the Index during the period
↑ The Fund’s underweight exposure to BB-rated securities contributed to performance relative to the Index during the period
↑ The Fund’s overweight exposure to securities with durations between 5-10 years contributed to performance relative to the Index during the period
Comparison of the change in value of a $5,000,000 investment for the period indicated.
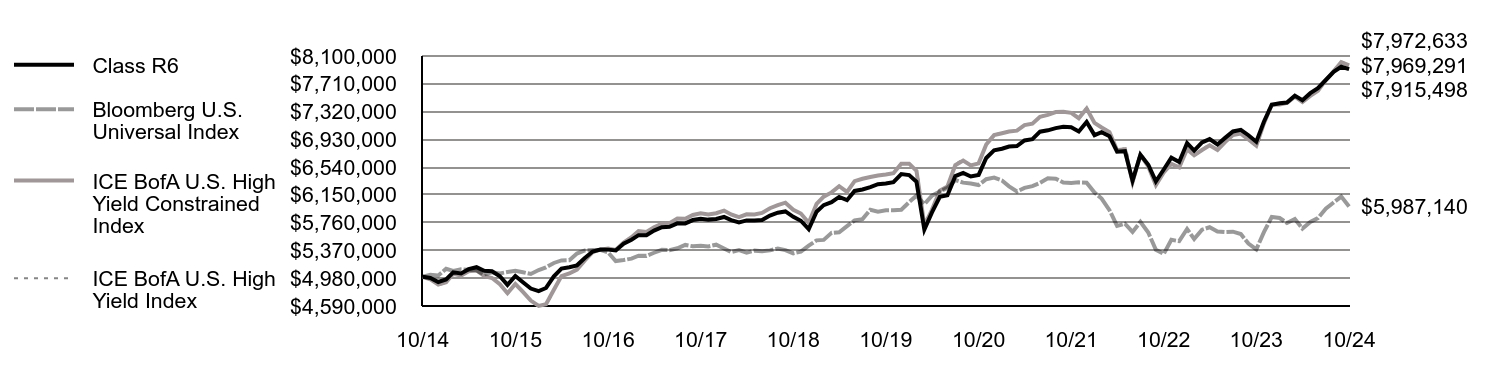
| Class R6 | Bloomberg U.S. Universal Index | ICE BofA U.S. High Yield Constrained Index | ICE BofA U.S. High Yield Index |
|---|
| 10/14 | $5,000,000 | $5,000,000 | $5,000,000 | $5,000,000 |
| 11/14 | $4,984,071 | $5,026,983 | $4,964,506 | $4,964,261 |
| 12/14 | $4,927,176 | $5,017,901 | $4,891,486 | $4,891,071 |
| 1/15 | $4,962,303 | $5,113,418 | $4,925,075 | $4,924,804 |
| 2/15 | $5,062,534 | $5,083,617 | $5,042,562 | $5,042,299 |
| 3/15 | $5,047,143 | $5,104,598 | $5,015,829 | $5,015,515 |
| 4/15 | $5,107,538 | $5,098,676 | $5,076,124 | $5,075,649 |
| 5/15 | $5,134,836 | $5,089,756 | $5,091,064 | $5,090,684 |
| 6/15 | $5,083,845 | $5,032,951 | $5,013,515 | $5,013,033 |
| 7/15 | $5,076,803 | $5,062,258 | $4,982,761 | $4,982,170 |
| 8/15 | $5,008,759 | $5,047,342 | $4,894,575 | $4,894,426 |
| 9/15 | $4,886,884 | $5,067,099 | $4,769,089 | $4,767,458 |
| 10/15 | $5,011,784 | $5,083,296 | $4,898,709 | $4,897,418 |
| 11/15 | $4,923,072 | $5,064,759 | $4,789,447 | $4,787,472 |
| 12/15 | $4,834,594 | $5,039,457 | $4,665,950 | $4,663,980 |
| 1/16 | $4,799,259 | $5,095,087 | $4,592,140 | $4,590,211 |
| 2/16 | $4,842,988 | $5,131,280 | $4,613,499 | $4,611,559 |
| 3/16 | $5,006,424 | $5,194,166 | $4,817,436 | $4,815,408 |
| 4/16 | $5,115,237 | $5,229,555 | $5,009,932 | $5,007,821 |
| 5/16 | $5,134,033 | $5,233,640 | $5,046,075 | $5,043,956 |
| 6/16 | $5,161,207 | $5,325,777 | $5,100,784 | $5,098,626 |
| 7/16 | $5,263,437 | $5,369,663 | $5,229,613 | $5,227,404 |
| 8/16 | $5,355,723 | $5,375,456 | $5,346,098 | $5,343,841 |
| 9/16 | $5,382,205 | $5,376,733 | $5,380,675 | $5,378,413 |
| 10/16 | $5,381,512 | $5,341,063 | $5,397,491 | $5,395,221 |
| 11/16 | $5,370,502 | $5,221,011 | $5,376,203 | $5,373,943 |
| 12/16 | $5,464,665 | $5,236,520 | $5,481,910 | $5,479,647 |
| 1/17 | $5,521,194 | $5,254,995 | $5,555,480 | $5,553,229 |
| 2/17 | $5,584,286 | $5,295,541 | $5,642,086 | $5,639,885 |
| 3/17 | $5,582,925 | $5,293,767 | $5,630,236 | $5,628,052 |
| 4/17 | $5,648,381 | $5,337,691 | $5,693,959 | $5,691,820 |
| 5/17 | $5,695,616 | $5,378,873 | $5,744,605 | $5,742,659 |
| 6/17 | $5,703,127 | $5,374,313 | $5,750,699 | $5,748,721 |
| 7/17 | $5,750,820 | $5,401,082 | $5,817,173 | $5,815,028 |
| 8/17 | $5,749,426 | $5,447,680 | $5,815,607 | $5,813,521 |
| 9/17 | $5,796,664 | $5,428,508 | $5,867,791 | $5,865,750 |
| 10/17 | $5,815,152 | $5,435,026 | $5,890,687 | $5,888,386 |
| 11/17 | $5,802,797 | $5,426,801 | $5,874,971 | $5,872,586 |
| 12/17 | $5,811,404 | $5,450,725 | $5,892,098 | $5,889,701 |
| 1/18 | $5,840,273 | $5,398,274 | $5,929,878 | $5,927,465 |
| 2/18 | $5,795,379 | $5,347,087 | $5,874,591 | $5,872,203 |
| 3/18 | $5,763,300 | $5,374,056 | $5,838,320 | $5,835,951 |
| 4/18 | $5,791,675 | $5,338,197 | $5,877,158 | $5,874,769 |
| 5/18 | $5,790,222 | $5,367,309 | $5,876,326 | $5,873,883 |
| 6/18 | $5,798,149 | $5,359,525 | $5,896,626 | $5,894,167 |
| 7/18 | $5,859,113 | $5,370,741 | $5,962,508 | $5,960,031 |
| 8/18 | $5,899,473 | $5,397,201 | $6,005,691 | $6,003,194 |
| 9/18 | $5,918,026 | $5,374,074 | $6,040,593 | $6,038,078 |
| 10/18 | $5,842,538 | $5,329,118 | $5,941,629 | $5,939,196 |
| 11/18 | $5,786,937 | $5,353,085 | $5,887,696 | $5,885,301 |
| 12/18 | $5,667,988 | $5,436,837 | $5,758,585 | $5,756,303 |
| 1/19 | $5,913,374 | $5,511,800 | $6,023,043 | $6,020,687 |
| 2/19 | $6,005,973 | $5,517,807 | $6,124,744 | $6,122,346 |
| 3/19 | $6,047,800 | $5,617,446 | $6,184,757 | $6,182,335 |
| 4/19 | $6,121,504 | $5,625,309 | $6,271,292 | $6,268,828 |
| 5/19 | $6,076,143 | $5,711,481 | $6,191,571 | $6,189,148 |
| 6/19 | $6,205,636 | $5,792,265 | $6,343,395 | $6,340,912 |
| 7/19 | $6,226,194 | $5,809,507 | $6,375,884 | $6,373,380 |
| 8/19 | $6,257,943 | $5,940,961 | $6,400,756 | $6,398,251 |
| 9/19 | $6,299,997 | $5,915,222 | $6,421,056 | $6,418,535 |
| 10/19 | $6,309,615 | $5,934,333 | $6,435,968 | $6,433,439 |
| 11/19 | $6,329,562 | $5,933,147 | $6,453,546 | $6,451,007 |
| 12/19 | $6,441,384 | $5,941,988 | $6,588,441 | $6,585,862 |
| 1/20 | $6,428,371 | $6,048,634 | $6,588,723 | $6,586,141 |
| 2/20 | $6,332,938 | $6,139,202 | $6,486,599 | $6,484,063 |
| 3/20 | $5,663,471 | $6,019,281 | $5,723,218 | $5,721,614 |
| 4/20 | $5,903,988 | $6,139,856 | $5,940,811 | $5,939,056 |
| 5/20 | $6,123,604 | $6,197,201 | $6,210,305 | $6,210,687 |
| 6/20 | $6,144,289 | $6,248,911 | $6,269,303 | $6,271,222 |
| 7/20 | $6,413,342 | $6,358,678 | $6,566,814 | $6,570,864 |
| 8/20 | $6,458,994 | $6,322,012 | $6,632,456 | $6,635,524 |
| 9/20 | $6,408,616 | $6,310,618 | $6,563,711 | $6,566,352 |
| 10/20 | $6,430,837 | $6,288,063 | $6,593,322 | $6,597,056 |
| 11/20 | $6,668,448 | $6,370,118 | $6,857,611 | $6,861,118 |
| 12/20 | $6,775,446 | $6,392,115 | $6,988,570 | $6,991,982 |
| 1/21 | $6,798,006 | $6,351,938 | $7,015,529 | $7,018,743 |
| 2/21 | $6,829,501 | $6,269,979 | $7,039,710 | $7,043,199 |
| 3/21 | $6,835,597 | $6,197,013 | $7,052,195 | $7,055,191 |
| 4/21 | $6,914,622 | $6,249,123 | $7,129,348 | $7,132,581 |
| 5/21 | $6,933,163 | $6,272,959 | $7,149,931 | $7,153,168 |
| 6/21 | $7,037,726 | $6,318,690 | $7,247,272 | $7,250,902 |
| 7/21 | $7,056,392 | $6,382,137 | $7,272,708 | $7,276,711 |
| 8/21 | $7,087,688 | $6,377,877 | $7,312,844 | $7,316,398 |
| 9/21 | $7,105,520 | $6,323,413 | $7,315,820 | $7,318,852 |
| 10/21 | $7,099,160 | $6,318,245 | $7,302,052 | $7,305,833 |
| 11/21 | $7,040,950 | $6,325,877 | $7,226,351 | $7,230,964 |
| 12/21 | $7,174,843 | $6,321,611 | $7,362,248 | $7,367,003 |
| 1/22 | $6,989,027 | $6,183,015 | $7,160,413 | $7,164,488 |
| 2/22 | $7,030,927 | $6,098,716 | $7,096,295 | $7,100,160 |
| 3/22 | $6,972,728 | $5,935,095 | $7,031,330 | $7,034,464 |
| 4/22 | $6,757,397 | $5,713,731 | $6,775,915 | $6,778,577 |
| 5/22 | $6,763,880 | $5,745,169 | $6,792,124 | $6,795,548 |
| 6/22 | $6,349,873 | $5,630,366 | $6,329,372 | $6,332,998 |
| 7/22 | $6,712,119 | $5,771,925 | $6,710,273 | $6,714,430 |
| 8/22 | $6,573,071 | $5,621,876 | $6,549,956 | $6,553,636 |
| 9/22 | $6,339,107 | $5,379,665 | $6,286,909 | $6,290,060 |
| 10/22 | $6,506,237 | $5,320,638 | $6,465,791 | $6,469,117 |
| 11/22 | $6,673,147 | $5,519,025 | $6,586,043 | $6,590,215 |
| 12/22 | $6,612,318 | $5,500,280 | $6,536,906 | $6,540,580 |
| 1/23 | $6,877,042 | $5,670,901 | $6,792,406 | $6,796,290 |
| 2/23 | $6,771,366 | $5,531,557 | $6,705,279 | $6,708,341 |
| 3/23 | $6,887,837 | $5,661,324 | $6,779,780 | $6,783,854 |
| 4/23 | $6,934,095 | $5,695,908 | $6,845,845 | $6,849,331 |
| 5/23 | $6,858,776 | $5,636,854 | $6,780,641 | $6,784,298 |
| 6/23 | $6,950,343 | $5,628,094 | $6,890,933 | $6,894,729 |
| 7/23 | $7,041,117 | $5,633,689 | $6,989,417 | $6,992,911 |
| 8/23 | $7,063,119 | $5,599,763 | $7,010,211 | $7,012,864 |
| 9/23 | $6,987,548 | $5,466,236 | $6,927,838 | $6,931,303 |
| 10/23 | $6,896,821 | $5,384,034 | $6,841,331 | $6,845,514 |
| 11/23 | $7,176,725 | $5,626,342 | $7,153,641 | $7,156,864 |
| 12/23 | $7,416,009 | $5,839,829 | $7,417,634 | $7,420,795 |
| 1/24 | $7,437,831 | $5,825,853 | $7,419,059 | $7,422,172 |
| 2/24 | $7,446,188 | $5,756,004 | $7,441,024 | $7,444,150 |
| 3/24 | $7,543,548 | $5,812,519 | $7,529,661 | $7,532,827 |
| 4/24 | $7,480,007 | $5,676,689 | $7,454,370 | $7,457,495 |
| 5/24 | $7,578,300 | $5,770,788 | $7,538,958 | $7,542,113 |
| 6/24 | $7,648,491 | $5,823,542 | $7,611,724 | $7,614,920 |
| 7/24 | $7,762,961 | $5,955,723 | $7,761,093 | $7,764,351 |
| 8/24 | $7,878,576 | $6,043,397 | $7,884,548 | $7,887,853 |
| 9/24 | $7,949,157 | $6,126,285 | $8,013,391 | $8,016,753 |
| 10/24 | $7,915,498 | $5,987,140 | $7,969,291 | $7,972,633 |
Average Annual Total Returns (%)
| Fund | 1 Year | 5 Years | 10 Years |
|---|
| Class R6 | 14.77% | 4.63% | 4.70% |
Bloomberg U.S. Universal IndexFootnote Reference1 | 11.20% | 0.18% | 1.82% |
| ICE BofA U.S. High Yield Index | 16.47% | 4.38% | 4.77% |
| ICE BofA U.S. High Yield Constrained Index | 16.49% | 4.36% | 4.77% |
| Footnote | Description |
Footnote1 | In accordance with regulatory changes requiring the Fund’s primary benchmark to represent the overall applicable market, the Fund’s primary prospectus benchmark changed to the indicated benchmark effective May 1, 2024. |
Performance does not reflect the deduction of taxes that a shareholder would pay on Fund distributions or redemption of Fund shares. Performance assumes that all dividends and distributions, if any, were reinvested. For more recent performance information, visit www.eatonvance.com/performance.php.
THE FUND'S PAST PERFORMANCE IS NO GUARANTEE OF FUTURE RESULTS.
| Total Net Assets | $5,663,132,601 |
| # of Portfolio Holdings | 432 |
| Portfolio Turnover Rate | 45% |
| Total Advisory Fees Paid | $30,275,138 |
What did the Fund invest in?
The following tables reflect what the Fund invested in as of the report date.
Asset Allocation (% of total investments)
| Value | Value |
|---|
OtherFootnote Reference† | 1.9% |
| Short-Term Investments | 3.6% |
| Senior Floating-Rate Loans | 7.9% |
| Corporate Bonds | 86.6% |
| Footnote | Description |
Footnote† | Investment types less than 1% each |
Credit Quality (% of total investments)Footnote Referencea
| Value | Value |
|---|
| Not Rated | 3.3% |
| CCC or Lower | 12.4% |
| B | 37.3% |
| BB | 44.3% |
| BBB | 2.7% |
| Footnote | Description |
Footnotea | Excludes Short-Term Investments. Ratings are based on Moody’s Investors Service, Inc. (“Moody’s”), S&P Global Ratings (“S&P”) or Fitch Ratings (“Fitch”). This breakdown assigns a numeric equivalent to the ratings from the aforementioned agencies and the mean is rounded to the nearest integer and converted to an equivalent S&P rating ranging from AAA, being the highest, to D, being the lowest. Ratings of BBB or higher are considered to be investment-grade quality. Holdings designated as “Not Rated” (if any) are not rated by the national ratings agencies stated above. |
If you wish to view additional information about the Fund, including the prospectus, statement of additional information, financial statements and holdings, please scan the QR code or visit www.eatonvance.com/open-end-mutual-fund-documents.php. For proxy information, please visit www.eatonvance.com/proxyvoting.
The Funds may deliver a single copy of certain required shareholder documents (including prospectuses, shareholder reports, and proxy materials) to investors with the same last name and the same address. Your participation will continue indefinitely unless you instruct otherwise by calling 1-800-262-1122 or by contacting your financial intermediary. Your instruction will typically be effective within 30 days of receipt.
Not FDIC Insured | May Lose Value | No Bank Guarantee
Annual Shareholder Report October 31, 2024
Item 2. Code of Ethics
The registrant (sometimes referred to as the “Fund”) has adopted a code of ethics applicable to its Principal Executive Officer, Principal Financial Officer and Principal Accounting Officer. The registrant undertakes to provide a copy of such code of ethics to any person upon request, without charge, by calling 1-800-262-1122. The registrant has not amended the code of ethics as described in Form N-CSR during the period covered by this report. The registrant has not granted any waiver, including an implicit waiver, from a provision of the code of ethics as described in Form N-CSR during the period covered by this report.
Item 3. Audit Committee Financial Expert
The registrant’s Board of Trustees (the “Board”) has designated George J. Gorman and Scott E. Wennerholm, each an independent trustee, as audit committee financial experts. Mr. Gorman is a certified public accountant who is the Principal at George J. Gorman LLC (a consulting firm). Previously, Mr. Gorman served in various capacities at Ernst & Young LLP (a registered public accounting firm), including as Senior Partner. Mr. Gorman also has experience serving as an independent trustee and audit committee financial expert of other mutual fund complexes. Mr. Wennerholm is a private investor. Previously, Mr. Wennerholm served as a Trustee at Wheelock College (postsecondary institution), as a Consultant at GF Parish Group (executive recruiting firm), Chief Operating Officer and Executive Vice President at BNY Mellon Asset Management (investment management firm), Chief Operating Officer and Chief Financial Officer at Natixis Global Asset Management (investment management firm), and Vice President at Fidelity Investments Institutional Services (investment management firm).
Item 4. Principal Accountant Fees and Services
Eaton Vance Income Fund of Boston (the “Fund”) is a series of Eaton Vance Series Trust II (the “Trust”), a Massachusetts business trust, which, including the Fund, contains a total of 2 series (the “Series”). The Trust is registered under the Investment Company Act of 1940 as an open-end management investment company. This Form N-CSR relates to the Fund’s annual report.
(a)-(d)
The following table presents the aggregate fees billed to the fund for the fund’s fiscal years ended October 31, 2023 and October 31, 2024 by the registrant’s principal accountant, Deloitte & Touche LLP (“D&T”), for professional services rendered for the audit of the fund’s annual financial statements and fees billed for other services rendered by D&T during such periods.
Eaton Vance Income Fund of Boston
| | | | | | | | |
Fiscal Years Ended | | 10/31/23 | | | 10/31/24 | |
Audit Fees | | $ | 98,600 | | | $ | 96,200 | |
Audit-Related Fees(1) | | $ | 0 | | | $ | 0 | |
Tax Fees(2) | | $ | 0 | | | $ | 0 | |
All Other Fees(3) | | $ | 833 | | | $ | 0 | |
| | | | | | | | |
Total | | $ | 99,433 | | | $ | 96,200 | |
| | | | | | | | |
| (1) | Audit-related fees consist of the aggregate fees billed for assurance and related services that are reasonably related to the performance of the audit of financial statements and are not reported under the category of audit fees. |
| (2) | Tax fees consist of the aggregate fees billed for professional services rendered by the principal accountant relating to tax compliance, tax advice, and tax planning and specifically include fees for tax return preparation and other tax related compliance/planning matters. |
| (3) | All other fees consist of the aggregate fees billed for products and services provided by the principal accountant other than audit, audit-related, and tax services. |
The various Series comprising the Trust have differing fiscal year ends (October 31 or June 30). The following table presents the aggregate audit, audit-related, tax, and other fees billed to all of the Series in the Trust by D&T for the last two fiscal years of each Series.
| | | | | | | | | | | | | | | | |
Fiscal Years Ended | | 6/30/23 | | | 10/31/23 | | | 6/30/24 | | | 10/31/24 | |
Audit Fees | | $ | 86,700 | | | $ | 98,600 | | | $ | 80,600 | | | $ | 96,200 | |
Audit-Related Fees(1) | | $ | 0 | | | $ | 0 | | | $ | 0 | | | $ | 0 | |
Tax Fees(2) | | $ | 0 | | | $ | 0 | | | $ | 0 | | | $ | 0 | |
All Other Fees(3) | | $ | 38 | | | $ | 833 | | | $ | 0 | | | $ | 0 | |
| | | | | | | | | | | | | | | | |
Total | | $ | 86,738 | | | $ | 99,433 | | | $ | 80,600 | | | $ | 96,200 | |
| | | | | | | | | | | | | | | | |
| (1) | Audit-related fees consist of the aggregate fees billed for assurance and related services that are reasonably related to the performance of the audit of financial statements and are not reported under the category of audit fees. |
| (2) | Tax fees consist of the aggregate fees billed for professional services rendered by the principal accountant relating to tax compliance, tax advice, and tax planning and specifically include fees for tax return preparation and other tax related compliance/planning matters. |
| (3) | All other fees consist of the aggregate fees billed for products and services provided by the principal accountant other than audit, audit-related, and tax services. |
(e)(1) The registrant’s audit committee has adopted policies and procedures relating to the pre-approval of services provided by the registrant’s principal accountant (the “Pre-Approval Policies”). The Pre-Approval Policies establish a framework intended to assist the audit committee in the proper discharge of its pre-approval responsibilities. As a general matter, the Pre-Approval Policies (i) specify certain types of audit, audit-related, tax, and other services determined to be pre-approved by the audit committee; and (ii) delineate specific procedures governing the mechanics of the pre-approval process, including the approval and monitoring of audit and non-audit service fees. Unless a service is specifically pre-approved under the Pre-Approval Policies, it must be separately pre-approved by the audit committee.
The Pre-Approval Policies and the types of audit and non-audit services pre-approved therein must be reviewed and ratified by the registrant’s audit committee at least annually. The registrant’s audit committee maintains full responsibility for the appointment, compensation, and oversight of the work of the registrant’s principal accountant.
(e)(2) No services described in paragraphs (b)-(d) above were approved by the registrant’s audit committee pursuant to the “de minimis exception” set forth in Rule 2-01(c)(7)(i)(C) of Regulation S-X.
(f) Not applicable.
(g) The following table presents (i) the aggregate non-audit fees (i.e., fees for audit-related, tax, and other services) billed for services rendered to all of the Series in the Trust by D&T for the last two fiscal years of each series; and (ii) the aggregate non-audit fees (i.e., fees for audit-related, tax, and other services) billed to the Eaton Vance organization by D&T for the last two fiscal years of each Series.
| | | | | | | | | | | | | | | | |
Fiscal Years Ended | | 6/30/23 | | | 10/31/23 | | | 6/30/24 | | | 10/31/24 | |
Registrant(1) | | $ | 38 | | | $ | 833 | | | $ | 0 | | | $ | 0 | |
Eaton Vance(2) | | $ | 0 | | | $ | 0 | | | $ | 18,490 | | | $ | 18,490 | |
| (1) | Includes all of the Series of the Trust. During the fiscal years reported above, certain of the Funds were “feeder” funds in a “master-feeder” fund structure or funds of funds. |
| (2) | Various subsidiaries of Morgan Stanley act in either an investment advisory and/or service provider capacity with respect to the Series and/or their respective “master” funds (if applicable). |
(h) The registrant’s audit committee has considered whether the provision by the registrant’s principal accountant of non-audit services to the registrant’s investment adviser and any entity controlling, controlled by, or under common control with the adviser that provides ongoing services to the registrant that were not pre-approved pursuant to Rule 2-01(c)(7)(ii) of Regulation S-X is compatible with maintaining the principal accountant’s independence.
(i) Not applicable.
(j) Not applicable.
Item 5. Audit Committee of Listed Registrants
Not applicable.
Item 6. Schedule of Investments
| (a) | Please see schedule of investments contained in the Financial Statements and Financial Highlights included under Item 7 of this Form N-CSR. |
Item 7. Financial Statements and Financial Highlights for Open-End Management Investment Companies
Eaton Vance
Income Fund of Boston
Annual Financial Statements and
Additional Information
October 31, 2024
This report must be preceded or accompanied by a current summary prospectus or prospectus. Before investing, investors should consider carefully the investment objective, risks, and charges and expenses of a mutual fund. This and other important information is contained in the prospectus and/or statement of additional information, which can be obtained by calling 1-800-262-1122 or from a financial intermediary. Prospective investors should read the prospectus carefully before investing.
Annual Financial Statements and Additional Information October 31, 2024
Eaton Vance
Income Fund of Boston
Eaton Vance
Income Fund of Boston
October 31, 2024
| Security | Shares | Value |
| Energy — 0.2% |
| Ascent CNR Corp., Class A(1)(2) | | 32,029,863 | $ 8,968,362 |
| | | | $ 8,968,362 |
| Environmental — 0.2% |
| GFL Environmental, Inc. | | 300,300 | $ 12,552,540 |
| | | | $ 12,552,540 |
| Gaming — 0.0% |
| New Cotai Participation Corp., Class B(1)(2)(3) | | 36 | $ 0 |
| | | | $ 0 |
| Healthcare — 0.1% |
| Endo, Inc.(3) | | 218,020 | $ 5,561,690 |
| | | | $ 5,561,690 |
| Leisure — 0.0% |
| iFIT Health and Fitness, Inc.(1)(2)(3) | | 128,520 | $ 0 |
| | | | $ 0 |
Total Common Stocks
(identified cost $11,918,741) | | | $ 27,082,592 |
| Security | Principal
Amount
(000's omitted) | Value |
| Homebuilders & Real Estate — 0.2% |
| Pebblebrook Hotel Trust, 1.75%, 12/15/26 | $ | 8,290 | $ 7,566,283 |
| | | | $ 7,566,283 |
| Utility — 0.3% |
| NextEra Energy Partners LP, 2.50%, 6/15/26(4) | $ | 19,038 | $ 17,901,280 |
| | | | $ 17,901,280 |
Total Convertible Bonds
(identified cost $25,230,216) | | | $ 25,467,563 |
| Security | Principal
Amount*
(000's omitted) | Value |
| Aerospace — 3.2% |
| Amentum Holdings, Inc., 7.25%, 8/1/32(4) | | 5,485 | $ 5,686,036 |
| Bombardier, Inc.: | | | |
| 7.00%, 6/1/32(4) | | 7,225 | 7,405,989 |
| 7.25%, 7/1/31(4) | | 8,710 | 9,009,694 |
| 7.875%, 4/15/27(4) | | 4,027 | 4,037,455 |
| 8.75%, 11/15/30(4) | | 11,185 | 12,133,108 |
| BWX Technologies, Inc.: | | | |
| 4.125%, 6/30/28(4) | | 9,145 | 8,736,176 |
| 4.125%, 4/15/29(4) | | 7,743 | 7,341,826 |
| Moog, Inc., 4.25%, 12/15/27(4) | | 11,173 | 10,661,486 |
| Rolls-Royce PLC: | | | |
| 3.625%, 10/14/25(4) | | 200 | 197,822 |
| 5.75%, 10/15/27(4) | | 32,331 | 33,013,604 |
| Science Applications International Corp., 4.875%, 4/1/28(4) | | 17,035 | 16,724,985 |
| TransDigm, Inc.: | | | |
| 4.625%, 1/15/29 | | 12,870 | 12,233,921 |
| 5.50%, 11/15/27 | | 20,169 | 20,008,394 |
| 6.375%, 3/1/29(4) | | 6,785 | 6,895,524 |
| 6.625%, 3/1/32(4) | | 10,835 | 11,031,972 |
| 6.75%, 8/15/28(4) | | 17,349 | 17,743,013 |
| | | | $ 182,861,005 |
| Air Transportation — 0.5% |
| VistaJet Malta Finance PLC/Vista Management Holding, Inc.: | | | |
| 6.375%, 2/1/30(4) | | 26,948 | $ 23,096,592 |
| 9.50%, 6/1/28(4) | | 4,439 | 4,365,542 |
| | | | $ 27,462,134 |
| Automotive & Auto Parts — 2.2% |
| Belron U.K. Finance PLC, 5.75%, 10/15/29(4) | | 18,960 | $ 19,011,382 |
| Clarios Global LP/Clarios U.S. Finance Co.: | | | |
| 4.375%, 5/15/26(5) | EUR | 23,968 | 26,073,470 |
| 8.50%, 5/15/27(4) | | 16,507 | 16,626,147 |
| Ford Motor Co., 4.75%, 1/15/43 | | 17,531 | 14,224,116 |
| Goodyear Tire & Rubber Co., 5.00%, 7/15/29 | | 13,448 | 12,187,208 |
| Real Hero Merger Sub 2, Inc., 6.25%, 2/1/29(4) | | 22,690 | 19,839,984 |
| Wand NewCo 3, Inc., 7.625%, 1/30/32(4) | | 17,454 | 18,053,346 |
| | | | $ 126,015,653 |
1
See Notes to Financial Statements.
Eaton Vance
Income Fund of Boston
October 31, 2024
Portfolio of Investments — continued
| Security | Principal
Amount*
(000's omitted) | Value |
| Broadcasting — 0.4% |
| Playtika Holding Corp., 4.25%, 3/15/29(4) | | 14,461 | $ 13,060,786 |
| Townsquare Media, Inc., 6.875%, 2/1/26(4) | | 11,647 | 11,614,319 |
| | | | $ 24,675,105 |
| Building Materials — 2.6% |
| Builders FirstSource, Inc.: | | | |
| 4.25%, 2/1/32(4) | | 26,747 | $ 23,948,408 |
| 5.00%, 3/1/30(4) | | 8,286 | 7,923,911 |
| CP Atlas Buyer, Inc., 7.00%, 12/1/28(4) | | 21,533 | 19,731,655 |
| MIWD Holdco II LLC/MIWD Finance Corp., 5.50%, 2/1/30(4) | | 7,025 | 6,729,449 |
| Smyrna Ready Mix Concrete LLC, 6.00%, 11/1/28(4) | | 27,640 | 27,438,675 |
| Standard Industries, Inc.: | | | |
| 2.25%, 11/21/26(5) | EUR | 2,250 | 2,369,774 |
| 3.375%, 1/15/31(4) | | 15,417 | 13,397,524 |
| 4.375%, 7/15/30(4) | | 21,439 | 19,717,296 |
| 4.75%, 1/15/28(4) | | 5,450 | 5,261,435 |
| 6.50%, 8/15/32(4) | | 7,140 | 7,191,022 |
| Summit Materials LLC/Summit Materials Finance Corp., 7.25%, 1/15/31(4) | | 13,383 | 13,918,521 |
| | | | $ 147,627,670 |
| Cable & Satellite TV — 1.9% |
| CCO Holdings LLC/CCO Holdings Capital Corp.: | | | |
| 4.25%, 2/1/31(4) | | 11,207 | $ 9,734,871 |
| 4.50%, 8/15/30(4) | | 47,451 | 42,419,481 |
| 4.75%, 3/1/30(4) | | 12,571 | 11,445,889 |
| 5.375%, 6/1/29(4) | | 4,814 | 4,599,202 |
| 6.375%, 9/1/29(4) | | 18,913 | 18,740,580 |
| CSC Holdings LLC, 11.75%, 1/31/29(4) | | 5,269 | 5,143,412 |
| Directv Financing LLC/Directv Financing Co-Obligor, Inc., 5.875%, 8/15/27(4) | | 3,515 | 3,388,255 |
| DISH Network Corp., 11.75%, 11/15/27(4) | | 11,514 | 12,128,728 |
| | | | $ 107,600,418 |
| Capital Goods — 2.7% |
| Arcosa, Inc., 6.875%, 8/15/32(4) | | 11,164 | $ 11,468,844 |
| Calderys Financing II LLC, 11.75%, (11.75% cash or 12.50% PIK), 6/1/28(4)(6) | | 14,105 | 14,278,477 |
| Calderys Financing LLC, 11.25%, 6/1/28(4) | | 23,813 | 25,461,431 |
| Chart Industries, Inc., 9.50%, 1/1/31(4) | | 19,416 | 20,892,548 |
| Dornoch Debt Merger Sub, Inc., 6.625%, 10/15/29(4) | | 13,152 | 11,022,828 |
| EMRLD Borrower LP/Emerald Co-Issuer, Inc., 6.625%, 12/15/30(4) | | 18,065 | 18,395,102 |
| Security | Principal
Amount*
(000's omitted) | Value |
| Capital Goods (continued) |
| ESAB Corp., 6.25%, 4/15/29(4) | | 11,457 | $ 11,673,063 |
| Madison IAQ LLC, 5.875%, 6/30/29(4) | | 16,182 | 15,363,799 |
| Patrick Industries, Inc.: | | | |
| 4.75%, 5/1/29(4) | | 14,923 | 14,128,965 |
| 6.375%, 11/1/32(4) | | 10,450 | 10,343,623 |
| 7.50%, 10/15/27(4) | | 2,155 | 2,152,304 |
| | | | $ 155,180,984 |
| Chemicals — 2.1% |
| Avient Corp.: | | | |
| 6.25%, 11/1/31(4) | | 9,447 | $ 9,480,868 |
| 7.125%, 8/1/30(4) | | 18,444 | 18,985,866 |
| Compass Minerals International, Inc., 6.75%, 12/1/27(4) | | 18,708 | 18,458,295 |
| Nufarm Australia Ltd./Nufarm Americas, Inc., 5.00%, 1/27/30(4) | | 18,423 | 17,088,440 |
| Olympus Water U.S. Holding Corp., 9.75%, 11/15/28(4) | | 25,901 | 27,510,981 |
| SNF Group SACA: | | | |
| 2.625%, 2/1/29(5) | EUR | 13,094 | 13,539,606 |
| 2.625%, 2/1/29(4) | EUR | 1,150 | 1,189,136 |
| Valvoline, Inc., 3.625%, 6/15/31(4) | | 16,879 | 14,644,250 |
| | | | $ 120,897,442 |
| Consumer Products — 1.4% |
| Acushnet Co., 7.375%, 10/15/28(4) | | 11,589 | $ 12,095,694 |
| Edgewell Personal Care Co., 4.125%, 4/1/29(4) | | 13,670 | 12,775,404 |
| Masterbrand, Inc., 7.00%, 7/15/32(4) | | 22,871 | 23,451,672 |
| Spectrum Brands, Inc., 3.875%, 3/15/31(4) | | 2,728 | 2,402,296 |
| Tempur Sealy International, Inc.: | | | |
| 3.875%, 10/15/31(4) | | 25,171 | 21,922,157 |
| 4.00%, 4/15/29(4) | | 6,005 | 5,539,338 |
| | | | $ 78,186,561 |
| Containers — 1.7% |
| Ardagh Metal Packaging Finance USA LLC/Ardagh Metal Packaging Finance PLC: | | | |
| 3.00%, 9/1/29(5) | EUR | 10,550 | $ 9,989,133 |
| 4.00%, 9/1/29(4) | | 11,917 | 10,464,995 |
| Berry Global, Inc., 5.625%, 7/15/27(4) | | 9,830 | 9,821,856 |
| Canpack SA/Canpack U.S. LLC, 3.875%, 11/15/29(4) | | 16,134 | 14,691,773 |
| Crown Americas LLC/Crown Americas Capital Corp. V, 4.25%, 9/30/26 | | 5,005 | 4,903,784 |
| Crown Americas LLC/Crown Americas Capital Corp. VI, 4.75%, 2/1/26 | | 5,705 | 5,667,864 |
2
See Notes to Financial Statements.
Eaton Vance
Income Fund of Boston
October 31, 2024
Portfolio of Investments — continued
| Security | Principal
Amount*
(000's omitted) | Value |
| Containers (continued) |
| Owens-Brockway Glass Container, Inc., 7.25%, 5/15/31(4) | | 14,712 | $ 14,488,010 |
| Trivium Packaging Finance BV: | | | |
| 5.50%, 8/15/26(4) | | 15,300 | 15,179,612 |
| 8.50%, 8/15/27(4) | | 8,340 | 8,324,258 |
| | | | $ 93,531,285 |
| Diversified Financial Services — 3.3% |
| Ally Financial, Inc., Series B, 4.70% to 5/15/26(7)(8) | | 15,568 | $ 14,053,873 |
| Boost Newco Borrower LLC, 7.50%, 1/15/31(4) | | 13,523 | 14,269,195 |
| Cargo Aircraft Management, Inc., 4.75%, 2/1/28(4) | | 16,250 | 15,519,630 |
| CI Financial Corp., 4.10%, 6/15/51 | | 12,900 | 9,026,262 |
| Compass Group Diversified Holdings LLC, 5.25%, 4/15/29(4) | | 22,787 | 21,931,613 |
| Focus Financial Partners LLC, 6.75%, 9/15/31(4) | | 12,245 | 12,173,246 |
| Hightower Holding LLC, 9.125%, 1/31/30(4) | | 15,204 | 16,041,877 |
| Jane Street Group/JSG Finance, Inc.: | | | |
| 4.50%, 11/15/29(4) | | 9,971 | 9,441,328 |
| 6.125%, 11/1/32(4) | | 14,480 | 14,498,422 |
| Macquarie Airfinance Holdings Ltd.: | | | |
| 6.50%, 3/26/31(4) | | 5,835 | 6,067,029 |
| 8.125%, 3/30/29(4) | | 15,828 | 16,758,006 |
| Rocket Mortgage LLC/Rocket Mortgage Co-Issuer, Inc.: | | | |
| 2.875%, 10/15/26(4) | | 5,450 | 5,190,963 |
| 3.625%, 3/1/29(4) | | 20,814 | 19,189,669 |
| 4.00%, 10/15/33(4) | | 2,160 | 1,864,798 |
| Shift4 Payments LLC/Shift4 Payments Finance Sub, Inc., 6.75%, 8/15/32(4) | | 11,559 | 11,868,076 |
| | | | $ 187,893,987 |
| Diversified Media — 1.9% |
| Arches Buyer, Inc.: | | | |
| 4.25%, 6/1/28(4) | | 6,084 | $ 5,585,413 |
| 6.125%, 12/1/28(4) | | 20,463 | 18,033,008 |
| Cars.com, Inc., 6.375%, 11/1/28(4) | | 15,581 | 15,548,599 |
| Clear Channel Outdoor Holdings, Inc.: | | | |
| 7.75%, 4/15/28(4) | | 21,045 | 18,753,547 |
| 7.875%, 4/1/30(4) | | 12,711 | 12,970,915 |
| Match Group Holdings II LLC, 3.625%, 10/1/31(4) | | 18,618 | 16,328,129 |
| Stagwell Global LLC, 5.625%, 8/15/29(4) | | 20,322 | 19,346,530 |
| | | | $ 106,566,141 |
| Security | Principal
Amount*
(000's omitted) | Value |
| Energy — 8.5% |
| Aethon United BR LP/Aethon United Finance Corp., 7.50%, 10/1/29(4) | | 15,375 | $ 15,492,127 |
| Antero Midstream Partners LP/Antero Midstream Finance Corp., 5.75%, 3/1/27(4) | | 19,185 | 19,163,726 |
| Civitas Resources, Inc., 8.625%, 11/1/30(4) | | 20,287 | 21,329,995 |
| DT Midstream, Inc., 4.125%, 6/15/29(4) | | 13,861 | 13,026,541 |
| Energy Transfer LP, 5.00%, 5/15/50 | | 13,980 | 12,145,733 |
| EQM Midstream Partners LP: | | | |
| 4.50%, 1/15/29(4) | | 14,598 | 14,063,388 |
| 4.75%, 1/15/31(4) | | 11,843 | 11,267,394 |
| 6.00%, 7/1/25(4) | | 2,469 | 2,473,627 |
| 6.50%, 7/1/27(4) | | 6,808 | 6,968,839 |
| 7.50%, 6/1/30(4) | | 10,115 | 10,885,540 |
| Expand Energy Corp., 4.75%, 2/1/32 | | 16,541 | 15,556,655 |
| Global Partners LP/GLP Finance Corp., 8.25%, 1/15/32(4) | | 13,576 | 13,863,282 |
| Kinetik Holdings LP, 5.875%, 6/15/30(4) | | 17,417 | 17,297,808 |
| Matador Resources Co., 6.50%, 4/15/32(4) | | 14,740 | 14,608,975 |
| Parkland Corp.: | | | |
| 4.50%, 10/1/29(4) | | 4,984 | 4,633,905 |
| 4.625%, 5/1/30(4) | | 16,642 | 15,310,179 |
| Permian Resources Operating LLC: | | | |
| 5.875%, 7/1/29(4) | | 18,688 | 18,438,153 |
| 6.25%, 2/1/33(4) | | 9,920 | 9,855,269 |
| 7.00%, 1/15/32(4) | | 12,443 | 12,703,034 |
| Plains All American Pipeline LP, Series B, 9.49%, (3 mo. SOFR + 4.372%)(7)(9) | | 19,633 | 19,601,560 |
| Precision Drilling Corp.: | | | |
| 6.875%, 1/15/29(4) | | 7,736 | 7,703,052 |
| 7.125%, 1/15/26(4) | | 2,962 | 2,960,037 |
| SM Energy Co., 7.00%, 8/1/32(4) | | 11,275 | 11,190,796 |
| Sunoco LP, 7.25%, 5/1/32(4) | | 11,440 | 11,918,547 |
| Sunoco LP/Sunoco Finance Corp.: | | | |
| 4.50%, 5/15/29 | | 4,087 | 3,888,983 |
| 4.50%, 4/30/30 | | 18,621 | 17,489,959 |
| Superior Plus LP/Superior General Partner, Inc., 4.50%, 3/15/29(4) | | 17,650 | 16,299,899 |
| Transocean Poseidon Ltd., 6.875%, 2/1/27(4) | | 5,266 | 5,267,176 |
| Transocean, Inc., 8.75%, 2/15/30(4) | | 5,354 | 5,551,097 |
| Venture Global LNG, Inc.: | | | |
| 7.00%, 1/15/30(4) | | 8,540 | 8,598,606 |
| 8.125%, 6/1/28(4) | | 11,255 | 11,688,182 |
| 8.375%, 6/1/31(4) | | 18,041 | 18,752,627 |
| 9.00% to 9/30/29(4)(7)(8) | | 23,781 | 23,794,439 |
| 9.50%, 2/1/29(4) | | 16,364 | 18,097,438 |
| 9.875%, 2/1/32(4) | | 15,583 | 17,019,005 |
3
See Notes to Financial Statements.
Eaton Vance
Income Fund of Boston
October 31, 2024
Portfolio of Investments — continued
| Security | Principal
Amount*
(000's omitted) | Value |
| Energy (continued) |
| Vital Energy, Inc.: | | | |
| 7.875%, 4/15/32(4) | | 7,611 | $ 7,319,060 |
| 9.75%, 10/15/30 | | 10,446 | 11,031,644 |
| Weatherford International Ltd., 8.625%, 4/30/30(4) | | 12,836 | 13,276,985 |
| | | | $ 480,533,262 |
| Entertainment & Film — 0.5% |
| Cinemark USA, Inc.: | | | |
| 5.25%, 7/15/28(4) | | 16,425 | $ 16,134,036 |
| 7.00%, 8/1/32(4) | | 10,685 | 10,960,994 |
| | | | $ 27,095,030 |
| Environmental — 1.7% |
| Clean Harbors, Inc.: | | | |
| 4.875%, 7/15/27(4) | | 4,475 | $ 4,410,586 |
| 5.125%, 7/15/29(4) | | 4,845 | 4,718,313 |
| 6.375%, 2/1/31(4) | | 6,311 | 6,364,442 |
| GFL Environmental, Inc.: | | | |
| 3.50%, 9/1/28(4) | | 19,165 | 17,984,105 |
| 3.75%, 8/1/25(4) | | 7,805 | 7,733,610 |
| 4.75%, 6/15/29(4) | | 28,603 | 27,411,159 |
| Reworld Holding Corp.: | | | |
| 4.875%, 12/1/29(4) | | 11,831 | 11,060,802 |
| 5.00%, 9/1/30 | | 7,210 | 6,641,538 |
| Wrangler Holdco Corp., 6.625%, 4/1/32(4) | | 7,150 | 7,308,358 |
| | | | $ 93,632,913 |
| Food & Drug Retail — 0.8% |
| Albertsons Cos., Inc./Safeway, Inc./New Albertsons LP/Albertsons LLC: | | | |
| 4.875%, 2/15/30(4) | | 17,635 | $ 17,194,256 |
| 5.875%, 2/15/28(4) | | 8,075 | 8,095,260 |
| 7.50%, 3/15/26(4) | | 4,400 | 4,454,296 |
| Ingles Markets, Inc., 4.00%, 6/15/31(4) | | 16,982 | 15,170,868 |
| | | | $ 44,914,680 |
| Food, Beverage & Tobacco — 4.4% |
| BellRing Brands, Inc., 7.00%, 3/15/30(4) | | 16,072 | $ 16,743,392 |
| CD&R Smokey Buyer, Inc./Radio Systems Corp., 9.50%, 10/15/29(4) | | 14,085 | 14,284,584 |
| Cerdia Finanz GmbH, 9.375%, 10/3/31(4) | | 13,855 | 14,283,812 |
| Chobani Holdco II LLC, 8.75%, (8.75% cash or 9.50% PIK), 10/1/29(4)(6) | | 25,951 | 26,837,139 |
| Chobani LLC/Chobani Finance Corp., Inc.: | | | |
| 4.625%, 11/15/28(4) | | 13,343 | 12,825,534 |
| Security | Principal
Amount*
(000's omitted) | Value |
| Food, Beverage & Tobacco (continued) |
Chobani LLC/Chobani Finance Corp., Inc.:
(continued) | | | |
| 7.625%, 7/1/29(4) | | 23,546 | $ 24,576,594 |
| Darling Ingredients, Inc., 6.00%, 6/15/30(4) | | 12,596 | 12,519,847 |
| Performance Food Group, Inc.: | | | |
| 4.25%, 8/1/29(4) | | 26,257 | 24,602,764 |
| 6.125%, 9/15/32(4) | | 9,990 | 10,044,286 |
| Pilgrim's Pride Corp.: | | | |
| 3.50%, 3/1/32 | | 22,122 | 19,377,014 |
| 6.875%, 5/15/34 | | 7,650 | 8,321,548 |
| Post Holdings, Inc., 6.25%, 2/15/32(4) | | 11,918 | 12,065,283 |
| Triton Water Holdings, Inc., 6.25%, 4/1/29(4) | | 20,339 | 20,112,245 |
| U.S. Foods, Inc., 4.75%, 2/15/29(4) | | 17,581 | 16,955,727 |
| Viking Baked Goods Acquisition Corp., 8.625%, 11/1/31(4)(10) | | 13,205 | 13,195,972 |
| | | | $ 246,745,741 |
| Gaming — 2.6% |
| Allwyn Entertainment Financing U.K. PLC, 7.875%, 4/30/29(4) | | 20,191 | $ 20,928,072 |
| Caesars Entertainment, Inc.: | | | |
| 4.625%, 10/15/29(4) | | 5,760 | 5,403,835 |
| 6.00%, 10/15/32(4) | | 11,360 | 11,088,299 |
| 6.50%, 2/15/32(4) | | 10,640 | 10,796,834 |
| 7.00%, 2/15/30(4) | | 7,130 | 7,314,220 |
| 8.125%, 7/1/27(4) | | 8,749 | 8,926,115 |
| Churchill Downs, Inc., 5.75%, 4/1/30(4) | | 17,060 | 16,808,735 |
| Genting New York LLC/GENNY Capital, Inc., 7.25%, 10/1/29(4) | | 13,915 | 14,135,284 |
| International Game Technology PLC: | | | |
| 5.25%, 1/15/29(4) | | 11,610 | 11,415,513 |
| 6.25%, 1/15/27(4) | | 10,967 | 11,083,579 |
| Jacobs Entertainment, Inc., 6.75%, 2/15/29(4) | | 8,351 | 8,226,284 |
| Light & Wonder International, Inc., 7.00%, 5/15/28(4) | | 18,466 | 18,558,699 |
| | | | $ 144,685,469 |
| Healthcare — 8.5% |
| AHP Health Partners, Inc., 5.75%, 7/15/29(4) | | 6,189 | $ 6,004,923 |
| AMN Healthcare, Inc.: | | | |
| 4.00%, 4/15/29(4) | | 12,403 | 11,441,620 |
| 4.625%, 10/1/27(4) | | 1,570 | 1,514,085 |
| athenahealth Group, Inc., 6.50%, 2/15/30(4) | | 39,384 | 37,275,483 |
| Avantor Funding, Inc., 3.875%, 7/15/28(5) | EUR | 10,850 | 11,774,735 |
| CHS/Community Health Systems, Inc., 6.875%, 4/15/29(4) | | 13,290 | 11,237,415 |
4
See Notes to Financial Statements.
Eaton Vance
Income Fund of Boston
October 31, 2024
Portfolio of Investments — continued
| Security | Principal
Amount*
(000's omitted) | Value |
| Healthcare (continued) |
| Endo Finance Holdings, Inc., 8.50%, 4/15/31(4) | | 14,311 | $ 15,319,526 |
| Fortrea Holdings, Inc., 7.50%, 7/1/30(4) | | 14,953 | 14,722,830 |
| HealthEquity, Inc., 4.50%, 10/1/29(4) | | 19,730 | 18,827,597 |
| Heartland Dental LLC/Heartland Dental Finance Corp., 10.50%, 4/30/28(4) | | 30,764 | 32,776,089 |
| IQVIA, Inc.: | | | |
| 2.25%, 3/15/29(5) | EUR | 6,633 | 6,805,654 |
| 5.00%, 5/15/27(4) | | 11,074 | 10,941,410 |
| 6.50%, 5/15/30(4) | | 8,363 | 8,598,368 |
| LifePoint Health, Inc.: | | | |
| 4.375%, 2/15/27(4) | | 7,557 | 7,333,128 |
| 5.375%, 1/15/29(4) | | 26,650 | 24,417,591 |
| 9.875%, 8/15/30(4) | | 8,380 | 9,177,197 |
| 10.00%, 6/1/32(4) | | 3,880 | 4,144,659 |
| Medline Borrower LP, 5.25%, 10/1/29(4) | | 45,264 | 43,881,908 |
| Molina Healthcare, Inc.: | | | |
| 3.875%, 11/15/30(4) | | 19,621 | 17,780,621 |
| 3.875%, 5/15/32(4) | | 8,251 | 7,321,990 |
| Option Care Health, Inc., 4.375%, 10/31/29(4) | | 20,983 | 19,329,661 |
| P&L Development LLC/PLD Finance Corp.: | | | |
| 7.75%, 11/15/25(4) | | 2,450 | 2,468,718 |
| 12.00%, (9.00% cash and 3.50% PIK or 12.00% cash), 5/15/29(4)(6) | | 8,053 | 8,125,180 |
| Perrigo Finance Unlimited Co.: | | | |
| 4.90%, 6/15/30 | | 18,023 | 17,074,776 |
| 4.90%, 12/15/44 | | 5,983 | 4,801,310 |
| Prestige Brands, Inc., 3.75%, 4/1/31(4) | | 8,014 | 7,149,860 |
| Surgery Center Holdings, Inc., 7.25%, 4/15/32(4) | | 13,400 | 13,775,924 |
| Team Health Holdings, Inc., 13.50%, (9.00% cash and 4.50% PIK), 6/30/28(4)(6) | | 15,400 | 17,363,738 |
| Tenet Healthcare Corp.: | | | |
| 4.375%, 1/15/30 | | 2,505 | 2,350,101 |
| 5.125%, 11/1/27 | | 12,794 | 12,695,366 |
| 6.125%, 10/1/28 | | 16,666 | 16,665,472 |
| 6.875%, 11/15/31 | | 9,134 | 9,803,997 |
| Teva Pharmaceutical Finance Netherlands III BV, 4.10%, 10/1/46 | | 35,125 | 24,800,905 |
| U.S. Acute Care Solutions LLC, 9.75%, 5/15/29(4) | | 17,668 | 18,043,023 |
| Varex Imaging Corp., 7.875%, 10/15/27(4) | | 6,765 | 6,895,930 |
| | | | $ 482,640,790 |
| Homebuilders & Real Estate — 3.4% |
| Artera Services LLC, 8.50%, 2/15/31(4) | | 15,935 | $ 15,807,995 |
| Ashton Woods USA LLC/Ashton Woods Finance Co.: | | | |
| 4.625%, 8/1/29(4) | | 7,522 | 7,037,478 |
| Security | Principal
Amount*
(000's omitted) | Value |
| Homebuilders & Real Estate (continued) |
Ashton Woods USA LLC/Ashton Woods Finance Co.:
(continued) | | | |
| 4.625%, 4/1/30(4) | | 11,328 | $ 10,442,368 |
| Brundage-Bone Concrete Pumping Holdings, Inc., 6.00%, 2/1/26(4) | | 11,203 | 11,158,367 |
| CTR Partnership LP/CareTrust Capital Corp., 3.875%, 6/30/28(4) | | 19,933 | 18,901,427 |
| Cushman & Wakefield U.S. Borrower LLC: | | | |
| 6.75%, 5/15/28(4) | | 13,307 | 13,390,954 |
| 8.875%, 9/1/31(4) | | 9,265 | 9,990,626 |
| Greystar Real Estate Partners LLC, 7.75%, 9/1/30(4) | | 21,967 | 23,038,440 |
| M/I Homes, Inc., 4.95%, 2/1/28 | | 11,706 | 11,352,345 |
| Outfront Media Capital LLC/Outfront Media Capital Corp.: | | | |
| 4.25%, 1/15/29(4) | | 5,875 | 5,514,360 |
| 4.625%, 3/15/30(4) | | 16,093 | 14,982,219 |
| 7.375%, 2/15/31(4) | | 14,940 | 15,790,908 |
| Pebblebrook Hotel LP/PEB Finance Corp., 6.375%, 10/15/29(4) | | 4,520 | 4,517,750 |
| TopBuild Corp., 4.125%, 2/15/32(4) | | 17,735 | 15,827,869 |
| VICI Properties LP/VICI Note Co., Inc.: | | | |
| 3.75%, 2/15/27(4) | | 2,441 | 2,361,657 |
| 4.50%, 9/1/26(4) | | 6,735 | 6,658,842 |
| 5.75%, 2/1/27(4) | | 4,084 | 4,115,614 |
| | | | $ 190,889,219 |
| Insurance — 1.5% |
| Alliant Holdings Intermediate LLC/Alliant Holdings Co-Issuer: | | | |
| 6.75%, 10/15/27(4) | | 33,823 | $ 33,726,435 |
| 7.00%, 1/15/31(4) | | 8,033 | 8,093,754 |
| 7.375%, 10/1/32(4) | | 2,645 | 2,625,349 |
| Jones Deslauriers Insurance Management, Inc., 10.50%, 12/15/30(4) | | 15,943 | 17,187,904 |
| Panther Escrow Issuer LLC, 7.125%, 6/1/31(4) | | 11,480 | 11,763,905 |
| Ryan Specialty LLC, 5.875%, 8/1/32(4) | | 10,135 | 10,110,015 |
| | | | $ 83,507,362 |
| Leisure — 3.5% |
| Boyne USA, Inc., 4.75%, 5/15/29(4) | | 14,335 | $ 13,681,611 |
| Carnival Corp., 6.00%, 5/1/29(4) | | 29,632 | 29,700,764 |
| Life Time, Inc.: | | | |
| 5.75%, 1/15/26(4) | | 13,785 | 13,786,035 |
| 8.00%, 4/15/26(4) | | 9,827 | 9,881,378 |
| NCL Corp. Ltd.: | | | |
| 5.875%, 3/15/26(4) | | 11,098 | 11,092,796 |
5
See Notes to Financial Statements.
Eaton Vance
Income Fund of Boston
October 31, 2024
Portfolio of Investments — continued
| Security | Principal
Amount*
(000's omitted) | Value |
| Leisure (continued) |
| NCL Corp. Ltd.: (continued) | | | |
| 5.875%, 2/15/27(4) | | 5,878 | $ 5,875,873 |
| 7.75%, 2/15/29(4) | | 15,105 | 16,036,556 |
| NCL Finance Ltd., 6.125%, 3/15/28(4) | | 10,638 | 10,711,849 |
| Royal Caribbean Cruises Ltd.: | | | |
| 3.70%, 3/15/28 | | 6,065 | 5,784,139 |
| 6.00%, 2/1/33(4) | | 11,770 | 11,849,627 |
| 6.25%, 3/15/32(4) | | 8,730 | 8,905,875 |
| Speedway Motorsports LLC/Speedway Funding II, Inc., 4.875%, 11/1/27(4) | | 15,199 | 14,866,713 |
| Viking Cruises Ltd.: | | | |
| 5.875%, 9/15/27(4) | | 25,312 | 25,168,022 |
| 6.25%, 5/15/25(4) | | 9,480 | 9,489,496 |
| 7.00%, 2/15/29(4) | | 7,222 | 7,283,892 |
| Viking Ocean Cruises Ship VII Ltd., 5.625%, 2/15/29(4) | | 4,638 | 4,577,635 |
| | | | $ 198,692,261 |
| Metals & Mining — 2.6% |
| Arsenal AIC Parent LLC, 11.50%, 10/1/31(4) | | 32,777 | $ 36,513,217 |
| Eldorado Gold Corp., 6.25%, 9/1/29(4) | | 14,223 | 14,007,076 |
| First Quantum Minerals Ltd., 9.375%, 3/1/29(4) | | 18,155 | 19,324,236 |
| Freeport-McMoRan, Inc., 5.45%, 3/15/43 | | 13,849 | 13,303,517 |
| Hudbay Minerals, Inc.: | | | |
| 4.50%, 4/1/26(4) | | 9,850 | 9,736,175 |
| 6.125%, 4/1/29(4) | | 5,978 | 6,026,769 |
| New Gold, Inc., 7.50%, 7/15/27(4) | | 13,412 | 13,638,556 |
| Novelis Corp.: | | | |
| 3.25%, 11/15/26(4) | | 7,535 | 7,255,027 |
| 4.75%, 1/30/30(4) | | 16,882 | 15,829,193 |
| Roller Bearing Co. of America, Inc., 4.375%, 10/15/29(4) | | 15,218 | 14,317,632 |
| | | | $ 149,951,398 |
| Paper — 0.0%(11) |
| Enviva Partners LP/Enviva Partners Finance Corp., 6.50%, 1/15/26(4)(12) | | 9,257 | $ 2,360,535 |
| Enviva, Inc., 8.00%, 12/16/24 | | 35 | 56,409 |
| | | | $ 2,416,944 |
| Publishing & Printing — 0.7% |
| Cimpress PLC, 7.375%, 9/15/32(4) | | 9,135 | $ 9,004,773 |
| McGraw-Hill Education, Inc.: | | | |
| 5.75%, 8/1/28(4) | | 4,755 | 4,665,294 |
| 7.375%, 9/1/31(4) | | 7,785 | 7,980,349 |
| Security | Principal
Amount*
(000's omitted) | Value |
| Publishing & Printing (continued) |
| McGraw-Hill Education, Inc.: (continued) | | | |
| 8.00%, 8/1/29(4) | | 19,785 | $ 19,933,839 |
| | | | $ 41,584,255 |
| Railroad — 0.2% |
| Watco Cos. LLC/Watco Finance Corp., 7.125%, 8/1/32(4) | | 12,165 | $ 12,552,334 |
| | | | $ 12,552,334 |
| Restaurant — 1.5% |
| 1011778 BC ULC/New Red Finance, Inc.: | | | |
| 3.875%, 1/15/28(4) | | 18,605 | $ 17,747,939 |
| 4.00%, 10/15/30(4) | | 23,200 | 20,975,810 |
| 4.375%, 1/15/28(4) | | 8,402 | 8,088,729 |
| Raising Cane's Restaurants LLC, 9.375%, 5/1/29(4) | | 18,056 | 19,430,567 |
| Yum! Brands, Inc., 3.625%, 3/15/31 | | 17,756 | 16,098,357 |
| | | | $ 82,341,402 |
| Services — 6.4% |
| Adtalem Global Education, Inc., 5.50%, 3/1/28(4) | | 17,818 | $ 17,461,305 |
| Allied Universal Holdco LLC, 7.875%, 2/15/31(4) | | 6,425 | 6,544,107 |
| Allied Universal Holdco LLC/Allied Universal Finance Corp.: | | | |
| 6.00%, 6/1/29(4) | | 13,038 | 11,942,694 |
| 9.75%, 7/15/27(4) | | 15,748 | 15,796,882 |
| Allied Universal Holdco LLC/Allied Universal Finance Corp./Atlas Luxco 4 SARL, 4.625%, 6/1/28(4) | | 12,722 | 11,924,652 |
| APi Group DE, Inc., 4.75%, 10/15/29(4) | | 15,963 | 15,164,558 |
| BCPE Empire Holdings, Inc., 7.625%, 5/1/27(4) | | 20,053 | 20,192,108 |
| Clarivate Science Holdings Corp., 4.875%, 7/1/29(4) | | 15,626 | 14,783,307 |
| EquipmentShare.com, Inc., 8.625%, 5/15/32(4) | | 7,421 | 7,664,876 |
| Gartner, Inc.: | | | |
| 3.625%, 6/15/29(4) | | 4,186 | 3,910,580 |
| 4.50%, 7/1/28(4) | | 8,049 | 7,861,068 |
| Imola Merger Corp., 4.75%, 5/15/29(4) | | 28,747 | 27,816,839 |
| Korn Ferry, 4.625%, 12/15/27(4) | | 14,068 | 13,729,065 |
| Neptune Bidco U.S., Inc., 9.29%, 4/15/29(4) | | 8,155 | 7,626,831 |
| NESCO Holdings II, Inc., 5.50%, 4/15/29(4) | | 15,655 | 14,584,463 |
| Ritchie Bros Holdings, Inc.: | | | |
| 6.75%, 3/15/28(4) | | 11,000 | 11,293,373 |
| 7.75%, 3/15/31(4) | | 4,087 | 4,311,135 |
| Specialty Building Products Holdings LLC/SBP Finance Corp., 7.75%, 10/15/29(4) | | 15,442 | 15,762,904 |
| Summer BC Bidco B LLC, 5.50%, 10/31/26(4) | | 15,399 | 15,186,922 |
| VT Topco, Inc., 8.50%, 8/15/30(4) | | 22,802 | 24,019,764 |
6
See Notes to Financial Statements.
Eaton Vance
Income Fund of Boston
October 31, 2024
Portfolio of Investments — continued
| Security | Principal
Amount*
(000's omitted) | Value |
| Services (continued) |
| WASH Multifamily Acquisition, Inc., 5.75%, 4/15/26(4) | | 26,713 | $ 26,674,838 |
| WESCO Distribution, Inc.: | | | |
| 6.375%, 3/15/29(4) | | 8,758 | 8,947,497 |
| 6.625%, 3/15/32(4) | | 8,812 | 9,041,069 |
| 7.25%, 6/15/28(4) | | 8,696 | 8,907,713 |
| White Cap Buyer LLC, 6.875%, 10/15/28(4) | | 12,285 | 12,336,363 |
| White Cap Parent LLC, 8.25%, (8.25% cash or 9.00% PIK), 3/15/26(4)(6) | | 9,274 | 9,291,389 |
| Windsor Holdings III LLC, 8.50%, 6/15/30(4) | | 20,912 | 22,034,193 |
| | | | $ 364,810,495 |
| Steel — 0.7% |
| Allegheny Ludlum LLC, 6.95%, 12/15/25 | | 9,369 | $ 9,545,072 |
| ATI, Inc., 5.875%, 12/1/27 | | 2,697 | 2,677,917 |
| Cleveland-Cliffs, Inc., 7.375%, 5/1/33(4) | | 13,980 | 14,096,172 |
| TMS International Corp., 6.25%, 4/15/29(4) | | 13,149 | 12,733,891 |
| | | | $ 39,053,052 |
| Super Retail — 3.6% |
| Asbury Automotive Group, Inc.: | | | |
| 4.625%, 11/15/29(4) | | 5,684 | $ 5,326,708 |
| 4.75%, 3/1/30 | | 9,195 | 8,660,599 |
| 5.00%, 2/15/32(4) | | 2,378 | 2,192,461 |
| Bath & Body Works, Inc.: | | | |
| 6.75%, 7/1/36 | | 4,233 | 4,261,188 |
| 6.875%, 11/1/35 | | 1,827 | 1,856,849 |
| 6.95%, 3/1/33 | | 10,748 | 10,671,151 |
| 9.375%, 7/1/25(4) | | 1,749 | 1,793,246 |
| Cougar JV Subsidiary LLC, 8.00%, 5/15/32(4) | | 17,820 | 18,645,280 |
| Evergreen AcqCo 1 LP/TVI, Inc., 9.75%, 4/26/28(4) | | 13,455 | 14,170,712 |
| Group 1 Automotive, Inc.: | | | |
| 4.00%, 8/15/28(4) | | 11,459 | 10,768,368 |
| 6.375%, 1/15/30(4) | | 4,810 | 4,843,591 |
| Ken Garff Automotive LLC, 4.875%, 9/15/28(4) | | 7,899 | 7,667,561 |
| LCM Investments Holdings II LLC: | | | |
| 4.875%, 5/1/29(4) | | 15,122 | 14,302,828 |
| 8.25%, 8/1/31(4) | | 2,693 | 2,814,557 |
| Lithia Motors, Inc.: | | | |
| 3.875%, 6/1/29(4) | | 7,149 | 6,567,151 |
| 4.375%, 1/15/31(4) | | 10,684 | 9,784,503 |
| 4.625%, 12/15/27(4) | | 4,222 | 4,100,068 |
| Mavis Tire Express Services Topco Corp., 6.50%, 5/15/29(4) | | 29,052 | 27,866,934 |
| Security | Principal
Amount*
(000's omitted) | Value |
| Super Retail (continued) |
| NMG Holding Co., Inc./Neiman Marcus Group LLC, 8.50%, 10/1/28(4) | | 14,068 | $ 14,315,700 |
| PetSmart, Inc./PetSmart Finance Corp., 4.75%, 2/15/28(4) | | 11,241 | 10,698,484 |
| Sonic Automotive, Inc.: | | | |
| 4.625%, 11/15/29(4) | | 12,675 | 11,649,322 |
| 4.875%, 11/15/31(4) | | 10,294 | 9,264,807 |
| | | | $ 202,222,068 |
| Technology — 3.1% |
| Ciena Corp., 4.00%, 1/31/30(4) | | 14,395 | $ 13,295,406 |
| Cloud Software Group, Inc.: | | | |
| 6.50%, 3/31/29(4) | | 10,020 | 9,793,836 |
| 9.00%, 9/30/29(4) | | 28,076 | 28,095,068 |
| Coherent Corp., 5.00%, 12/15/29(4) | | 12,195 | 11,708,866 |
| Fair Isaac Corp., 4.00%, 6/15/28(4) | | 14,364 | 13,654,100 |
| Insight Enterprises, Inc., 6.625%, 5/15/32(4) | | 13,605 | 13,919,629 |
| McAfee Corp., 7.375%, 2/15/30(4) | | 21,727 | 20,964,665 |
| ON Semiconductor Corp., 3.875%, 9/1/28(4) | | 15,579 | 14,624,391 |
| Seagate HDD Cayman: | | | |
| 4.091%, 6/1/29 | | 3,723 | 3,513,410 |
| 9.625%, 12/1/32 | | 7,787 | 8,881,361 |
| Sensata Technologies, Inc.: | | | |
| 3.75%, 2/15/31(4) | | 16,844 | 15,047,688 |
| 6.625%, 7/15/32(4) | | 4,540 | 4,603,676 |
| VM Consolidated, Inc., 5.50%, 4/15/29(4) | | 20,362 | 19,710,149 |
| | | | $ 177,812,245 |
| Telecommunications — 2.4% |
| Altice Financing SA: | | | |
| 5.00%, 1/15/28(4) | | 8,859 | $ 7,500,790 |
| 5.75%, 8/15/29(4) | | 5,699 | 4,680,478 |
| Connect Finco SARL/Connect U.S. Finco LLC, 9.00%, 9/15/29(4) | | 20,715 | 19,701,999 |
| Iliad Holding SASU: | | | |
| 6.50%, 10/15/26(4) | | 7,127 | 7,189,518 |
| 7.00%, 10/15/28(4) | | 5,008 | 5,076,637 |
| 8.50%, 4/15/31(4) | | 7,595 | 8,096,696 |
| Sable International Finance Ltd., 7.125%, 10/15/32(4) | | 6,451 | 6,489,287 |
| Virgin Media Finance PLC, 5.00%, 7/15/30(4) | | 5,964 | 5,134,344 |
| Virgin Media Vendor Financing Notes III DAC, 4.875%, 7/15/28(5) | GBP | 7,258 | 8,744,660 |
| Virgin Media Vendor Financing Notes IV DAC, 5.00%, 7/15/28(4) | | 12,243 | 11,747,659 |
7
See Notes to Financial Statements.
Eaton Vance
Income Fund of Boston
October 31, 2024
Portfolio of Investments — continued
| Security | Principal
Amount*
(000's omitted) | Value |
| Telecommunications (continued) |
| Vmed O2 U.K. Financing I PLC: | | | |
| 4.75%, 7/15/31(4) | | 10,402 | $ 9,018,484 |
| 7.75%, 4/15/32(4) | | 7,260 | 7,277,838 |
| Zegona Finance PLC, 8.625%, 7/15/29(4) | | 19,466 | 20,609,628 |
| Ziggo Bond Co. BV, 5.125%, 2/28/30(4) | | 9,186 | 8,323,451 |
| Ziggo BV, 4.875%, 1/15/30(4) | | 5,796 | 5,380,135 |
| | | | $ 134,971,604 |
| Transport Excluding Air & Rail — 0.3% |
| Seaspan Corp., 5.50%, 8/1/29(4) | | 19,919 | $ 18,965,659 |
| | | | $ 18,965,659 |
| Utility — 4.9% |
| Alpha Generation LLC, 6.75%, 10/15/32(4) | | 23,638 | $ 23,984,963 |
| Atlantica Sustainable Infrastructure PLC, 4.125%, 6/15/28(4) | | 6,935 | 6,617,520 |
| California Buyer Ltd./Atlantica Sustainable Infrastructure PLC, 6.375%, 2/15/32(4)(10) | | 11,535 | 11,462,492 |
| Calpine Corp.: | | | |
| 4.50%, 2/15/28(4) | | 8,929 | 8,605,667 |
| 5.00%, 2/1/31(4) | | 12,773 | 12,068,099 |
| 5.125%, 3/15/28(4) | | 12,610 | 12,335,859 |
| 5.25%, 6/1/26(4) | | 883 | ��� 877,724 |
| Ferrellgas LP/Ferrellgas Finance Corp., 5.875%, 4/1/29(4) | | 15,872 | 14,830,280 |
| Leeward Renewable Energy Operations LLC, 4.25%, 7/1/29(4) | | 9,063 | 8,487,439 |
| NRG Energy, Inc.: | | | |
| 3.375%, 2/15/29(4) | | 7,148 | 6,523,614 |
| 3.625%, 2/15/31(4) | | 11,913 | 10,558,815 |
| 3.875%, 2/15/32(4) | | 9,445 | 8,394,272 |
| 5.25%, 6/15/29(4) | | 5,370 | 5,251,652 |
| 6.00%, 2/1/33(4) | | 12,525 | 12,463,503 |
| 6.25%, 11/1/34(4) | | 8,345 | 8,341,429 |
| 10.25% to 3/15/28(4)(7)(8) | | 16,715 | 18,461,433 |
| Pattern Energy Operations LP/Pattern Energy Operations, Inc., 4.50%, 8/15/28(4) | | 11,699 | 11,163,495 |
| Suburban Propane Partners LP/Suburban Energy Finance Corp., 5.00%, 6/1/31(4) | | 13,481 | 12,378,898 |
| TerraForm Power Operating LLC: | | | |
| 4.75%, 1/15/30(4) | | 5,450 | 5,090,492 |
| 5.00%, 1/31/28(4) | | 15,022 | 14,689,351 |
| TransAlta Corp., 7.75%, 11/15/29 | | 15,091 | 15,948,969 |
| Vistra Operations Co. LLC: | | | |
| 4.375%, 5/1/29(4) | | 10,260 | 9,774,674 |
| Security | Principal
Amount*
(000's omitted) | Value |
| Utility (continued) |
| Vistra Operations Co. LLC: (continued) | | | |
| 5.00%, 7/31/27(4) | | 23,679 | $ 23,382,290 |
| 6.875%, 4/15/32(4) | | 14,100 | 14,590,740 |
| | | | $ 276,283,670 |
Total Corporate Bonds
(identified cost $4,870,661,945) | | | $4,854,800,238 |
| Security | Principal
Amount/
Shares | Value |
| Insurance — 0.3% |
| AH Parent, Inc. (Alliant), Series A, 10% cash or 10.50% PIK(2)(3) | $ | 15,830,000 | $ 15,629,497 |
| | | | $ 15,629,497 |
| Services — 0.4% |
| WESCO International, Inc., Series A, 10.625% to 6/22/25(8) | | 1,031,479 | $ 26,818,454 |
| | | | $ 26,818,454 |
Total Preferred Stocks
(identified cost $44,266,450) | | | $ 42,447,951 |
| Senior Floating-Rate Loans — 7.8%(13) |
| Borrower/Description | Principal
Amount*
(000's omitted) | Value |
| Aerospace — 0.3% |
| TransDigm, Inc., Term Loan, 7.354%, (SOFR + 2.75%), 8/24/28 | | 14,850 | $ 14,902,787 |
| | | | $ 14,902,787 |
| Automotive & Auto Parts — 0.7% |
| Clarios Global LP: | | | |
| Term Loan, 6.102%, (EURIBOR + 3.00%), 7/16/31(14) | EUR | 27,305 | $ 29,694,833 |
| Term Loan, 7.185%, (SOFR + 2.50%), 5/6/30 | | 12,380 | 12,408,500 |
| | | | $ 42,103,333 |
8
See Notes to Financial Statements.
Eaton Vance
Income Fund of Boston
October 31, 2024
Portfolio of Investments — continued
| Borrower/Description | Principal
Amount*
(000's omitted) | Value |
| Broadcasting — 0.3% |
| ABG Intermediate Holdings 2 LLC: | | | |
| Term Loan, 7.447%, (SOFR + 2.75%), 12/21/28 | | 12,840 | $ 12,883,445 |
| Term Loan, 12/21/28(15) | | 1,670 | 1,675,413 |
| | | | $ 14,558,858 |
| Building Materials — 0.3% |
| Associated Materials, Inc., Term Loan, 10.685%, (SOFR + 6.00%), 3/8/29 | | 19,306 | $ 18,919,600 |
| | | | $ 18,919,600 |
| Capital Goods — 0.2% |
| EMRLD Borrower LP, Term Loan, 7.557%, (SOFR + 2.50%), 5/31/30 | | 12,156 | $ 12,166,217 |
| | | | $ 12,166,217 |
| Energy — 0.5% |
| Epic Y-Grade Services LP, Term Loan, 10.601%, (SOFR + 5.75%), 6/29/29 | | 24,749 | $ 24,754,791 |
| New Generation Gas Gathering LLC, Term Loan, 10.335%, (SOFR + 5.75%), 9/30/29 | | 6,716 | 6,560,078 |
| | | | $ 31,314,869 |
| Food, Beverage & Tobacco — 0.3% |
| Triton Water Holdings, Inc., Term Loan, 8.115%, (SOFR + 3.25%), 3/31/28 | | 17,297 | $ 17,332,433 |
| | | | $ 17,332,433 |
| Gaming — 0.5% |
| Peninsula Pacific Entertainment LLC, Term Loan, 13.00%, 12/24/29(1)(16) | | 11,315 | $ 11,315,275 |
| Spectacle Gary Holdings LLC, Term Loan, 9.035%, (SOFR + 4.25%), 12/11/28 | | 14,720 | 14,658,193 |
| | | | $ 25,973,468 |
| Healthcare — 1.0% |
| Endo Luxembourg Finance Co. I SARL, Term Loan, 9.245%, (SOFR + 4.50%), 4/23/31 | | 9,016 | $ 9,036,286 |
| Jazz Financing Lux SARL, Term Loan, 6.935%, (SOFR + 2.25%), 5/5/28 | | 10,864 | 10,876,256 |
| Pluto Acquisition I, Inc.: | | | |
| Term Loan, 10.253%, (SOFR + 5.50%), 6/20/28 | | 4,539 | 4,584,435 |
| Term Loan - Second Lien, 9.132%, (SOFR + 4.00%), 9/20/28 | | 12,938 | 11,951,103 |
| Team Health Holdings, Inc., Term Loan, 9.836%, (SOFR + 5.25%), 3/2/27(14) | | 20,133 | 19,750,262 |
| | | | $ 56,198,342 |
| Borrower/Description | Principal
Amount*
(000's omitted) | Value |
| Insurance — 0.5% |
| Truist Insurance Holdings LLC, Term Loan - Second Lien, 9.354%, (SOFR + 4.75%), 5/6/32 | | 28,356 | $ 28,816,785 |
| | | | $ 28,816,785 |
| Leisure — 0.4% |
| Peloton Interactive, Inc., Term Loan, 10.685%, (SOFR + 6.00%), 5/23/29 | | 20,097 | $ 20,406,462 |
| | | | $ 20,406,462 |
| Paper — 0.1% |
| Enviva Partners LP/Fin C: | | | |
| DIP Loan, 10.915%, (SOFR + 8.00%), 12/13/24(14)(17) | | 58 | $ 59,302 |
| DIP Loan, 11.025%, (SOFR + 8.00%), 12/13/24(17) | | 3,084 | 3,161,477 |
| Term Loan, 12.804%, (SOFR + 8.00%), 12/13/24 | | 1,851 | 3,007,259 |
| | | | $ 6,228,038 |
| Restaurant — 0.5% |
| IRB Holding Corp., Term Loan, 7.535%, (SOFR + 2.75%), 12/15/27 | | 29,442 | $ 29,469,545 |
| | | | $ 29,469,545 |
| Services — 0.3% |
| AlixPartners LLP, Term Loan, 7.30%, (SOFR + 2.50%), 2/4/28 | | 19,392 | $ 19,440,077 |
| | | | $ 19,440,077 |
| Super Retail — 0.9% |
| Hanesbrands, Inc., Term Loan, 6.785%, (SOFR + 2.00%), 11/19/26 | | 7,182 | $ 7,163,735 |
| Mavis Tire Express Services Corp., Term Loan, 8.185%, (SOFR + 3.50%), 5/4/28 | | 10,570 | 10,609,297 |
| Petco Health & Wellness Co., Inc., Term Loan, 8.115%, (SOFR + 3.25%), 3/3/28 | | 14,309 | 13,645,072 |
| PetSmart, Inc., Term Loan, 8.535%, (SOFR + 3.75%), 2/11/28 | | 18,308 | 18,218,439 |
| | | | $ 49,636,543 |
| Technology — 1.0% |
| Cloud Software Group, Inc., Term Loan, 8.604%, (SOFR + 4.00%), 3/30/29 | | 6,864 | $ 6,868,945 |
| Fortress Intermediate 3, Inc., Term Loan, 8.435%, (SOFR + 3.75%), 6/27/31 | | 32,145 | 32,175,152 |
9
See Notes to Financial Statements.
Eaton Vance
Income Fund of Boston
October 31, 2024
Portfolio of Investments — continued
| Borrower/Description | Principal
Amount*
(000's omitted) | Value |
| Technology (continued) |
| Riverbed Technology, Inc., Term Loan, 9.104%, (SOFR + 4.50%), 7.104% cash, 2.00% PIK, 7/1/28 | | 3,595 | $ 2,228,738 |
| Travelport Finance (Luxembourg) SARL, Term Loan, 12.855%, (SOFR + 8.26%), 9/30/28 | | 17,515 | 15,040,928 |
| | | | $ 56,313,763 |
Total Senior Floating-Rate Loans
(identified cost $442,948,913) | | | $ 443,781,120 |
| Security | Principal
Amount/
Shares | Value |
| Diversified Financial Services — 0.0% |
| ACC Claims Holdings LLC(1)(3) | | 11,599,560 | $ 0 |
| | | | $ 0 |
| Diversified Media — 0.0% |
| National CineMedia, Inc., Escrow Certificates(1)(3) | $ | 12,070,000 | $ 0 |
| | | | $ 0 |
| Gaming — 0.2% |
| PGP Investors, LLC, Membership Interests(1)(2)(3) | | 57,265 | $ 9,737,830 |
| | | | $ 9,737,830 |
| Healthcare — 0.0% |
| Endo Design LLC, Escrow Certificates(1)(3) | $ | 6,987,000 | $ 0 |
| Endo Luxembourg Finance SARL, Escrow Certificates(1)(3) | | 15,196,000 | 0 |
| | | | $ 0 |
| Services — 0.0%(11) |
| Hertz Corp., Escrow Certificates(3)(4) | $ | 3,679,000 | $ 634,628 |
| | | | $ 634,628 |
Total Miscellaneous
(identified cost $0) | | | $ 10,372,458 |
| Short-Term Investments — 3.5% |
| Security | Shares | Value |
| Morgan Stanley Institutional Liquidity Funds - Government Portfolio, Institutional Class, 4.78%(18) | | 199,166,329 | $ 199,166,329 |
Total Short-Term Investments
(identified cost $199,166,329) | | | $ 199,166,329 |
Total Investments — 98.9%
(identified cost $5,594,192,594) | | | $5,603,118,251 |
| Less Unfunded Loan Commitments — (0.0)%(11) | | | $ (628,445) |
Net Investments — 98.9%
(identified cost $5,593,564,149) | | | $5,602,489,806 |
| Other Assets, Less Liabilities — 1.1% | | | $ 60,642,795 |
| Net Assets — 100.0% | | | $5,663,132,601 |
| The percentage shown for each investment category in the Portfolio of Investments is based on net assets. |
| * | In U.S. dollars unless otherwise indicated. |
| (1) | For fair value measurement disclosure purposes, security is categorized as Level 3 (see Note 12). |
| (2) | Restricted security (see Note 8). |
| (3) | Non-income producing security. |
| (4) | Security exempt from registration under Rule 144A of the Securities Act of 1933, as amended. These securities may be sold in certain transactions in reliance on an exemption from registration (normally to qualified institutional buyers). At October 31, 2024, the aggregate value of these securities is $4,386,875,848 or 77.5% of the Fund's net assets. |
| (5) | Security exempt from registration under Regulation S of the Securities Act of 1933, as amended, which exempts from registration securities offered and sold outside the United States. Security may not be offered or sold in the United States except pursuant to an exemption from, or in a transaction not subject to, the registration requirements of the Securities Act of 1933, as amended. At October 31, 2024, the aggregate value of these securities is $79,297,032 or 1.4% of the Fund's net assets. |
| (6) | Represents a payment-in-kind security which may pay interest in additional principal at the issuer’s discretion. |
| (7) | Perpetual security with no stated maturity date but may be subject to calls by the issuer. |
| (8) | Security converts to variable rate after the indicated fixed-rate coupon period. |
| (9) | Variable rate security. The stated interest rate represents the rate in effect at October 31, 2024. |
| (10) | When-issued security. |
| (11) | Amount is less than 0.05% or (0.05)%, as applicable. |
| (12) | Issuer is in default with respect to interest and/or principal payments or has declared bankruptcy and is non-income producing. |
10
See Notes to Financial Statements.
Eaton Vance
Income Fund of Boston
October 31, 2024
Portfolio of Investments — continued
| (13) | Senior floating-rate loans (Senior Loans) often require prepayments from excess cash flows or permit the borrowers to repay at their election. The degree to which borrowers repay, whether as a contractual requirement or at their election, cannot be predicted with accuracy. As a result, the actual remaining maturity may be substantially less than the stated maturities shown. However, Senior Loans will typically have an expected average life of approximately two to four years. Senior Loans typically have rates of interest which are redetermined periodically by reference to a base lending rate, plus a spread. These base lending rates are primarily the Secured Overnight Financing Rate (“SOFR”) and secondarily, the prime rate offered by one or more major United States banks (the “Prime Rate”). Base lending rates may be subject to a floor, or minimum rate. Rates for SOFR are generally 1 or 3-month tenors and may also be subject to a credit spread adjustment. Senior Loans are generally subject to contractual restrictions that must be satisfied before they can be bought or sold. |
| (14) | The stated interest rate represents the weighted average interest rate at October 31, 2024 of contracts within the senior loan facility. Interest rates on contracts are primarily redetermined either monthly or quarterly by reference to the indicated base lending rate and spread and the reset period. |
| (15) | This Senior Loan will settle after October 31, 2024, at which time the interest rate will be determined. |
| (16) | Fixed-rate loan. |
| (17) | Unfunded or partially unfunded loan commitments. The stated interest rate reflects the weighted average of the reference rate and spread for the funded portion, if any, and the commitment fees on the portion of the loan that is unfunded. At October 31, 2024, the total value of unfunded loan commitments is $644,156. See Note 1G for description. |
| (18) | May be deemed to be an affiliated investment company (see Note 11). The rate shown is the annualized seven-day yield as of October 31, 2024. |
| Forward Foreign Currency Exchange Contracts (OTC) |
| Currency Purchased | Currency Sold | Counterparty | Settlement
Date | Unrealized
Appreciation | Unrealized
(Depreciation) |
| USD | 49,013,696 | EUR | 45,143,000 | State Street Bank and Trust Company | 1/31/25 | $ — | $(278,892) |
| USD | 53,398,724 | EUR | 49,170,811 | State Street Bank and Trust Company | 1/31/25 | — | (291,916) |
| USD | 8,942,496 | GBP | 6,876,879 | State Street Bank and Trust Company | 1/31/25 | 77,514 | — |
| | | | | | | $77,514 | $(570,808) |
| Abbreviations: |
| DIP | – Debtor In Possession |
| EURIBOR | – Euro Interbank Offered Rate |
| OTC | – Over-the-counter |
| PIK | – Payment In Kind |
| SOFR | – Secured Overnight Financing Rate |
| Currency Abbreviations: |
| EUR | – Euro |
| GBP | – British Pound Sterling |
| USD | – United States Dollar |
11
See Notes to Financial Statements.
Eaton Vance
Income Fund of Boston
October 31, 2024
Statement of Assets and Liabilities
| | October 31, 2024 |
| Assets | |
| Unaffiliated investments, at value (identified cost $5,394,397,820) | $5,403,323,477 |
| Affiliated investments, at value (identified cost $199,166,329) | 199,166,329 |
| Cash | 2,749,558 |
| Deposits for derivatives collateral — forward foreign currency exchange contracts | 560,000 |
| Foreign currency, at value (identified cost $323,404) | 324,031 |
| Interest receivable | 78,946,997 |
| Dividends receivable from affiliated investments | 927,947 |
| Receivable for investments sold | 19,396,482 |
| Receivable for Fund shares sold | 5,642,181 |
| Receivable for open forward foreign currency exchange contracts | 77,514 |
| Trustees' deferred compensation plan | 301,519 |
| Total assets | $5,711,416,035 |
| Liabilities | |
| Payable for investments purchased | $5,250,037 |
| Payable for when-issued securities | 24,767,904 |
| Payable for Fund shares redeemed | 10,224,884 |
| Payable for open forward foreign currency exchange contracts | 570,808 |
| Distributions payable | 1,027,202 |
| Payable to affiliates: | |
| Investment adviser fee | 2,779,689 |
| Distribution and service fees | 154,766 |
| Trustees' fees | 9,042 |
| Trustees' deferred compensation plan | 301,519 |
| Accrued expenses | 3,197,583 |
| Total liabilities | $48,283,434 |
| Net Assets | $5,663,132,601 |
| Sources of Net Assets | |
| Paid-in capital | $6,214,189,279 |
| Accumulated loss | (551,056,678) |
| Net Assets | $5,663,132,601 |
| Class A Shares | |
| Net Assets | $558,558,672 |
| Shares Outstanding | 107,284,295 |
Net Asset Value and Redemption Price Per Share
(net assets ÷ shares of beneficial interest outstanding) | $5.21 |
Maximum Offering Price Per Share
(100 ÷ 96.75 of net asset value per share) | $5.39 |
| Class C Shares | |
| Net Assets | $31,060,881 |
| Shares Outstanding | 5,947,569 |
Net Asset Value and Offering Price Per Share*
(net assets ÷ shares of beneficial interest outstanding) | $5.22 |
| Class I Shares | |
| Net Assets | $3,834,382,672 |
| Shares Outstanding | 736,308,281 |
Net Asset Value, Offering Price and Redemption Price Per Share
(net assets ÷ shares of beneficial interest outstanding) | $5.21 |
12
See Notes to Financial Statements.
Eaton Vance
Income Fund of Boston
October 31, 2024
Statement of Assets and Liabilities — continued
| | October 31, 2024 |
| Class R Shares | |
| Net Assets | $18,719,789 |
| Shares Outstanding | 3,590,835 |
Net Asset Value, Offering Price and Redemption Price Per Share
(net assets ÷ shares of beneficial interest outstanding) | $5.21 |
| Class R6 Shares | |
| Net Assets | $1,220,410,587 |
| Shares Outstanding | 234,343,790 |
Net Asset Value, Offering Price and Redemption Price Per Share
(net assets ÷ shares of beneficial interest outstanding) | $5.21 |
| On sales of $100,000 or more, the offering price of Class A shares is reduced. |
| * | Redemption price per share is equal to the net asset value less any applicable contingent deferred sales charge. |
13
See Notes to Financial Statements.
Eaton Vance
Income Fund of Boston
October 31, 2024
| | Year Ended |
| | October 31, 2024 |
| Investment Income | |
| Dividend income (net of foreign taxes withheld of $2,477) | $4,489,132 |
| Dividend income from affiliated investments | 11,712,617 |
| Interest income | 328,132,040 |
| Other income | 1,149,276 |
| Total investment income | $345,483,065 |
| Expenses | |
| Investment adviser fee | $30,608,179 |
| Distribution and service fees: | |
| Class A | 1,434,260 |
| Class C | 333,676 |
| Class R | 97,486 |
| Trustees’ fees and expenses | 108,319 |
| Custodian fee | 1,045,369 |
| Transfer and dividend disbursing agent fees | 3,951,057 |
| Legal and accounting services | 292,609 |
| Printing and postage | 522,517 |
| Registration fees | 167,961 |
| Miscellaneous | 164,950 |
| Total expenses | $38,726,383 |
| Deduct: | |
| Waiver and/or reimbursement of expenses by affiliates | $333,041 |
| Total expense reductions | $333,041 |
| Net expenses | $38,393,342 |
| Net investment income | $307,089,723 |
| Realized and Unrealized Gain (Loss) | |
| Net realized gain (loss): | |
| Investment transactions | $(104,011,817) |
| Foreign currency transactions | 873,755 |
| Forward foreign currency exchange contracts | (1,631,752) |
| Net realized loss | $(104,769,814) |
| Change in unrealized appreciation (depreciation): | |
| Investments | $486,025,034 |
| Foreign currency | 20,813 |
| Forward foreign currency exchange contracts | (498,999) |
| Net change in unrealized appreciation (depreciation) | $485,546,848 |
| Net realized and unrealized gain | $380,777,034 |
| Net increase in net assets from operations | $687,866,757 |
14
See Notes to Financial Statements.
Eaton Vance
Income Fund of Boston
October 31, 2024
Statements of Changes in Net Assets
| | Year Ended October 31, |
| | 2024 | 2023 |
| Increase (Decrease) in Net Assets | | |
| From operations: | | |
| Net investment income | $307,089,723 | $274,737,717 |
| Net realized gain (loss) | (104,769,814) | 3,810,320 |
| Net change in unrealized appreciation (depreciation) | 485,546,848 | (17,157,014) |
| Net increase in net assets from operations | $687,866,757 | $261,391,023 |
| Distributions to shareholders: | | |
| Class A | $(33,819,087) | $(32,470,826) |
| Class C | (1,716,089) | (1,891,059) |
| Class I | (206,769,840) | (172,956,802) |
| Class R | (1,100,020) | (1,008,164) |
| Class R6 | (74,173,694) | (64,827,903) |
| Total distributions to shareholders | $(317,578,730) | $(273,154,754) |
| Tax return of capital to shareholders: | | |
| Class A | $— | $(1,376,919) |
| Class C | — | (78,875) |
| Class I | — | (7,477,415) |
| Class R | — | (42,496) |
| Class R6 | — | (2,780,377) |
| Total tax return of capital to shareholders | $— | $(11,756,082) |
| Transactions in shares of beneficial interest: | | |
| Class A | $(42,206,173) | $(38,633,462) |
| Class C | (5,735,985) | (9,910,052) |
| Class I | 536,105,847 | 387,333,661 |
| Class R | (459,737) | (2,115,461) |
| Class R6 | 5,076,992 | (76,890,316) |
| Net increase in net assets from Fund share transactions | $492,780,944 | $259,784,370 |
| Net increase in net assets | $863,068,971 | $236,264,557 |
| Net Assets | | |
| At beginning of year | $4,800,063,630 | $4,563,799,073 |
| At end of year | $5,663,132,601 | $4,800,063,630 |
15
See Notes to Financial Statements.
Eaton Vance
Income Fund of Boston
October 31, 2024
| | Class A |
| | Year Ended October 31, |
| | 2024 | 2023 | 2022 | 2021 | 2020 |
| Net asset value — Beginning of year | $4.83 | $4.83 | $5.59 | $5.34 | $5.58 |
| Income (Loss) From Operations | | | | | |
| Net investment income(1) | $0.29 | $0.27 | $0.23 | $0.24 | $0.25 |
| Net realized and unrealized gain (loss) | 0.39 | 0.01(2) | (0.71) | 0.30 | (0.17) |
| Total income (loss) from operations | $0.68 | $0.28 | $(0.48) | $0.54 | $0.08 |
| Less Distributions | | | | | |
| From net investment income | $(0.30) | $(0.27) | $(0.26) | $(0.24) | $(0.26) |
| Tax return of capital | — | (0.01) | (0.02) | (0.05) | (0.06) |
| Total distributions | $(0.30) | $(0.28) | $(0.28) | $(0.29) | $(0.32) |
| Net asset value — End of year | $5.21 | $4.83 | $4.83 | $5.59 | $5.34 |
| Total Return(3) | 14.38% | 5.85% | (8.87)% | 10.23% | 1.56% |
| Ratios/Supplemental Data | | | | | |
| Net assets, end of year (000’s omitted) | $558,559 | $557,880 | $596,063 | $841,709 | $843,097 |
| Ratios (as a percentage of average daily net assets):(4)(5) | | | | | |
| Total expenses | 0.98% | 1.02% | 1.02% | 1.01% | 1.03% |
| Net expenses | 0.98%(6) | 1.00%(6) | 1.00%(6) | 1.00% | 1.01% |
| Net investment income | 5.69% | 5.49% | 4.40% | 4.21% | 4.68% |
| Portfolio Turnover of the Portfolio(7) | — | — | — | — | 32% |
| Portfolio Turnover of the Fund | 45% | 29% | 28% | 63% | 18%(8) |
| (1) | Computed using average shares outstanding. |
| (2) | The per share amount is not in accord with the net realized and unrealized gain (loss) for the period because of the timing of Fund share transactions and the amount of the per share realized and unrealized gains and losses at such time. |
| (3) | Returns are historical and are calculated by determining the percentage change in net asset value with all distributions reinvested and do not reflect the effect of sales charges. |
| (4) | Total expenses do not reflect amounts reimbursed and/or waived by the adviser and certain of its affiliates, if applicable. Net expenses are net of all reductions and represent the net expenses paid by the Fund. |
| (5) | Includes the Fund’s share of the Portfolio’s allocated expenses for the period while the Fund was investing in the Portfolio. |
| (6) | Includes a reduction by the investment adviser of a portion of its adviser fee due to the Fund’s investment in the Liquidity Fund (equal to less than 0.01%, less than 0.01% and less than 0.005% of average daily net assets for the years ended October 31, 2024, 2023 and 2022, respectively). |
| (7) | Portfolio turnover represents the rate of portfolio activity for the period while the Fund was investing in the Portfolio. |
| (8) | For the period from June 15, 2020 through October 31, 2020 when the Fund was making investments directly in securities. |
| References to Portfolio herein are to Boston Income Portfolio, a Massachusetts business trust in which the Fund invested all of its investable assets prior to the close of business on June 12, 2020 and which had the same investment objectives and policies as the Fund during such period. |
16
See Notes to Financial Statements.
Eaton Vance
Income Fund of Boston
October 31, 2024
Financial Highlights — continued
| | Class C |
| | Year Ended October 31, |
| | 2024 | 2023 | 2022 | 2021 | 2020 |
| Net asset value — Beginning of year | $4.85 | $4.85 | $5.60 | $5.35 | $5.59 |
| Income (Loss) From Operations | | | | | |
| Net investment income(1) | $0.25 | $0.23 | $0.19 | $0.20 | $0.21 |
| Net realized and unrealized gain (loss) | 0.38 | 0.01(2) | (0.71) | 0.30 | (0.18) |
| Total income (loss) from operations | $0.63 | $0.24 | $(0.52) | $0.50 | $0.03 |
| Less Distributions | | | | | |
| From net investment income | $(0.26) | $(0.23) | $(0.21) | $(0.21) | $(0.22) |
| Tax return of capital | — | (0.01) | (0.02) | (0.04) | (0.05) |
| Total distributions | $(0.26) | $(0.24) | $(0.23) | $(0.25) | $(0.27) |
| Net asset value — End of year | $5.22 | $4.85 | $4.85 | $5.60 | $5.35 |
| Total Return(3) | 13.28% | 5.02% | (9.39)% | 9.39% | 0.74% |
| Ratios/Supplemental Data | | | | | |
| Net assets, end of year (000’s omitted) | $31,061 | $34,242 | $43,919 | $65,596 | $85,246 |
| Ratios (as a percentage of average daily net assets):(4)(5) | | | | | |
| Total expenses | 1.73% | 1.77% | 1.77% | 1.76% | 1.78% |
| Net expenses | 1.73%(6) | 1.75%(6) | 1.75%(6) | 1.75% | 1.76% |
| Net investment income | 4.94% | 4.73% | 3.65% | 3.47% | 3.95% |
| Portfolio Turnover of the Portfolio(7) | — | — | — | — | 32% |
| Portfolio Turnover of the Fund | 45% | 29% | 28% | 63% | 18%(8) |
| (1) | Computed using average shares outstanding. |
| (2) | The per share amount is not in accord with the net realized and unrealized gain (loss) for the period because of the timing of Fund share transactions and the amount of the per share realized and unrealized gains and losses at such time. |
| (3) | Returns are historical and are calculated by determining the percentage change in net asset value with all distributions reinvested and do not reflect the effect of sales charges. |
| (4) | Total expenses do not reflect amounts reimbursed and/or waived by the adviser and certain of its affiliates, if applicable. Net expenses are net of all reductions and represent the net expenses paid by the Fund. |
| (5) | Includes the Fund’s share of the Portfolio’s allocated expenses for the period while the Fund was investing in the Portfolio. |
| (6) | Includes a reduction by the investment adviser of a portion of its adviser fee due to the Fund’s investment in the Liquidity Fund (equal to less than 0.01%, less than 0.01% and less than 0.005% of average daily net assets for the years ended October 31, 2024, 2023 and 2022, respectively). |
| (7) | Portfolio turnover represents the rate of portfolio activity for the period while the Fund was investing in the Portfolio. |
| (8) | For the period from June 15, 2020 through October 31, 2020 when the Fund was making investments directly in securities. |
| References to Portfolio herein are to Boston Income Portfolio, a Massachusetts business trust in which the Fund invested all of its investable assets prior to the close of business on June 12, 2020 and which had the same investment objectives and policies as the Fund during such period. |
17
See Notes to Financial Statements.
Eaton Vance
Income Fund of Boston
October 31, 2024
Financial Highlights — continued
| | Class I |
| | Year Ended October 31, |
| | 2024 | 2023 | 2022 | 2021 | 2020 |
| Net asset value — Beginning of year | $4.83 | $4.84 | $5.59 | $5.34 | $5.59 |
| Income (Loss) From Operations | | | | | |
| Net investment income(1) | $0.31 | $0.29 | $0.24 | $0.25 | $0.26 |
| Net realized and unrealized gain (loss) | 0.39 | 0.00(2)(3) | (0.70) | 0.30 | (0.18) |
| Total income (loss) from operations | $0.70 | $0.29 | $(0.46) | $0.55 | $0.08 |
| Less Distributions | | | | | |
| From net investment income | $(0.32) | $(0.29) | $(0.27) | $(0.25) | $(0.27) |
| Tax return of capital | — | (0.01) | (0.02) | (0.05) | (0.06) |
| Total distributions | $(0.32) | $(0.30) | $(0.29) | $(0.30) | $(0.33) |
| Net asset value — End of year | $5.21 | $4.83 | $4.84 | $5.59 | $5.34 |
| Total Return(4) | 14.67% | 5.90% | (8.44)% | 10.50% | 1.64% |
| Ratios/Supplemental Data | | | | | |
| Net assets, end of year (000’s omitted) | $3,834,383 | $3,061,662 | $2,692,891 | $4,267,314 | $4,242,893 |
| Ratios (as a percentage of average daily net assets):(5)(6) | | | | | |
| Total expenses | 0.73% | 0.77% | 0.77% | 0.76% | 0.78% |
| Net expenses | 0.73%(7) | 0.75%(7) | 0.75%(7) | 0.75% | 0.76% |
| Net investment income | 5.94% | 5.75% | 4.64% | 4.47% | 4.91% |
| Portfolio Turnover of the Portfolio(8) | — | — | — | — | 32% |
| Portfolio Turnover of the Fund | 45% | 29% | 28% | 63% | 18%(9) |
| (1) | Computed using average shares outstanding. |
| (2) | Amount is less than $0.005. |
| (3) | The per share amount is not in accord with the net realized and unrealized gain (loss) for the period because of the timing of Fund share transactions and the amount of the per share realized and unrealized gains and losses at such time. |
| (4) | Returns are historical and are calculated by determining the percentage change in net asset value with all distributions reinvested. |
| (5) | Total expenses do not reflect amounts reimbursed and/or waived by the adviser and certain of its affiliates, if applicable. Net expenses are net of all reductions and represent the net expenses paid by the Fund. |
| (6) | Includes the Fund’s share of the Portfolio’s allocated expenses for the period while the Fund was investing in the Portfolio. |
| (7) | Includes a reduction by the investment adviser of a portion of its adviser fee due to the Fund’s investment in the Liquidity Fund (equal to less than 0.01%, less than 0.01% and less than 0.005% of average daily net assets for the years ended October 31, 2024, 2023 and 2022, respectively). |
| (8) | Portfolio turnover represents the rate of portfolio activity for the period while the Fund was investing in the Portfolio. |
| (9) | For the period from June 15, 2020 through October 31, 2020 when the Fund was making investments directly in securities. |
| References to Portfolio herein are to Boston Income Portfolio, a Massachusetts business trust in which the Fund invested all of its investable assets prior to the close of business on June 12, 2020 and which had the same investment objectives and policies as the Fund during such period. |
18
See Notes to Financial Statements.
Eaton Vance
Income Fund of Boston
October 31, 2024
Financial Highlights — continued
| | Class R |
| | Year Ended October 31, |
| | 2024 | 2023 | 2022 | 2021 | 2020 |
| Net asset value — Beginning of year | $4.84 | $4.84 | $5.60 | $5.35 | $5.59 |
| Income (Loss) From Operations | | | | | |
| Net investment income(1) | $0.28 | $0.26 | $0.22 | $0.22 | $0.24 |
| Net realized and unrealized gain (loss) | 0.38 | 0.01(2) | (0.72) | 0.31 | (0.18) |
| Total income (loss) from operations | $0.66 | $0.27 | $(0.50) | $0.53 | $0.06 |
| Less Distributions | | | | | |
| From net investment income | $(0.29) | $(0.26) | $(0.24) | $(0.23) | $(0.25) |
| Tax return of capital | — | (0.01) | (0.02) | (0.05) | (0.05) |
| Total distributions | $(0.29) | $(0.27) | $(0.26) | $(0.28) | $(0.30) |
| Net asset value — End of year | $5.21 | $4.84 | $4.84 | $5.60 | $5.35 |
| Total Return(3) | 13.86% | 5.57% | (9.08)% | 9.95% | 1.28% |
| Ratios/Supplemental Data | | | | | |
| Net assets, end of year (000’s omitted) | $18,720 | $17,774 | $19,860 | $25,010 | $27,105 |
| Ratios (as a percentage of average daily net assets):(4)(5) | | | | | |
| Total expenses | 1.23% | 1.27% | 1.27% | 1.26% | 1.28% |
| Net expenses | 1.23%(6) | 1.25%(6) | 1.25%(6) | 1.25% | 1.26% |
| Net investment income | 5.44% | 5.24% | 4.16% | 3.97% | 4.44% |
| Portfolio Turnover of the Portfolio(7) | — | — | — | — | 32% |
| Portfolio Turnover of the Fund | 45% | 29% | 28% | 63% | 18%(8) |
| (1) | Computed using average shares outstanding. |
| (2) | The per share amount is not in accord with the net realized and unrealized gain (loss) for the period because of the timing of Fund share transactions and the amount of the per share realized and unrealized gains and losses at such time. |
| (3) | Returns are historical and are calculated by determining the percentage change in net asset value with all distributions reinvested. |
| (4) | Total expenses do not reflect amounts reimbursed and/or waived by the adviser and certain of its affiliates, if applicable. Net expenses are net of all reductions and represent the net expenses paid by the Fund. |
| (5) | Includes the Fund’s share of the Portfolio’s allocated expenses for the period while the Fund was investing in the Portfolio. |
| (6) | Includes a reduction by the investment adviser of a portion of its adviser fee due to the Fund’s investment in the Liquidity Fund (equal to less than 0.01%, less than 0.01% and less than 0.005% of average daily net assets for the years ended October 31, 2024, 2023 and 2022, respectively). |
| (7) | Portfolio turnover represents the rate of portfolio activity for the period while the Fund was investing in the Portfolio. |
| (8) | For the period from June 15, 2020 through October 31, 2020 when the Fund was making investments directly in securities. |
| References to Portfolio herein are to Boston Income Portfolio, a Massachusetts business trust in which the Fund invested all of its investable assets prior to the close of business on June 12, 2020 and which had the same investment objectives and policies as the Fund during such period. |
19
See Notes to Financial Statements.
Eaton Vance
Income Fund of Boston
October 31, 2024
Financial Highlights — continued
| | Class R6 |
| | Year Ended October 31, |
| | 2024 | 2023 | 2022 | 2021 | 2020 |
| Net asset value — Beginning of year | $4.83 | $4.84 | $5.59 | $5.35 | $5.59 |
| Income (Loss) From Operations | | | | | |
| Net investment income(1) | $0.31 | $0.29 | $0.25 | $0.25 | $0.26 |
| Net realized and unrealized gain (loss) | 0.39 | (0.00)(2) | (0.71) | 0.30 | (0.16) |
| Total income (loss) from operations | $0.70 | $0.29 | $(0.46) | $0.55 | $0.10 |
| Less Distributions | | | | | |
| From net investment income | $(0.32) | $(0.29) | $(0.27) | $(0.26) | $(0.28) |
| Tax return of capital | — | (0.01) | (0.02) | (0.05) | (0.06) |
| Total distributions | $(0.32) | $(0.30) | $(0.29) | $(0.31) | $(0.34) |
| Net asset value — End of year | $5.21 | $4.83 | $4.84 | $5.59 | $5.35 |
| Total Return(3) | 14.77% | 6.00% | (8.35)% | 10.39% | 1.92% |
| Ratios/Supplemental Data | | | | | |
| Net assets, end of year (000’s omitted) | $1,220,411 | $1,128,506 | $1,211,066 | $1,318,299 | $1,153,264 |
| Ratios (as a percentage of average daily net assets):(4)(5) | | | | | |
| Total expenses | 0.64% | 0.68% | 0.68% | 0.67% | 0.68% |
| Net expenses | 0.64%(6) | 0.66%(6) | 0.66%(6) | 0.66% | 0.66% |
| Net investment income | 6.04% | 5.85% | 4.77% | 4.55% | 4.92% |
| Portfolio Turnover of the Portfolio(7) | — | — | — | — | 32% |
| Portfolio Turnover of the Fund | 45% | 29% | 28% | 63% | 18%(8) |
| (1) | Computed using average shares outstanding. |
| (2) | Amount is less than $(0.005). |
| (3) | Returns are historical and are calculated by determining the percentage change in net asset value with all distributions reinvested. |
| (4) | Total expenses do not reflect amounts reimbursed and/or waived by the adviser and certain of its affiliates, if applicable. Net expenses are net of all reductions and represent the net expenses paid by the Fund. |
| (5) | Includes the Fund’s share of the Portfolio’s allocated expenses for the period while the Fund was investing in the Portfolio. |
| (6) | Includes a reduction by the investment adviser of a portion of its adviser fee due to the Fund’s investment in the Liquidity Fund (equal to less than 0.01%, less than 0.01% and less than 0.005% of average daily net assets for the years ended October 31, 2024, 2023 and 2022, respectively). |
| (7) | Portfolio turnover represents the rate of portfolio activity for the period while the Fund was investing in the Portfolio. |
| (8) | For the period from June 15, 2020 through October 31, 2020 when the Fund was making investments directly in securities. |
| References to Portfolio herein are to Boston Income Portfolio, a Massachusetts business trust in which the Fund invested all of its investable assets prior to the close of business on June 12, 2020 and which had the same investment objectives and policies as the Fund during such period. |
20
See Notes to Financial Statements.
Eaton Vance
Income Fund of Boston
October 31, 2024
Notes to Financial Statements
1 Significant Accounting Policies
Eaton Vance Income Fund of Boston (the Fund) is a diversified series of Eaton Vance Series Trust II (the Trust). The Trust is a Massachusetts business trust registered under the Investment Company Act of 1940, as amended (the 1940 Act), as an open-end management investment company. The Fund’s investment objective is to provide a high level of current income. The Fund’s secondary objectives are to seek growth of income and capital. The Fund offers five classes of shares. Class A shares are generally sold subject to a sales charge imposed at time of purchase. Class C shares are sold at net asset value and are generally subject to a contingent deferred sales charge (see Note 5). Effective November 5, 2020, Class C shares automatically convert to Class A shares eight years after their purchase as described in the Fund’s prospectus. Class I, Class R and Class R6 shares are sold at net asset value and are not subject to a sales charge. Each class represents a pro rata interest in the Fund, but votes separately on class-specific matters and (as noted below) is subject to different expenses. Realized and unrealized gains and losses are allocated daily to each class of shares based on the relative net assets of each class to the total net assets of the Fund. Net investment income, other than class-specific expenses, is allocated daily to each class of shares based upon the ratio of the value of each class’s paid shares to the total value of all paid shares. Sub-accounting, recordkeeping and similar administrative fees payable to financial intermediaries, which are a component of transfer and dividend disbursing agent fees on the Statement of Operations, are not allocated to Class R6 shares. Each class of shares differs in its distribution plan and certain other class-specific expenses.
The following is a summary of significant accounting policies of the Fund. The policies are in conformity with accounting principles generally accepted in the United States of America (U.S. GAAP). The Fund is an investment company and follows accounting and reporting guidance in the Financial Accounting Standards Board (FASB) Accounting Standards Codification Topic 946.
A Investment Valuation—The following methodologies are used to determine the market value or fair value of investments.
Debt Obligations. Debt obligations are generally valued on the basis of valuations provided by third party pricing services, as derived from such services’ pricing models. Inputs to the models may include, but are not limited to, reported trades, executable bid and ask prices, broker/dealer quotations, prices or yields of securities with similar characteristics, interest rates, anticipated prepayments, benchmark curves or information pertaining to the issuer, as well as industry and economic events. The pricing services may use a matrix approach, which considers information regarding securities with similar characteristics to determine the valuation for a security. Short-term debt obligations purchased with a remaining maturity of sixty days or less for which a valuation from a third party pricing service is not readily available may be valued at amortized cost, which approximates fair value.
Senior Floating-Rate Loans. Interests in senior floating-rate loans (Senior Loans) are valued generally at the average mean of bid and ask quotations obtained from a third party pricing service. Senior Loans, for which a valuation is not available or deemed unreliable, are fair valued by the investment adviser utilizing one or more of the valuation techniques described below to assess the likelihood that the borrower will make a full repayment of the loan underlying such Senior Loan. If the investment adviser believes that there is a reasonable likelihood of full repayment, the investment adviser will determine fair value using a matrix pricing approach that considers the yield on the Senior Loan relative to yields on other Senior Loans issued by companies of comparable credit quality. If the investment adviser believes there is not a reasonable likelihood of full repayment, the investment adviser will determine fair value using analyses that include, but are not limited to: (i) a comparison of the value of the borrower's outstanding equity and debt to that of comparable public companies; (ii) a discounted cash flow analysis; or (iii) when the investment adviser believes it is likely that a borrower will be liquidated or sold, an analysis of the terms of such liquidation or sale. In certain cases, the investment adviser will use a combination of analytical methods to determine fair value, such as when only a portion of a borrower's assets are likely to be sold. In conducting its assessment and analyses for purposes of determining fair value of a Senior Loan, the investment adviser will use its discretion and judgment in considering and appraising relevant factors. Junior Loans (i.e., subordinated loans and second lien loans) are valued in the same manner as Senior Loans.
Equity Securities. Equity securities listed on a U.S. securities exchange generally are valued at the last sale or closing price on the day of valuation or, if no sales took place on such date, at the mean between the closing bid and ask prices on the exchange where such securities are principally traded. Equity securities listed on the NASDAQ National Market System are valued at the NASDAQ official closing price. Unlisted or listed securities for which closing sales prices or closing quotations are not available are valued at the mean between the latest available bid and ask prices or, in the case of preferred equity securities that are not listed or traded in the over-the-counter market, by a third party pricing service that uses various techniques that consider factors including, but not limited to, prices or yields of securities with similar characteristics, benchmark yields, broker/dealer quotes, quotes of underlying common stock, issuer spreads, as well as industry and economic events.
Derivatives. Forward foreign currency exchange contracts are generally valued at the mean of the average bid and average ask prices that are reported by currency dealers to a third party pricing service at the valuation time. Such third party pricing service valuations are supplied for specific settlement periods and the Fund’s forward foreign currency exchange contracts are valued at an interpolated rate between the closest preceding and subsequent settlement period reported by the third party pricing service.
Foreign Securities and Currencies. Foreign securities and currencies are valued in U.S. dollars, based on foreign currency exchange rate quotations supplied by a third party pricing service. The pricing service uses a proprietary model to determine the exchange rate. Inputs to the model include reported trades and implied bid/ask spreads.
Other. Investments in management investment companies (including money market funds) that do not trade on an exchange are valued at the net asset value as of the close of each business day.
Eaton Vance
Income Fund of Boston
October 31, 2024
Notes to Financial Statements — continued
Fair Valuation. In connection with Rule 2a-5 of the 1940 Act, the Trustees have designated the Fund’s investment adviser as its valuation designee. Investments for which valuations or market quotations are not readily available or are deemed unreliable are valued by the investment adviser, as valuation designee, at fair value using methods that most fairly reflect the security’s “fair value”, which is the amount that the Fund might reasonably expect to receive for the security upon its current sale in the ordinary course. Each such determination is based on a consideration of relevant factors, which are likely to vary from one pricing context to another. These factors may include, but are not limited to, the type of security, the existence of any contractual restrictions on the security’s disposition, the price and extent of public trading in similar securities of the issuer or of comparable companies or entities, quotations or relevant information obtained from broker/dealers or other market participants, information obtained from the issuer, analysts, and/or the appropriate stock exchange (for exchange-traded securities), an analysis of the company’s or entity’s financial statements, and an evaluation of the forces that influence the issuer and the market(s) in which the security is purchased and sold.
B Investment Transactions—Investment transactions for financial statement purposes are accounted for on a trade date basis. Realized gains and losses on investments sold are determined on the basis of identified cost.
C Income—Interest income is recorded on the basis of interest accrued, adjusted for amortization of premium or accretion of discount. Fees in connection with investments in senior floating-rate loans may include amendment fees, consent fees and prepayment fees, which are recorded to income as earned and included in Other income on the Statement of Operations. Dividend income is recorded on the ex-dividend date for dividends received in cash and/or securities. Withholding taxes on foreign dividends have been provided for in accordance with the Fund’s understanding of the applicable countries’ tax rules and rates. Distributions from investment companies are recorded as dividend income, capital gains or return of capital based on the nature of the distribution.
D Federal Taxes—The Fund's policy is to comply with the provisions of the Internal Revenue Code applicable to regulated investment companies and to distribute to shareholders each year substantially all of its net investment income, and all or substantially all of its net realized capital gains. Accordingly, no provision for federal income or excise tax is necessary.
As of October 31, 2024, the Fund had no uncertain tax positions that would require financial statement recognition, de-recognition, or disclosure. The Fund files a U.S. federal income tax return annually after its fiscal year-end, which is subject to examination by the Internal Revenue Service for a period of three years from the date of filing.
E Expenses—The majority of expenses of the Trust are directly identifiable to an individual fund. Expenses which are not readily identifiable to a specific fund are allocated taking into consideration, among other things, the nature and type of expense and the relative size of the funds.
F Foreign Currency Translation—Investment valuations, other assets, and liabilities initially expressed in foreign currencies are translated each business day into U.S. dollars based upon current exchange rates. Purchases and sales of foreign investment securities and income and expenses denominated in foreign currencies are translated into U.S. dollars based upon currency exchange rates in effect on the respective dates of such transactions. Recognized gains or losses on investment transactions attributable to changes in foreign currency exchange rates are recorded for financial statement purposes as net realized gains and losses on investments. That portion of unrealized gains and losses on investments that results from fluctuations in foreign currency exchange rates is not separately disclosed.
G Unfunded Loan Commitments—The Fund may enter into certain loan agreements all or a portion of which may be unfunded. The Fund is obligated to fund these commitments at the borrower's discretion. These commitments are disclosed in the accompanying Portfolio of Investments. At October 31, 2024, the Fund had sufficient cash and/or securities to cover these commitments.
H Use of Estimates—The preparation of the financial statements in conformity with U.S. GAAP requires management to make estimates and assumptions that affect the reported amounts of assets and liabilities at the date of the financial statements and the reported amounts of income and expense during the reporting period. Actual results could differ from those estimates.
I Indemnifications—Under the Trust’s organizational documents, its officers and Trustees may be indemnified against certain liabilities and expenses arising out of the performance of their duties to the Fund. Under Massachusetts law, if certain conditions prevail, shareholders of a Massachusetts business trust (such as the Trust) could be deemed to have personal liability for the obligations of the Trust. However, the Trust’s Declaration of Trust contains an express disclaimer of liability on the part of Fund shareholders and the By-laws provide that the Trust shall assume, upon request by the shareholder, the defense on behalf of any Fund shareholders. Moreover, the By-laws also provide for indemnification out of Fund property of any shareholder held personally liable solely by reason of being or having been a shareholder for all loss or expense arising from such liability. Additionally, in the normal course of business, the Fund enters into agreements with service providers that may contain indemnification clauses. The Fund’s maximum exposure under these arrangements is unknown as this would involve future claims that may be made against the Fund that have not yet occurred.
J Forward Foreign Currency Exchange Contracts—The Fund may enter into forward foreign currency exchange contracts for the purchase or sale of a specific foreign currency at a fixed price on a future date. The forward foreign currency exchange contracts are adjusted by the daily exchange rate of the underlying currency and any gains or losses are recorded as unrealized until such time as the contracts have been closed. Risks may arise upon entering these contracts from the potential inability of counterparties to meet the terms of their contracts and from movements in the value of a foreign currency relative to the U.S. dollar.
Eaton Vance
Income Fund of Boston
October 31, 2024
Notes to Financial Statements — continued
K When-Issued Securities and Delayed Delivery Transactions—The Fund may purchase securities on a delayed delivery or when-issued basis. Payment and delivery may take place after the customary settlement period for that security. At the time the transaction is negotiated, the price of the security that will be delivered is fixed. The Fund maintains cash and/or security positions for these commitments such that sufficient liquid assets will be available to make payments upon settlement. Securities purchased on a delayed delivery or when-issued basis are marked-to-market daily and begin earning interest on settlement date. Such security purchases are subject to the risk that when delivered they will be worth less than the agreed upon payment price. Losses may also arise if the counterparty does not perform under the contract.
2 Distributions to Shareholders and Income Tax Information
The Fund declares dividends daily to shareholders of record at the time of declaration. Distributions are generally paid monthly. Distributions of realized capital gains are made at least annually. Distributions are declared separately for each class of shares. Shareholders may reinvest income and capital gain distributions in additional shares of the same class of the Fund at the net asset value as of the reinvestment date or, at the election of the shareholder, receive distributions in cash. Distributions to shareholders are determined in accordance with income tax regulations, which may differ from U.S. GAAP. As required by U.S. GAAP, only distributions in excess of tax basis earnings and profits are reported in the financial statements as a return of capital. Permanent differences between book and tax accounting relating to distributions are reclassified to paid-in capital. For tax purposes, distributions from short-term capital gains are considered to be from ordinary income.
The tax character of distributions declared for the years ended October 31, 2024 and October 31, 2023 was as follows:
| | Year Ended October 31, |
| | 2024 | 2023 |
| Ordinary income | $317,578,730 | $273,154,754 |
| Tax return of capital | $ — | $11,756,082 |
During the year ended October 31, 2024, accumulated loss was decreased by $2,342,678 and paid-in capital was decreased by $2,342,678 due to taxable overdistributions and differences between book and tax accounting for investments in partnerships. These reclassifications had no effect on the net assets or net asset value per share of the Fund.
As of October 31, 2024, the components of distributable earnings (accumulated loss) on a tax basis were as follows:
| Deferred capital losses | $(502,479,909) |
| Net unrealized depreciation | (47,549,567) |
| Distributions payable | (1,027,202) |
| Accumulated loss | $(551,056,678) |
At October 31, 2024, the Fund, for federal income tax purposes, had deferred capital losses of $502,479,909 which would reduce its taxable income arising from future net realized gains on investment transactions, if any, to the extent permitted by the Internal Revenue Code, and thus would reduce the amount of distributions to shareholders, which would otherwise be necessary to relieve the Fund of any liability for federal income or excise tax. The deferred capital losses are treated as arising on the first day of the Fund’s next taxable year and retain the same short-term or long-term character as when originally deferred. Of the deferred capital losses at October 31, 2024, $502,479,909 are long-term.
The cost and unrealized appreciation (depreciation) of investments, including open derivative contracts, of the Fund at October 31, 2024, as determined on a federal income tax basis, were as follows:
| Aggregate cost | $5,650,012,826 |
| Gross unrealized appreciation | $106,328,115 |
| Gross unrealized depreciation | (153,851,135) |
| Net unrealized depreciation | $(47,523,020) |
Eaton Vance
Income Fund of Boston
October 31, 2024
Notes to Financial Statements — continued
3 Investment Adviser Fee and Other Transactions with Affiliates
The investment adviser fee is earned by Boston Management and Research (BMR), an indirect, wholly-owned subsidiary of Morgan Stanley, as compensation for investment advisory services rendered to the Fund. The investment adviser fee is computed at an annual rate as a percentage of the Fund’s average daily net assets as follows and is payable monthly:
| Average Daily Net Assets | Annual Fee Rate |
| Up to $1.5 billion | 0.625% |
| $1.5 billion but less than $2 billion | 0.600% |
| $2 billion but less than $5 billion | 0.575% |
| $5 billion but less than $10 billion | 0.555% |
| $10 billion and over | 0.535% |
For the year ended October 31, 2024, the Fund’s investment adviser fee amounted to $30,608,179 or 0.59% of the Fund’s average daily net assets.
Pursuant to an investment sub-advisory agreement, BMR has delegated a portion of the investment management of the Fund to Eaton Vance Advisers International Ltd. (EVAIL), an affiliate of BMR. BMR pays EVAIL a portion of its investment adviser fee for sub-advisory services provided to the Fund. The Fund may invest in a money market fund, the Institutional Class of the Morgan Stanley Institutional Liquidity Funds - Government Portfolio (the "Liquidity Fund"), an open-end management investment company managed by Morgan Stanley Investment Management Inc., a wholly-owned subsidiary of Morgan Stanley. The investment adviser fee paid by the Fund is reduced by an amount equal to its pro rata share of the advisory and administration fees paid by the Fund due to its investment in the Liquidity Fund. For the year ended October 31, 2024, the investment adviser fee paid was reduced by $333,041
relating to the Fund's investment in the Liquidity Fund.
Eaton Vance Management (EVM), an affiliate of BMR, serves as the administrator of the Fund, but receives no compensation. EVM has agreed to reimburse the Fund’s expenses to the extent that total annual operating expenses (relating to ordinary operating expenses only and excluding such expenses as brokerage commissions, acquired fund fees and expenses of unaffiliated funds, borrowing costs, taxes or litigation expenses) exceed 1.00%, 1.75%, 0.75%, 1.25% and 0.66% of the Fund’s average daily net assets for Class A, Class C, Class I, Class R and Class R6, respectively. This agreement may be changed or terminated after March 1, 2025. Pursuant to this agreement, no operating expenses were waived and/or reimbursed by EVM for the year ended October 31, 2024.
EVM provides sub-transfer agency and related services to the Fund pursuant to a Sub-Transfer Agency Support Services Agreement. For the year ended October 31, 2024, EVM earned $173,332 from the Fund pursuant to such agreement, which is included in transfer and dividend disbursing agent fees on the Statement of Operations. The Fund was informed that Eaton Vance Distributors, Inc. (EVD), an affiliate of EVM and the Fund’s principal underwriter, received $10,090 as its portion of the sales charge on sales of Class A shares for the year ended October 31, 2024. The Fund was informed that Morgan Stanley affiliated broker-dealers, which may be deemed to be affiliates of EVM, BMR and EVD, also received a portion of the sales charge on sales of Class A shares for the year ended October 31, 2024 in the amount of $4,204. EVD also received distribution and service fees from Class A, Class C and Class R shares (see Note 4) and contingent deferred sales charges (see Note 5).
Trustees and officers of the Fund who are members of EVM’s or BMR’s organizations receive remuneration for their services to the Fund out of the investment adviser fee. Trustees of the Fund who are not affiliated with the investment adviser may elect to defer receipt of all or a percentage of their annual fees in accordance with the terms of the Trustees Deferred Compensation Plan. Certain officers and Trustees of the Fund are officers of the above organizations.
4 Distribution Plans
The Fund has in effect a distribution plan for Class A shares (Class A Plan) pursuant to Rule 12b-1 under the 1940 Act. Pursuant to the Class A Plan, the Fund pays EVD a distribution and service fee of 0.25% per annum of its average daily net assets attributable to Class A shares for distribution services and facilities provided to the Fund by EVD, as well as for personal services and/or the maintenance of shareholder accounts. Distribution and service fees paid or accrued to EVD for the year ended October 31, 2024 amounted to $1,434,260 for Class A shares.
The Fund also has in effect distribution plans for Class C shares (Class C Plan) and Class R shares (Class R Plan) pursuant to Rule 12b-1 under the 1940 Act. Pursuant to the Class C Plan, the Fund pays EVD amounts equal to 0.75% per annum of its average daily net assets attributable to Class C shares for providing ongoing distribution services and facilities to the Fund. For the year ended October 31, 2024, the Fund paid or accrued to EVD $250,257 for Class C shares. The Class R Plan requires the Fund to pay EVD an amount up to 0.50% per annum of its average daily net assets attributable to Class R shares for providing ongoing distribution services and facilities to the Fund. The Trustees of the Trust have currently limited Class R distribution payments to 0.25% per annum of the average daily net assets attributable to Class R shares. For the year ended October 31, 2024, the Fund paid or accrued to EVD $48,743 for Class R shares.
Eaton Vance
Income Fund of Boston
October 31, 2024
Notes to Financial Statements — continued
Pursuant to the Class C and Class R Plans, the Fund also makes payments of service fees to EVD, financial intermediaries and other persons in amounts equal to 0.25% per annum of its average daily net assets attributable to that class. Service fees paid or accrued are for personal services and/or the maintenance of shareholder accounts. They are separate and distinct from the sales commissions and distribution fees payable to EVD. Service fees paid or accrued for the year ended October 31, 2024 amounted to $83,419 and $48,743 for Class C and Class R shares, respectively.
Distribution and service fees are subject to the limitations contained in the Financial Industry Regulatory Authority Rule 2341(d).
5 Contingent Deferred Sales Charges
A contingent deferred sales charge (CDSC) of 1% generally is imposed on redemptions of Class C shares made within 12 months of purchase. Class A shares may be subject to a 0.75% CDSC if redeemed within 12 months of purchase (depending on the circumstances of purchase). Generally, the CDSC is based upon the lower of the net asset value at date of redemption or date of purchase. No charge is levied on shares acquired by reinvestment of dividends or capital gain distributions. For the year ended October 31, 2024, the Fund was informed that EVD received $3,103 and $1,837 of CDSCs paid by Class A and Class C shareholders, respectively.
6 Purchases and Sales of Investments
Purchases and sales of investments, other than short-term obligations and including maturities, paydowns and principal repayments on Senior Loans, aggregated $2,656,104,497 and $2,217,203,506, respectively, for the year ended October 31, 2024.
7 Shares of Beneficial Interest
The Fund’s Declaration of Trust permits the Trustees to issue an unlimited number of full and fractional shares of beneficial interest (without par value). Such shares may be issued in a number of different series (such as the Fund) and classes. Transactions in Fund shares, including direct exchanges pursuant to share class conversions, were as follows:
| | Year Ended
October 31, 2024 | | Year Ended
October 31, 2023 |
| | Shares | Amount | | Shares | Amount |
| Class A | | | | | |
| Sales | 13,618,497 | $ 69,825,688 | | 24,267,173 | $ 120,347,588 |
| Issued to shareholders electing to receive payments of distributions in Fund shares | 6,132,274 | 31,560,733 | | 6,383,401 | 31,602,534 |
| Redemptions | (27,934,308) | (143,592,594) | | (38,468,405) | (190,583,584) |
| Net decrease | (8,183,537) | $ (42,206,173) | | (7,817,831) | $ (38,633,462) |
| Class C | | | | | |
| Sales | 682,525 | $ 3,533,206 | | 586,562 | $ 2,902,653 |
| Issued to shareholders electing to receive payments of distributions in Fund shares | 322,790 | 1,664,980 | | 386,329 | 1,919,128 |
| Redemptions | (2,123,278) | (10,934,171) | | (2,966,805) | (14,731,833) |
| Net decrease | (1,117,963) | $ (5,735,985) | | (1,993,914) | $ (9,910,052) |
| Class I | | | | | |
| Sales | 221,962,345 | $1,146,200,439 | | 233,376,237 | $1,162,046,587 |
| Issued to shareholders electing to receive payments of distributions in Fund shares | 38,883,752 | 200,250,148 | | 35,353,903 | 175,103,222 |
| Redemptions | (158,097,352) | (810,344,740) | | (192,016,886) | (949,816,148) |
| Net increase | 102,748,745 | $ 536,105,847 | | 76,713,254 | $ 387,333,661 |
Eaton Vance
Income Fund of Boston
October 31, 2024
Notes to Financial Statements — continued
| | Year Ended
October 31, 2024 | | Year Ended
October 31, 2023 |
| | Shares | Amount | | Shares | Amount |
| Class R | | | | | |
| Sales | 891,507 | $ 4,580,121 | | 666,783 | $ 3,308,529 |
| Issued to shareholders electing to receive payments of distributions in Fund shares | 212,770 | 1,096,421 | | 211,358 | 1,047,761 |
| Redemptions | (1,187,267) | (6,136,279) | | (1,307,032) | (6,471,751) |
| Net decrease | (82,990) | $ (459,737) | | (428,891) | $ (2,115,461) |
| Class R6 | | | | | |
| Sales | 70,133,999 | $ 359,960,205 | | 63,283,835 | $ 313,746,538 |
| Issued to shareholders electing to receive payments of distributions in Fund shares | 13,955,239 | 71,826,543 | | 13,322,263 | 65,988,627 |
| Redemptions | (83,222,979) | (426,709,756) | | (93,514,921) | (456,625,481) |
| Net increase (decrease) | 866,259 | $ 5,076,992 | | (16,908,823) | $ (76,890,316) |
8 Restricted Securities
At October 31, 2024, the Fund owned the following securities (representing 0.3% of net assets) which were restricted as to public resale and not registered under the Securities Act of 1933 (excluding Rule 144A securities). The Fund has various registration rights (exercisable under a variety of circumstances) with respect to these securities. The value of these securities is determined based on valuations provided by brokers when available, or if not available, they are valued at fair value using methods determined in good faith by or at the direction of the Trustees’ valuation designee.
| Description | Date(s) of
Acquisition | Principal Amount/
Shares | Cost | Value |
| Common Stocks | | | | |
| Ascent CNR Corp., Class A | 4/25/16, 11/16/16 | 32,029,863 | $ 18,931 | $ 8,968,362 |
| iFIT Health and Fitness, Inc. | 10/6/22 | 128,520 | 449,820 | 0 |
| New Cotai Participation Corp., Class B | 4/12/13 | 36 | 1,111,500 | 0 |
| Total Common Stocks | | | $1,580,251 | $8,968,362 |
| Miscellaneous | | | | |
| PGP Investors, LLC, Membership Interests | 10/23/12, 2/18/15, 4/23/18, 11/30/20, 12/17/21 | 57,265 | $ 0 | $ 9,737,830 |
| Total Miscellaneous | | | $0 | $9,737,830 |
| Preferred Stocks | | | | |
| AH Parent, Inc. (Alliant), Series A | 09/25/24 | $15,830,000 | $15,592,550 | $15,629,497 |
| Total Preferred Stocks | | | $15,592,550 | $15,629,497 |
| Total Restricted Securities | | | $17,172,801 | $34,335,689 |
Eaton Vance
Income Fund of Boston
October 31, 2024
Notes to Financial Statements — continued
9 Financial Instruments
The Fund may trade in financial instruments with off-balance sheet risk in the normal course of its investing activities. These financial instruments may include forward foreign currency exchange contracts and may involve, to a varying degree, elements of risk in excess of the amounts recognized for financial statement purposes. The notional or contractual amounts of these instruments represent the investment the Fund has in particular classes of financial instruments and do not necessarily represent the amounts potentially subject to risk. The measurement of the risks associated with these instruments is meaningful only when all related and offsetting transactions are considered. A summary of obligations under these financial instruments at October 31, 2024 is included in the Portfolio of Investments. At October 31, 2024, the Fund had sufficient cash and/or securities to cover commitments under these contracts.
The Fund is subject to foreign exchange risk in the normal course of pursuing its investment objectives. Because the Fund holds foreign currency denominated investments, the value of these investments and related receivables and payables may change due to future changes in foreign currency exchange rates. To hedge against this risk, the Fund enters into forward foreign currency exchange contracts.
The Fund enters into forward foreign currency exchange contracts that may contain provisions whereby the counterparty may terminate the contract under certain conditions, including but not limited to a decline in the Fund’s net assets below a certain level over a certain period of time, which would trigger a payment by the Fund for those derivatives in a liability position. At October 31, 2024, the fair value of derivatives with credit-related contingent features in a net liability position was $570,808. The aggregate fair value of assets pledged as collateral by the Fund for such liability was $560,000 at October 31, 2024.
The over-the-counter (OTC) derivatives in which the Fund invests are subject to the risk that the counterparty to the contract fails to perform its obligations under the contract. To mitigate this risk, the Fund has entered into an International Swaps and Derivatives Association, Inc. Master Agreement (“ISDA Master Agreement”) or similar agreement with substantially all its derivative counterparties. An ISDA Master Agreement is a bilateral agreement between the Fund and a counterparty that governs certain OTC derivatives and typically contains, among other things, set-off provisions in the event of a default and/or termination event as defined under the relevant ISDA Master Agreement. Under an ISDA Master Agreement, the Fund may, under certain circumstances, offset with the counterparty certain derivative financial instruments’ payables and/or receivables with collateral held and/or posted and create one single net payment. The provisions of the ISDA Master Agreement typically permit a single net payment in the event of default including the bankruptcy or insolvency of the counterparty. However, bankruptcy or insolvency laws of a particular jurisdiction may impose restrictions on or prohibitions against the right of offset in bankruptcy or insolvency. Certain ISDA Master Agreements allow counterparties to OTC derivatives to terminate derivative contracts prior to maturity in the event the Fund’s net assets decline by a stated percentage or the Fund fails to meet the terms of its ISDA Master Agreements, which would cause the counterparty to accelerate payment by the Fund of any net liability owed to it.
The collateral requirements for derivatives traded under an ISDA Master Agreement are governed by a Credit Support Annex to the ISDA Master Agreement. Collateral requirements are determined at the close of business each day and are typically based on changes in market values for each transaction under an ISDA Master Agreement and netted into one amount for such agreement. Generally, the amount of collateral due from or to a counterparty is subject to a minimum transfer threshold amount before a transfer is required, which may vary by counterparty. Collateral pledged for the benefit of the Fund and/or counterparty is held in segregated accounts by the Fund’s custodian and cannot be sold, re-pledged, assigned or otherwise used while pledged. The portion of such collateral representing cash, if any, is reflected as deposits for derivatives collateral and, in the case of cash pledged by a counterparty for the benefit of the Fund, a corresponding liability on the Statement of Assets and Liabilities. Securities pledged by the Fund as collateral, if any, are identified as such in the Portfolio of Investments.
The fair value of open derivative instruments (not considered to be hedging instruments for accounting disclosure purposes) and whose primary underlying risk exposure is foreign exchange risk at October 31, 2024 was as follows:
| | Fair Value |
| Derivative | Asset Derivative | Liability Derivative |
| Forward foreign currency exchange contracts | $77,514(1) | $(570,808)(2) |
| (1) | Statement of Assets and Liabilities location: Receivable for open forward foreign currency exchange contracts. |
| (2) | Statement of Assets and Liabilities location: Payable for open forward foreign currency exchange contracts. |
Eaton Vance
Income Fund of Boston
October 31, 2024
Notes to Financial Statements — continued
The Fund's derivative assets and liabilities at fair value by type, which are reported gross in the Statement of Assets and Liabilities, are presented in the table above.The following tables present the Fund’s derivative assets and liabilities by counterparty, net of amounts available for offset under a master netting agreement and net of the related collateral received by the Fund for such assets and pledged by the Fund for such liabilities as of October 31, 2024.
| Counterparty | Derivative
Assets Subject to
Master Netting
Agreement | Derivatives
Available
for Offset | Non-cash
Collateral
Received(a) | Cash
Collateral
Received(a) | Net Amount
of Derivative
Assets(b) |
| State Street Bank and Trust Company | $77,514 | $(77,514) | $ — | $ — | $ — |
| Counterparty | Derivative
Liabilities Subject to
Master Netting
Agreement | Derivatives
Available
for Offset | Non-cash
Collateral
Pledged(a) | Cash
Collateral
Pledged(a) | Net Amount
of Derivative
Liabilities(c) |
| State Street Bank and Trust Company | $(570,808) | $77,514 | $ — | $493,294 | $ — |
| (a) | In some instances, the total collateral received and/or pledged may be more than the amount shown due to overcollateralization. |
| (b) | Net amount represents the net amount due from the counterparty in the event of default. |
| (c) | Net amount represents the net amount payable to the counterparty in the event of default. |
The effect of derivative instruments (not considered to be hedging instruments for accounting disclosure purposes) on the Statement of Operations and whose primary underlying risk exposure is foreign exchange risk for the year ended October 31, 2024 was as follows:
| Derivative | Realized Gain (Loss)
on Derivatives Recognized
in Income(1) | Change in Unrealized
Appreciation (Depreciation) on
Derivatives Recognized in Income(2) |
| Forward foreign currency exchange contracts | $(1,631,752) | $(498,999) |
| (1) | Statement of Operations location: Net realized gain (loss): Forward foreign currency exchange contracts. |
| (2) | Statement of Operations location: Change in unrealized appreciation (depreciation): Forward foreign currency exchange contracts. |
The average notional amount of forward foreign currency exchange contracts (based on the absolute value of notional amounts of currency purchased and currency sold) outstanding during the year ended October 31, 2024, which is indicative of the volume of this derivative type, was approximately $91,692,000.
10 Line of Credit
The Fund participates with other portfolios and funds managed by BMR and its affiliates in a $650 million unsecured revolving line of credit agreement with a group of banks, which is in effect through October 21, 2025. Borrowings are made by the Fund solely for temporary purposes related to redemptions and other short-term cash needs. Interest is charged to the Fund based on its borrowings generally at an amount above either the Secured Overnight Financing Rate (SOFR) or Federal Funds rate. In addition, a fee computed at an annual rate of 0.15% on the daily unused portion of the line of credit is allocated among the participating portfolios and funds at the end of each quarter. In connection with the renewal of the agreement in October 2024, an arrangement fee of $150,000 was incurred that was allocated to the participating portfolios and funds. Because the line of credit is not available exclusively to the Fund, it may be unable to borrow some or all of its requested amounts at any particular time. The Fund did not have any significant borrowings or allocated fees during the year ended October 31, 2024.
Eaton Vance
Income Fund of Boston
October 31, 2024
Notes to Financial Statements — continued
11 Affiliated Investments
At October 31, 2024, the value of the Fund's investment in funds that may be deemed to be affiliated was $199,166,329, which represents 3.5% of the Fund's net assets. Transactions in such investments by the Fund for the year ended October 31, 2024 were as follows:
| Name | Value,
beginning
of period | Purchases | Sales
proceeds | Net realized
gain (loss) | Change in
unrealized
appreciation
(depreciation) | Value, end
of period | Dividend
income | Shares,
end of period |
| Short-Term Investments |
| Liquidity Fund | $161,394,075 | $1,490,709,426 | $(1,452,937,172) | $ — | $ — | $199,166,329 | $11,712,617 | 199,166,329 |
12 Fair Value Measurements
Under generally accepted accounting principles for fair value measurements, a three-tier hierarchy to prioritize the assumptions, referred to as inputs, is used in valuation techniques to measure fair value. The three-tier hierarchy of inputs is summarized in the three broad levels listed below.
| • | Level 1 – quoted prices in active markets for identical investments |
| • | Level 2 – other significant observable inputs (including quoted prices for similar investments, interest rates, prepayment speeds, credit risk, etc.) |
| • | Level 3 – significant unobservable inputs (including a fund's own assumptions in determining the fair value of investments) |
In cases where the inputs used to measure fair value fall in different levels of the fair value hierarchy, the level disclosed is determined based on the lowest level input that is significant to the fair value measurement in its entirety. The inputs or methodology used for valuing securities are not necessarily an indication of the risk associated with investing in those securities.
At October 31, 2024, the hierarchy of inputs used in valuing the Fund's investments and open derivative instruments, which are carried at fair value, were as follows:
| Asset Description | Level 1 | Level 2 | Level 3* | Total |
| Common Stocks | $ 12,552,540 | $ 5,561,690 | $ 8,968,362 | $ 27,082,592 |
| Convertible Bonds | — | 25,467,563 | — | 25,467,563 |
| Corporate Bonds | — | 4,854,800,238 | — | 4,854,800,238 |
| Preferred Stocks | 26,818,454 | 15,629,497 | — | 42,447,951 |
| Senior Floating-Rate Loans (Less Unfunded Loan Commitments) | — | 431,837,400 | 11,315,275 | 443,152,675 |
| Miscellaneous | — | 634,628 | 9,737,830 | 10,372,458 |
| Short-Term Investments | 199,166,329 | — | — | 199,166,329 |
| Total Investments | $238,537,323 | $5,333,931,016 | $30,021,467 | $5,602,489,806 |
| Forward Foreign Currency Exchange Contracts | $ — | $ 77,514 | $ — | $ 77,514 |
| Total | $238,537,323 | $5,334,008,530 | $30,021,467 | $5,602,567,320 |
| Liability Description | | | | |
| Forward Foreign Currency Exchange Contracts | $ — | $ (570,808) | $ — | $ (570,808) |
| Total | $ — | $ (570,808) | $ — | $ (570,808) |
| * | None of the unobservable inputs for Level 3 assets, individually or collectively, had a material impact on the Fund. |
Level 3 investments at the beginning and/or end of the period in relation to net assets were not significant and accordingly, a reconciliation of Level 3 assets for the year ended October 31, 2024 is not presented.
Eaton Vance
Income Fund of Boston
October 31, 2024
Notes to Financial Statements — continued
13 Risks and Uncertainties
Credit Risk
The Fund primarily invests in lower rated and comparable quality unrated high yield securities. These investments have different risks than investments in debt securities rated investment grade. Risk of loss upon default by the borrower is significantly greater with respect to such debt than with other debt securities because these securities are generally unsecured and are more sensitive to adverse economic conditions, such as recession or increasing interest rates, than are investment grade issuers.
Eaton Vance
Income Fund of Boston
October 31, 2024
Report of Independent Registered Public Accounting Firm
To the Trustees of Eaton Vance Series Trust II and Shareholders of Eaton Vance Income Fund of Boston:
Opinion on the Financial Statements and Financial Highlights
We have audited the accompanying statement of assets and liabilities of Eaton Vance Income Fund of Boston (the “Fund") (one of the funds constituting Eaton Vance Series Trust II), including the portfolio of investments, as of October 31, 2024, the related statement of operations for the year then ended, the statements of changes in net assets for each of the two years in the period then ended, the financial highlights for each of the five years in the period then ended, and the related notes. In our opinion, the financial statements and financial highlights present fairly, in all material respects, the financial position of the Fund as of October 31, 2024, and the results of its operations for the year then ended, the changes in its net assets for each of the two years in the period then ended, and the financial highlights for each of the five years in the period then ended, in conformity with accounting principles generally accepted in the United States of America.
Basis for Opinion
These financial statements and financial highlights are the responsibility of the Fund's management. Our responsibility is to express an opinion on the Fund's financial statements and financial highlights based on our audits. We are a public accounting firm registered with the Public Company Accounting Oversight Board (United States) (PCAOB) and are required to be independent with respect to the Fund in accordance with the U.S. federal securities laws and the applicable rules and regulations of the Securities and Exchange Commission and the PCAOB.
We conducted our audits in accordance with the standards of the PCAOB. Those standards require that we plan and perform the audit to obtain reasonable assurance about whether the financial statements and financial highlights are free of material misstatement, whether due to error or fraud. The Fund is not required to have, nor were we engaged to perform, an audit of its internal control over financial reporting. As part of our audits, we are required to obtain an understanding of internal control over financial reporting but not for the purpose of expressing an opinion on the effectiveness of the Fund’s internal control over financial reporting. Accordingly, we express no such opinion.
Our audits included performing procedures to assess the risks of material misstatement of the financial statements and financial highlights, whether due to error or fraud, and performing procedures that respond to those risks. Such procedures included examining, on a test basis, evidence regarding the amounts and disclosures in the financial statements and financial highlights. Our audits also included evaluating the accounting principles used and significant estimates made by management, as well as evaluating the overall presentation of the financial statements and financial highlights. Our procedures included confirmation of securities and senior loans owned as of October 31, 2024, by correspondence with the custodian, brokers and agent banks; when replies were not received from brokers and agent banks, we performed other auditing procedures. We believe that our audits provide a reasonable basis for our opinion.
/s/ Deloitte & Touche LLP
Boston, Massachusetts
December 18, 2024
We have served as the auditor of one or more Eaton Vance investment companies since 1959.
Eaton Vance
Income Fund of Boston
October 31, 2024
Federal Tax Information (Unaudited)
The Form 1099-DIV you receive in February 2025 will show the tax status of all distributions paid to your account in calendar year 2024. Shareholders are advised to consult their own tax adviser with respect to the tax consequences of their investment in the Fund. As required by the Internal Revenue Code and/or regulations, shareholders must be notified regarding the status of qualified dividend income for individuals and 163(j) interest dividends.
Qualified Dividend Income. For the fiscal year ended October 31, 2024, the Fund designates approximately $2,692,750, or up to the maximum amount of such dividends allowable pursuant to the Internal Revenue Code, as qualified dividend income eligible for the reduced tax rate of 15%.
163(j) Interest Dividends. For the fiscal year ended October 31, 2024, the Fund designates 85.73% of distributions from net investment income as a 163(j) interest dividend.
Eaton Vance
Income Fund of Boston
October 31, 2024
Board of Trustees’ Contract Approval
Overview of the Contract Review Process
The Investment Company Act of 1940, as amended (the “1940 Act”), provides, in substance, that the investment advisory agreement between a fund and its investment adviser will continue in effect from year-to-year only if its continuation is approved on an annual basis by a vote of the fund’s board of trustees, including a majority of the trustees who are not “interested persons” of the fund (“independent trustees”), cast in person at a meeting called for the purpose of considering such approval.
At a meeting held on June 6, 2024, the Boards of Trustees/Directors (collectively, the “Board”) that oversee the registered investment companies advised by Eaton Vance Management or its affiliate, Boston Management and Research (the “Eaton Vance Funds”), including a majority of the independent trustees (the “Independent Trustees”), voted to approve the continuation of existing investment advisory agreements and sub-advisory agreements1 for each of the Eaton Vance Funds for an additional one-year period. The Board relied upon the affirmative recommendation of its Contract Review Committee, which is a committee comprised of all of the Independent Trustees. Prior to making its recommendation, the Contract Review Committee reviewed information furnished by the adviser and sub-adviser to each of the Eaton Vance Funds (including information specifically requested by the Board) for a series of meetings held between April and June 2024, as well as certain additional information provided in response to specific requests from the Independent Trustees as members of the Contract Review Committee. Members of the Contract Review Committee also considered information received at prior meetings of the Board and its committees, to the extent such information was relevant to the Contract Review Committee’s annual evaluation of the investment advisory agreements and sub-advisory agreements.
In connection with its evaluation of the investment advisory agreements and sub-advisory agreements, the Board considered various information relating to the Eaton Vance Funds. This included information applicable to all or groups of Eaton Vance Funds, which is referenced immediately below, and information applicable to the particular Eaton Vance Fund covered by this report (each “Eaton Vance Fund” is referred to below as a “fund”). (For funds that invest through one or more underlying portfolios, references to “each fund” in this section may include information that was considered at the portfolio-level.)
Information about Fees, Performance and Expenses
• A report from an independent data provider comparing advisory and other fees paid by each fund to such fees paid by comparable funds, as identified by the independent data provider (“comparable funds”);
• A report from an independent data provider comparing each fund’s total expense ratio (and its components) to those of comparable funds;
• A report from an independent data provider comparing the investment performance of each fund (including, as relevant, total return data, income data, Sharpe ratios, and information ratios) to the investment performance of comparable funds and, as applicable, benchmark indices, over various time periods;
• In certain instances, data regarding investment performance relative to customized groups of peer funds and blended indices identified by the adviser in consultation with the Portfolio Management Committee of the Board (a committee exclusively comprised of Independent Trustees);
• Comparative information concerning the fees charged and services provided by the adviser and sub-adviser to each fund in managing other accounts (which may include other funds, collective investment trusts and institutional accounts) with the same or substantially similar investment objective as the fund and with a significant overlap in holdings based on criteria set by the Board, if any;
• Profitability analyses with respect to the adviser and sub-adviser to each of the funds;
Information about Portfolio Management and Trading
• Descriptions of the investment management services provided to each fund, as well as each of the funds’ investment strategies and policies;
• The procedures and processes used by the adviser to determine the value of fund assets, including, when necessary, the determination of “fair value” by the adviser in its role as each funds’ valuation designee and actions taken to monitor and test the effectiveness of such procedures and processes;
• Information about the policies and practices of each fund’s adviser and sub-adviser with respect to trading, including their processes for seeking best execution of portfolio transactions;
• Information about the allocation of brokerage transactions and the benefits, if any, received by the adviser and sub-adviser to each fund as a result of brokerage allocation, including, as applicable, information concerning the acquisition of research through client commission arrangements and policies with respect to “soft dollars”;
• Data relating to the portfolio turnover rate of each fund and related information regarding active management in the context of particular strategies;
Information about each Adviser and Sub-adviser
• Reports detailing the financial results and condition of the adviser and sub-adviser to each fund;
1 Not all Eaton Vance Funds have entered into a sub-advisory agreement with a sub-adviser. Accordingly, references to “sub-adviser” or “sub-advisory agreement” in this “Overview” section may not be applicable to the particular Eaton Vance Fund covered by this report. Eaton Vance Management and Boston Management and Research are referred to collectively as the “adviser.”
Eaton Vance
Income Fund of Boston
October 31, 2024
Board of Trustees’ Contract Approval — continued
• Information regarding the individual investment professionals whose responsibilities include portfolio management and investment research for the funds, and, for portfolio managers and certain other investment professionals, information relating to their responsibilities with respect to managing other funds and investment accounts, as applicable;
• Information regarding the adviser’s and its parent company’s (Morgan Stanley’s) efforts to retain and attract talented investment professionals, including in the context of a competitive marketplace for talent;
• Information regarding the adviser’s compensation methodology for its investment professionals and the incentives and accountability it creates, along with investment professionals’ investments in the fund(s) they manage;
• The personal trading codes of ethics of the adviser and its affiliates and the sub-adviser of each fund, together with information relating to compliance with, and the administration of, such codes;
• Policies and procedures relating to proxy voting, including regular reporting with respect to fund proxy voting activities;
• Information regarding the handling of corporate actions and class actions, as well as information regarding litigation and other regulatory matters;
• Information concerning the resources devoted to compliance efforts undertaken by the adviser and its affiliates and the sub-adviser of each fund, including descriptions of their various compliance programs and their record of compliance and remediation;
• Information concerning the business continuity and disaster recovery plans of the adviser and its affiliates and the sub-adviser of each fund;
• A description of the adviser’s oversight of sub-advisers, including with respect to regulatory and compliance issues, investment management and other matters;
Other Relevant Information
• Information regarding ongoing initiatives to further integrate and harmonize, where applicable, the investment management and other departments of the adviser and its affiliates with the overall investment management infrastructure of Morgan Stanley, in light of Morgan Stanley’s acquisition of Eaton Vance Corp. on March 1, 2021;
• Information concerning the nature, cost, and character of the administrative and other non-investment advisory services provided by the adviser and its affiliates;
• Information concerning oversight of the relationship with the custodian, subcustodians, fund accountants, and other third-party service providers by the adviser and/or administrator to each of the funds;
• Information concerning efforts to implement policies and procedures with respect to various regulations applicable to the funds, including Rule 12d1-4 (the Fund-of-Funds Rule), Rule 18f-4 (the Derivatives Rule), and Rule 2a-5 (the Fair Valuation Rule);
• For an Eaton Vance Fund structured as an exchange-listed closed-end fund, information concerning the benefits of the closed-end fund structure, as well as, where relevant, the closed-end fund’s market prices (including as compared to the closed-end fund’s net asset value (NAV)), trading volume data, continued use of auction preferred shares (where applicable), distribution rates, and other relevant matters;
• The risks that the adviser and/or its affiliates incur in connection with the management and operation of the funds, including, among others, litigation, regulatory, entrepreneurial, and other business risks (and the associated costs of such risks); and
• The terms of each investment advisory agreement and sub-advisory agreement.
During the various meetings of the Board and its committees over the course of the year leading up to the June 6, 2024 meeting, the Board and its committees received information from portfolio managers and other investment professionals of the adviser and sub-advisers of the funds regarding investment and performance matters, and considered various investment and trading strategies used in pursuing the funds’ investment objectives. The Board and its committees also received information regarding risk management techniques employed in connection with the management of the funds. The Board and its committees evaluated issues pertaining to industry and regulatory developments, compliance procedures, fund governance, and other issues with respect to the funds, and received and participated in reports and presentations provided by the adviser and sub-advisers, with respect to such matters. In addition to the formal meetings of the Board and its committees, the Independent Trustees held regular video or telephone conferences to discuss, among other topics, matters relating to the continuation of investment advisory agreements and sub-advisory agreements.
The Contract Review Committee was advised throughout the contract review process by Kirkland & Ellis LLP, independent legal counsel for the Independent Trustees. The members of the Contract Review Committee, with the advice of such counsel, exercised their own business judgment in determining the material factors to be considered in evaluating each investment advisory agreement and sub-advisory agreement and the weight to be given to each such factor. The conclusions reached with respect to each investment advisory agreement and sub-advisory agreement were based on a comprehensive evaluation of all the information provided and not any single factor. Moreover, each member of the Contract Review Committee may have placed varying emphasis on particular factors in reaching conclusions with respect to each investment advisory agreement and sub-advisory agreement. In evaluating each investment advisory agreement and sub-advisory agreement, including the fee structures and other terms contained in such agreements, the members of the Contract Review Committee were also informed by multiple years of analysis and discussion with the adviser and sub-adviser to each of the Eaton Vance Funds.
Results of the Contract Review Process
Based on its consideration of the foregoing, and such other information it deemed relevant, including the factors and conclusions described below, the Contract Review Committee concluded that the continuation of the investment advisory agreement between Eaton Vance Income Fund of Boston (the “Fund”) and Boston Management and Research (the “Adviser”), and the sub-advisory agreement between the Adviser and Eaton Vance Advisers
Eaton Vance
Income Fund of Boston
October 31, 2024
Board of Trustees’ Contract Approval — continued
International Ltd. (the “Sub-adviser”), an affiliate of the Adviser, with respect to the Fund, including their respective fee structures, are in the interests of shareholders and, therefore, recommended to the Board approval of each agreement. Based on the recommendation of the Contract Review Committee, the Board, including a majority of the Independent Trustees, voted to approve continuation of the investment advisory agreement and the sub-advisory agreement for the Fund.
Nature, Extent and Quality of Services
In considering whether to approve the investment advisory agreement and the sub-advisory agreement for the Fund, the Board evaluated the nature, extent and quality of services provided to the Fund by the Adviser and the Sub-adviser.
The Board considered the Adviser’s and the Sub-adviser’s management capabilities and investment processes in light of the types of investments held by the Fund, including the education and experience of the investment professionals who provide services to the Fund. Regarding the Adviser, the Board considered the Adviser’s responsibilities with respect to oversight of the Sub-adviser. The Board also considered the abilities and experience of the Adviser’s investment professionals in analyzing special considerations relevant to investing in high-yield debt. With respect to the Sub-adviser, the Board considered the abilities and experience of the Sub-adviser’s investment professionals in analyzing factors such as special considerations relevant to investing in global high yield debt and foreign markets. The Board considered the international investment capabilities of the Sub-adviser, which is based in London, and the benefits to the Fund of having portfolio management services involving investments in international securities provided by investment professionals located abroad. The Board also took into account the resources dedicated to portfolio management and other services, the compensation methods of the Adviser and other factors, including the reputation and resources of the Adviser to recruit and retain highly qualified research, advisory and supervisory investment professionals. In addition, the Board considered the time and attention devoted to the Eaton Vance Funds, including the Fund, by senior management, as well as the infrastructure, operational capabilities and support staff in place to assist in the portfolio management and operations of the Fund, including the provision of administrative services. The Board also considered the business-related and other risks to which the Adviser or its affiliates may be subject in managing the Fund.
The Board considered the compliance programs of the Adviser and relevant affiliates thereof, including the Sub-adviser. The Board considered compliance and reporting matters regarding, among other things, personal trading by investment professionals, disclosure of portfolio holdings, compliance with policies and procedures, portfolio valuation, business continuity and the allocation of investment opportunities. The Board also considered relevant examinations of the Adviser and its affiliates by regulatory authorities, such as the Securities and Exchange Commission and the Financial Industry Regulatory Authority.
The Board considered other administrative services provided or overseen by Eaton Vance Management and its affiliates, including transfer agency and accounting services. The Board evaluated the benefits to shareholders of investing in a fund that is a part of a large fund complex offering exposure to a variety of asset classes and investment disciplines, as well as the ability, in many cases, to exchange an investment among different funds without incurring additional sales charges.
After consideration of the foregoing factors, among others, the Board concluded that the nature, extent and quality of services provided by the Adviser and the Sub-adviser, taken as a whole, are appropriate and consistent with the terms of the investment advisory agreement and the sub-advisory agreement.
Fund Performance
The Board compared the Fund’s investment performance to that of comparable funds identified by an independent data provider (the peer group), as well as appropriate benchmark indices. The Board’s review included comparative performance data with respect to the Fund for the one-, three-, five- and ten-year periods ended December 31, 2023. In this regard, the Board noted that the performance of the Fund was higher than the median performance of the Fund’s peer group for the three-year period. The Board also noted that the performance of the Fund was higher than its primary and secondary benchmark indexes for the three-year period. The Board concluded that the performance of the Fund was satisfactory.
Management Fees and Expenses
The Board considered contractual fee rates payable by the Fund for advisory and administrative services (referred to collectively as “management fees”). As part of its review, the Board considered the Fund’s management fees and total expense ratio for the one-year period ended December 31, 2023, as compared to those of comparable funds, before and after giving effect to any undertaking to waive fees or reimburse expenses. The Board also considered certain factors identified by management in response to inquiries from the Contract Review Committee regarding the Fund’s total expense ratio relative to comparable funds. The Board also received and considered information about the services offered and the fee rates charged by the Adviser and/or Sub-adviser to other types of accounts with the same or substantially similar investment objective as the Fund and with a significant overlap in holdings based on criteria set by the Board. For any such type of account, the Board received information about the differences in the nature and scope of services the Adviser and/or Sub-adviser provide to the Fund as compared to other type of account and the material differences in compliance, reporting and other legal burdens and risks to the Adviser and/or Sub-adviser as between the Fund and other type of account.
After considering the foregoing information, and in light of the nature, extent and quality of the services provided by the Adviser and the Sub-adviser, the Board concluded that the management fees charged for advisory and related services are reasonable.
Eaton Vance
Income Fund of Boston
October 31, 2024
Board of Trustees’ Contract Approval — continued
Profitability and “Fall-Out” Benefits
The Board considered the level of profits realized by the Adviser and relevant affiliates thereof, including the Sub-adviser, in providing investment advisory and administrative services to the Fund and to all Eaton Vance Funds as a group. The Board considered the level of profits realized without regard to marketing support or other payments by the Adviser and its affiliates to third parties in respect of distribution or other services.
The Board concluded that, in light of the foregoing factors and the nature, extent and quality of the services rendered, the profits realized by the Adviser and its affiliates, including the Sub-adviser, are not excessive.
The Board also considered direct or indirect fall-out benefits received by the Adviser and its affiliates, including the Sub-adviser, in connection with their respective relationships with the Fund, including the benefits of research services that may be available to the Adviser or the Sub-adviser as a result of securities transactions effected for the Fund and other investment advisory clients.
Economies of Scale
In reviewing management fees and profitability, the Board also considered the extent to which the Adviser and its affiliates, on the one hand, and the Fund, on the other hand, can expect to realize benefits from economies of scale as the assets of the Fund increase. The Board acknowledged the difficulty in accurately measuring the benefits resulting from economies of scale, if any, with respect to the management of any specific fund or group of funds. To assist in the evaluation of the sharing of any economies of scale, the Board received data showing for recent years, asset levels, Adviser profitability and total expense ratios. Based upon the foregoing, the Board concluded that the Fund currently shares in the benefits from economies of scale, if any, when they are realized by the Adviser. The Board also concluded that the structure of the advisory fee, which includes breakpoints at several asset levels, will allow the Fund to continue to benefit from any economies of scale in the future.
Item 8. Changes in and Disagreements with Accountants for Open-End Management Investment Companies
Not applicable.
Item 9. Proxy Disclosures for Open-End Management Investment Companies
Not applicable.
Item 10. Remuneration Paid to Directors, Officers, and Others of Open-End Management Investment Companies
The information is disclosed as part of the Financial Statements included in Item 7 of this Form N-CSR.
Item 11. Statement Regarding Basis for Approval of Investment Advisory Contract
The information is included in Item 7 of this Form N-CSR.
Item 12. Disclosure of Proxy Voting Policies and Procedures for Closed-End Management Investment Companies
Not applicable.
Item 13. Portfolio Managers of Closed-End Management Investment Companies
Not applicable.
Item 14. Purchases of Equity Securities by Closed-End Management Investment Company and Affiliated Purchasers
Not applicable.
Item 15. Submission of Matters to a Vote of Security Holders
There have been no material changes to the procedures by which shareholders may recommend nominee to the Fund’s Board of Trustees since the Fund last provided disclosure in response to this item.
Item 16. Controls and Procedures
| (a) | It is the conclusion of the registrant’s principal executive officer and principal financial officer that the effectiveness of the registrant’s current disclosure controls and procedures (such disclosure controls and procedures having been evaluated within 90 days of the date of this filing) provide reasonable assurance that the information required to be disclosed by the registrant has been recorded, processed, summarized and reported within the time period specified in the Commission’s rules and forms and that the information required to be disclosed by the registrant has been accumulated and communicated to the registrant’s principal executive officer and principal financial officer in order to allow timely decisions regarding required disclosure. |
| (b) | There have been no changes in the registrant’s internal control over financial reporting during the period covered by this report that has materially affected, or is reasonably likely to materially affect, the registrant’s internal control over financial reporting. |
Item 17. Disclosure of Securities Lending Activities for Closed-End Management Investment Companies
Not applicable.
Item 18. Recovery of Erroneously Awarded Compensation
Not applicable.
Item 19. Exhibits
Signatures
Pursuant to the requirements of the Securities Exchange Act of 1934 and the Investment Company Act of 1940, the registrant has duly caused this report to be signed on its behalf by the undersigned, thereunto duly authorized.
| | |
| Eaton Vance Series Trust II |
| |
| By: | | /s/ Kenneth A. Topping |
| | Kenneth A. Topping |
| | Principal Executive Officer |
|
| Date: December 23, 2024 |
Pursuant to the requirements of the Securities Exchange Act of 1934 and the Investment Company Act of 1940, this report has been signed below by the following persons on behalf of the registrant and in the capacities and on the dates indicated.
| | |
| By: | | /s/ James F. Kirchner |
| | James F. Kirchner |
| | Principal Financial Officer |
|
| Date: December 23, 2024 |
| |
| By: | | /s/ Kenneth A. Topping |
| | Kenneth A. Topping |
| | Principal Executive Officer |
|
| Date: December 23, 2024 |