UNITED STATES
SECURITIES AND EXCHANGE COMMISSION
WASHINGTON, D.C. 20549
FORM N-CSR
CERTIFIED SHAREHOLDER REPORT OF REGISTERED
MANAGEMENT INVESTMENT COMPANIES
Investment Company Act file number:
Parnassus Funds (811-04044) and Parnassus Income Funds (811-06673)
Parnassus Funds
Parnassus Income Funds
(Exact name of registrant as specified in charter)
1 Market Street, Suite 1600, San Francisco, California 94105
(Address of principal executive offices) (Zip Code)
Marc C. Mahon
Parnassus Funds
Parnassus Income Funds
1 Market Street, Suite 1600, San Francisco, California 94105
(Name and address of agent for service)
Registrant’s telephone number, including area code: (415) 778-0200
Date of fiscal year end: December 31
Date of reporting period: June 30, 2024
Form N-CSR is to be used by management investment companies to file reports with the Commission not later than 10 days after the transmission to stockholders of any report that is required to be transmitted to stockholders under Rule 30e-1 under the Investment Company Act of 1940 (17 CFR 270.30e-1). The Commission may use the information provided on Form N-CSR in its regulatory, disclosure review, inspection, and policymaking roles.
A registrant is required to disclose the information specified by Form N-CSR, and the Commission will make this information public. A registrant is not required to respond to the collection of information contained in Form N-CSR unless the Form displays a currently valid Office of Management and Budget (“OMB”) control number. Please direct comments concerning the accuracy of the information collection burden estimate and any suggestions for reducing the burden to Secretary, Securities and Exchange Commission, 450 Fifth Street, NW, Washington, DC 20549-0609. The OMB has reviewed this collection of information under the clearance requirements of 44 U.S.C. § 3507.
Item 1. Report to Stockholders.
Parnassus Value Equity Fund
Class - Institutional Shares
Semi-Annual Shareholder Report - June 30, 2024
Parnassus Value Equity Fund (the "Fund") offers a concentrated portfolio of U.S. large-cap stocks that are attractively priced relative to their history or peers.
This semi-annual shareholder report contains important information about the Fund for the period of January 1, 2024 to June 30, 2024.
You can find additional information about the fund at www.parnassus.com. You can also request this information by contacting us at 800-999-3505.
What was the Fund's cost for the period?
(based on hypothetical $10,000 investment)
| Class name | Cost of a $10,000 investment | Cost paid as a % of a $10,000 investment |
|---|
| Institutional Shares | $33 | 0.65% |
How did the fund perform?
Parnassus Value Equity Fund (Institutional Shares) returned -3.74% (net of fees) for the quarter, underperforming the Russell 1000 Value Index. Stock selection in the Health Care sector drove most of the underperformance. Selection in the Consumer Staples and Industrials sectors detracted to a lesser degree.
The portfolio's positioning remained steady. The Fund maintained its overweights in Information Technology, Communication Services and Financials. We sold Cisco Systems and bought Broadcom for more attractive networking exposure, while adding to our existing cable positions.
We maintained diversification. Our artificial intelligence-related (AI-related) investments in information technology were complemented by holdings that provided exposure to other parts of the economy.
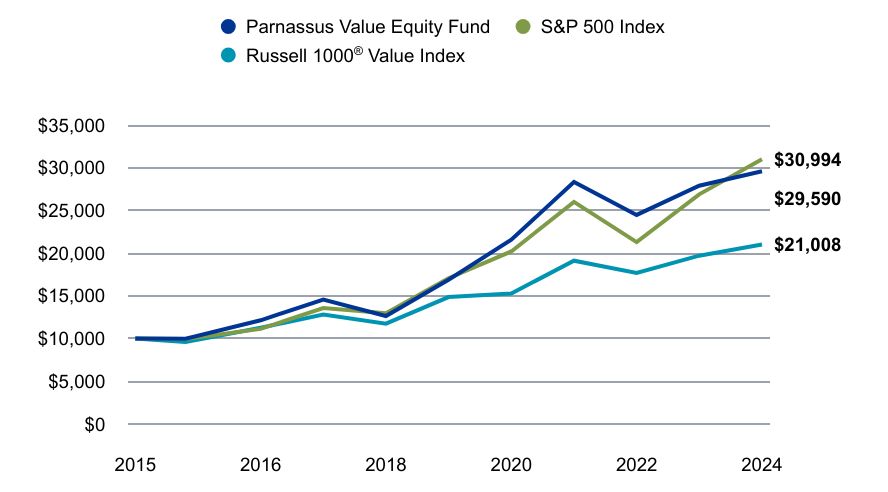
Value on June 30, 2024 of $10,000 invested on April 30, 2015.
| Parnassus Value Equity Fund | S&P 500 Index | Russell 1000® Value Index |
|---|
| | | |
|---|
| 2015 | $10,000 | $10,000 | $10,000 |
| 2015 | $9,978 | $9,947 | $9,597 |
| 2016 | $12,141 | $11,137 | $11,262 |
| 2017 | $14,573 | $13,569 | $12,801 |
| 2018 | $12,642 | $12,974 | $11,742 |
| 2019 | $16,885 | $17,059 | $14,859 |
| 2020 | $21,565 | $20,197 | $15,274 |
| 2021 | $28,330 | $25,995 | $19,117 |
| 2022 | $24,476 | $21,287 | $17,676 |
| 2023 | $27,888 | $26,883 | $19,703 |
| 2024 | $29,590 | $30,994 | $21,008 |
The chart shows the growth in value of a hypothetical $10,000 investment since inception and does not reflect the deduction of taxes a shareholder would pay on fund distributions or the redemption of fund shares. The Fund commenced operations on April 30, 2015.
The fund's past performance is not a good predictor of how the fund will perform in the future. The graph and table do not reflect the deduction of taxes that a shareholder would pay on fund distributions or redemption of fund shares.
| Total Net Assets | $4,902,949,310 |
| # of Portfolio Holdings | 44 |
| Portfolio Turnover Rate | 10% |
| Advisory Fees Paid | $15,609,747 |
Average Annual Total Returns (%)
| 1 Year | 5 years | Since Inception |
|---|
| Parnassus Value Equity Fund - Institutional Shares (Incp: April 30, 2015) | 15.38% | 14.59% | 12.56% |
| S&P 500 Index | 24.56% | 15.05% | 13.13% |
Russell 1000® Value Index | 13.06% | 9.01% | 8.43% |
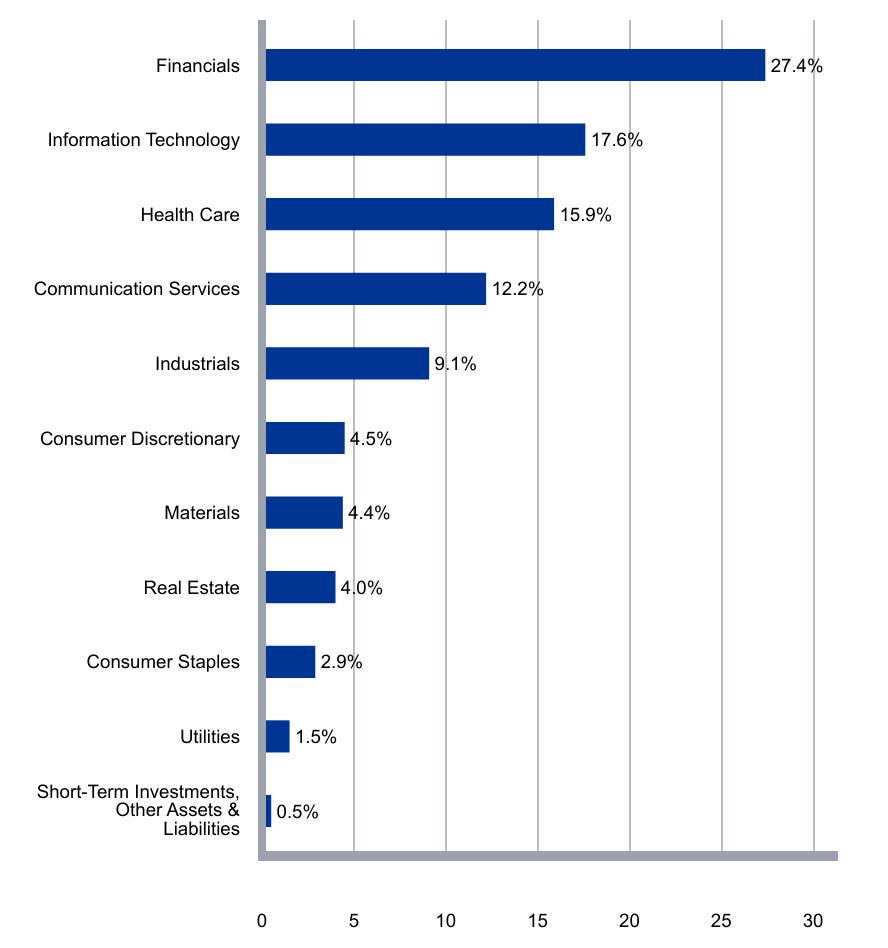
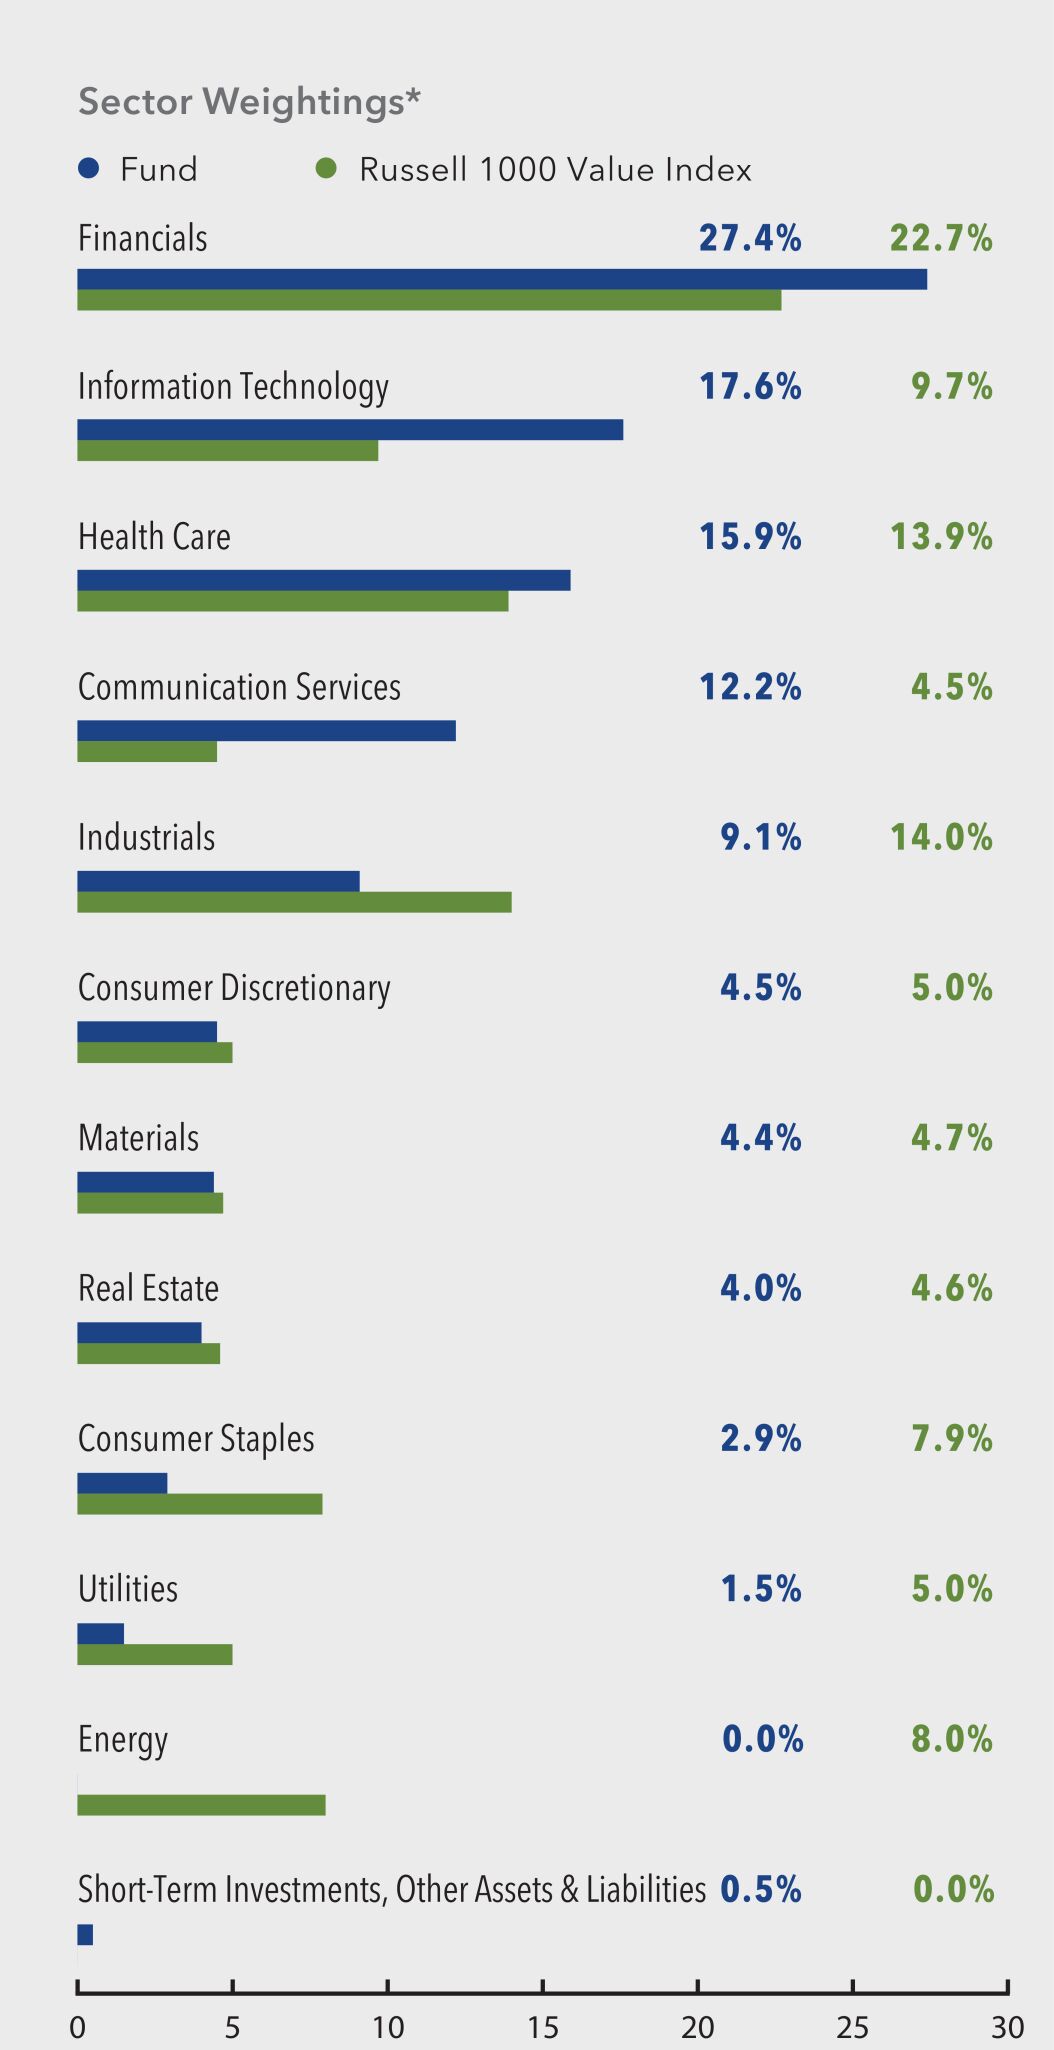
What did the Fund invest in?
Parnassus Value Equity Fund invests selectively in about 40-45 U.S. large-cap equity securities trading at a discount. The Fund pursues companies with increasingly relevant products and services, durable competitive advantages, strong management teams and sustainable business practices that are likely to thrive in a healthy economy and be resilient in an economic downturn.
| Value | Value |
|---|
| Short-Term Investments, Other Assets & Liabilities | 0.5% |
| Utilities | 1.5% |
| Consumer Staples | 2.9% |
| Real Estate | 4.0% |
| Materials | 4.4% |
| Consumer Discretionary | 4.5% |
| Industrials | 9.1% |
| Communication Services | 12.2% |
| Health Care | 15.9% |
| Information Technology | 17.6% |
| Financials | 27.4% |
| Verizon Communications Inc. | 4.2% |
| Bank of America Corp. | 3.5% |
| Oracle Corp. | 3.3% |
| S&P Global Inc. | 3.0% |
| Alphabet Inc., Class A | 3.0% |
| Sysco Corp. | 2.9% |
| Ball Corp. | 2.8% |
| The Bank of New York Mellon Corp. | 2.8% |
| Micron Technology Inc. | 2.7% |
| Microsoft Corp. | 2.7% |
Parnassus Value Equity Fund
Class - Institutional Shares
Semi-Annual Shareholder Report - June 30, 2024
If you wish to view additional information about the Fund; including, but not limited to, financial statements or holdings, please call us or visit our website:
Phone: 800-999-3505
Website: www.parnassus.com
No material changes to the Fund in the last reporting period.
Change in or Disagreements with Accountants
There have been no changes to or disagreements with the accountants in the last reporting period.
© 2024 Parnassus Investments, LLC. All rights reserved. PARNASSUS, PARNASSUS INVESTMENTS, and PARNASSUS FUNDS are federally registered trademarks of Parnassus Investments, LLC. The Parnassus Funds are distributed by Parnassus Funds Distributor, LLC.
If you wish to receive a copy of this document at a new address, contact 800-999-3505.
Parnassus Growth Equity Fund
Class - Institutional Shares
Semi-Annual Shareholder Report - June 30, 2024
Parnassus Growth Equity Fund (the "Fund") offers a concentrated portfolio of U.S. large-cap stocks with the potential to benefit from secular trends at attractive valuations.
This semi-annual shareholder report contains important information about the Fund for the period of January 1, 2024 to June 30, 2024.
You can find additional information about the fund at www.parnassus.com. You can also request this information by contacting us at 800-999-3505.
What was the Fund's cost for the period?
(based on hypothetical $10,000 investment)
| Class name | Cost of a $10,000 investment | Cost paid as a % of a $10,000 investment |
|---|
| Institutional Shares | $34 | 0.63% |
How did the fund perform?
The Parnassus Growth Equity Fund (Institutional Shares) returned 3.78% (net of fees) for the quarter, underperforming the Russell 1000 Growth Index. The underperformance was primarily driven by our stock selection in the Information Technology sector. An overweight position and stock selection in the Financials sector also detracted.
We took advantage of recent sell-offs to add two new positions in Financials and Information Technology: MSCI and Workday, respectively. We offset these new holdings by trimming our existing positions and selling Palo Alto Networks within Information Technology.
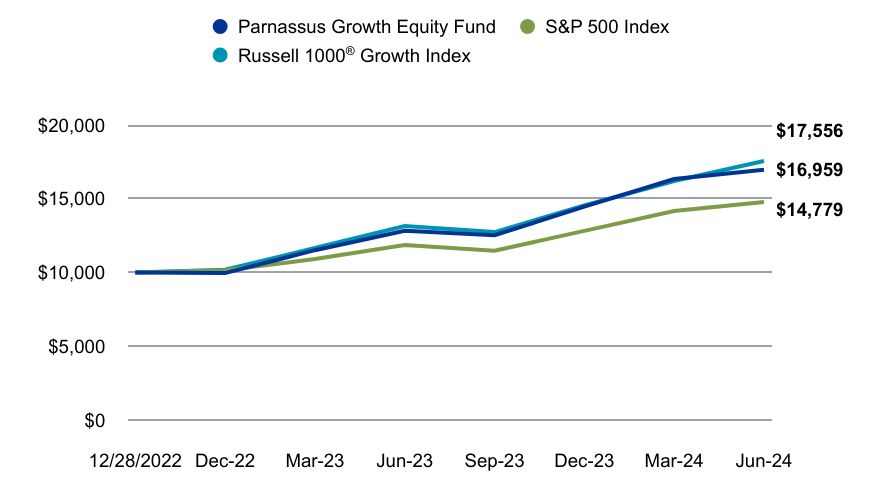
Value on June 30, 2024 of $10,000 invested on December 28, 2022.
| Parnassus Growth Equity Fund | S&P 500 Index | Russell 1000® Growth Index |
|---|
| | | |
|---|
| 12/28/2022 | $10,000 | $10,000 | $10,000 |
| Dec-22 | $9,960 | $10,151 | $10,194 |
| Mar-23 | $11,513 | $10,912 | $11,659 |
| Jun-23 | $12,827 | $11,866 | $13,152 |
| Sep-23 | $12,527 | $11,477 | $12,741 |
| Dec-23 | $14,460 | $12,819 | $14,545 |
| Mar-24 | $16,341 | $14,172 | $16,205 |
| Jun-24 | $16,959 | $14,779 | $17,556 |
The chart shows the growth in value of a hypothetical $10,000 investment since inception and does not reflect the deduction of taxes a shareholder would pay on fund distributions or the redemption of fund shares. The Fund commenced operations on December 28, 2022.
The fund's past performance is not a good predictor of how the fund will perform in the future. The graph and table do not reflect the deduction of taxes that a shareholder would pay on fund distributions or redemption of fund shares.
| Total Net Assets | $49,937,183 |
| # of Portfolio Holdings | 41 |
| Portfolio Turnover Rate | 15% |
| Advisory Fees Paid | $21,511 |
Average Annual Total Returns (%)
| 1 Year | Since Inception |
|---|
| Parnassus Growth Equity Fund - Institutional Shares (Incp: December 28, 2022) | 32.21% | 42.03% |
| S&P 500 Index | 24.56% | 29.63% |
Russell 1000® Growth Index | 33.48% | 45.33% |
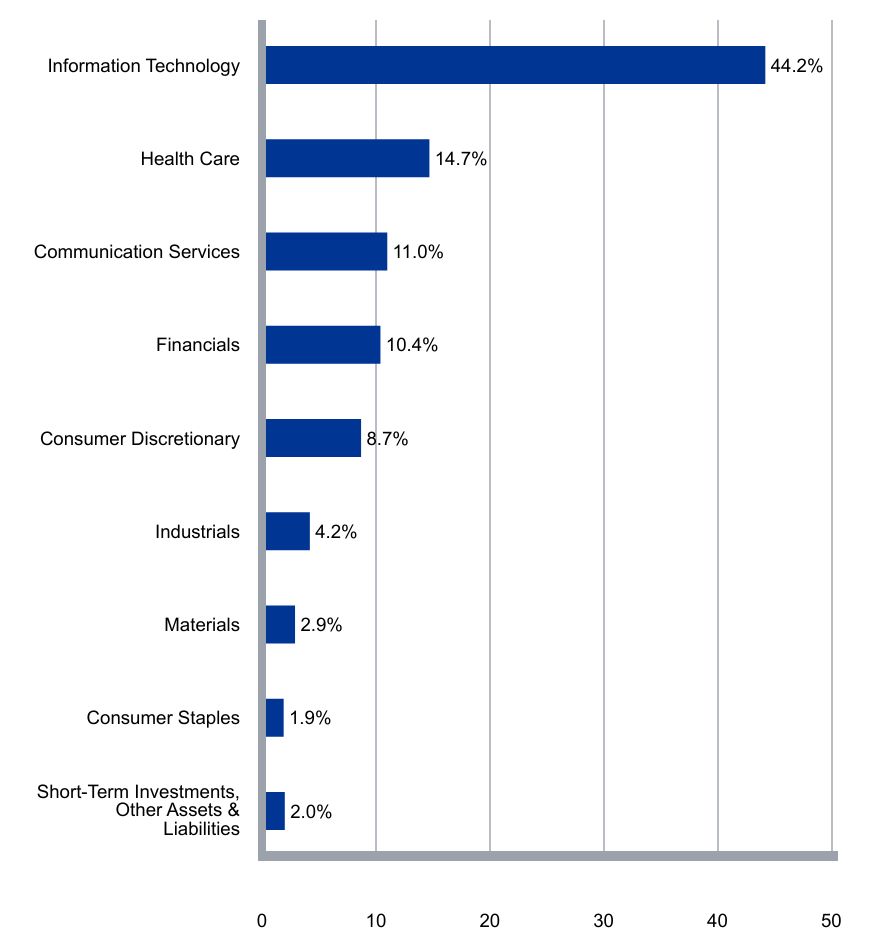
What did the Fund invest in?
Parnassus Growth Equity Fund invests selectively in about 40 U.S. large-cap equity securities. The Fund pursues high quality companies with increasing relevancy, durable competitive advantages, strong management teams and sustainable business practices. It favors leading, innovative companies positioned to capitalize on secular trends.
| Value | Value |
|---|
| Short-Term Investments, Other Assets & Liabilities | 2.0% |
| Consumer Staples | 1.9% |
| Materials | 2.9% |
| Industrials | 4.2% |
| Consumer Discretionary | 8.7% |
| Financials | 10.4% |
| Communication Services | 11.0% |
| Health Care | 14.7% |
| Information Technology | 44.2% |
| Microsoft Corp. | 8.4% |
| Alphabet Inc., Class A | 8.1% |
| NVIDIA Corp. | 7.7% |
| Amazon.com Inc. | 4.9% |
| Apple Inc. | 4.5% |
| Visa Inc., Class A | 4.1% |
| Eli Lilly & Co. | 3.4% |
| Salesforce Inc. | 3.3% |
| Broadcom Inc. | 2.9% |
| Intuit Inc. | 2.4% |
Parnassus Growth Equity Fund
Class - Institutional Shares
Semi-Annual Shareholder Report - June 30, 2024
If you wish to view additional information about the Fund; including, but not limited to, financial statements or holdings, please call us or visit our website:
Phone: 800-999-3505
Website: www.parnassus.com
No material changes to the Fund in the last reporting period.
Change in or Disagreements with Accountants
There have been no changes to or disagreements with the accountants in the last reporting period.
© 2024 Parnassus Investments, LLC. All rights reserved. PARNASSUS, PARNASSUS INVESTMENTS, and PARNASSUS FUNDS are federally registered trademarks of Parnassus Investments, LLC. The Parnassus Funds are distributed by Parnassus Funds Distributor, LLC.
If you wish to receive a copy of this document at a new address, contact 800-999-3505.
Semi-Annual Shareholder Report - June 30, 2024
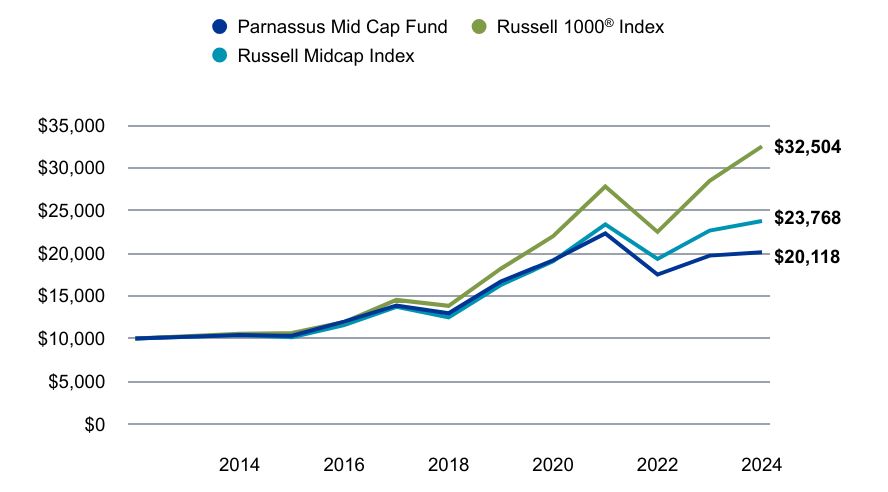
Parnassus Mid Cap Fund (the "Fund") offers a concentrated portfolio U.S. mid-cap stocks with the potential for long-term growth and business resiliency.
This semi-annual shareholder report contains important information about the Fund for the period of January 1, 2024 to June 30, 2024.
You can find additional information about the fund at www.parnassus.com. You can also request this information by contacting us at 800-999-3505.
What was the Fund's cost for the period?
(based on hypothetical $10,000 investment)
| Class name | Cost of a $10,000 investment | Cost paid as a % of a $10,000 investment |
|---|
| Investor Shares | $48 | 0.96% |
How did the fund perform?
The Parnassus Mid Fund (Investor Shares) returned -5.80% (net of fees) for the quarter, underperforming the Russell Midcap Index. The portfolio's underperformance was primarily driven by stock selection. The Health Care and Industrials sectors were the biggest detractors, due in part to our overweight positioning in life sciences tools and freight transportation stocks.
We shifted the portfolio position in the Consumer Staples sector from a modest underweight to a significant underweight during the quarter and increased the overweight position in the Information Technology sector.
Value on June 30, 2024 of $10,000 invested on June 30, 2014.
| Parnassus Mid Cap Fund | Russell 1000® Index | Russell Midcap Index |
|---|
| | | |
|---|
| 2013 | $10,000 | $10,000 | $10,000 |
| 2014 | $10,414 | $10,557 | $10,418 |
| 2015 | $10,324 | $10,653 | $10,164 |
| 2016 | $11,984 | $11,938 | $11,567 |
| 2017 | $13,876 | $14,526 | $13,708 |
| 2018 | $12,955 | $13,831 | $12,467 |
| 2019 | $16,680 | $18,178 | $16,274 |
| 2020 | $19,162 | $21,989 | $19,057 |
| 2021 | $22,303 | $27,806 | $23,361 |
| 2022 | $17,494 | $22,488 | $19,316 |
| 2023 | $19,711 | $28,453 | $22,644 |
| 2024 | $20,118 | $32,504 | $23,768 |
The chart shows the growth in value of a hypothetical $10,000 investment over the last 10 years and does not reflect the deduction of taxes a shareholder would pay on fund distributions or the redemption of fund shares.
The fund's past performance is not a good predictor of how the fund will perform in the future. The graph and table do not reflect the deduction of taxes that a shareholder would pay on fund distributions or redemption of fund shares.
| Total Net Assets | $3,037,798,726 |
| # of Portfolio Holdings | 40 |
| Portfolio Turnover Rate | 33% |
| Advisory Fees Paid | $12,512,960 |
Average Annual Total Returns (%)
| 1 Year | 5 years | 10 Years |
|---|
| Parnassus Mid Cap Fund - Investor Shares | 10.06% | 4.98% | 7.24% |
Russell 1000® Index | 23.88% | 14.61% | 12.51% |
| Russell Midcap Index | 12.88% | 9.46% | 9.04% |
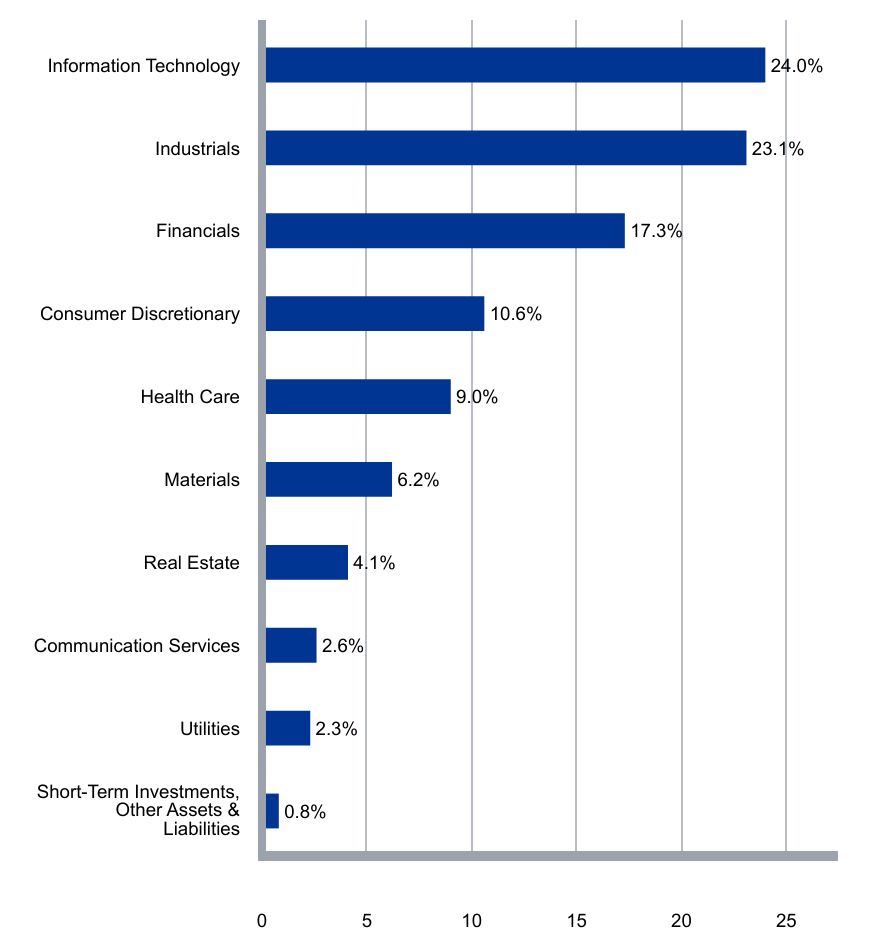
What did the Fund invest in?
Parnassus Mid Cap Fund invests selectively in about 35-45 U.S. mid-cap equity securities. The Fund pursues high quality companies with increasingly relevant products and services, durable competitive advantages, strong management teams and sustainable business practices that are likely to thrive in a healthy economy and be resilient in an economic downturn.
| Value | Value |
|---|
| Short-Term Investments, Other Assets & Liabilities | 0.8% |
| Utilities | 2.3% |
| Communication Services | 2.6% |
| Real Estate | 4.1% |
| Materials | 6.2% |
| Health Care | 9.0% |
| Consumer Discretionary | 10.6% |
| Financials | 17.3% |
| Industrials | 23.1% |
| Information Technology | 24.0% |
| Fidelity National Information Services | 3.9% |
| Guidewire Software Inc. | 3.7% |
| Roper Technologies Inc. | 3.6% |
| J.B. Hunt Transport Services Inc. | 3.5% |
| Cboe Global Markets Inc. | 3.5% |
| KLA Corp. | 3.2% |
| TransUnion | 3.2% |
| Republic Services Inc., Class A | 3.1% |
| Hologic Inc. | 3.1% |
| Ross Stores Inc. | 2.9% |
Semi-Annual Shareholder Report - June 30, 2024
If you wish to view additional information about the Fund; including, but not limited to, financial statements or holdings, please call us or visit our website:
Phone: 800-999-3505
Website: www.parnassus.com
No material changes to the Fund in the last reporting period.
Change in or Disagreements with Accountants
There have been no changes to or disagreements with the accountants in the last reporting period.
© 2024 Parnassus Investments, LLC. All rights reserved. PARNASSUS, PARNASSUS INVESTMENTS, and PARNASSUS FUNDS are federally registered trademarks of Parnassus Investments, LLC. The Parnassus Funds are distributed by Parnassus Funds Distributor, LLC.
If you wish to receive a copy of this document at a new address, contact 800-999-3505.
Parnassus Mid Cap Growth Fund
Semi-Annual Shareholder Report - June 30, 2024
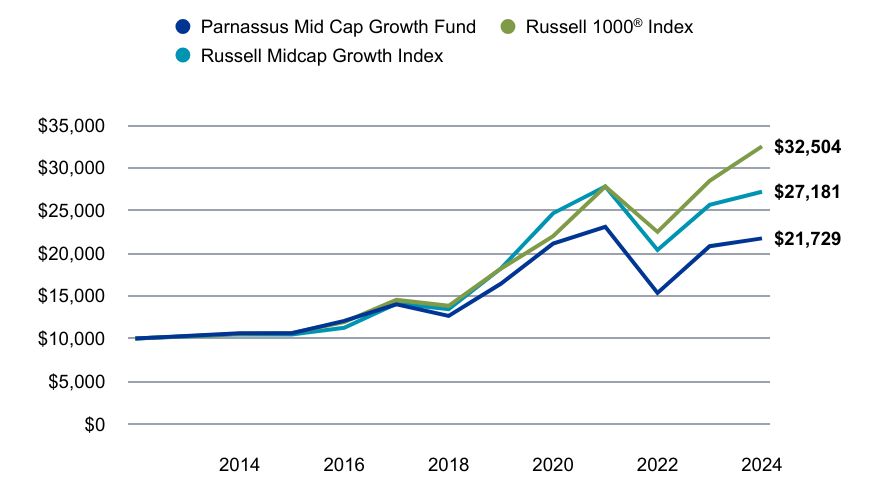
Parnassus Mid Cap Growth Fund (the "Fund") offers a concentrated portfolio of U.S. mid-cap, fast-growing companies with healthy balance sheets and proven financial models
This semi-annual shareholder report contains important information about the Fund for the period of January 1, 2024 to June 30, 2024.
You can find additional information about the fund at www.parnassus.com. You can also request this information by contacting us at 800-999-3505.
What was the Fund's cost for the period?
(based on hypothetical $10,000 investment)
| Class name | Cost of a $10,000 investment | Cost paid as a % of a $10,000 investment |
|---|
| Investor Shares | $41 | 0.80% |
How did the fund perform?
The Parnassus Mid Cap Growth Fund (Investor Shares) returned -3.20% (net of fees) for the second quarter of 2024, approximately in line with the Russell Midcap Growth Index's -3.21% return. Stock selection in the Information Technology and Industrials sectors contributed to relative results, while selection within Real Estate and Health Care detracted.
The portfolio position in Consumer Discretionary shifted from an overweight to an underweight during the quarter, while the overweight position in Information Technology increased.
Value on June 30, 2024 of $10,000 invested on June 30, 2014.
| Parnassus Mid Cap Growth Fund | Russell 1000® Index | Russell Midcap Growth Index |
|---|
| | | |
|---|
| 2013 | $10,000 | $10,000 | $10,000 |
| 2014 | $10,609 | $10,557 | $10,507 |
| 2015 | $10,637 | $10,653 | $10,486 |
| 2016 | $12,068 | $11,938 | $11,254 |
| 2017 | $14,008 | $14,526 | $14,097 |
| 2018 | $12,645 | $13,831 | $13,427 |
| 2019 | $16,416 | $18,178 | $18,189 |
| 2020 | $21,112 | $21,989 | $24,662 |
| 2021 | $23,090 | $27,806 | $27,801 |
| 2022 | $15,350 | $22,488 | $20,372 |
| 2023 | $20,815 | $28,453 | $25,648 |
| 2024 | $21,729 | $32,504 | $27,181 |
The chart shows the growth in value of a hypothetical $10,000 investment over the last 10 years and does not reflect the deduction of taxes a shareholder would pay on fund distributions or the redemption of fund shares.
The fund's past performance is not a good predictor of how the fund will perform in the future. The graph and table do not reflect the deduction of taxes that a shareholder would pay on fund distributions or redemption of fund shares.
| Total Net Assets | $831,325,790 |
| # of Portfolio Holdings | 40 |
| Portfolio Turnover Rate | 20% |
| Advisory Fees Paid | $2,519,872 |
Average Annual Total Returns (%)
| 1 Year | 5 years | 10 Years |
|---|
| Parnassus Mid Cap Growth Fund - Investor Shares | 19.29% | 7.43% | 8.07% |
Russell 1000® Index | 23.88% | 14.61% | 12.51% |
| Russell Midcap Growth Index | 15.05% | 9.93% | 10.52% |
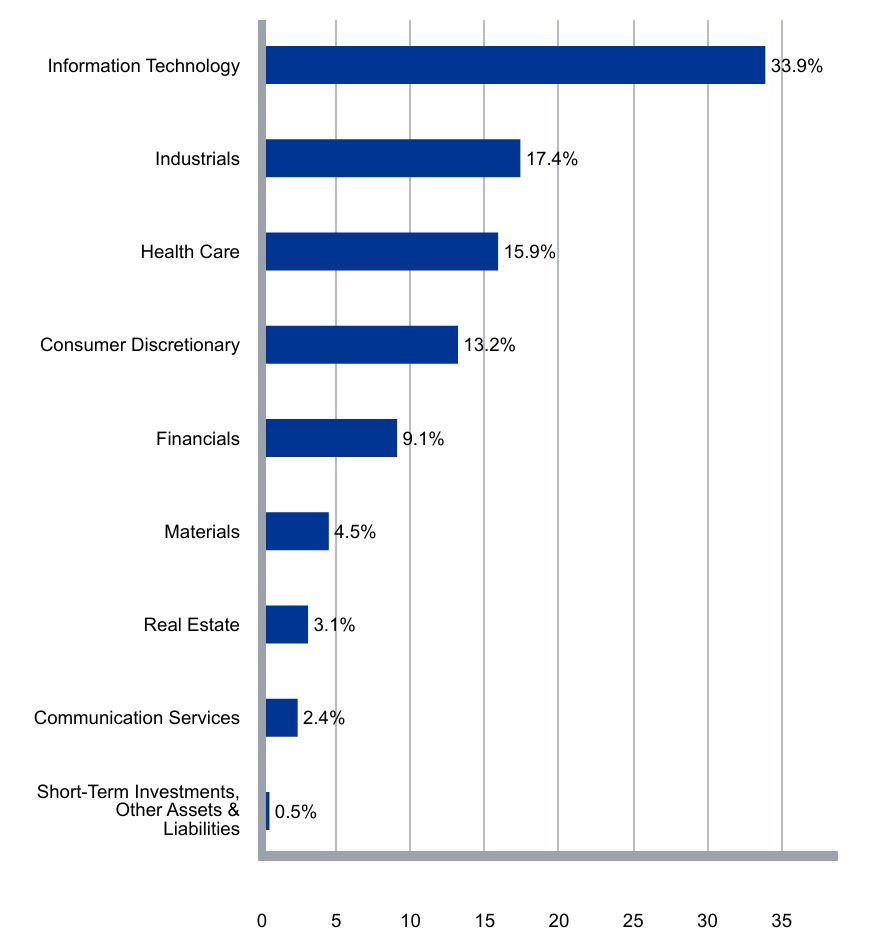
What did the Fund invest in?
Parnassus Mid Cap Growth Fund invests selectively in about 35-45 U.S. mid-cap growth equity securities. The Fund pursues best-in-class, high quality companies with increasingly relevant products and services, durable competitive advantages, strong management teams and sustainable business practices that are likely to thrive in a healthy economy and be resilient in a downturn.
| Value | Value |
|---|
| Short-Term Investments, Other Assets & Liabilities | 0.5% |
| Communication Services | 2.4% |
| Real Estate | 3.1% |
| Materials | 4.5% |
| Financials | 9.1% |
| Consumer Discretionary | 13.2% |
| Health Care | 15.9% |
| Industrials | 17.4% |
| Information Technology | 33.9% |
| Guidewire Software Inc. | 5.5% |
| Teradyne Inc. | 4.9% |
| Equifax Inc. | 4.3% |
| Trane Technologies plc | 3.6% |
| KLA Corp. | 3.6% |
| Agilent Technologies Inc. | 3.4% |
| Ross Stores Inc. | 3.4% |
| CoStar Group Inc. | 3.1% |
| Monolithic Power Systems Inc. | 3.0% |
| Mettler-Toledo International Inc. | 3.0% |
Parnassus Mid Cap Growth Fund
Semi-Annual Shareholder Report - June 30, 2024
If you wish to view additional information about the Fund; including, but not limited to, financial statements or holdings, please call us or visit our website:
Phone: 800-999-3505
Website: www.parnassus.com
No material changes to the Fund in the last reporting period.
Change in or Disagreements with Accountants
There have been no changes to or disagreements with the accountants in the last reporting period.
© 2024 Parnassus Investments, LLC. All rights reserved. PARNASSUS, PARNASSUS INVESTMENTS, and PARNASSUS FUNDS are federally registered trademarks of Parnassus Investments, LLC. The Parnassus Funds are distributed by Parnassus Funds Distributor, LLC.
If you wish to receive a copy of this document at a new address, contact 800-999-3505.
Parnassus Value Equity Fund
Semi-Annual Shareholder Report - June 30, 2024
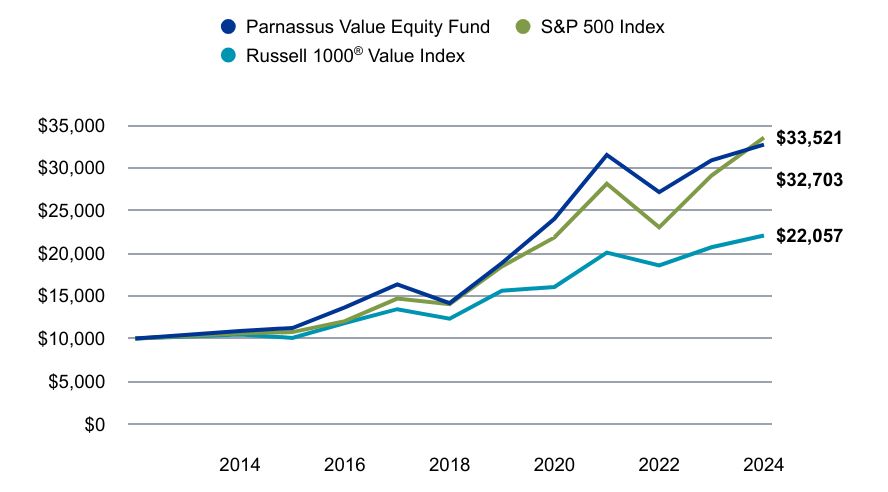
Parnassus Value Equity Fund (the "Fund") offers a concentrated portfolio of U.S. large-cap stocks that are attractively priced relative to their history or peers.
This semi-annual shareholder report contains important information about the Fund for the period of January 1, 2024 to June 30, 2024.
You can find additional information about the fund at www.parnassus.com. You can also request this information by contacting us at 800-999-3505.
What was the Fund's cost for the period?
(based on hypothetical $10,000 investment)
| Class name | Cost of a $10,000 investment | Cost paid as a % of a $10,000 investment |
|---|
| Investor Shares | $45 | 0.88% |
How did the fund perform?
Parnassus Value Equity Fund (Investor Shares) returned -3.81% (net of fees) for the quarter, underperforming the Russell 1000 Value Index. Stock selection in the Health Care sector drove most of the underperformance. Selection in the Consumer Staples and Industrials sectors detracted to a lesser degree.
The portfolio's positioning remained steady. The Fund maintained its overweights in Information Technology, Communication Services and Financials. We sold Cisco Systems and bought Broadcom for more attractive networking exposure, while adding to our existing cable positions.
We maintained diversification. Our artificial intelligence-related (AI-related) investments in information technology were complemented by holdings that provided exposure to other parts of the economy.
Value on June 30, 2024 of $10,000 invested on June 30, 2014.
| Parnassus Value Equity Fund | S&P 500 Index | Russell 1000® Value Index |
|---|
| | | |
|---|
| 2013 | $10,000 | $10,000 | $10,000 |
| 2014 | $10,883 | $10,612 | $10,478 |
| 2015 | $11,237 | $10,758 | $10,077 |
| 2016 | $13,643 | $12,045 | $11,824 |
| 2017 | $16,346 | $14,675 | $13,440 |
| 2018 | $14,141 | $14,031 | $12,329 |
| 2019 | $18,849 | $18,449 | $15,601 |
| 2020 | $24,017 | $21,844 | $16,037 |
| 2021 | $31,491 | $28,114 | $20,072 |
| 2022 | $27,141 | $23,023 | $18,559 |
| 2023 | $30,859 | $29,075 | $20,686 |
| 2024 | $32,703 | $33,521 | $22,057 |
The chart shows the growth in value of a hypothetical $10,000 investment over the last 10 years and does not reflect the deduction of taxes a shareholder would pay on fund distributions or the redemption of fund shares.
The fund's past performance is not a good predictor of how the fund will perform in the future. The graph and table do not reflect the deduction of taxes that a shareholder would pay on fund distributions or redemption of fund shares.
| Total Net Assets | $4,902,949,310 |
| # of Portfolio Holdings | 44 |
| Portfolio Turnover Rate | 10% |
| Advisory Fees Paid | $15,609,747 |
Average Annual Total Returns (%)
| 1 Year | 5 years | 10 Years |
|---|
| Parnassus Value Equity Fund - Investor Shares | 15.13% | 14.34% | 12.58% |
| S&P 500 Index | 24.56% | 15.05% | 12.86% |
Russell 1000® Value Index | 13.06% | 9.01% | 8.23% |
What did the Fund invest in?
Parnassus Value Equity Fund invests selectively in about 40-45 U.S. large-cap equity securities trading at a discount. The Fund pursues companies with increasingly relevant products and services, durable competitive advantages, strong management teams and sustainable business practices that are likely to thrive in a healthy economy and be resilient in an economic downturn.
| Value | Value |
|---|
| Short-Term Investments, Other Assets & Liabilities | 0.5% |
| Utilities | 1.5% |
| Consumer Staples | 2.9% |
| Real Estate | 4.0% |
| Materials | 4.4% |
| Consumer Discretionary | 4.5% |
| Industrials | 9.1% |
| Communication Services | 12.2% |
| Health Care | 15.9% |
| Information Technology | 17.6% |
| Financials | 27.4% |
| Verizon Communications Inc. | 4.2% |
| Bank of America Corp. | 3.5% |
| Oracle Corp. | 3.3% |
| S&P Global Inc. | 3.0% |
| Alphabet Inc., Class A | 3.0% |
| Sysco Corp. | 2.9% |
| Ball Corp. | 2.8% |
| The Bank of New York Mellon Corp. | 2.8% |
| Micron Technology Inc. | 2.7% |
| Microsoft Corp. | 2.7% |
Parnassus Value Equity Fund
Semi-Annual Shareholder Report - June 30, 2024
If you wish to view additional information about the Fund; including, but not limited to, financial statements or holdings, please call us or visit our website:
Phone: 800-999-3505
Website: www.parnassus.com
No material changes to the Fund in the last reporting period.
Change in or Disagreements with Accountants
There have been no changes to or disagreements with the accountants in the last reporting period.
© 2024 Parnassus Investments, LLC. All rights reserved. PARNASSUS, PARNASSUS INVESTMENTS, and PARNASSUS FUNDS are federally registered trademarks of Parnassus Investments, LLC. The Parnassus Funds are distributed by Parnassus Funds Distributor, LLC.
If you wish to receive a copy of this document at a new address, contact 800-999-3505.
Class - Institutional Shares
Semi-Annual Shareholder Report - June 30, 2024
Parnassus Mid Cap Fund (the "Fund") offers a concentrated portfolio U.S. mid-cap stocks with the potential for long-term growth and business resiliency.
This semi-annual shareholder report contains important information about the Fund for the period of January 1, 2024 to June 30, 2024.
You can find additional information about the fund at www.parnassus.com. You can also request this information by contacting us at 800-999-3505.
What was the Fund's cost for the period?
(based on hypothetical $10,000 investment)
| Class name | Cost of a $10,000 investment | Cost paid as a % of a $10,000 investment |
|---|
| Institutional Shares | $38 | 0.75% |
How did the fund perform?
The Parnassus Mid Cap Fund (Institutional Shares) returned -5.77% (net of fees) for the quarter, underperforming the Russell Midcap Index. The portfolio's underperformance was primarily driven by stock selection. The Health Care and Industrials sectors were the biggest detractors, due in part to our overweight positioning in life sciences tools and freight transportation stocks.
We shifted the portfolio position in the Consumer Staples sector from a modest underweight to a significant underweight during the quarter and increased the overweight position in the Information Technology sector.
Value on June 30, 2024 of $10,000 invested on April 30, 2015.
| Parnassus Mid Cap Fund | Russell 1000® Index | Russell Midcap Index |
|---|
| | | |
|---|
| 2015 | $10,000 | $10,000 | $10,000 |
| 2015 | $9,870 | $9,864 | $9,471 |
| 2016 | $11,477 | $11,053 | $10,778 |
| 2017 | $13,318 | $13,450 | $12,774 |
| 2018 | $12,467 | $12,806 | $11,617 |
| 2019 | $16,084 | $16,831 | $15,165 |
| 2020 | $18,524 | $20,359 | $17,758 |
| 2021 | $21,605 | $25,745 | $21,769 |
| 2022 | $16,979 | $20,821 | $18,000 |
| 2023 | $19,172 | $26,344 | $21,100 |
| 2024 | $19,587 | $30,094 | $22,148 |
The chart shows the growth in value of a hypothetical $10,000 investment since inception and does not reflect the deduction of taxes a shareholder would pay on fund distributions or the redemption of fund shares. The Fund commenced operations on April 30, 2015.
The fund's past performance is not a good predictor of how the fund will perform in the future. The graph and table do not reflect the deduction of taxes that a shareholder would pay on fund distributions or redemption of fund shares.
| Total Net Assets | $3,037,798,726 |
| # of Portfolio Holdings | 40 |
| Portfolio Turnover Rate | 33% |
| Advisory Fees Paid | $12,512,960 |
Average Annual Total Returns (%)
| 1 Year | 5 years | Since Inception |
|---|
| Parnassus Mid Cap Fund - Institutional Shares (Incp: April 30, 2015) | 10.27% | 5.21% | 7.61% |
Russell 1000® Index | 23.88% | 14.61% | 12.77% |
| Russell Midcap Index | 12.88% | 9.46% | 9.06% |
What did the Fund invest in?
Parnassus Mid Cap Fund invests selectively in about 35-45 U.S. mid-cap equity securities. The Fund pursues high quality companies with increasingly relevant products and services, durable competitive advantages, strong management teams and sustainable business practices that are likely to thrive in a healthy economy and be resilient in an economic downturn.
| Value | Value |
|---|
| Short-Term Investments, Other Assets & Liabilities | 0.8% |
| Utilities | 2.3% |
| Communication Services | 2.6% |
| Real Estate | 4.1% |
| Materials | 6.2% |
| Health Care | 9.0% |
| Consumer Discretionary | 10.6% |
| Financials | 17.3% |
| Industrials | 23.1% |
| Information Technology | 24.0% |
| Fidelity National Information Services | 3.9% |
| Guidewire Software Inc. | 3.7% |
| Roper Technologies Inc. | 3.6% |
| J.B. Hunt Transport Services Inc. | 3.5% |
| Cboe Global Markets Inc. | 3.5% |
| KLA Corp. | 3.2% |
| TransUnion | 3.2% |
| Republic Services Inc., Class A | 3.1% |
| Hologic Inc. | 3.1% |
| Ross Stores Inc. | 2.9% |
Class - Institutional Shares
Semi-Annual Shareholder Report - June 30, 2024
If you wish to view additional information about the Fund; including, but not limited to, financial statements or holdings, please call us or visit our website:
Phone: 800-999-3505
Website: www.parnassus.com
No material changes to the Fund in the last reporting period.
Change in or Disagreements with Accountants
There have been no changes to or disagreements with the accountants in the last reporting period.
© 2024 Parnassus Investments, LLC. All rights reserved. PARNASSUS, PARNASSUS INVESTMENTS, and PARNASSUS FUNDS are federally registered trademarks of Parnassus Investments, LLC. The Parnassus Funds are distributed by Parnassus Funds Distributor, LLC.
If you wish to receive a copy of this document at a new address, contact 800-999-3505.
Parnassus Mid Cap Growth Fund
Class - Institutional Shares
Semi-Annual Shareholder Report - June 30, 2024
Parnassus Mid Cap Growth Fund (the "Fund") offers a concentrated portfolio of U.S. mid-cap, fast-growing companies with healthy balance sheets and proven financial models
This semi-annual shareholder report contains important information about the Fund for the period of January 1, 2024 to June 30, 2024.
You can find additional information about the fund at www.parnassus.com. You can also request this information by contacting us at 800-999-3505.
What was the Fund's cost for the period?
(based on hypothetical $10,000 investment)
| Class name | Cost of a $10,000 investment | Cost paid as a % of a $10,000 investment |
|---|
| Institutional Shares | $35 | 0.68% |
How did the fund perform?
The Parnassus Mid Cap Growth Fund (Institutional Shares) returned -3.17% (net of fees) for the second quarter of 2024, mostly outperforming the Russell Midcap Growth Index's -3.21% return. Stock selection in the Information Technology and Industrials sectors contributed to relative results, while selection within Real Estate and Health Care detracted.
The portfolio position in Consumer Discretionary shifted from an overweight to an underweight during the quarter, while the overweight position in Information Technology increased.
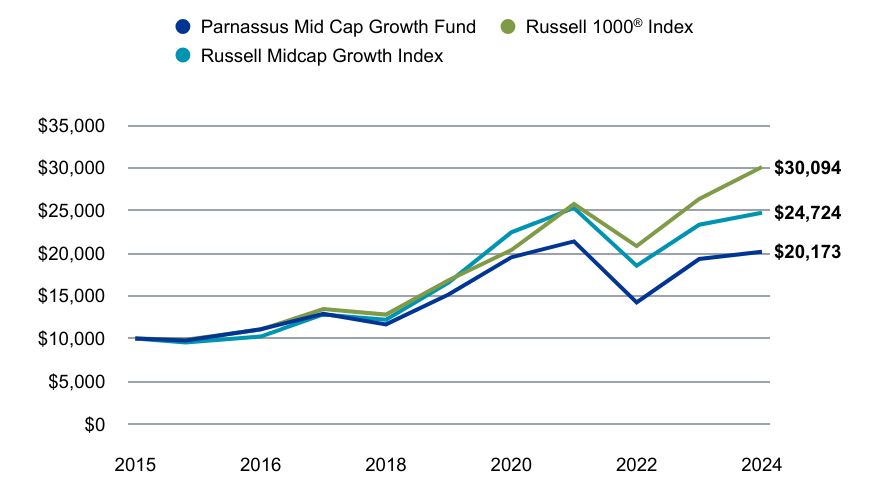
Value on June 30, 2024 of $10,000 invested on April 30, 2015.
| Parnassus Mid Cap Growth Fund | Russell 1000® Index | Russell Midcap Growth Index |
|---|
| | | |
|---|
| 2015 | $10,000 | $10,000 | $10,000 |
| 2015 | $9,763 | $9,864 | $9,538 |
| 2016 | $11,089 | $11,053 | $10,237 |
| 2017 | $12,891 | $13,450 | $12,823 |
| 2018 | $11,658 | $12,806 | $12,213 |
| 2019 | $15,152 | $16,831 | $16,545 |
| 2020 | $19,517 | $20,359 | $22,432 |
| 2021 | $21,373 | $25,745 | $25,288 |
| 2022 | $14,224 | $20,821 | $18,531 |
| 2023 | $19,311 | $26,344 | $23,329 |
| 2024 | $20,173 | $30,094 | $24,724 |
The chart shows the growth in value of a hypothetical $10,000 investment since inception and does not reflect the deduction of taxes a shareholder would pay on fund distributions or the redemption of fund shares. The Fund commenced operations on April 30, 2015.
The fund's past performance is not a good predictor of how the fund will perform in the future. The graph and table do not reflect the deduction of taxes that a shareholder would pay on fund distributions or redemption of fund shares.
| Total Net Assets | $831,325,790 |
| # of Portfolio Holdings | 40 |
| Portfolio Turnover Rate | 20% |
| Advisory Fees Paid | $2,519,872 |
Average Annual Total Returns (%)
| 1 Year | 5 years | Since Inception |
|---|
| Parnassus Mid Cap Growth Fund - Institutional Shares (Incp: April 30, 2015) | 19.44% | 7.57% | 7.96% |
Russell 1000® Index | 23.88% | 14.61% | 12.77% |
| Russell Midcap Growth Index | 15.05% | 9.93% | 10.38% |
What did the Fund invest in?
Parnassus Mid Cap Growth Fund invests selectively in about 35-45 U.S. mid-cap growth equity securities. The Fund pursues best-in-class, high quality companies with increasingly relevant products and services, durable competitive advantages, strong management teams and sustainable business practices that are likely to thrive in a healthy economy and be resilient in a downturn.
| Value | Value |
|---|
| Short-Term Investments, Other Assets & Liabilities | 0.5% |
| Communication Services | 2.4% |
| Real Estate | 3.1% |
| Materials | 4.5% |
| Financials | 9.1% |
| Consumer Discretionary | 13.2% |
| Health Care | 15.9% |
| Industrials | 17.4% |
| Information Technology | 33.9% |
| Guidewire Software Inc. | 5.5% |
| Teradyne Inc. | 4.9% |
| Equifax Inc. | 4.3% |
| Trane Technologies plc | 3.6% |
| KLA Corp. | 3.6% |
| Agilent Technologies Inc. | 3.4% |
| Ross Stores Inc. | 3.4% |
| CoStar Group Inc. | 3.1% |
| Monolithic Power Systems Inc. | 3.0% |
| Mettler-Toledo International Inc. | 3.0% |
Parnassus Mid Cap Growth Fund
Class - Institutional Shares
Semi-Annual Shareholder Report - June 30, 2024
If you wish to view additional information about the Fund; including, but not limited to, financial statements or holdings, please call us or visit our website:
Phone: 800-999-3505
Website: www.parnassus.com
No material changes to the Fund in the last reporting period.
Change in or Disagreements with Accountants
There have been no changes to or disagreements with the accountants in the last reporting period.
© 2024 Parnassus Investments, LLC. All rights reserved. PARNASSUS, PARNASSUS INVESTMENTS, and PARNASSUS FUNDS are federally registered trademarks of Parnassus Investments, LLC. The Parnassus Funds are distributed by Parnassus Funds Distributor, LLC.
If you wish to receive a copy of this document at a new address, contact 800-999-3505.
Parnassus Growth Equity Fund
Semi-Annual Shareholder Report - June 30, 2024
Parnassus Growth Equity Fund (the "Fund") offers a concentrated portfolio of U.S. large-cap stocks with the potential to benefit from secular trends at attractive valuations.
This semi-annual shareholder report contains important information about the Fund for the period of January 1, 2024 to June 30, 2024.
You can find additional information about the fund at www.parnassus.com. You can also request this information by contacting us at 800-999-3505.
What was the Fund's cost for the period?
(based on hypothetical $10,000 investment)
| Class name | Cost of a $10,000 investment | Cost paid as a % of a $10,000 investment |
|---|
| Investor Shares | $45 | 0.84% |
How did the fund perform?
The Parnassus Growth Equity Fund (Investor Shares) returned 3.74% (net of fees) for the quarter, underperforming the Russell 1000 Growth Index. The underperformance was primarily driven by our stock selection in the Information Technology sector. An overweight position and stock selection in the Financials sector also detracted.
We took advantage of recent sell-offs to add two new positions in Financials and Information Technology: MSCI and Workday, respectively. We offset these new holdings by trimming our existing positions and selling Palo Alto Networks within Information Technology.
Value on June 30, 2024 of $10,000 invested on December 28, 2022.
| Parnassus Growth Equity Fund | S&P 500 Index | Russell 1000® Growth Index |
|---|
| | | |
|---|
| 12/28/2022 | $10,000 | $10,000 | $10,000 |
| Dec-22 | $9,960 | $10,151 | $10,194 |
| Mar-23 | $11,507 | $10,912 | $11,659 |
| Jun-23 | $12,813 | $11,866 | $13,152 |
| Sep-23 | $12,507 | $11,477 | $12,741 |
| Dec-23 | $14,434 | $12,819 | $14,545 |
| Mar-24 | $16,298 | $14,172 | $16,205 |
| Jun-24 | $16,908 | $14,779 | $17,556 |
The chart shows the growth in value of a hypothetical $10,000 investment since inception and does not reflect the deduction of taxes a shareholder would pay on fund distributions or the redemption of fund shares. The Fund commenced operations on December 28, 2022.
The fund's past performance is not a good predictor of how the fund will perform in the future. The graph and table do not reflect the deduction of taxes that a shareholder would pay on fund distributions or redemption of fund shares.
| Total Net Assets | $49,937,183 |
| # of Portfolio Holdings | 41 |
| Portfolio Turnover Rate | 15% |
| Advisory Fees Paid | $21,511 |
Average Annual Total Returns (%)
| 1 Year | Since Inception |
|---|
| Parnassus Growth Equity Fund - Investor Shares (Incp: December 28, 2022) | 31.95% | 41.74% |
| S&P 500 Index | 24.56% | 29.63% |
Russell 1000® Growth Index | 33.48% | 45.33% |
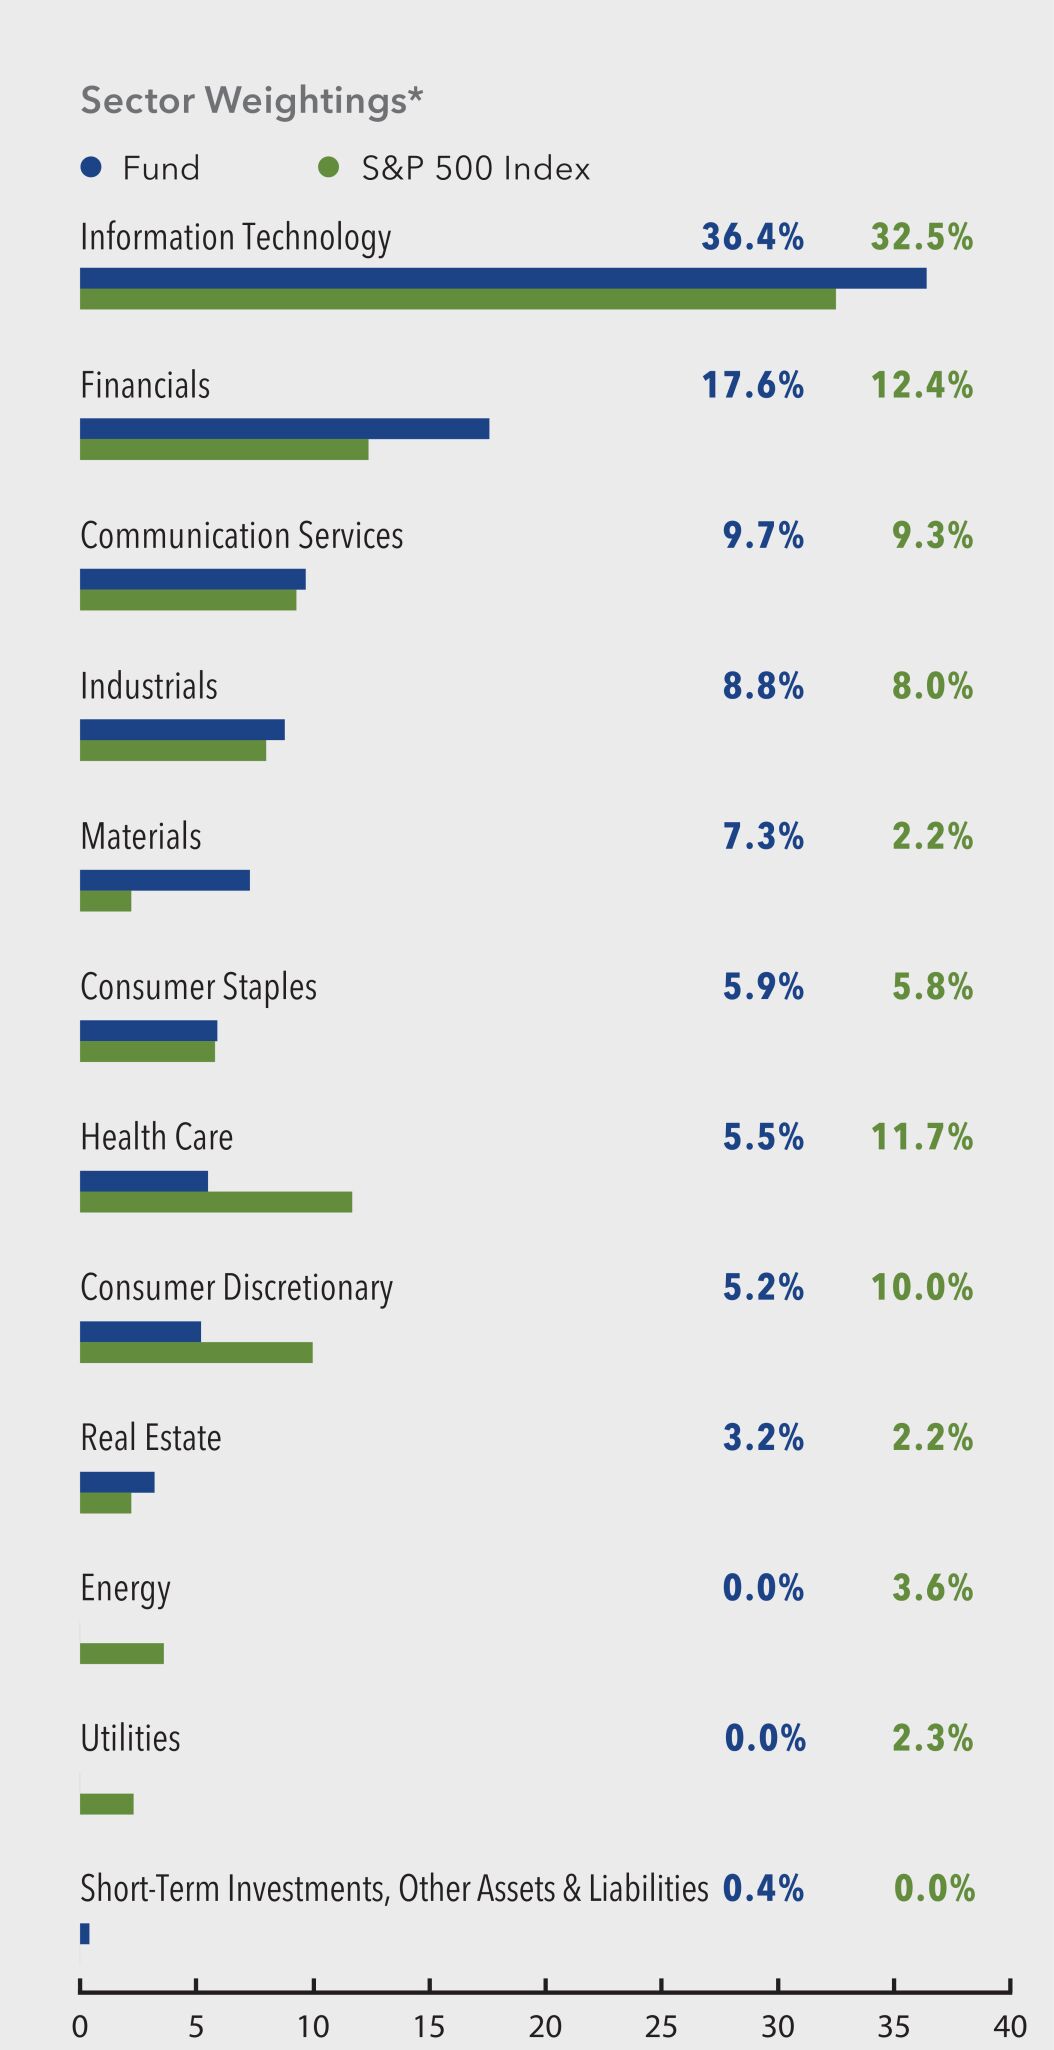
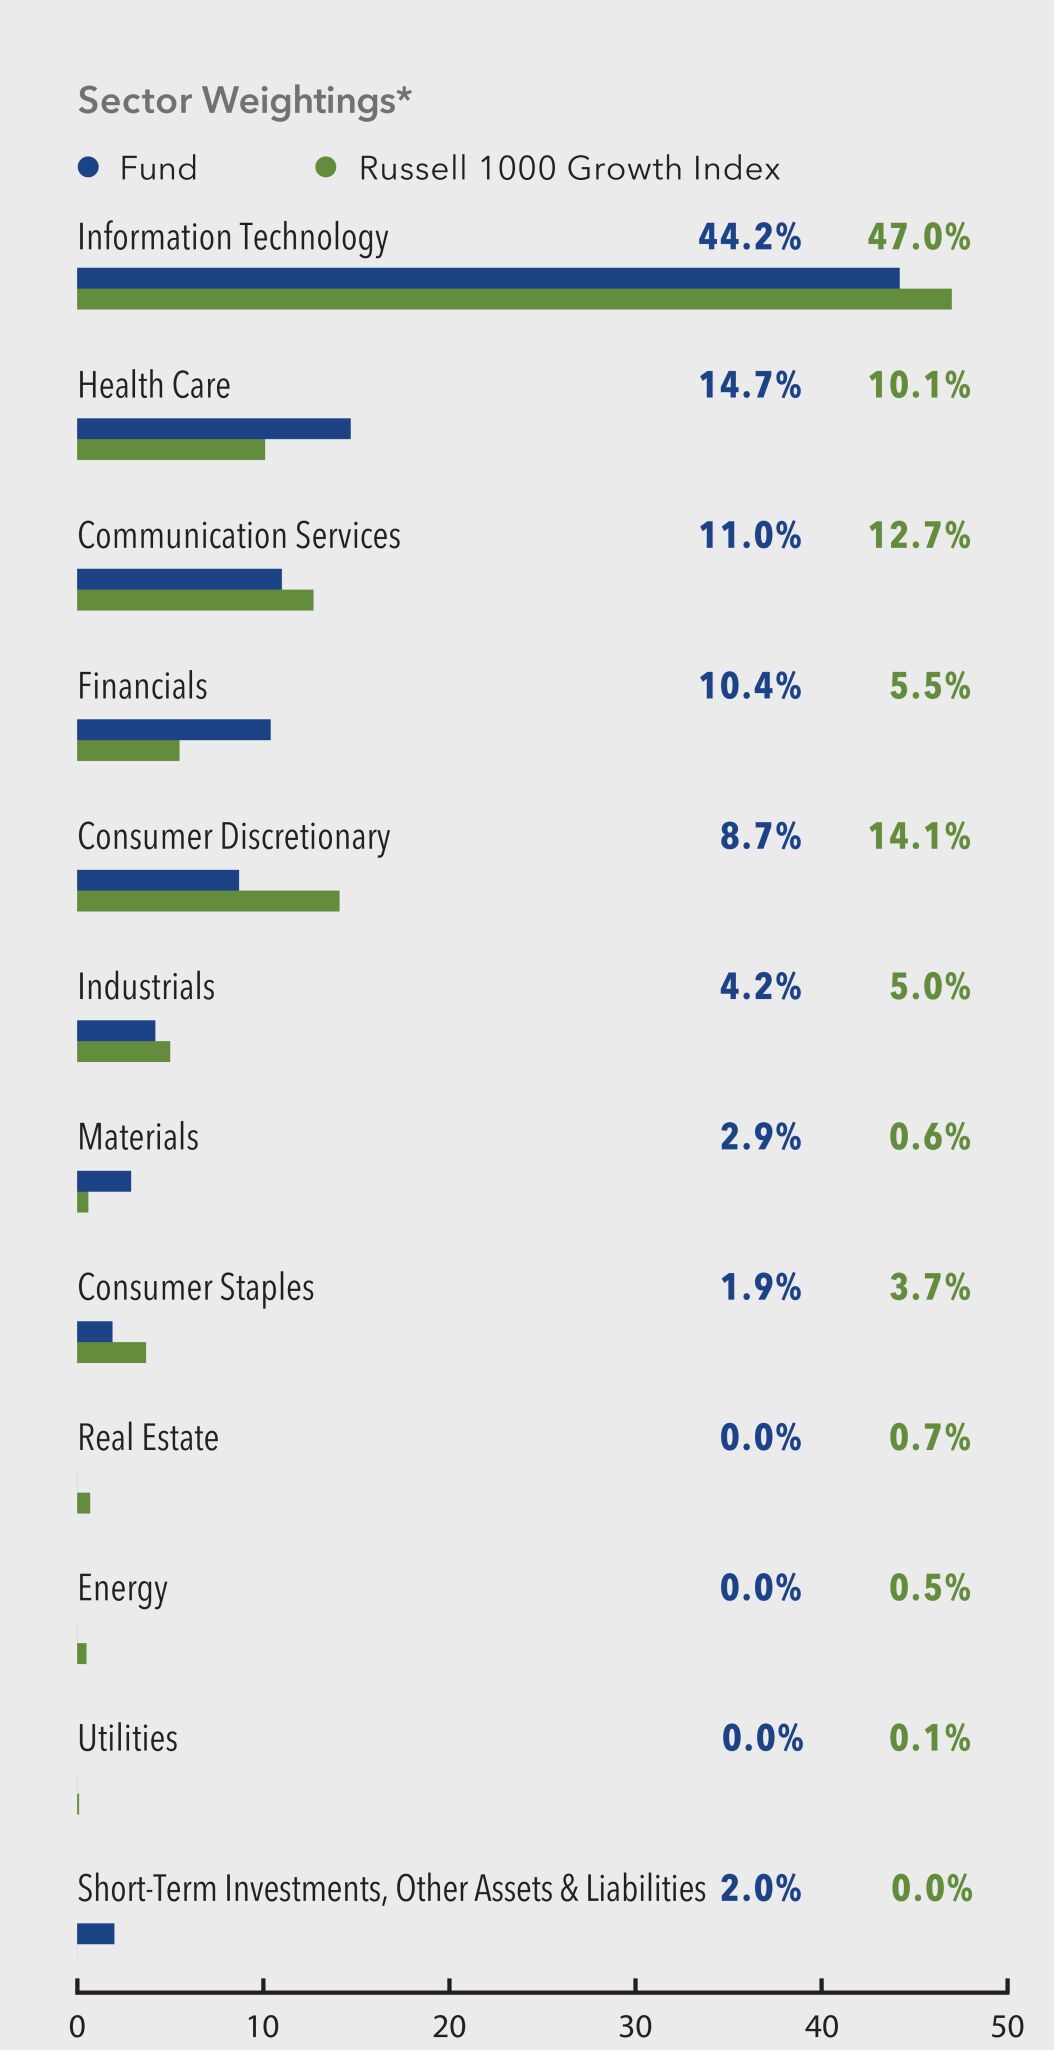
What did the Fund invest in?
Parnassus Growth Equity Fund invests selectively in about 40 U.S. large-cap equity securities. The Fund pursues high quality companies with increasing relevancy, durable competitive advantages, strong management teams and sustainable business practices. It favors leading, innovative companies positioned to capitalize on secular trends.
| Value | Value |
|---|
| Short-Term Investments, Other Assets & Liabilities | 2.0% |
| Consumer Staples | 1.9% |
| Materials | 2.9% |
| Industrials | 4.2% |
| Consumer Discretionary | 8.7% |
| Financials | 10.4% |
| Communication Services | 11.0% |
| Health Care | 14.7% |
| Information Technology | 44.2% |
| Microsoft Corp. | 8.4% |
| Alphabet Inc., Class A | 8.1% |
| NVIDIA Corp. | 7.7% |
| Amazon.com Inc. | 4.9% |
| Apple Inc. | 4.5% |
| Visa Inc., Class A | 4.1% |
| Eli Lilly & Co. | 3.4% |
| Salesforce Inc. | 3.3% |
| Broadcom Inc. | 2.9% |
| Intuit Inc. | 2.4% |
Parnassus Growth Equity Fund
Semi-Annual Shareholder Report - June 30, 2024
If you wish to view additional information about the Fund; including, but not limited to, financial statements or holdings, please call us or visit our website:
Phone: 800-999-3505
Website: www.parnassus.com
No material changes to the Fund in the last reporting period.
Change in or Disagreements with Accountants
There have been no changes to or disagreements with the accountants in the last reporting period.
© 2024 Parnassus Investments, LLC. All rights reserved. PARNASSUS, PARNASSUS INVESTMENTS, and PARNASSUS FUNDS are federally registered trademarks of Parnassus Investments, LLC. The Parnassus Funds are distributed by Parnassus Funds Distributor, LLC.
If you wish to receive a copy of this document at a new address, contact 800-999-3505.
Item 2. Code of Ethics.
Not applicable for semi-annual reports. The information required by this Item is only required in an annual report on Form N-CSR.
Item 3. Audit Committee Financial Expert.
Not applicable for semi-annual reports. The information required by this Item is only required in an annual report on Form N-CSR.
Item 4. Principal Accountant Fees and Services.
Not applicable for semi-annual reports. The information required by this Item is only required in an annual report on Form N-CSR.
Item 5. Audit Committee of Listed Registrants.
Not applicable for semi-annual reports. The information required by this Item is only required in an annual report on Form N-CSR.
Item 6. Investments.
| (a) | Included as part of the report to shareholders filed under Item 7 of this form. |
Item 7. Financial Statements and Financial Highlights for Open-End Management Investment Companies.

Parnassus Funds Semiannual Report
June 30, 2024
Parnassus Core Equity FundSM
Investor Shares: PRBLX | Institutional Shares: PRILX
Parnassus Growth Equity FundSM
Investor Shares: PFGEX | Institutional Shares: PFPGX
Parnassus Value Equity FundSM
Investor Shares: PARWX | Institutional Shares: PFPWX
Parnassus Mid Cap FundSM
Investor Shares: PARMX | Institutional Shares: PFPMX
Parnassus Mid Cap Growth FundSM
Investor Shares: PARNX | Institutional Shares: PFPRX
Parnassus Fixed Income FundSM
Investor Shares: PRFIX | Institutional Shares: PFPLX

Table of Contents
3
| | | | |
| | |
 | | | | Semiannual Report • 2024 |
August 9, 2024
Dear Shareholder,
The narrow market, driven largely by Nvidia, the highflying semiconductor company, has been challenging to navigate as an active manager. The positive returns for equities have been dominated by a very small number of large technology companies, which makes it very difficult to outperform the benchmark.
Given that backdrop, I’m pleased that all of the Parnassus Equity Funds delivered healthy positive returns for the first half of 2024. Our best-performing fund this year has been the Parnassus Growth Equity Fund, up 17% in the first half of the year, followed by the Parnassus Core Equity Fund with a 12% gain. The Parnassus Value Equity Fund, the Parnassus Mid Cap Fund and the Parnassus Mid Cap Growth Fund delivered returns between 2% and 6%, which is respectable on a historical basis. The Parnassus Fixed Income Fund, meanwhile, saw a 0.3% decline, slightly ahead of its benchmark. In the pages that follow, you can read about what the portfolio managers of these funds think about the current market environment, including retrospectives on the past quarter’s performance, as well as outlooks for the second half of the year.
Interns and Anniversaries
2024 is a big year for Parnassus as we celebrate our 40th anniversary. On a more personal note, this year also marks a milestone in my career: I joined Parnassus 20 years ago as an intern. Today, our internship program remains close to my heart, and so I’m proud to welcome five interns to Parnassus this summer.
Xiling Chen joins us as a Research Analyst intern while pursuing an MBA at Harvard Business School. Previously, Xiling received a dual major in math and arts at Tufts University and worked for five years in equity research at JP Morgan, covering U.S. pharmaceutical and Chinese healthcare companies in New York and Hong Kong. In her free time, she loves reading, sketching, film photography, hiking and wakesurfing.
Jade Mon joined our Software Engineering program after achieving a double major at University of California, Berkeley, in computer and data science. Jade previously conducted research at the university’s Space Science Laboratory as well as cybersecurity research with Proofpoint, creating machine learning models to detect potentially malicious emails. Her interests include reading, biking, playing the piano and hanging out with friends.
Terry Park also joins our Research Analyst Internship program as a first-year MBA student at Stanford University. He previously worked at EQT Group, focusing on advanced industrials and financial services, and later as an analyst in Morgan Stanley’s investment banking division in Hong Kong. He graduated summa cum laude from the Wharton School at the University of Pennsylvania with a degree in statistics and finance. He also served two years in the Korean army, becoming a top rifle marksman.
4
| | | | |
| | |
| Semiannual Report • 2024 | | | | |
Craig Wong is a summer intern on our Software Engineering team, having recently graduated from the University of California, Davis, with a degree in computer science. Craig spends his free time enjoying new restaurants, playing basketball and meeting new people.
Hanna Zhang enters our ESG Internship program while studying business administration and cognitive science at the University of California, Berkeley. Hanna’s interest include exploring the financial world and its intersection with technology, healthcare and global climate issues. She can play five musical instruments and has 11 years of experience in ballet and other dance.
New Team Members
We continued to invest in expanding the Parnassus team to better serve shareholders. Cristian Bayer joined Parnassus as Senior Manager, Software Engineering. Cristian has 23 years of fintech development experience, with a focus on technology management and application development. A San Francisco native, Cristian enjoys games, painting models and spending time with his family, friends and puppy dog.
Alyssa McShane is a new Executive Assistant at Parnassus. Alyssa moved to the Bay Area after attending school at Chico State in Northern California. Before Parnassus, she spent 12 years at the Boston Consulting Group, managing a team of three executive assistants for the past three years. She loves attending concerts with her wife Annie and bringing their spoiled-rotten rescue pup Mazzy to local breweries and wineries, and she recently enjoyed a goat-yoga retreat with friends to celebrate her birthday.
Finally, please take note that there is a new shareholder report rolling out this quarter. We will no longer be sending reports on a quarterly schedule, but you can continue to expect this new report on a semiannual basis, for the June and December reporting periods. Our website, www.parnassus.com, has the most current information for portfolio performance, holdings and commentary. We encourage you to check it out and subscribe to receive updates by email.
Thank you for your investment in the Parnassus Funds.
Sincerely,

Benjamin E. Allen
CEO and Portfolio Manager
5
| | | | |
| | |
| | | | Semiannual Report • 2024 |
Parnassus Core Equity Fund
Ticker: Investor Shares - PRBLX
Ticker: Institutional Shares - PRILX
As of June 30, 2024, after taking dividends into account, the Parnassus Core Equity Fund – Investor Shares (“the Fund”) returned 1.86% (net of fees) for the quarter, underperforming the S&P 500 Index’s (“S&P 500”) 4.28%.
Below is a table that summarizes the performances of the Parnassus Core Equity Fund and the S&P 500. The returns are for the one-, three-, five- and ten-year periods.
Parnassus Core Equity Fund
| | | | | | | | | | | | | | | | | | | | | | | | |
| |
| | | Average Annual Total Returns (%) | |
| |
| | | for period ended June 30, 2024 | |
| | | | | | |
| | | One Year | | | Three Years | | | Five Years | | | Ten Years | | | Gross Expense Ratio | | | Net Expense Ratio | |
| | | | | | |
| Parnassus Core Equity Fund – Investor Shares | | | 21.10 | | | | 8.10 | | | | 13.87 | | | | 12.01 | | | | 0.82 | | | | 0.82 | |
| | | | | | |
| Parnassus Core Equity Fund – Institutional Shares | | | 21.34 | | | | 8.32 | | | | 14.11 | | | | 12.24 | | | | 0.62 | | | | 0.61 | |
| | | | | | |
| S&P 500 Index | | | 24.56 | | | | 10.01 | | | | 15.05 | | | | 12.86 | | | | NA | | | | NA | |
Performance data quoted represent past performance and are no guarantee of future returns. Current performance may be lower or higher than the performance data quoted, and current performance information to the most recent month end is available on the Parnassus website (www.parnassus.com). Investment return and principal value will fluctuate, so an investor’s shares, when redeemed, may be worth more or less than their original principal cost.
Returns shown in the table do not reflect the deduction of taxes a shareholder may pay on fund distributions or redemption of shares. The S&P 500 is an unmanaged index of common stocks, and it is not possible to invest directly in an index. Index figures do not take any expenses, fees or taxes into account, but mutual fund returns do.
The estimated impact of individual stocks on the Fund’s performance is provided by FactSet.
As described in the Fund’s current prospectus dated May 1, 2024, Parnassus Investments, LLC has contractually agreed to reduce its investment advisory fee to the extent necessary to limit total annual fund operating expenses to 0.82% of net assets for the Parnassus Core Equity Fund – Investor Shares and to 0.61% of net assets for the Parnassus Core Equity Fund – Institutional Shares. This agreement will not be terminated prior to May 1, 2025, and may be continued indefinitely by the investment adviser on a year-to-year basis.
Second Quarter Review
The Fund (Investor Shares) returned 1.86%, (net of fees), underperforming the S&P 500 Index’s 4.28% during the quarter. From the sector perspective, positive stock selection in Communication Services boosted relative performance. An underweight in Health Care and a lack of Energy exposure also had positive impacts. Conversely, stock selection in the Information Technology, Consumer Discretionary and Materials sectors hindered relative results.
The Fund’s strongest relative contributors—Alphabet, Applied Materials and Oracle—rose because investors felt confident about their prospects as the artificial intelligence (AI) infrastructure build-out and adoption continues. The top two detractors, Salesforce and Intel, lagged due to disappointing near-term results. We believe the current valuations of these stocks do not reflect the long-term opportunity for these advantaged businesses.
Alphabet’s stock rose on the strength of robust first-quarter revenue growth underpinned by noteworthy gains in search advertising, YouTube advertising and the cloud business. Signs that the company is accelerating its development of AI solutions buoyed investor optimism.
Applied Materials is the world’s largest supplier of wafer fabrication technologies used in semiconductor manufacturing. The company reported solid earnings for the quarter, and investors believe Applied Materials should continue to benefit from accelerated industry spend due to AI and share gains.
Oracle stock surged in June after management forecasted double-digit revenue growth for fiscal year 2025, powered in part by growth in the company’s cloud infrastructure business. Investor sentiment was further bolstered by Oracle’s announcement of a new
6
| | | | |
| | |
| Semiannual Report • 2024 | | | | |
partnership with ChatGPT maker OpenAI and Microsoft, and another with Google Cloud.
Salesforce’s growth continues to moderate, and investors question its prospect as it relates to AI. We remain confident that the company, which developed the original salesforce automation product and pioneered the SaaS (software as a service) delivery model, is well positioned to capitalize on emerging AI opportunities.
Intel reported first-quarter results largely in line with expectations, but its moderate second-quarter forecast weighed on the stock. Intel continues to show progress on its technology roadmaps, albeit at a slower-than-expected pace.
Ball saw its shares decline despite reporting a largely positive financial report for the first quarter. The company continues to capitalize on a global shift toward eco-friendly packaging. After the sale of its aerospace operations, we expect management’s focus on capital allocation to significantly benefit shareholders.
Parnassus Core Equity Fund
As of June 30, 2024
(percentage of net assets)
* For purposes of categorizing securities for diversification requirements under the Investment Company Act, the Fund uses industry classifications that are more specific than those used for the chart.
Portfolio characteristics and holdings are subject to change periodically.
7
| | | | |
| | |
| | | | Semiannual Report • 2024 |
| | | | |
| |
Top 10 Equity Holdings | | | | |
| (percentage of net assets) | | | | |
| |
| Microsoft Corp. | | | 6.9% | |
| |
| NVIDIA Corp. | | | 6.6% | |
| |
| Alphabet Inc., Class A | | | 6.5% | |
| |
| Apple Inc. | | | 4.6% | |
| |
| Salesforce Inc. | | | 4.2% | |
| |
| Deere & Co. | | | 3.4% | |
| |
| Realty Income Corp. | | | 3.2% | |
| |
| Mastercard Inc., Class A | | | 3.2% | |
| |
| Ball Corp. | | | 2.8% | |
| |
| Linde plc | | | 2.8% | |
Portfolio characteristics and holdings are subject to change periodically.
Outlook and Strategy
As of June 30, 2024, the Fund’s most significant sector weights relative to the benchmark did not change significantly from the previous quarter-end. The Fund’s largest overweights are in Financials, Materials and Information Technology, while its largest underweights are in Health Care and Consumer Discretionary.
The Financials sector continues to be our largest sector overweight position. Our exposure decreased as we trimmed several holdings, including Bank of America, Fiserv and Mastercard. Our Materials exposure also declined with the sale of Nutrien, a distributor of agricultural products.
Our underweight position in the Health Care sector widened as we exited the pharmaceutical industry by closing our position in Switzerland-based drugmaker Roche Holding. We redeployed a portion of the proceeds to increase our existing position in Realty Income, a real estate investment trust that owns commercial properties. We consider Realty Income a more appealing defensive holding in the current environment. This move changed our Real Estate sector exposure from an underweight to an overweight.
Within the Information Technology sector, we trimmed certain positions, including Micron Technology and Applied Materials, while increasing our exposure to Salesforce, Adobe, Broadcom and Alphabet. The net effect of these changes was to moderately grow our overweight in the sector.
We continue to look through the near-term noise and seek to own competitively advantaged, attractively priced businesses that we believe are positioned to outperform over the long term.
We have maintained our balanced approach to portfolio positioning. The investment landscape remains favorable for stocks and risk assets, given moderating inflation, robust consumer demand, resilient wages and strong corporate earnings growth. In this environment, investor optimism has led to an elevated overall market valuation.
We continue to focus on companies that, in our view, are well positioned from a long-term secular perspective, and we are taking advantage of volatility to add to what we believe are high-quality businesses with strong growth potential.
Further, we have repositioned the defensive portion of the portfolio to emphasize areas where we are seeing attractively priced exposure, including Real Estate.
As always, we are honored to have your trust as we continue pursuing Principles and Performance®.
Sincerely,

Todd C. Ahlsten
Lead Portfolio Manager
Benjamin E. Allen
Portfolio Manager

Andrew S. Choi
Portfolio Manager
8
| | | | |
| | |
| Semiannual Report • 2024 | | | | |
Parnassus Growth Equity Fund
Ticker: Investor Shares - PFGEX
Ticker: Institutional Shares - PFPGX
As of June 30, 2024, the Parnassus Growth Equity Fund – Investor Shares (“the Fund”) returned 3.74% (net of fees) for the quarter, underperforming the Russell 1000 Growth Index’s (“Russell 1000 Growth”) 8.33%.
Below is a table that summarizes the performances of the Parnassus Growth Equity Fund and the Russell 1000 Growth. The returns are for the one-year and since inception periods.
Parnassus Growth Equity Fund
| | | | | | | | | | | | | | | | |
| |
| | | Average Annual Total Returns (%) | |
| |
| | | for period ended June 30, 2024 | |
| | | | |
| | | One
Year | | | Since
Inception* | | | Gross
Expense
Ratio | | | Net
Expense
Ratio | |
| | | | |
| Parnassus Growth Equity Fund – Investor Shares | | | 31.95 | | | | 41.74 | | | | 2.89 | | | | 0.84 | |
| | | | |
| Parnassus Growth Equity Fund – Institutional Shares | | | 32.21 | | | | 42.03 | | | | 1.86 | | | | 0.63 | |
| | | | |
| Russell 1000 Growth Index | | | 33.48 | | | | 45.33 | | | | NA | | | | NA | |
Performance data quoted represent past performance and are no guarantee of future returns. Current performance may be lower or higher than the performance data quoted. Current performance information to the most recent month end is available on the Parnassus website (www.parnassus.com). Investment return and principal value will fluctuate, so an investor’s shares, when redeemed, may be worth more or less than their original principal cost. Returns would have been lower if certain of the Fund’s fees and expenses had not been waived.
Returns shown in the table do not reflect the deduction of taxes a shareholder may pay on fund distributions or redemption of shares. The Russell 1000 Growth is an unmanaged index of common stocks, and it is not possible to invest directly in an index. Index figures do not take any expenses, fees or taxes into account, but mutual fund returns do.
The estimated impact of individual stocks on the Fund’s performance is provided by FactSet.
* Since Inception, December 28, 2022 (commencement of operations) through December 31, 2023.
As described in the Fund’s current prospectus dated May 1, 2024, Parnassus Investments, LLC has contractually agreed to reduce its investment advisory fee to the extent necessary to limit total annual fund operating expenses to 0.84% of net assets for the Parnassus Growth Equity Fund – Investor Shares and to 0.63% of net assets for the Parnassus Growth Equity Fund – Institutional Shares. This agreement will not be terminated prior to May 1, 2025, and may be continued indefinitely by the investment adviser on a year-to-year basis.
Second Quarter Review
The Fund (Investor Shares) returned 3.74% (net of fees), trailing the Russell 1000 Growth Index’s 8.33%, with underperformance driven primarily by our stock selection in the Information Technology sector, where a select few companies outgained most of the market. An overweight position and stock selection in the Financials sector and an overweight in the Materials sector also curbed results. Conversely, our stock selection in the Health Care, Consumer Staples and Communication Services sectors contributed to performance.
The Fund’s top relative contributors included companies benefiting from the surge in AI investment (Alphabet, Taiwan Semiconductor Manufacturing Company (TSMC) and Applied Materials). Among our largest detractors were our underweight positions in Apple and NVIDIA, two companies that gained largely on investor confidence in their AI-related growth prospects.
Alphabet’s stock rose on the strength of robust first-quarter revenue growth underpinned by noteworthy gains in search advertising, YouTube advertising and the cloud business. Signs that the company is accelerating its development of AI solutions buoyed investor optimism.
Taiwan Semiconductor Manufacturing Company’s leading position in AI chip production continued to boost investor sentiment on the stock. During the quarter, announcements by several large technology companies to expand their AI investments signaled insatiable demand for TSMC’s chips and contributed to the stock’s rise.
Natera, an industry leader in genetic testing, reported favorable financial results for the first quarter of 2024. The company reached cash flow breakeven early and raised full-year guidance. We are optimistic that
9
| | | | |
| | |
| | | | Semiannual Report • 2024 |
upcoming catalysts will continue to fuel growth in its women’s health and oncology businesses.
Adyen shares tumbled during the quarter as investors were disappointed that the payments processor met but did not exceed revenue expectations. Encouragingly, the company reported an expansion of its relationship with a key digital customer and reiterated optimistic medium-term guidance.
Apple gained but detracted from relative performance due to our underweight. While the company’s overall and iPhone revenues declined year over year, the unveiling of an upgraded iPad Pro and iPad Air boosted investor sentiment. In particular, the introduction of generative AI features allayed concerns that Apple was not keeping pace with competitors.
NVIDIA rallied but detracted from relative returns due to our underweight. The maker of generative AI chips once again reported exceptional quarterly results and increased its guidance for the upcoming quarter.
Parnassus Growth Equity Fund
As of June 30, 2024
(percentage of net assets)
* For purposes of categorizing securities for diversification requirements under the Investment Company Act, the Fund uses industry classifications that are more specific than those used for the chart.
Portfolio characteristics and holdings are subject to change periodically.
10
| | | | |
| | |
| Semiannual Report • 2024 | | | | |
| | | | |
| |
| Top 10 Equity Holdings | | | | |
| (percentage of net assets) | | | | |
| |
| Microsoft Corp. | | | 8.4% | |
| |
| Alphabet Inc., Class A | | | 8.1% | |
| |
| NVIDIA Corp. | | | 7.7% | |
| |
| Amazon.com Inc. | | | 4.9% | |
| |
| Apple Inc. | | | 4.5% | |
| |
| Visa Inc., Class A | | | 4.1% | |
| |
| Eli Lilly & Co. | | | 3.4% | |
| |
| Salesforce Inc. | | | 3.3% | |
| |
| Broadcom Inc. | | | 2.9% | |
| |
| Intuit Inc. | | | 2.4% | |
Portfolio characteristics and holdings are subject to change periodically.
Outlook and Strategy
As of June 30, 2024, the Fund’s most significant sector weights relative to the benchmark remain the same. The Fund’s largest overweight positions are in the Financials and Health Care sectors, while its largest underweight positions are in the Information Technology and Consumer Discretionary sectors.
The Financials sector continues to be our largest sector overweight position. We opportunistically added market index provider MSCI during the quarter. We believe MSCI complements our existing names as a must-have data provider to the asset management industry. Like our other holdings, MSCI has unique end-market exposure, high operating leverage and limited balance sheet risk. To fund MSCI, we trimmed some of our existing positions and sold Old Dominion Freight Line. This sale turned our overweight to an underweight in Industrials, which continues to face cyclical demand risk.
Our relative Health Care exposure increased slightly. We continue to favor our catalyst-rich names across subsectors, including medical devices, biopharma, life science tools and payors. We prefer the relatively defensive and idiosyncratic growth opportunities in Health Care to the businesses and valuations in Consumer Staples, where we remain underweight.
Our underweight positions in the Information Technology and Consumer Discretionary sectors were primarily driven by our limited exposure to large benchmark constituents Apple, NVIDIA, Tesla and Amazon. Our underweights in Apple and NVIDIA were
both negative relative contributors for the quarter. To help offset this underweight, we continued to add to our overall semiconductor exposure. Within Information Technology, we added Workday and funded it with the sale of Palo Alto Networks.
We made no material changes to our positions in the Consumer Staples, Communication Services or Materials sectors. We do not own any Energy, Real Estate or Utilities stocks.
We have maintained our balanced approach to portfolio positioning. The investment landscape remains favorable for stocks and risk assets, given moderating inflation, robust consumer demand, resilient wages and strong corporate earnings growth. In this environment, investor optimism has led to an elevated overall market valuation.
We remain focused on companies that have dominant market positions and growth supported by long-term secular trends. We are taking advantage of volatility to add to what we believe are high-quality businesses with strong growth potential at reasonable valuations.
We continue to anchor the Fund’s defensive exposure in Health Care, where we invest in businesses with cash flow that is less macro sensitive and in companies with strong catalysts. We are trimming some of our exposure to payments processors and Industrials companies with cyclical sensitivity in favor of those with more recurring revenue and must-have products within the Financials and Industrials sectors.
As always, we are honored to have your trust as we continue pursuing Principles and Performance®.
Sincerely,
Andrew S. Choi
Lead Portfolio Manager

Shivani R. Vohra
Portfolio Manager
11
| | | | |
| | |
| | | | Semiannual Report • 2024 |
Parnassus Value Equity Fund
Ticker: Investor Shares - PARWX
Ticker: Institutional Shares - PFPWX
As of June 30, 2024, the Parnassus Value Equity Fund – Investor Shares (“the Fund”) returned -3.81% (net of fees) for the quarter, underperforming the Russell 1000 Value Index’s (“Russell 1000 Value”) -2.17%.
Below is a table that summarizes the performances of the Parnassus Value Equity Fund and the Russell 1000 Value. The returns are for the one-, three-, five- and ten-year periods.
Parnassus Value Equity Fund
| | | | | | | | | | | | | | | | | | | | | | | | |
| |
| | | Average Annual Total Returns (%) | |
| |
| | | for period ended June 30, 2024 | |
| | | | | | |
| | | One
Year | | | Three
Years | | | Five
Years | | | Ten
Years | | | Gross
Expense
Ratio | | | Net
Expense
Ratio | |
| | | | | | |
| Parnassus Value Equity Fund – Investor Shares | | | 15.13 | | | | 2.56 | | | | 14.34 | | | | 12.58 | | | | 0.93 | | | | 0.88 | |
| | | | | | |
| Parnassus Value Equity Fund – Institutional Shares | | | 15.38 | | | | 2.79 | | | | 14.59 | | | | 12.81 | | | | 0.72 | | | | 0.65 | |
| | | | | | |
| Russell 1000 Value Index | | | 13.06 | | | | 5.52 | | | | 9.01 | | | | 8.23 | | | | NA | | | | NA | |
The average annual total return for the Parnassus Value Equity Fund – Institutional Shares from commencement (April 30, 2015) was 12.56%. Performance shown prior to the inception of the Institutional Shares reflects the performance of the Parnassus Value Equity Fund – Investor Shares and includes expenses that are not applicable to and are higher than those of the Institutional Shares. The performance of the Institutional Shares differs from that shown for the Investor Shares to the extent that the classes do not have the same expenses.
Performance data quoted represent past performance and are no guarantee of future returns. Current performance may be lower or higher than the performance data quoted. Current performance information to the most recent month end is available on the Parnassus website (www.parnassus.com). Investment return and principal value will fluctuate, so an investor’s shares, when redeemed, may be worth more or less than their original principal cost. Returns would have been lower if certain of the Fund’s fees and expenses had not been waived.
Returns shown in the table do not reflect the deduction of taxes a shareholder may pay on fund distributions or redemption of shares. The Russell 1000 Value is an unmanaged index of common stocks, and it is not possible to invest directly in an index. Index figures do not take any expenses, fees or taxes into account, but mutual fund returns do.
The estimated impact of individual stocks on the Fund’s performance is provided by FactSet.
As described in the Fund’s current prospectus dated May 1, 2024, Parnassus Investments, LLC has contractually agreed to reduce its investment advisory fee to the extent necessary to limit total annual fund operating expenses to 0.88% of net assets for the Parnassus Value Equity Fund – Investor Shares and to 0.65% of net assets for the Parnassus Value Equity Fund – Institutional Shares. This agreement will not be terminated prior to May 1, 2025, and may be continued indefinitely by the investment adviser on a year-to-year basis.
Second Quarter Review
The Fund returned -3.81% (net of fees), trailing the Russell 1000 Value’s -2.17%. From a sector perspective, stock selection in the Communication Services sector contributed the most to relative performance, followed by selection in the Information Technology and Utilities sectors. The Fund’s overweight in Financials also aided results. Stock selection in Health Care, Consumer Staples and Industrials, on the other hand, hindered relative return.
The Fund’s top contributors were Alphabet, Micron Technology and Taiwan Semiconductor Manufacturing Company (TSMC), while the bottom contributors were Global Payments, Intel and NICE.
Alphabet’s stock rose on the strength of robust first-quarter revenue growth underpinned by noteworthy gains in search advertising, YouTube advertising and the cloud business. Signs that the company is accelerating its development of AI solutions sparked investor optimism.
Micron Technology posted fiscal-third-quarter results that met expectations. Micron’s DRAM (dynamic random access memory) and NAND (non-volatile storage technology) segments grew revenue strongly, continuing the company’s recovery from a cyclical downturn last year. We believe Micron is well positioned to capitalize on AI-driven demand for greater memory.
Taiwan Semiconductor Manufacturing Company’s leading position in AI chip production continued to boost investor sentiment on the stock. During the quarter, announcements by several large technology companies to expand their AI investments signaled insatiable demand for TSMC’s chips and contributed to the stock’s rise.
12
| | | | |
| | |
| Semiannual Report • 2024 | | | | |
Global Payments’ stock fell on investor fears that a slowing economy could weigh on payment processing companies. The company will host an investor day focused on improving efficiencies and strategic redeployment of assets in the fall, which we believe will unlock hidden value in the undervalued shares.
Intel disappointed investors with a less-than-stellar second-quarter forecast, driving shares lower despite first-quarter results that largely met expectations. Additionally, the company revealed greater losses than anticipated in its foundry operations during the quarter.
NICE reported first-quarter earnings that exceeded consensus estimates. However, the stock fell on news that the company’s CEO plans to leave at the end of the year and on concerns that its contact-center software would be replaced by generative AI. We believe the concerns are overblown and anticipate that the firm will integrate AI features successfully.
Parnassus Value Equity Fund
As of June 30, 2024
(percentage of net assets)
* For purposes of categorizing securities for diversification requirements under the Investment Company Act, the Fund uses industry classifications that are more specific than those used for the chart.
Portfolio characteristics and holdings are subject to change periodically.
13
| | | | |
| | |
| | | | Semiannual Report • 2024 |
| | | | |
| |
| Top 10 Equity Holdings | | | | |
| (percentage of net assets) | | | | |
| |
| Verizon Communications Inc. | | | 4.2% | |
| |
| Bank of America Corp. | | | 3.5% | |
| |
| Oracle Corp. | | | 3.3% | |
| |
| S&P Global Inc. | | | 3.0% | |
| |
| Alphabet Inc., Class A | | | 3.0% | |
| |
| Sysco Corp. | | | 2.9% | |
| |
| Ball Corp. | | | 2.8% | |
| |
| The Bank of New York Mellon Corp. | | | 2.8% | |
| |
| Micron Technology Inc. | | | 2.7% | |
| |
| Microsoft Corp. | | | 2.7% | |
Portfolio characteristics and holdings are subject to change periodically.
Outlook and Strategy
The Fund’s largest overweights relative to the benchmark as of June 30, 2024, were in the Information Technology, Communication Services and Financials sectors, while the Fund’s three largest underweights were in the Energy, Consumer Staples and Industrials sectors.
During the second quarter, the Fund’s overweight position in the Information Technology sector decreased slightly as we sold our position in Cisco Systems and used most of the proceeds to buy Broadcom, a leading semiconductor company and provider of custom silicon products. Both stocks provide similar exposure to networking technology, but we believe Broadcom offers more upside from AI infrastructure spend and defensiveness due to its software assets.
The Fund’s exposure to the Communication Services sector increased slightly as we used proceeds from the Cisco exit to increase our existing exposure to Comcast and Charter Communications. We consider both Comcast and Charter to be trading at attractive valuations following a period of soft performance. These moves increased the Fund’s overweight position in the Communication Services sector.
In the Financials sector, we tapered our positions across multiple holdings, including Bank of America, Bank of New York Mellon, Fidelity National Information Services, Charles Schwab, Progressive and American
Express. After more than a year of uncertainty, investors now accept the idea that the U.S. economy could experience a soft landing, which has driven these stocks higher. While there is room to run if capital markets continue to recover, we reduced the Fund’s overweight in Financials slightly to add to our existing positions in cable and other stocks with more upside potential.
With stocks pushing multiple record highs, there are fewer bargains in the market. We therefore made fewer new purchases this quarter, consistent with our disciplined investment process. Our bottom-up approach allows us to uncover quality businesses and invest only when they are trading at attractive valuations.
We continue to maintain the Fund’s balanced positioning between offensive and defensive sectors, given that available economic data suggests a balanced mix of risks and opportunities. After peaking at over 9% in 2022, headline inflation is trending lower in response to restrictive monetary policy by the Fed. However, the unpredictable timing of Fed rate cuts, concerns that economic growth could stall and tensions over the upcoming presidential election are all expected to increase investor uncertainty. Our strategy is to capitalize on this volatility by investing in quality businesses when they reach attractive valuations.
We remain confident in our portfolio’s positioning and strategy for potential future returns. The possibility of Fed rate cuts creates a favorable environment for equities, benefiting our holdings in the Financials sector. Our strategy focuses on undervalued stocks of quality companies, which are likely to rise quickly if the market rally broadens. Additionally, advancements in AI should boost our strategic investments in the Information Technology sector, where we carefully balance the upside potential against high market expectations.
Our positioning today is an outcome of our bottom-up investment process. While it is tempting to bet on specific macroeconomic outcomes, in our experience, fundamental factors can far outweigh near-term macroeconomic factors for generating attractive returns. This thesis informs our approach for building concentrated portfolios with high conviction and high active share1.
1 Active Share is a measure of the percentage of stock holdings in a manager’s portfolio that differ from the benchmark index.
14
| | | | |
| | |
| Semiannual Report • 2024 | | | | |
Macroeconomic drivers, however, can result in temporary dislocations in the market, which create opportunities for active managers. During the rest of the year, if uncertainty around interest rates, geopolitical events and the domestic political environment increases, we anticipate discovering more bargain opportunities to invest in for the long term.
Thank you for your investment in the Parnassus Value Equity Fund.

Billy J. Hwan
Lead Portfolio Manager

Krishna S. Chintalapalli
Portfolio Manager
15
| | | | |
| | |
| | | | Semiannual Report • 2024 |
Parnassus Mid Cap Fund
Ticker: Investor Shares - PARMX
Ticker: Institutional Shares - PFPMX
As of June 30, 2024, the Parnassus Mid Cap Fund – Investor Shares (“the Fund”) returned -5.80% (net of fees) for the quarter, underperforming the Russell Midcap Index’s (“Russell Midcap”) -3.35% return.
Below is a table comparing the Parnassus Mid Cap Fund with the Russell Midcap Index for the one-, three-, five- and ten-year periods.
Parnassus Mid Cap Fund
| | | | | | | | | | | | | | | | | | | | | | | | |
| |
| | | Average Annual Total Returns (%) | |
| |
| | | for period ended June 30, 2024 | |
| | | | | | |
| | | One
Year | | | Three
Years | | | Five
Years | | | Ten
Years | | | Gross
Expense
Ratio | | | Net
Expense
Ratio | |
| | | | | | |
| Parnassus Mid Cap Fund – Investor Shares | | | 10.06 | | | | -1.31 | | | | 4.98 | | | | 7.24 | | | | 0.98 | | | | 0.96 | |
| | | | | | |
| Parnassus Mid Cap Fund – Institutional Shares | | | 10.27 | | | | -1.10 | | | | 5.21 | | | | 7.46 | | | | 0.76 | | | | 0.75 | |
| | | | | | |
| Russell Midcap Index | | | 12.88 | | | | 2.37 | | | | 9.46 | | | | 9.04 | | | | NA | | | | NA | |
The average annual total return for the Parnassus Mid Cap Fund – Institutional Shares from commencement (April 30, 2015) was 7.61%. Performance shown prior to the inception of the Institutional Shares reflects the performance of the Parnassus Mid Cap Fund – Investor Shares and includes expenses that are not applicable to and are higher than those of the Institutional Shares. The performance of the Institutional Shares differs from that shown for the Investor Shares to the extent that the classes do not have the same expenses.
Performance data quoted represent past performance and are no guarantee of future returns. Current performance may be lower or higher than the performance data quoted. Current performance information to the most recent month end is available on the Parnassus website (www.parnassus.com). Investment return and principal value will fluctuate, so an investor’s shares, when redeemed, may be worth more or less than their original principal cost.
Returns shown in the table do not reflect the deduction of taxes a shareholder may pay on fund distributions or redemption of shares. The Russell Midcap Index is an unmanaged index of common stocks, and it is not possible to invest directly in an index. Index figures do not take any expenses, fees or taxes into account, but mutual fund returns do. Mid cap companies can be more sensitive to changing economic conditions and have fewer financial resources than large cap companies.
The estimated impact of individual stocks on the Fund’s performance is provided by FactSet.
As described in the Fund’s current prospectus dated May 1, 2024, Parnassus Investments, LLC has contractually agreed to reduce its investment advisory fee to the extent necessary to limit total annual fund operating expenses to 0.96% of net assets for the Parnassus Mid Cap Fund – Investor Shares and to 0.75% of net assets for the Parnassus Mid Cap Fund – Institutional Shares. This agreement will not be terminated prior to May 1, 2025, and may be continued indefinitely by the investment adviser on a year-to-year basis.
Second Quarter Review
The fund (Investor Shares) returned -5.80% for the quarter, underperforming the Russell Midcap Index’s -3.35% return. Stock selection within Health Care and Industrials detracted as life sciences tools and freight transportation stocks had yet to rebound.
Top contributors included insurance software provider Guidewire Software, which rose on strong fiscal-third-quarter earnings, and semiconductor equipment manufacturer KLA Corp. Detractors included bioprocessing company Repligen Corp., which reported uneven demand and announced a CEO transition, and trucking and logistics company J.B. Hunt Transport Services, which suffered from soft shipping demand.
Guidewire Software, the leading software provider for property and casualty insurers, reported strong fiscal-third-quarter earnings highlighted by accelerating growth in annual recurring revenue and structurally higher profitability. With demand increasing and a broad array of strategic partners to guide implementations and migrations, we see a long runway ahead.
KLA Corp., a provider of process control and yield-management solutions for the semiconductor and related nanoelectronics industries, continued its strong run. We expect that KLA will continue to benefit from the increasing complexity of chip designs.
Trade Desk, a cloud-based media-buying platform for advertisement purchasers, reported a strong quarter based on increasing demand for connected TVs. The stock received another boost after the company announced a partnership with Netflix, which should accelerate Trade Desk’s growth.
16
| | | | |
| | |
| Semiannual Report • 2024 | | | | |
Repligen Corp., a leading bioprocessing company, posted a soft first-quarter revenue result. The stock fell further after the company announced a CEO transition. We are pleased that the well-regarded outgoing CEO will remain as executive chair. We believe Repligen is well positioned to benefit once the cyclical downturn reverses.
J.B. Hunt Transport Services, a leading trucking and logistics company that specializes in intermodal services, posted earnings well below expectations due to weaker-than-expected demand and higher costs. Longer-term trends should support demand for freight services and the company’s strong service network.
Pool Corp., a swimming pool supply distributor, lowered its full-year earnings estimates as demand for new pool construction fell more than expected due to high interest rates impacting big ticket purchases. Most of its revenue comes from maintenance of installed pools, which should be resilient.
Parnassus Mid Cap Fund
As of June 30, 2024
(percentage of net assets)
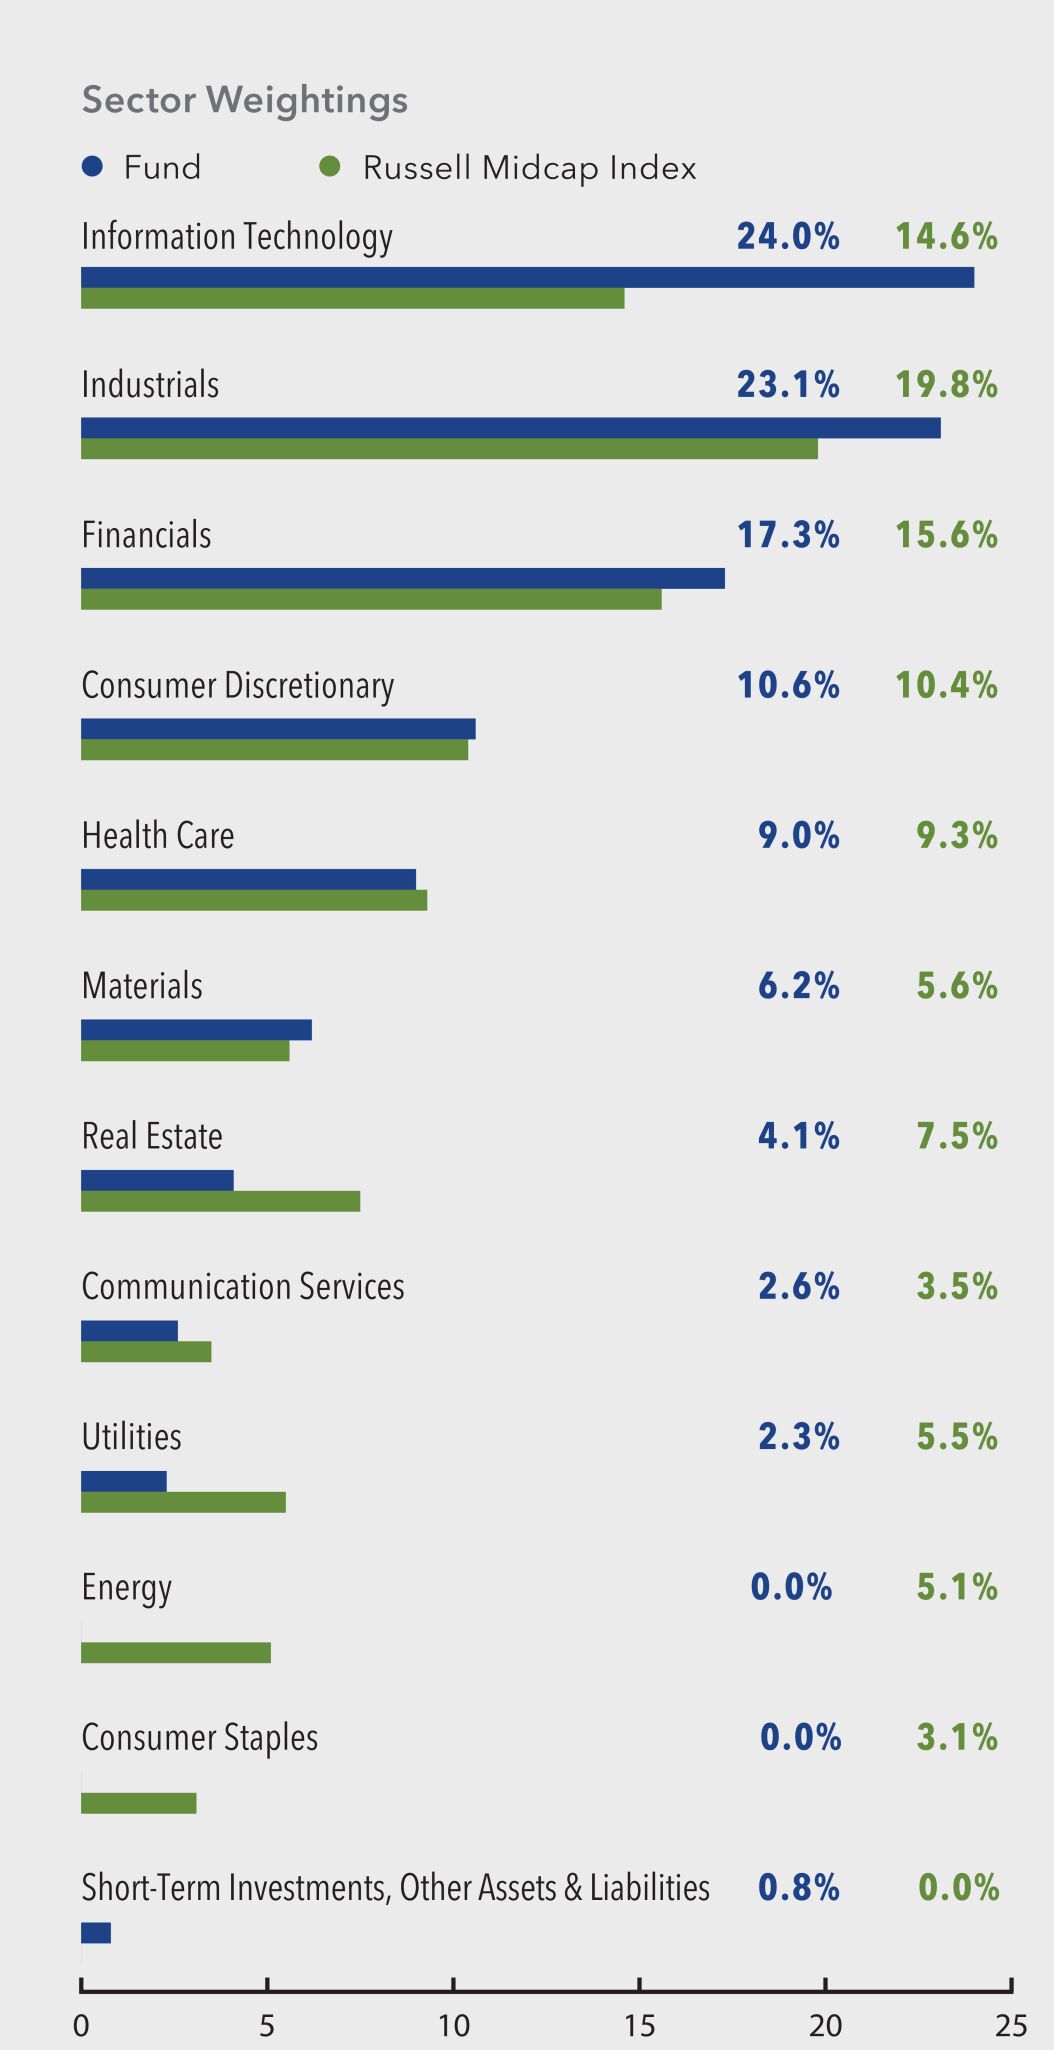
Portfolio characteristics and holdings are subject to change periodically.
17
| | | | |
| | |
| | | | Semiannual Report • 2024 |
| | | | |
| |
Top 10 Equity Holdings | | | | |
| (percentage of net assets) | | | | |
| |
| Fidelity National Information Services | | | 3.9% | |
| |
| Guidewire Software Inc. | | | 3.7% | |
| |
| Roper Technologies Inc. | | | 3.6% | |
| |
| J.B. Hunt Transport Services Inc. | | | 3.5% | |
| |
| Cboe Global Markets Inc. | | | 3.5% | |
| |
| KLA Corp. | | | 3.2% | |
| |
| TransUnion | | | 3.2% | |
| |
| Republic Services Inc., Class A | | | 3.1% | |
| |
| Hologic Inc. | | | 3.1% | |
| |
| Ross Stores Inc. | | | 2.9% | |
Portfolio characteristics and holdings are subject to change periodically.
Outlook and Strategy
During the quarter, we increased our overweight allocation to the Information Technology sector. In the software industry, we initiated a new position in BILL Holdings, which runs leading payments platform Bill.com, and added to our holdings in Workday. We exited our position in Amdocs, as we saw more upside in our other software holdings. Software has been one of our strategy’s most-alpha1-generative industries, driven by its increasing relevancy, network effects, mission-critical importance and the high incremental margins of the business models. We re-initiated a position in Western Digital, a manufacturer of memory semiconductor chips and hard disk drives, as we believe earnings expectations are far too low. Semiconductors have been another of our most-alpha-generative industries, thanks to the industry’s secular tailwinds and our in-house expertise.
Our biggest reduction in sector weighting was in Consumer Staples, as we exited Sysco due to its persistent market share losses. We also reduced our exposure to Health Care, exiting BioMarin Pharmaceutical because we’re skeptical that the new CEO’s plan to reduce expenses and streamline the pipeline will generate outperformance.
Within industrials, we exited CNH Industrial following the CEO’s surprise resignation. We used the capital to
add to our position in J.B. Hunt Transport Services, the dominant intermodal freight transportation provider. In Financials, we exited Block due to regulatory concerns surrounding its Cash App business.
The common theme in our trades this quarter was to concentrate the portfolio into stocks that we believe are increasing in relevancy. We exited structurally slow growers, turnaround stories focused on profitability instead of growth and companies that faced regulatory hurdles to growth.
While headline economic growth and employment numbers remain positive and the excitement of artificial intelligence (AI) is pushing a concentrated group of stocks to all-time highs, there are crosscurrents under the surface. Less-affluent consumers and small- and medium-sized businesses are grappling with the effects of persistently high interest rates. The economy seems to be in a rolling recession, where certain industries—such as freight transportation, life sciences tools and housing—are mired in a downturn despite the positive headline numbers.
However, the Fed is expected to cut interest rates later this year, and we expect fiscal spending to remain at elevated levels. Once the uncertainty of the election passes, “animal spirits” may return and help the economy to re-accelerate, potentially broadening the stock market’s gains. In this environment, we’re maintaining our balanced positioning.
We’re overweight freight transportation, life sciences tools and housing. While this positioning detracted from our relative returns, we’ve held onto or increased our investments in these industries due to our confidence in their prospects. Even if overall economic growth slows, these industries are already experiencing a downturn, which we believe should limit further downside. Our portfolio contains competitively advantaged, secularly growing businesses with strong balance sheets and increasing market share. We believe there is meaningful upside for our holdings as demand in their respective end markets eventually improves.
1 Alpha is a measure of performance on a risk-adjusted basis. Alpha takes the volatility (price risk) of a fund and compares its risk-adjusted performance to a benchmark index. The excess return of the fund relative to the return of the benchmark is a fund’s alpha.
18
| | | | |
| | |
| Semiannual Report • 2024 | | | | |
We thank you for your continued trust and investment in the Parnassus Mid Cap Fund.
Yours truly,

Matthew D. Gershuny
Portfolio Manager

Lori A. Keith
Portfolio Manager

Ian E. Sexsmith
Portfolio Manager
19
| | | | |
| | |
| | | | Semiannual Report • 2024 |
Parnassus Mid Cap Growth Fund
Ticker: Investor Shares - PARNX
Ticker: Institutional Shares - PFPRX
As of June 30, 2024, the Parnassus Mid Cap Growth Fund – Investor Shares (“the Fund”) returned -3.20% (net of fees) for the second quarter of 2024, approximately in line with the Russell Midcap Growth Index’s (“Russell Midcap Growth”) -3.21% return.
Below is a table that summarizes the performances of the Parnassus Mid Cap Growth Fund and the Russell Midcap Growth. The returns are for the one-, three-, five- and ten-year periods.
Parnassus Mid Cap Growth Fund
| | | | | | | | | | | | | | | | | | | | | | | | |
| |
| | | Average Annual Total Returns (%) | |
| |
| | | for period ended June 30, 2024 | |
| | | | | | |
| | | One
Year | | | Three
Years | | | Five
Years | | | Ten
Years | | | Gross
Expense
Ratio | | | Net
Expense
Ratio | |
| | | | | | |
| Parnassus Mid Cap Growth Fund – Investor Shares | | | 19.29 | | | | -1.48 | | | | 7.43 | | | | 8.07 | | | | 0.81 | | | | 0.80 | |
| | | | | | |
| Parnassus Mid Cap Growth Fund – Institutional Shares | | | 19.44 | | | | -1.37 | | | | 7.57 | | | | 8.21 | | | | 0.71 | | | | 0.68 | |
| | | | | | |
| Russell Midcap Growth Index | | | 15.05 | | | | -0.07 | | | | 9.93 | | | | 10.52 | | | | NA | | | | NA | |
The average annual total return for the Parnassus Mid Cap Growth Fund – Institutional Shares from commencement (April 30, 2015) was 7.96%. Performance shown prior to the inception of the Institutional Shares reflects the performance of the Parnassus Mid Cap Growth Fund – Investor Shares and includes expenses that are not applicable to and are higher than those of the Institutional Shares. The performance of Institutional Shares differs from that shown for the Investor Shares to the extent that the classes do not have the same expenses.
Performance data quoted represent past performance and are no guarantee of future returns. Current performance may be lower or higher than the performance data quoted. Current performance information to the most recent month end is available on the Parnassus website (www.parnassus.com). Investment return and principal value will fluctuate, so an investor’s shares, when redeemed, may be worth more or less than their original principal cost.
Returns shown in the table do not reflect the deduction of taxes a shareholder may pay on fund distributions or redemption of shares. The Russell Mid Cap Growth is an index of common stocks, and it is not possible to invest directly in an index. Index figures do not take any expenses, fees or taxes into account, but mutual fund returns do.
The estimated impact of individual stocks on the Fund’s performance is provided by FactSet.
Contributions to returns quoted for individual stocks are their returns relative to the Fund’s index.
As described in the Fund’s current prospectus dated May 1, 2024, Parnassus Investments, LLC has contractually agreed to reduce its investment advisory fee to the extent necessary to limit total annual fund operating expenses to 0.80% of net assets for the Parnassus Mid Cap Growth Fund – Investor Shares and to 0.68% of net assets for the Parnassus Mid Cap Growth Fund – Institutional Shares. This agreement will not be terminated prior to May 1, 2025, and may be continued indefinitely by the investment adviser on a year-to-year basis.
Second Quarter Review
The Fund (Investor Shares) returned -3.20% (net of fees) for the second quarter of 2024, approximately in line with the Russell Midcap Growth Index’s -3.21% return. Stock selection in the Information Technology and Industrials sectors contributed to relative results, while selection within Real Estate and Health Care detracted.
The top contributors to relative performance included Teradyne, Guidewire Software and KLA Corp. Notable detractors include CoStar Group, Pool Corp. and Align Technology.
Teradyne, a provider of advanced testing solutions for semiconductors, electronic systems and wireless devices, delivered first-quarter revenue and earnings per share that topped expectations. Management cited artificial intelligence–driven (AI-driven) demand in memory and computing as a significant performance driver.
Guidewire Software, the leading software provider for property and casualty insurers, reported strong fiscal-third-quarter earnings highlighted by accelerating growth in annual recurring revenue and structurally higher profitability. With demand increasing and a broad array of strategic partners to guide implementations and migrations, we see a long runway ahead.
KLA Corp., a provider of process control and yield-management solutions for the semiconductor and related nanoelectronics industries, continued its strong run. We expect that KLA will continue to benefit from the increasing complexity of chip designs.
CoStar Group, a leading provider of online real estate marketplaces, has been investing heavily in Homes.com,
20
| | | | |
| | |
| Semiannual Report • 2024 | | | | |
its residential marketplace, and 2024 is expected to be the peak investment year. We think the investments will pay off, as the company has followed a similar investment profile before, ultimately delivering strong returns.
Pool Corp., a swimming pool supply distributor, lowered its full-year earnings estimates as demand for new pool construction fell more than expected due to high interest rates impacting big ticket purchases. Most of its revenue comes from maintenance of installed pools, which should be resilient.
Align Technology, the manufacturer of leading dental aligner Invisalign, logged solid first-quarter earnings. Shares fell over concerns of weakening consumer sentiment since orthodontic costs are often not covered by insurance. However, we believe that Align, a leader in the clear aligner category, will take market share from metal braces.
Parnassus Mid Cap Growth Fund
As of June 30, 2024
(percentage of net assets)
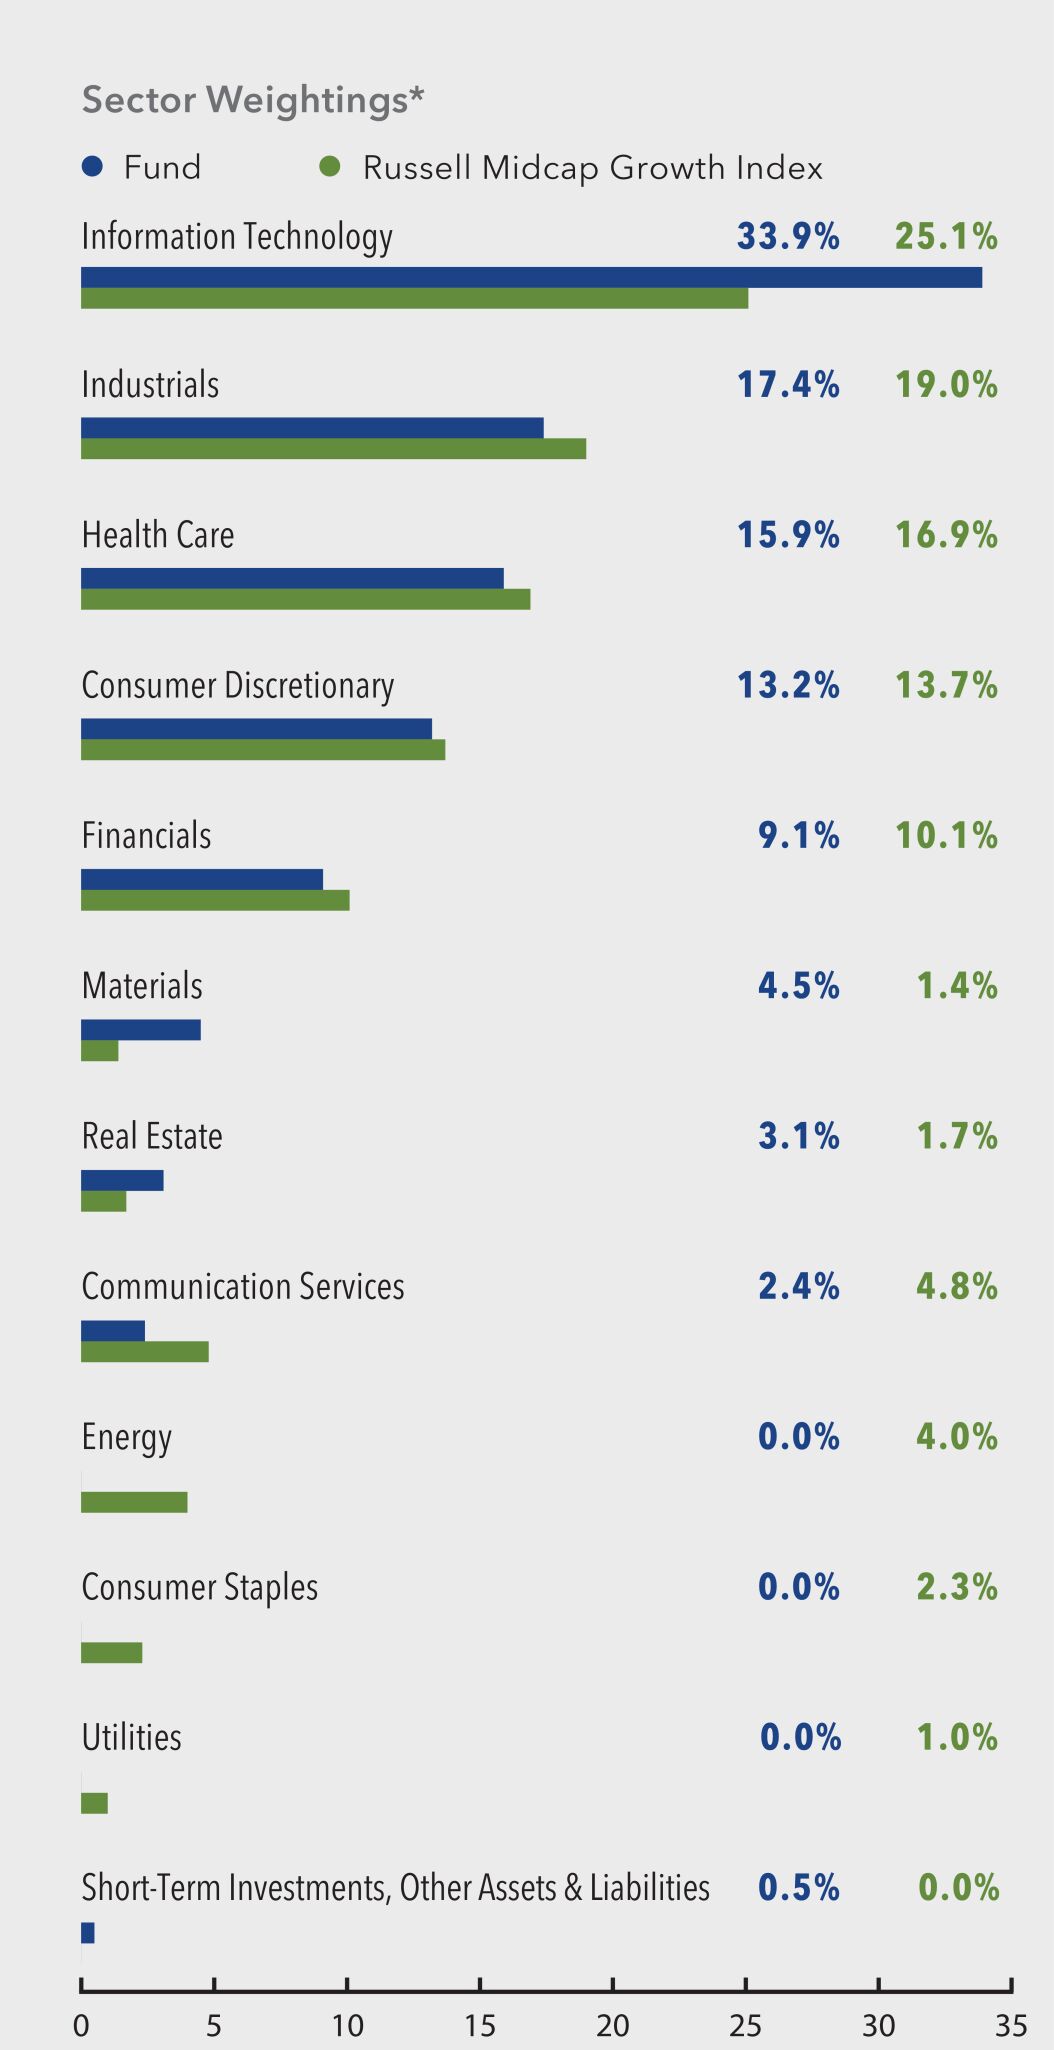
* For purposes of categorizing securities for diversification requirements under the Investment Company Act, the Fund uses industry classifications that are more specific than those used for the chart.
Portfolio characteristics and holdings are subject to change periodically.
21
| | | | |
| | |
| | | | Semiannual Report • 2024 |
| | | | |
| |
| Top 10 Equity Holdings | | | | |
| (percentage of net assets) | | | | |
| |
| Guidewire Software Inc. | | | 5.5% | |
| |
| Teradyne Inc. | | | 4.9% | |
| |
| Equifax Inc. | | | 4.3% | |
| |
| Trane Technologies plc | | | 3.6% | |
| |
| KLA Corp. | | | 3.6% | |
| |
| Agilent Technologies Inc. | | | 3.4% | |
| |
| Ross Stores Inc. | | | 3.4% | |
| |
| CoStar Group Inc. | | | 3.1% | |
| |
| Monolithic Power Systems Inc. | | | 3.0% | |
| |
| Mettler-Toledo International Inc. | | | 3.0% | |
Portfolio characteristics and holdings are subject to change periodically.
Outlook and Strategy
Our portfolio positioning remains consistent with last quarter, as we maintained our overweight position in the semiconductor, software, life sciences tools and housing industries.
Our semiconductor overweight was our most significant contributor this quarter, and our exposure increased as our holdings appreciated. We also re-initiated a position in Western Digital, a memory semiconductor and hard disk drive manufacturer, as we believe earnings expectations are far too low.
We increased our exposure to the software industry during the quarter, adding a new position in payments provider BILL Holdings (Bill.com). Some software stocks have underperformed due to concerns about slowing economic growth and enterprise technology spending on AI crowding out spending on software. However, we have high conviction in our software holdings because they provide mission-critical technology and we believe their network effects, high switching costs and culture of innovation will drive strong long-term performance.
We also increased our exposure to the life sciences tools industry, adding a new position in West Pharmaceutical Services, a leader in packaging for injectable therapies. The industry is going through a cyclical downturn, but drug development continues, ensuring that quality control remains as important as ever; we think it’s only a matter of time before the cycle turns. We exited both of our biotech investments, BioMarin Pharmaceutical and Alnylam Pharmaceuticals, as we believe the life sciences industry offers more
durable growth and wider competitive moats without the idiosyncratic risks of individual drug trials.
We maintained our overweight exposure to the housing market. While we haven’t yet seen a recovery in the housing market, as existing home sales volume remains at multidecade lows due to a structural undersupply, we believe that we are well positioned to benefit when volumes improve. We own a number of best-in-class companies tied to the housing market, including Equifax, Sherwin-Williams and Pool Corp.
While headline economic growth remains positive and the excitement of AI is pushing a concentrated group of stocks to all-time highs, we discern crosscurrents under the surface. Less-affluent consumers are struggling with elevated prices, and persistently high interest rates are negatively impacting some consumers and small- and medium-sized businesses.
However, the Fed is expected to cut interest rates later this year, and we expect fiscal spending to remain at elevated levels. Once the uncertainty of the election passes, “animal spirits” may return and help the economy to reaccelerate, potentially broadening the stock market’s gains.
In this uncertain environment, we’re retaining the portfolio’s overall balanced positioning and focusing on our thematic overweights to semiconductors, software, life sciences tools and housing. Three of those four thematic overweights—software, life sciences tools and housing—are in industries that are out of favor with investors. We think each of them is a coiled spring. When demand in their end markets eventually improves, the upside for these companies should be meaningful.
Thank you for your investment in the Parnassus Mid Cap Growth Fund.
Yours truly,
Ian E. Sexsmith
Lead Portfolio Manager

Robert J. Klaber
Portfolio Manager
22
| | | | |
| | |
| Semiannual Report • 2024 | | | | |
Parnassus Fixed Income Fund
Ticker: Investor Shares - PRFIX
Ticker: Institutional Shares - PFPLX
As of June 30, 2024, after taking dividends into account, the Parnassus Fixed Income Fund – Investor Shares (“the Fund”) returned 0.17% (net of fees) for the second-quarter period, outperforming the nearly flat 0.07% return for the Bloomberg U.S. Aggregate Bond Index (“Bloomberg Aggregate Index”).
Below is a table that summarizes the performances of the Parnassus Fixed Income Fund and the Bloomberg U.S. Aggregate Bond Index. The returns are for the one-, three-, five- and ten-year periods.
Parnassus Fixed Income Fund
| | | | | | | | | | | | | | | | | | | | | | | | |
| |
| | | Average Annual Total Returns (%) | |
| |
| | | for period ended June 30, 2024 | |
| | | | | | |
| | | One
Year | | | Three
Years | | | Five
Years | | | Ten
Years | | | Gross
Expense
Ratio | | | Net
Expense
Ratio | |
| | | | | | |
| Parnassus Fixed Income Fund – Investor Shares | | | 4.22 | | | | -3.07 | | | | -0.35 | | | | 1.16 | | | | 0.81 | | | | 0.58 | |
| | | | | | |
| Parnassus Fixed Income Fund – Institutional Shares | | | 4.43 | | | | -2.86 | | | | -0.12 | | | | 1.36 | | | | 0.61 | | | | 0.39 | |
| | | | | | |
| Bloomberg U.S. Aggregate Bond Index | | | 2.63 | | | | -3.02 | | | | -0.23 | | | | 1.35 | | | | NA | | | | NA | |
The average annual total return for the Parnassus Fixed Income Fund – Institutional Shares from commencement (April 30, 2015) was 1.24%. Performance shown prior to the inception of the Institutional Shares reflects the performance of the Parnassus Fixed Income Fund – Investor Shares and includes expenses that are not applicable to and are higher than those of the Institutional Shares. The performance of the Institutional Shares differs from that shown for the Investor Shares to the extent that the classes do not have the same expenses.
Performance data quoted represent past performance and are no guarantee of future returns. Current performance may be lower or higher than the performance data quoted. Current performance information to the most recent month end is available on the Parnassus website (www.parnassus.com). Investment return and principal value will fluctuate, so an investor’s shares, when redeemed, may be worth more or less than their original cost. Returns would have been lower if certain of the Fund’s fees and expenses had not been waived.
Returns shown in the table do not reflect the deduction of taxes a shareholder would pay in fund distributions or redemption of shares. The Bloomberg U.S. Aggregate Bond Index (formerly known as the Barclays U.S. Aggregate Bond Index) is an unmanaged index of bonds, and it is not possible to invest directly in an index. Index figures do not take any expenses, fees or taxes into account, but mutual fund returns do.
The estimated impact of individual stocks on the Fund’s performance is provided by FactSet.
As described in the Fund’s current prospectus dated May 1, 2024, Parnassus Investments, LLC has contractually agreed to waive 0.10% of its management fee for each class, and to reimburse the Fund for expenses to the extent necessary to limit total operating expenses to 0.58% of net assets for the Parnassus Fixed Income Fund –Investor Shares and to 0.39% of net assets for the Parnassus Fixed Income Fund –Institutional Shares. This agreement will not be terminated prior to May 1, 2025, and may be continued indefinitely by the Adviser on a year-to-year basis.
Second Quarter Review
Parnassus Fixed Income Fund (Investor Shares) returned 0.17% for the second-quarter period, outperforming the nearly flat 0.07% return for the Bloomberg U.S. Aggregate Bond Index. The portfolio maintained an average duration (6.6 years) that was relatively close to that of the index (6.2 years) as spreads widened.
While the corporate bond overweight detracted from the fund’s relative returns, security selection within corporate bonds aided the fund’s performance. Security selection in government-related bonds also aided results, while an underweight to Treasuries hampered relative performance.
The portfolio’s overweight to corporate bonds drove the majority of portfolio returns, as these issues continued to benefit from a strong economy. Among corporate bonds, selection within and an overweight to the Financials sector helped relative performance due to balance sheet strength, ample interest rate coverage and robust demand for new issuance ahead of potential rate cuts. Relative performance was also aided by security selection among Industrials sector corporate bonds, but an overweight to the Industrials sector detracted.
The portfolio’s underweight to Treasuries was a modest detractor. Treasuries and government-related bonds outperformed in a volatile environment that first saw government bonds rally in a flight to quality but pare gains near the end of the period.
Among securitized bonds, our selection within mortgage-backed securities helped relative performance. Mortgage rates remained elevated, while defaults were low.
23
| | | | |
| | |
| | | | Semiannual Report • 2024 |
Parnassus Fixed Income Fund
As of June 30, 2024
(percentage of net assets)
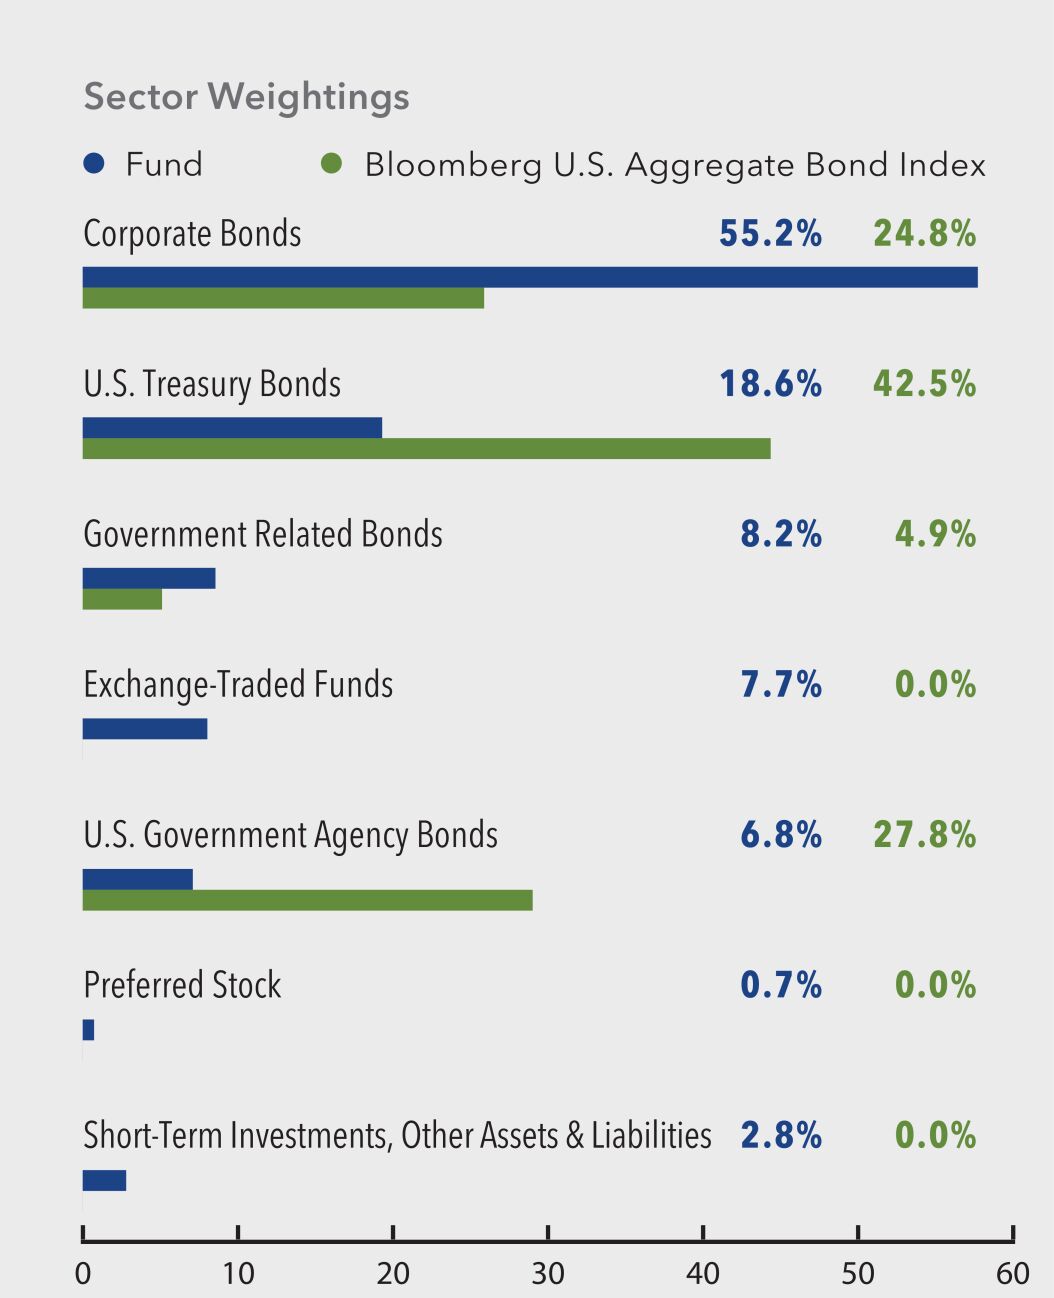
Portfolio characteristics and holdings are subject to change periodically.
Outlook and Strategy
While we believe that corporate bonds provide the best long-term returns because they have higher initial yields, we have further reduced our exposure to the asset class. Credit spreads are historically tight, meaning that investors anticipate a continued strong economy and are willing to accept less yield for less credit risk. We agree that most companies are in excellent financial condition but are seeing opportunities away from corporate bonds, including in mortgage-backed securities. Our allocation to corporate bonds fell from 60% in the first quarter to about 57% at the end of the second quarter. By contrast, the fund typically holds about 70% of assets in corporate bonds. We maintain our overweight position relative to the index because we believe in the long-term prospects of our corporate holdings.
Our portfolio allocation to mortgage-backed bonds stands at 14%, up from about 8% at the end of last
year. These bonds have been disproportionately impacted by higher interest rates, as homeowners are locked into their existing mortgages and the government is no longer purchasing the securities as part of its quantitative easing programs. We think mortgage-backed securities are poised to perform well should yields fall.
We added a new green bond1 issued by Dominion Energy during the quarter. We can purchase green bonds from issuers that might otherwise be outside of Parnassus’s sustainable investment scope, because these bonds provide funding to help companies transition away from fossil fuels and into renewable energy sources. We are excited to support that effort and think these bonds are an attractive addition to the portfolio. We exited Discover Financial, based on its potential upcoming merger with Capital One, and exited Block due to concerns about the regulatory environment.
As we anticipated last spring, the Federal Reserve (Fed) has continued to reduce its forecast for interest rate cuts this year. Outside of housing, the economy has proved resilient despite interest rate hikes, making it difficult for the Fed to justify reducing its policy rate. However, most of that data has been backward-looking, and we see indications that the economy is cooling into the second half of the year. Certain consumer metrics, from spending to subprime delinquencies to confidence, are showing signs of weakness. The economy is starting from a particularly strong position, which should help mitigate some of the impacts of a slowdown.
Given this data, we began insulating the portfolio from the impacts of a slower economy. Some of those changes include reducing the exposure to corporate bonds, as discussed above. As part of these moves, we’ve also reduced the duration of our corporate portfolio. This makes our corporate bonds less sensitive to interest-rate and credit-spread changes. We’ve also extended the duration of our Treasury portfolio. We believe that interest rates are nearer the peak than the trough, and Treasuries are likely to benefit as the economy normalizes. We remain diligent in monitoring the data and alert to making further changes to the portfolio in response to changing conditions.
1 A green bond is a type of fixed income instrument that is specifically earmarked to raise money for climate and environmental projects. These bonds are typically asset-linked and backed by the issuing entity’s balance sheet, so they usually carry the same credit rating as their issuers’ other debt obligations.
24
| | | | |
| | |
| Semiannual Report • 2024 | | | | |
As always, thank you for your investment.

Samantha Palm
Lead Portfolio Manager

Minh Bui
Portfolio Manager
25
| | | | |
| | |
| | | | Semiannual Report • 2024 |
Responsible Investing Notes
Dear Shareholders,
In 2024, the U.S. Supreme Court delivered over a dozen rulings that are likely to have significant and long-lasting implications for the lives of everyday Americans. For this letter, I’d like to focus on just one.
Among the many significant recent developments was the Court’s decision to overturn the 40-year-old “Chevron doctrine,” a ruling that had given deference in interpreting ambiguous statutes to federal agencies, such as the Securities and Exchange Commission (SEC), the Environmental Protection Agency (EPA), the Consumer Financial Protection Bureau (CFPB) and the Occupational Health and Safety Administration (OHSA). The Chevron doctrine meant that agencies like these would fill in gaps where laws passed by Congress were vague, giving certainty (and, yes, at times red tape) to companies trying to navigate complex issues.
The recent decision constrains the power of these agencies to regulate corporate practices and curtails their ability to effectively respond to developing issues like climate change, biodiversity loss, worker safety and environmental justice. It also raises concerns around adequate protection for investors, consumers and communities from deceptive or abusive practices and other adverse impacts.
As quoted by the New York Times, “If Americans are worried about their drinking water, their health, their retirement account, discrimination on the job, if they fly on a plane, drive a car, if they go outside and breathe the air—all of these day-to-day activities are run through a massive universe of federal agency regulations,” said Lisa Heinzerling, an expert in administrative law at Georgetown University. “And this decision now means that more of those regulations could be struck down by the courts.1”
This ruling has unsettled longstanding legal precedents and created a lack of regulatory stability for companies and, importantly, for their investors. We believe this uncertain landscape heightens the importance of ESG integration in investment decision-making and reinforces the role of active ownership in driving long-term, enduring value. Parnassus will continue to:
| | • | | Invest with an owner’s mindset, prioritizing long-term potential over short term gains: In the absence of consistent agency oversight, companies may be incentivized to externalize negative environmental impacts and costs on to stakeholders for short-term profits at the expense of long-term value. When evaluating investment risks and opportunities, we will continue to consider how companies are incorporating stakeholder impacts as part of and alongside financial metrics in business planning and strategic decision making. |
| | • | | Use stewardship to promote high standards for portfolio companies: We will engage companies and vote company proxies to promote long-term thinking at portfolio companies. This means that we will encourage strong governance practices and the integration of environmental and social factors to build more resilient and sustainable businesses, and to identify long-term opportunities for leadership and innovation. |
We will do this because we believe that companies that operate sustainably, respect human rights, promote product responsibility and uphold ethics and transparency are best positioned to succeed and deliver enduring value for investors.
The full effects of this decision will unfold over time through litigation, the setting of new precedents and hopefully without avoidable corporate catastrophes. Against this backdrop, Parnassus will continue to deliver on our mission to build wealth responsibly for long-term investors in alignment with our Principles and Performance investment philosophy.
Typically, in my quarterly perspectives I share recent stewardship highlights across our engagement, proxy and industry advocacy workstreams. However, soon we will be releasing our 2024 Stewardship Report, which will contain full-year details, data and informative case studies covering Parnassus’s stewardship work, impact engagements and results from the 2024 proxy season. In this report, you can expect to see the ways in which our engagements drove improvements in performance and disclosure on climate change, environmental justice, sustainable workplaces and the responsible use of artificial intelligence. You’ll also find information on
1 https://www.nytimes.com/2024/06/28/us/politics/chevron-deference-decision-meaning.html
26
| | | | |
| | |
| Semiannual Report • 2024 | | | | |
the 2024 proxy season, during which we used our votes to press for improvements in executive compensation, board composition and ESG performance at portfolio companies. I look forward to sharing this work with you in the coming quarter.
Thank you for your trust and investment as we continue pursuing Principles and Performance.

Marian Macindoe
Managing Director, Sustainable Investment Strategy
27
| | | | |
| | |
| | | | Semiannual Report • 2024 |
Fund Expenses (unaudited)
As a shareholder of the Funds, you incur ongoing costs, which include portfolio management fees, administrative fees, shareholder reports, and other fund expenses. The Funds do not charge transaction fees, so you do not incur transaction costs such as sales charges (loads) on purchase payments, reinvested dividends, or other distributions, redemption fees, and exchange fees. The information on this page is intended to help you understand your ongoing costs of investing in the Funds and to compare these costs with the ongoing costs of investing in other mutual funds.
The following example is based on an investment of $10,000 invested at the beginning of the most recent six-month period and held for the period of January 1, 2024, through June 30, 2024.
Actual Expenses
In the example below, the first line for each Fund provides information about actual account values and actual expenses. You may use the information in this line, together with the amount you invested, to estimate the expenses that you paid over the period. Simply divide your account value by $10,000 (for example, $86,000 account value divided by $10,000 = 8.6), then multiply the result by the number in the first line under the heading entitled “Expenses Paid During
Period” to estimate the expenses you paid on your account during this period.
Hypothetical Example for Comparison Purposes
The second line of each Fund provides information about hypothetical account values and hypothetical expenses based on the Fund’s expense ratio and an assumed rate of return of 5% per year before expenses, which is not the Fund’s actual return. You may compare the ongoing costs of investing in the Fund with other mutual funds by comparing this 5% hypothetical example with the 5% hypothetical examples that appear in the shareholder reports of other funds.
The hypothetical account values and expenses may not be used to estimate the actual ending account balance or expenses you paid for the period.
Please note that the expenses shown in the table are meant to highlight only your ongoing costs in these Funds. Therefore, the second line of each Fund is useful in comparing only ongoing costs and will not help you determine the relative total costs of owning other mutual funds, which may include transactional costs such as loads.
| | | | | | | | | | | | | | | | | | | | | | | | |
| | | | | | |
| | | | | | Fund
Expense
Ratio | | | Beginning
Account Value
January 1, 2024 | | | Ending
Account Value
June 30, 2024 | | | Expenses Paid
During Period | | | | |
| | | | Parnassus Core Equity Fund – Investor Shares* | | | 0.81% | | | | $10,000.00 | | | | $11,203.00 | | | | $42.70 | | | | | |
| | | | Hypothetical (5% before expenses) | | | 0.81% | | | | $10,000.00 | | | | $10,208.36 | | | | $40.70 | | | | | |
| | | | Parnassus Core Equity Fund – Institutional Shares* | | | 0.61% | | | | $10,000.00 | | | | $11,213.00 | | | | $32.17 | | | | | |
| | | | Hypothetical (5% before expenses) | | | 0.61% | | | | $10,000.00 | | | | $10,218.30 | | | | $30.66 | | | | | |
| | | | Parnassus Growth Equity Fund – Investor Shares* | | | 0.84% | | | | $10,000.00 | | | | $11,714.00 | | | | $45.35 | | | | | |
| | | | Hypothetical (5% before expenses) | | | 0.84% | | | | $10,000.00 | | | | $10,206.86 | | | | $42.20 | | | | | |
| | | | Parnassus Growth Equity Fund – Institutional Shares* | | | 0.63% | | | | $10,000.00 | | | | $11,728.00 | | | | $34.03 | | | | | |
| | | | Hypothetical (5% before expenses) | | | 0.63% | | | | $10,000.00 | | | | $10,217.31 | | | | $31.67 | | | | | |
| | | | Parnassus Value Equity Fund – Investor Shares* | | | 0.88% | | | | $10,000.00 | | | | $10,598.00 | | | | $45.07 | | | | | |
| | | | Hypothetical (5% before expenses) | | | 0.88% | | | | $10,000.00 | | | | $10,204.87 | | | | $44.21 | | | | | |
| | | | Parnassus Value Equity Fund – Institutional Shares* | | | 0.65% | | | | $10,000.00 | | | | $10,610.00 | | | | $33.31 | | | | | |
| | | | Hypothetical (5% before expenses) | | | 0.65% | | | | $10,000.00 | | | | $10,216.31 | | | | $32.67 | | | | | |
| | | | Parnassus Mid Cap Fund – Investor Shares* | | | 0.96% | | | | $10,000.00 | | | | $10,207.00 | | | | $48.23 | | | | | |
| | | | Hypothetical (5% before expenses) | | | 0.96% | | | | $10,000.00 | | | | $10,200.90 | | | | $48.22 | | | | | |
| | | | Parnassus Mid Cap Fund – Institutional Shares* | | | 0.75% | | | | $10,000.00 | | | | $10,216.00 | | | | $37.70 | | | | | |
| | | | Hypothetical (5% before expenses) | | | 0.75% | | | | $10,000.00 | | | | $10,211.34 | | | | $37.69 | | | | | |
| | | | Parnassus Mid Cap Growth Fund – Investor Shares* | | | 0.80% | | | | $10,000.00 | | | | $10,439.00 | | | | $40.65 | | | | | |
| | | | Hypothetical (5% before expenses) | | | 0.80% | | | | $10,000.00 | | | | $10,208.85 | | | | $40.20 | | | | | |
| | | | Parnassus Mid Cap Growth Fund – Institutional Shares* | | | 0.68% | | | | $10,000.00 | | | | $10,446.00 | | | | $34.57 | | | | | |
| | | | Hypothetical (5% before expenses) | | | 0.68% | | | | $10,000.00 | | | | $10,214.82 | | | | $34.18 | | | | | |
| | | | Parnassus Fixed Income Fund – Investor Shares* | | | 0.58% | | | | $10,000.00 | | | | $9,974.00 | | | | $28.80 | | | | | |
| | | | Hypothetical (5% before expenses) | | | 0.58% | | | | $10,000.00 | | | | $10,219.79 | | | | $29.16 | | | | | |
| | | | Parnassus Fixed Income Fund – Institutional Shares* | | | 0.39% | | | | $10,000.00 | | | | $9,987.00 | | | | $19.38 | | | | | |
| | | | Hypothetical (5% before expenses) | | | 0.39% | | | | $10,000.00 | | | | $10,229.24 | | | | $19.62 | | | | | |
* Expenses are calculated using the Funds’ annualized expense ratios, which represent ongoing expense as a percentage of net assets for the six months ended June 30, 2024. Expenses are calculated by multiplying the annualized expense ratio by the average account value of the period; then multiplying the result by the number of days in the most recent six-month period (182); and then dividing that result by the number of days in the current fiscal year (366).
28
| | | | |
| | |
| Semiannual Report • 2024 | | | | |
Parnassus Core Equity Fund
Portfolio of Investments as of June 30, 2024 (unaudited)
| | | | | | | | |
| | |
| Equities | | Shares | | | Market Value ($) | |
| | |
| Banks (2.0%) | | | | | | | | |
| Bank of America Corp. | | | 15,155,348 | | | | 602,728,190 | |
| | |
| | | | | | | | |
| | |
| Capital Markets (7.7%) | | | | | | | | |
| CME Group Inc., Class A | | | 3,801,648 | | | | 747,403,997 | |
| Intercontinental Exchange Inc. | | | 6,070,771 | | | | 831,027,842 | |
| S&P Global Inc. | | | 1,644,675 | | | | 733,525,050 | |
| | |
| | | | | | | | |
| | | | | | | 2,311,956,889 | |
| | |
| | | | | | | | |
| | |
| Chemicals (4.5%) | | | | | | | | |
| Linde plc | | | 1,904,517 | | | | 835,721,105 | |
| The Sherwin-Williams Co. | | | 1,728,005 | | | | 515,688,532 | |
| | |
| | | | | | | | |
| | | | | | | 1,351,409,637 | |
| | |
| | | | | | | | |
| | |
| Commercial Services & Supplies (2.6%) | | | | | | | | |
| Waste Management Inc. | | | 3,714,506 | | | | 792,452,710 | |
| | |
| | | | | | | | |
| | |
| Containers & Packaging (2.8%) | | | | | | | | |
| Ball Corp. W | | | 14,067,624 | | | | 844,338,793 | |
| | |
| | | | | | | | |
| | |
| Diversified Financial Services (5.5%) | | | | | | | | |
| Fiserv Inc. q | | | 4,669,604 | | | | 695,957,780 | |
| Mastercard Inc., Class A | | | 2,149,878 | | | | 948,440,179 | |
| | |
| | | | | | | | |
| | | | | | | 1,644,397,959 | |
| | |
| | | | | | | | |
| | |
| Diversified Telecommunication Services (1.4%) | | | | | | | | |
| Verizon Communications Inc. | | | 10,216,206 | | | | 421,316,335 | |
| | |
| | | | | | | | |
| | |
| Equity Real Estate Investment Trusts (3.2%) | | | | | | | | |
| Realty Income Corp. | | | 18,360,464 | | | | 969,799,708 | |
| | |
| | | | | | | | |
| | |
| Food & Staples Retailing (3.0%) | | | | | | | | |
| Costco Wholesale Corp. | | | 611,804 | | | | 520,027,282 | |
| Sysco Corp. | | | 5,360,834 | | | | 382,709,939 | |
| | |
| | | | | | | | |
| | | | | | | 902,737,221 | |
| | |
| | | | | | | | |
| | |
| Food Products (1.2%) | | | | | | | | |
| Mondelez International Inc., Class A | | | 5,340,039 | | | | 349,452,152 | |
| | |
| | | | | | | | |
| | |
| Health Care Providers & Services (2.2%) | | | | | | | | |
| The Cigna Group | | | 2,017,748 | | | | 667,006,956 | |
| | |
| | | | | | | | |
| | |
| Hotels, Restaurants & Leisure (1.6%) | | | | | | | | |
| Marriott International Inc., Class A | | | 1,939,536 | | | | 468,921,619 | |
| | |
| | | | | | | | |
| | |
| Household Durables (1.1%) | | | | | | | | |
| D.R. Horton Inc. | | | 2,429,184 | | | | 342,344,901 | |
| | |
| | | | | | | | |
| | | | | | | | |
| | |
| Equities | | Shares | | | Market Value ($) | |
| | |
| Household Products (1.7%) | | | | | | | | |
| The Procter & Gamble Co. | | | 3,060,070 | | | | 504,666,744 | |
| | |
| | | | | | | | |
| | |
| Insurance (2.4%) | | | | | | | | |
| Marsh & McLennan Co., Inc. | | | 3,363,457 | | | | 708,747,659 | |
| | |
| | | | | | | | |
| | |
| Interactive Media & Services (6.5%) | | | | | | | | |
| Alphabet Inc., Class A | | | 10,651,549 | | | | 1,940,179,650 | |
| | |
| | | | | | | | |
| | |
| Life Sciences Tools & Services (3.3%) | | | | | | | | |
| Danaher Corp. | | | 1,922,869 | | | | 480,428,820 | |
| Thermo Fisher Scientific Inc. | | | 934,635 | | | | 516,853,155 | |
| | |
| | | | | | | | |
| | | | | | | 997,281,975 | |
| | |
| | | | | | | | |
| | |
| Machinery (3.4%) | | | | | | | | |
| Deere & Co. | | | 2,756,711 | | | | 1,029,989,931 | |
| | |
| | | | | | | | |
| | |
| Media (1.9%) | | | | | | | | |
| Charter Communications Inc., Class A q | | | 1,859,401 | | | | 555,886,523 | |
| | |
| | | | | | | | |
| | |
| Professional Services (2.8%) | | | | | | | | |
| Equifax Inc. | | | 1,547,322 | | | | 375,163,692 | |
| Verisk Analytics Inc., Class A | | | 1,669,658 | | | | 450,056,314 | |
| | |
| | | | | | | | |
| | | | | | | 825,220,006 | |
| | |
| | | | | | | | |
| | |
| Semiconductors & Semiconductor Equipment (14.0%) | | | | | | | | |
| Applied Materials Inc. | | | 3,431,155 | | | | 809,718,268 | |
| Broadcom Inc. | | | 409,583 | | | | 657,597,794 | |
| Intel Corp. | | | 15,712,141 | | | | 486,605,007 | |
| Micron Technology Inc. | | | 2,135,510 | | | | 280,883,630 | |
| NVIDIA Corp. | | | 16,115,820 | | | | 1,990,948,403 | |
| | |
| | | | | | | | |
| | | | | | | 4,225,753,102 | |
| | |
| | | | | | | | |
| | |
| Software (17.7%) | | | | | | | | |
| Adobe Inc. q | | | 901,966 | | | | 501,078,192 | |
| Intuit Inc. | | | 1,053,707 | | | | 692,506,777 | |
| Microsoft Corp. | | | 4,632,147 | | | | 2,070,338,102 | |
| Oracle Corp. | | | 5,781,208 | | | | 816,306,570 | |
| Salesforce Inc. | | | 4,865,440 | | | | 1,250,904,624 | |
| | |
| | | | | | | | |
| | | | | | | 5,331,134,265 | |
| | |
| | | | | | | | |
| | |
| Specialty Retail (2.5%) | | | | | | | | |
| AutoZone Inc. q | | | 249,746 | | | | 740,272,119 | |
| | |
| | | | | | | | |
| | |
| Technology Hardware, Storage & Peripherals (4.6%) | | | | | | | | |
| Apple Inc. | | | 6,508,600 | | | | 1,370,841,332 | |
| | |
| | | | | | | | |
| |
| Total investment in equities (99.6%) | | | | | |
| (cost $20,341,140,076) | | | | | | | 29,898,836,376 | |
| | |
| | | | | | | | |
29
| | | | |
| | |
| | | | Semiannual Report • 2024 |
Parnassus Core Equity Fund
Portfolio of Investments as of June 30, 2024 (unaudited) (continued)
| | | | | | | | | | | | | | | | |
| | | | |
| Short-Term Securities | | Interest
Rate | | | Maturity
Date | | | Principal Amount ($) | | | Market Value ($) | |
| | | | |
| Certificates of Deposit (0.0%) a | | | | | | | | | | | | | | | | |
| Citizens Trust Bank | | | 1.00 | % | | | 01/14/2025 | | | | 250,000 | | | | 244,617 | |
| Community Vision Capital & Consulting | | | 0.25 | % | | | 01/31/2025 | | | | 250,000 | | | | 241,230 | |
| Self-Help Federal Credit Union | | | 4.50 | % | | | 10/16/2024 | | | | 250,000 | | | | 247,076 | |
| Self-Help Federal Credit Union | | | 4.60 | % | | | 02/17/2025 | | | | 1,000,000 | | | | 974,754 | |
| | | | |
| | | | | | | | | | | | | | | | |
| | | | | | | | | | | | | | | 1,707,677 | |
| | | | |
| | | | | | | | | | | | | | | | |
| | | |
| Certificates of Deposit Account Registry Service (0.0%) a | | | | | | | | | | | | | |
CDARS agreement with Beneficial State Bank, dated 03/14/2024 Participating depository institutions: CapStar Bank, par 150,500 First Business Bank., par 235,500;
Freedom Financial Bank, par 235,500;
Frontier Bank, par 235,500;
River City Bank, par 235,500;
Signature Bank National Association, par 235,500;
Solera National Bank, par 235,500;
South Ottumwa Savings Bank, par 235,500;
Summit Community Bank Inc, par 143,000;
The Peoples Bank of Georgia, par 58,000;
(cost $1,943,956) | | | 4.18 | % | | | 03/13/2025 | | | | 2,000,000 | | | | 1,943,956 | |
| | | | |
| | | | | | | | | | | | | | | | |
| | | | |
| Community Development Loans (0.0%) a | | | | | | | | | | | | | | | | |
| New Hampshire Community Loan Fund Inc. | | | 1.00 | % | | | 07/31/2024 | | | | 500,000 | | | | 497,541 | |
| Root Capital Inc. | | | 1.00 | % | | | 02/01/2025 | | | | 200,000 | | | | 192,951 | |
| | | | |
| | | | | | | | | | | | | | | | |
| | | | | | | | | | | | | | | 690,492 | |
| | | | |
| | | | | | | | | | | | | | | | |
| | | | |
| Time Deposits (0.5%) | | | | | | | | | | | | | | | | |
| Citibank, New York | | | 4.68 | % | | | 07/01/2024 | | | | 165,232,255 | | | | 165,232,255 | |
| | | | |
| | | | | | | | | | | | | | | | |
| | | | |
Total short-term securities (0.5%) (cost $169,574,380) | | | | | | | | | | | | | | | 169,574,380 | |
| | | | |
| | | | | | | | | | | | | | | | |
| | | | |
Total securities (100.1%) (cost $20,510,714,456) | | | | | | | | | | | | | | | 30,068,410,756 | |
| | | | |
| | | | | | | | | | | | | | | | |
| | | | |
| Other assets and liabilities (-0.1%) | | | | | | | | | | | | | | | (15,115,055 | ) |
| | | | |
| | | | | | | | | | | | | | | | |
| | | | |
| Total net assets (100.0%) | | | | | | | | | | | | | | | 30,053,295,701 | |
| | | | |
| | | | | | | | | | | | | | | | |
| | | | | | | | | | | | | | | | |
W Fund ownership consists of 5% or more of the shares outstanding of the Affiliated Issuer, as defined under the Investment Securities Act of 1940. q This security is non-income producing. a Market value adjustments have been applied to these securities to reflect potential early withdrawal. Such securities have been classified as level 3. | |
| | | | |
plc Public Limited Company | | | | | | | | | | | | | | | | |
30
| | | | |
| | |
| Semiannual Report • 2024 | | | | |
Parnassus Growth Equity Fund
Portfolio of Investments as of June 30, 2024 (unaudited)
| | | | | | | | |
| | |
| Equities | | Shares | | | Market
Value ($) | |
| | |
| Biotechnology (1.7%) | | | | | | | | |
| Natera Inc. q | | | 7,802 | | | | 844,879 | |
| | |
| | | | | | | | |
| | |
| Capital Markets (5.0%) | | | | | | | | |
| Ares Management Corp., Class A | | | 5,954 | | | | 793,549 | |
| MSCI Inc., Class A | | | 1,693 | | | | 815,603 | |
| S&P Global Inc. | | | 1,978 | | | | 882,188 | |
| | |
| | | | | | | | |
| | | | | | | 2,491,340 | |
| | |
| | | | | | | | |
| | |
| Chemicals (2.9%) | | | | | | | | |
| Linde plc | | | 1,513 | | | | 663,920 | |
| The Sherwin-Williams Co. | | | 2,537 | | | | 757,117 | |
| | |
| | | | | | | | |
| | | | | | | 1,421,037 | |
| | |
| | | | | | | | |
| | |
| Diversified Financial Services (5.4%) | | | | | | | | |
| Adyen N.V., ADR q | | | 54,498 | | | | 646,891 | |
| Visa Inc., Class A | | | 7,825 | | | | 2,053,828 | |
| | |
| | | | | | | | |
| | | | | | | 2,700,719 | |
| | |
| | | | | | | | |
| | |
| Entertainment (1.3%) | | | | | | | | |
| Netflix Inc. q | | | 958 | | | | 646,535 | |
| | |
| | | | | | | | |
| | |
| Food & Staples Retailing (1.9%) | | | | | | | | |
| Costco Wholesale Corp. | | | 1,141 | | | | 969,839 | |
| | |
| | | | | | | | |
| | |
| Health Care Equipment & Supplies (3.2%) | | | | | | | | |
| Boston Scientific Corp. q | | | 12,241 | | | | 942,679 | |
| Intuitive Surgical Inc. q | | | 1,417 | | | | 630,352 | |
| | |
| | | | | | | | |
| | | | | | | 1,573,031 | |
| | |
| | | | | | | | |
| | |
| Health Care Providers & Services (1.9%) | | | | | | | | |
| UnitedHealth Group Inc. | | | 1,893 | | | | 964,029 | |
| | |
| | | | | | | | |
| | |
| Hotels, Restaurants & Leisure (2.5%) | | | | | | | | |
| Airbnb Inc., Class A q | | | 4,225 | | | | 640,637 | |
| Marriott International Inc., Class A | | | 2,565 | | | | 620,140 | |
| | |
| | | | | | | | |
| | | | | | | 1,260,777 | |
| | |
| | | | | | | | |
| | |
| Interactive Media & Services (8.1%) | | | | | | | | |
| Alphabet Inc., Class A | | | 22,261 | | | | 4,054,841 | |
| | |
| | | | | | | | |
| | |
| IT Services (2.1%) | | | | | | | | |
| Akamai Technologies Inc. q | | | 5,490 | | | | 494,539 | |
| Cloudflare Inc., Class A q | | | 6,435 | | | | 533,011 | |
| | |
| | | | | | | | |
| | | | | | | 1,027,550 | |
| | |
| | | | | | | | |
| | |
| Life Sciences Tools & Services (3.1%) | | | | | | | | |
| Danaher Corp. | | | 2,292 | | | | 572,656 | |
| Thermo Fisher Scientific Inc. | | | 1,788 | | | | 988,764 | |
| | |
| | | | | | | | |
| | | | | | | 1,561,420 | |
| | |
| | | | | | | | |
| | |
| Machinery (1.5%) | | | | | | | | |
| Deere & Co. | | | 1,966 | | | | 734,557 | |
| | |
| | | | | | | | |
| | | | | | | | |
| | |
| Equities | | Shares | | | Market
Value ($) | |
| | |
| Media (1.6%) | | | | | | | | |
| Charter Communications Inc., Class A q | | | 2,621 | | | | 783,574 | |
| | |
| | | | | | | | |
| | |
| Multiline Retail (4.9%) | | | | | | | | |
| Amazon.com Inc. q | | | 12,595 | | | | 2,433,984 | |
| | |
| | | | | | | | |
| | |
| Pharmaceuticals (4.8%) | | | | | | | | |
| AstraZeneca plc, ADR | | | 9,092 | | | | 709,085 | |
| Eli Lilly & Co. | | | 1,885 | | | | 1,706,641 | |
| | |
| | | | | | | | |
| | | | | | | 2,415,726 | |
| | |
| | | | | | | | |
| | |
| Professional Services (1.4%) | | | | | | | | |
| Equifax Inc. | | | 2,891 | | | | 700,952 | |
| | |
| | | | | | | | |
| | |
| Semiconductors & Semiconductor Equipment (16.0%) | | | | | | | | |
| Advanced Micro Devices Inc. q | | | 4,980 | | | | 807,806 | |
| Applied Materials Inc. | | | 4,334 | | | | 1,022,781 | |
| Broadcom Inc. | | | 891 | | | | 1,430,527 | |
| NVIDIA Corp. | | | 31,010 | | | | 3,830,975 | |
| Taiwan Semiconductor Manufacturing Co. Ltd., ADR | | | 5,252 | | | | 912,850 | |
| | |
| | | | | | | | |
| | | | | | | 8,004,939 | |
| | |
| | | | | | | | |
| | |
| Software (21.5%) | | | | | | | | |
| Adobe Inc. q | | | 1,873 | | | | 1,040,526 | |
| Intuit Inc. | | | 1,844 | | | | 1,211,895 | |
| Microsoft Corp. | | | 9,352 | | | | 4,179,876 | |
| Procore Technologies Inc. q | | | 11,079 | | | | 734,649 | |
| PTC Inc. q | | | 4,799 | | | | 871,834 | |
| Salesforce Inc. | | | 6,487 | | | | 1,667,808 | |
| Workday Inc., Class A q | | | 4,767 | | | | 1,065,711 | |
| | |
| | | | | | | | |
| | | | | | | 10,772,299 | |
| | |
| | | | | | | | |
| | |
| Technology Hardware, Storage & Peripherals (4.5%) | | | | | | | | |
| Apple Inc. | | | 10,705 | | | | 2,254,687 | |
| | |
| | | | | | | | |
| | |
| Textiles, Apparel & Luxury Goods (1.3%) | | | | | | | | |
| LVMH Moët Hennessy Louis Vuitton, ADR | | | 4,289 | | | | 657,718 | |
| | |
| | | | | | | | |
| | |
| Trading Companies & Distributors (1.4%) | | | | | | | | |
| Ferguson plc | | | 3,487 | | | | 675,258 | |
| | |
| | | | | | | | |
| | |
Total investment in equities (98.0%)
(cost $37,890,792) | | | | | | | 48,949,691 | |
| | |
| | | | | | | | |
31
| | | | |
| | |
| | | | Semiannual Report • 2024 |
Parnassus Growth Equity Fund
Portfolio of Investments as of June 30, 2024 (unaudited) (continued)
| | | | | | | | | | | | | | | | |
| | | | |
| Short-Term Securities | | Interest
Rate | | | Maturity
Date | | | Principal
Amount ($) | | | Market
Value ($) | |
| | |
| Time Deposits (2.0%) | | | | | | | | | |
| SEB, Stockholm | | | 4.68 | % | | | 07/01/2024 | | | | 1,012,113 | | | | 1,012,113 | |
| | | | |
| | | | | | | | | | | | | | | | |
| | | | |
Total short-term securities (2.0%)
(cost $1,012,113) | | | | | | | | | | | | | | | 1,012,113 | |
| | | | |
| | | | | | | | | | | | | | | | |
| | | | |
Total securities (100.0%)
(cost $38,902,905) | | | | | | | | | | | | | | | 49,961,804 | |
| | | | |
| | | | | | | | | | | | | | | | |
| | | | |
| Other assets and liabilities (0.0%) | | | | | | | | | | | | | | | (24,621 | ) |
| | | | |
| | | | | | | | | | | | | | | | |
| | | | |
| Total net assets (100.0%) | | | | | | | | | | | | | | | 49,937,183 | |
| | | | |
| | | | | | | | | | | | | | | | |
| | | | | | | | | | | | | | | | |
q This security is non-income producing. | | | | | | | | | | | | | | | | |
| | | | |
plc Public Limited Company | | | | | | | | | | | | | | | | |
ADR American Depositary Receipt | | | | | | | | | | | | | | | | |
N.V. Naamloze Vennootschap | | | | | | | | | | | | | | | | |
32
| | | | |
| | |
| Semiannual Report • 2024 | | | | |
Parnassus Value Equity Fund
Portfolio of Investments as of June 30, 2024 (unaudited)
| | | | | | | | |
| | |
| Equities | | Shares | | | Market
Value ($) | |
| | |
| Air Freight & Logistics (1.8%) | | | | | | | | |
| FedEx Corp. | | | 301,210 | | | | 90,314,806 | |
| | |
| | | | | | | | |
| | |
| Banks (6.0%) | | | | | | | | |
| Bank of America Corp. | | | 4,315,265 | | | | 171,618,089 | |
| Citigroup Inc. | | | 1,922,087 | | | | 121,975,641 | |
| | |
| | | | | | | | |
| | | | | | | 293,593,730 | |
| | |
| | | | | | | | |
| | |
| Biotechnology (3.7%) | | | | | | | | |
| Biogen Inc. q | | | 360,742 | | | | 83,627,210 | |
| Gilead Sciences Inc. | | | 1,432,811 | | | | 98,305,163 | |
| | |
| | | | | | | | |
| | | | | | | 181,932,373 | |
| | |
| | | | | | | | |
| | |
| Capital Markets (9.7%) | | | | | | | | |
| CME Group Inc., Class A | | | 365,859 | | | | 71,927,879 | |
| S&P Global Inc. | | | 331,514 | | | | 147,855,244 | |
| The Bank of New York Mellon Corp. | | | 2,286,397 | | | | 136,932,316 | |
| The Charles Schwab Corp. | | | 1,627,758 | | | | 119,949,487 | |
| | |
| | | | | | | | |
| | | | | | | 476,664,926 | |
| | |
| | | | | | | | |
| | |
| Chemicals (1.6%) | | | | | | | | |
| Nutrien Ltd. l | | | 1,564,307 | | | | 79,638,869 | |
| | |
| | | | | | | | |
| | |
| Consumer Finance (1.7%) | | | | | | | | |
| American Express Co. | | | 369,561 | | | | 85,571,850 | |
| | |
| | | | | | | | |
| | |
| Containers & Packaging (2.8%) | | | | | | | | |
| Ball Corp. W | | | 2,303,656 | | | | 138,265,433 | |
| | |
| | | | | | | | |
| | |
| Diversified Financial Services (7.5%) | | | | | | | | |
| Fidelity National Information Services | | | 1,640,360 | | | | 123,617,530 | |
| Global Payments Inc. | | | 1,310,863 | | | | 126,760,452 | |
| Mastercard Inc., Class A | | | 265,769 | | | | 117,246,652 | |
| | |
| | | | | | | | |
| | | | | | | 367,624,634 | |
| | |
| | | | | | | | |
| | |
| Diversified Telecommunication Services (4.2%) | | | | | | | | |
| Verizon Communications Inc. | | | 4,987,150 | | | | 205,670,066 | |
| | |
| | | | | | | | |
| | |
| Entertainment (1.6%) | | | | | | | | |
| The Walt Disney Co. | | | 764,219 | | | | 75,879,305 | |
| | |
| | | | | | | | |
| | |
| Equity Real Estate Investment Trusts (4.0%) | | | | | | | | |
| CBRE Group Inc., Class A q | | | 1,005,993 | | | | 89,644,036 | |
| Simon Property Group Inc. | | | 710,235 | | | | 107,813,673 | |
| | |
| | | | | | | | |
| | | | | | | 197,457,709 | |
| | |
| | | | | | | | |
| | |
| Food & Staples Retailing (2.9%) | | | | | | | | |
| Sysco Corp. | | | 1,975,976 | | | | 141,064,927 | |
| | |
| | | | | | | | |
| | |
| Health Care Equipment & Supplies (3.1%) | | | | | | | | |
| Align Technology Inc. q | | | 330,007 | | | | 79,673,590 | |
| Baxter International Inc. | | | 2,222,045 | | | | 74,327,405 | |
| | |
| | | | | | | | |
| | | | | | | 154,000,995 | |
| | |
| | | | | | | | |
| | |
| Health Care Providers & Services (2.4%) | | | | | | | | |
| The Cigna Group | | | 353,497 | | | | 116,855,503 | |
| | |
| | | | | | | | |
| | | | | | | | |
| | |
| Equities | | Shares | | | Market
Value ($) | |
| | |
| Household Durables (2.5%) | | | | | | | | |
| D.R. Horton Inc. | | | 864,230 | | | | 121,795,934 | |
| | |
| | | | | | | | |
| | |
| Independent Power & Renewable Electricity Producers (1.5%) | | | | | | | | |
| Brookfield Renewable Corp., Class A l | | | 2,572,928 | | | | 73,019,697 | |
| | |
| | | | | | | | |
| | |
| Insurance (2.5%) | | | | | | | | |
| The Progressive Corp. | | | 586,702 | | | | 121,863,872 | |
| | |
| | | | | | | | |
| | |
| Interactive Media & Services (3.0%) | | | | | | | | |
| Alphabet Inc., Class A | | | 797,835 | | | | 145,325,645 | |
| | |
| | | | | | | | |
| | |
| Life Sciences Tools & Services (4.2%) | | | | | | | | |
| Agilent Technologies Inc. | | | 944,194 | | | | 122,395,868 | |
| Bio-Rad Laboratories Inc., Class A q | | | 310,732 | | | | 84,864,017 | |
| | |
| | | | | | | | |
| | | | | | | 207,259,885 | |
| | |
| | | | | | | | |
| | |
| Machinery (5.1%) | | | | | | | | |
| Cummins Inc. | | | 427,848 | | | | 118,483,947 | |
| Deere & Co. | | | 348,570 | | | | 130,236,209 | |
| | |
| | | | | | | | |
| | | | | | | 248,720,156 | |
| | |
| | | | | | | | |
| | |
| Media (3.5%) | | | | | | | | |
| Charter Communications Inc., Class A q | | | 333,220 | | | | 99,619,451 | |
| Comcast Corp., Class A | | | 1,852,661 | | | | 72,550,205 | |
| | |
| | | | | | | | |
| | | | | | | 172,169,656 | |
| | |
| | | | | | | | |
| | |
| Pharmaceuticals (2.4%) | | | | | | | | |
| Pfizer Inc. | | | 4,233,811 | | | | 118,462,032 | |
| | |
| | | | | | | | |
| | |
| Road & Rail (2.2%) | | | | | | | | |
| Union Pacific Corp. | | | 482,958 | | | | 109,274,077 | |
| | |
| | | | | | | | |
| | |
| Semiconductors & Semiconductor Equipment (7.8%) | | | | | | | | |
| Broadcom Inc. | | | 33,578 | | | | 53,910,486 | |
| Intel Corp. | | | 3,678,098 | | | | 113,910,695 | |
| Micron Technology Inc. | | | 1,013,884 | | | | 133,356,163 | |
| Taiwan Semiconductor Manufacturing Co. Ltd., ADR | | | 476,163 | | | | 82,761,891 | |
| | |
| | | | | | | | |
| | | | | | | 383,939,235 | |
| | |
| | | | | | | | |
| | |
| Software (7.8%) | | | | | | | | |
| Microsoft Corp. | | | 294,390 | | | | 131,577,611 | |
| Nice Ltd., ADR q | | | 509,404 | | | | 87,602,206 | |
| Oracle Corp. | | | 1,159,208 | | | | 163,680,170 | |
| | |
| | | | | | | | |
| | | | | | | 382,859,987 | |
| | |
| | | | | | | | |
| | |
| Specialty Retail (2.0%) | | | | | | | | |
| Ross Stores Inc. | | | 670,406 | | | | 97,423,400 | |
| | |
| | | | | | | | |
| | |
| Technology Hardware, Storage & Peripherals (2.0%) | | | | | | | | |
| Western Digital Corp. q | | | 1,240,198 | | | | 93,969,802 | |
| | |
| | | | | | | | |
| |
Total investment in equities (99.5%)
(cost $3,909,569,705) | | | | 4,880,618,504 | |
| | |
| | | | | | | | |
33
| | | | |
| | |
| | | | Semiannual Report • 2024 |
Parnassus Value Equity Fund
Portfolio of Investments as of June 30, 2024 (unaudited) (continued)
| | | | | | | | | | | | | | | | |
| | | | |
| Short-Term Securities | | Interest
Rate | | | Maturity
Date | | | Principal
Amount ($) | | | Market
Value ($) | |
| | | | |
| Certificates of Deposit (0.1%) a | | | | | | | | | | | | | | | | |
| Citizens Trust Bank | | | 1.00 | % | | | 10/06/2024 | | | | 250,000 | | | | 247,350 | |
| Community Vision Capital & Consulting | | | 0.25 | % | | | 03/31/2025 | | | | 250,000 | | | | 238,781 | |
| Self-Help Federal Credit Union | | | 4.60 | % | | | 02/25/2025 | | | | 250,000 | | | | 243,488 | |
| | | | |
| | | | | | | | | | | | | | | | |
| | | | | | | | | | | | | | | 729,619 | |
| | | | |
| | | | | | | | | | | | | | | | |
| | | | |
| Certificates of Deposit Account Registry Service (0.0%) a | | | | | | | | | | | | | | | | |
CDARS agreement with Beneficial State Bank,
dated 03/14/2024
Participating depository institutions:
First Business Bank, par 230,073;
Frontier Bank, par 34,427;
Solera National Bank, par 235,500;
(cost $485,989) | | | 4.18 | % | | | 03/13/2025 | | | | 500,000 | | | | 485,989 | |
| | | | |
| | | | | | | | | | | | | | | | |
| | | | |
| Community Development Loans (0.0%) a | | | | | | | | | | | | | | | | |
| Root Capital Inc. | | | 1.00 | % | | | 02/01/2025 | | | | 100,000 | | | | 96,475 | |
| | | | |
| | | | | | | | | | | | | | | | |
|
| Securities Purchased with Cash Collateral from Securities Lending | |
| | | | |
| Registered Investment Companies (0.3%) | | | | | | | | | | | | | | | | |
| Invesco Aim Government & Agency Portfolio Short-Term Investments Trust, Institutional Class | | | 5.16 | % | | | | | | | | | | | 14,682,746 | |
| | | | |
| | | | | | | | | | | | | | | | |
| | | | |
| Time Deposits (0.4%) | | | | | | | | | | | | | | | | |
| ANZ, London | | | 4.68 | % | | | 07/01/2024 | | | | 20,828,492 | | | | 20,828,492 | |
| | | | |
| | | | | | | | | | | | | | | | |
| | | | |
Total short-term securities (0.8%)
(cost $36,823,321) | | | | | | | | | | | | | | | 36,823,321 | |
| | | | |
| | | | | | | | | | | | | | | | |
| | | | |
Total securities (100.3%)
(cost $3,946,393,026) | | | | | | | | | | | | | | | 4,917,441,825 | |
| | | | |
| | | | | | | | | | | | | | | | |
| | | | |
| Payable upon return of securities loaned (-0.3%) | | | | | | | | | | | | | | | (14,682,746 | ) |
| | | | |
| | | | | | | | | | | | | | | | |
| | | | |
| Other assets and liabilities (0.0%) | | | | | | | | | | | | | | | 190,231 | |
| | | | |
| | | | | | | | | | | | | | | | |
| | | | |
| Total net assets (100.0%) | | | | | | | | | | | | | | | 4,902,949,310 | |
| | | | |
| | | | | | | | | | | | | | | | |
| | | | | | | | | | | | | | | | |
q This security is non-income producing. | | | | | | | | | | | | | | | | |
l This security, or partial position of this security, was on loan at June 30, 2024. The total value of the securities on loan at June 30, 2024 was $14,372,863. | |
W Fund ownership consists of 5% or more of the shares outstanding of the Affiliated Issuer, as defined under the Investment Securities Act of 1940. | |
a Market value adjustments have been applied to these securities to reflect potential early withdrawal. Such securities have been
classified as level 3. | |
| | | | |
ADR American Depositary Receipt | | | | | | | | | | | | | | | | |
34
| | | | |
| | |
| Semiannual Report • 2024 | | | | |
Parnassus Mid Cap Fund
Portfolio of Investments as of June 30, 2024 (unaudited)
| | | | | | | | |
| | |
| Equities | | Shares | | | Market Value ($) | |
| | |
| Banks (2.6%) | | | | | | | | |
| Truist Financial Corp. | | | 2,010,845 | | | | 78,121,328 | |
| | |
| | | | | | | | |
| | |
| Capital Markets (6.2%) | | | | | | | | |
| Cboe Global Markets Inc. | | | 616,319 | | | | 104,811,209 | |
| The Bank of New York Mellon Corp. | | | 1,410,382 | | | | 84,467,778 | |
| | |
| | | | | | | | |
| | | | | | | 189,278,987 | |
| | |
| | | | | | | | |
| | |
| Chemicals (4.4%) | | | | | | | | |
| Nutrien Ltd. | | | 1,044,168 | | | | 53,158,593 | |
| The Sherwin-Williams Co. | | | 269,729 | | | | 80,495,226 | |
| | |
| | | | | | | | |
| | | | | | | 133,653,819 | |
| | |
| | | | | | | | |
| | |
| Commercial Services & Supplies (3.1%) | | | | | | | | |
| Republic Services Inc., Class A | | | 488,300 | | | | 94,896,222 | |
| | |
| | | | | | | | |
| | |
| Containers & Packaging (1.8%) | | | | | | | | |
| Ball Corp. W | | | 918,160 | | | | 55,107,963 | |
| | |
| | | | | | | | |
| | |
| Distributors (1.5%) | | | | | | | | |
| Pool Corp. | | | 142,846 | | | | 43,900,861 | |
| | |
| | | | | | | | |
| | |
| Diversified Financial Services (3.9%) | | | | | | | | |
| Fidelity National Information Services | | | 1,585,601 | | | | 119,490,891 | |
| | |
| | | | | | | | |
| | |
| Electric Utilities (2.3%) | | | | | | | | |
| IDACORP Inc. | | | 749,994 | | | | 69,861,941 | |
| | |
| | | | | | | | |
| | |
| Equity Real Estate Investment Trusts (2.7%) | | | | | | | | |
| CBRE Group Inc., Class A q | | | 916,265 | | | | 81,648,374 | |
| | |
| | | | | | | | |
| | |
| Health Care Equipment & Supplies (3.1%) | | | | | | | | |
| Hologic Inc. q | | | 1,273,829 | | | | 94,581,803 | |
| | |
| | | | | | | | |
| | |
| Health Care REITs (1.4%) | | | | | | | | |
| Alexandria Real Estate Equities Inc. | | | 357,801 | | | | 41,851,983 | |
| | |
| | | | | | | | |
| | |
| Hotels, Restaurants & Leisure (1.3%) | | | | | | | | |
| Hilton Worldwide Holdings Inc. | | | 179,063 | | | | 39,071,547 | |
| | |
| | | | | | | | |
| | |
| Household Durables (2.5%) | | | | | | | | |
| D.R. Horton Inc. | | | 539,729 | | | | 76,064,008 | |
| | |
| | | | | | | | |
| | |
| Insurance (4.6%) | | | | | | | | |
| The Allstate Corp. | | | 484,587 | | | | 77,369,160 | |
| W R Berkley Corp. | | | 784,069 | | | | 61,612,142 | |
| | |
| | | | | | | | |
| | | | | | | 138,981,302 | |
| | |
| | | | | | | | |
| | |
| Life Sciences Tools & Services (5.9%) | | | | | | | | |
| Avantor Inc. q | | | 2,961,499 | | | | 62,783,779 | |
| IQVIA Holdings Inc. q | | | 362,031 | | | | 76,547,835 | |
| Repligen Corp. q | | | 319,127 | | | | 40,229,150 | |
| | |
| | | | | | | | |
| | | | | | | 179,560,764 | |
| | |
| | | | | | | | |
| | | | | | | | |
| | |
| Equities | | Shares | | | Market Value ($) | |
| | |
| Machinery (6.7%) | | | | | | | | |
| Otis Worldwide Corp. | | | 851,867 | | | | 82,000,717 | |
| Pentair plc | | | 562,318 | | | | 43,112,921 | |
| Xylem Inc. | | | 585,229 | | | | 79,374,609 | |
| | |
| | | | | | | | |
| | | | | | | 204,488,247 | |
| | |
| | | | | | | | |
| | |
| Media (2.5%) | | | | | | | | |
| The Trade Desk, Inc., Class A q | | | 788,991 | | | | 77,060,751 | |
| | |
| | | | | | | | |
| | |
| Professional Services (5.7%) | | | | | | | | |
| Broadridge Financial Solutions Inc. | | | 396,837 | | | | 78,176,889 | |
| TransUnion | | | 1,289,235 | | | | 95,609,668 | |
| | |
| | | | | | | | |
| | | | | | | 173,786,557 | |
| | |
| | | | | | | | |
| | |
| Road & Rail (5.4%) | | | | | | | | |
| J.B. Hunt Transport Services Inc. | | | 659,792 | | | | 105,566,720 | |
| Old Dominion Freight Line Inc. | | | 325,247 | | | | 57,438,620 | |
| | |
| | | | | | | | |
| | | | | | | 163,005,340 | |
| | |
| | | | | | | | |
| | |
| Semiconductors & Semiconductor Equipment (5.6%) | | | | | | | | |
| KLA Corp. | | | 117,796 | | | | 97,123,980 | |
| Lam Research Corp. | | | 67,383 | | | | 71,752,788 | |
| | |
| | | | | | | | |
| | | | | | | 168,876,768 | |
| | |
| | | | | | | | |
| | |
| Software (16.2%) | | | | | | | | |
| Autodesk Inc. q | | | 276,100 | | | | 68,320,945 | |
| BILL Holdings Inc. q | | | 1,195,326 | | | | 62,898,054 | |
| Fortinet Inc. q | | | 1,249,460 | | | | 75,304,954 | |
| Guidewire Software Inc. q | | | 824,292 | | | | 113,661,624 | |
| Roper Technologies Inc. | | | 194,917 | | | | 109,866,916 | |
| Workday Inc., Class A q | | | 278,027 | | | | 62,155,716 | |
| | |
| | | | | | | | |
| | | | | | | 492,208,209 | |
| | |
| | | | | | | | |
| | |
| Specialty Retail (5.4%) | | | | | | | | |
| O’Reilly Automotive Inc. q | | | 71,546 | | | | 75,556,869 | |
| Ross Stores Inc. | | | 607,193 | | | | 88,237,287 | |
| | |
| | | | | | | | |
| | | | | | | 163,794,156 | |
| | |
| | | | | | | | |
| | |
| Technology Hardware, Storage & Peripherals (2.2%) | | | | | | | | |
| Western Digital Corp. q | | | 877,804 | | | | 66,511,209 | |
| | |
| | | | | | | | |
| | |
| Trading Companies & Distributors (2.2%) | | | | | | | | |
| Ferguson plc | | | 343,450 | | | | 66,509,093 | |
| | |
| | | | | | | | |
| |
| Total investment in equities (99.2%) | | | | | |
| (cost $2,568,182,523) | | | | | | | 3,012,312,123 | |
| | |
| | | | | | | | |
35
| | | | |
| | |
| | | | Semiannual Report • 2024 |
Parnassus Mid Cap Fund
Portfolio of Investments as of June 30, 2024 (unaudited) (continued)
| | | | | | | | | | | | | | | | |
| Short-Term Securities | | Interest
Rate | | | Maturity
Date | | | Principal Amount ($) | | | Market Value ($) | |
| | | | |
| Certificates of Deposit (0.0%) a | | | | | | | | | | | | | | | | |
| Beneficial State Bank | | | 4.00 | % | | | 03/27/2025 | | | | 250,000 | | | | 242,630 | |
| Citizens Trust Bank | | | 1.00 | % | | | 01/14/2025 | | | | 250,000 | | | | 244,617 | |
| Self-Help Federal Credit Union | | | 4.60 | % | | | 02/17/2025 | | | | 250,000 | | | | 243,689 | |
| | | | |
| | | | | | | | | | | | | | | | |
| | | | | | | | | | | | | | | 730,936 | |
| | | | |
| | | | | | | | | | | | | | | | |
| | | | |
| Time Deposits (0.9%) | | | | | | | | | | | | | | | | |
| Citibank, New York | | | 4.68 | % | | | 07/01/2024 | | | | 25,006,054 | | | | 25,006,054 | |
| JPMorgan Chase, New York | | | 4.68 | % | | | 07/01/2024 | | | | 1,814,094 | | | | 1,814,094 | |
| | | | |
| | | | | | | | | | | | | | | | |
| | | | | | | | | | | | | | | 26,820,148 | |
| | | | |
| | | | | | | | | | | | | | | | |
| | | | |
Total short-term securities (0.9%) (cost $27,551,084) | | | | | | | | | | | | | | | 27,551,084 | |
| | | | |
| | | | | | | | | | | | | | | | |
| | | | |
Total securities (100.1%) (cost $2,595,733,607) | | | | | | | | | | | | | | | 3,039,863,207 | |
| | | | |
| | | | | | | | | | | | | | | | |
| | | | |
| Other assets and liabilities (-0.1%) | | | | | | | | | | | | | | | (2,064,481 | ) |
| | | | |
| | | | | | | | | | | | | | | | |
| | | | |
| Total net assets (100.0%) | | | | | | | | | | | | | | | 3,037,798,726 | |
| | | | |
| | | | | | | | | | | | | | | | |
| | | | | | | | | | | | | | | | |
W Fund ownership consists of 5% or more of the shares outstanding of the Affiliated Issuer, as defined under the Investment Securities Act of 1940. q This security is non-income producing. a Market value adjustments have been applied to these securities to reflect potential early withdrawal. Such securities have been classified as level 3. | |
| | | | |
plc Public Limited Company | | | | | | | | | | | | | | | | |
36
| | | | |
| | |
| Semiannual Report • 2024 | | | | |
Parnassus Mid Cap Growth Fund
Portfolio of Investments as of June 30, 2024 (unaudited)
| | | | | | | | |
| | |
| Equities | | Shares | | | Market Value ($) | |
| | |
| Building Products (3.6%) | | | | | | | | |
| Trane Technologies plc | | | 89,740 | | | | 29,518,178 | |
| | |
| | | | | | | | |
| | |
| Capital Markets (6.0%) | | | | | | | | |
| LPL Financial Holdings Inc. | | | 56,840 | | | | 15,875,412 | |
| Morningstar Inc. | | | 71,034 | | | | 21,015,409 | |
| MSCI Inc., Class A | | | 26,308 | | | | 12,673,879 | |
| | |
| | | | | | | | |
| | | | | | | 49,564,700 | |
| | |
| | | | | | | | |
| | |
| Chemicals (4.5%) | | | | | | | | |
| Nutrien Ltd. | | | 310,046 | | | | 15,784,442 | |
| The Sherwin-Williams Co. | | | 72,133 | | | | 21,526,651 | |
| | |
| | | | | | | | |
| | | | | | | 37,311,093 | |
| | |
| | | | | | | | |
| | |
| Commercial Services & Supplies (2.6%) | | | | | | | | |
| Cintas Corp. | | | 30,728 | | | | 21,517,589 | |
| | |
| | | | | | | | |
| | |
| Distributors (2.0%) | | | | | | | | |
| Pool Corp. | | | 54,897 | | | | 16,871,495 | |
| | |
| | | | | | | | |
| | |
| Diversified Financial Services (1.0%) | | | | | | | | |
| Adyen N.V., ADR q | | | 720,125 | | | | 8,547,884 | |
| | |
| | | | | | | | |
| | |
| Equity Real Estate Investment Trusts (3.1%) | | | | | | | | |
| CoStar Group Inc. q | | | 348,207 | | | | 25,816,067 | |
| | |
| | | | | | | | |
| | |
| Health Care Equipment & Supplies (4.8%) | | | | | | | | |
| Align Technology Inc. q | | | 66,596 | | | | 16,078,272 | |
| IDEXX Laboratories Inc. q | | | 48,983 | | | | 23,864,518 | |
| | |
| | | | | | | | |
| | | | | | | 39,942,790 | |
| | |
| | | | | | | | |
| | |
| Hotels, Restaurants & Leisure (2.9%) | | | | | | | | |
| Hilton Worldwide Holdings Inc. | | | 108,531 | | | | 23,681,464 | |
| | |
| | | | | | | | |
| | |
| Insurance (2.1%) | | | | | | | | |
| The Progressive Corp. | | | 85,449 | | | | 17,748,612 | |
| | |
| | | | | | | | |
| | |
| Life Sciences Tools & Services (11.0%) | | | | | | | | |
| Agilent Technologies Inc. | | | 215,607 | | | | 27,949,135 | |
| IQVIA Holdings Inc. q | | | 83,124 | | | | 17,575,739 | |
| Mettler-Toledo International Inc. q | | | 17,848 | | | | 24,944,186 | |
| Repligen Corp. q | | | 69,404 | | | | 8,749,068 | |
| West Pharmaceutical Services | | | 38,013 | | | | 12,521,102 | |
| | |
| | | | | | | | |
| | | | | | | 91,739,230 | |
| | |
| | | | | | | | |
| | |
| Media (2.4%) | | | | | | | | |
| The Trade Desk, Inc., Class A q | | | 206,498 | | | | 20,168,660 | |
| | |
| | | | | | | | |
| | |
| Multiline Retail (2.9%) | | | | | | | | |
| MercadoLibre Inc. q | | | 14,467 | | | | 23,775,068 | |
| | |
| | | | | | | | |
| | | | | | | | |
| | |
| Equities | | Shares | | | Market Value ($) | |
| | |
| Professional Services (8.7%) | | | | | | | | |
| Broadridge Financial Solutions Inc. | | | 111,530 | | | | 21,971,410 | |
| Equifax Inc. | | | 147,699 | | | | 35,811,100 | |
| Verisk Analytics Inc., Class A | | | 54,962 | | | | 14,815,007 | |
| | |
| | | | | | | | |
| | | | | | | 72,597,517 | |
| | |
| | | | | | | | |
| | |
| Road & Rail (2.6%) | | | | | | | | |
| Old Dominion Freight Line Inc. | | | 120,458 | | | | 21,272,883 | |
| | |
| | | | | | | | |
| | |
| Semiconductors & Semiconductor Equipment (11.5%) | | | | | | | | |
| KLA Corp. | | | 35,771 | | | | 29,493,547 | |
| Monolithic Power Systems Inc. | | | 30,663 | | | | 25,195,174 | |
| Teradyne Inc. | | | 275,652 | | | | 40,876,435 | |
| | |
| | | | | | | | |
| | | | | | | 95,565,156 | |
| | |
| | | | | | | | |
| | |
| Software (20.6%) | | | | | | | | |
| Atlassian Corp., Class A q | | | 75,954 | | | | 13,434,744 | |
| BILL Holdings Inc. q | | | 317,035 | | | | 16,682,382 | |
| Cadence Design Systems Inc. q | | | 54,507 | | | | 16,774,529 | |
| Datadog Inc., Class A q | | | 144,377 | | | | 18,724,253 | |
| Fortinet Inc. q | | | 252,877 | | | | 15,240,897 | |
| Guidewire Software Inc. q | | | 332,044 | | | | 45,785,547 | |
| Procore Technologies Inc. q | | | 125,868 | | | | 8,346,307 | |
| PTC Inc. q | | | 93,547 | | | | 16,994,683 | |
| Workday Inc., Class A q | | | 87,596 | | | | 19,582,962 | |
| | |
| | | | | | | | |
| | | | | | | 171,566,304 | |
| | |
| | | | | | | | |
| | |
| Specialty Retail (5.5%) | | | | | | | | |
| O’Reilly Automotive Inc. q | | | 16,675 | | | | 17,609,800 | |
| Ross Stores Inc. | | | 191,397 | | | | 27,813,812 | |
| | |
| | | | | | | | |
| | | | | | | 45,423,612 | |
| | |
| | | | | | | | |
| | |
| Technology Hardware, Storage & Peripherals (1.7%) | | | | | | | | |
| Western Digital Corp. q | | | 185,162 | | | | 14,029,725 | |
| | |
| | | | | | | | |
| | |
Total investment in equities (99.5%) (cost $582,563,558) | | | | | | | 826,658,027 | |
| | |
| | | | | | | | |
37
| | | | |
| | |
| | | | Semiannual Report • 2024 |
Parnassus Mid Cap Growth Fund
Portfolio of Investments as of June 30, 2024 (unaudited) (continued)
| | | | | | | | | | | | | | | | |
| | | | |
| Short-Term Securities | | Interest
Rate | | | Maturity
Date | | | Principal Amount ($) | | | Market Value ($) | |
| | | | |
| Certificates of Deposit (0.1%) a | | | | | | | | | | | | | | | | |
| Beneficial State Bank | | | 4.00 | % | | | 01/15/2025 | | | | 250,000 | | | | 244,590 | |
| Citizens Trust Bank | | | 1.00 | % | | | 01/14/2025 | | | | 200,000 | | | | 195,694 | |
| | | | |
| | | | | | | | | | | | | | | | |
| | | | | | | | | | | | | | | 440,284 | |
| | | | |
| | | | | | | | | | | | | | | | |
| | | |
| Certificates of Deposit Account Registry Service (0.1%) a | | | | | | | | | | | | | |
CDARS agreement with Beneficial State Bank, dated 03/14/2024 Participating depository institutions: First Business Bank, par 235,500;
Frontier Bank, par 141,898;
Solera National Bank, par 122,602;
(cost $485,989) | | | 4.18 | % | | | 03/13/2025 | | | | 500,000 | | | | 485,989 | |
| | | | |
| | | | | | | | | | | | | | | | |
| | | | |
| Community Development Loans (0.0%) a | | | | | | | | | | | | | | | | |
| Root Capital Inc. | | | 1.00 | % | | | 02/01/2025 | | | | 100,000 | | | | 96,476 | |
| Vermont Community Loan Fund Inc. | | | 2.00 | % | | | 10/15/2024 | | | | 100,000 | | | | 98,262 | |
| | | | |
| | | | | | | | | | | | | | | | |
| | | | | | | | | | | | | | | 194,738 | |
| | | | |
| | | | | | | | | | | | | | | | |
| | | | |
| Time Deposits (0.5%) | | | | | | | | | | | | | | | | |
| Citibank, New York | | | 4.68 | % | | | 07/01/2024 | | | | 4,245,741 | | | | 4,245,741 | |
| | | | |
| | | | | | | | | | | | | | | | |
| | | | |
Total short-term securities (0.7%) (cost $5,366,752) | | | | | | | | | | | | | | | 5,366,752 | |
| | | | |
| | | | | | | | | | | | | | | | |
| | | | |
Total securities (100.2%) (cost $587,930,310) | | | | | | | | | | | | | | | 832,024,779 | |
| | | | |
| | | | | | | | | | | | | | | | |
| | | | |
| Other assets and liabilities (-0.2%) | | | | | | | | | | | | | | | (698,989 | ) |
| | | | |
| | | | | | | | | | | | | | | | |
| | | | |
| Total net assets (100.0%) | | | | | | | | | | | | | | | 831,325,790 | |
| | | | |
| | | | | | | | | | | | | | | | |
| | | | | | | | | | | | | | | | |
| | | | | | | | | | | | | | | | |
q This security is non-income producing. | |
a Market value adjustments have been applied to these securities to reflect potential early withdrawal. Such securities have been classified as level 3. | |
| | | | |
plc Public Limited Company | | | | | | | | | | | | | | | | |
ADR American Depositary Receipt | |
N.V. Naamloze Vennootschap | |
38
| | | | |
| | |
| Semiannual Report • 2024 | | | | |
Parnassus Fixed Income Fund
Portfolio of Investments as of June 30, 2024 (unaudited)
| | | | | | | | | | | | | | | | |
| | | | |
| Exchange-Traded Funds | | Interest
Rate | | | Maturity
Date | | | Shares | | | Market
Value ($) | |
| | | | |
| Mortgage Real Estate Investment Trusts (7.7%) | | | | | | | | | | | | | | | | |
| iShares MBS ETF | | | | | | | | | | | 232,752 | | | | 21,368,961 | |
| | | | |
| | | | | | | | | | | | | | | | |
| | | | |
Total investment in exchange-traded funds (7.7%)
(cost $21,099,806) | | | | | | | | | | | | | | | 21,368,961 | |
| | | | |
| | | | | | | | | | | | | | | | |
| | | | | | | | | | | | | | | | |
| | | | |
| Preferred Stock | | | | | | | | | | | | |
| | | | |
| Capital Markets (0.7%) | | | | | | | | | | | | | | | | |
| Morgan Stanley | | | 4.25 | % | | | 01/15/2027 | | | | 100,000 | | | | 1,915,000 | |
| | | | |
| | | | | | | | | | | | | | | | |
| | | | |
Total investment in preferred stock (0.7%)
(cost $2,105,029) | | | | | | | | | | | | | | | 1,915,000 | |
| | | | |
| | | | | | | | | | | | | | | | |
| | | | | | | | | | | | | | | | |
| | | | |
| Corporate Bonds | | | | | | | | Principal
Amount ($) | | | | |
| | | | |
| Air Freight & Logistics (2.4%) | | | | | | | | | | | | | | | | |
| C.H. Robinson Worldwide Inc. | | | 4.20 | % | | | 04/15/2028 | | | | 3,500,000 | | | | 3,385,008 | |
| FedEx Corp. | | | 4.25 | % | | | 05/15/2030 | | | | 1,750,000 | | | | 1,682,237 | |
| FedEx Corp. | | | 4.75 | % | | | 11/15/2045 | | | | 1,750,000 | | | | 1,515,229 | |
| | | | |
| | | | | | | | | | | | | | | | |
| | | | | | | | | | | | | | | 6,582,474 | |
| | | | |
| | | | | | | | | | | | | | | | |
| | | | |
| Airlines (2.0%) | | | | | | | | | | | | | | | | |
| Alaska Airlines 2020-1, Class B l | | | 8.00 | % | | | 08/15/2025 | | | | 2,447,850 | | | | 2,475,667 | |
| Southwest Airlines Co. | | | 5.13 | % | | | 06/15/2027 | | | | 3,000,000 | | | | 2,985,044 | |
| | | | |
| | | | | | | | | | | | | | | | |
| | | | | | | | | | | | | | | 5,460,711 | |
| | | | |
| | | | | | | | | | | | | | | | |
| | | | |
| Auto Components (0.9%) | | | | | | | | | | | | | | | | |
| APTIV plc | | | 5.40 | % | | | 03/15/2049 | | | | 2,000,000 | | | | 1,798,489 | |
| APTIV plc | | | 4.15 | % | | | 05/01/2052 | | | | 1,000,000 | | | | 748,429 | |
| | | | |
| | | | | | | | | | | | | | | | |
| | | | |
| Banks (2.3%) | | | | | | | | | | | | | | | | |
| Bank of America Corp. | | | 1.53 | % | | | 12/06/2025 | | | | 1,500,000 | | | | 1,471,969 | |
| Bank of America Corp. | | | 3.85 | % | | | 03/08/2037 | | | | 2,000,000 | | | | 1,755,884 | |
| Citigroup Inc. | | | 2.01 | % | | | 01/25/2026 | | | | 3,250,000 | | | | 3,180,212 | |
| | | | |
| | | | | | | | | | | | | | | | |
| | | | | | | | | | | | | | | 6,408,065 | |
| | | | |
| | | | | | | | | | | | | | | | |
| | | | |
| Building Products (1.0%) | | | | | | | | | | | | | | | | |
| Masco Corp. | | | 4.50 | % | | | 05/15/2047 | | | | 3,260,000 | | | | 2,704,318 | |
| | | | |
| | | | | | | | | | | | | | | | |
| | | | |
| Capital Markets (1.7%) | | | | | | | | | | | | | | | | |
| Morgan Stanley | | | 2.72 | % | | | 07/22/2025 | | | | 1,500,000 | | | | 1,497,161 | |
| The Charles Schwab Corp. | | | 4.00 | % | | | 06/01/2026 | | | | 3,500,000 | | | | 3,273,828 | |
| | | | |
| | | | | | | | | | | | | | | | |
| | | | | | | | | | | | | | | 4,770,989 | |
| | | | |
| | | | | | | | | | | | | | | | |
| | | | |
| Chemicals (1.6%) | | | | | | | | | | | | | | | | |
| International Flavors & Fragrances Inc. | | | 5.00 | % | | | 09/26/2048 | | | | 3,300,000 | | | | 2,843,404 | |
| The Sherwin-Williams Co. | | | 4.50 | % | | | 06/01/2047 | | | | 2,000,000 | | | | 1,693,575 | |
| | | | |
| | | | | | | | | | | | | | | | |
| | | | | | | | | | | | | | | 4,536,979 | |
| | | | |
| | | | | | | | | | | | | | | | |
39
| | | | |
| | |
| | | | Semiannual Report • 2024 |
Parnassus Fixed Income Fund
Portfolio of Investments as of June 30, 2024 (unaudited) (continued)
| | | | | | | | | | | | | | | | |
| | | | |
| Corporate Bonds | | Interest
Rate | | | Maturity
Date | | | Principal
Amount ($) | | | Market
Value ($) | |
| | | | |
| Commercial Services & Supplies (0.9%) | | | | | | | | | | | | | | | | |
| CCO Holdings LLC / CCO Holdings Capital Corp. l | | | 4.75 | % | | | 03/01/2030 | | | | 3,000,000 | | | | 2,598,326 | |
| | | | |
| | | | | | | | | | | | | | | | |
| | | | |
| Consumer Finance (1.8%) | | | | | | | | | | | | | | | | |
| American Express Co. | | | 4.05 | % | | | 05/03/2029 | | | | 3,500,000 | | | | 3,379,734 | |
| Capital One Financial Corp. | | | 2.62 | % | | | 11/02/2032 | | | | 2,000,000 | | | | 1,630,132 | |
| | | | |
| | | | | | | | | | | | | | | | |
| | | | | | | | | | | | | | | 5,009,866 | |
| | | | |
| | | | | | | | | | | | | | | | |
| | | | |
| Diversified Financial Services (4.9%) | | | | | | | | | | | | | | | | |
| Ares Finance Co. III LLC l | | | 4.13 | % | | | 06/30/2051 | | | | 2,500,000 | | | | 2,326,950 | |
| Fiserv Inc. | | | 5.60 | % | | | 03/02/2033 | | | | 2,500,000 | | | | 2,525,339 | |
| Global Payments Inc. | | | 5.95 | % | | | 08/15/2052 | | | | 3,500,000 | | | | 3,389,056 | |
| The Bank of New York Mellon Corp. | | | 3.75 | % | | | 10/31/2026 | | | | 3,000,000 | | | | 2,768,413 | |
| Truist Financial Corp. | | | 5.13 | % | | | 12/15/2027 | | | | 2,750,000 | | | | 2,605,983 | |
| | | | |
| | | | | | | | | | | | | | | | |
| | | | | | | | | | | | | | | 13,615,741 | |
| | | | |
| | | | | | | | | | | | | | | | |
| | | | |
| Diversified Telecommunication Services (0.9%) | | | | | | | | | | | | | | | | |
| Verizon Communications Inc. | | | 2.85 | % | | | 09/03/2041 | | | | 3,750,000 | | | | 2,637,506 | |
| | | | |
| | | | | | | | | | | | | | | | |
| | | | |
| Electric Utilities (2.0%) | | | | | | | | | | | | | | | | |
| Dominion Energy Inc. | | | 2.25 | % | | | 08/15/2031 | | | | 3,000,000 | | | | 2,448,094 | |
| Public Service Co. of Oklahoma | | | 2.20 | % | | | 08/15/2031 | | | | 4,000,000 | | | | 3,237,924 | |
| | | | |
| | | | | | | | | | | | | | | | |
| | | | | | | | | | | | | | | 5,686,018 | |
| | | | |
| | | | | | | | | | | | | | | | |
| | | | |
| Electronic Equipment, Instruments & Components (1.1%) | | | | | | | | | | | | | | | | |
| Trimble Inc. | | | 6.10 | % | | | 03/15/2033 | | | | 3,000,000 | | | | 3,111,965 | |
| | | | |
| | | | | | | | | | | | | | | | |
| | | | |
| Equity Real Estate Investment Trusts (4.4%) | | | | | | | | | | | | | | | | |
| Alexandria Real Estate Equities Inc. | | | 2.00 | % | | | 05/18/2032 | | | | 2,500,000 | | | | 1,960,457 | |
| Alexandria Real Estate Equities Inc. | | | 4.85 | % | | | 04/15/2049 | | | | 1,750,000 | | | | 1,482,397 | |
| American Tower Corp. | | | 3.70 | % | | | 10/15/2049 | | | | 4,000,000 | | | | 2,917,674 | |
| Regency Centers LP | | | 5.25 | % | | | 01/15/2034 | | | | 2,750,000 | | | | 2,684,641 | |
| SBA Communications Corp. | | | 3.88 | % | | | 02/15/2027 | | | | 3,500,000 | | | | 3,335,862 | |
| | | | |
| | | | | | | | | | | | | | | | |
| | | | | | | | | | | | | | | 12,381,031 | |
| | | | |
| | | | | | | | | | | | | | | | |
| | | | |
| Food & Staples Retailing (1.1%) | | | | | | | | | | | | | | | | |
| Sysco Corp. | | | 2.40 | % | | | 02/15/2030 | | | | 3,500,000 | | | | 3,034,530 | |
| | | | |
| | | | | | | | | | | | | | | | |
| | | | |
| Food Products (1.2%) | | | | | | | | | | | | | | | | |
| McCormick & Co., Inc. | | | 2.50 | % | | | 04/15/2030 | | | | 4,000,000 | | | | 3,468,779 | |
| | | | |
| | | | | | | | | | | | | | | | |
| | | | |
| Health Care Equipment & Supplies (2.0%) | | | | | | | | | | | | | | | | |
| Baxter International Inc. | | | 2.54 | % | | | 02/01/2032 | | | | 3,000,000 | | | | 2,465,108 | |
| Becton, Dickinson and Co. | | | 4.69 | % | | | 12/15/2044 | | | | 3,500,000 | | | | 3,096,093 | |
| | | | |
| | | | | | | | | | | | | | | | |
| | | | | | | | | | | | | | | 5,561,201 | |
| | | | |
| | | | | | | | | | | | | | | | |
| | | | |
| Hotels, Restaurants & Leisure (2.2%) | | | | | | | | | | | | | | | | |
| Hilton Domestic Operating Company Inc. l | | | 3.75 | % | | | 05/01/2029 | | | | 3,684,000 | | | | 3,377,795 | |
| Yum! Brands Inc. | | | 4.63 | % | | | 01/31/2032 | | | | 3,000,000 | | | | 2,759,499 | |
| | | | |
| | | | | | | | | | | | | | | | |
| | | | | | | | | | | | | | | 6,137,294 | |
| | | | |
| | | | | | | | | | | | | | | | |
| | | | |
| Insurance (0.5%) | | | | | | | | | | | | | | | | |
| The Progressive Corp. | | | 3.20 | % | | | 03/26/2030 | | | | 1,500,000 | | | | 1,366,922 | |
| | | | |
| | | | | | | | | | | | | | | | |
40
| | | | |
| | |
| Semiannual Report • 2024 | | | | |
Parnassus Fixed Income Fund
Portfolio of Investments as of June 30, 2024 (unaudited) (continued)
| | | | | | | | | | | | | | | | |
| | | | |
| Corporate Bonds | | Interest
Rate | | | Maturity
Date | | | Principal
Amount ($) | | | Market
Value ($) | |
| | | | |
| Interactive Media & Services (0.3%) | | | | | | | | | | | | | | | | |
| Alphabet Inc. | | | 2.05 | % | | | 08/15/2050 | | | | 1,500,000 | | | | 858,553 | |
| | | | |
| | | | | | | | | | | | | | | | |
| | | | |
| Life Sciences Tools & Services (1.2%) | | | | | | | | | | | | | | | | |
| Agilent Technologies Inc. | | | 2.75 | % | | | 09/15/2029 | | | | 3,750,000 | | | | 3,349,997 | |
| | | | |
| | | | | | | | | | | | | | | | |
| | | | |
| Machinery (2.4%) | | | | | | | | | | | | | | | | |
| Pentair Finance Sarl | | | 4.50 | % | | | 07/01/2029 | | | | 3,500,000 | | | | 3,388,720 | |
| Xylem Inc. | | | 2.25 | % | | | 01/30/2031 | | | | 4,000,000 | | | | 3,361,388 | |
| | | | |
| | | | | | | | | | | | | | | | |
| | | | | | | | | | | | | | | 6,750,108 | |
| | | | |
| | | | | | | | | | | | | | | | |
| | | | |
| Pharmaceuticals (1.0%) | | | | | | | | | | | | | | | | |
| Merck & Co., Inc. | | | 1.90 | % | | | 12/10/2028 | | | | 3,250,000 | | | | 2,891,623 | |
| | | | |
| | | | | | | | | | | | | | | | |
| | | | |
| Real Estate Investment Trust (1.1%) | | | | | | | | | | | | | | | | |
| Prologis LP | | | 2.88 | % | | | 11/15/2029 | | | | 3,250,000 | | | | 2,925,715 | |
| | | | |
| | | | | | | | | | | | | | | | |
| | | | |
| Road & Rail (0.5%) | | | | | | | | | | | | | | | | |
| Canadian Pacific Railway Co. | | | 2.88 | % | | | 11/15/2029 | | | | 1,500,000 | | | | 1,343,759 | |
| | | | |
| | | | | | | | | | | | | | | | |
| | | | |
| Semiconductors & Semiconductor Equipment (3.4%) | | | | | | | | | | | | | | | | |
| Intel Corp. | | | 4.15 | % | | | 08/05/2032 | | | | 3,200,000 | | | | 3,001,690 | |
| Micron Technology Inc. | | | 2.70 | % | | | 04/15/2032 | | | | 4,000,000 | | | | 3,319,440 | |
| Qorvo Inc. l | | | 3.38 | % | | | 04/01/2031 | | | | 3,750,000 | | | | 3,215,621 | |
| | | | |
| | | | | | | | | | | | | | | | |
| | | | | | | | | | | | | | | 9,536,751 | |
| | | | |
| | | | | | | | | | | | | | | | |
| | | | |
| Software (4.2%) | | | | | | | | | | | | | | | | |
| Autodesk Inc. | | | 2.40 | % | | | 12/15/2031 | | | | 3,500,000 | | | | 2,909,843 | |
| Oracle Corp. | | | 6.13 | % | | | 07/08/2039 | | | | 3,250,000 | | | | 3,376,440 | |
| Roper Technologies Inc. | | | 2.95 | % | | | 09/15/2029 | | | | 3,500,000 | | | | 3,149,881 | |
| Salesforce Inc. | | | 1.50 | % | | | 07/15/2028 | | | | 3,000,000 | | | | 2,638,222 | |
| | | | |
| | | | | | | | | | | | | | | | |
| | | | | | | | | | | | | | | 12,074,386 | |
| | | | |
| | | | | | | | | | | | | | | | |
| | | | |
| Specialty Retail (3.3%) | | | | | | | | | | | | | | | | |
| Lowe’s Companies Inc. | | | 2.80 | % | | | 09/15/2041 | | | | 4,250,000 | | | | 2,928,403 | |
| O’Reilly Automotive Inc. | | | 4.20 | % | | | 04/01/2030 | | | | 3,500,000 | | | | 3,333,775 | |
| Ross Stores Inc. | | | 4.80 | % | | | 04/15/2030 | | | | 3,000,000 | | | | 2,903,397 | |
| | | | |
| | | | | | | | | | | | | | | | |
| | | | | | | | | | | | | | | 9,165,575 | |
| | | | |
| | | | | | | | | | | | | | | | |
| | | | |
| Textiles, Apparel & Luxury Goods (0.7%) | | | | | | | | | | | | | | | | |
| VF Corp. | | | 6.00 | % | | | 10/15/2033 | | | | 2,000,000 | | | | 1,889,984 | |
| | | | |
| | | | | | | | | | | | | | | | |
| | | | |
| Transportation Infrastructure (1.1%) | | | | | | | | | | | | | | | | |
| Avantor Funding Inc. l | | | 4.63 | % | | | 07/15/2028 | | | | 3,250,000 | | | | 3,093,119 | |
| | | | |
| | | | | | | | | | | | | | | | |
| | | | |
| Wireless Telecommunication Services (1.1%) | | | | | | | | | | | | | | | | |
| T-Mobile USA Inc. | | | 4.38 | % | | | 04/15/2040 | | | | 3,500,000 | | | | 3,043,562 | |
| | | | |
| | | | | | | | | | | | | | | | |
| | | | |
Total investment in corporate bonds (55.2%)
(cost $164,080,301) | | | | | | | | | | | | | | | 154,542,765 | |
| | | | |
| | | | | | | | | | | | | | | | |
| | | | | | | | | | | | | | | | |
| | | | |
| Supranational Bonds | | | | | | | | | | | | |
| European Bank for Reconstruction & Development | | | 1.50 | % | | | 02/13/2025 | | | | 2,000,000 | | | | 1,953,045 | |
| European Investment Bank | | | 1.63 | % | | | 10/09/2029 | | | | 2,000,000 | | | | 1,738,869 | |
| European Investment Bank | | | 0.75 | % | | | 09/23/2030 | | | | 2,000,000 | | | | 1,606,304 | |
41
| | | | |
| | |
| | | | Semiannual Report • 2024 |
Parnassus Fixed Income Fund
Portfolio of Investments as of June 30, 2024 (unaudited) (continued)
| | | | | | | | | | | | | | | | |
| | | | |
Supranational Bonds | | Interest
Rate | | | Maturity
Date | | | Principal
Amount ($) | | | Market
Value ($) | |
| International Bank for Reconstruction & Development | | | 3.13 | % | | | 11/20/2025 | | | | 4,000,000 | | | | 3,899,815 | |
| International Bank for Reconstruction & Development | | | 1.63 | % | | | 11/03/2031 | | | | 5,000,000 | | | | 4,128,462 | |
| International Finance Corp. | | | 2.13 | % | | | 04/07/2026 | | | | 6,000,000 | | | | 5,723,060 | |
| International Finance Corp. | | | 4.38 | % | | | 01/15/2027 | | | | 4,000,000 | | | | 3,972,176 | |
| | | | |
| | | | | | | | | | | | | | | | |
| | | | |
Total investment in supranational bonds (8.2%)
(cost $25,097,359) | | | | | | | | | | | | | | | 23,021,731 | |
| | | | |
| | | | | | | | | | | | | | | | |
| | | | |
| U.S. Government Agency Bonds | | | | | | | | | | | | |
| Fannie Mae Pool BY0205 | | | 5.50 | % | | | 05/01/2053 | | | | 1,849,574 | | | | 1,827,648 | |
| Fannie Mae Pool DA0007 | | | 5.50 | % | | | 09/01/2053 | | | | 3,888,058 | | | | 3,839,865 | |
| Fannie Mae Pool FS4736 | | | 6.50 | % | | | 05/01/2053 | | | | 3,095,493 | | | | 3,161,791 | |
| Fannie Mae Pool FS6916 | | | 5.00 | % | | | 06/01/2053 | | | | 1,929,403 | | | | 1,869,555 | |
| Fannie Mae Pool MA4709 | | | 5.00 | % | | | 07/01/2052 | | | | 1,710,379 | | | | 1,660,013 | |
| Fannie Mae Pool MA5216 | | | 6.00 | % | | | 12/01/2053 | | | | 3,778,821 | | | | 3,794,166 | |
| Freddie Mac Pool SD8315 | | | 5.00 | % | | | 04/01/2053 | | | | 2,786,196 | | | | 2,699,498 | |
| | | | |
| | | | | | | | | | | | | | | | |
| | | | |
Total investment in U.S. government agency bonds (6.8%)
(cost $19,017,866) | | | | | | | | | | | | | | | 18,852,536 | |
| | | | |
| | | | | | | | | | | | | | | | |
| | | | | | | | | | | | | | | | |
| | | | |
| U.S. Government Treasury Bonds | | | | | | | | | | | | |
| U.S. Treasury | | | 2.25 | % | | | 11/15/2024 | | | | 1,500,000 | | | | 1,482,656 | |
| U.S. Treasury | | | 3.88 | % | | | 03/31/2025 | | | | 2,000,000 | | | | 1,980,449 | |
| U.S. Treasury | | | 0.25 | % | | | 06/30/2025 | | | | 2,000,000 | | | | 1,906,328 | |
| U.S. Treasury | | | 2.25 | % | | | 11/15/2025 | | | | 3,000,000 | | | | 2,893,125 | |
| U.S. Treasury | | | 0.38 | % | | | 12/31/2025 | | | | 2,000,000 | | | | 1,870,391 | |
| U.S. Treasury | | | 3.63 | % | | | 05/15/2026 | | | | 3,000,000 | | | | 2,938,828 | |
| U.S. Treasury | | | 1.88 | % | | | 07/31/2026 | | | | 2,000,000 | | | | 1,888,672 | |
| U.S. Treasury | | | 4.63 | % | | | 10/15/2026 | | | | 3,500,000 | | | | 3,497,402 | |
| U.S. Treasury | | | 3.63 | % | | | 03/31/2028 | | | | 2,500,000 | | | | 2,430,957 | |
| U.S. Treasury | | | 4.63 | % | | | 09/30/2028 | | | | 3,000,000 | | | | 3,026,953 | |
| U.S. Treasury | | | 3.75 | % | | | 05/31/2030 | | | | 2,500,000 | | | | 2,423,242 | |
| U.S. Treasury | | | 4.13 | % | | | 11/15/2032 | | | | 2,500,000 | | | | 2,462,012 | |
| U.S. Treasury | | | 3.50 | % | | | 02/15/2033 | | | | 3,000,000 | | | | 2,816,836 | |
| U.S. Treasury | | | 3.38 | % | | | 05/15/2033 | | | | 1,500,000 | | | | 1,392,891 | |
| U.S. Treasury | | | 3.25 | % | | | 05/15/2042 | | | | 4,000,000 | | | | 3,341,250 | |
| U.S. Treasury | | | 4.00 | % | | | 11/15/2042 | | | | 4,500,000 | | | | 4,164,785 | |
| U.S. Treasury | | | 4.38 | % | | | 08/15/2043 | | | | 3,500,000 | | | | 3,392,812 | |
| U.S. Treasury | | | 4.75 | % | | | 11/15/2043 | | | | 2,000,000 | | | | 2,035,313 | |
| U.S. Treasury | | | 4.63 | % | | | 05/15/2044 | | | | 3,000,000 | | | | 3,007,031 | |
| U.S. Treasury | | | 2.00 | % | | | 02/15/2050 | | | | 2,000,000 | | | | 1,222,891 | |
| U.S. Treasury | | | 1.25 | % | | | 05/15/2050 | | | | 3,500,000 | | | | 1,747,539 | |
| | | | |
| | | | | | | | | | | | | | | | |
| | |
Total investment in U.S. government treasury bonds (18.6%)
(cost $54,919,677) | | | | | | | | 51,922,363 | |
| | |
| | | | | | | | | |
| | |
Total investment in long-term securities (97.2%)
(cost $286,320,038) | | | | | | | | 271,623,356 | |
| | |
| | | | | | | | | |
| | | | | | | | | | | | | | | | |
42
| | | | |
| | |
| Semiannual Report • 2024 | | | | |
Parnassus Fixed Income Fund
Portfolio of Investments as of June 30, 2024 (unaudited) (continued)
| | | | | | | | | | | | | | | | |
| | | | |
Short-Term Securities | | Interest
Rate | | | Maturity
Date | | | Principal
Amount ($) | | | Market
Value ($) | |
| | |
| Certificates of Deposit (0.2%) a | | | | | | | | | |
| Beneficial State Bank | | | 4.00 | % | | | 10/23/2024 | | | | 250,000 | | | | 246,885 | |
| Citizens Trust Bank | | | 1.00 | % | | | 10/06/2024 | | | | 250,000 | | | | 247,350 | |
| | | | |
| | | | | | | | | | | | | | | | |
| | | | | | | | | | | | | | | 494,235 | |
| | | | |
| | | | | | | | | | | | | | | | |
| | |
| Time Deposits (2.0%) | | | | | | | | | |
| Citibank, New York | | | 4.68 | % | | | 07/01/2024 | | | | 5,515,950 | | | | 5,515,950 | |
| | | | |
| | | | | | | | | | | | | | | | |
| | | | |
Total short-term securities (2.2%)
(cost $6,010,185) | | | | | | | | | | | | | | | 6,010,185 | |
| | | | |
| | | | | | | | | | | | | | | | |
| | | | |
Total securities (99.4%)
(cost $292,330,223) | | | | | | | | | | | | | | | 277,633,541 | |
| | | | |
| | | | | | | | | | | | | | | | |
| | | | |
| Other assets and liabilities (0.6%) | | | | | | | | | | | | | | | 1,753,383 | |
| | | | |
| | | | | | | | | | | | | | | | |
| | | | |
| Total net assets (100.0%) | | | | | | | | | | | | | | | 279,386,924 | |
| | | | |
| | | | | | | | | | | | | | | | |
| | | | | | | | | | | | | | | | |
l Security exempt from registration under Rule 144A of the Securities Act of 1933, as amended. The security may be resold in transactions exempt from registration normally to qualified institutional buyers. The security has been determined to be liquid in accordance with procedures adopted by the Funds’ Board of Trustees. At June 30, 2024, the aggregate value is $17,087,478, which is 6.12% of net assets. | |
a Market value adjustments have been applied to these securities to reflect potential early withdrawal. Such securities have been classified as level 3. | |
| | | | |
plc Public Limited Company | | | | | | | | | | | | | | | | |
MBS Mortgage-Backed Securities | | | | | | | | | | | | | | | | |
ETF Exchange-Traded Fund | | | | | | | | | | | | | | | | |
LP Limited Partnership | | | | | | | | | | | | | | | | |
43
| | | | |
| | |
| | | | Semiannual Report • 2024 |
Statement of Assets and Liabilities
June 30, 2024 (unaudited)
| | | | | | | | | | | | |
| | | |
| | | Parnassus Core Equity Fund | | | Parnassus Growth Equity Fund | | | Parnassus Value Equity Fund | |
| | | |
| Assets | | | | | | | | | | | | |
| | | |
Investments in stocks, exchange-traded funds and bonds, at market value – Unaffiliated (cost $19,285,025,543, $37,890,792, $3,776,283,246, $2,514,661,548, $582,563,558 and $286,320,038) | | $ | 29,054,497,583 | | | $ | 48,949,691 | | | $ | 4,742,353,071 | |
| | | |
Investments in stocks, at market value – Affiliated | | | | | | | | | | | | |
| | | |
(cost of $1,056,114,533, $0, $133,286,459, $53,520,975, $0 and $0) | | | 844,338,793 | | | | - | | | | 138,265,433 | |
| | | |
Investments in short-term securities | | | | | | | | | | | | |
| | | |
(at cost which approximates market value) | | | 169,574,380 | | | | 1,012,113 | | | | 36,823,321 | |
| | | |
Cash | | | 621,367 | | | | 2,021 | | | | 96,744 | |
| | | |
Receivables | | | | | | | | | | | | |
| | | |
Dividends and interest | | | 14,602,880 | | | | 9,123 | | | | 3,333,166 | |
| | | |
Capital shares sold | | | 8,946,950 | | | | 28,016 | | | | 3,512,917 | |
| | | |
Other assets | | | 151,314 | | | | 29,873 | | | | 28,824 | |
| | | |
Total assets | | $ | 30,092,733,267 | | | $ | 50,030,837 | | | $ | 4,924,413,476 | |
| | | |
| Liabilities | | | | | | | | | | | | |
| | | |
Payable upon return of loaned securities | | | - | | | | - | | | | 14,682,746 | |
| | | |
Capital shares redeemed | | | 21,412,337 | | | | 38,362 | | | | 3,742,568 | |
| | | |
Fees payable to Parnassus Investments | | | 14,593,494 | | | | 4,878 | | | | 2,632,362 | |
| | | |
Distributions payable | | | 1,160,672 | | | | - | | | | - | |
| | | |
Accounts payable and accrued expenses | | | 2,271,063 | | | | 50,414 | | | | 406,490 | |
| | | |
Total liabilities | | $ | 39,437,566 | | | $ | 93,654 | | | $ | 21,464,166 | |
| | | |
Net assets | | $ | 30,053,295,701 | | | $ | 49,937,183 | | | $ | 4,902,949,310 | |
| | | |
| Net assets consist of | | | | | | | | | | | | |
| | | |
Capital paid-in | | | 19,225,756,839 | | | | 36,991,880 | | | | 3,646,864,673 | |
| | | |
Total Distributable Earnings | | | 10,827,538,862 | | | | 12,945,303 | | | | 1,256,084,637 | |
| | | |
Total net assets | | $ | 30,053,295,701 | | | $ | 49,937,183 | | | $ | 4,902,949,310 | |
| | | |
| Net asset value and offering per share | | | | | | | | | | | | |
| | | |
Net assets Investor Shares | | $ | 13,773,072,593 | | | $ | 16,825,119 | | | $ | 3,195,073,175 | |
| | | |
Net assets Institutional Shares | | $ | 16,280,223,108 | | | $ | 33,112,064 | | | $ | 1,707,876,135 | |
| | | |
Shares outstanding Investor Shares | | | 223,415,111 | | | | 674,426 | | | | 59,653,874 | |
| | | |
Shares outstanding Institutional Shares | | | 263,375,804 | | | | 1,325,385 | | | | 31,785,570 | |
| | | |
Net asset values and redemption price per share | | | | | | | | | | | | |
| | | |
(Net asset value divided by shares outstanding) | | | | | | | | | | | | |
| | | |
Investor Shares | | $ | 61.65 | | | $ | 24.95 | | | $ | 53.56 | |
| | | |
Institutional Shares | | $ | 61.81 | | | $ | 24.98 | | | $ | 53.73 | |
44
| | | | |
| | |
| Semiannual Report • 2024 | | | | |
| | | | | | | | | | |
| | |
Parnassus Mid Cap Fund | | | Parnassus Mid Cap Growth Fund | | | Parnassus Fixed Income Fund | |
| | |
| | | | | | | | | | |
| | |
$ | 2,957,204,160 | | | $ | 826,658,027 | | | $ | 271,623,356 | |
| | |
| | | | | | | | | | |
| | |
| | 55,107,963 | | | | - | | | | - | |
| | |
| | | | | | | | | | |
| | |
| | 27,551,084 | | | | 5,366,752 | | | | 6,010,185 | |
| | |
| | 100,579 | | | | 23,296 | | | | 4,888 | |
| | |
| | | | | | | | | | |
| | |
| | 2,608,013 | | | | 300,507 | | | | 2,393,539 | |
| | |
| | 1,146,357 | | | | 43,643 | | | | 46,016 | |
| | |
| | 69,423 | | | | 16,566 | | | | 8,036 | |
| | |
| $ | 3,043,787,579 | | | $ | 832,408,791 | | | $ | 280,086,020 | |
| | |
| | | | | | | | | | |
| | |
| | - | | | | - | | | | - | |
| | |
| | 3,377,465 | | | | 442,243 | | | | 444,538 | |
| | |
| | 1,800,819 | | | | 396,677 | | | | 67,216 | |
| | |
| | - | | | | - | | | | 48,035 | |
| | |
| | 810,569 | | | | 244,081 | | | | 139,307 | |
| | |
| $ | 5,988,853 | | | $ | 1,083,001 | | | $ | 699,096 | |
| | |
| $ | 3,037,798,726 | | | $ | 831,325,790 | | | $ | 279,386,924 | |
| | |
| | | | | | | | | | |
| | |
| | 2,203,264,591 | | | | 540,055,544 | | | | 349,875,007 | |
| | |
| | 834,534,135 | | | | 291,270,246 | | | | (70,488,083 | ) |
| | |
| $ | 3,037,798,726 | | | $ | 831,325,790 | | | $ | 279,386,924 | |
| | |
| | | | | | | | | | |
| | |
| $ | 1,327,302,195 | | | $ | 646,529,956 | | | $ | 109,402,589 | |
| | |
| $ | 1,710,496,531 | | | $ | 184,795,834 | | | $ | 169,984,335 | |
| | |
| | 34,913,274 | | | | 11,145,129 | | | | 7,501,071 | |
| | |
| | 44,737,289 | | | | 3,168,763 | | | | 11,643,913 | |
| | |
| | | | | | | | | | |
| | |
| | | | | | | | | | |
| | |
| $ | 38.02 | | | $ | 58.01 | | | $ | 14.58 | |
| | |
| $ | 38.23 | | | $ | 58.32 | | | $ | 14.60 | |
45
| | | | |
| | |
| | | | Semiannual Report • 2024 |
Statement of Operations
Period Ended June 30, 2024 (unaudited)
| | | | | | | | | | | | |
| | | |
| | | Parnassus Core Equity Fund | | | Parnassus
Growth Equity Fund | | | Parnassus Value Equity Fund | |
| | | |
| Investment income | | | | | | | | | | | | |
| | | |
Dividends – Unaffiliated | | $ | 161,530,509 | | | $ | 119,756 | | | $ | 45,636,386 | |
| | | |
Dividends – Affiliated | | | 5,646,791 | | | | - | | | | 959,173 | |
| | | |
Interest | | | 4,823,829 | | | | 15,957 | | | | 414,651 | |
| | | |
Securities lending | | | 5,405 | | | | - | | | | 44,443 | |
| | | |
Other income | | | - | | | | 1,956 | | | | - | |
| | | |
Foreign withholding tax | | | (3,820,200 | ) | | | (2,140 | ) | | | (636,875 | ) |
| | | |
Total investment income | | $ | 168,186,334 | | | $ | 135,529 | | | $ | 46,417,778 | |
| | | |
| Expenses | | | | | | | | | | | | |
| | | |
Investment advisory fees | | | 82,323,771 | | | | 151,644 | | | | 16,468,280 | |
| | | |
Transfer agent fees | | | | | | | | | | | | |
| | | |
Investor Shares | | | 97,030 | | | | 15,512 | | | | 67,905 | |
| | | |
Institutional Shares | | | 51,363 | | | | 16,881 | | | | 28,894 | |
| | | |
Fund administration | | | 4,487,942 | | | | 6,376 | | | | 769,689 | |
| | | |
Service provider fees | | | 13,001,743 | | | | 9,028 | | | | 2,981,627 | |
| | | |
Reports to shareholders | | | 435,206 | | | | 6,718 | | | | 104,608 | |
| | | |
Registration fees and expenses | | | 235,929 | | | | 15,415 | | | | 109,276 | |
| | | |
Custody fees | | | 759,956 | | | | 3,350 | | | | 49,098 | |
| | | |
Overdraft charges | | | 2,790 | | | | - | | | | 19,701 | |
| | | |
Professional fees | | | 186,897 | | | | 32,154 | | | | 52,940 | |
| | | |
Trustee fees and expenses | | | 422,666 | | | | 191 | | | | 81,427 | |
| | | |
Proxy voting fees | | | 1,831 | | | | 1,831 | | | | 1,831 | |
| | | |
Pricing service fees | | | 4,026 | | | | 4,026 | | | | 4,026 | |
| | | |
Other expenses | | | 124,525 | | | | 10,952 | | | | 26,335 | |
| | | |
Total expenses | | $ | 102,135,675 | | | $ | 274,078 | | | $ | 20,765,637 | |
| | | |
Fees waived and expenses reimbursed by Parnassus Investments | | | (381,472 | ) | | | (130,133 | ) | | | (858,533 | ) |
| | | |
Net expenses | | $ | 101,754,203 | | | $ | 143,945 | | | $ | 19,907,104 | |
| | | |
Net investment income (loss) | | $ | 66,432,131 | | | $ | (8,416 | ) | | $ | 26,510,674 | |
| | | |
| Realized and unrealized gain (loss) on investments | | | | | | | | | | | | |
| | | |
Net realized gain (loss) from securities transactions – Unaffiliated | | | 650,681,072 | | | | 1,725,983 | | | | 255,232,184 | |
| | | |
Net realized (loss) from securities transactions – Affiliated | | | (2,954,143 | ) | | | - | | | | (440,987 | ) |
| | | |
Net change in unrealized appreciation (depreciation) of securities – Unaffiliated | | | 2,558,598,618 | | | | 4,475,970 | | | | 2,484,720 | |
| | | |
Net change in unrealized appreciation (depreciation) of securities – Affiliated | | | 36,673,935 | | | | - | | | | 8,644,149 | |
| | | |
Net realized and unrealized gain (loss) on securities | | $ | 3,242,999,482 | | | $ | 6,201,953 | | | $ | 265,920,066 | |
| | | |
Net increase (decrease) in net assets resulting from operations | | $ | 3,309,431,613 | | | $ | 6,193,537 | | | $ | 292,430,740 | |
46
| | | | |
| | |
| Semiannual Report • 2024 | | | | |
| | | | | | | | | | |
| | |
Parnassus Mid Cap Fund | | | Parnassus
Mid Cap Growth Fund | | | Parnassus
Fixed Income Fund | |
| | |
| | | | | | | | | | |
| | |
| $ | 19,756,649 | | | $ | 1,831,859 | | | $ | 391,583 | |
| | |
| | 429,019 | | | | - | | | | - | |
| | |
| | 912,290 | | | | 149,656 | | | | 5,405,423 | |
| | |
| | 2,364 | | | | 16 | | | | - | |
| | |
| | 2 | | | | - | | | | - | |
| | |
| | (302,126 | ) | | | (45,931 | ) | | | - | |
| | |
| $ | 20,798,198 | | | $ | 1,935,600 | | | $ | 5,797,006 | |
| | |
| | | | | | | | | | |
| | |
| | 12,936,691 | | | | 2,578,471 | | | | 671,714 | |
| | |
| | | | | | | | | | |
| | |
| | 42,109 | | | | 85,841 | | | | 38,281 | |
| | |
| | 24,871 | | | | 19,212 | | | | 18,344 | |
| | |
| | 564,352 | | | | 129,307 | | | | 42,826 | |
| | |
| | 1,282,575 | | | | 347,867 | | | | 84,632 | |
| | |
| | 331,371 | | | | 10,662 | | | | 5,371 | |
| | |
| | 122,328 | | | | 37,295 | | | | 34,311 | |
| | |
| | 55,645 | | | | 9,382 | | | | 4,037 | |
| | |
| | 26,433 | | | | 1,377 | | | | - | |
| | |
| | 56,531 | | | | 39,882 | | | | 34,899 | |
| | |
| | 72,173 | | | | 11,641 | | | | 4,921 | |
| | |
| | 1,831 | | | | 1,831 | | | | - | |
| | |
| | 4,026 | | | | 4,026 | | | | 5,143 | |
| | |
| | 28,109 | | | | 9,388 | | | | 6,464 | |
| | |
| $ | 15,549,045 | | | $ | 3,286,182 | | | $ | 950,943 | |
| | |
| | (423,731 | ) | | | (58,599 | ) | | | (304,370 | ) |
| | |
| $ | 15,125,314 | | | $ | 3,227,583 | | | $ | 646,573 | |
| | |
| $ | 5,672,884 | | | $ | (1,291,983 | ) | | $ | 5,150,433 | |
| | |
| | | | | | | | | | |
| | |
| | 385,993,817 | | | | 38,447,132 | | | | (3,355,757 | ) |
| | |
| | (58,140,420 | ) | | | (361,063 | ) | | | - | |
| | |
| | (318,627,223 | ) | | | (422,531 | ) | | | (2,332,362 | ) |
| | |
| | 61,594,874 | | | | (49,167 | ) | | | - | |
| | |
| $ | 70,821,048 | | | $ | 37,614,371 | | | $ | (5,688,119 | ) |
| | |
| $ | 76,493,932 | | | $ | 36,322,388 | | | $ | (537,686 | ) |
47
| | | | |
| | |
| | | | Semiannual Report • 2024 |
Statement of Changes in Net Assets
June 30, 2024 (unaudited)
| | | | | | | | | | | | | | | | | | | | | | | | |
| | | |
| | | Parnassus Core Equity Fund | | | Parnassus Growth Equity Fund | | | Parnassus Value Equity Fund | |
| | | Period Ended June 30, 2024 | | | Year Ended December 31,
2023 | | | Period Ended June 30, 2024 | | | Year Ended December 31,
2023 | | | Period Ended June 30, 2024 | | | Year Ended December 31,
2023 | |
| | | | | | |
| Investment income from operations | | | | | | | | | | | | | | | | | | | | | | | | |
| | | | | | |
Net investment income (loss) | | $ | 66,432,131 | | | $ | 175,651,833 | | | $ | (8,416 | ) | | $ | 53,147 | | | $ | 26,510,674 | | | $ | 62,495,567 | |
| | | | | | |
Net realized gain (loss) from securities transactions | | | 647,726,929 | | | | 1,883,613,738 | | | | 1,725,983 | | | | 603,573 | | | | 254,791,197 | | | | 73,680,697 | |
| | | | | | |
Net change in unrealized appreciation (depreciation) of securities | | | 2,595,272,553 | | | | 3,729,624,120 | | | | 4,475,970 | | | | 6,623,223 | | | | 11,128,869 | | | | 471,396,606 | |
| | | | | | |
Increase (decrease) in net assets resulting from operations | | $ | 3,309,431,613 | | | $ | 5,788,889,691 | | | $ | 6,193,537 | | | $ | 7,279,943 | | | $ | 292,430,740 | | | $ | 607,572,870 | |
| | | | | | |
| Net Dividends and Distributions | | | | | | | | | | | | | | | | | | | | | | | | |
| | | | | | |
Investor Shares | | | (20,780,944 | ) | | | (748,675,071 | ) | | | - | | | | (118,942 | ) | | | - | | | | (57,508,798 | ) |
| | | | | | |
Institutional Shares | | | (39,886,941 | ) | | | (885,452,302 | ) | | | - | | | | (392,106 | ) | | | - | | | | (32,490,513 | ) |
| | | | | | |
Distributions to shareholders | | $ | (60,667,885 | ) | | $ | (1,634,127,373 | ) | | $ | - | | | $ | (511,048 | ) | | $ | - | | | $ | (89,999,311 | ) |
| | | | | | |
| Capital share transactions | | | | | | | | | | | | | | | | | | | | | | | | |
| | | | | | |
Investor Shares | | | | | | | | | | | | | | | | | | | | | | | | |
| | | | | | |
Proceeds from sale of shares | | | 649,785,375 | | | | 1,429,730,222 | | | | 9,678,255 | | | | 7,561,832 | | | | 208,099,062 | | | | 568,039,536 | |
| | | | | | |
Reinvestment of dividends | | | 20,589,870 | | | | 742,926,535 | | | | - | | | | 117,437 | | | | - | | | | 56,362,215 | |
| | | | | | |
Shares repurchased | | | (1,329,981,471 | ) | | | (2,351,510,214 | ) | | | (2,775,075 | ) | | | (936,797 | ) | | | (472,687,704 | ) | | | (791,711,396 | ) |
| | | | | | |
Institutional Shares | | | | | | | | | | | | | | | | | | | | | | | | |
| | | | | | |
Proceeds from sale of shares | | | 1,401,918,209 | | | | 2,765,300,719 | | | | 6,980,638 | | | | 6,109,966 | | | | 169,199,505 | | | | 370,760,683 | |
| | | | | | |
Reinvestment of dividends | | | 36,828,519 | | | | 824,897,458 | | | | - | | | | 389,407 | | | | - | | | | 27,806,425 | |
| | | | | | |
Shares repurchased | | | (1,772,943,454 | ) | | | (3,677,956,769 | ) | | | (675,592 | ) | | | (275,880 | ) | | | (214,472,325 | ) | | | (434,725,087 | ) |
| | | | | | |
Increase (decrease) in net assets from capital share transactions | | | (993,802,952 | ) | | | (266,612,049 | ) | | | 13,208,226 | | | | 12,965,965 | | | | (309,861,462 | ) | | | (203,467,624 | ) |
| | | | | | |
Increase (decrease) in net assets | | $ | 2,254,960,776 | | | $ | 3,888,150,269 | | | $ | 19,401,763 | | | $ | 19,734,860 | | | $ | (17,430,722 | ) | | $ | 314,105,935 | |
| | | | | | |
| Net Assets | | | | | | | | | | | | | | | | | | | | | | | | |
| | | | | | |
Beginning of year | | | 27,798,334,925 | | | | 23,910,184,656 | | | | 30,535,420 | | | | 10,800,560 | | | | 4,920,380,032 | | | | 4,606,274,097 | |
| | | | | | |
End of period | | $ | 30,053,295,701 | | | $ | 27,798,334,925 | | | $ | 49,937,183 | | | $ | 30,535,420 | | | $ | 4,902,949,310 | | | $ | 4,920,380,032 | |
| | | | | | |
| Shares issued and redeemed | | | | | | | | | | | | | | | | | | | | | | | | |
| | | | | | |
Investor Shares | | | | | | | | | | | | | | | | | | | | | | | | |
| | | | | | |
Shares sold | | | 11,195,640 | | | | 27,589,143 | | | | 415,630 | | | | 403,821 | | | | 3,965,092 | | | | 12,182,448 | |
| | | | | | |
Shares issued through dividend reinvestment | | | 338,451 | | | | 14,200,348 | | | | - | | | | 5,608 | | | | - | | | | 1,161,573 | |
| | | | | | |
Shares repurchased | | | (22,717,342 | ) | | | (45,353,199 | ) | | | (117,151 | ) | | | (48,693 | ) | | | (8,965,343 | ) | | | (16,896,050 | ) |
| | | | | | |
Institutional Shares | | | | | | | | | | | | | | | | | | | | | | | | |
| | | | | | |
Shares sold | | | 23,916,000 | | | | 53,206,007 | | | | 296,441 | | | | 346,058 | | | | 3,202,062 | | | | 7,868,346 | |
| | | | | | |
Shares issued through dividend reinvestment | | | 602,464 | | | | 15,720,432 | | | | - | | | | 18,596 | | | | - | | | | 570,584 | |
| | | | | | |
Shares repurchased | | | (30,206,736 | ) | | | (70,675,669 | ) | | | (28,507 | ) | | | (14,536 | ) | | | (4,057,076 | ) | | | (9,269,262 | ) |
| | | | | | |
Net increase (decrease) in shares outstanding | | | | | | | | | | | | | | | | | | | | | | | | |
| | | | | | |
Investor Shares | | | (11,183,251 | ) | | | (3,563,708 | ) | | | 298,479 | | | | 360,736 | | | | (5,000,251 | ) | | | (3,552,029 | ) |
| | | | | | |
Institutional Shares | | | (5,688,272 | ) | | | (1,749,230 | ) | | | 267,934 | | | | 350,118 | | | | (855,014 | ) | | | (830,332 | ) |
48
| | | | |
| | |
| Semiannual Report • 2024 | | | | |
| | | | | | | | | | | | | | | | | | | | | | |
| | |
| Parnassus Mid Cap Fund | | | Parnassus Mid Cap Growth Fund | | | Parnassus Fixed Income Fund | |
Period Ended June 30, 2024 | | | Year Ended December 31, 2023 | | | Period Ended June 30, 2024 | | | Year Ended December 31, 2023 | | | Period Ended June 30, 2024 | | | Year Ended December 31, 2023 | |
| | | | | |
|
|
| | | | | | | | | | | | | | | | | | | | |
| | | | | |
| $ | 5,672,884 | | | $ | 24,250,221 | | | $ | (1,291,983 | ) | | $ | (2,017,466 | ) | | $ | 5,150,433 | | | $ | 9,133,639 | |
| | | | | |
| 327,853,397 | | | | 98,054,588 | | | | 38,086,069 | | | | 33,041,887 | | | | (3,355,757 | ) | | | (17,069,548 | ) |
| | | | | |
| (257,032,349 | ) | | | 515,546,777 | | | | (471,698 | ) | | | 192,813,842 | | | | (2,332,362 | ) | | | 25,853,643 | |
| | | | | |
$ | 76,493,932 | | | $ | 637,851,586 | | | $ | 36,322,388 | | | $ | 223,838,263 | | | $ | (537,686 | ) | | $ | 17,917,734 | |
| | | | | |
|
|
| | | | | | | | | | | | | | | | | | | | |
| | | | | |
| | - | | | | (35,431,185 | ) | | | - | | | | (17,988,852 | ) | | | (2,002,850 | ) | | | (4,001,945 | ) |
| | | | | |
| | - | | | | (96,571,449 | ) | | | - | | | | (4,910,790 | ) | | | (3,039,494 | ) | | | (4,970,263 | ) |
| | | | | |
| $ | - | | | $ | (132,002,634 | ) | | $ | - | | | $ | (22,899,642 | ) | | $ | (5,042,344 | ) | | $ | (8,972,208 | ) |
| | | | | |
| | | | | | | | | | | | | | | | | | | | | | |
| | | | | |
| | | | | | | | | | | | | | | | | | | | | | |
| | | | | |
| | 63,185,766 | | | | 165,924,493 | | | | 14,495,695 | | | | 27,028,916 | | | | 5,988,045 | | | | 19,600,024 | |
| | | | | |
| | - | | | | 34,261,123 | | | | - | | | | 17,626,660 | | | | 1,934,302 | | | | 3,865,642 | |
| | | | | |
| | (243,312,465 | ) | | | (843,213,613 | ) | | | (41,391,578 | ) | | | (70,413,362 | ) | | | (15,052,307 | ) | | | (40,475,030 | ) |
| | | | | |
| | | | | | | | | | | | | | | | | | | | | | |
| | | | | |
| | 140,129,476 | | | | 885,175,226 | | | | 10,165,568 | | | | 16,472,593 | | | | 23,936,351 | | | | 43,570,687 | |
| | | | | |
| | - | | | | 88,763,680 | | | | - | | | | 4,589,891 | | | | 2,807,918 | | | | 4,607,953 | |
| | | | | |
| | (2,397,498,459 | ) | | | (1,515,164,518 | ) | | | (16,546,308 | ) | | | (26,449,136 | ) | | | (15,063,879 | ) | | | (38,123,601 | ) |
| | | | | |
| (2,437,495,682 | ) | | | (1,184,253,609 | ) | | | (33,276,623 | ) | | | (31,144,438 | ) | | | 4,550,430 | | | | (6,954,325 | ) |
| | | | | |
| $ | (2,361,001,750 | ) | | $ | (678,404,657 | ) | | $ | 3,045,765 | | | $ | 169,794,183 | | | $ | (1,029,600 | ) | | $ | 1,991,201 | |
| | | | | |
| | | | | | | | | | | | | | | | | | | | | | |
| | | | | |
| | 5,398,800,476 | | | | 6,077,205,133 | | | | 828,280,025 | | | | 658,485,842 | | | | 280,416,524 | | | | 278,425,323 | |
| | | | | |
| $ | 3,037,798,726 | | | $ | 5,398,800,476 | | | $ | 831,325,790 | | | $ | 828,280,025 | | | $ | 279,386,924 | | | $ | 280,416,524 | |
| | | | | |
|
|
| | | | | | | | | | | | | | | | | | | | |
| | | | | |
| | | | | | | | | | | | | | | | | | | | | | |
| | | | | |
| | 1,643,796 | | | | 4,788,590 | | | | 253,822 | | | | 548,287 | | | | 410,398 | | | | 1,350,182 | |
| | | | | |
| - | | | | 992,424 | | | | - | | | | 352,181 | | | | 132,852 | | | | 267,847 | |
| | | | | |
| | (6,386,187 | ) | | | (24,399,581 | ) | | | (720,728 | ) | | | (1,450,794 | ) | | | (1,034,770 | ) | | | (2,819,587 | ) |
| | | | | |
| | | | | | | | | | | | | | | | | | | | | | |
| | | | | |
| | 3,677,253 | | | | 25,476,890 | | | | 175,929 | | | | 327,727 | | | | 1,640,387 | | | | 3,024,457 | |
| | | | | |
| - | | | | 2,546,029 | | | | - | | | | 91,287 | | | | 192,719 | | | | 319,129 | |
| | | | | |
| | (63,741,872 | ) | | | (43,818,164 | ) | | | (285,736 | ) | | | (542,010 | ) | | | (1,032,641 | ) | | | (2,638,092 | ) |
| | | | | |
| | | | | | | | | | | | | | | | | | | | | | |
| | | | | |
| | (4,742,391 | ) | | | (18,618,567 | ) | | | (466,906 | ) | | | (550,326 | ) | | | (491,520 | ) | | | (1,201,558 | ) |
| | | | | |
| | (60,064,619 | ) | | | (15,795,245 | ) | | | (109,807 | ) | | | (122,996 | ) | | | 800,465 | | | | 705,494 | |
49
| | | | |
| | |
| | | | Semiannual Report • 2024 |
Notes to Financial Statements
1. Organization
The Parnassus Funds are comprised of two Trusts, the Parnassus Funds trust and the Parnassus Income Funds trust (collectively the “Trusts”), organized as Massachusetts Business Trusts registered under the Investment Company Act of 1940, as amended (the “1940 Act”), as diversified, open-end investment management companies, and are comprised of six separate funds (each a “Fund” and, collectively, the “Funds”). The Parnassus Funds trust includes the Parnassus Mid Cap Growth Fund, which commenced operations on December 27, 1984, the Parnassus Value Equity Fund and the Parnassus Mid Cap Fund, both of which commenced operations on April 29, 2005, and the Parnassus Growth Equity Fund which commenced operation on December 28, 2022. The Parnassus Income Funds trust includes the Parnassus Core Equity Fund and the Parnassus Fixed Income Fund, both of which commenced operations on August 31, 1992. Each Fund has distinct investment objectives and investment strategies. In general, each of the Funds seeks long-term capital appreciation.
2. Significant Accounting Policies
Each Fund operates as a separate investment company that applies the accounting and reporting guidance issued in Accounting Standards Codification (“ASC”) Topic 946, Financial Services – Investment Companies issued by the Financial Accounting Standards Board (“FASB”). The presentation of the financial statements is made using specialized accounting principles applicable to investment companies.
Short-Term Securities
Short-term securities represent investments of excess cash and consist of time deposits, community development loans, certificates of deposit and money market funds.
Security Transactions and Related Investment Income and Expenses
Securities transactions are recorded on the date the securities are purchased or sold (trade date). Realized gains and losses on securities transactions are determined on the basis of first-in-first-out for both financial statement and federal income tax purposes. Dividend income is recognized on the ex-dividend date and interest income is recognized on an accrual basis. Discounts and premiums on securities purchased are amortized over the lives of the respective securities using the constant yield method,
which approximates the interest method. Expenses are recorded on an accrual basis.
Class Allocations
Income, fees and expenses (other than class-specific fees and expenses) and realized and unrealized gains and losses are allocated daily among the various share classes based on their relative net assets. Class-specific fees and expenses, such as broker service fees, and administrative and shareholder service fees, are charged directly to the respective share class.
Dividends and Distributions to Shareholders
Dividends and distributions to shareholders are recorded on the ex-dividend date to shareholders of record on the record date. The Parnassus Core Equity Fund pays income dividends quarterly and capital-gain dividends annually. The Parnassus Fixed Income Fund pays income dividends monthly and capital-gain dividends annually. The other Funds pay income and capital-gain dividends annually.
3. Securities Valuations
Methods and Inputs
The Funds’ investments in financial instruments are carried at fair value daily. Fair value is the price that would be received to sell an asset or paid to transfer a liability in an orderly transaction between market participants on the measurement date. When market quotations are not readily available the Funds’ valuation designee determines the fair value pursuant to duly adopted fair value methodologies. In compliance with Rule 2a-5 under the 1940 Act, the Board has designated the Funds’ investment manager as its valuation designee. The investment manager has responsibility for oversight of valuation.
Equity securities and exchange-traded funds that are listed or traded on a national securities exchange are stated at market value, based on recorded closing sales on the exchange or at the NASDAQ’s National Market official closing price. In the absence of a recorded sale, and for over-the-counter securities, equity securities are stated at the mean between the last recorded bid and asked prices. Investments in registered investment companies are valued at their net asset value.
Fixed-income securities with an active market are valued at the “bid” price where such quotes are readily available from brokers and dealers and are
50
| | | | |
| | |
| Semiannual Report • 2024 | | | | |
Notes to Financial Statements (continued)
representative of the actual market for such securities. Other fixed-income securities experiencing a less active market are valued as determined by the pricing services selected by the valuation designee, based on methods which include consideration of trading in securities of comparable yield, quality, coupon, maturity and type, as well as indications as to values from dealers and other market data without exclusive reliance upon quoted prices or over-the-counter prices, since such valuations are believed to reflect more accurately the value of such securities. Mortgage-backed and asset-backed securities are valued as determined by the pricing services selected by the valuation designee, based on methods which include standard inputs and cashflows, prepayment information, default rates, delinquency and loss assumptions, collateral characteristics, credit enhancements and specific deal information.
As noted above, investments where market quotations are not readily available are priced at their fair value, in accordance with fair value methodologies established by the valuation designee. These investments include certificates of deposit and community development loans. These investments carry interest rates ranging from 0.05% to 4.50% with maturities of one year or less. In determining fair value, the investment manager may consider a variety of information including, but not limited to, the following: price based upon a multiple of earnings or sales, fundamental analytical data and an evaluation of market conditions. A valuation adjustment is applied to certificates of deposit, community development loans and other community development investments as an estimate of potential penalties for early withdrawal.
The Funds follow ASC Topic 820, Fair Value Measurements and Disclosure issued by the FASB, which defines fair value, establishes a framework for measuring fair value and expands disclosures about fair value measurements. Various inputs are used in determining the value of the Funds’ portfolio investments. These inputs are summarized in three levels, Level 1–unadjusted quoted prices in active markets for identical investments, Level 2–other significant observable inputs (including quoted prices for similar investments) and Level 3–significant unobservable inputs (including the Fund’s own assumptions in determining the fair value of investments).
Securities Lending
The Parnassus Funds have entered into an agreement with Brown Brothers Harriman & Co., dated July 29, 2009 (“Agreement”), to provide securities lending services to the Funds. Under this program, the proceeds (cash collateral) received from borrowers are used to invest in money market funds.
Under the Agreement, the borrowers pay the Funds negotiated lenders’ fees and the Funds receive cash collateral in an amount equal to 102% of the market value of the loaned securities. The borrower of securities is at all times required to post cash collateral to the portfolio in an amount equal to 100% of the market value of the securities loaned based on the previous day’s market value of the securities loaned, marked-to-market daily. Any collateral shortfalls are adjusted the next business day. If the borrower defaults on its obligations to return the securities loaned because of insolvency or other reasons, the portfolio could experience delays and costs in recovering the securities loaned.
The Agreement provides the right in the event of default for the non-defaulting party to liquidate the collateral and calculate a net exposure to the defaulting party or request additional collateral. In the event that a borrower defaults, the Funds, as lender, would offset the market value of the collateral received against the market value of the securities loaned. When the value of the collateral is greater than that of the market value of the securities loaned, the lender is left with a net amount payable to the defaulting party. However, bankruptcy or insolvency laws of a particular jurisdiction may impose restrictions on or prohibitions against such a right of offset in the event of a counterparty’s bankruptcy or insolvency. Under the Agreement, the borrower can resell or re-pledge the loaned securities, and the Funds can reinvest cash collateral, or, upon an event of default, resell or re-pledge the collateral.
The Funds retained beneficial ownership and all economic benefits in the securities they have loaned and continue to receive interest paid by the securities and payments equivalent to dividends, and to participate in any changes in their market value, but do not have the proxy voting rights with respect to loaned securities. The portfolio managers of the Funds have the responsibility to request that the securities lending agent call back securities which are out on loan to vote
51
| | | | |
| | |
| | | | Semiannual Report • 2024 |
Notes to Financial Statements (continued)
on material matters and it is the Funds’ policy that the portfolio managers vote on all material matters. However, the ability to timely recall shares for proxy voting purposes typically is not entirely within the control of the portfolio managers, the Funds or their securities lending agent. Under certain circumstances, the recall of shares in time for such shares to be voted may not be possible due to applicable proxy voting record dates and administrative considerations.
Income generated from securities lending is presented in the Statement of Operations. Cash collateral
received by the Funds is reflected as an asset in the Portfolio of Investments (securities purchased with cash collateral from securities lending). The related liability (payable upon return of securities loaned) is presented in the Statement of Assets and Liabilities.
At June 30, 2024, the following tables are a summary of the Funds’ securities lending agreements by counterparty, which are subject to offset under the agreement:
| | | | | | | | | | | | | | | | | | | | |
| | | | | |
| | | | Parnassus Value Equity Fund | | | | | | | | | | | | | | | | |
| | | | Counterparty | | Securities Loaned at Value | | | Cash Collateral
Received1 | | | Net
Amount | | | | |
| | | | BNP Paribas Securities Corp. | | | 2,198,540 | | | | (2,198,540 | ) | | | - | | | | | |
| | | | Morgan Stanley & Co. LLC | | | 11,824,580 | | | | (11,824,580 | ) | | | - | | | | | |
| | | | UBS AG London Branch | | | 349,743 | | | | (349,743 | ) | | | - | | | | | |
| | | | Total | | | 14,372,863 | | | | (14,372,863 | ) | | | - | | | | | |
1 Collateral value of $14,682,746 has been received in connection with securities lending agreements for Parnassus Value Equity Fund. Collateral received in excess of the value of the securities loaned from the individual counterparty is shown for financial reporting purposes in the Funds’ financial statements.
As of June 30, 2024, the contractual maturity date is overnight and continuous for the gross obligation of the equity securities on loan in the Parnassus Value Equity Fund of $14,682,746.
Community Development Investment Programs
The Parnassus Funds may each invest up to 2% of their assets in community investments and community-development loan funds. Each of the Funds may invest in obligations issued by community loan funds at below-market interest rates if the projects financed have a positive social impact, as determined by the Funds’ investment adviser. Generally, there is no secondary market on loan funds and thus loan funds are considered illiquid.
As part of our community development investment program, the Parnassus Core Equity Fund, Parnassus Value Equity Fund and Parnassus Mid Cap Growth Fund have entered into an agreement for fund investments through the Certificate of Deposit Account Registry Service (“CDARS”) network. The CDARS network allows members to place funds in time deposits with depository institutions whose accounts are insured by the Federal Deposit Insurance
Corporation (“FDIC”). Provisions stipulate that participating institutions are FDIC insured; however, in the event of default or bankruptcy by any party to the agreement, the proceeds of the investment may be delayed or subject to legal proceedings and are subject to FDIC limits. While certain investments of the Funds may be bank deposits and may be covered by FDIC insurance, the Funds are themselves not covered by FDIC insurance.
Use of Estimates
The preparation of financial statements in conformity with U.S. Generally Accepted Accounting Principles (“GAAP”) requires management to make estimates and assumptions that affect the reported amounts of assets and liabilities at the date of the financial statements and the reported amount of revenues and expenses during the reporting period. Actual results could differ from those estimates.
4. Risk Factors
Investing in the Parnassus Funds may involve certain risks including, but not limited to those identified below. Please refer to the Funds’ current prospectus and statement of additional information for more information on the risks associated with investing in the Funds.
52
| | | | |
| | |
| Semiannual Report • 2024 | | | | |
Notes to Financial Statements (continued)
Market Conditions
The prices of, and the income generated by, the common stocks and other securities held by the Funds may decline in response to certain events taking place around the world, including those directly involving the companies whose securities are owned by the Funds; conditions affecting the general economy; overall market changes; local, regional or global political, social or economic instability; and public health emergencies (such as the spread of infectious disease); and currency, interest rate and commodity price fluctuations. Additionally, the values of, and the income generated by, most debt securities held by the Funds may be affected by changing interest rates and by changes in the effective maturities and credit ratings of these debt securities. The Funds’ investment manager attempts to reduce these risks through diversification of the portfolio and ongoing credit analysis as well as by monitoring economic and legislative developments, but there can be no assurance that it will be successful at doing so. Investments in securities issued by entities based outside the U.S. may also be affected by currency controls; different accounting, auditing, financial reporting, and legal standards and practices; expropriation; changes in tax policy; greater market volatility; different securities market structures and higher transaction costs.
Investing Outside the U.S.
Securities of issuers domiciled outside the U.S., or with significant operations outside the U.S., may lose value because of political, social, economic or market developments or instability in the countries or regions in which the issuer operates. These securities may also
lose value due to changes in foreign currency exchange rates against the U.S. dollar and/or currencies of other countries. Securities markets in certain countries may be more volatile and/or less liquid than those in the U.S. Investment outside the U.S. may also be subject to different settlement and accounting practices and different regulatory, legal and reporting standards, and may be more difficult to value, than those in the U.S. The risks of investing outside the U.S. may be heightened in connection with investments in emerging and developing countries.
Contractual Obligations
Under the Trusts’ organizational documents, its officers and Trustees may be indemnified against certain liabilities and expenses arising out of the performance of their duties to the Trusts. Additionally, the Trusts have a variety of indemnification obligations under contracts with its service providers. The Trusts’ maximum exposure under these arrangements is unknown, as this would involve future claims that may be made against the Trusts that have not yet occurred.
5. Taxation and Distributions
Federal Income Taxes
The Trusts intend to comply with the requirements of the Internal Revenue Code applicable to regulated investment companies and to distribute all taxable income to shareholders. Therefore, no federal income tax provision is required. Income distributions and capital-gain distributions are determined in accordance with income tax regulations, which may differ from U.S Generally Accepted Accounting Principles (“GAAP”).
The Funds follow ASC 740, Income Taxes, relating to uncertainty in income taxes and disclosures. ASC 740 establishes a minimum threshold for income tax benefits to be recognized in the financial statements. These tax benefits must meet a “more likely than not” threshold, which means that based on technical merits, they have a more than 50% likelihood of being sustained upon examination by the tax authority. Tax benefits meeting this threshold are measured as the largest amount of tax benefit that is greater than 50% likely of being realized upon ultimate settlement with the tax authority. As of and during the year ended June 30, 2024, the Funds did not have a liability for any unrecognized tax benefits. The Funds recognize interest and penalties, if any, related to unrecognized tax benefits as income tax expense in the Statement of Operations. During the year, the Funds did not incur interest or penalties. The Funds are not generally subject to examination by U.S. federal taxing authorities before 2020 or state taxing authorities before 2019.
53
| | | | |
| | |
| | | | Semiannual Report • 2024 |
Notes to Financial Statements (continued)
Tax Matters and Distributions
At June 30, 2024, the cost of investments in securities and net unrealized appreciation/depreciation for income tax purposes were as follows:
| | | | | | | | | | | | | | | | | | | | | | | | | | | | | | | | |
| | | | | | | | |
| | | | | | Parnassus Core
Equity Fund | | | Parnassus Growth
Equity Fund | | | Parnassus Value
Equity Fund | | | Parnassus
Mid Cap Fund | | | Parnassus
Mid Cap
Growth Fund | | | Parnassus
Fixed Income Fund | | | | |
| | | | Cost of investment | | $ | 20,510,714,456 | | | $ | 38,902,905 | | | $ | 3,946,393,026 | | | $ | 2,595,733,607 | | | $ | 587,930,310 | | | $ | 292,330,223 | | | | | |
| | | | Gross unrealized appreciation | | $ | 10,030,138,958 | | | $ | 11,520,289 | | | $ | 1,156,183,315 | | | $ | 539,103,938 | | | $ | 252,372,789 | | | $ | 2,020,169 | | | | | |
| | | | Gross unrealized depreciation | | $ | (472,442,658 | ) | | $ | (461,390 | ) | | $ | (185,134,516 | ) | | $ | (94,974,338 | ) | | $ | (8,278,320 | ) | | $ | (16,716,851 | ) | | | | |
| | | | Net unrealized appreciation (depreciation) | | $ | 9,557,696,300 | | | $ | 11,058,899 | | | $ | 971,048,799 | | | $ | 444,129,600 | | | $ | 244,094,469 | | | $ | (14,696,682 | ) | | | | |
Net unrealized gain/loss differ for financial statement and income tax purposes primarily due to differing treatments of wash sales and return of capital distributions from REITs. Reclassifications as shown in the following table have been made in each Fund’s capital accounts to report these balances on a tax basis, excluding certain temporary differences, as of December 31, 2023. Additional permanent book to tax adjustments may be required in subsequent reporting periods. These reclassifications, which have no impact on the net asset value of the Funds, are primarily the utilization of earnings and profits distributed to shareholders on redemption of shares, net operating losses, and certain differences in the computation of
distributable income and capital gains under Federal tax rules versus GAAP.
For tax purposes, net realized capital losses may be carried over to offset future capital gains, if any. Funds are permitted to carry forward capital losses for an indefinite period, and such losses will retain their character as either short-term or long-term capital losses.
6. Fair Value Measurements
The following table summarizes the portfolios’ financial assets as of June 30, 2024, that is valued at fair value on a recurring basis:
| | | | | | | | | | | | | | | | | | | | | | | | |
| | | | | | |
| | | | Parnassus Core Equity Fund | | | | | | | | | | | | | | | | | | | | |
| | | | | | |
| | | | Investment Securities | | Level 1 | | | Level 2 | | | Level 3 | | | Total | | | | |
| | | | Equities: | | | | | | | | | | | | | | | | | | | | |
| | | | | | |
| | | | Communication Services | | $ | 2,917,382,508 | | | $ | – | | | $ | – | | | $ | 2,917,382,508 | | | | | |
| | | | | | |
| | | | Consumer Discretionary | | | 1,551,538,639 | | | | – | | | | – | | | | 1,551,538,639 | | | | | |
| | | | | | |
| | | | Consumer Staples | | | 1,756,856,117 | | | | – | | | | – | | | | 1,756,856,117 | | | | | |
| | | | | | |
| | | | Financials | | | 5,267,830,697 | | | | – | | | | – | | | | 5,267,830,697 | | | | | |
| | | | | | |
| | | | Health Care | | | 1,664,288,931 | | | | – | | | | – | | | | 1,664,288,931 | | | | | |
| | | | | | |
| | | | Industrials | | | 2,647,662,647 | | | | – | | | | – | | | | 2,647,662,647 | | | | | |
| | | | | | |
| | | | Information Technology | | | 10,927,728,699 | | | | – | | | | – | | | | 10,927,728,699 | | | | | |
| | | | | | |
| | | | Materials | | | 2,195,748,430 | | | | – | | | | – | | | | 2,195,748,430 | | | | | |
| | | | | | |
| | | | Real Estate | | | 969,799,708 | | | | – | | | | – | | | | 969,799,708 | | | | | |
| | | | | | |
| | | | Short-Term Investments | | | 165,232,255 | | | | – | | | | 4,342,125 | | | | 169,574,380 | | | | | |
| | | | Total | | $ | 30,064,068,631 | | | $ | – | | | $ | 4,342,125 | | | $ | 30,068,410,756 | | | | | |
54
| | | | |
| | |
| Semiannual Report • 2024 | | | | |
Notes to Financial Statements (continued)
| | | | | | | | | | | | | | | | | | | | | | | | |
| | | | | | |
| | | | Parnassus Growth Equity Fund | | | | | | | | | | | | | | | | | | | | |
| | | | | | |
| | | | Investment Securities | | Level 1 | | | Level 2 | | | Level 3 | | | Total | | | | |
| | | | Equities: | | | | | | | | | | | | | | | | | | | | |
| | | | | | |
| | | | Communication Services | | $ | 5,484,950 | | | $ | – | | | $ | – | | | $ | 5,484,950 | | | | | |
| | | | | | |
| | | | Consumer Discretionary | | | 4,352,479 | | | | – | | | | – | | | | 4,352,479 | | | | | |
| | | | | | |
| | | | Consumer Staples | | | 969,839 | | | | – | | | | – | | | | 969,839 | | | | | |
| | | | | | |
| | | | Financials | | | 5,192,059 | | | | – | | | | – | | | | 5,192,059 | | | | | |
| | | | | | |
| | | | Health Care | | | 7,359,085 | | | | – | | | | – | | | | 7,359,085 | | | | | |
| | | | | | |
| | | | Industrials | | | 2,110,767 | | | | – | | | | – | | | | 2,110,767 | | | | | |
| | | | | | |
| | | | Information Technology | | | 22,059,475 | | | | – | | | | – | | | | 22,059,475 | | | | | |
| | | | | | |
| | | | Materials | | | 1,421,037 | | | | – | | | | – | | | | 1,421,037 | | | | | |
| | | | | | |
| | | | Short-Term Investments | | | 1,012,113 | | | | – | | | | – | | | | 1,012,113 | | | | | |
| | | | Total | | $ | 49,961,804 | | | $ | – | | | $ | – | | | $ | 49,961,804 | | | | | |
| | | | | | |
| | | | Parnassus Value Equity Fund | | | | | | | | | | | | | | | | | | | | |
| | | | | | |
| | | | Investment Securities | | Level 1 | | | Level 2 | | | Level 3 | | | Total | | | | |
| | | | Equities: | | | | | | | | | | | | | | | | | | | | |
| | | | | | |
| | | | Communication Services | | $ | 599,044,672 | | | $ | – | | | $ | – | | | $ | 599,044,672 | | | | | |
| | | | | | |
| | | | Consumer Discretionary | | | 219,219,334 | | | | – | | | | – | | | | 219,219,334 | | | | | |
| | | | | | |
| | | | Consumer Staples | | | 141,064,927 | | | | – | | | | – | | | | 141,064,927 | | | | | |
| | | | | | |
| | | | Financials | | | 1,345,319,012 | | | | – | | | | – | | | | 1,345,319,012 | | | | | |
| | | | | | |
| | | | Health Care | | | 778,510,788 | | | | – | | | | – | | | | 778,510,788 | | | | | |
| | | | | | |
| | | | Industrials | | | 448,309,039 | | | | – | | | | – | | | | 448,309,039 | | | | | |
| | | | | | |
| | | | Information Technology | | | 860,769,024 | | | | – | | | | – | | | | 860,769,024 | | | | | |
| | | | | | |
| | | | Materials | | | 217,904,302 | | | | – | | | | – | | | | 217,904,302 | | | | | |
| | | | | | |
| | | | Real Estate | | | 197,457,709 | | | | – | | | | – | | | | 197,457,709 | | | | | |
| | | | | | |
| | | | Utilities | | | 73,019,697 | | | | – | | | | – | | | | 73,019,697 | | | | | |
| | | | | | |
| | | | Short-Term Investments | | | 35,511,238 | | | | – | | | | 1,312,083 | | | | 36,823,321 | | | | | |
| | | | Total | | $ | 4,916,129,742 | | | $ | – | | | $ | 1,312,083 | | | $ | 4,917,441,825 | | | | | |
| | | | | | |
| | | | Parnassus Mid Cap Fund | | | | | | | | | | | | | | | | | | | | |
| | | | | | |
| | | | Investment Securities | | Level 1 | | | Level 2 | | | Level 3 | | | Total | | | | |
| | | | Equities: | | | | | | | | | | | | | | | | | | | | |
| | | | | | |
| | | | Communication Services | | $ | 77,060,751 | | | $ | – | | | $ | – | | | $ | 77,060,751 | | | | | |
| | | | | | |
| | | | Consumer Discretionary | | | 322,830,572 | | | | – | | | | – | | | | 322,830,572 | | | | | |
| | | | | | |
| | | | Financials | | | 525,872,508 | | | | – | | | | – | | | | 525,872,508 | | | | | |
| | | | | | |
| | | | Health Care | | | 274,142,567 | | | | – | | | | – | | | | 274,142,567 | | | | | |
| | | | | | |
| | | | Industrials | | | 702,685,459 | | | | – | | | | – | | | | 702,685,459 | | | | | |
| | | | | | |
| | | | Information Technology | | | 727,596,186 | | | | – | | | | – | | | | 727,596,186 | | | | | |
| | | | | | |
| | | | Materials | | | 188,761,782 | | | | – | | | | – | | | | 188,761,782 | | | | | |
| | | | | | |
| | | | Real Estate | | | 123,500,357 | | | | – | | | | – | | | | 123,500,357 | | | | | |
| | | | | | |
| | | | Utilities | | | 69,861,941 | | | | – | | | | – | | | | 69,861,941 | | | | | |
| | | | | | |
| | | | Short-Term Investments | | | 26,820,148 | | | | – | | | | 730,936 | | | | 27,551,084 | | | | | |
| | | | Total | | $ | 3,039,132,271 | | | $ | – | | | $ | 730,936 | | | $ | 3,039,863,207 | | | | | |
55
| | | | |
| | |
| | | | Semiannual Report • 2024 |
Notes to Financial Statements (continued)
| | | | | | | | | | | | | | | | | | | | | | | | |
| | | | | | |
| | | | Parnassus Mid Cap Growth Fund | | | | | | | | | | | | | | | | | | | | |
| | | | | | |
| | | | Investment Securities | | Level 1 | | | Level 2 | | | Level 3 | | | Total | | | | |
| | | | Equities: | | | | | | | | | | | | | | | | | | | | |
| | | | | | |
| | | | Communication Services | | $ | 20,168,660 | | | $ | – | | | $ | – | | | $ | 20,168,660 | | | | | |
| | | | | | |
| | | | Consumer Discretionary | | | 109,751,639 | | | | – | | | | – | | | | 109,751,639 | | | | | |
| | | | | | |
| | | | Financials | | | 75,861,196 | | | | – | | | | – | | | | 75,861,196 | | | | | |
| | | | | | |
| | | | Health Care | | | 131,682,020 | | | | – | | | | – | | | | 131,682,020 | | | | | |
| | | | | | |
| | | | Industrials | | | 144,906,167 | | | | – | | | | – | | | | 144,906,167 | | | | | |
| | | | | | |
| | | | Information Technology | | | 281,161,185 | | | | – | | | | – | | | | 281,161,185 | | | | | |
| | | | | | |
| | | | Materials | | | 37,311,093 | | | | – | | | | – | | | | 37,311,093 | | | | | |
| | | | | | |
| | | | Real Estate | | | 25,816,067 | | | | – | | | | – | | | | 25,816,067 | | | | | |
| | | | | | |
| | | | Short-Term Investments | | | 4,245,741 | | | | – | | | | 1,121,011 | | | | 5,366,752 | | | | | |
| | | | Total | | $ | 830,903,768 | | | $ | – | | | $ | 1,121,011 | | | $ | 832,024,779 | | | | | |
| | | | | | |
| | | | Parnassus Fixed Income Fund | | | | | | | | | | | | | | | | | | | | |
| | | | | | |
| | | | Investment Securities | | Level 1 | | | Level 2 | | | Level 3 | | | Total | | | | |
| | | | | | |
| | | | Exchange-Traded Funds | | $ | 21,368,961 | | | $ | – | | | $ | – | | | $ | 21,368,961 | | | | | |
| | | | | | |
| | | | Preferred Stock | | | 1,915,000 | | | | – | | | | – | | | | 1,915,000 | | | | | |
| | | | | | |
| | | | Corporate Bonds | | | – | | | | 154,542,765 | | | | – | | | | 154,542,765 | | | | | |
| | | | | | |
| | | | Supranational Bonds | | | – | | | | 23,021,731 | | | | – | | | | 23,021,731 | | | | | |
| | | | | | |
| | | | U.S. Government Agency Bonds | | | – | | | | 18,852,536 | | | | – | | | | 18,852,536 | | | | | |
| | | | | | |
| | | | U.S. Government Treasury Bonds | | | – | | | | 51,922,363 | | | | – | | | | 51,922,363 | | | | | |
| | | | | | |
| | | | Short-Term Investments | | | 5,515,950 | | | | – | | | | 494,235 | | | | 6,010,185 | | | | | |
| | | | Total | | $ | 28,799,911 | | | $ | 248,339,395 | | | $ | 494,235 | | | $ | 277,633,541 | | | | | |
The following table reconciles the valuation of the Funds’ Level 3 investment securities and related transactions as of June 30, 2024:
| | | | | | | | | | | | | | | | | | | | | | | | | | | | |
| | | | | | Parnassus Core
Equity Fund | | | Parnassus Value
Equity Fund | | | Parnassus
Mid Cap Fund | | | Parnassus
Mid Cap
Growth Fund | | | Parnassus
Fixed Income
Fund | | | | |
| | | | | | Certificates of
Deposit | | | Certificates of
Deposit | | | Certificates of
Deposit | | | Certificates of
Deposit | | | Certificates of
Deposit | | | | |
| | | | | | Community
Development Loans | | | Community
Development Loans | | | | | | Community
Development Loans | | | | | | | |
| | | | | | | |
| | | | Balance as of December 31, 2023 | | $ | 5,481,990 | | | $ | 1,332,661 | | | $ | 1,287,700 | | | $ | 1,336,631 | | | $ | 484,290 | | | | | |
| | | | | | | |
| | | | Discounts/premiums amortization | | | (39,865 | ) | | | (20,578 | ) | | | (6,764 | ) | | | (15,620 | ) | | | 9,945 | | | | | |
| | | | | | | |
| | | | Purchases | | | 3,700,000 | | | | 1,100,000 | | | | 750,000 | | | | 1,050,000 | | | | - | | | | | |
| | | | | | | |
| | | | Sales | | | (4,800,000 | ) | | | (1,100,000 | ) | | | (1,300,000 | ) | | | (1,250,000 | ) | | | - | | | | | |
| | | | Balance as of June 30, 2024 | | $ | 4,342,125 | | | $ | 1,312,083 | | | $ | 730,936 | | | $ | 1,121,011 | | | $ | 494,235 | | | | | |
56
| | | | |
| | |
| Semiannual Report • 2024 | | | | |
Notes to Financial Statements (continued)
Quantitative information about Level 3 fair value measurement:
| | | | | | | | | | | | | | | | | | |
| | | | | | |
| | | | | | Fair Value at
June 30, 2024 | | | Valuation
Technique | | Unobservable Input | | Range
(Weighted Average) | | | |
| | | | |
| | | | Parnassus Core Equity Fund | | | | | | | | |
| | | | Certificates of Deposit | | $ | 3,651,633 | | | Liquidity Discount | | Discount for Lack of
Marketability | | 4% | | | | |
| | | | Community Development Loans | | $ | 690,492 | | | Liquidity Discount | | Discount for Lack of
Marketability and Probability of Default | | 6% | | | | |
| | | | |
| | | | Parnassus Value Equity Fund | | | | | | | | |
| | | | Certificates of Deposit | | $ | 1,215,608 | | | Liquidity Discount | | Discount for Lack of
Marketability | | 4% | | | | |
| | | | Community Development Loans | | $ | 96,475 | | | Liquidity Discount | | Discount for Lack of
Marketability and Probability of Default | | 6% | | | | |
| | | | |
| | | | Parnassus Mid Cap Fund | | | | | | | | |
| | | | Certificates of Deposit | | $ | 730,936 | | | Liquidity Discount | | Discount for Lack of
Marketability | | 4% | | | | |
| | | | |
| | | | Parnassus Mid Cap Growth Fund | | | | | | | | |
| | | | Certificates of Deposit | | $ | 926,273 | | | Liquidity Discount | | Discount for Lack of
Marketability | | 4% | | | | |
| | | | Community Development Loans | | $ | 194,738 | | | Liquidity Discount | | Discount for Lack of
Marketability and Probability of Default | | 6% | | | | |
| | | | |
| | | | Parnassus Fixed Income Fund | | | | | | | | |
| | | | Certificates of Deposit | | $ | 494,235 | | | Liquidity Discount | | Discount for Lack of
Marketability | | 4% | | | | |
The significant unobservable inputs used in fair value measurement of the Fund’s Certificates of Deposits are a discount for lack of marketability. The significant unobservable inputs used in the fair value measurement of the Fund’s Community Development Loans are a discount for lack of marketability and a discount for the probability of default. Significant increases in any of these inputs in isolation would result in a lower fair value measurement. Generally, a change in the assumption used for probability of default should be accompanied by a directionally-similar change in the assumption used for the lack of marketability.
The Funds’ valuation designee has adopted fair value pricing methodologies to fair value each Fund’s
securities when market prices are not “readily available” or are unreliable. Determination of a fair value by the valuation designee may include significant unobservable inputs and therefore such financial instruments would be reflected as a Level 3 of the fair value hierarchy. Fair value determinations are made in good faith in accordance with the duly adopted fair value pricing methodologies. The valuation designee provides quarterly and annual reports to the Funds’ Trustees in connection the Trustees’ obligation to oversee the valuation designee.
7. Capital Stock
Capital stock consists of an unlimited number of authorized shares of capital stock with no par value.
57
| | | | |
| | |
| | | | Semiannual Report • 2024 |
Notes to Financial Statements (continued)
8. Purchases and Sales of Securities
Purchases and proceeds from sales of securities, excluding short-term securities, for the six-month period ended June 30, 2024 were as follows:
| | | | | | | | | | | | | | | | | | | | | | | | |
| | | | | | |
| | | | Fund | | Affiliated
Purchases | | | Unaffiliated
Purchases | | | Affiliated
Sales | | | Unaffiliated
Sales | | | | |
| | | | Parnassus Core Equity Fund | | $ | 107,064,330 | | | $ | 3,123,900,599 | | | $ | 6,353,028 | | | $ | 4,089,230,498 | | | | | |
| | | | Parnassus Growth Equity Fund | | | – | | | | 19,005,501 | | | | – | | | | 6,141,983 | | | | | |
| | | | Parnassus Value Equity Fund | | | – | | | | 484,264,600 | | | | 13,289,647 | | | | 763,764,540 | | | | | |
| | | | Parnassus Mid Cap Fund | | | – | | | | 1,196,216,315 | | | | 113,237,178 | | | | 3,466,258,260 | | | | | |
| | | | Parnassus Mid Cap Growth Fund | | | – | | | | 167,972,437 | | | | 7,970,433 | | | | 193,647,122 | | | | | |
| | | | Parnassus Fixed Income Fund | | | – | | | | 53,628,592 | | | | – | | | | 40,952,685 | | | | | |
The above includes purchases and sales of U.S. Government securities in the amount of $22,256,785 and $13,265,429, respectively, within the Parnassus Fixed Income Fund.
9. Investment Advisory Agreement and Transactions with Affiliates
Under terms of an agreement which provides for furnishing investment management and advice to the Funds, Parnassus Investments, LLC, the investment manager to the Funds (the “Advisor”), is entitled to receive fees payable monthly, based on each Fund’s average daily net assets for the month, at the following annual rates:
Parnassus Growth Equity Fund: 0.75% of the first $30,000,000, 0.70% of the next $70,000,000, 0.65% of the next $400,000,000, 0.60% of the next $9,500,000,000 and 0.55% of the amount above $10,000,000,000. For the six-month period ended June 30, 2024, Parnassus Investments has contractually agreed to limit total operating expenses to 0.84% of the net assets of the Parnassus Growth Equity Fund – Investor Shares and to 0.63% of net assets for the Parnassus Growth Equity Fund – Institutional Shares.
Parnassus Value Equity Fund: 0.85% of the first $100,000,000, 0.80% of the next $100,000,000, 0.75% of the next $300,000,000 and 0.65% of the amount above $500,000,000. For the six-month period ended June 30, 2024, Parnassus Investments has contractually agreed to limit total operating expenses to 0.88% of net assets for the Parnassus Value Equity Fund – Investor Shares and to 0.65% of net assets for the Parnassus Value Equity Fund – Institutional Shares.
Parnassus Mid Cap Fund: 0.85% of the first $100,000,000, 0.80% of the next $100,000,000, 0.75% of the next $300,000,000 and 0.70% of the amount above $500,000,000. For the six-month period ended June 30, 2024, Parnassus Investments has contractually agreed to limit total operating expenses to 0.96% of the net assets of the Parnassus Mid Cap Fund – Investor Shares and to 0.75% of net assets for the Parnassus Mid Cap Fund – Institutional Shares.
Parnassus Mid Cap Growth Fund: 0.70% of the first $100,000,000, 0.65% of the next $100,000,000 and 0.60% of the amount above $200,000,000. For the six-month period ended June 30, 2024, Parnassus Investments has contractually agreed to limit total operating expenses to 0.80% of the net assets of the Parnassus Mid Cap Growth Fund – Investor Shares and to 0.68% of the net assets of the Parnassus Mid Cap Growth Fund – Institutional Shares.
Parnassus Core Equity Fund: 0.75% of the first $30,000,000, 0.70% of the next $70,000,000, 0.65% of the next $400,000,000, 0.60% of the next $9,500,000,000 and 0.55% of the amount above $10,000,000,000. For the six-month period ended June 30, 2024, Parnassus Investments has contractually agreed to limit total operating expenses to 0.82% of net assets of the Parnassus Core Equity Fund – Investor Shares and to 0.61% of net assets for the Parnassus Core Equity Fund – Institutional Shares.
Parnassus Fixed Income Fund: 0.50% of the first $200,000,000, 0.45% of the next $200,000,000 and 0.40% of the amount above $400,000,000. For the six- month period ended June 30, 2024, Parnassus
58
| | | | |
| | |
| Semiannual Report • 2024 | | | | |
Notes to Financial Statements (continued)
Investments has contractually agreed to limit total operating expenses to 0.58% of net assets for the Parnassus Fixed Income Fund – Investor Shares and to 0.39% of net assets for the Parnassus Fixed Income Fund – Institutional Shares. Parnassus Investments, LLC has contractually agreed to waive 0.10% of its management fee for each class.
The fund administration reflects annual rates based on net assets for all Funds managed by Parnassus Investments and was allocated based on respective Fund net assets at the following annual rates: 0.08% of the first $500,000,000, 0.07% of the next $500,000,000 and 0.03% of the amount above $1,000,000,000. The fund administration services fee was 0.03% of average net assets under this agreement for the six-month period ended June 30, 2024.
The Advisor has appointed Brown Brothers Harriman as a sub administrator to the Funds. Brown Brothers Harriman provides day-to-day operational services to each Fund including, but not limited to fund accounting services. The fees payable to Brown Brothers Harriman for sub administrative services are paid by the Advisor and not the Funds. Custodian fees are paid by the Funds.
The Funds have a shareholder services agreement with Ultimus Financial Solutions under which the Funds compensate Ultimus Financial Solutions for providing transfer agent services to each of the Funds’ share classes. These services include recordkeeping, shareholder communications and transaction processing.
10. Holdings of 5% Voting Securities of Portfolio Companies
The 1940 Act defines “affiliated companies” to include investments in portfolio companies in which a fund owns 5% or more of the outstanding voting securities. Additionally, as defined in the 1940 Act, an investment is deemed to be a “Controlled Affiliate” of a fund when a fund owns, either directly or indirectly, 25% or more of the affiliated companies’ outstanding shares or has the power to exercise control over management or policies of such company.
During the six-month period ended June 30, 2024, investments in “affiliated companies” were as follows:
| | | | | | | | | | | | | | | | | | | | | | | | | | | | | | | | | | | | | | | | |
| | | | | | Value at
Beginning of
Year | | | Purchases | | | Sales | | | Realized
Gain (Loss) | | | Net Change in
Unrealized
Appreciation
(Depreciation) | | | Value at End
of Period | | | Number of
Shares
Held at
End of Period | | | Investment
Income | | | | |
| | | | | | | | |
| | | | Parnassus Core Equity Fund | | | | | | | | | | | | | | | | | | | | | | | | | | | | | |
| | | | | | | | |
| | | | Non-Controlled Affiliates | | | | | | | | | | | | | | | | | | | | | | | | Dividends | | | | | |
| | | | | | | | | | |
| | | | | Ball Corp. | | $ | 709,907,699 | | | $ | 107,064,330 | | | $ | 6,353,028 | | | $ | (2,954,143 | ) | | $ | 36,673,935 | | | $ | 844,338,793 | | | | 14,067,624 | | | $ | 5,646,791 | | | | | |
| | | | | | | | | | |
| | | | Total Affiliates | | $ | 709,907,699 | | | $ | 107,064,330 | | | $ | 6,353,028 | | | $ | (2,954,143 | ) | | $ | 36,673,935 | | | $ | 844,338,793 | | | | 14,067,624 | | | $ | 5,646,791 | | | | | |
| | | | | | | | |
| | | | Parnassus Value Equity Fund | | | | | | | | | | | | | | | | | | | | | | | | | | | | | |
| | | | | | | | |
| | | | Non-Controlled Affiliates | | | | | | | | | | | | | | | | | | | | | | | | Dividends | | | | | |
| | | | | | | | | | |
| | | | | Ball Corp. | | $ | 143,351,919 | | | $ | – | | | $ | 13,289,647 | | | $ | (440,987 | ) | | $ | 8,644,148 | | | $ | 138,265,433 | | | | 2,303,656 | | | $ | 959,173 | | | | | |
| | | | | | | | | | |
| | | | Total Affiliates | | $ | 143,351,919 | | | $ | – | | | $ | 13,289,647 | | | $ | (440,987 | ) | | $ | 8,644,148 | | | $ | 138,265,433 | | | | 2,303,656 | | | $ | 959,173 | | | | | |
| | | | | | | | |
| | | | Parnassus Mid Cap Fund | | | | | | | | | | | | | | | | | | | | | | | | | | | | | |
| | | | | | | | |
| | | | Non-Controlled Affiliates | | | | | | | | | | | | | | | | | | | | | | | | Dividends | | | | | |
| | | | | | | | | | |
| | | | | Ball Corp. | | $ | 164,890,686 | | | $ | – | | | $ | 113,237,179 | | | $ | (58,140,420 | ) | | $ | 61,594,876 | | | $ | 55,107,963 | | | | 918,160 | | | $ | 429,019 | | | | | |
| | | | | | | | | | |
| | | | Total Affiliates | | $ | 164,890,686 | | | $ | – | | | $ | 113,237,179 | | | $ | (58,140,420 | ) | | $ | 61,594,876 | | | $ | 55,107,963 | | | | 918,160 | | | $ | 429,019 | | | | | |
59
| | | | |
| | |
| | | | Semiannual Report • 2024 |
Notes to Financial Statements (continued)
| | | | | | | | | | | | | | | | | | | | | | | | | | | | | | | | | | | | | | | | |
| | | | | | Value at
Beginning of
Year | | | Purchases | | | Sales | | | Realized
Gain (Loss) | | | Net Change in
Unrealized
Appreciation
(Depreciation) | | | Value at End
of Period | | | Number of
Shares
Held at
End of Period | | | Investment
Income | | | | |
| | | | | | | | |
| | | | Parnassus Mid Cap Growth Fund | | | | | | | | | | | | | | | | | | | | | | | | | | | | | |
| | | | | | | | |
| | | | Non-Controlled Affiliates | | | | | | | | | | | | | | | | | | | | | | | | Dividends | | | | | |
| | | | | | | | | | |
| | | | | Ball Corp. | | $ | 8,380,664 | | | $ | – | | | $ | 7,970,434 | | | $ | (361,063 | ) | | $ | (49,167 | ) | | $ | – | | | | – | | | | $– | | | | | |
| | | | Total Affiliates | | $ | 8,380,664 | | | $ | – | | | $ | 7,970,434 | | | $ | (361,063 | ) | | $ | (49,167 | ) | | $ | – | | | | – | | | | $– | | | | | |
11. Subsequent Events
Management has evaluated the impact of all subsequent events on the Funds through the date the financial statements were issued and has determined
that there were no subsequent events requiring adjustment to or additional disclosure in the financial statements.
60
| | | | |
| | |
| Semiannual Report • 2024 | | | | |
THIS PAGE LEFT INTENTIONALLY BLANK
61
| | | | |
| | |
| | | | Semiannual Report • 2024 |
Financial Highlights
Selected data for each share of capital stock outstanding, total return and ratios/supplement data for the six-month period ended June 30, 2024 and each of the five years ended December 31 are as follows:
| | | | | | | | | | | | | | | | | | | | | | | | | | | | |
| | | | | | | |
For a Share Outstanding
for the Six-Month Period
Ended June 30, 2024
(unaudited) | | Net Asset
Value
Beginning
of Period | | | Net Investment
Income
(Loss)(a) | | | Net Realized and
Unrealized
Gain (Loss) on
Securities(a) | | | Total from
Investment
Operations(a) | | | Dividends
from Net
Investment
Income | | | Distributions
from Net
Realized
Gains on
Securities | | | Total
Dividends and
Distributions | |
| Parnassus Core Equity Fund – Investor Shares | |
Six-Month Period Ended June 30, 2024 | | | $55.11 | | | | $0.10 | | | | $6.53 | | | | $6.63 | | | | $(0.09 | ) | | | $- | | | | $(0.09 | ) |
2023 | | | 46.92 | | | | 0.29 | | | | 11.21 | | | | 11.50 | | | | (0.31 | ) | | | (3.00 | ) | | | (3.31 | ) |
2022 | | | 63.41 | | | | 0.23 | | | | (11.97 | ) | | | (11.74 | ) | | | (0.23 | ) | | | (4.52 | ) | | | (4.75 | ) |
2021 | | | 53.65 | | | | 0.23 | | | | 14.46 | | | | 14.69 | | | | (0.53 | ) | | | (4.40 | ) | | | (4.93 | ) |
2020 | | | 47.03 | | | | 0.33 | | | | 9.44 | | | | 9.77 | | | | (0.31 | ) | | | (2.84 | ) | | | (3.15 | ) |
2019 | | | 38.99 | | | | 0.36 | | | | 11.45 | | | | 11.81 | | | | (0.34 | ) | | | (3.43 | ) | | | (3.77 | ) |
| Parnassus Core Equity Fund – Institutional Shares | |
Six-Month Period Ended June 30, 2024 | | | 55.26 | | | | 0.16 | | | | 6.54 | | | | 6.70 | | | | (0.15 | ) | | | - | | | | (0.15 | ) |
2023 | | | 47.03 | | | | 0.40 | | | | 11.25 | | | | 11.65 | | | | (0.42 | ) | | | (3.00 | ) | | | (3.42 | ) |
2022 | | | 63.55 | | | | 0.34 | | | | (12.00 | ) | | | (11.66 | ) | | | (0.34 | ) | | | (4.52 | ) | | | (4.86 | ) |
2021 | | | 53.75 | | | | 0.36 | | | | 14.49 | | | | 14.85 | | | | (0.65 | ) | | | (4.40 | ) | | | (5.05 | ) |
2020 | | | 47.10 | | | | 0.44 | | | | 9.46 | | | | 9.90 | | | | (0.41 | ) | | | (2.84 | ) | | | (3.25 | ) |
2019 | | | 39.05 | | | | 0.46 | | | | 11.47 | | | | 11.93 | | | | (0.45 | ) | | | (3.43 | ) | | | (3.88 | ) |
| Parnassus Growth Equity Fund – Investor Shares | |
Six-Month Period Ended June 30, 2024 | | | 21.30 | | | | (0.02 | ) | | | 3.67 | | | | 3.65 | | | | - | | | | - | | | | - | |
2023 | | | 14.95 | | | | 0.02 | | | | 6.68 | | | | 6.70 | | | | (0.35 | ) | | | - | | | | (0.35 | ) |
For the period ended December 31, 2022(f) | | | 15.00 | | | | - | (g) | | | (0.05 | ) | | | (0.05 | ) | | | - | | | | - | | | | - | |
| Parnassus Growth Equity Fund – Institutional Shares | |
Six-Month Period Ended June 30, 2024 | | | 21.30 | | | | 0.00 | | | | 3.68 | | | | 3.68 | | | | - | | | | - | | | | - | |
2023 | | | 14.95 | | | | 0.05 | | | | 6.68 | | | | 6.73 | | | | (0.38 | ) | | | - | | | | (0.38 | ) |
For the period ended December 31, 2022(f) | | | 15.00 | | | | - | (g) | | | (0.05 | ) | | | (0.05 | ) | | | - | | | | - | | | | - | |
| Parnassus Value Equity Fund – Investor Shares | |
Six-Month Period Ended June 30, 2024 | | | 50.54 | | | | 0.26 | | | | 2.76 | | | | 3.02 | | | | - | | | | - | | | | - | |
2023 | | | 45.27 | | | | 0.59 | | | | 5.57 | | | | 6.16 | | | | (0.60 | ) | | | (0.29 | ) | | | (0.89 | ) |
2022 | | | 54.03 | | | | 0.53 | | | | (7.99 | ) | | | (7.46 | ) | | | (0.54 | ) | | | (0.76 | ) | | | (1.30 | ) |
2021 | | | 48.31 | | | | 0.69 | | | | 14.08 | | | | 14.77 | | | | (0.97 | ) | | | (8.08 | ) | | | (9.05 | ) |
2020 | | | 38.18 | | | | 0.28 | | | | 10.19 | | | | 10.47 | | | | (0.34 | ) | | | - | | | | (0.34 | ) |
2019 | | | 28.87 | | | | 0.25 | | | | 9.36 | | | | 9.61 | | | | (0.30 | ) | | | - | | | | (0.30 | ) |
| Parnassus Value Equity Fund – Institutional Shares | |
Six-Month Period Ended June 30, 2024 | | | 50.64 | | | | 0.32 | | | | 2.77 | | | | 3.09 | | | | - | | | | - | | | | - | |
2023 | | | 45.36 | | | | 0.70 | | | | 5.58 | | | | 6.28 | | | | (0.71 | ) | | | (0.29 | ) | | | (1.00 | ) |
2022 | | | 54.10 | | | | 0.64 | | | | (8.00 | ) | | | (7.36 | ) | | | (0.62 | ) | | | (0.76 | ) | | | (1.38 | ) |
2021 | | | 48.36 | | | | 0.80 | | | | 14.11 | | | | 14.91 | | | | (1.09 | ) | | | (8.08 | ) | | | (9.17 | ) |
2020 | | | 38.19 | | | | 0.36 | | | | 10.22 | | | | 10.58 | | | | (0.41 | ) | | | - | | | | (0.41 | ) |
2019 | | | 28.89 | | | | 0.34 | | | | 9.36 | | | | 9.70 | | | | (0.40 | ) | | | - | | | | (0.40 | ) |
62
| | | | |
| | |
| Semiannual Report • 2024 | | | | |
| | | | | | | | | | | | | | | | | | | | | | | | | | |
| | | | | | |
Net Asset
Value
End of
Period | | | Total
Overall
Return | | | Net Assets
End of
Period
(000s) | | | Ratio of
Gross
Expenses to
Average
Net Assets | | | Ratio of Net Expenses to
Average Net Assets
(Net of Waiver and
Expense
Offset Arrangements)(b),(c) | | | Ratio of
Net Investment
Income (Loss)
to Average Net
Assets | | | Portfolio
Turnover
Rate | |
| | |
|
$61.65 |
| | | 12.03 | %(d) | | | $13,773,073 | | | | 0.81 | %(e) | | | 0.81 | %(e) | | | 0.35 | %(e) | | | 11.21 | % |
| | 55.11 | | | | 24.93 | | | | 12,929,826 | | | | 0.82 | | | | 0.82 | | | | 0.56 | | | | 29.01 | |
| | 46.92 | | | | (18.61 | ) | | | 11,173,977 | | | | 0.85 | | | | 0.82 | | | | 0.42 | | | | 39.63 | |
| | 63.41 | | | | 27.55 | | | | 15,405,636 | | | | 0.82 | | | | 0.82 | | | | 0.38 | | | | 25.82 | |
| | 53.65 | | | | 21.19 | | | | 11,906,386 | | | | 0.84 | | | | 0.84 | | | | 0.69 | | | | 37.15 | |
| | 47.03 | | | | 30.69 | | | | 9,998,994 | | | | 0.86 | | | | 0.86 | | | | 0.78 | | | | 36.88 | |
| | |
|
61.81 |
| | | 12.13 | (d) | | | 16,280,223 | | | | 0.61 | (e) | | | 0.61 | (e) | | | 0.55 | (e) | | | 11.21 | |
| | 55.26 | | | | 25.21 | | | | 14,868,509 | | | | 0.62 | | | | 0.61 | | | | 0.77 | | | | 29.01 | |
| | 47.03 | | | | (18.45 | ) | | | 12,736,208 | | | | 0.62 | | | | 0.61 | | | | 0.64 | | | | 39.63 | |
| | 63.55 | | | | 27.81 | | | | 16,869,763 | | | | 0.61 | | | | 0.61 | | | | 0.60 | | | | 25.82 | |
| | 53.75 | | | | 21.47 | | | | 11,320,933 | | | | 0.62 | | | | 0.62 | | | | 0.91 | | | | 37.15 | |
| | 47.10 | | | | 30.96 | | | | 8,660,689 | | | | 0.63 | | | | 0.63 | | | | 1.02 | | | | 36.88 | |
| | |
|
24.95 |
| | | 17.14 | (d) | | | 16,825 | | | | 1.49 | (e) | | | 0.84 | (e) | | | (0.17 | )(e) | | | 15.20 | |
| | 21.30 | | | | 44.82 | | | | 8,006 | | | | 2.89 | | | | 0.84 | | | | 0.10 | | | | 34.94 | |
|
14.95 |
| | | (0.33 | )(d) | | | 227 | | | | 7.83 | (e) | | | 0.84 | (e) | | | 3.52 | (e) | | | - | |
| | |
|
24.98 |
| | | 17.28 | (d) | | | 33,112 | | | | 1.25 | (e) | | | 0.63 | (e) | | | 0.02 | (e) | | | 15.20 | |
| | 21.30 | | | | 45.09 | | | | 22,529 | | | | 1.86 | | | | 0.63 | | | | 0.30 | | | | 34.94 | |
|
14.95 |
| | | (0.33 | )(d) | | | 10,573 | | | | 2.30 | (e) | | | 0.63 | (e) | | | 3.11 | (e) | | | - | |
| | |
|
53.56 |
| | | 5.98 | (d) | | | 3,195,073 | | | | 0.90 | (e) | | | 0.88 | (e) | | | 0.99 | (e) | | | 9.77 | |
| | 50.54 | | | | 13.70 | | | | 3,267,439 | | | | 0.93 | | | | 0.88 | | | | 1.26 | | | | 30.19 | |
| | 45.27 | | | | (13.81 | ) | | | 3,008,001 | | | | 0.92 | | | | 0.88 | | | | 1.11 | | | | 32.36 | |
| | 54.03 | | | | 31.12 | | | | 3,768,904 | | | | 0.90 | | | | 0.90 | | | | 1.20 | | | | 37.22 | |
| | 48.31 | | | | 27.42 | | | | 2,238,344 | | | | 0.94 | | | | 0.94 | | | | 0.75 | | | | 52.77 | |
| | 38.18 | | | | 33.29 | | | | 2,737,805 | | | | 0.97 | | | | 0.95 | | | | 0.73 | | | | 57.29 | |
| | |
|
53.73 |
| | | 6.10 | (d) | | | 1,707,876 | | | | 0.71 | (e) | | | 0.65 | (e) | | | 1.22 | (e) | | | 9.77 | |
| | 50.64 | | | | 13.94 | | | | 1,652,941 | | | | 0.72 | | | | 0.65 | | | | 1.49 | | | | 30.19 | |
| | 45.36 | | | | (13.61 | ) | | | 1,518,273 | | | | 0.72 | | | | 0.65 | | | | 1.35 | | | | 32.36 | |
| | 54.10 | | | | 31.37 | | | | 1,654,506 | | | | 0.71 | | | | 0.71 | | | | 1.39 | | | | 37.22 | |
| | 48.36 | | | | 27.72 | | | | 1,025,590 | | | | 0.73 | | | | 0.71 | | | | 0.96 | | | | 52.77 | |
| | 38.19 | | | | 33.57 | | | | 1,104,181 | | | | 0.71 | | | | 0.71 | | | | 0.97 | | | | 57.29 | |
63
| | | | |
| | |
| | | | Semiannual Report • 2024 |
Financial Highlights (continued)
| | | | | | | | | | | | | | | | | | | | | | | | | | | | |
| | | | | | | |
For a Share Outstanding
for the Six-Month Period
Ended June 30, 2024
(unaudited) | | Net Asset
Value
Beginning
of Period | | | Net Investment
Income
(Loss)(a) | | | Net Realized and
Unrealized
Gain (Loss) on
Securities(a) | | | Total from
Investment
Operations(a) | | | Dividends
from Net
Investment
Income | | | Distributions
from Net
Realized
Gains on
Securities | | | Total
Dividends and
Distributions | |
| Parnassus Mid Cap Fund – Investor Shares | |
Six-Month Period Ended June 30, 2024 | | | $37.25 | | | | $0.04 | | | | $0.73 | | | | $0.77 | | | | $- | | | | $- | | | | $- | |
2023 | | | 33.88 | | | | 0.10 | | | | 4.13 | | | | 4.23 | | | | (0.14 | ) | | | (0.72 | ) | | | (0.86 | ) |
2022 | | | 45.20 | | | | 0.03 | | | | (9.78 | ) | | | (9.75 | ) | | | - | | | | (1.57 | ) | | | (1.57 | ) |
2021 | | | 40.78 | | | | (0.04 | ) | | | 6.66 | | | | 6.62 | | | | (0.01 | ) | | | (2.19 | ) | | | (2.20 | ) |
2020 | | | 35.63 | | | | 0.12 | | | | 5.18 | | | | 5.30 | | | | (0.08 | ) | | | (0.07 | ) | | | (0.15 | ) |
2019 | | | 28.86 | | | | 0.17 | | | | 8.08 | | | | 8.25 | | | | (0.18 | ) | | | (1.30 | ) | | | (1.48 | ) |
| Parnassus Mid Cap Fund – Institutional Shares | |
Six-Month Period Ended June 30, 2024 | | | 37.42 | | | | 0.07 | | | | 0.74 | | | | 0.81 | | | | - | | | | - | | | | - | |
2023 | | | 34.02 | | | | 0.17 | | | | 4.16 | | | | 4.33 | | | | (0.21 | ) | | | (0.72 | ) | | | (0.93 | ) |
2022 | | | 45.39 | | | | 0.11 | | | | (9.83 | ) | | | (9.72 | ) | | | (0.08 | ) | | | (1.57 | ) | | | (1.65 | ) |
2021 | | | 40.87 | | | | 0.05 | | | | 6.69 | | | | 6.74 | | | | (0.03 | ) | | | (2.19 | ) | | | (2.22 | ) |
2020 | | | 35.68 | | | | 0.20 | | | | 5.20 | | | | 5.40 | | | | (0.14 | ) | | | (0.07 | ) | | | (0.21 | ) |
2019 | | | 28.90 | | | | 0.27 | | | | 8.07 | | | | 8.34 | | | | (0.26 | ) | | | (1.30 | ) | | | (1.56 | ) |
| Parnassus Mid Cap Growth Fund – Investor Shares | |
Six-Month Period Ended June 30, 2024 | | | 55.57 | | | | (0.10 | ) | | | 2.54 | | | | 2.44 | | | | - | | | | - | | | | - | |
2023 | | | 42.28 | | | | (0.15 | ) | | | 15.03 | | | | 14.88 | | | | - | | | | (1.59 | ) | | | (1.59 | ) |
2022 | | | 64.36 | | | | (0.17 | ) | | | (21.39 | ) | | | (21.56 | ) | | | - | | | | (0.52 | ) | | | (0.52 | ) |
2021 | | | 61.44 | | | | (0.34 | ) | | | 6.16 | | | | 5.82 | | | | (0.94 | ) | | | (1.96 | ) | | | (2.90 | ) |
2020 | | | 50.47 | | | | (0.02 | ) | | | 14.19 | | | | 14.17 | | | | (0.06 | ) | | | (3.14 | ) | | | (3.20 | ) |
2019 | | | 40.54 | | | | 0.29 | | | | 11.77 | | | | 12.06 | | | | (1.28 | ) | | | (0.85 | ) | | | (2.13 | ) |
| Parnassus Mid Cap Growth Fund – Institutional Shares | |
Six-Month Period Ended June 30, 2024 | | | 55.83 | | | | (0.06 | ) | | | 2.55 | | | | 2.49 | | | | - | | | | - | | | | - | |
2023 | | | 42.42 | | | | (0.09 | ) | | | 15.09 | | | | 15.00 | | | | - | | | | (1.59 | ) | | | (1.59 | ) |
2022 | | | 64.50 | | | | (0.11 | ) | | | (21.45 | ) | | | (21.56 | ) | | | - | | | | (0.52 | ) | | | (0.52 | ) |
2021 | | | 61.49 | | | | (0.26 | ) | | | 6.17 | | | | 5.91 | | | | (0.94 | ) | | | (1.96 | ) | | | (2.90 | ) |
2020 | | | 50.43 | | | | 0.05 | | | | 14.21 | | | | 14.26 | | | | (0.06 | ) | | | (3.14 | ) | | | (3.20 | ) |
2019 | | | 40.52 | | | | 0.37 | | | | 11.75 | | | | 12.12 | | | | (1.36 | ) | | | (0.85 | ) | | | (2.21 | ) |
| Parnassus Fixed Income Fund – Investor Shares | |
Six-Month Period Ended June 30, 2024 | | | 14.88 | | | | 0.26 | | | | (0.30 | ) | | | (0.04 | ) | | | (0.26 | ) | | | - | | | | (0.26 | ) |
2023 | | | 14.40 | | | | 0.47 | | | | 0.47 | | | | 0.94 | | | | (0.46 | ) | | | - | | | | (0.46 | ) |
2022 | | | 17.22 | | | | 0.37 | | | | (2.82 | ) | | | (2.45 | ) | | | (0.37 | ) | | | - | | | | (0.37 | ) |
2021 | | | 18.01 | | | | 0.29 | | | | (0.66 | ) | | | (0.37 | ) | | | (0.29 | ) | | | (0.13 | ) | | | (0.42 | ) |
2020 | | | 17.05 | | | | 0.29 | | | | 1.05 | | | | 1.34 | | | | (0.28 | ) | | | (0.10 | ) | | | (0.38 | ) |
2019 | | | 15.92 | | | | 0.37 | | | | 1.15 | | | | 1.52 | | | | (0.39 | ) | | | - | | | | (0.39 | ) |
64
| | | | |
| | |
| Semiannual Report • 2024 | | | | |
| | | | | | | | | | | | | | | | | | | | | | | | | | |
| | | | | | |
Net Asset
Value
End of
Period | | | Total
Overall
Return | | | Net Assets
End of
Period
(000s) | | | Ratio of
Gross
Expenses to
Average
Net Assets | | | Ratio of Net Expenses to
Average Net Assets
(Net of Waiver and
Expense
Offset Arrangements)(b),(c) | | | Ratio of
Net Investment
Income (Loss)
to Average Net
Assets | | | Portfolio
Turnover
Rate | |
| | |
|
$38.02 |
| | | 2.07 | %(d) | | | $1,327,302 | | | | 0.97 | %(e) | | | 0.96 | %(e) | | | 0.22 | %(e) | | | 32.66 | % |
| | 37.25 | | | | 12.67 | | | | 1,477,106 | | | | 0.98 | | | | 0.96 | | | | 0.28 | | | | 42.45 | |
| | 33.88 | | | | (21.56 | ) | | | 1,974,198 | | | | 0.97 | | | | 0.96 | | | | 0.09 | | | | 47.52 | |
| | 45.20 | | | | 16.39 | | | | 3,155,696 | | | | 0.96 | | | | 0.96 | | | | (0.08 | ) | | | 34.76 | |
| | 40.78 | | | | 14.88 | | | | 2,749,355 | | | | 0.98 | | | | 0.98 | | | | 0.34 | | | | 41.00 | |
| | 35.63 | | | | 28.75 | | | | 2,381,822 | | | | 1.01 | | | | 0.99 | | | | 0.48 | | | | 28.27 | |
| | |
|
38.23 |
| | | 2.16 | (d) | | | 1,710,497 | | | | 0.78 | (e) | | | 0.75 | (e) | | | 0.37 | (e) | | | 32.66 | |
| | 37.42 | | | | 12.92 | | | | 3,921,694 | | | | 0.76 | | | | 0.75 | | | | 0.49 | | | | 42.45 | |
| | 34.02 | | | | (21.41 | ) | | | 4,103,007 | | | | 0.76 | | | | 0.75 | | | | 0.30 | | | | 47.52 | |
| | 45.39 | | | | 16.63 | | | | 5,518,086 | | | | 0.75 | | | | 0.75 | | | | 0.13 | | | | 34.76 | |
| | 40.87 | | | | 15.16 | | | | 4,211,267 | | | | 0.76 | | | | 0.75 | | | | 0.58 | | | | 41.00 | |
| | 35.68 | | | | 29.02 | | | | 2,692,990 | | | | 0.75 | | | | 0.75 | | | | 0.77 | | | | 28.27 | |
| | |
|
58.01 |
| | | 4.39 | (d) | | | 646,530 | | | | 0.81 | (e) | | | 0.80 | (e) | | | (0.34 | )(e) | | | 20.24 | |
| | 55.57 | | | | 35.60 | | | | 645,243 | | | | 0.81 | | | | 0.80 | | | | (0.30 | ) | | | 47.49 | |
| | 42.28 | | | | (33.52 | ) | | | 514,193 | | | | 0.80 | | | | 0.80 | | | | (0.36 | ) | | | 58.11 | |
| | 64.36 | | | | 9.37 | | | | 880,724 | | | | 0.80 | | | | 0.80 | | | | (0.52 | ) | | | 28.73 | |
| | 61.44 | | | | 28.61 | | | | 860,120 | | | | 0.83 | | | | 0.83 | | | | (0.05 | ) | | | 82.46 | |
| | 50.47 | | | | 29.82 | | | | 803,731 | | | | 0.84 | | | | 0.84 | | | | 0.60 | | | | 43.61 | |
| | |
|
58.32 |
| | | 4.46 | (d) | | | 184,796 | | | | 0.70 | (e) | | | 0.68 | (e) | | | (0.22 | )(e) | | | 20.24 | |
| | 55.83 | | | | 35.77 | | | | 183,037 | | | | 0.71 | | | | 0.68 | | | | (0.18 | ) | | | 47.49 | |
| | 42.42 | | | | (33.45 | ) | | | 144,292 | | | | 0.70 | | | | 0.68 | | | | (0.24 | ) | | | 58.11 | |
| | 64.50 | | | | 9.50 | | | | 237,137 | | | | 0.68 | | | | 0.68 | | | | (0.40 | ) | | | 28.73 | |
| | 61.49 | | | | 28.81 | | | | 218,962 | | | | 0.68 | | | | 0.68 | | | | 0.09 | | | | 82.46 | |
| | 50.43 | | | | 29.98 | | | | 182,443 | | | | 0.68 | | | | 0.68 | | | | 0.76 | | | | 43.61 | |
| | |
|
14.58 |
| | | (0.26 | )(d) | | | 109,403 | | | | 0.80 | (e) | | | 0.58 | (e) | | | 3.61 | (e) | | | 15.16 | |
| | 14.88 | | | | 6.71 | | | | 118,945 | | | | 0.81 | | | | 0.58 | | | | 3.24 | | | | 48.72 | |
| | 14.40 | | | | (14.29 | ) | | | 132,391 | | | | 0.82 | | | | 0.68 | | | | 2.42 | | | | 58.67 | |
| | 17.22 | | | | (2.09 | ) | | | 230,471 | | | | 0.76 | | | | 0.68 | | | | 1.64 | | | | 31.29 | |
| | 18.01 | | | | 7.91 | | | | 233,496 | | | | 0.74 | | | | 0.68 | | | | 1.61 | | | | 37.77 | |
| | 17.05 | | | | 9.63 | | | | 160,158 | | | | 0.87 | | | | 0.68 | | | | 2.22 | | | | 53.98 | |
65
| | | | |
| | |
| | | | Semiannual Report • 2024 |
Financial Highlights (continued)
| | | | | | | | | | | | | | | | | | | | | | | | | | | | |
| | | | | | | |
For a Share Outstanding
for the Six-Month Period
Ended June 30, 2024
(unaudited) | | Net Asset
Value
Beginning
of Period | | | Net Investment
Income
(Loss)(a) | | | Net Realized and
Unrealized
Gain (Loss) on
Securities(a) | | | Total from
Investment
Operations(a) | | | Dividends
from Net
Investment
Income | | | Distributions
from Net
Realized
Gains on
Securities | | | Total
Dividends and
Distributions | |
| Parnassus Fixed Income Fund – Institutional Shares | |
Six-Month Period Ended June 30, 2024 | | | $14.89 | | | | $0.28 | | | | $(0.30 | ) | | | $(0.02 | ) | | | $(0.27 | ) | | | $- | | | | $(0.27 | ) |
2023 | | | 14.40 | | | | 0.50 | | | | 0.48 | | | | 0.98 | | | | (0.49 | ) | | | - | | | | (0.49 | ) |
2022 | | | 17.22 | | | | 0.40 | | | | (2.81 | ) | | | (2.41 | ) | | | (0.40 | ) | | | (0.01 | ) | | | (0.41 | ) |
2021 | | | 18.01 | | | | 0.33 | | | | (0.67 | ) | | | (0.34 | ) | | | (0.32 | ) | | | (0.13 | ) | | | (0.45 | ) |
2020 | | | 17.04 | | | | 0.33 | | | | 1.06 | | | | 1.39 | | | | (0.32 | ) | | | (0.10 | ) | | | (0.42 | ) |
2019 | | | 15.92 | | | | 0.41 | | | | 1.14 | | | | 1.55 | | | | (0.43 | ) | | | - | | | | (0.43 | ) |
66
| | | | |
| | |
| Semiannual Report • 2024 | | | | |
| | | | | | | | | | | | | | | | | | | | | | | | | | |
| | | | | | |
Net Asset
Value
End of
Period | | | Total
Overall
Return | | | Net Assets
End of
Period
(000s) | | | Ratio of
Gross
Expenses to
Average
Net Assets | | | Ratio of Net Expenses to
Average Net Assets
(Net of Waiver and
Expense
Offset Arrangements)(b),(c) | | | Ratio of
Net Investment
Income (Loss)
to Average Net
Assets | | | Portfolio
Turnover
Rate | |
| | |
|
$14.60 |
| | | (0.13 | )%(d) | | | $169,984 | | | | 0.61 | %(e) | | | 0.39 | %(e) | | | 3.81 | %(e) | | | 15.16 | % |
| | 14.89 | | | | 6.95 | | | | 161,471 | | | | 0.61 | | | | 0.39 | | | | 3.44 | | | | 48.72 | |
| | 14.40 | | | | (14.10 | ) | | | 146,034 | | | | 0.59 | | | | 0.45 | | | | 2.66 | | | | 58.67 | |
| | 17.22 | | | | (1.90 | ) | | | 233,649 | | | | 0.56 | | | | 0.45 | | | | 1.88 | | | | 31.29 | |
| | 18.01 | | | | 8.19 | | | | 163,671 | | | | 0.55 | | | | 0.45 | | | | 1.81 | | | | 37.77 | |
| | 17.04 | | | | 9.82 | | | | 69,923 | | | | 0.45 | | | | 0.45 | | | | 2.44 | | | | 53.98 | |
(a) Income (loss) from operations per share is based on average daily shares outstanding.
(b) Parnassus Investments has contractually limited expenses to an annualized rate of 0.82% for the Parnassus Core Equity Fund – Investor Shares, 0.84% for the Parnassus Growth Equity Fund – Investor Shares, 0.88% for the Parnassus Value Equity Fund – Investor Shares, 0.96% for the Parnassus Mid Cap Fund – Investor Shares, 0.80% for the Parnassus Mid Cap Growth Fund – Investor Shares and 0.58% for the Parnassus Fixed Income Fund – Investor Shares.
(c) Parnassus Investments has contractually limited expenses to an annualized rate of 0.61% for the Parnassus Core Equity Fund – Institutional Shares, 0.63% for the Parnassus Growth Equity Fund – Institutional Shares, 0.65% for the Parnassus Value Equity Fund – Institutional Shares, 0.75% for the Parnassus Mid Cap Fund – Institutional Shares, 0.68% for the Parnassus Mid Cap Growth Fund – Institutional Shares and 0.39% for the Parnassus Fixed Income Fund – Institutional Shares.
(d) Total Return is not annualized for periods less than one year.
(e) Annualized.
(f) The Parnassus Growth Equity Fund commenced operations on December 28, 2022, and the period shown is from December 28, 2022 through December 31, 2022.
(g) Amount less than $0.01.
67
| | | | |
| | |
| | | | Semiannual Report • 2024 |
Additional Information (unaudited)
Board of Trustees Consideration of Investment Advisory Agreements
Section 15(c) of the Investment Company Act of 1940, as amended (the “1940 Act”), requires that the Board of Trustees (the members thereof referred to herein as the “Trustees”) of the Parnassus Funds trust and the Parnassus Income Funds trust (the “Trusts”) meet to review and consider the continuation of the investment advisory agreements for the Parnassus Core Equity Fund, the Parnassus Growth Equity, the Parnassus Value Equity Fund, the Parnassus Mid Cap Fund, the Parnassus Mid Cap Growth Fund and the Parnassus Fixed Income Fund (each a “Fund” and, collectively, the “Funds”). In this regard, the Trustees who are not “interested persons” of the Trusts, as defined in the 1940 Act (the “Independent Trustees”), met on March 11, 2024 and March 26, 2024 to review and evaluate the continuation of the investment advisory agreements with Parnassus Investments, LLC (“Parnassus Investments” or the “Adviser”), and all of the Trustees, including the Independent Trustees, met on March 27, 2024 to review and evaluate the continuation of the investment advisory agreements. The Trustees, including the Independent Trustees, were provided with relevant information by the Adviser, as described below, and the Independent Trustees were assisted in their evaluation of the investment advisory agreements by independent legal counsel, from whom they received assistance and advice, including a written memorandum, regarding the legal standards applicable to the consideration of advisory arrangements and with whom they met separately in executive session on March 11, 2024 and March 26, 2024. In addition, the Trustees considered matters bearing on the management of the Funds and other arrangements at regular meetings throughout the year, including reviews of investment results and performance data at each regular meeting and periodic presentations from the Adviser.
Prior to approving the continuation of the investment advisory agreements, the Trustees, including the Independent Trustees, considered:
| | • | | The nature and quality of the investment advisory services provided by the Adviser, including the Adviser’s organization and operations, financial condition and stability and ownership structure; and the terms of the investment advisory agreements and how the services performed by the Adviser under the investment advisory agreements differ from those performed for other accounts. |
| | • | | A comparison of the fees and expenses of the Funds to other similar funds, including a comparison of the Funds’ total expenses and the total expense ratios. |
| | • | | A comparison of the fee structures of other accounts managed by the Adviser. |
| | • | | Whether economies of scale are recognized by the Funds, and whether existing breakpoints are appropriate. |
| | • | | The costs and profitability of the Funds to the Adviser. |
| | • | | The independence, expertise, care, and conscientiousness of the Board of Trustees. |
| | • | | Short-term and long-term investment performance of the Funds. |
| | • | | The other benefits to the Adviser from serving as investment adviser to the Funds (in addition to the advisory fee). |
The material considerations and determinations of the Trustees, including all of the Independent Trustees, are as follows:
Nature and Quality of Investment Advisory Services
The Trustees noted that Parnassus Investments supervises the investment portfolios of the Funds, directing the day-to-day management of the Funds’ portfolios, including the purchase and sale of investment securities and the monitoring of the environmental, social and governance (ESG) aspects of the Funds. The Trustees then discussed with management the nature of the investment process employed by Parnassus Investments, including the interplay of the ESG research in the process of selecting investments. They determined that, as the Adviser’s processes are team-based and research intensive, it is important to have sufficient knowledgeable personnel to effectively manage the Funds.
This led to a discussion with the Adviser on the personnel and other resources at Parnassus Investments, including the experience of senior management; the qualifications, tenure, background and responsibilities of the portfolio managers primarily responsible for the day-to-day portfolio management
68
| | | | |
| | |
| Semiannual Report • 2024 | | | | |
Additional Information (unaudited) (continued)
Board of Trustees Consideration of Investment Advisory Agreements (continued)
of the Funds; the qualifications of research analysts; and the personnel that manage the ESG aspect of the Funds. Based on this discussion, the Trustees concluded that Parnassus Investments is well staffed to conduct the research needed to meet the investment objectives of the Funds, as Parnassus Investments regularly reviews its staffing levels and has regularly added staff and resources to ensure the Funds are properly serviced.
In considering the nature, extent and quality of the services provided by Parnassus Investments, the Trustees reviewed written and oral reports and written responses prepared by Parnassus Investments describing the portfolio management, shareholder communication and servicing, prospective shareholder assistance and regulatory compliance services provided by Parnassus Investments to the Funds. The Trustees also considered a written report prepared by Broadridge, an independent provider of investment company data, comparing aspects of the portfolio management services provided by Parnassus Investments to similar services provided to a universe of comparable mutual funds (the “Universe”). The Trustees also considered the quality of the material service providers to the Funds, who provide administrative and distribution services on behalf of the Funds and are overseen by Parnassus Investments, and the overall reputation and capabilities of Parnassus Investments. Based on this review, the Trustees believe that Parnassus Investments provides high quality services to the Funds, as the Funds generally compare favorably to the Universe and have generally performed well.
The Independent Trustees evaluated the ability of Parnassus Investments, based on its financial condition, resources, reputation and other attributes to attract and retain qualified investment professionals, including research, advisory and supervisory personnel. They concluded that Parnassus Investments is a well-respected firm that is able to attract qualified professionals. The Independent Trustees further considered the compliance programs and compliance records of Parnassus Investments, noting that the Funds have a robust compliance program, and that Parnassus Investments regularly uses its own resources to help enhance the Funds compliance program. In addition, the Independent Trustees took into account the administrative services provided to the Funds by Parnassus Investments, noting that the Funds’ filings are timely filed and that board materials are provided well in advance of meetings.
Overall, the Trustees concluded that they were satisfied with the nature, extent and quality of the investment advisory services provided to the Funds by Parnassus Investments, and that the nature and extent of the services provided by Parnassus Investments are appropriate to assure that each Fund’s operations are conducted in compliance with applicable laws, rules and regulations.
Comparative Fees and Expenses
The Trustees then discussed with management the variables, in addition to the management fees, such as administrative and transaction fees, that impact costs to the shareholders of the Funds. They also reviewed reports comparing each Fund’s expense ratio to that of the applicable Universe and concluded overall that each Fund’s expense ratio was within the range of its respective Universe. The Trustees also reviewed reports comparing the advisory fees paid by each Fund to that of the applicable Universe and concluded overall that the advisory fee paid by each Fund was within the range of its respective Universe.
As part of the discussion with management, the Trustees ensured that they understood and were comfortable with the criteria used by Parnassus Investments to determine the mutual funds that make up the Universes for purposes of the 15(c) Materials. Overall, the Trustees concluded that the Funds’ fees are reasonable in relation to the nature and quality of the services provided, and are reasonable when compared to the applicable Universe.
Comparison of Fee Structures of Other Accounts
The Trustees then inquired of management regarding the distinction between the services performed by Parnassus Investments for institutional separate accounts and those performed by Parnassus Investments for the Funds. Parnassus Investments noted that the management of the Funds involves more comprehensive and substantive duties than the management of institutional separate accounts. Specifically, Parnassus Investments noted the following:
| | • | | Parnassus Investments provides tailored investment advisory services to the Funds in order to accommodate the cash flow volatility presented by the purchases and redemptions of shareholders. |
| | • | | With regard to the Funds, Parnassus Investments attempts to serve the needs of thousands of |
69
| | | | |
| | |
| | | | Semiannual Report • 2024 |
Additional Information (unaudited) (continued)
Board of Trustees Consideration of Investment Advisory Agreements (continued)
| | | accounts, ranging from direct accounts holding a few thousand dollars to the large omnibus accounts of intermediaries who in turn service thousands of large and small accounts. |
| | • | | Parnassus Investments maintains a robust shareholder communication effort for the Funds to reach shareholders through direct contact, through intermediaries, or via the financial press. |
| | • | | Parnassus Investments coordinates with the Funds’ Chief Compliance Officer and other service providers to ensure compliance with regulatory regimens imposed by Federal law and the Internal Revenue Code. |
| | • | | Separate accounts do not require the same level of services and oversight, nor do they present the same compliance risk. |
The Trustees concluded that the services performed by Parnassus Investments for the Funds require a higher level of service and oversight than the services performed by Parnassus Investments for institutional separate accounts, and that the services performed by Parnassus Investments for the Funds present a higher level of compliance and litigation risk to Parnassus Investments. Based on this determination, the Trustees believe that the differential in advisory fees between the Funds and the institutional separate accounts are reasonable, and concluded that the fee rates charged to the Funds in comparison to those charged to Parnassus Investments’ other clients are reasonable.
In addition to the above, the Trustees discussed with management the fact that increasingly investors in the Funds invest through brokerage platforms (intermediaries), with fewer investors going directly to the Funds’ transfer agent. The Trustees noted that in connection with the intermediaries, Parnassus Investments absorbs all costs in excess of the fees paid by the Funds for sub-transfer agent services performed by the intermediaries. As a result, the cost of obtaining, retaining and servicing shareholders for the Funds is significantly higher than the costs for separately managed accounts. The Trustees concluded that the payment of the intermediary service fees by Parnassus Investments further justifies the differential in advisory fees between the Funds and the institutional separate accounts.
Economies of Scale
The Trustees noted that the investment advisory fee for each Fund contains a number of breakpoints in an
effort to reflect economies of scale that might be realized as each Fund grows. The Independent Trustees also noted that actual or potential economies of scale will be reasonably shared with the Fund shareholders through these breakpoints, fee waivers and expense reimbursement arrangements applicable to the Funds. The Trustees concluded that the current fees and breakpoints were appropriate. They also concluded that the Adviser’s ongoing and significant investments into the Funds’ portfolio management, research and ESG teams result in a sharing of economies of scale that benefits the Funds and their shareholders.
Costs and Profitability
The Trustees reviewed a report of the costs of services provided, and the profits realized, by Parnassus Investments from its relationship with each Fund, and concluded, on a Fund-by-Fund basis, that such profits were reasonable and not excessive when compared to profitability guidelines set forth in relevant court cases. The Trustees also considered the impact of the intermediary service fees on the profitability of Parnassus Investments, and the resources and revenues that Parnassus Investments has put into managing and distributing the Funds, and concluded that this further supported the conclusion that the level of profitability realized by Parnassus Investments from its provision of services to the Funds is reasonable.
Performance
The Trustees compared the performance of each of the Funds to benchmark indices over various periods of time ended December 31, 2023 and to the Universe of comparable mutual funds as determined by Broadridge. They noted, on a comparative basis, that the performance of the Parnassus Value Equity Fund over 1, 5 and 10 years, the Parnassus Mid Cap Growth Fund over the 1 year and the Parnassus Fixed Income Fund over 1 and 5 years have outperformed their benchmark, while the Parnassus Core Equity and Parnassus Mid Cap Fund, and over 1, 5 and 10 years underperformed their benchmark. The Parnassus Growth Equity Fund, with inception date of December 28, 2022, outperformed its benchmark over the 1 year period. The Trustees also reviewed how each Fund’s performance compared to its comparable mutual funds in the Universe and determined that each Fund’s performance has been within a reasonable range of its comparable mutual funds in the Universe.
70
| | | | |
| | |
| Semiannual Report • 2024 | | | | |
Additional Information (unaudited) (continued)
Board of Trustees Consideration of Investment Advisory Agreements (continued)
The Trustees discussed how the Funds’ performance compares when the ESG component is factored into the analysis, and determined that the Funds’ performance is good. Based on the Trustees’ review of the Funds’ comparative performance, the Trustees concluded that the overall performance of the Funds warranted the continuation of the investment advisory agreements.
The Trustees noted that at each quarterly meeting, the Trustees review reports comparing the investment performance of the Funds to various indices. Based on the information provided at this meeting and the information and quarterly discussions regarding the Funds’ investment performance, the Trustees believe that Parnassus Investments manages the Funds in a manner that is materially consistent with their stated investment objective and style. The Trustees concluded that the Funds’ investment performance had generally been good, particularly when factoring in the ESG component, and that they have confidence in the investment personnel of Parnassus Investments managing the Funds.
Fall-Out Benefits
The Trustees then considered other benefits to Parnassus Investments from serving as adviser to the Funds (in addition to the advisory fee). The Trustees noted that Parnassus Investments derives ancillary benefits from its association with the Funds in the form of proprietary and third-party research products and services received from broker dealers that execute portfolio trades for the Funds. The Trustees determined such products and services have been used for legitimate purposes relating to the Funds by providing assistance in the investment decision-making process. The Trustees concluded that the other benefits realized by Parnassus Investments from its relationship with the Funds were reasonable.
Conclusion
After reviewing the 15(c) Materials, management’s presentation, as well as other information regularly provided at the Board’s quarterly meetings throughout the year regarding the quality of services provided by
Parnassus Investments, the performance of the Funds, expense information, regulatory compliance issues, trading information and related matters and other factors deemed relevant by the Trustees, the Trustees, including all of the Independent Trustees, approved the continuation of the investment advisory agreements.
The Trustees noted that all of the factors above were considered by the Board as a whole, and separately by the Independent Trustees meeting in executive sessions. The factors were viewed in their totality by the Trustees, with no single factor being the principal or determinative factor in the Board’s determination of whether to approve the continuation of the investment advisory agreements.
Proxy Disclosures
Parnassus proxy voting policies and procedures are available, without charge, on our website (www.parnassus.com), on the Securities and Exchange Commission’s website (www.sec.gov) and by calling us at (800) 999-3505. The Funds file a proxy voting record with the Securities and Exchange Commission for the 12 months ended June 30. The most recent report is available by calling Parnassus or it may be obtained from the Securities and Exchange Commission’s website or the Parnassus website.
Quarterly Portfolio Schedule
The Funds file their complete schedule of portfolio holdings with the Securities and Exchange Commission for the first and third quarters of each fiscal year as an exhibit to their reports on Form N-PORT. The Funds’ Form N-PORT reports are available on the Securities and Exchange Commission’s web site at http://www.sec.gov. The Funds publish their entire portfolio holdings information as of the end of each month and quarter on the Parnassus Funds’ website (www.parnassus.com). This information is available to anyone who visits the website and is updated on or about ten business days following the end of each month. Holdings information will remain on the website until updated for the subsequent time period.
71
Cash Flow (free cash flow) is a measure of the amount of money coming into and going out of a company. Credit Spread is the difference in yield between two bonds of the same maturity. Duration is a measure of the sensitivity of the price (the value of principal) of a fixed income investment to a change in interest rates. Duration is expressed as a number of years. Rising interest rates mean falling bond prices, while declining interest rates mean rising bond prices. Investment Grade refers to the quality of an issuer’s credit. The term usually refers to bonds rated BBB or higher by an independent rating agency. A rating below BBB is considered to be noninvestment grade. The 30-Day SEC Yield is computed under an SEC standardized formula based on net income earned over the past 30 days. It is a “subsidized” yield, which means it includes contractual expense reimbursements and it would be lower without those reimbursements. The Unsubsidized 30-Day SEC Yield is computed under an SEC standardized formula based on net income earned over the past 30 days. It excludes contractual expense reimbursements, resulting in a lower yield. Price/Book (P/B) Ratio is the ratio of a stock’s latest closing price divided by its book value per share.
Price/Earnings (P/E) Ratio is a ratio of a stock’s current price to its per-share earnings over the past 12 months (or “trailing” 12 months); whereas, a Forward Price/Earnings (PE) Ratio is calculated using forecasted earnings.
The Yield to Worst (“YTW”) is the lowest potential bond yield received without the issuer defaulting, it assumes the worst-case scenario, or earliest redemption possible under terms of the bond and the Forward Earnings is an estimate of a company’s earnings for upcoming periods, usually the completion of the current fiscal year and often the following fiscal year whereas, a Forward Sales represents an estimate of a company’s expected sales over the next 12 months.
The Russell 1000® Growth Index, the Russell 1000® Value Index, the Russell Midcap® Index, the Russell Midcap® Growth Index, the Bloomberg U.S. Aggregate Bond Index, and the Standard & Poor’s 500 Composite Stock Price Index (the S&P 500 Index) are widely recognized indices of common stock prices. Index performance includes the reinvestment of dividends and capital gains. An index reflects no deductions for fees, expenses, or taxes. An investor cannot invest directly in an index.
The Russell 1000 Growth Index measures the performance of the large cap growth segment of the U.S. equity universe. It includes those Russell 1000 companies with relatively higher price-to-book ratios and higher expected earnings growth rates.
The Russell 1000 Value Index measures the performance of the large-cap value segment of the U.S. equity universe. It includes those Russell 1000 companies with lower price-to-book ratios and lower forecasted growth rates.
The Russell Midcap Index is a market capitalization-weighted index that measures the performance of the 800 smallest companies in the Russell 1000 Index, which represents approximately 30% of the total market capitalization of the Russell 1000 Index.
The Russell Midcap Growth Index measures the performance of the midcap growth segment of the US equity universe. It includes those Russell Midcap Index companies with higher price-to book ratios and higher forecasted growth values.
The Bloomberg U.S. Aggregate Bond Index is a broad-based, widely recognized index of fixed income security prices.
The S&P 500 Index is an unmanaged index of 500 common stocks primarily traded on the New York Stock Exchange, weighted by market capitalization. The S&P 500 Index is a product of S&P Dow Jones Indices LLC and/or its affiliates and has been licensed for use by Parnassus Investments. Copyright © 2024 by S&P Dow Jones Indices LLC, a subsidiary of McGraw-Hill Financial, Inc., and/or its affiliates. All rights reserved. Redistribution, reproduction and/or photocopying in whole or in part are prohibited without written permission of S&P Dow Jones Indices LLC. For more information on any of S&P Dow Jones Indices LLC’s indices please visit www.spdji.com. S&P® is a registered trademark of Standard & Poor’s Financial Services LLC and Dow Jones® is a registered trademark of Dow Jones Trademark Holdings LLC. Neither S&P Dow Jones Indices LLC, Dow Jones Trademark Holdings LLC, their affiliates nor their third party licensors make any representation or warranty, express or implied, as to the ability of any index to accurately represent the asset class or market sector that it purports to represent and neither S&P Dow Jones Indices LLC, Dow Jones Trademark Holdings LLC, their affiliates nor their third party licensors shall have any liability for any errors, omissions, or interruptions of any index or the data included therein.
Earnings growth is not representative of the fund’s future performance.
Mutual fund investing involves risk, and loss of principal is possible. The Fund’s share price may change daily based on the value of its security holdings. Stock markets can be volatile, and stock values fluctuate in response to the asset levels of individual companies and in response to general U.S. and international market and economic conditions. In addition to large cap companies, the Fund may invest in small and/or mid cap companies, which can be more volatile than large cap firms. Security holdings in the fund can vary significantly from broad market indexes.
Parnassus Fixed Income Fund: Bond prices are inversely related to interest rates. As interest rates drop, bond prices will increase, and as interest rates go up, the price of bonds will decrease. A security’s value may also be affected by the possibility that issuers of debt obligations will not pay the Fund interest or principal, or that their credit rating may be downgraded by a ratings agency. In addition, up to 20% of the Fund’s total net assets may be invested in convertible securities, which may not have an investment-grade rating. This would make them riskier than securities with an investment-grade rating.
Parnassus Growth Equity Fund and Parnassus Mid Cap Growth Fund: The adviser may be wrong in its assessment of a company’s potential for growth, and the growth stocks the fund holds may not grow as the advisor anticipates. In addition, there are periods when investing in growth stocks falls out of favor with investors and these stocks may underperform.
Parnassus Mid Cap and Parnassus Mid Cap Growth Funds: The Fund invests in small and/or mid cap growth companies, which are generally riskier than larger companies, and the Fund’s share price may be more volatile than funds that invest in larger companies.
ENVIRONMENTAL, SOCIAL, AND GOVERNANCE GUIDELINES: The Fund evaluates financially material ESG factors as part of the investment decision-making process, considering a range of impacts they may have on future revenues, expenses, assets, liabilities and overall risk. The Fund also utilizes active ownership to encourage more sustainable business policies and practices and greater ESG transparency. Active ownership strategies include proxy voting, dialogue with company management and sponsorship of shareholder resolutions, and public policy advocacy. There is no guarantee that the ESG strategy will be successful.
Performance data quoted represent past performance and are no guarantee of future returns. Current performance may be lower or higher than the performance data quoted, and current performance information to the most recent month end is available on the Parnassus website (www.parnassus.com). Investment return and principal value will fluctuate, so an investor’s shares, when redeemed, may be worth more or less than their original principal cost.
Before investing, an investor should carefully consider the investment objectives, risks, charges and expenses of the Fund and should carefully read the prospectus or summary prospectus, which contain this and other information. The prospectus or summary prospectus can be obtained on the Parnassus website or by calling (800) 999-3505.
Investment Adviser
Parnassus Investments, LLC
1 Market Street, Suite 1600
San Francisco, CA 94105
Independent Registered Public Accounting Firm
PricewaterhouseCoopers LLP
405 Howard Street, Suite 600
San Francisco, CA 94105
Legal Counsel
Foley and Lardner LLP
777 E. Wisconsin Ave.
Milwaukee, WI 53202
Distributor
Parnassus Funds Distributor, LLC
Three Canal Plaza, Suite 100
Portland, ME 04101

Sign up for electronic delivery of prospectuses, shareholder reports
and account statements at www.parnassus.com
If you do not hold your account directly with Parnassus, please contact
the firm that holds your account to inquire about electronic delivery.

© 2024 Parnassus Investments, LLC. All rights reserved. PARNASSUS, PARNASSUS INVESTMENTS, and PARNASSUS FUNDS are federally registered trademarks of Parnassus Investments, LLC. The Parnassus Funds are distributed by Parnassus Funds Distributor, LLC.
1 Market Street, Suite 1600 San Francisco, CA 94105^(800) 999-3505^www.parnassus.com
Item 8. Changes in and Disagreements with Accountants for Open-End Management Investment Companies.
Not applicable
Item 9. Proxy Disclosures for Open-End Management Companies.
This information is included in materials filed under Item 7 of this form.
Item 10. Remuneration Paid to Directors, Officers, and Others of Open-End Management Companies.
This information is included in materials filed under Item 7 of this form.
Item 11. Statement Regarding Basis for Approval of Investment Advisory Contract.
This information is included in materials filed under Item 7 of this form.
Item 12. Disclosure of Proxy Voting Policies and Procedures for Closed-End Management Investment Companies.
Not applicable.
Item 13. Portfolio Managers of Closed-End Management Investment Companies.
Not applicable.
Item 14. Purchases of Equity Securities by Closed-End Management Investment Company and Affiliated Purchasers.
Not applicable.
Item 15. Submission of Matters to a Vote of Security Holders.
Not applicable.
Item 16. Controls and Procedures.
| (a) | The registrant’s certifying officers have reasonably designed such disclosure controls and procedures to ensure material information relating to the registrant is made known to them by others, particularly during the period in which this report is being prepared. The registrant’s certifying officers have determined that the registrant’s disclosure controls and procedures are effective based on their evaluation of these controls and procedures as of a date within 90 days prior to the filing date of this report. |
| (b) | There were no significant changes in the registrant’s internal controls over financial reporting, or in other factors that could significantly affect these controls, that occurred during the registrant’s fiscal half-year, including any corrective actions with regard to significant deficiencies and material weaknesses. |
Item 17. Disclosure of Securities Lending Activities for Closed-End Management Investment Companies.
Not applicable.
Item 18. Recovery of Erroneously Awarded Compensation.
Not applicable.
Item 19. Exhibits.
SIGNATURES
Pursuant to the requirements of the Securities Exchange Act of 1934 and the Investment Company Act of 1940, the Registrant has duly caused this report to be signed on its behalf by the undersigned, thereunto duly authorized.
| | |
(Registrant) Parnassus Funds and Parnassus Income Funds |
| |
| By: | | (Signature and Title) |
|
/s/ Benjamin E. Allen |
| Benjamin E. Allen |
| Title: | | President and Principal Executive Officer |
| Date: | | August 9, 2024 |
Pursuant to the requirements of the Securities Exchange Act of 1934 and the Investment Company Act of 1940, this report has been signed below by the following persons on behalf of the Registrant and in the capacities and on the dates indicated.
| | |
| By: (Signature and Title) |
|
/s/ Benjamin E. Allen |
| Benjamin E. Allen |
| Title: | | President and Principal Executive Officer |
| Date: | | August 9, 2024 |
| |
| By: | | (Signature and Title) |
|
/s/ Marc C. Mahon |
| Marc C. Mahon |
| Title: | | Treasurer and Principal Financial Officer |
| Date: | | August 9, 2024 |