UNITED STATES
SECURITIES AND EXCHANGE COMMISSION
WASHINGTON, D.C. 20549
FORM N-CSR
CERTIFIED SHAREHOLDER REPORT OF REGISTERED
MANAGEMENT INVESTMENT COMPANIES
Investment Company Act file number:
Parnassus Funds (811-04044) and Parnassus Income Funds (811-06673)
Parnassus Funds
Parnassus Income Funds
(Exact name of registrant as specified in charter)
1 Market Street, Suite 1600, San Francisco, California 94105
(Address of principal executive offices) (Zip Code)
Marc C. Mahon
Parnassus Funds
Parnassus Income Funds
1 Market Street, Suite 1600, San Francisco, California 94105
(Name and address of agent for service)
Registrant’s telephone number, including area code: (415) 778-0200
Date of fiscal year end: December 31
Date of reporting period: December 31, 2024
Form N-CSR is to be used by management investment companies to file reports with the Commission not later than 10 days after the transmission to stockholders of any report that is required to be transmitted to stockholders under Rule 30e-1 under the Investment Company Act of 1940 (17 CFR 270.30e-1). The Commission may use the information provided on Form N-CSR in its regulatory, disclosure review, inspection, and policymaking roles.
A registrant is required to disclose the information specified by Form N-CSR, and the Commission will make this information public. A registrant is not required to respond to the collection of information contained in Form N-CSR unless the Form displays a currently valid Office of Management and Budget (“OMB”) control number. Please direct comments concerning the accuracy of the information collection burden estimate and any suggestions for reducing the burden to Secretary, Securities and Exchange Commission, 450 Fifth Street, NW, Washington, DC 20549-0609. The OMB has reviewed this collection of information under the clearance requirements of 44 U.S.C. § 3507.
Item 1. Report to Stockholders.
| | (a) | The following is a copy of the report transmitted to shareholders pursuant to Rule 30e-1 under the Investment Company Act of 1940 (17 CFR 270.30e-1). |
| | (b) | Include a copy of each notice transmitted to stockholders in reliance on Rule 30e-3 under the Act (17 CFR 270.30e-3) that contains disclosures specified by paragraph (c)(3) of that rule. |
Parnassus Growth Equity Fund
Annual Shareholder Report - December 31, 2024
Parnassus Growth Equity Fund (the "Fund") offers a concentrated portfolio of U.S. large-cap stocks with the potential to benefit from secular trends at attractive valuations.
This annual shareholder report contains important information about the Fund for the period of January 1, 2024 to December 31, 2024.
You can find additional information about the fund at www.parnassus.com. You can also request this information by contacting us at 800-999-3505.
What was the Fund's cost for the year?
(based on hypothetical $10,000 investment)
| Class name | Cost of a $10,000 investment | Cost paid as a % of a $10,000 investment |
|---|
| Investor Shares | $95 | 0.84% |
|---|
How did the fund perform?
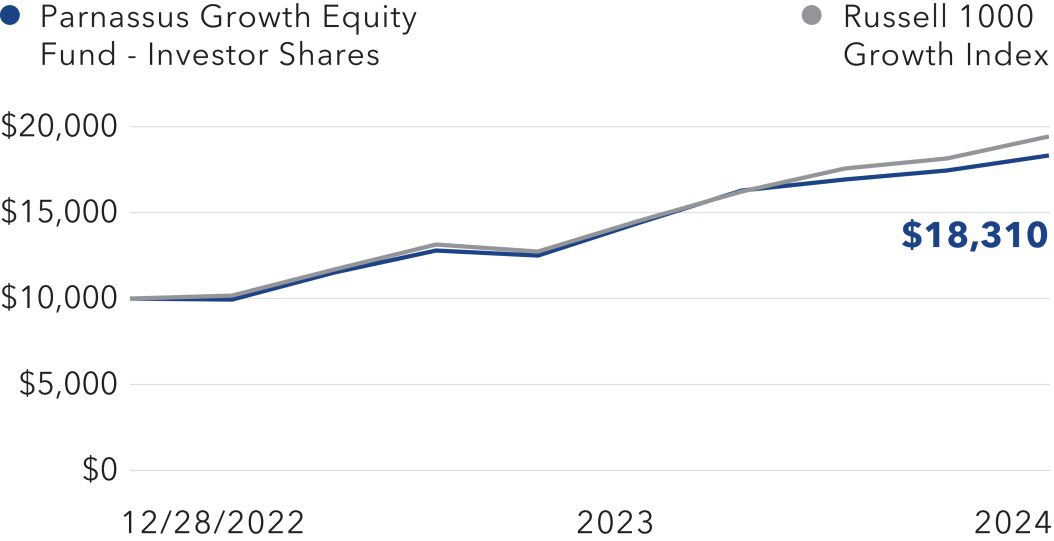
Parnassus Growth Equity Fund (Investor Shares) returned 26.85%, (net of fees) for the year, underperforming the Russell 1000 Growth Index’s 33.36%. Stock selection in the Information Technology, Consumer Discretionary and Communication Services sectors held back relative returns. Conversely, stock selection in the Health Care sector and both stock selection and an underweight in the Consumer Staples sector buoyed relative performance.
We continue to maintain balanced portfolio positioning in favor of increasingly relevant, competitively advantaged businesses that are trading at attractive valuations.
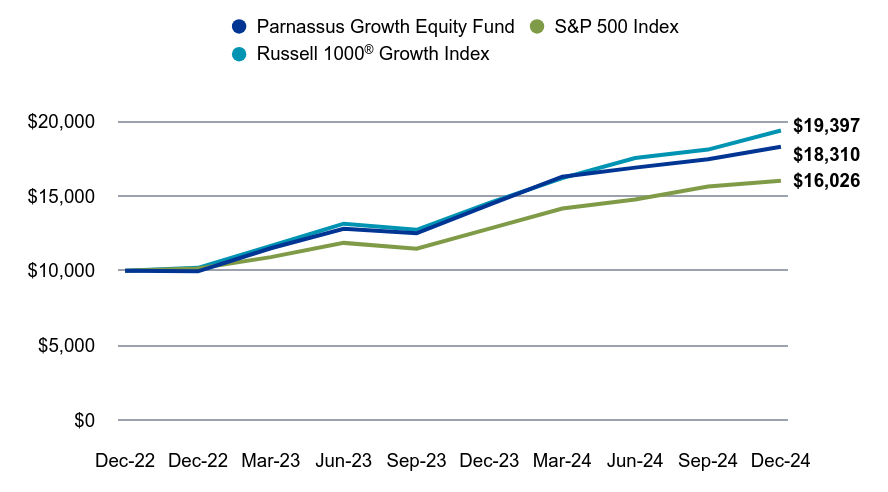
Value on December 31, 2024 of $10,000 invested on December 28, 2022.
| Parnassus Growth Equity Fund | S&P 500 Index | Russell 1000® Growth Index |
|---|
| | | |
|---|
| Dec-22 | $10,000 | $10,000 | $10,000 |
|---|
| Dec-22 | $9,960 | $10,151 | $10,194 |
|---|
| Mar-23 | $11,507 | $10,912 | $11,659 |
|---|
| Jun-23 | $12,813 | $11,866 | $13,152 |
|---|
| Sep-23 | $12,507 | $11,477 | $12,741 |
|---|
| Dec-23 | $14,434 | $12,819 | $14,545 |
|---|
| Mar-24 | $16,298 | $14,172 | $16,205 |
|---|
| Jun-24 | $16,908 | $14,779 | $17,556 |
|---|
| Sep-24 | $17,463 | $15,649 | $18,116 |
|---|
| Dec-24 | $18,310 | $16,026 | $19,397 |
|---|
The chart shows the growth in value of a hypothetical $10,000 investment since inception and does not reflect the deduction of taxes a shareholder would pay on fund distributions or the redemption of fund shares. The Fund commenced operations on December 28, 2022.
The fund’s past performance is not a good predictor of how the fund will perform in the future. The graph and table do not reflect the deduction of taxes that a shareholder would pay on fund distributions or redemption of fund shares.
| Total Net Assets | $63,702,581 |
|---|
| # of Portfolio Holdings | 42 |
|---|
| Portfolio Turnover Rate | 34.89% |
|---|
| Advisory Fees Paid | $85,796 |
|---|
Average Annual Total Returns (%)
| 1 Year | Since Inception |
|---|
| Parnassus Growth Equity Fund - Investor Shares (Incp: December 28, 2022) | 26.85% | 35.15% |
|---|
| S&P 500 Index | 25.02% | 26.47% |
|---|
Russell 1000® Growth Index | 33.36% | 39.08% |
|---|
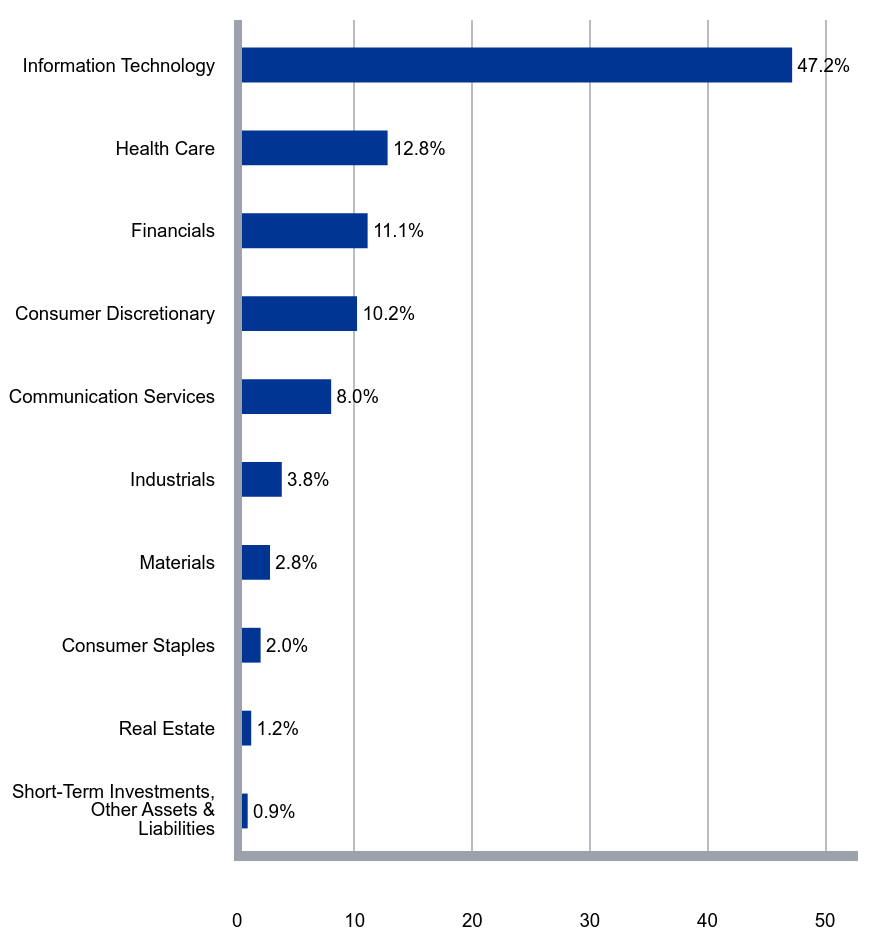
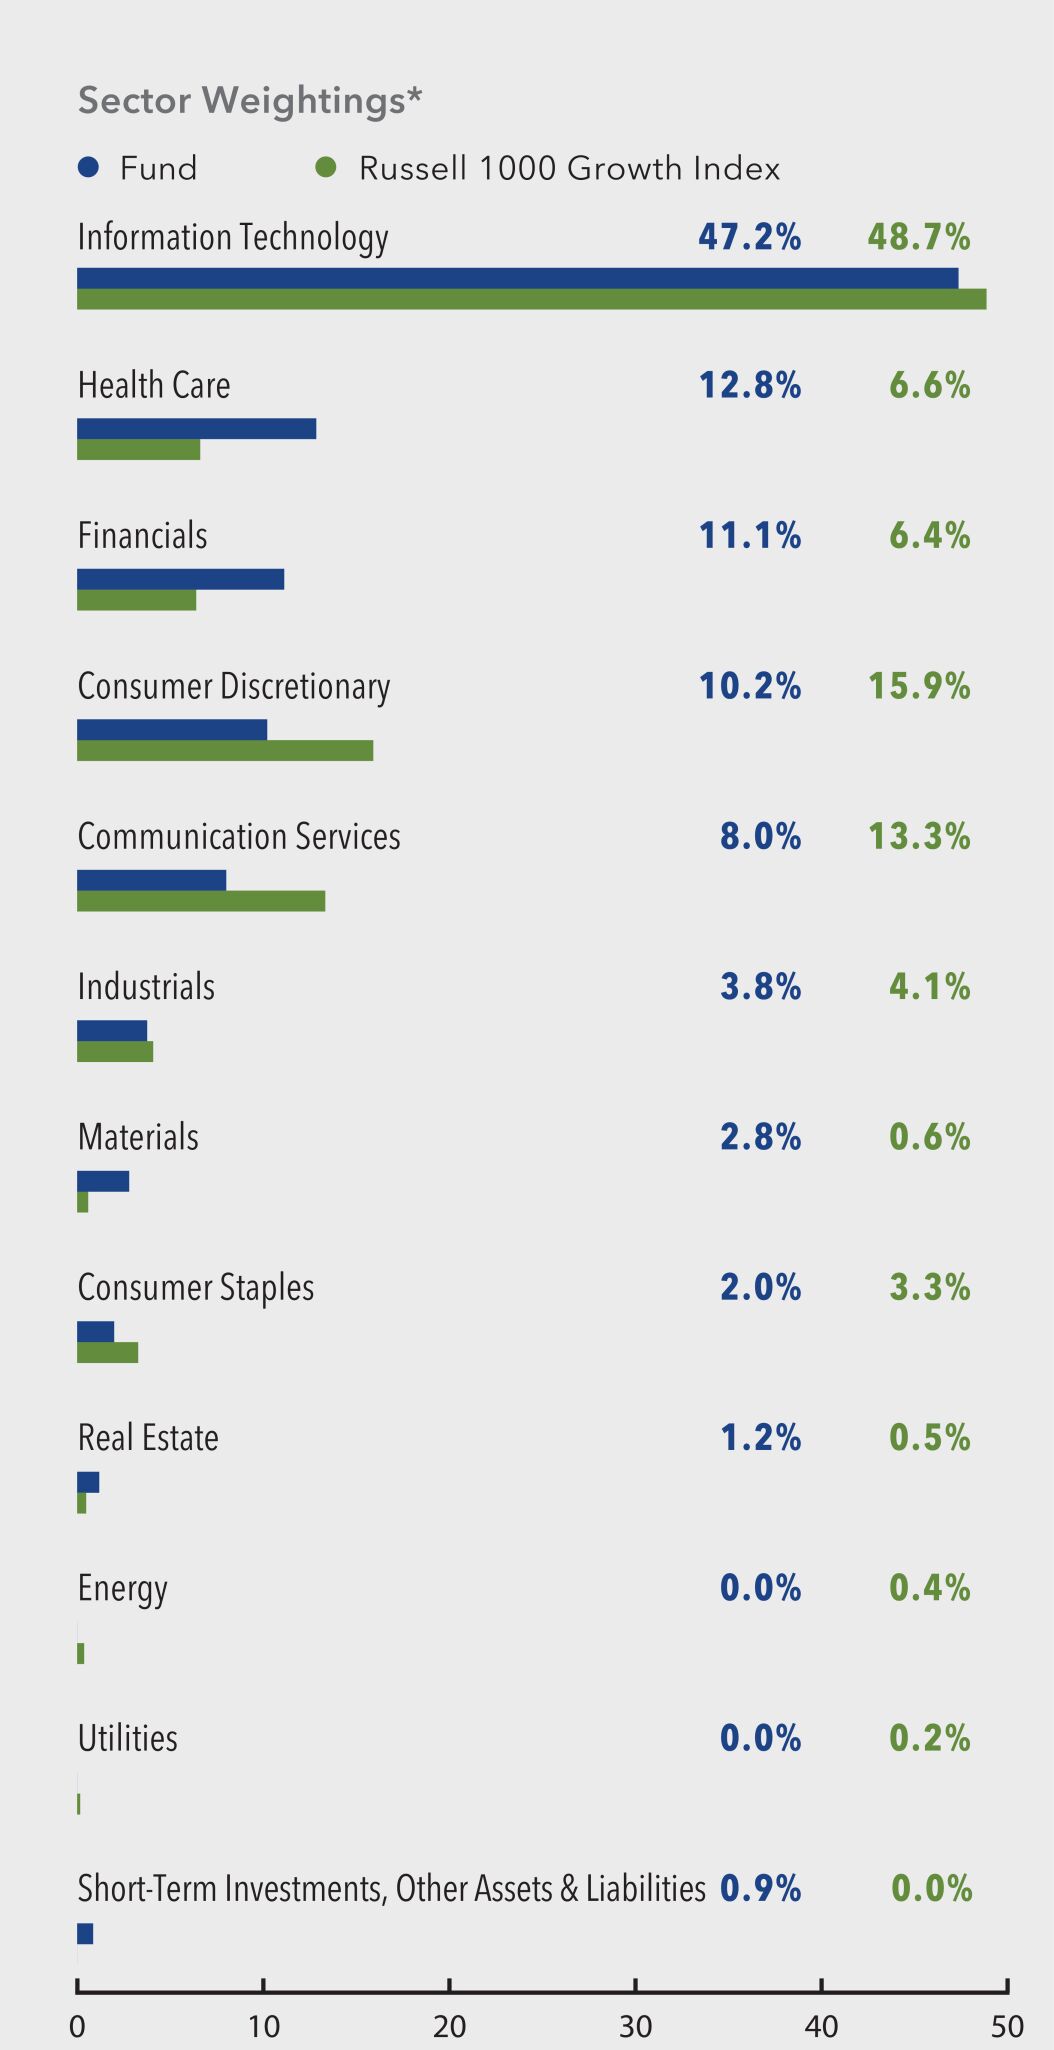
What did the Fund invest in?
Parnassus Growth Equity Fund invests selectively in about 40 U.S. large-cap equity securities. The Fund pursues high quality companies with increasing relevancy, durable competitive advantages, strong management teams and sustainable business practices. It favors leading, innovative companies positioned to capitalize on secular trends.
| Value | Value |
|---|
| Short-Term Investments, Other Assets & Liabilities | 0.9% |
| Real Estate | 1.2% |
| Consumer Staples | 2.0% |
| Materials | 2.8% |
| Industrials | 3.8% |
| Communication Services | 8.0% |
| Consumer Discretionary | 10.2% |
| Financials | 11.1% |
| Health Care | 12.8% |
| Information Technology | 47.2% |
| Microsoft Corp. | 9.0% |
| NVIDIA Corp. | 8.9% |
| Alphabet Inc., Class A | 6.4% |
| Amazon.com Inc. | 4.8% |
| Apple Inc. | 4.8% |
| Broadcom Inc. | 4.8% |
| Visa Inc., Class A | 4.6% |
| Salesforce Inc. | 3.2% |
| Eli Lilly & Co. | 2.9% |
| Natera Inc. | 2.4% |
Parnassus Growth Equity Fund
Annual Shareholder Report - December 31, 2024
If you wish to view additional information about the Fund; including, but not limited to, financial statements or holdings, please call us or visit our website:
Phone: 800-999-3505
Website: www.parnassus.com/literature-and-forms/fund-information
For purposes of categorizing securities for diversification requirements under the Investment Company Act, the Fund uses industry classifications that are more specific than those used for the chart.
Portfolio characteristics and holdings are subject to change periodically.
* The holding tables and charts above represent percentage based on Total Net Assets.
No material changes to the Fund in the last reporting year.
Change in or Disagreements with Accountants
There have been no changes to or disagreements with the accountants in the last reporting year.
© 2025 Parnassus Investments, LLC. All rights reserved. PARNASSUS, PARNASSUS INVESTMENTS, and PARNASSUS FUNDS are federally registered trademarks of Parnassus Investments, LLC.
If you wish to receive a copy of this document at a new address, contact 800-999-3505.
Parnassus Growth Equity Fund
Class - Institutional Shares
Annual Shareholder Report - December 31, 2024
Parnassus Growth Equity Fund (the "Fund") offers a concentrated portfolio of U.S. large-cap stocks with the potential to benefit from secular trends at attractive valuations.
This annual shareholder report contains important information about the Fund for the period of January 1, 2024 to December 31, 2024.
You can find additional information about the fund at www.parnassus.com. You can also request this information by contacting us at 800-999-3505.
What was the Fund's cost for the year?
(based on hypothetical $10,000 investment)
| Class name | Cost of a $10,000 investment | Cost paid as a % of a $10,000 investment |
|---|
| Institutional Shares | $72 | 0.63% |
|---|
How did the fund perform?
Parnassus Growth Equity Fund (Institutional Shares) returned 27.13%, (net of fees) for the year, underperforming the Russell 1000 Growth Index’s 33.36%. Stock selection in the Information Technology, Consumer Discretionary and Communication Services sectors held back relative returns. Conversely, stock selection in the Health Care sector and both stock selection and an underweight in the Consumer Staples sector buoyed relative performance.
We continue to maintain balanced portfolio positioning in favor of increasingly relevant, competitively advantaged businesses that are trading at attractive valuations.
Value on December 31, 2024 of $10,000 invested on December 28, 2022.
| Parnassus Growth Equity Fund | S&P 500 Index | Russell 1000® Growth Index |
|---|
| | | |
|---|
| Dec-22 | $10,000 | $10,000 | $10,000 |
|---|
| Dec-22 | $9,960 | $10,151 | $10,194 |
|---|
| Mar-23 | $11,513 | $10,912 | $11,659 |
|---|
| Jun-23 | $12,827 | $11,866 | $13,152 |
|---|
| Sep-23 | $12,527 | $11,477 | $12,741 |
|---|
| Dec-23 | $14,460 | $12,819 | $14,545 |
|---|
| Mar-24 | $16,341 | $14,172 | $16,205 |
|---|
| Jun-24 | $16,959 | $14,779 | $17,556 |
|---|
| Sep-24 | $17,536 | $15,649 | $18,116 |
|---|
| Dec-24 | $18,384 | $16,026 | $19,397 |
|---|
The chart shows the growth in value of a hypothetical $10,000 investment since inception and does not reflect the deduction of taxes a shareholder would pay on fund distributions or the redemption of fund shares. The Fund commenced operations on December 28, 2022.
The fund’s past performance is not a good predictor of how the fund will perform in the future. The graph and table do not reflect the deduction of taxes that a shareholder would pay on fund distributions or redemption of fund shares.
| Total Net Assets | $63,702,581 |
|---|
| # of Portfolio Holdings | 42 |
|---|
| Portfolio Turnover Rate | 34.89% |
|---|
| Advisory Fees Paid | $85,796 |
|---|
Average Annual Total Returns (%)
| 1 Year | Since Inception |
|---|
| Parnassus Growth Equity Fund - Institutional Shares (Incp: December 28, 2022) | 27.13% | 35.42% |
|---|
| S&P 500 Index | 25.02% | 26.47% |
|---|
Russell 1000® Growth Index | 33.36% | 39.08% |
|---|
What did the Fund invest in?
Parnassus Growth Equity Fund invests selectively in about 40 U.S. large-cap equity securities. The Fund pursues high quality companies with increasing relevancy, durable competitive advantages, strong management teams and sustainable business practices. It favors leading, innovative companies positioned to capitalize on secular trends.
| Value | Value |
|---|
| Short-Term Investments, Other Assets & Liabilities | 0.9% |
| Real Estate | 1.2% |
| Consumer Staples | 2.0% |
| Materials | 2.8% |
| Industrials | 3.8% |
| Communication Services | 8.0% |
| Consumer Discretionary | 10.2% |
| Financials | 11.1% |
| Health Care | 12.8% |
| Information Technology | 47.2% |
| Microsoft Corp. | 9.0% |
| NVIDIA Corp. | 8.9% |
| Alphabet Inc., Class A | 6.4% |
| Amazon.com Inc. | 4.8% |
| Apple Inc. | 4.8% |
| Broadcom Inc. | 4.8% |
| Visa Inc., Class A | 4.6% |
| Salesforce Inc. | 3.2% |
| Eli Lilly & Co. | 2.9% |
| Natera Inc. | 2.4% |
Parnassus Growth Equity Fund
Class - Institutional Shares
Annual Shareholder Report - December 31, 2024
If you wish to view additional information about the Fund; including, but not limited to, financial statements or holdings, please call us or visit our website:
Phone: 800-999-3505
Website: www.parnassus.com/literature-and-forms/fund-information
For purposes of categorizing securities for diversification requirements under the Investment Company Act, the Fund uses industry classifications that are more specific than those used for the chart.
Portfolio characteristics and holdings are subject to change periodically.
* The holding tables and charts above represent percentage based on Total Net Assets.
No material changes to the Fund in the last reporting year.
Change in or Disagreements with Accountants
There have been no changes to or disagreements with the accountants in the last reporting year.
© 2025 Parnassus Investments, LLC. All rights reserved. PARNASSUS, PARNASSUS INVESTMENTS, and PARNASSUS FUNDS are federally registered trademarks of Parnassus Investments, LLC.
If you wish to receive a copy of this document at a new address, contact 800-999-3505.
Parnassus Value Equity Fund
Annual Shareholder Report - December 31, 2024
Parnassus Value Equity Fund (the "Fund") offers a concentrated portfolio of U.S. large-cap stocks that are attractively priced relative to their history or peers.
This annual shareholder report contains important information about the Fund for the period of January 1, 2024 to December 31, 2024.
You can find additional information about the fund at www.parnassus.com. You can also request this information by contacting us at 800-999-3505.
What was the Fund's cost for the year?
(based on hypothetical $10,000 investment)
| Class name | Cost of a $10,000 investment | Cost paid as a % of a $10,000 investment |
|---|
| Investor Shares | $93 | 0.88% |
|---|
How did the fund perform?
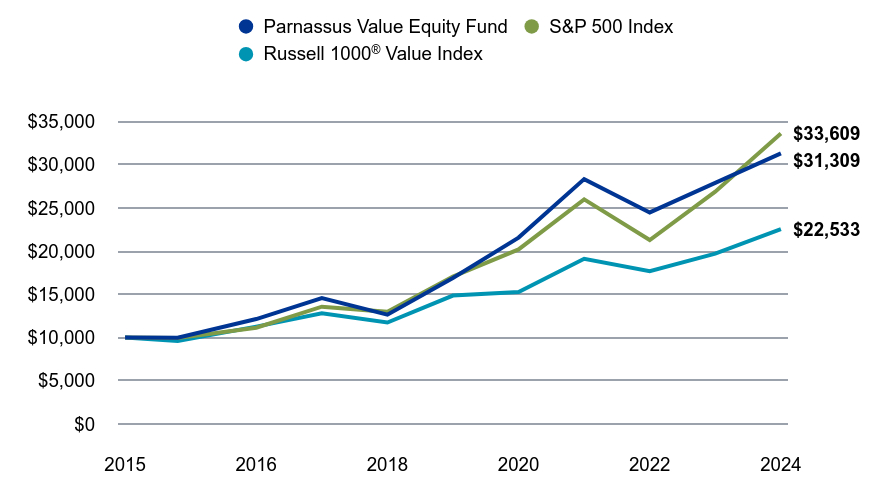
Parnassus Value Equity Fund (Investor Shares) returned 12.01% (net of fees), trailing the Russell 1000 Value Index’s 14.37% for the year. Stock selection in the Health Care sector notably weighed on relative performance. In contrast, strong stock selection in Real Estate boosted relative returns.
A continuation of the shift in investor sentiment toward more economically sensitive sectors could support a broadening of the stock market rally, especially in value stocks.
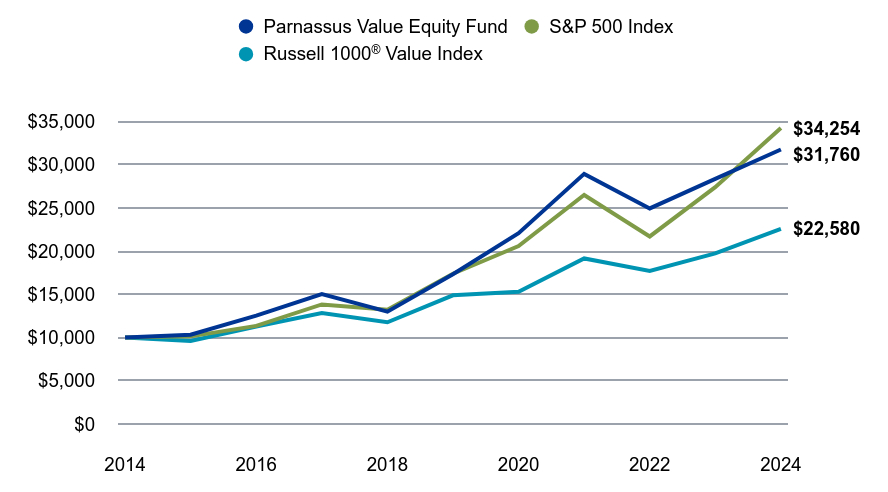
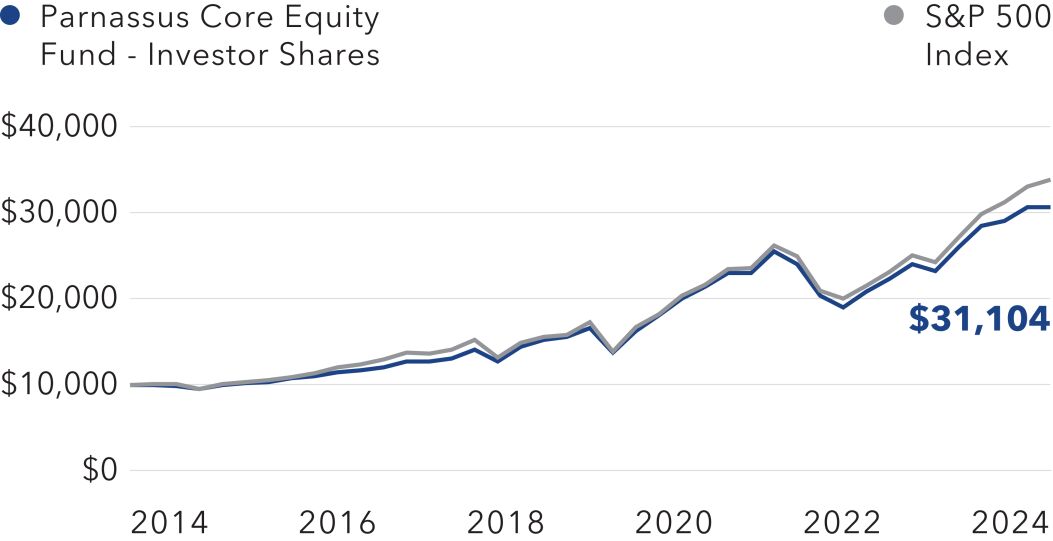
Value on December 31, 2024 of $10,000 invested on December 31, 2014.
| Parnassus Value Equity Fund | S&P 500 Index | Russell 1000® Value Index |
|---|
| | | |
|---|
| 2014 | $10,000 | $10,000 | $10,000 |
|---|
| 2015 | $10,325 | $10,138 | $9,617 |
|---|
| 2016 | $12,536 | $11,351 | $11,285 |
|---|
| 2017 | $15,019 | $13,829 | $12,827 |
|---|
| 2018 | $12,994 | $13,223 | $11,767 |
|---|
| 2019 | $17,319 | $17,386 | $14,890 |
|---|
| 2020 | $22,068 | $20,585 | $15,306 |
|---|
| 2021 | $28,936 | $26,494 | $19,157 |
|---|
| 2022 | $24,939 | $21,696 | $17,713 |
|---|
| 2023 | $28,355 | $27,399 | $19,743 |
|---|
| 2024 | $31,760 | $34,254 | $22,580 |
|---|
The chart shows the growth in value of a hypothetical $10,000 investment over the last 10 years and does not reflect the deduction of taxes a shareholder would pay on fund distributions or the redemption of fund shares.
The fund’s past performance is not a good predictor of how the fund will perform in the future. The graph and table do not reflect the deduction of taxes that a shareholder would pay on fund distributions or redemption of fund shares.
| Total Net Assets | $4,825,190,926 |
|---|
| # of Portfolio Holdings | 45 |
|---|
| Portfolio Turnover Rate | 24.08% |
|---|
| Advisory Fees Paid | $31,176,918 |
|---|
Average Annual Total Returns (%)
| 1 Year | 5 years | 10 Years |
|---|
| Parnassus Value Equity Fund - Investor Shares | 12.01% | 12.89% | 12.25% |
|---|
| S&P 500 Index | 25.02% | 14.53% | 13.10% |
|---|
Russell 1000® Value Index | 14.37% | 8.68% | 8.49% |
|---|
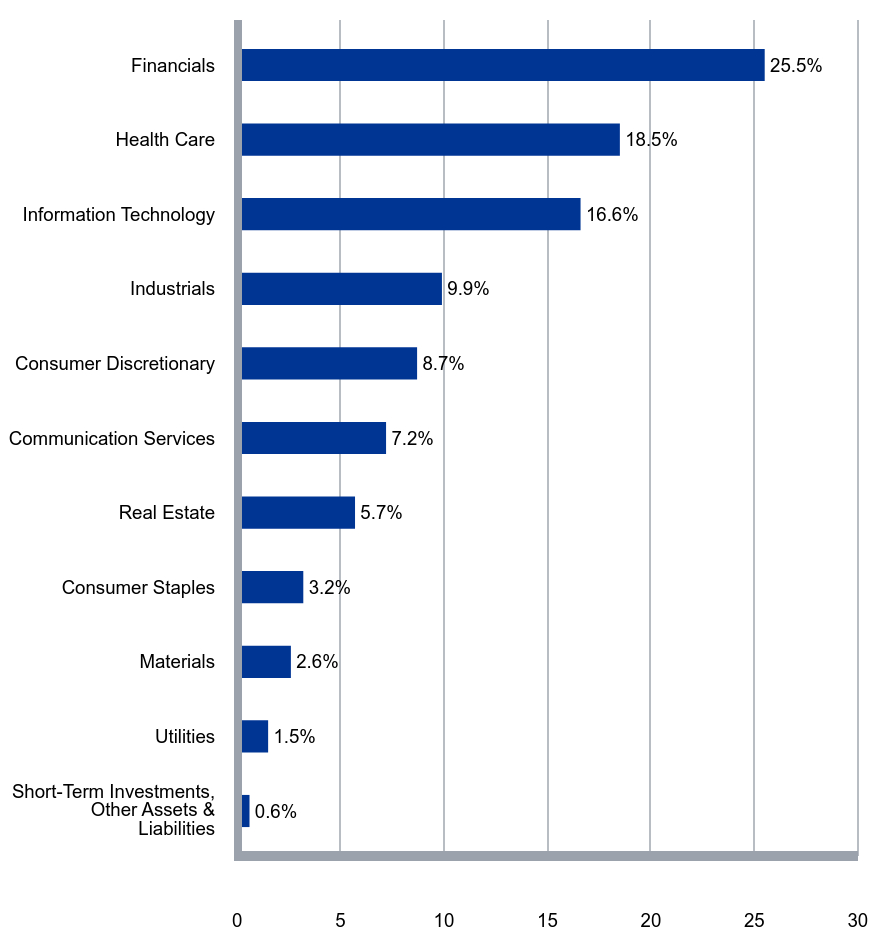
What did the Fund invest in?
Parnassus Value Equity Fund invests selectively in about 40-45 U.S. large-cap equity securities trading at a discount. The Fund pursues companies with increasingly relevant products and services, durable competitive advantages, strong management teams and sustainable business practices that are likely to thrive in a healthy economy and be resilient in an economic downturn.
| Value | Value |
|---|
| Short-Term Investments, Other Assets & Liabilities | 0.6% |
| Utilities | 1.5% |
| Materials | 2.6% |
| Consumer Staples | 3.2% |
| Real Estate | 5.7% |
| Communication Services | 7.2% |
| Consumer Discretionary | 8.7% |
| Industrials | 9.9% |
| Information Technology | 16.6% |
| Health Care | 18.5% |
| Financials | 25.5% |
| S&P Global Inc. | 3.5% |
| Bank of America Corp. | 3.3% |
| Sysco Corp. | 3.2% |
| CBRE Group Inc., Class A | 3.2% |
| Deere & Co. | 3.1% |
| Verizon Communications Inc. | 2.9% |
| Mastercard Inc., Class A | 2.9% |
| Broadcom Inc. | 2.8% |
| Alphabet Inc., Class A | 2.8% |
| Cummins Inc. | 2.7% |
Parnassus Value Equity Fund
Annual Shareholder Report - December 31, 2024
If you wish to view additional information about the Fund; including, but not limited to, financial statements or holdings, please call us or visit our website:
Phone: 800-999-3505
Website: www.parnassus.com/literature-and-forms/fund-information
For purposes of categorizing securities for diversification requirements under the Investment Company Act, the Fund uses industry classifications that are more specific than those used for the chart.
Portfolio characteristics and holdings are subject to change periodically.
* The holding tables and charts above represent percentage based on Total Net Assets.
No material changes to the Fund in the last reporting year.
Change in or Disagreements with Accountants
There have been no changes to or disagreements with the accountants in the last reporting year.
© 2025 Parnassus Investments, LLC. All rights reserved. PARNASSUS, PARNASSUS INVESTMENTS, and PARNASSUS FUNDS are federally registered trademarks of Parnassus Investments, LLC.
If you wish to receive a copy of this document at a new address, contact 800-999-3505.
Parnassus Value Equity Fund
Class - Institutional Shares
Annual Shareholder Report - December 31, 2024
Parnassus Value Equity Fund (the "Fund") offers a concentrated portfolio of U.S. large-cap stocks that are attractively priced relative to their history or peers.
This annual shareholder report contains important information about the Fund for the period of January 1, 2024 to December 31, 2024.
You can find additional information about the fund at www.parnassus.com. You can also request this information by contacting us at 800-999-3505.
What was the Fund's cost for the year?
(based on hypothetical $10,000 investment)
| Class name | Cost of a $10,000 investment | Cost paid as a % of a $10,000 investment |
|---|
| Institutional Shares | $69 | 0.65% |
|---|
How did the fund perform?
Parnassus Value Equity Fund (Institutional Shares) returned 12.27% (net of fees), trailing the Russell 1000 Value Index’s 14.37% for the year. Stock selection in the Health Care sector notably weighed on relative performance. In contrast, strong stock selection in Real Estate boosted relative returns.
A continuation of the shift in investor sentiment toward more economically sensitive sectors could support a broadening of the stock market rally, especially in value stocks.
Value on December 31, 2024 of $10,000 invested on April 30, 2015.
| Parnassus Value Equity Fund | S&P 500 Index | Russell 1000® Value Index |
|---|
| | | |
|---|
| 2015 | $10,000 | $10,000 | $10,000 |
|---|
| 2015 | $9,978 | $9,947 | $9,597 |
|---|
| 2016 | $12,141 | $11,137 | $11,262 |
|---|
| 2017 | $14,573 | $13,569 | $12,801 |
|---|
| 2018 | $12,642 | $12,974 | $11,742 |
|---|
| 2019 | $16,885 | $17,059 | $14,859 |
|---|
| 2020 | $21,565 | $20,197 | $15,274 |
|---|
| 2021 | $28,330 | $25,995 | $19,117 |
|---|
| 2022 | $24,476 | $21,287 | $17,676 |
|---|
| 2023 | $27,888 | $26,883 | $19,703 |
|---|
| 2024 | $31,309 | $33,609 | $22,533 |
|---|
The chart shows the growth in value of a hypothetical $10,000 investment since inception and does not reflect the deduction of taxes a shareholder would pay on fund distributions or the redemption of fund shares. The share class commenced operations on April 30, 2015.
The fund’s past performance is not a good predictor of how the fund will perform in the future. The graph and table do not reflect the deduction of taxes that a shareholder would pay on fund distributions or redemption of fund shares.
| Total Net Assets | $4,825,190,926 |
|---|
| # of Portfolio Holdings | 45 |
|---|
| Portfolio Turnover Rate | 24.08% |
|---|
| Advisory Fees Paid | $31,176,918 |
|---|
Average Annual Total Returns (%)
| 1 Year | 5 years | Since Inception |
|---|
| Parnassus Value Equity Fund - Institutional Shares (Incp: April 30, 2015) | 12.27% | 13.14% | 12.53% |
|---|
| S&P 500 Index | 25.02% | 14.53% | 13.36% |
|---|
Russell 1000® Value Index | 14.37% | 8.68% | 8.76% |
|---|
What did the Fund invest in?
Parnassus Value Equity Fund invests selectively in about 40-45 U.S. large-cap equity securities trading at a discount. The Fund pursues companies with increasingly relevant products and services, durable competitive advantages, strong management teams and sustainable business practices that are likely to thrive in a healthy economy and be resilient in an economic downturn.
| Value | Value |
|---|
| Short-Term Investments, Other Assets & Liabilities | 0.6% |
| Utilities | 1.5% |
| Materials | 2.6% |
| Consumer Staples | 3.2% |
| Real Estate | 5.7% |
| Communication Services | 7.2% |
| Consumer Discretionary | 8.7% |
| Industrials | 9.9% |
| Information Technology | 16.6% |
| Health Care | 18.5% |
| Financials | 25.5% |
| S&P Global Inc. | 3.5% |
| Bank of America Corp. | 3.3% |
| Sysco Corp. | 3.2% |
| CBRE Group Inc., Class A | 3.2% |
| Deere & Co. | 3.1% |
| Verizon Communications Inc. | 2.9% |
| Mastercard Inc., Class A | 2.9% |
| Broadcom Inc. | 2.8% |
| Alphabet Inc., Class A | 2.8% |
| Cummins Inc. | 2.7% |
Parnassus Value Equity Fund
Class - Institutional Shares
Annual Shareholder Report - December 31, 2024
If you wish to view additional information about the Fund; including, but not limited to, financial statements or holdings, please call us or visit our website:
Phone: 800-999-3505
Website: www.parnassus.com/literature-and-forms/fund-information
For purposes of categorizing securities for diversification requirements under the Investment Company Act, the Fund uses industry classifications that are more specific than those used for the chart.
Portfolio characteristics and holdings are subject to change periodically.
* The holding tables and charts above represent percentage based on Total Net Assets.
No material changes to the Fund in the last reporting year.
Change in or Disagreements with Accountants
There have been no changes to or disagreements with the accountants in the last reporting year.
© 2025 Parnassus Investments, LLC. All rights reserved. PARNASSUS, PARNASSUS INVESTMENTS, and PARNASSUS FUNDS are federally registered trademarks of Parnassus Investments, LLC.
If you wish to receive a copy of this document at a new address, contact 800-999-3505.
Annual Shareholder Report - December 31, 2024
Parnassus Mid Cap Fund (the "Fund") offers a concentrated portfolio U.S. mid-cap stocks with the potential for long-term growth and business resiliency.
This annual shareholder report contains important information about the Fund for the period of January 1, 2024 to December 31, 2024.
You can find additional information about the fund at www.parnassus.com. You can also request this information by contacting us at 800-999-3505.
What was the Fund's cost for the year?
(based on hypothetical $10,000 investment)
| Class name | Cost of a $10,000 investment | Cost paid as a % of a $10,000 investment |
|---|
| Investor Shares | $100 | 0.95% |
|---|
How did the fund perform?
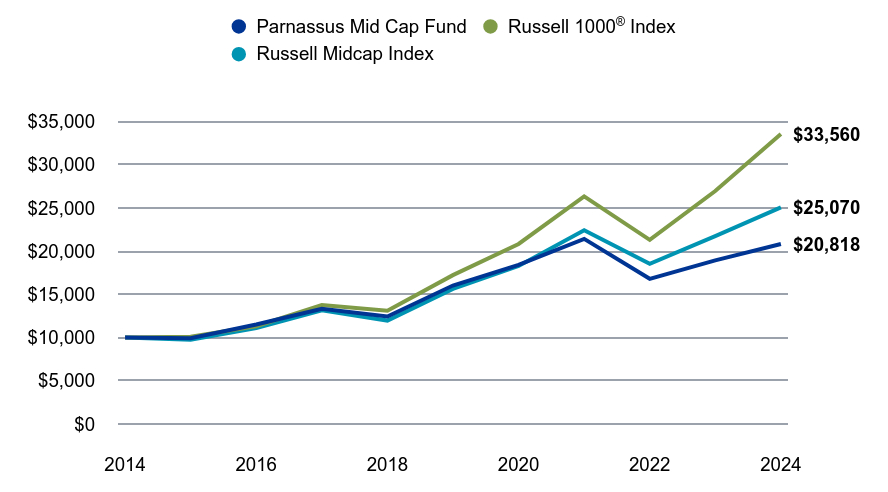
The Parnassus Mid Cap Fund (Investor shares) returned 9.99% (net of fees) in 2024, underperforming the Russell Midcap Index’s 15.34% return. Stock selection within Communication Services and Real Estate contributed to relative performance, while selection within Industrials and Information Technology detracted.
Our disciplined approach—emphasizing quality, financial strength, and attractive valuations—positions the Fund to help protect capital during downturns while capturing upside in favorable markets.
Value on December 31, 2024 of $10,000 invested on December 31, 2014.
| Parnassus Mid Cap Fund | Russell 1000® Index | Russell Midcap Index |
|---|
| | | |
|---|
| 2014 | $10,000 | $10,000 | $10,000 |
|---|
| 2015 | $9,913 | $10,092 | $9,756 |
|---|
| 2016 | $11,507 | $11,308 | $11,102 |
|---|
| 2017 | $13,324 | $13,761 | $13,158 |
|---|
| 2018 | $12,440 | $13,102 | $11,966 |
|---|
| 2019 | $16,016 | $17,220 | $15,621 |
|---|
| 2020 | $18,399 | $20,830 | $18,292 |
|---|
| 2021 | $21,416 | $26,340 | $22,424 |
|---|
| 2022 | $16,798 | $21,302 | $18,541 |
|---|
| 2023 | $18,927 | $26,953 | $21,735 |
|---|
| 2024 | $20,818 | $33,560 | $25,070 |
|---|
The chart shows the growth in value of a hypothetical $10,000 investment over the last 10 years and does not reflect the deduction of taxes a shareholder would pay on fund distributions or the redemption of fund shares.
The fund’s past performance is not a good predictor of how the fund will perform in the future. The graph and table do not reflect the deduction of taxes that a shareholder would pay on fund distributions or redemption of fund shares.
| Total Net Assets | $2,842,441,773 |
|---|
| # of Portfolio Holdings | 38 |
|---|
| Portfolio Turnover Rate | 43.55% |
|---|
| Advisory Fees Paid | $23,536,822 |
|---|
Average Annual Total Returns (%)
| 1 Year | 5 years | 10 Years |
|---|
| Parnassus Mid Cap Fund - Investor Shares | 9.99% | 5.38% | 7.61% |
|---|
Russell 1000® Index | 24.51% | 14.28% | 12.87% |
|---|
| Russell Midcap Index | 15.34% | 9.92% | 9.63% |
|---|
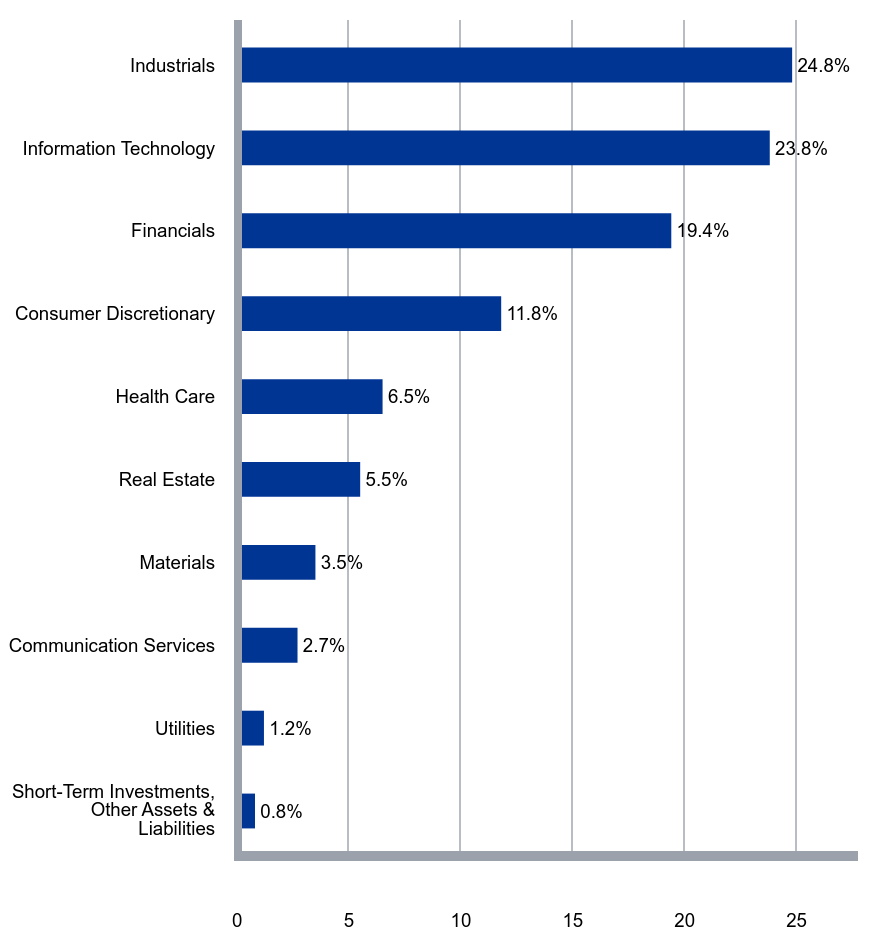
What did the Fund invest in?
Parnassus Mid Cap Fund invests selectively in about 35-45 U.S. mid-cap equity securities. The Fund pursues high quality companies with increasingly relevant products and services, durable competitive advantages, strong management teams and sustainable business practices that are likely to thrive in a healthy economy and be resilient in an economic downturn.
| Value | Value |
|---|
| Short-Term Investments, Other Assets & Liabilities | 0.8% |
| Utilities | 1.2% |
| Communication Services | 2.7% |
| Materials | 3.5% |
| Real Estate | 5.5% |
| Health Care | 6.5% |
| Consumer Discretionary | 11.8% |
| Financials | 19.4% |
| Information Technology | 23.8% |
| Industrials | 24.8% |
| Fidelity National Information Services | 4.0% |
| TransUnion | 3.8% |
| CBRE Group Inc., Class A | 3.7% |
| Fortinet Inc. | 3.7% |
| J.B. Hunt Transport Services Inc. | 3.6% |
| Cboe Global Markets Inc. | 3.5% |
| The Bank of New York Mellon Corp. | 3.4% |
| Roper Technologies Inc. | 3.3% |
| Truist Financial Corp. | 3.3% |
| Republic Services Inc. | 3.1% |
Annual Shareholder Report - December 31, 2024
If you wish to view additional information about the Fund; including, but not limited to, financial statements or holdings, please call us or visit our website:
Phone: 800-999-3505
Website: www.parnassus.com/literature-and-forms/fund-information
For purposes of categorizing securities for diversification requirements under the Investment Company Act, the Fund uses industry classifications that are more specific than those used for the chart.
Portfolio characteristics and holdings are subject to change periodically.
* The holding tables and charts above represent percentage based on Total Net Assets.
No material changes to the Fund in the last reporting year.
Change in or Disagreements with Accountants
There have been no changes to or disagreements with the accountants in the last reporting year.
© 2025 Parnassus Investments, LLC. All rights reserved. PARNASSUS, PARNASSUS INVESTMENTS, and PARNASSUS FUNDS are federally registered trademarks of Parnassus Investments, LLC.
If you wish to receive a copy of this document at a new address, contact 800-999-3505.
Class - Institutional Shares
Annual Shareholder Report - December 31, 2024
Parnassus Mid Cap Fund (the "Fund") offers a concentrated portfolio U.S. mid-cap stocks with the potential for long-term growth and business resiliency.
This annual shareholder report contains important information about the Fund for the period of January 1, 2024 to December 31, 2024.
You can find additional information about the fund at www.parnassus.com. You can also request this information by contacting us at 800-999-3505.
What was the Fund's cost for the year?
(based on hypothetical $10,000 investment)
| Class name | Cost of a $10,000 investment | Cost paid as a % of a $10,000 investment |
|---|
| Institutional Shares | $79 | 0.75% |
|---|
How did the fund perform?
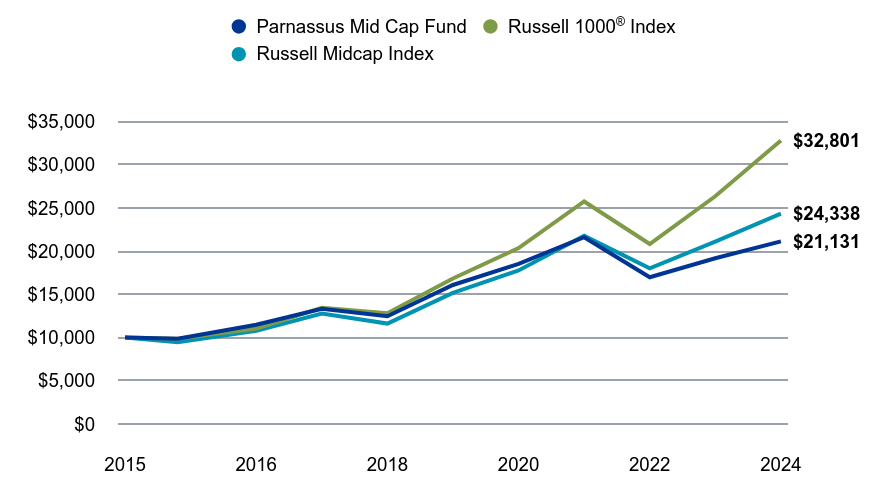
The Parnassus Mid Cap Fund (Institutional shares) returned 10.21% (net of fees) in 2024, underperforming the Russell Midcap Index’s 15.34% return. Stock selection within Communication Services and Real Estate contributed to relative performance, while selection within Industrials and Information Technology detracted.
Our disciplined approach—emphasizing quality, financial strength, and attractive valuations—positions the Fund to help protect capital during downturns while capturing upside in favorable markets.
Value on December 31, 2024 of $10,000 invested on April 30, 2015.
| Parnassus Mid Cap Fund | Russell 1000® Index | Russell Midcap Index |
|---|
| | | |
|---|
| 2015 | $10,000 | $10,000 | $10,000 |
|---|
| 2015 | $9,870 | $9,864 | $9,471 |
|---|
| 2016 | $11,477 | $11,053 | $10,778 |
|---|
| 2017 | $13,318 | $13,450 | $12,774 |
|---|
| 2018 | $12,467 | $12,806 | $11,617 |
|---|
| 2019 | $16,084 | $16,831 | $15,165 |
|---|
| 2020 | $18,523 | $20,359 | $17,758 |
|---|
| 2021 | $21,605 | $25,745 | $21,769 |
|---|
| 2022 | $16,979 | $20,821 | $18,000 |
|---|
| 2023 | $19,172 | $26,344 | $21,100 |
|---|
| 2024 | $21,131 | $32,801 | $24,338 |
|---|
The chart shows the growth in value of a hypothetical $10,000 investment since inception and does not reflect the deduction of taxes a shareholder would pay on fund distributions or the redemption of fund shares. The share class commenced operations on April 30, 2015.
The fund’s past performance is not a good predictor of how the fund will perform in the future. The graph and table do not reflect the deduction of taxes that a shareholder would pay on fund distributions or redemption of fund shares.
| Total Net Assets | $2,842,441,773 |
|---|
| # of Portfolio Holdings | 38 |
|---|
| Portfolio Turnover Rate | 43.55% |
|---|
| Advisory Fees Paid | $23,536,822 |
|---|
Average Annual Total Returns (%)
| 1 Year | 5 years | Since Inception |
|---|
| Parnassus Mid Cap Fund - Institutional Shares (Incp: April 30, 2015) | 10.21% | 5.61% | 8.04% |
|---|
Russell 1000® Index | 24.51% | 14.28% | 13.07% |
|---|
| Russell Midcap Index | 15.34% | 9.92% | 9.64% |
|---|
What did the Fund invest in?
Parnassus Mid Cap Fund invests selectively in about 35-45 U.S. mid-cap equity securities. The Fund pursues high quality companies with increasingly relevant products and services, durable competitive advantages, strong management teams and sustainable business practices that are likely to thrive in a healthy economy and be resilient in an economic downturn.
| Value | Value |
|---|
| Short-Term Investments, Other Assets & Liabilities | 0.8% |
| Utilities | 1.2% |
| Communication Services | 2.7% |
| Materials | 3.5% |
| Real Estate | 5.5% |
| Health Care | 6.5% |
| Consumer Discretionary | 11.8% |
| Financials | 19.4% |
| Information Technology | 23.8% |
| Industrials | 24.8% |
| Fidelity National Information Services | 4.0% |
| TransUnion | 3.8% |
| CBRE Group Inc., Class A | 3.7% |
| Fortinet Inc. | 3.7% |
| J.B. Hunt Transport Services Inc. | 3.6% |
| Cboe Global Markets Inc. | 3.5% |
| The Bank of New York Mellon Corp. | 3.4% |
| Roper Technologies Inc. | 3.3% |
| Truist Financial Corp. | 3.3% |
| Republic Services Inc. | 3.1% |
Class - Institutional Shares
Annual Shareholder Report - December 31, 2024
If you wish to view additional information about the Fund; including, but not limited to, financial statements or holdings, please call us or visit our website:
Phone: 800-999-3505
Website: www.parnassus.com/literature-and-forms/fund-information
For purposes of categorizing securities for diversification requirements under the Investment Company Act, the Fund uses industry classifications that are more specific than those used for the chart.
Portfolio characteristics and holdings are subject to change periodically.
* The holding tables and charts above represent percentage based on Total Net Assets.
No material changes to the Fund in the last reporting year.
Change in or Disagreements with Accountants
There have been no changes to or disagreements with the accountants in the last reporting year.
© 2025 Parnassus Investments, LLC. All rights reserved. PARNASSUS, PARNASSUS INVESTMENTS, and PARNASSUS FUNDS are federally registered trademarks of Parnassus Investments, LLC.
If you wish to receive a copy of this document at a new address, contact 800-999-3505.
Parnassus Mid Cap Growth Fund
Annual Shareholder Report - December 31, 2024
Parnassus Mid Cap Growth Fund (the "Fund") offers a concentrated portfolio of U.S. mid-cap, fast-growing companies with healthy balance sheets and proven financial models.
This annual shareholder report contains important information about the Fund for the period of January 1, 2024 to December 31, 2024.
You can find additional information about the fund at www.parnassus.com. You can also request this information by contacting us at 800-999-3505.
What was the Fund's cost for the year?
(based on hypothetical $10,000 investment)
| Class name | Cost of a $10,000 investment | Cost paid as a % of a $10,000 investment |
|---|
| Investor Shares | $84 | 0.80% |
|---|
How did the fund perform?
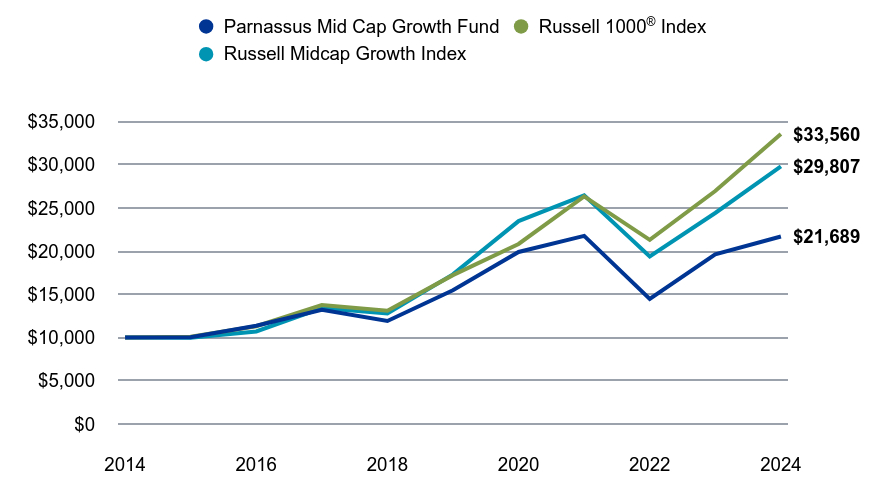
The Parnassus Mid Cap Growth Fund (Investor shares) returned 10.55% (net of fees) in 2024, underperforming the Russell Midcap Growth Index’s 22.10% return. A lack of exposure to Consumer Staples and stock selection within Communication Services contributed while stock selection within Information Technology and Consumer Discretionary detracted.
Our disciplined approach—emphasizing quality, financial strength, and attractive valuations—positions the Fund to help protect capital during downturns while capturing upside in favorable markets.
Value on December 31, 2024 of $10,000 invested on December 31, 2014.
| Parnassus Mid Cap Growth Fund | Russell 1000® Index | Russell Midcap Growth Index |
|---|
| | | |
|---|
| 2014 | $10,000 | $10,000 | $10,000 |
|---|
| 2015 | $10,026 | $10,092 | $9,980 |
|---|
| 2016 | $11,375 | $11,308 | $10,711 |
|---|
| 2017 | $13,204 | $13,761 | $13,418 |
|---|
| 2018 | $11,919 | $13,102 | $12,780 |
|---|
| 2019 | $15,474 | $17,220 | $17,312 |
|---|
| 2020 | $19,900 | $20,830 | $23,473 |
|---|
| 2021 | $21,764 | $26,340 | $26,461 |
|---|
| 2022 | $14,468 | $21,302 | $19,390 |
|---|
| 2023 | $19,620 | $26,953 | $24,411 |
|---|
| 2024 | $21,689 | $33,560 | $29,807 |
|---|
The chart shows the growth in value of a hypothetical $10,000 investment over the last 10 years and does not reflect the deduction of taxes a shareholder would pay on fund distributions or the redemption of fund shares.
The fund’s past performance is not a good predictor of how the fund will perform in the future. The graph and table do not reflect the deduction of taxes that a shareholder would pay on fund distributions or redemption of fund shares.
| Total Net Assets | $841,960,290 |
|---|
| # of Portfolio Holdings | 37 |
|---|
| Portfolio Turnover Rate | 41.45% |
|---|
| Advisory Fees Paid | $5,159,334 |
|---|
Average Annual Total Returns (%)
| 1 Year | 5 years | 10 Years |
|---|
| Parnassus Mid Cap Growth Fund - Investor Shares | 10.55% | 6.99% | 8.05% |
|---|
Russell 1000® Index | 24.51% | 14.28% | 12.87% |
|---|
| Russell Midcap Growth Index | 22.10% | 11.48% | 11.54% |
|---|
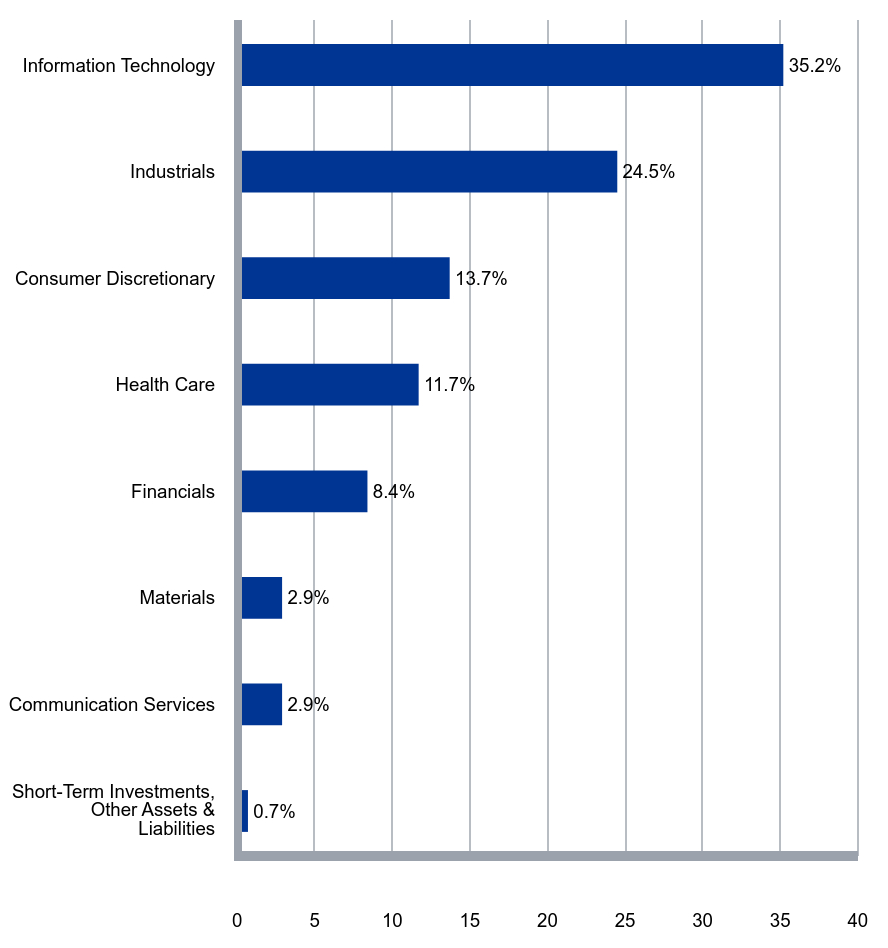
What did the Fund invest in?
Parnassus Mid Cap Growth Fund invests selectively in about 35-45 U.S. mid-cap growth equity securities. The Fund pursues best-in-class, high quality companies with increasingly relevant products and services, durable competitive advantages, strong management teams and sustainable business practices that are likely to thrive in a healthy economy and be resilient in a downturn.
| Value | Value |
|---|
| Short-Term Investments, Other Assets & Liabilities | 0.7% |
| Communication Services | 2.9% |
| Materials | 2.9% |
| Financials | 8.4% |
| Health Care | 11.7% |
| Consumer Discretionary | 13.7% |
| Industrials | 24.5% |
| Information Technology | 35.2% |
| Equifax Inc. | 4.4% |
| Old Dominion Freight Line Inc. | 4.0% |
| J.B. Hunt Transport Services Inc. | 4.0% |
| Trane Technologies plc | 3.9% |
| Atlassian Corp., Class A | 3.7% |
| Teradyne Inc. | 3.6% |
| MercadoLibre Inc. | 3.4% |
| Block Inc., Class A | 3.2% |
| Workday Inc., Class A | 3.2% |
| Hilton Worldwide Holdings Inc. | 3.1% |
Parnassus Mid Cap Growth Fund
Annual Shareholder Report - December 31, 2024
If you wish to view additional information about the Fund; including, but not limited to, financial statements or holdings, please call us or visit our website:
Phone: 800-999-3505
Website: www.parnassus.com/literature-and-forms/fund-information
For purposes of categorizing securities for diversification requirements under the Investment Company Act, the Fund uses industry classifications that are more specific than those used for the chart.
Portfolio characteristics and holdings are subject to change periodically.
* The holding tables and charts above represent percentage based on Total Net Assets.
No material changes to the Fund in the last reporting year.
Change in or Disagreements with Accountants
There have been no changes to or disagreements with the accountants in the last reporting year.
© 2025 Parnassus Investments, LLC. All rights reserved. PARNASSUS, PARNASSUS INVESTMENTS, and PARNASSUS FUNDS are federally registered trademarks of Parnassus Investments, LLC.
If you wish to receive a copy of this document at a new address, contact 800-999-3505.
Parnassus Mid Cap Growth Fund
Class - Institutional Shares
Annual Shareholder Report - December 31, 2024
Parnassus Mid Cap Growth Fund (the "Fund") offers a concentrated portfolio of U.S. mid-cap, fast-growing companies with healthy balance sheets and proven financial models.
This annual shareholder report contains important information about the Fund for the period of January 1, 2024 to December 31, 2024.
You can find additional information about the fund at www.parnassus.com. You can also request this information by contacting us at 800-999-3505.
What was the Fund's cost for the year?
(based on hypothetical $10,000 investment)
| Class name | Cost of a $10,000 investment | Cost paid as a % of a $10,000 investment |
|---|
| Institutional Shares | $72 | 0.68% |
|---|
How did the fund perform?
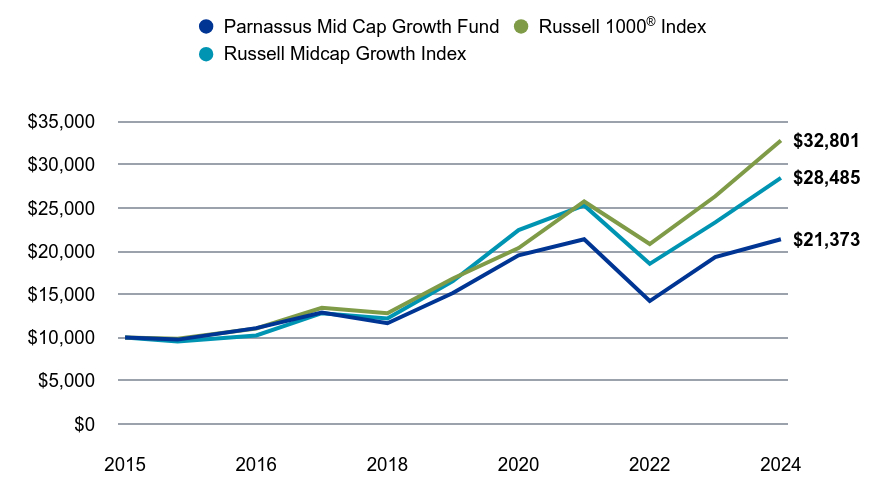
The Parnassus Mid Cap Growth Fund (Institutional shares) returned 10.68% (net of fees) in 2024, underperforming the Russell Midcap Growth Index’s 22.10% return. A lack of exposure to Consumer Staples and stock selection within Communication Services contributed while stock selection within Information Technology and Consumer Discretionary detracted.
Our disciplined approach—emphasizing quality, financial strength, and attractive valuations—positions the Fund to help protect capital during downturns while capturing upside in favorable markets.
Value on December 31, 2024 of $10,000 invested on April 30, 2015.
| Parnassus Mid Cap Growth Fund | Russell 1000® Index | Russell Midcap Growth Index |
|---|
| | | |
|---|
| 2015 | $10,000 | $10,000 | $10,000 |
|---|
| 2015 | $9,763 | $9,864 | $9,538 |
|---|
| 2016 | $11,089 | $11,053 | $10,237 |
|---|
| 2017 | $12,891 | $13,450 | $12,823 |
|---|
| 2018 | $11,658 | $12,806 | $12,213 |
|---|
| 2019 | $15,152 | $16,831 | $16,545 |
|---|
| 2020 | $19,517 | $20,359 | $22,432 |
|---|
| 2021 | $21,373 | $25,745 | $25,288 |
|---|
| 2022 | $14,224 | $20,821 | $18,531 |
|---|
| 2023 | $19,311 | $26,344 | $23,329 |
|---|
| 2024 | $21,373 | $32,801 | $28,485 |
|---|
The chart shows the growth in value of a hypothetical $10,000 investment since inception and does not reflect the deduction of taxes a shareholder would pay on fund distributions or the redemption of fund shares. The share class commenced operations on April 30, 2015.
The fund’s past performance is not a good predictor of how the fund will perform in the future. The graph and table do not reflect the deduction of taxes that a shareholder would pay on fund distributions or redemption of fund shares.
| Total Net Assets | $841,960,290 |
|---|
| # of Portfolio Holdings | 37 |
|---|
| Portfolio Turnover Rate | 41.45% |
|---|
| Advisory Fees Paid | $5,159,334 |
|---|
Average Annual Total Returns (%)
| 1 Year | 5 years | Since Inception |
|---|
| Parnassus Mid Cap Growth Fund - Institutional Shares (Incp: April 30, 2015) | 10.68% | 7.12% | 8.17% |
|---|
Russell 1000® Index | 24.51% | 14.28% | 13.07% |
|---|
| Russell Midcap Growth Index | 22.10% | 11.48% | 11.43% |
|---|
What did the Fund invest in?
Parnassus Mid Cap Growth Fund invests selectively in about 35-45 U.S. mid-cap growth equity securities. The Fund pursues best-in-class, high quality companies with increasingly relevant products and services, durable competitive advantages, strong management teams and sustainable business practices that are likely to thrive in a healthy economy and be resilient in a downturn.
| Value | Value |
|---|
| Short-Term Investments, Other Assets & Liabilities | 0.7% |
| Communication Services | 2.9% |
| Materials | 2.9% |
| Financials | 8.4% |
| Health Care | 11.7% |
| Consumer Discretionary | 13.7% |
| Industrials | 24.5% |
| Information Technology | 35.2% |
| Equifax Inc. | 4.4% |
| Old Dominion Freight Line Inc. | 4.0% |
| J.B. Hunt Transport Services Inc. | 4.0% |
| Trane Technologies plc | 3.9% |
| Atlassian Corp., Class A | 3.7% |
| Teradyne Inc. | 3.6% |
| MercadoLibre Inc. | 3.4% |
| Block Inc., Class A | 3.2% |
| Workday Inc., Class A | 3.2% |
| Hilton Worldwide Holdings Inc. | 3.1% |
Parnassus Mid Cap Growth Fund
Class - Institutional Shares
Annual Shareholder Report - December 31, 2024
If you wish to view additional information about the Fund; including, but not limited to, financial statements or holdings, please call us or visit our website:
Phone: 800-999-3505
Website: www.parnassus.com/literature-and-forms/fund-information
For purposes of categorizing securities for diversification requirements under the Investment Company Act, the Fund uses industry classifications that are more specific than those used for the chart.
Portfolio characteristics and holdings are subject to change periodically.
* The holding tables and charts above represent percentage based on Total Net Assets.
No material changes to the Fund in the last reporting year.
Change in or Disagreements with Accountants
There have been no changes to or disagreements with the accountants in the last reporting year.
© 2025 Parnassus Investments, LLC. All rights reserved. PARNASSUS, PARNASSUS INVESTMENTS, and PARNASSUS FUNDS are federally registered trademarks of Parnassus Investments, LLC.
If you wish to receive a copy of this document at a new address, contact 800-999-3505.
Item 2. Code of Ethics.
The registrant has adopted a code of ethics dated July 22, 2003 that applies to the registrant’s principal executive officer (President) and principal financial officer (Treasurer) for the fiscal year ending December 31, 2024. During the fiscal year ending December 31, 2024 there were no amendments to any provisions of this code of ethics.
Item 3. Audit Committee Financial Expert.
The Boards of Trustees of the Parnassus Funds and the Parnassus Income Funds determined that Kay Yun, Chair of the Boards’ Audit Committee, qualified as an “independent audit committee financial expert” as defined by Form N-CSR. The Trustees’ decision was based on Ms. Yun’s understanding of generally accepted accounting principles (GAAP); her ability to assess the general application of such principles in connection with the accounting for estimates, accruals, and reserves; her experience preparing, auditing, analyzing, or evaluating financial statements that present a breadth and level of complexity of accounting issues that are generally comparable to the breadth and complexity of issues that can reasonably be expected to be raised by the registrants’ financial statements; an understanding of internal controls and procedures for financial reporting; and understanding of audit committee functions.
Kay Yun is a Partner and the Chief Financial Officer of Health Evolution Partners, a healthcare-focused private equity firm in San Francisco. Before this, Kay was Co-Founder and Chief Executive Officer of YuniNetworks, a technology start-up, through its sale in 2001. Before YuniNetworks, she was an investment banker with Goldman Sachs for almost ten years. Kay serves as the Board President at the American Conservatory Theater and co-chair of the $18 million Next ACT capital campaign. She is also the fundraising chair for The Wharton MBA class of 1990. Kay received her B.S. in Business Administration from the Leeds School of Business at the University of Colorado, Boulder, in 1985 and an MBA from The Wharton School at the University of Pennsylvania in 1990.
Item 4. Principal Accountant Fees and Services.
(a) Audit Fees
The aggregate fees billed for professional services rendered by the principal accountant for the audit of the registrant’s annual financial statements or services that are normally provided by the accountant in connection with statutory and regulatory filings or engagements for the Parnassus Funds fiscal years ended December 31, 2023 and 2024 were $297,550 and $95,000 respectively and the Parnassus Income Funds fiscal year ended December 31, 2023 and 2024 were $234,950 and $78,000 respectively.
(b) Audit-Related Fees
There were no aggregate fees billed for assurance and related services rendered by the principal accountants that are reasonably related to the performance of the audit of the registrant’s financial statements and are not reported under paragraph (a) of this Item.
(c) Tax Fees
The aggregate fees billed for professional services rendered by the principal accountant for tax compliance, tax advice, and tax planning for the Parnassus Funds fiscal years ended December 31, 2023 and 2024 were $33,955 and $15,412 respectively and the Parnassus Income Funds fiscal years ended December 31, 2023 and 2024 were $26,365 and $7,706 respectively.
(d) All Other Fees
There were no fees billed in each of the last two fiscal years for products and services by the principal accountant, other than the services reported in paragraphs (a) through (c) of this Item.
(e)(1) The Audit Committee’s pre-approval policies and procedures are as follows: The audit committee is required to pre-approve all audit services and permitted non-audit services provided by the independent accountants for the Parnassus Funds, affiliated funds, and other service affiliates. Explicit pre-approval by the Audit Committee Chair shall be required for any individual non-audit engagement to be performed by the independent accountants with estimated fees of $10,000 or less and the Audit Committee Chair shall report such approval to the full audit committee at the next regularly scheduled meeting. Explicit pre-approval by the full Audit Committee shall be required for any individual non-audit engagement to be performed by the independent accountants with estimated fees in excess of $10,000. Officers of the Funds shall furnish the audit committee at least annually with a listing of all fees paid to the independent accountants including non-audit services performed. For certain non-audit services which are no more than five percent of the total fees paid by the Trust, such fees may be exempted from the required pre-approval process specified above subject to limitations and prompt disclosure of such services are identified, and in all cases approval is required prior to completion.
(e)(2) None.
(f) Not applicable.
(g) The aggregate non-audit fees billed by the registrant’s accountant for services rendered to the registrant, and rendered to the registrant’s investment adviser forth in 4(b) and (c) of this Item of $— and $— for the Parnassus Funds fiscal years ended December 31, 2023 and 2024, respectively and $— and $— for the Parnassus Income Funds fiscal years ended December 31, 2023 and 2024, respectively.
Item 5. Audit Committee of Listed Registrants.
(a) The Registrant is an issuer as defined in Section 10A-3 of the Securities Exchange Act of 1934 and has a separately-designated standing Audit Committee in accordance with Section 3(a)(58)(A) of such Act. All of the Board’s independent Trustees are members of the Audit Committee.
(b) Not applicable.
Item 6. Investments.
| (a) | Included as part of the report to shareholders filed under Item 7 of this form. |
Item 7. Financial Statements and Financial Highlights for Open-End Management Investment Companies.
| (a) | The Registrant’s Financial Statements are attached herewith. |
| (b) | The Registrant’s Financial Highlights are included as part of the Financial Statements filed under Item 7(a) of this Form. |

Parnassus Funds Annual Report
December 31, 2024
Parnassus Core Equity FundSM
Investor Shares: PRBLX | Institutional Shares: PRILX
Parnassus Growth Equity FundSM
Investor Shares: PFGEX | Institutional Shares: PFPGX
Parnassus Value Equity FundSM
Investor Shares: PARWX | Institutional Shares: PFPWX
Parnassus Mid Cap FundSM
Investor Shares: PARMX | Institutional Shares: PFPMX
Parnassus Mid Cap Growth FundSM
Investor Shares: PARNX | Institutional Shares: PFPRX
Parnassus Fixed Income FundSM
Investor Shares: PRFIX | Institutional Shares: PFPLX

Table of Contents
3
| | | | |
| | |
 | | | | Annual Report • 2024 |
February 14, 2025
Dear Shareholder,
2024 was another great year to be invested in stocks and bonds. Our five equity strategies saw impressive double-digit gains in 2024 this year, with our flagship Core Equity Fund advancing 19% on the year and our Growth Equity Fund finishing the year with a 27% gain. Our Value Equity, Mid Cap and Mid Cap Growth Funds also delivered compelling absolute performance with gains of 12%, 10% and 11% respectively. Throughout the year, however, the stock market’s strong performance was narrowly driven by a handful of tech companies, presenting challenges to active managers and leading our equity strategies to lag their benchmarks.
Actively managed funds can be helpful in navigating this kind of market because that narrowness eventually widens out. In past market cycles, we’ve seen a handful of companies dominate for several years, but it always changes. Other companies take up the mantle of market leadership. Some sectors that have been overlooked can become the leaders of the next three to five years. So we’re focused on the dynamics of the overall stock market and staying nimble. We aim to position our portfolios to be resilient, capturing market upside while protecting our portfolios from market pullbacks to deliver enduring value.
As a firm, we haven’t been standing still. Our clients expressed interest in Parnassus investment strategies in an exchange-traded fund (ETF) vehicle. And we delivered. I’m very proud that we launched the Parnassus Core Select ETF (NYSE: PRCS) and the Parnassus Value Select ETF (NYSE: PRVS) in December. These innovative products give investors new ways to access the strengths of our investment approach. Our active ETFs offer highly concentrated portfolios that represent our portfolio managers’ convictions for the highest quality, most attractively valued companies in a cost-efficient, convenient product. The new ETFs reaffirm our focus on doing what we do best by offering investors building blocks for a diversified equity allocation that is poised to outperform. I invite you to check out the new ETFs at www.parnassus.com/etfs.
In the pages that follow, you can find detailed commentary from our portfolio managers on market conditions as well as their outlooks for the coming year. You can always also find the most current information on our portfolio performance, holdings and commentary at www.parnassus.com. We encourage you to visit our website and subscribe to receive updates by email.
Strengthening Our Team
In pursuit of our mission of building wealth responsibly, I want to acknowledge our team, and the hard work our entire staff has put in this year. Our team has grown to support and enhance our capabilities. We welcomed nine new employees to Parnassus in the second half of 2024.
| | • | | Weston Cooper joined our firm as an Equity Trader on the Research team after spending the last 10 years of his career with Fisher Investments in a senior role responsible for firmwide trade execution. Weston loves spending time outdoors and traveling. |
ETFs are subject to additional risks that do not apply to conventional funds, including the risks that the market price of an ETF’s shares may trade at a premium or discount to its net asset value, an active secondary trading market may not develop or be maintained, or trading may be halted by the exchange in which they trade, which may impact an ETF’s ability to sell its shares. Shares of any ETF are bought and sold at market price (not NAV) and are not individually redeemed from the ETF. Brokerage commissions will reduce returns.
4
| | | | |
| | |
| Annual Report • 2024 | | | | |
| | • | | Sophie Haywood is a new analyst on the Sustainability and Stewardship team, supporting company engagement programs, client communications, proxy voting activities and sustainability-related integration. Previously, Sophie was with Environmental Resources Management. Sophie is happiest when taking art classes, baking, skiing or training to run a marathon. |
| | • | | Ethan Hejna joined our Investment Operations team as an Associate. Ethan came from Citigroup’s credit trading middle office team, where he worked with various corporate debt and securitized trading desks. In his free time, he enjoys skiing, golfing and hanging out with friends and family. |
| | • | | Karen Huynh is a Senior Manager specializing in ETF operations. Karen previously served as a Senior Manager and Fund Accountant at Matthews Asia. During her free time, Karen loves to travel, having visited many countries where she enjoyed local cultures and foods. |
| | • | | Paulyne Keefe also joined us as a Manager on our Corporate Accounting team, with more than seven years of experience in financial reporting, accounting systems implementation and compliance. Outside of work, Paulyne enjoys spending time with her husband and their two kids and experiencing different cultures. |
| | • | | Chris Kelser is a new analyst on our Research team, responsible for supporting firmwide investment research. Chris worked at Fidelity Investments as an Equity Research Associate on the healthcare team covering medical device stocks. In his free time, he enjoys running and is an avid reader and writer. |
| | • | | Marcy McCullaugh is a new director on our Sustainability and Stewardship team. She leads impact engagements with portfolio companies and serves as a member of our Proxy Committee. Previously, Marcy was Director of Investment Stewardship at Schwab Asset Management and was a senior advisor on the sustainability and public policy team at Chevron. She enjoys running, hiking and traveling to new destinations. |
| | • | | Ken Ryan joined us as a Senior Analyst on our Research team. He previously worked in equity research for WCM Investment Management, Dodge & Cox and Credit Suisse. Ken is a CFA charterholder. He enjoys traveling both personally and professionally, having visited 35 countries and counting. |
| | • | | Peter Valencia is a Manager on our Compliance team. He previously worked at Mission Creek Capital Partners and Matthews Asia. In his free time, Peter enjoys spending time with his son and cooking, and is an avid longboarder. |
Thank you for your investment in the Parnassus Funds. May 2025 bring peace, prosperity and good health for us all.
Sincerely,

Benjamin E. Allen
CEO and Portfolio Manager
5
| | | | |
| | |
| | | | Annual Report • 2024 |
Parnassus Core Equity Fund
Ticker: Investor Shares - PRBLX
Ticker: Institutional Shares - PRILX
As of December 31, 2024, after taking dividends into account, the Parnassus Core Equity Fund – Investor Shares (the “Fund”) returned 18.52% (net of fees) for the year, underperforming the S&P 500 Index’s 25.02%.
Below is a table that summarizes the performances of the Parnassus Core Equity Fund and the S&P 500. The returns are for the one-, three-, five- and ten-year periods.
Parnassus Core Equity Fund
| | | | | | | | | | | | | | | | | | | | | | | | |
| |
| | | Average Annual Total Returns (%) | |
| |
| | | for period ended December 31, 2024 | |
| | | | | | |
| | | One
Year | | | Three
Years | | | Five
Years | | | Ten
Years | | | Gross
Expense
Ratio | | | Net
Expense
Ratio | |
| | | | | | |
| Parnassus Core Equity Fund – Investor Shares | | | 18.52 | | | | 6.42 | | | | 13.25 | | | | 12.02 | | | | 0.82 | | | | 0.82 | |
| | | | | | |
| Parnassus Core Equity Fund – Institutional Shares | | | 18.75 | | | | 6.64 | | | | 13.49 | | | | 12.25 | | | | 0.62 | | | | 0.61 | |
| | | | | | |
| S&P 500 Index | | | 25.02 | | | | 8.94 | | | | 14.53 | | | | 13.10 | | | | NA | | | | NA | |
Performance data quoted represent past performance and are no guarantee of future returns. Current performance may be lower or higher than the performance data quoted, and current performance information to the most recent month end is available on the Parnassus website (www.parnassus.com). Investment return and principal value will fluctuate, so an investor’s shares, when redeemed, may be worth more or less than their original principal cost.
Returns shown in the table do not reflect the deduction of taxes a shareholder may pay on fund distributions or redemption of shares. The S&P 500 is an unmanaged index of common stocks, and it is not possible to invest directly in an index. Index figures do not take any expenses, fees or taxes into account, but mutual fund returns do.
The estimated impact of individual stocks on the Fund’s performance is provided by FactSet.
Contributions to returns quoted for individual stocks are their returns relative to the Fund’s index.
As described in the Fund’s current prospectus dated May 1, 2024, Parnassus Investments, LLC has contractually agreed to reduce its investment advisory fee to the extent necessary to limit total annual fund operating expenses to 0.82% of net assets for the Parnassus Core Equity Fund – Investor Shares and to 0.61% of net assets for the Parnassus Core Equity Fund – Institutional Shares. This agreement will not be terminated prior to May 1, 2025, and may be continued indefinitely by the investment adviser on a year-to-year basis.
Year In Review
The Fund (Investor Shares) returned 18.52%, (net of fees) for the year, underperforming the S&P 500 Index’s 25.02%. Stock selection in the Financials and Communication Services sector held back relative returns, as did an overweight to Materials. Conversely, a lack of exposure to the Energy sector and underweights in the Consumer Discretionary and Health Care sectors buoyed relative performance.
Oracle stock posted its best annual performance since 1999 as the software giant gained market share in cloud-based training of generative artificial intelligence (AI) models. Oracle Cloud Infrastructure is helping to reaccelerate growth as the company continues to execute well in capturing new deals.
Fiserv benefited in 2024 from growing demand for payments processing and fintech intermediaries, gaining traction with both merchants and financial institutions. Its quarterly results throughout the year reflected strong competitive positioning.
Amazon’s shares experienced volatility throughout the year as IT spending and the company’s margin structure came under scrutiny. Despite this, the stock outperformed as sentiment and results improved across both the overall environment for Amazon Web Services and the company’s ability to show margin.
Intel shares declined as the chipmaker announced a major cost-cutting plan and reported disappointing financial results. We exited our position in the stock.
Ball, the global leader in aluminum packaging, experienced lackluster results as consumer spending on beverages tightened across key regions globally.
Cigna Group shares declined along with those of several other large health care providers and insurers amid
6
| | | | |
| | |
| Annual Report • 2024 | | | | |
speculation that the incoming Trump administration could implement reforms to pharmacy benefit managers, along with heightened public scrutiny over the sector’s business practices.
Parnassus Core Equity Fund
As of December 31, 2024
(percentage of net assets)
* For purposes of categorizing securities for diversification requirements under the Investment Company Act, the Fund uses industry classifications that are more specific than those used for the chart.
Portfolio characteristics and holdings are subject to change periodically.
| | | | |
| |
| Top 10 Equity Holdings | | | | |
| (percentage of net assets) | | | | |
| |
| Microsoft Corp. | | | 6.5% | |
| |
| Amazon.com Inc. | | | 6.3% | |
| |
| NVIDIA Corp. | | | 5.9% | |
| |
| Alphabet Inc., Class A | | | 5.0% | |
| |
| Deere & Co. | | | 3.6% | |
| |
| Waste Management Inc. | | | 3.4% | |
| |
| Mastercard Inc., Class A | | | 3.4% | |
| |
| Realty Income Corp. | | | 3.2% | |
| |
| Broadcom Inc. | | | 3.0% | |
| |
| Intercontinental Exchange Inc. | | | 3.0% | |
Portfolio characteristics and holdings are subject to change periodically.
Value on December 31, 2024
of $10,000 invested on December 31, 2014
The chart shows the growth in value of a hypothetical $10,000 investment over the last 10 years and does not reflect the deduction of taxes a shareholder would pay on fund distributions or the redemption of fund shares.
Outlook and Strategy
The portfolio’s largest overweights are in Materials and Industrials, while its largest underweights are in Energy and Communication Services.
We continue to maintain a portfolio positioning balanced between offense and defense. Real rates moved higher in the fourth quarter as the 10-year Treasury yield increased by almost 0.80%. Despite this, the market’s valuation is largely unchanged, as are earnings expectations for 2025. The market continues to anticipate a favorable environment for risk and economic growth, a backdrop that we believe warrants our balanced portfolio positioning.
We sold two positions in the Consumer Staples sector during the quarter, Sysco and Mondelez International. Sysco has not responded convincingly to its industry’s
7
| | | | |
| | |
| | | | Annual Report • 2024 |
competitive dynamics, while Mondelez faces idiosyncratic challenges to its financial outlook. In Financials, we sold CME Group, an operator of futures and derivatives exchanges that faces slowing growth and rising competition.
We also added several new positions, including two in Information Technology: Workday, a category leader for enterprise cloud applications for finance and human resources, and KLA, a leader in semiconductor process control.
In the Health Care sector, we added drugmaker Eli Lilly, which has an exceptional GLP-1 franchise and a strong track record of innovation, and Vertex Pharmaceuticals, a high-quality biotech company run by a strong management team. We also added Industrials sector holding Ferguson Enterprises, a leading distributor of plumbing supplies and construction equipment.
The market has begun to grapple with policy expectations from a new presidential administration. We expect the debate between expected and realized policy to be a persistent theme in 2025.
As we look into the year ahead, we expect the following factors, some of which carry forward from 2024, to be notable drivers of investment returns:
| | • | | The path and continuation of frontier AI model scaling, which expands the capabilities and complexity of AI applications |
| | • | | Greater AI usage and workflow integration across consumer and enterprise businesses |
| | • | | Fiscal policy moves (e.g., tariffs, immigration) by the new administration and Congress and the combined impact on inflation, economic growth and interest rates |
| | • | | International markets experiencing growth recoveries (e.g., China, Europe, South America) |
We remain focused on executing our investment process and maintaining exposure to increasingly relevant, competitively advantaged businesses at attractive valuations. We continue to see attractive opportunities across the Materials and Financials sectors while opportunistically taking advantage of volatility in Information Technology in our pursuit of strong long-term returns.
As always, we are honored to have your trust as we continue pursuing Principles and Performance®.
Sincerely,

Todd C. Ahlsten
Lead Portfolio Manager
Benjamin E. Allen
Portfolio Manager

Andrew S. Choi
Portfolio Manager
8
| | | | |
| | |
| Annual Report • 2024 | | | | |
Parnassus Growth Equity Fund
Ticker: Investor Shares - PFGEX
Ticker: Institutional Shares - PFPGX
As of December 31, 2024, after taking dividends into account, Parnassus Growth Equity Fund – Investor Shares (the “Fund”) returned 26.85%, (net of fees) for the year, underperforming the Russell 1000 Growth’s 33.36%.
Below is a table that summarizes the performances of the Parnassus Growth Equity Fund and the Russell 1000 Growth. The returns are for the one-year and since inception periods.
Parnassus Growth Equity Fund
| | | | | | | | | | | | | | | | |
| |
| | | Average Annual Total Returns (%) | |
| |
| | | for period ended December 31, 2024 | |
| | | | |
| | | One
Year | | | Since
Inception* | | | Gross
Expense
Ratio | | | Net
Expense
Ratio | |
| | | | |
| Parnassus Growth Equity Fund – Investor Shares | | | 26.85 | | | | 35.15 | | | | 2.89 | | | | 0.84 | |
| | | | |
| Parnassus Growth Equity Fund – Institutional Shares | | | 27.13 | | | | 35.42 | | | | 1.86 | | | | 0.63 | |
| | | | |
| Russell 1000 Growth Index | | | 33.36 | | | | 39.02 | | | | NA | | | | NA | |
Performance data quoted represent past performance and are no guarantee of future returns. Current performance may be lower or higher than the performance data quoted. Current performance information to the most recent month end is available on the Parnassus website (www.parnassus.com). Investment return and principal value will fluctuate, so an investor’s shares, when redeemed, may be worth more or less than their original principal cost. Returns would have been lower if certain of the Fund’s fees and expenses had not been waived.
Returns shown in the table do not reflect the deduction of taxes a shareholder may pay on fund distributions or redemption of shares. The Russell 1000 Growth is an unmanaged index of common stocks, and it is not possible to invest directly in an index. Index figures do not take any expenses, fees or taxes into account, but mutual fund returns do.
The estimated impact of individual stocks on the Fund’s performance is provided by FactSet.
Contributions to returns quoted for individual stocks are their returns relative to the Fund’s index.
* Since Inception, December 28, 2022 (commencement of operations) through December 31, 2024.
As described in the Fund’s current prospectus dated May 1, 2024, Parnassus Investments, LLC has contractually agreed to reduce its investment advisory fee to the extent necessary to limit total annual fund operating expenses to 0.84% of net assets for the Parnassus Growth Equity Fund – Investor Shares and to 0.63% of net assets for the Parnassus Growth Equity Fund – Institutional Shares. This agreement will not be terminated prior to May 1, 2025, and may be continued indefinitely by the investment adviser on a year-to-year basis.
Year In Review
The Fund (Investor Shares) returned 26.85%, (net of fees) for the year, underperforming the Russell 1000 Growth’s 33.36%. Stock selection in the Information Technology, Consumer Discretionary and Communication Services sectors held back relative returns. Conversely, stock selection in the Health Care sector and both stock selection and an underweight in the Consumer Staples sector buoyed relative performance.
Natera shares rose throughout the year, as the genetic testing company gained market share, improved reimbursement and continued to publish data and gain traction for its cancer recurrence monitoring tests. More than 50% of oncologists in the U.S. have now used the Natera test.
Taiwan Semiconductor Manufacturing Co.’s leading position in AI chip production continued to boost investor sentiment on the stock. During the year, moves by several large technology companies to increase their AI investments underscored demand for TSMC’s chips and supported the stock’s rise.
Microsoft’s focus on AI investment provided a boost to the company’s revenue streams and its share price. Azure, Microsoft’s cloud computing business that integrates AI tools, drove significant growth during the year.
NVIDIA continued to lead the market for graphics processing units and semiconductor chips needed to power AI applications. Because our position in the stock is an underweight relative to the nearly 12% of the benchmark it now represents, it was a relative detractor for the year.
9
| | | | |
| | |
| | | | Annual Report • 2024 |
Intuit shares ended the year slightly higher but lagged the broader market and the Information Technology sector. However, we continue to believe Intuit’s customer growth and relevant platform will sustain its wide moat and long growth runway.
Akamai Technologies suffered an unexpected deterioration in its underlying business, notably on the content delivery side, in an intensely competitive industry. We exited the position.
Parnassus Growth Equity Fund
As of December 31, 2024
(percentage of net assets)
* For purposes of categorizing securities for diversification requirements under the Investment Company Act, the Fund uses industry classifications that are more specific than those used for the chart.
Portfolio characteristics and holdings are subject to change periodically.
10
| | | | |
| | |
| Annual Report • 2024 | | | | |
| | | | |
| |
| Top 10 Equity Holdings | | | | |
| (percentage of net assets) | | | | |
| |
| Microsoft Corp. | | | 9.0% | |
| |
| NVIDIA Corp. | | | 8.9% | |
| |
| Alphabet Inc., Class A | | | 6.4% | |
| |
| Amazon.com Inc. | | | 4.8% | |
| |
| Apple Inc. | | | 4.8% | |
| |
| Broadcom Inc. | | | 4.8% | |
| |
| Visa Inc., Class A | | | 4.6% | |
| |
| Salesforce Inc. | | | 3.2% | |
| |
| Eli Lilly & Co. | | | 2.9% | |
| |
| Natera Inc. | | | 2.4% | |
Portfolio characteristics and holdings are subject to change periodically.
Value on December 31, 2024
of $10,000 invested on December 28, 2022
The chart shows the growth in value of a hypothetical $10,000 investment since inception (December 28, 2022) and does not reflect the deduction of taxes a shareholder would pay on fund distributions or the redemption of fund shares.
Outlook and Strategy
The portfolio’s largest overweights are in Health Care and Financials, while its largest underweights are in Consumer Discretionary and Communication Services. These underweights are partially driven by large benchmark constituents we do not own, such as Meta Platforms and Tesla.
We continue to maintain a portfolio positioning balanced between offense and defense. While there is some uncertainty particularly around a new administration, the market continues to anticipate a favorable environment for risk and economic growth. We believe this backdrop warrants a continued, balanced portfolio positioning.
We sold two Health Care positions during the quarter, pharmaceutical company AstraZeneca and insurer UnitedHealth Group. AstraZeneca is under investigation concerning the company’s leadership in China, which increases the range of expected outcomes for the stock. UnitedHealth’s business model is becoming higher-risk, which coupled with slowing Medicare Advantage growth and regulatory uncertainty led to us exiting the position. With these proceeds, we bought two new positions in biotechnology company Vertex Pharmaceuticals and genetic-testing company Exact Sciences.
In Consumer Discretionary, we sold LVMH Moet Hennessy Louis Vuitton, which faces a potentially prolonged economic recovery in China, one of its major markets. With the proceeds, we bought food delivery company DoorDash.
We also added several new positions, including two in Information Technology: Atlassian, a maker of innovative software that allows IT developers and other employees to seamlessly collaborate on complex projects, and Datadog, a dominant cloud monitoring platform.
The market has begun to grapple with policy expectations from a new presidential administration. We expect the debate between expected and realized policy to be a persistent theme in 2025.
As we look into the year ahead, we expect the following factors, some of which carry forward from 2024, to be notable drivers of investment returns:
| | • | | The path and continuation of frontier AI model scaling, which expands the capabilities and complexity of AI applications |
| | • | | Greater AI usage and workflow integration across consumer and enterprise businesses |
| | • | | Fiscal policy moves (e.g., tariffs, immigration) by the new administration and Congress and the combined impact on inflation, economic growth and interest rates |
| | • | | International markets experiencing growth recoveries (e.g., China, Europe, South America) |
We remain focused on executing our investment process and maintaining exposure to increasingly relevant, competitively advantaged businesses at
11
| | | | |
| | |
| | | | Annual Report • 2024 |
attractive valuations. We continue to see attractive opportunities across the Health Care, Financials and Materials sectors while opportunistically taking advantage of volatility in Information Technology in our pursuit of strong long-term returns.
As always, we are honored to have your trust as we continue pursuing Principles and Performance®.
Sincerely,
Andrew S. Choi
Lead Portfolio Manager

Shivani R. Vohra
Portfolio Manager
12
| | | | |
| | |
| Annual Report • 2024 | | | | |
Parnassus Value Equity Fund
Ticker: Investor Shares - PARWX
Ticker: Institutional Shares - PFPWX
As of December 31, 2024, after taking dividends into account, Parnassus Value Equity Fund – Investor Shares (the “Fund”) returned 12.01% (net of fees), trailing the Russell 1000 Value’s 14.37%.
Below is a table that summarizes the performances of the Parnassus Growth Equity Fund and the Russell 1000 Value. The returns are for the one-, three-, five- and ten-year periods.
Parnassus Value Equity Fund
| | | | | | | | | | | | | | | | | | | | | | | | |
| |
| | | Average Annual Total Returns (%) | |
| |
| | | for period ended December 31, 2024 | |
| | | | | | |
| | | One
Year | | | Three
Years | | | Five
Years | | | Ten
Years | | | Gross
Expense
Ratio | | | Net
Expense
Ratio | |
| | | | | | |
| Parnassus Value Equity Fund – Investor Shares | | | 12.01 | | | | 3.15 | | | | 12.89 | | | | 12.25 | | | | 0.93 | | | | 0.88 | |
| | | | | | |
| Parnassus Value Equity Fund – Institutional Shares | | | 12.27 | | | | 3.39 | | | | 13.14 | | | | 12.49 | | | | 0.72 | | | | 0.65 | |
| | | | | | |
| Russell 1000 Value Index | | | 14.37 | | | | 5.63 | | | | 8.69 | | | | 8.49 | | | | NA | | | | NA | |
The average annual total return for the Parnassus Value Equity Fund – Institutional Shares from commencement (April 30, 2015) was 12.53%. Performance shown prior to the inception of the Institutional Shares reflects the performance of the Parnassus Value Equity Fund – Investor Shares and includes expenses that are not applicable to and are higher than those of the Institutional Shares. The performance of the Institutional Shares differs from that shown for the Investor Shares to the extent that the classes do not have the same expenses.
Performance data quoted represent past performance and are no guarantee of future returns. Current performance may be lower or higher than the performance data quoted. Current performance information to the most recent month end is available on the Parnassus website (www.parnassus.com). Investment return and principal value will fluctuate, so an investor’s shares, when redeemed, may be worth more or less than their original principal cost. Returns would have been lower if certain of the Fund’s fees and expenses had not been waived.
Returns shown in the table do not reflect the deduction of taxes a shareholder may pay on fund distributions or redemption of shares. The Russell 1000 Value is an unmanaged index of common stocks, and it is not possible to invest directly in an index. Index figures do not take any expenses, fees or taxes into account, but mutual fund returns do.
The estimated impact of individual stocks on the Fund’s performance is provided by FactSet.
Contributions to returns quoted for individual stocks are their returns relative to the Fund’s index.
As described in the Fund’s current prospectus dated May 1, 2024, Parnassus Investments, LLC has contractually agreed to reduce its investment advisory fee to the extent necessary to limit total annual fund operating expenses to 0.88% of net assets for the Parnassus Vaule Equity Fund – Investor Shares and to 0.65% of net assets for the Parnassus Value Equity Fund – Institutional Shares. This agreement will not be terminated prior to May 1, 2025, and may be continued indefinitely by the investment adviser on a year-to-year basis.
Year In Review
For calendar year 2024, the Fund (Investor Shares) returned 12.01% (net of fees), trailing the Russell 1000 Value’s 14.37%. Stock selection in the Health Care sector notably weighed on relative performance. In contrast, strong stock selection in Real Estate boosted relative returns.
Oracle stock posted its best annual performance since 1999 as the software giant gained market share in cloud-based training of generative AI models. New and promising strategic partnerships include a deal with Meta Platforms to develop AI agents.
Broadcom gained on the strength of better-than-expected sales of AI chips to hyperscalers such as Google and Meta Platforms, as well as optimism on the revenue-generating potential of its wide-ranging AI initiatives generally.
Progressive continues to benefit from higher pricing for auto and home insurance, which is bolstering its underwriting results. An increase in investment income from higher interest rates further boosted sentiment.
Intel shares declined as the chipmaker announced a major cost-cutting plan and reported disappointing financial results.
Biogen shares were pressured by the slow launch of the company’s Alzheimer’s drug, a novel treatment that requires extensive infrastructure buildup. Given our concerns over uncertainty in the Alzheimer’s market, we exited the position.
NICE stock fell due to concerns over its CEO’s departure and fears that its contact center software could be replaced by generative AI. We believe the concerns are overblown and anticipate instead that the firm will integrate AI features successfully.
13
| | | | |
| | |
| | | | Annual Report • 2024 |
Parnassus Value Equity Fund
As of December 31, 2024
(percentage of net assets)
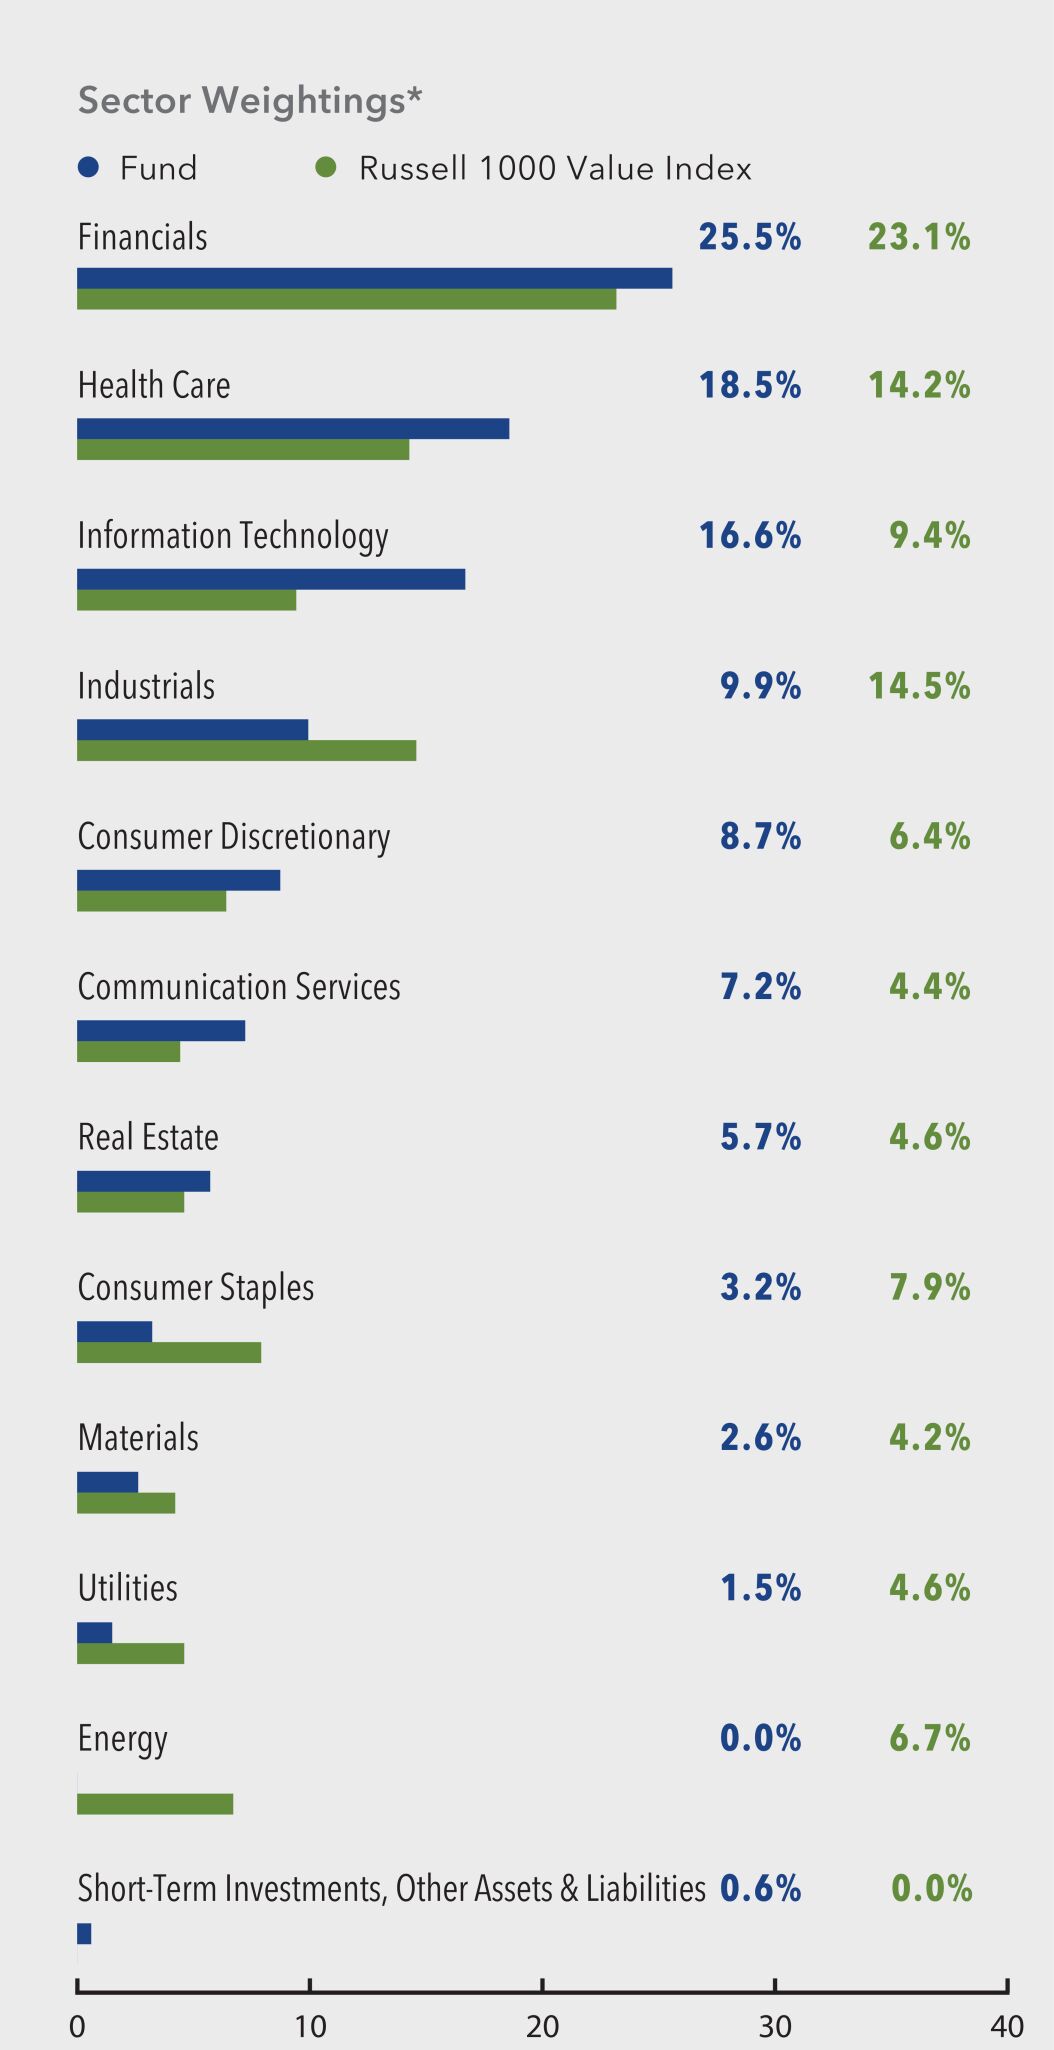
* For purposes of categorizing securities for diversification requirements under the Investment Company Act, the Fund uses industry classifications that are more specific than those used for the chart.
Portfolio characteristics and holdings are subject to change periodically.
| | | | |
| |
| Top 10 Equity Holdings | | | | |
| (percentage of net assets) | | | | |
| |
| S&P Global Inc. | | | 3.5% | |
| |
| Bank of America Corp. | | | 3.3% | |
| |
| Sysco Corp. | | | 3.2% | |
| |
| CBRE Group Inc., Class A | | | 3.2% | |
| |
| Deere & Co. | | | 3.1% | |
| |
| Verizon Communications Inc. | | | 2.9% | |
| |
| Mastercard Inc., Class A | | | 2.9% | |
| |
| Broadcom Inc. | | | 2.8% | |
| |
| Alphabet Inc., Class A | | | 2.8% | |
| |
| Cummins Inc. | | | 2.7% | |
Portfolio characteristics and holdings are subject to change periodically.
Value on December 31, 2024
of $10,000 invested on December 31, 2014
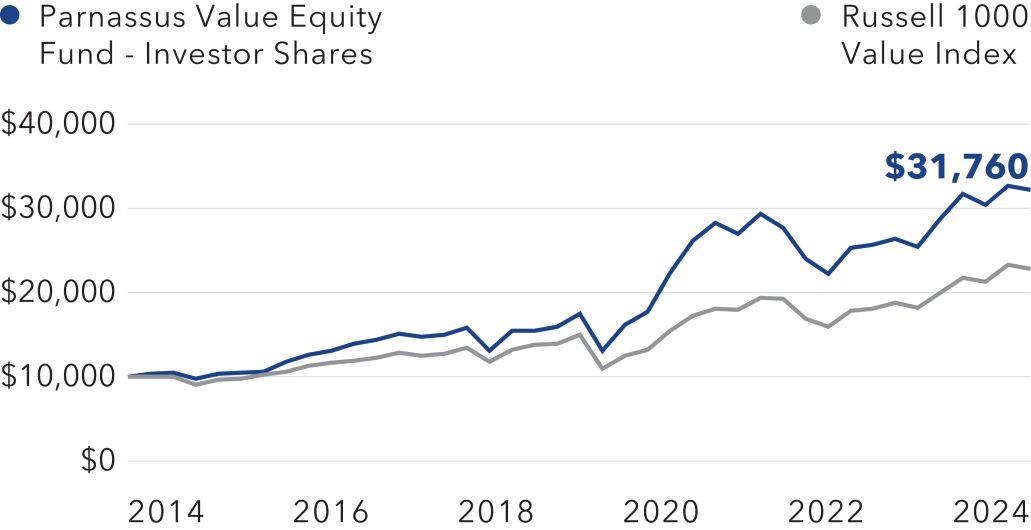
The chart shows the growth in value of a hypothetical $10,000 investment over the last 10 years and does not reflect the deduction of taxes a shareholder would pay on fund distributions or the redemption of fund shares.
Outlook and Strategy
Information Technology remains our largest overweight allocation relative to the benchmark, and it grew during the quarter with the addition of Applied Materials, one of the world’s leading suppliers of wafer fabrication equipment for semiconductors. We expect the secular growth in high-performance computing applications like AI to continue, despite near-term cyclical softness in demand for PCs and smartphones.
In the Financials sector, we maintained our positions in select names that can benefit from stable to higher interest rates. Economic conditions have improved compared to last year, along with expectations for growth, given the favorable regulatory and tax regime suggested by the new administration.
14
| | | | |
| | |
| Annual Report • 2024 | | | | |
In the Health Care sector, we gained access to industry-leading research and development (R&D) teams and drug pipelines with AstraZeneca and added exposure to the blockbuster metabolic drug market with Ozempic maker Novo Nordisk.
In the Consumer Discretionary sector, we added a position in Airbnb, which has a consistent focus on profitability and a track record of customer-centric innovation. We also added Visa in the Financials sector. Its valuation is attractive relative to its history and its peers, given the high quality of its business and the shift from cash to digital payments.
We also exited several positions, including Materials holding Nutrien, which has faced pricing challenges, and Health Care stock Biogen, whose Alzheimer’s drug, Leqembi, has underperformed expectations.
Companies we hold in the portfolio have exposure to thematic tailwinds, durable competitive positions, a history of operating profitably and sustainable business practices. Our portfolio additions exemplify this time-tested approach for generating attractive long-term returns through various market cycles.
U.S. stocks outperformed most investor expectations this year. This robust performance was largely driven by the strong appreciation of technology stocks. Companies leveraging advancements in AI experienced remarkable share price increases. Broadcom’s stock, for example, more than doubled as its custom chips and networking equipment became increasingly critical for AI infrastructure. Stocks also found support from anticipated Federal Reserve interest rate cuts (Fed rate cut).
Toward the end of the year, we saw a shift in investor sentiment toward more economically sensitive sectors. A continuation of this trend could support a broadening of the stock market rally, especially in value stocks, which tend to be more sensitive to interest
rates. Recent volatility aside, we believe we could be entering a favorable period for equities. The new U.S. president has championed market-friendly policies, and the Fed has more flexibility to protect labor market stability now that inflation has peaked and is falling.
That said, several problematic factors could potentially impact equity markets in the near term. For one, inflation remains elevated compared to pre-2021 levels, which could cause the Fed to pare back the scope of its likely 2025 rate cuts. In addition, the robust stock rally of recent years has resulted in historically high valuations, putting pressure on earnings expectations. From a geopolitical perspective, slowing growth across regions and conflicts in the Middle East and between Ukraine and Russia could create market instability.
Our long-term investment philosophy remains steadfast. By opportunistically allocating capital to undervalued opportunities, we are well positioned to capitalize on potential market volatility in the year ahead. Our balanced approach allows us to navigate complex market conditions while pursuing sustainable growth for our shareholders.
Thank you for your investment in the Parnassus Value Equity Fund.

Billy J. Hwan
Lead Portfolio Manager

Krishna S. Chintalapalli
Portfolio Manager
15
| | | | |
| | |
| | | | Annual Report • 2024 |
Parnassus Mid Cap Fund
Ticker: Investor Shares - PARMX
Ticker: Institutional Shares - PFPMX
As of December 31, 2024, after taking dividends into account, the Parnassus Mid Cap Fund – Investor Shares (the “Fund”) returned 9.99% (net of fees) in 2024, underperforming the Russell Midcap Index’s 15.34% return.
Below is a table that summarizes the performances of the Parnassus Mid Cap Fund and the Russell Midcap. The returns are for the one-, three-, five- and ten-year periods.
Parnassus Mid Cap Fund
| | | | | | | | | | | | | | | | | | | | | | | | |
| |
| | | Average Annual Total Returns (%) | |
| |
| | | for period ended December 31, 2024 | |
| | | | | | |
| | | One
Year | | | Three
Years | | | Five
Years | | | Ten
Years | | | Gross
Expense
Ratio | | | Net
Expense
Ratio | |
| | | | | | |
| Parnassus Mid Cap Fund – Investor Shares | | | 9.99 | | | | -0.94 | | | | 5.38 | | | | 7.61 | | | | 0.98 | | | | 0.96 | |
| | | | | | |
| Parnassus Mid Cap Fund – Institutional Shares | | | 10.21 | | | | -0.74 | | | | 5.61 | | | | 7.84 | | | | 0.76 | | | | 0.75 | |
| | | | | | |
| Russell Midcap Index | | | 15.34 | | | | 3.79 | | | | 9.92 | | | | 9.63 | | | | NA | | | | NA | |
The average annual total return for the Parnassus Mid Cap Fund – Institutional Shares from commencement (April 30, 2015) was 8.04%. Performance shown prior to the inception of the Institutional Shares reflects the performance of the Parnassus Mid Cap Fund – Investor Shares and includes expenses that are not applicable to and are higher than those of the Institutional Shares. The performance of the Institutional Shares differs from that shown for the Investor Shares to the extent that the classes do not have the same expenses.
Performance data quoted represent past performance and are no guarantee of future returns. Current performance may be lower or higher than the performance data quoted. Current performance information to the most recent month end is available on the Parnassus website (www.parnassus.com). Investment return and principal value will fluctuate, so an investor’s shares, when redeemed, may be worth more or less than their original principal cost.
Returns shown in the table do not reflect the deduction of taxes a shareholder may pay on fund distributions or redemption of shares. The Russell Midcap Index is an unmanaged index of common stocks, and it is not possible to invest directly in an index. Index figures do not take any expenses, fees or taxes into account, but mutual fund returns do. Mid cap companies can be more sensitive to changing economic conditions and have fewer financial resources than large cap companies.
The estimated impact of individual stocks on the Fund’s performance is provided by FactSet.
Contributions to returns quoted for individual stocks are their returns relative to the Fund’s index.
As described in the Fund’s current prospectus dated May 1, 2024, Parnassus Investments, LLC has contractually agreed to reduce its investment advisory fee to the extent necessary to limit total annual fund operating expenses to 0.96% of net assets for the Parnassus Mid Cap Fund – Investor Shares and to 0.75% of net assets for the Parnassus Mid Cap Fund – Institutional Shares. This agreement will not be terminated prior to May 1, 2025, and may be continued indefinitely by the investment adviser on a year-to-year basis.
Year In Review
The Fund (Investor shares) returned 9.99% (net of fees) in 2024, underperforming the Russell Midcap Index’s 15.34% return. Stock selection within Communication Services and Real Estate contributed to relative performance, while selection within Industrials and Information Technology detracted.
Guidewire Software was a top contributor for the year, driven by its successful execution of its cloud migration strategy and rising global demand. After its successful run, we trimmed our position in the company during the fourth quarter.
Fortinet gained for the year-to-date by leveraging its strong market position and growing demand for integrated, platform-based security solutions to drive growth, supported by robust customer loyalty and an expanding presence in critical areas like cloud security and operations.
The Trade Desk, a media-buying platform, continues to position itself as a critical player in the shift toward programmatic advertising by focusing on collaboration with advertisers and creating value in connected TV and emerging formats.
J.B. Hunt, the largest intermodal transportation provider in the U.S., was hampered by weaker freight demand and competitive pressures from depressed truckload rates that weighed on revenue and margins. At current valuations, we see J.B Hunt as well positioned to capitalize from a recovery in volumes.
IQVIA Holdings faced headwinds as the broader biopharma industry adapted to evolving R&D priorities and shifting spending patterns, though the company maintained momentum in its technology solutions.
Roper Technologies, a diversified technology solutions provider, dealt with disruptions across key sectors—including freight markets, the entertainment industry and water metering—that tempered its overall performance.
16
| | | | |
| | |
| Annual Report • 2024 | | | | |
Parnassus Mid Cap Fund
As of December 31, 2024
(percentage of net assets)
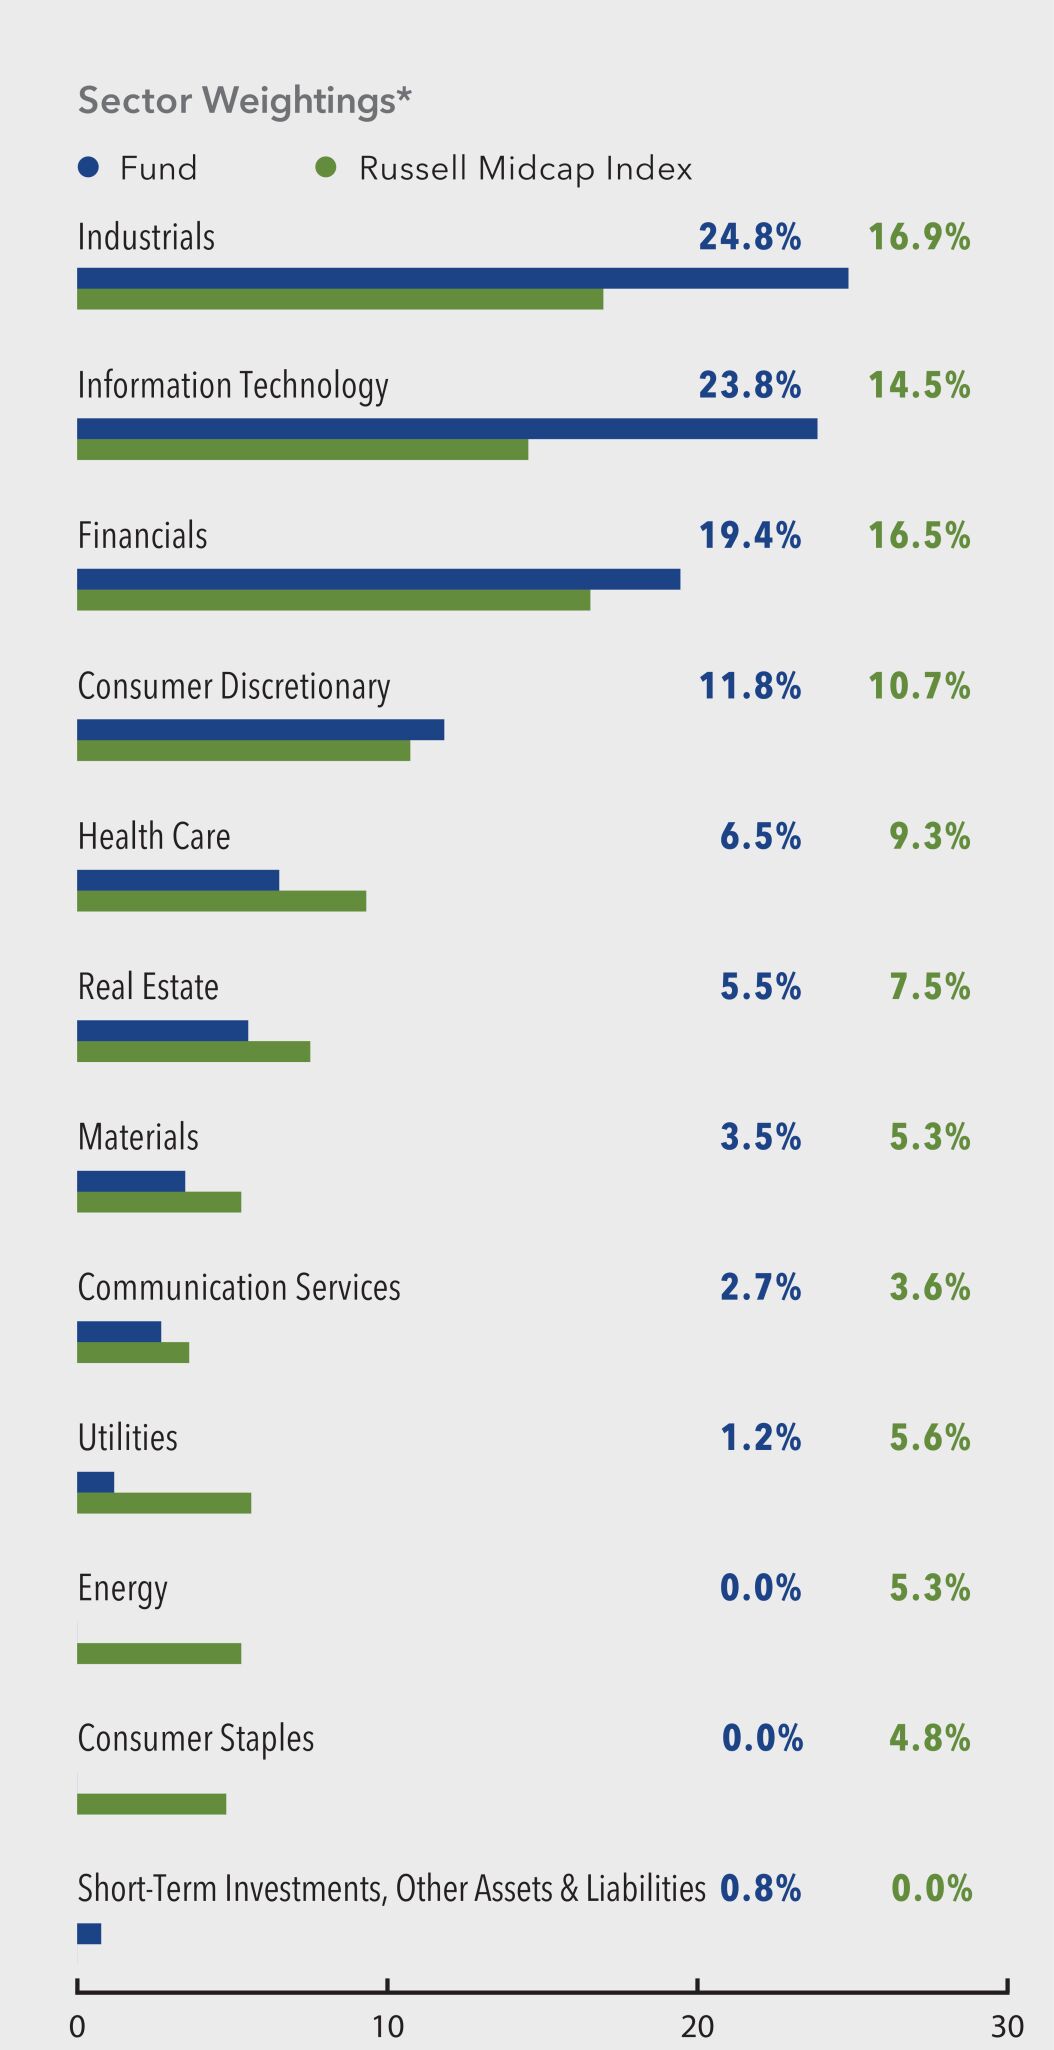
* For purposes of categorizing securities for diversification requirements under the Investment Company Act, the Fund uses industry classifications that are more specific than those used for the chart.
Portfolio characteristics and holdings are subject to change periodically.
| | | | |
| |
Top 10 Equity Holdings | | | | |
(percentage of net assets) | | | | |
| |
Fidelity National Information Services | | | 4.0% | |
| |
TransUnion | | | 3.8% | |
| |
CBRE Group Inc., Class A | | | 3.7% | |
| |
Fortinet Inc. | | | 3.7% | |
| |
J.B. Hunt Transport Services Inc. | | | 3.6% | |
| |
Cboe Global Markets Inc. | | | 3.5% | |
| |
The Bank of New York Mellon Corp. | | | 3.4% | |
| |
Roper Technologies Inc. | | | 3.3% | |
| |
Truist Financial Corp. | | | 3.3% | |
| |
Republic Services Inc. | | | 3.1% | |
Portfolio characteristics and holdings are subject to change periodically.
Value on December 31, 2024
of $10,000 invested on December 31, 2014
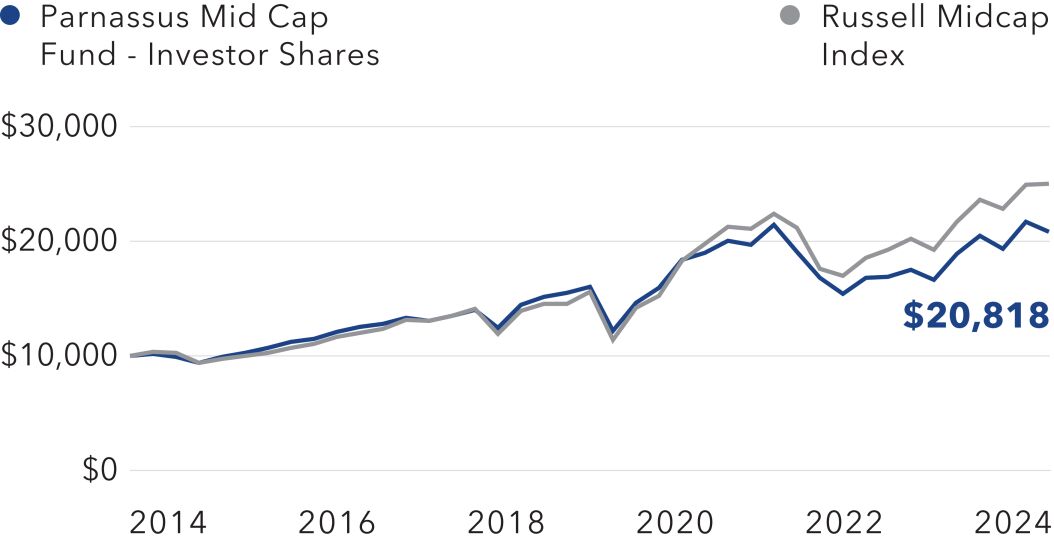
The chart shows the growth in value of a hypothetical $10,000 investment over the last 10 years and does not reflect the deduction of taxes a shareholder would pay on fund distributions or the redemption of fund shares.
Outlook and Strategy
During the quarter, we added to positions in businesses currently in cyclical downturns, as we believe their stocks have the potential for a cyclical upturn and a secular valuation re-rating. Semiconductor stocks Western Digital and Lam Research underperformed because they do not directly benefit from AI. We believe both should benefit as the benefits of AI broaden and end markets recover. Distributors Pool Corporation and Ferguson Enterprises should benefit from an improved housing backdrop. Truist Financial Corporation could benefit from broadening economic growth and less restrictive bank regulation under the Trump administration. We added to Xylem as its stock lagged during the quarter’s rally despite what we think is an attractive secular backdrop for water infrastructure.
17
| | | | |
| | |
| | | | Annual Report • 2024 |
We re-initiated a position in Brookfield Renewables Energy Corporation. As one of the world’s largest owners and operators of renewables, Brookfield is well positioned to capture the growing demand for clean power, especially from large global tech players expanding their AI-driven data center capacity.
To accommodate these additions, we exited healthcare-focused REIT Alexandria Realty on concerns that oversupply of medical office space could constrain a recovery. We exited Avantor due to concerns around its competitive position in bioprocessing. We took some profits in Guidewire and trimmed our position in paint manufacturer Sherwin-Williams, as we see more upside in our other housing stocks.
Our portfolio remains overweight the Information Technology, Industrials, Financials and Consumer Discretionary sectors as we believe that we own a collection of competitively advantaged, increasingly relevant businesses.
This year, investors favored stocks with compelling AI narratives and highly cyclical growth plays poised to benefit from the Trump administration’s anticipated regulatory rollbacks. As a result, we saw a second consecutive year of strong returns for the mid cap category.
After keeping pace with the index through the third quarter, the strategy lost ground during the fourth quarter as price momentum surged. While it can be tempting to chase price momentum, it eventually stalls or reverses when earnings expectations become difficult to exceed or valuations expand to unsustainable levels. This dynamic often turns today’s winners into tomorrow’s losers, particularly among cyclical stocks lacking strong competitive advantages.
As Parnassus CIO Todd Ahlsten noted in his 2025 Outlook, “…sometimes the hardest thing to do is nothing.” For us, this means staying disciplined—resisting fleeting trends and market noise. Our focus
remains on curating a high-quality portfolio designed for strong, long-term, risk-adjusted returns.
We are excited about our thematic overweights in software, semiconductors, life sciences tools, housing and freight transportation. We added to these positions at attractive prices. Semiconductor holdings are poised to rebound as supply-demand dynamics improve, while easing rates should boost freight and housing activity. Life sciences tools are set for growth as COVID-era inventory headwinds ease, and software holdings offer multi-year secular growth with expanding margins. We believe these investments will behave like coiled springs. Backed by their durable competitive advantages, we believe they will unlock significant value as cycles turn upward. Our disciplined approach—emphasizing quality, financial strength and attractive valuations—positions the Fund to help protect capital during downturns while capturing upside in favorable markets.
We thank you for your continued trust and investment in the Parnassus Mid Cap Fund.
Yours truly,

Matthew D. Gershuny
Portfolio Manager

Lori A. Keith
Portfolio Manager

Ian E. Sexsmith
Portfolio Manager
18
| | | | |
| | |
| Annual Report • 2024 | | | | |
Parnassus Mid Cap Growth Fund
Ticker: Investor Shares - PARNX
Ticker: Institutional Shares - PFPRX
As of December 31, 2024, after taking dividends into account, the Parnassus Mid Cap Growth Fund – Investor Shares (the “Fund”) returned 10.55% (net of fees) in 2024, underperforming the Russell Midcap Growth Index’s 22.10% return.
Below is a table that summarizes the performances of the Parnassus Mid Cap Growth Fund and the Russell Midcap Growth. The returns are for the one-, three-, five- and ten-year periods.
Parnassus Mid Cap Growth Fund
| | | | | | | | | | | | | | | | | | | | | | | | |
| |
| | | Average Annual Total Returns (%) | |
| |
| | | for period ended December 31, 2024 | |
| | | | | | |
| | | One
Year | | | Three
Years | | | Five
Years | | | Ten
Years | | | Gross
Expense
Ratio | | | Net
Expense
Ratio | |
| | | | | | |
| Parnassus Mid Cap Growth Fund – Investor Shares | | | 10.55 | | | | -0.12 | | | | 6.99 | | | | 8.05 | | | | 0.81 | | | | 0.80 | |
| | | | | | |
| Parnassus Mid Cap Growth Fund – Institutional Shares | | | 10.68 | | | | 0.00 | | | | 7.12 | | | | 8.19 | | | | 0.71 | | | | 0.68 | |
| | | | | | |
| Russell Midcap Growth Index | | | 22.10 | | | | 4.04 | | | | 11.47 | | | | 11.54 | | | | NA | | | | NA | |
The average annual total return for the Parnassus Mid Cap Growth Fund – Institutional Shares from commencement (April 30, 2015) was 8.17%. Performance shown prior to the inception of the Institutional Shares reflects the performance of the Parnassus Mid Cap Growth Fund – Investor Shares and includes expenses that are not applicable to and are higher than those of the Institutional Shares. The performance of Institutional Shares differs from that shown for the Investor Shares to the extent that the classes do not have the same expenses.
Performance data quoted represent past performance and are no guarantee of future returns. Current performance may be lower or higher than the performance data quoted. Current performance information to the most recent month end is available on the Parnassus website (www.parnassus.com). Investment return and principal value will fluctuate, so an investor’s shares, when redeemed, may be worth more or less than their original principal cost.
Returns shown in the table do not reflect the deduction of taxes a shareholder may pay on fund distributions or redemption of shares. The Russell Mid Cap Growth is an index of common stocks, and it is not possible to invest directly in an index. Index figures do not take any expenses, fees or taxes into account, but mutual fund returns do.
The estimated impact of individual stocks on the Fund’s performance is provided by FactSet.
Contributions to returns quoted for individual stocks are their returns relative to the Fund’s index.
As described in the Fund’s current prospectus dated May 1, 2024, Parnassus Investments, LLC has contractually agreed to reduce its investment advisory fee to the extent necessary to limit total annual fund operating expenses to 0.80% of net assets for the Parnassus Mid Cap Growth Fund – Investor Shares and to 0.68% of net assets for the Parnassus Mid Cap Growth Fund – Institutional Shares. This agreement will not be terminated prior to May 1, 2025, and may be continued indefinitely by the investment adviser on a year-to-year basis.
Year In Review
The Fund (Investor shares) returned 10.55% (net of fees) in 2024, underperforming the Russell Midcap Growth Index’s 22.10% return. A lack of exposure to Consumer Staples and stock selection within Communication Services contributed while stock selection within Information Technology and Consumer Discretionary detracted.
Guidewire Software was the top contributor for the year, driven by the successful execution of its cloud migration strategy and rising global demand. The company consistently expanded its presence through new Guidewire Cloud deals.
Progressive Corporation, a leading auto insurer, significantly improved its underwriting profitability and pivoted its focus to growth, capitalizing on peers who were still repairing their own profitability.
Fortinet leveraged its strong market position and growing demand for integrated, platform-based security solutions to drive growth, supported by robust customer loyalty and an expanding presence in critical areas like cloud security and operations.
Old Dominion Freight Line, a leading U.S. less-than-truckload carrier, saw sluggish demand in industrial end markets and elevated capacity pressured profitability. We expect a better year for freight volumes, and for Old Dominion, in 2025.
CoStar Group, a leading provider of online real estate marketplaces, detracted as significant investment in its residential marketplace tempered investor sentiment amid broader real estate market challenges.
IDEXX Laboratories is a leader in veterinary diagnostics. Softer-than-expected clinic visits weighed on revenue growth despite its strong market position and continued demand for its diagnostics platforms.
19
| | | | |
| | |
| | | | Annual Report • 2024 |
Parnassus Mid Cap Growth Fund
As of December 31, 2024
(percentage of net assets)
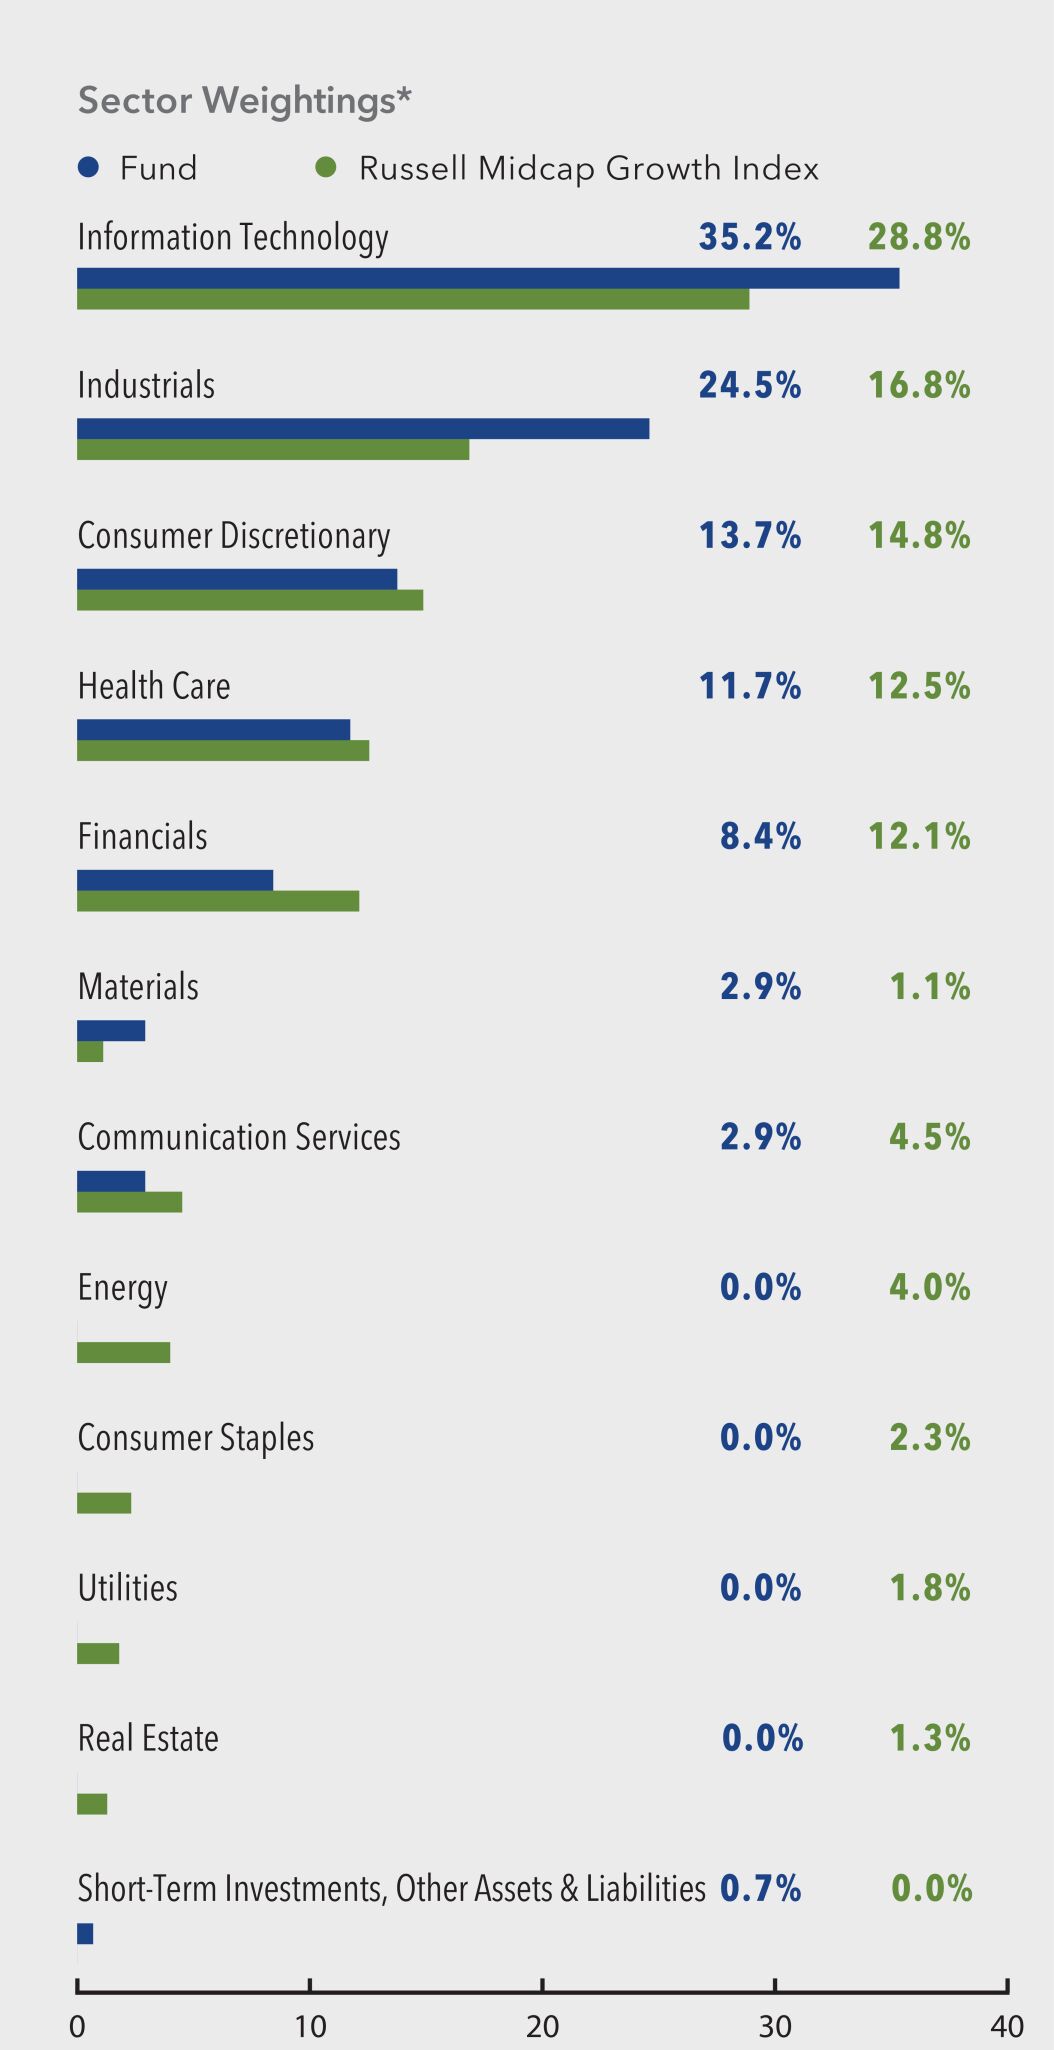
* For purposes of categorizing securities for diversification requirements under the Investment Company Act, the Fund uses industry classifications that are more specific than those used for the chart.
Portfolio characteristics and holdings are subject to change periodically.
| | | | |
| |
| Top 10 Equity Holdings | | | | |
| (percentage of net assets) | | | | |
| |
| Equifax Inc. | | | 4.4% | |
| |
| Old Dominion Freight Line Inc. | | | 4.0% | |
| |
| J.B. Hunt Transport Services Inc. | | | 4.0% | |
| |
| Trane Technologies plc | | | 3.9% | |
| |
| Atlassian Corp., Class A | | | 3.7% | |
| |
| Teradyne Inc. | | | 3.6% | |
| |
| MercadoLibre Inc. | | | 3.4% | |
| |
| Block Inc., Class A | | | 3.2% | |
| |
| Workday Inc., Class A | | | 3.2% | |
| |
| Hilton Worldwide Holdings Inc. | | | 3.1% | |
Portfolio characteristics and holdings are subject to change periodically.
Value on December 31, 2024
of $10,000 invested on December 31, 2014
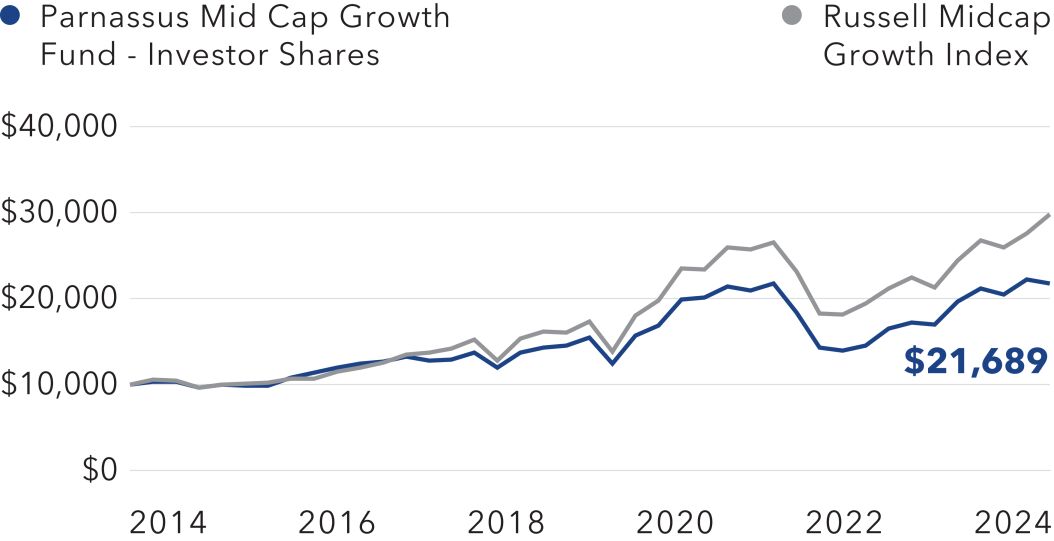
The chart shows the growth in value of a hypothetical $10,000 investment over the last 10 years and does not reflect the deduction of taxes a shareholder would pay on fund distributions or the redemption of fund shares.
Outlook and Strategy
We maintained our key thematic overweights in the semiconductor, life sciences tools, housing and freight transportation industries. We’ve identified innovative, competitively advantaged, market-share gainers in these industries that we believe can deliver strong performance over the coming years.
During the fourth quarter, we increased our exposure to freight transportation, capitalizing on the continued underperformance of Old Dominion Freight Lines and JB Hunt. Freight volumes remained weak through 2024, but we expect volumes to improve in 2025. While software was a large thematic overweight entering the quarter, we trimmed our position in Guidewire given its strong performance, which reduced our software overweight.
20
| | | | |
| | |
| Annual Report • 2024 | | | | |
We initiated a position in Rockwell Automation, a leader in industrial automation that helps factories to manufacture goods more efficiently. Industrial production has faced a multi-year slump, but we anticipate a rebound as economic growth broadens. We also re-initiated a position in Block, which operates the Cash App and the Square platforms. The company has made significant progress in improving its profit margins and is turning its focus back to growth.
We exited four holdings during the quarter. We took gains in Progressive on the concern that the auto insurance industry might become more competitive in 2025. We sold Adyen, an international e-commerce payment processor, to refocus on U.S. exposure. We exited Align, a clear aligner and dental technology provider, due to disappointing growth. Lastly, we sold CoStar Group, a real estate analytics provider, because we became more concerned about management’s ability to generate value while heavily investing in Homes.com.
Investors gravitated toward stocks with compelling artificial intelligence (AI) narratives and cyclical growth plays poised to benefit from the Trump administration’s promised regulatory rollbacks. This led to a second consecutive year of strong returns for the mid cap growth category.
While we kept pace with the benchmark through the third quarter, our strategy did not participate in the fourth-quarter rally that was driven by price momentum. While it can be tempting to chase price momentum, it eventually stalls or reverses when earnings expectations become difficult to exceed or valuations expand to unsustainable levels. This dynamic often turns today’s winners into tomorrow’s losers, particularly among cyclical stocks without competitive moats or proven leadership.
As Parnassus CIO Todd Ahlsten said in his 2025 Outlook, “…sometimes the hardest thing to do is nothing.” For us, doing nothing means remaining disciplined—avoiding short-term trends or reactive moves—and constructing a high-quality portfolio for strong long-term returns.
We’ve never felt better about the prospects for our portfolio. We have validated our convictions in our thematic overweights of semiconductors, life sciences tools, housing and freight transportation. We added to these positions at attractive prices as others chased momentum. We believe these themes are well positioned for a cyclical upturn if the economy accelerates and the market broadens. We also believe that our portfolio of competitively advantaged market leaders is poised for a secular valuation re-rating when their cycles turn upward, which could unlock significant value—like coiled springs. Finally, if 2025 brings a market downturn, we believe our holdings’ reasonable valuations should help provide downside protection.
Thank you for your investment in the Parnassus Mid Cap Growth Fund.
Yours truly,
Ian E. Sexsmith
Lead Portfolio Manager

Robert J. Klaber
Portfolio Manager
21
| | | | |
| | |
| | | | Annual Report • 2024 |
Parnassus Fixed Income Fund
Ticker: Investor Shares - PRFIX
Ticker: Institutional Shares - PFPLX
As of December 31, 2024, after taking dividends into account, the Parnassus Fixed Income Fund – Investor Shares (the “Fund”) returned 1.92% (net of fees) for the year, outperforming the Bloomberg U.S. Aggregate Bond Index’s 1.25% return.
Below is a table that summarizes the performances of the Parnassus Fixed Income Fund and the Bloomberg U.S. Aggregate Bond. The returns are for the one-, three-, five- and ten-year periods.
Parnassus Fixed Income Fund
| | | | | | | | | | | | | | | | | | | | | | | | |
| |
| | | Average Annual Total Returns (%) | |
| |
| | | for period ended December 31, 2024 | |
| | | | | | |
| | | One
Year | | | Three
Years | | | Five
Years | | | Ten
Years | | | Gross
Expense
Ratio | | | Net
Expense
Ratio | |
| | | | | | |
| Parnassus Fixed Income Fund – Investor Shares | | | 1.92 | | | | -2.31 | | | | -0.30 | | | | 1.28 | | | | 0.81 | | | | 0.58 | |
| | | | | | |
| Parnassus Fixed Income Fund – Institutional Shares | | | 2.13 | | | | -2.10 | | | | -0.08 | | | | 1.48 | | | | 0.61 | | | | 0.39 | |
| | | | | | |
| Bloomberg U.S. Aggregate Bond Index | | | 1.25 | | | | -2.41 | | | | -0.33 | | | | 1.35 | | | | NA | | | | NA | |
The average annual total return for the Parnassus Fixed Income Fund – Institutional Shares from commencement (April 30, 2015) was 1.41%. Performance shown prior to the inception of the Institutional Shares reflects the performance of the Parnassus Fixed Income Fund – Investor Shares and includes expenses that are not applicable to and are higher than those of the Institutional Shares. The performance of the Institutional Shares differs from that shown for the Investor Shares to the extent that the classes do not have the same expenses.
Performance data quoted represent past performance and are no guarantee of future returns. Current performance may be lower or higher than the performance data quoted. Current performance information to the most recent month end is available on the Parnassus website (www.parnassus.com). Investment return and principal value will fluctuate, so an investor’s shares, when redeemed, may be worth more or less than their original cost. Returns would have been lower if certain of the Fund’s fees and expenses had not been waived.
Returns shown in the table do not reflect the deduction of taxes a shareholder would pay in fund distributions or redemption of shares. The Bloomberg U.S. Aggregate Bond Index (formerly known as the Barclays U.S. Aggregate Bond Index) is an unmanaged index of bonds, and it is not possible to invest directly in an index. Index figures do not take any expenses, fees or taxes into account, but mutual fund returns do.
The estimated impact of individual stocks on the Fund’s performance is provided by FactSet.
Contributions to returns quoted for individual stocks are their returns relative to the Fund’s index.
As described in the Fund’s current prospectus dated May 1, 2024, Parnassus Investments, LLC has contractually agreed to waive 0.10% of its management fee for each class, and to reimburse the Fund for expenses to the extent necessary to limit total operating expenses to 0.58% of net assets for the Parnassus Fixed Income Fund – Investor Shares and to 0.39% of net assets for the Parnassus Fixed Income Fund – Institutional Shares. This agreement will not be terminated prior to May 1, 2025, and may be continued indefinitely by the Adviser on a year-to-year basis.
Year in Review
The Fund (Investor Shares) returned 1.92% (net of fees) for the year, outperforming the Bloomberg U.S. Aggregate Bond Index’s 1.25% return. Corporate bonds were the primary drivers of outperformance, supported by both the Fund’s overweight position and favorable security selection. Within corporates, Financial Services and Industrial Bonds stood out as strong contributors, reflecting the impact of favorable credit spreads and robust fundamentals.
Security selection within Treasuries, however, modestly detracted from performance, with the portfolio’s longer-duration exposure encountering headwinds from rising yields.
22
| | | | |
| | |
| Annual Report • 2024 | | | | |
Parnassus Fixed Income Fund
As of December 31, 2024
(percentage of net assets)
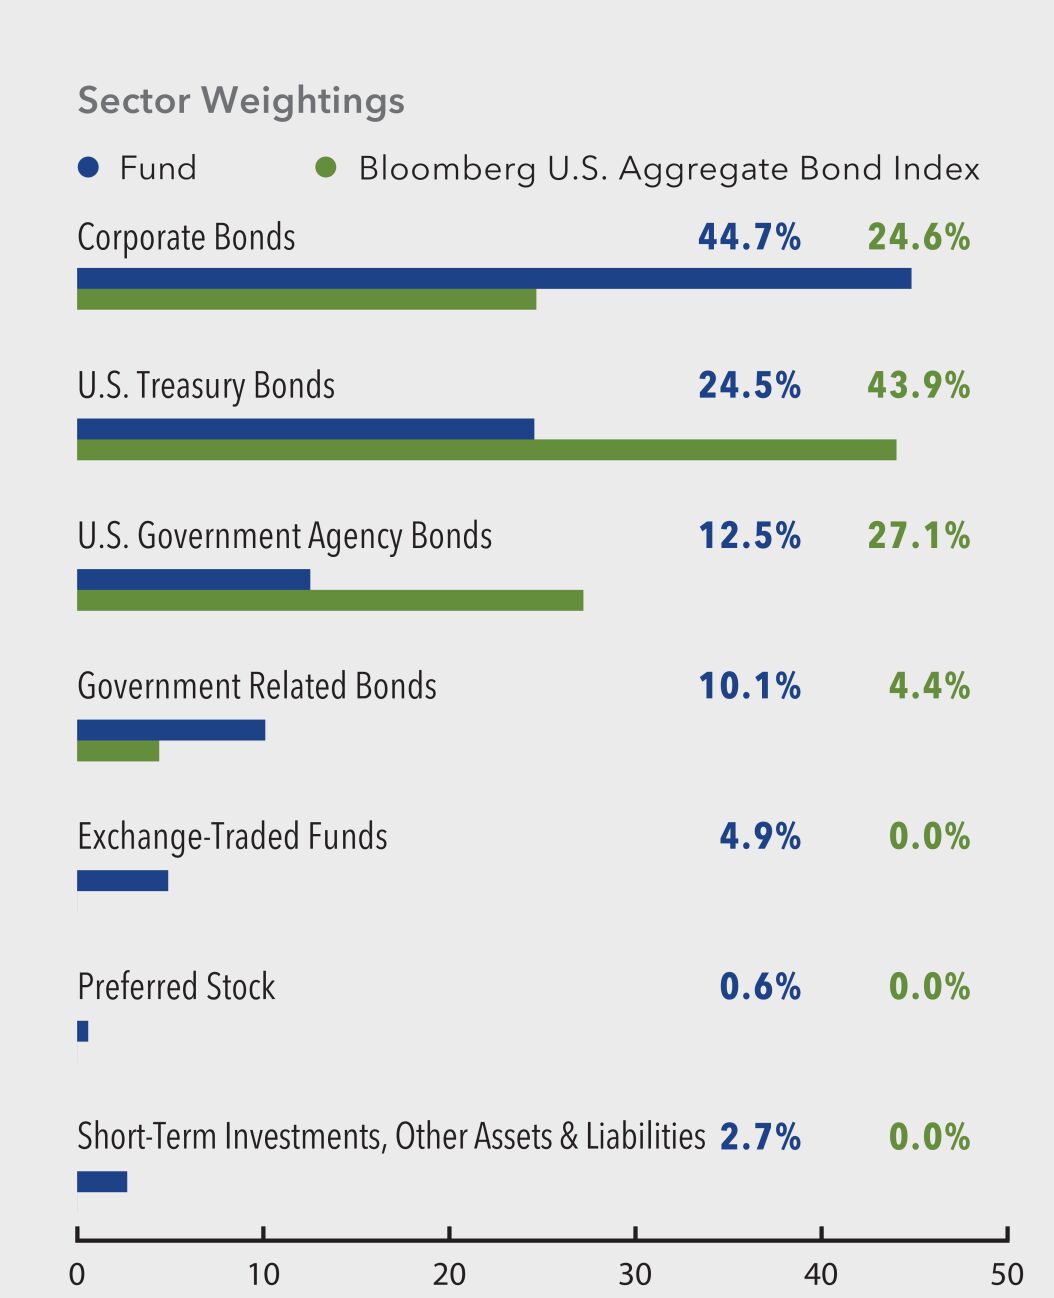
Portfolio characteristics and holdings are subject to change periodically.
Value on December 31, 2024
of $10,000 invested on December 31, 2014
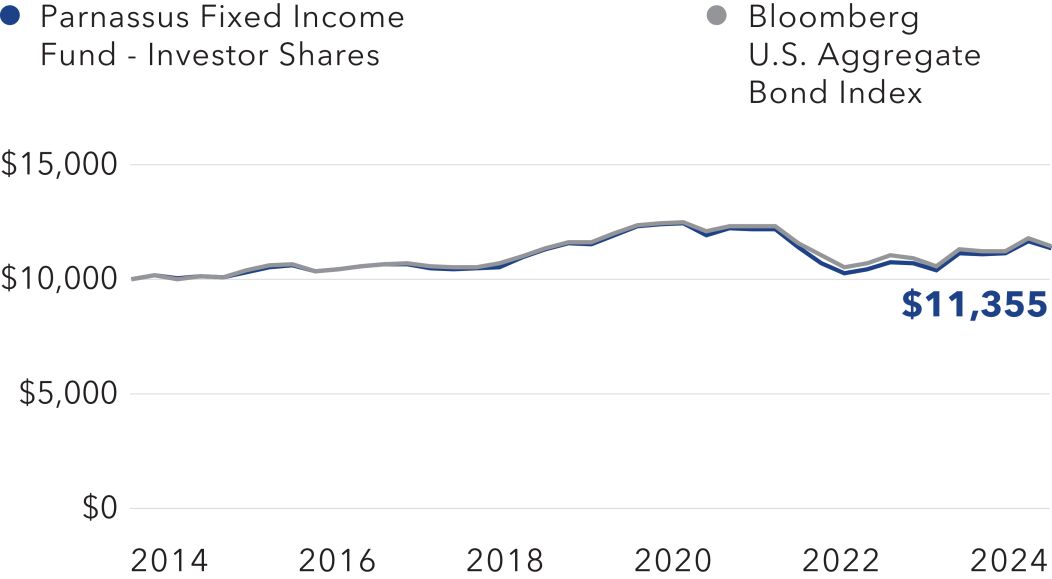
The chart shows the growth in value of a hypothetical $10,000 investment over the last 10 years and does not reflect the deduction of taxes a shareholder would pay on fund distributions or the redemption of fund shares.
Outlook and Strategy
We adjusted the Fund to a slightly more defensive positioning both relative to credit risk and interest rate risk, including further reducing corporate bond exposure, increasing the Treasury allocation and shortening duration.
The Fund retained an overweight to corporate bonds relative to the index. We expect corporate bonds to generate strong long-term total returns given their higher initial yields, but we think it prudent to reduce exposure given the current tight credit spreads.
The Fund’s allocation to mortgage-backed securities was mostly unchanged from the previous quarter. The Fund continued to hold a greater portion of current coupon mortgage-backed securities than the benchmark. Because current coupon mortgages carry higher rates, they are expected to prepay faster than lower coupon mortgages. As such, mortgage-backed securities secured by higher coupon mortgages have lower duration and are more exposed to the front end of the yield curve. In short, they offer higher yield while providing less sensitivity to changes in interest rates compared to most of the mortgage-backed bonds held in the index.
The Fund’s duration remained slightly shorter than the index. We think that the disinflation trend of the past several quarters is fading and the inflation outlook is now more uncertain, with risks tilted to the upside. There was also a notable change in the inflation outlook from members of the Federal Reserve Open Market Committee (FOMC). At the last FOMC meeting in December, more than half of the FOMC were expecting inflation to remain around 2.5% or higher in 2025. This was quite different from the FOMC’s previous meeting in September, when most members thought that inflation would be closer to the 2% target by 2025.
Durable economic growth has eased credit concerns and pushed credit spreads near historic tight levels. With yields on investment-grade corporate bonds remaining well above 5%, we foresee continued demand for corporate bonds that should drive strong total returns for the asset class. More important, the business cycle and economic growth should also remain resilient enough to keep corporate earnings strong. Though not at their strongest levels, credit metrics have now stabilized within pre-pandemic
23
| | | | |
| | |
| | | | Annual Report • 2024 |
ranges. Overall, this suggests that credit fundamentals should support the current tight spread environment.
Given this backdrop, we continue to have an overweight allocation to corporate bonds. However, compared to mortgages, corporate bonds have a less compelling asymmetric return profile, especially following this year’s strong relative outperformance. Mortgages struggled amid increased volatility and rising interest rates but now offer a substantial yield pickup over corporate bonds with similar duration. Interest rate volatility, a key driver of mortgage-backed bond prices, should also recede as monetary policy uncertainty abates. The FOMC indicated that modestly elevated inflation is unlikely to lead to rate hikes, but then it could ease quickly if labor markets weakened. As such, we trimmed our corporate bond exposure and reallocated some of the proceeds to mortgages.
The “red sweep” in the latest U.S. election is adding additional policy uncertainty that could hinder growth. Anticipated tax cuts and deregulation might benefit
U.S. growth and productivity. However, those could be offset by possible trade and immigration restrictions, which could fuel inflation. We have positioned the Fund to take advantage of current high yields while balancing potential inflationary risks and possibly weaker credit fundamentals.
As always, thank you for your investment.

Samantha Palm
Lead Portfolio Manager

Minh Bui
Portfolio Manager
24
| | | | |
| | |
| Annual Report • 2024 | | | | |
Responsible Investing Notes
Dear Shareholders,
The beginning of the year is a natural time to reflect on what to expect in the year ahead, as well as to celebrate our past achievements. In that spirit, I would like to begin by highlighting three sustainability issues to watch in 2025 – and what Parnassus is doing about them.
1. Risks of regressing climate action ... and a worsening climate
With the sharp shift in priorities for the incoming presidential administration, the United States will begin taking steps to regress its national climate commitments and slow or reverse federal climate actions. On Jan 20, President Trump introduced a flurry of executive orders on energy and the environment, including U.S. withdrawal from the Paris Agreement, declaration of a national energy emergency that may suspend prior environmental rules, a roll back of emissions-related regulations, and a review of regulations that impose an ‘undue burden’ on energy development, among others. This regression will almost certainly include legislative attempts to repeal President Biden’s signature legislation - the Inflation Reduction Act of 2022 - which allocated significant resources to clean energy, electrification, environmental justice and further climate-related activities. If the U.S. steps back on climate action, we will see a shift in international dynamics, with China and the EU vying to fill the leadership gap.
These anticipated events could create new risks and opportunities for businesses and investors in the evolving geopolitical landscape. For example, some high-emitting companies may feel emboldened to increase emissions or reduce or eliminate transition-related activities. However, others may see this as an opportunity to demonstrate leadership by investing in technologies to reduce emissions and adapt to a changing climate. Meanwhile, in the ongoing absence of major systems change, we will continue to experience worsening storms, droughts, floods, saltwater intrusion and ecosystem disruption. As long-term investors, Parnassus will be watching how companies respond to these dynamics to drive long-term value for our clients.
How is the Sustainability & Stewardship team responding?
In our view, companies that actively prepare for a low-carbon transition and a rapidly changing climate are more likely to succeed in the long term. Pursuant to this, we engage many portfolio companies to drive emissions reductions and to prepare strategic climate transition planning. Climate and water risk are priorities for our 2025 impact engagements, commencing with our annual notification to companies across our equity strategies of our expectations for emissions reductions.
2. Risks and opportunities from advancements in AI
In 2025, artificial intelligence (AI) will become more “intelligent,” more accessible and able to do more things better. AI will embed in more and more products, services and processes and alter the way many of us work, live and make decisions. On the positive side, AI should drive scientific innovation, promote efficiency, reduce human error and automate many tedious and dangerous tasks. However, AI may also exacerbate the spread of misinformation, worsen extremism, unfairly limit access to healthcare, housing, credit or education, or increase inequalities and discrimination. Globally, 2025 is likely to bring a raft of new AI-related legislation, litigation and corporate successes and failures in developing, deploying and using this rapidly advancing technology.
AI promises to deliver game-changing disruption, creating new opportunities for winners and new risks for laggards. As long-term investors, Parnassus will seek investments in companies that have strong competitive advantages, products or services that are becoming increasingly relevant, as well as strong management teams that consider how these business models may affect society or the environment.
How is the Sustainability & Stewardship team responding?
In our view, companies with responsible AI practices are best positioned to advance sustainable innovation and drive long-term value. Through our impact engagements and proxy voting, we will advocate for portfolio companies to manage key AI-related risk, to integrate principles of safety, non-bias, privacy and accuracy throughout product life cycles, as well as to establish clear AI governance and consider human rights impacts across their value chain.
25
| | | | |
| | |
| | | | Annual Report • 2024 |
3. Regulatory risks and consumer concerns: Hazardous chemicals in medical and everyday products
In recent years, we have seen increasing scientific consensus and public interest surrounding the impacts of “forever chemicals” and other hazardous synthetic substances on human health. These impacts may include cancer, liver damage, thyroid disease and fertility issues. These concerns become particularly significant when hazardous chemicals are found in implantable medical devices, from intravenous bags and tubing to artificial joints, as well as formulated goods that come into direct contact with our bodies, such as shampoo, sunscreen and laundry detergent.
The good news is some consumers, regulators and legislators are responding, including at the state and national levels. While recent EPA rules on PFAS have been withdrawn, the new Administrator of the EPA, Lee Zeldin, has said that attention to PFAS regulation will be a priority and voted in support of PFAS-regulating legislation in his tenure as a United States Representative. For companies that use or produce these chemicals, this environment presents both challenges and opportunities to meet the demands of increasing regulation and consumer demand for safer products. As investors, Parnassus will be considering how companies are managing these risks and opportunities to create enduring shareholder value.
How is the Sustainability & Stewardship team responding?
In our view, companies that proactively address chemical safety may gain a competitive edge and enhance their market share, while those that lag may face regulatory penalties and loss of consumer trust. Chemical safety is an engagement priority for Parnassus in 2025 as we press companies to strengthen chemical management practices, improve consumer and investor transparency by disclosing chemical inventories and assess opportunities to shift to safer alternatives where appropriate.
2024 in Review
Expanding our team to deliver results
The Sustainability & Stewardship team has three new members, bringing the total headcount to five. Marcy McCullaugh joined in September 2024 from Schwab Asset Management as a Director to provide strategic support for our stewardship program, lead impact engagements with portfolio companies and support our internal and external thought leadership and advocacy. Sophie Haywood joined in October 2024 from ERM as an Analyst to help drive outcomes in our company engagements, client communications, proxy voting and other sustainability-related investment activities. Tyler McCullough joined Parnassus in January 2025 as a Senior Analyst from Ceres’ Climate & Energy team. He will lead Parnassus’s climate and water risk work and support proxy, sustainability integration and client communications. Tyler will also lead the execution of our firmwide Climate Action Plan, which aims for net-zero across Parnassus’s Funds by 2050.
Stewardship in Focus
Climate Targets: In January 2023, Parnassus announced a target to have 100% of our Funds’ assets under management aligned with net-zero greenhouse gas emissions by 20501. In practice, this means that we expect all companies in our Funds to have set science-based targets by 2040. In 2024, we engaged many portfolio companies, asking that they set science-aligned targets, disclose their emissions and/or publish assessments of climate-related risks and opportunities. By the end of 2024, over 60% of our Funds’ assets under management were covered by science-based targets or had committed to set such a target.
Modernizing our Approach: In May, Parnassus modernized its screening process by introducing a new Sustainability Lens and Caution List that is built on our longstanding commitment to Principles and Performance. This approach, which represents an evolution of our prior prospectus screens, allows us to more effectively identify companies that align with our sustainability and quality expectations.
1 These commitments are made in the expectation that governments will follow through on their own commitments to ensure the objectives of the Paris Agreement are met, including increasing the ambition of their Nationally Determined Contributions, and in the context of our fiduciary and legal duties to clients and unless otherwise prohibited by applicable law.
26
| | | | |
| | |
| Annual Report • 2024 | | | | |
Since implementing these changes, we have evaluated companies that were previously excluded by prospectus, but we have not added any of them to our strategies.
Reinforcing our Principles: Last year, we interacted with nearly every company across our strategies via email, virtual meetings or in-person visits, reinforcing our Principles and sustainable investment philosophy. Through engagement, we made progress on critical issues such as climate risk, environmental health, chemical safety, artificial intelligence, sustainable workplace and strong governance, covering over half of our assets under management. We also voted proxies at every meeting for which we were eligible to vote, pressing for stronger governance, fair executive compensation that is linked to company performance and the furtherance of appropriate actions on material environmental and social issues.
Our Sustainability & Stewardship Report provides more detailed information on our 2024 proxy voting, engagement strategy, companies engaged and the outcomes achieved.
What’s Ahead?
The past year brought significant strides in Sustainability and Stewardship at Parnassus. Our team expanded and grew stronger, our engagements yielded impactful results and our commitment to Principles and Performance remained steadfast. As I look forward to 2025, I am confident in our ability to take on emerging challenges and drive meaningful change in pursuit of enduring value for our clients.
I anticipate sharing more time and success stories with you as the year proceeds. Thank you for your continued trust and investment in Parnassus.

Marian Macindoe
Managing Director, Sustainable Investment Strategy
27
| | | | |
| | |
| | | | Annual Report • 2024 |
Fund Expenses (unaudited)
As a shareholder of the Funds, you incur ongoing costs, which include portfolio management fees, administrative fees, shareholder reports, and other fund expenses. The Funds do not charge transaction fees, so you do not incur transaction costs such as sales charges (loads) on purchase payments, reinvested dividends, or other distributions, redemption fees, and exchange fees. The information on this page is intended to help you understand your ongoing costs of investing in the Funds and to compare these costs with the ongoing costs of investing in other mutual funds.
The following example is based on an investment of $10,000 invested at the beginning of the most recent year and held for the year of January 1, 2024, through December 31, 2024.
Actual Expenses
In the example below, the first line for each Fund provides information about actual account values and actual expenses. You may use the information in this line, together with the amount you invested, to estimate the expenses that you paid over the period. Simply divide your account value by $10,000 (for example, $86,000 account value divided by $10,000 = 8.6), then multiply the result by the number in the first line under the heading entitled “Expenses Paid During
Period” to estimate the expenses you paid on your account during this period.
Hypothetical Example for Comparison Purposes
The second line of each Fund provides information about hypothetical account values and hypothetical expenses based on the Fund’s expense ratio and an assumed rate of return of 5% per year before expenses, which is not the Fund’s actual return. You may compare the ongoing costs of investing in the Fund with other mutual funds by comparing this 5% hypothetical example with the 5% hypothetical examples that appear in the shareholder reports of other funds.
The hypothetical account values and expenses may not be used to estimate the actual ending account balance or expenses you paid for the period.
Please note that the expenses shown in the table are meant to highlight only your ongoing costs in these Funds. Therefore, the second line of each Fund is useful in comparing only ongoing costs and will not help you determine the relative total costs of owning other mutual funds, which may include transactional costs such as loads.
| | | | | | | | | | | | | | | | | | | | | | | | |
| | | | | | |
| | | | | | Fund
Expense
Ratio | | | Beginning
Account Value
January 1, 2024 | | | Ending
Account Value
December 31,
2024 | | | Expenses Paid
During Period | | | | |
| | | | Parnassus Core Equity Fund – Investor Shares* | | | 0.81% | | | | $10,000.00 | | | | $11,852.00 | | | | $88.50 | | | | | |
| | | | Hypothetical (5% before expenses) | | | 0.81% | | | | $10,000.00 | | | | $10,419.00 | | | | $82.70 | | | | | |
| | | | Parnassus Core Equity Fund – Institutional Shares* | | | 0.61% | | | | $10,000.00 | | | | $11,875.00 | | | | $66.72 | | | | | |
| | | | Hypothetical (5% before expenses) | | | 0.61% | | | | $10,000.00 | | | | $10,439.00 | | | | $62.34 | | | | | |
| | | | Parnassus Growth Equity Fund – Investor Shares* | | | 0.84% | | | | $10,000.00 | | | | $12,685.00 | | | | $95.28 | | | | | |
| | | | Hypothetical (5% before expenses) | | | 0.84% | | | | $10,000.00 | | | | $10,416.00 | | | | $85.75 | | | | | |
| | | | Parnassus Growth Equity Fund – Institutional Shares* | | | 0.63% | | | | $10,000.00 | | | | $12,713.00 | | | | $71.55 | | | | | |
| | | | Hypothetical (5% before expenses) | | | 0.63% | | | | $10,000.00 | | | | $10,437.00 | | | | $64.38 | | | | | |
| | | | Parnassus Value Equity Fund – Investor Shares* | | | 0.88% | | | | $10,000.00 | | | | $11,201.00 | | | | $93.28 | | | | | |
| | | | Hypothetical (5% before expenses) | | | 0.88% | | | | $10,000.00 | | | | $10,412.00 | | | | $89.81 | | | | | |
| | | | Parnassus Value Equity Fund – Institutional Shares* | | | 0.65% | | | | $10,000.00 | | | | $11,227.00 | | | | $68.99 | | | | | |
| | | | Hypothetical (5% before expenses) | | | 0.65% | | | | $10,000.00 | | | | $10,435.00 | | | | $66.41 | | | | | |
| | | | Parnassus Mid Cap Fund – Investor Shares* | | | 0.95% | | | | $10,000.00 | | | | $10,999.00 | | | | $99.75 | | | | | |
| | | | Hypothetical (5% before expenses) | | | 0.95% | | | | $10,000.00 | | | | $10,405.00 | | | | $96.92 | | | | | |
| | | | Parnassus Mid Cap Fund – Institutional Shares* | | | 0.75% | | | | $10,000.00 | | | | $11,021.00 | | | | $78.83 | | | | | |
| | | | Hypothetical (5% before expenses) | | | 0.75% | | | | $10,000.00 | | | | $10,425.00 | | | | $76.59 | | | | | |
| | | | Parnassus Mid Cap Growth Fund – Investor Shares* | | | 0.80% | | | | $10,000.00 | | | | $11,055.00 | | | | $84.22 | | | | | |
| | | | Hypothetical (5% before expenses) | | | 0.80% | | | | $10,000.00 | | | | $10,420.00 | | | | $81.68 | | | | | |
| | | | Parnassus Mid Cap Growth Fund – Institutional Shares* | | | 0.68% | | | | $10,000.00 | | | | $11,068.00 | | | | $71.63 | | | | | |
| | | | Hypothetical (5% before expenses) | | | 0.68% | | | | $10,000.00 | | | | $10,432.00 | | | | $69.47 | | | | | |
| | | | Parnassus Fixed Income Fund – Investor Shares* | | | 0.58% | | | | $10,000.00 | | | | $10,192.00 | | | | $58.56 | | | | | |
| | | | Hypothetical (5% before expenses) | | | 0.58% | | | | $10,000.00 | | | | $10,442.00 | | | | $59.28 | | | | | |
| | | | Parnassus Fixed Income Fund – Institutional Shares* | | | 0.39% | | | | $10,000.00 | | | | $10,213.00 | | | | $39.42 | | | | | |
| | | | Hypothetical (5% before expenses) | | | 0.39% | | | | $10,000.00 | | | | $10,461.00 | | | | $39.90 | | | | | |
* Expenses are calculated using the Funds’ annualized expense ratios, which represent ongoing expense as a percentage of net assets for the year ended December 31, 2024. Expenses are calculated by multiplying the annualized expense ratio by the average account value of the period.
28
| | | | |
| | |
| Annual Report • 2024 | | | | |
Parnassus Core Equity Fund
Portfolio of Investments as of December 31, 2024
| | | | | | | | |
| | |
| Equities | | Shares | | | Market
Value ($) | |
| | |
| Banks (2.1%) | | | | | | | | |
| Bank of America Corp. | | | 13,852,909 | | | | 608,835,351 | |
| | |
| | | | | | | | |
| | |
| Biotechnology (2.0%) | | | | | | | | |
| Vertex Pharmaceuticals Inc. q | | | 1,432,284 | | | | 576,780,767 | |
| | |
| | | | | | | | |
| | |
| Capital Markets (5.5%) | | | | | | | | |
| Intercontinental Exchange Inc. | | | 5,737,337 | | | | 854,920,586 | |
| S&P Global Inc. | | | 1,487,664 | | | | 740,901,302 | |
| | |
| | | | | | | | |
| | | | | | | 1,595,821,888 | |
| | |
| | | | | | | | |
| | |
| Chemicals (4.1%) | | | | | | | | |
| Linde plc | | | 1,702,041 | | | | 712,593,505 | |
| The Sherwin-Williams Co. | | | 1,399,058 | | | | 475,581,786 | |
| | |
| | | | | | | | |
| | | | | | | 1,188,175,291 | |
| | |
| | | | | | | | |
| | |
Commercial Services &
Supplies (3.4%) | | | | | | | | |
| Waste Management Inc. | | | 4,949,293 | | | | 998,717,835 | |
| | |
| | | | | | | | |
| | |
| Containers & Packaging (2.3%) | | | | | | | | |
| Ball Corp. W | | | 12,375,881 | | | | 682,282,320 | |
| | |
| | | | | | | | |
| | |
Diversified Financial
Services (6.1%) | | | | | | | | |
| Fiserv Inc. q | | | 3,836,644 | | | | 788,123,411 | |
| Mastercard Inc., Class A | | | 1,872,137 | | | | 985,811,180 | |
| | |
| | | | | | | | |
| | | | | | | 1,773,934,591 | |
| | |
| | | | | | | | |
| | |
| Diversified Telecommunication Services (1.4%) | | | | | | | | |
| Verizon Communications Inc. | | | 10,313,698 | | | | 412,444,783 | |
| | |
| | | | | | | | |
| | |
| Equity Real Estate Investment Trusts (3.2%) | | | | | | | | |
| Realty Income Corp. | | | 17,162,768 | | | | 916,663,439 | |
| | |
| | | | | | | | |
| | |
| Food & Staples Retailing (1.8%) | | | | | | | | |
| Costco Wholesale Corp. | | | 559,456 | | | | 512,612,749 | |
| | |
| | | | | | | | |
| | |
| Health Care Equipment & Supplies (1.9%) | | | | | | | | |
| Stryker Corp. | | | 1,552,584 | | | | 559,007,869 | |
| | |
| | | | | | | | |
| | |
Health Care Providers &
Services (1.9%) | | | | | | | | |
| The Cigna Group | | | 2,028,243 | | | | 560,079,022 | |
| | |
| | | | | | | | |
| | |
Hotels, Restaurants &
Leisure (1.7%) | | | | | | | | |
| Marriott International Inc., Class A | | | 1,737,566 | | | | 484,676,660 | |
| | |
| | | | | | | | |
| | |
| Household Durables (1.1%) | | | | | | | | |
| D.R. Horton Inc. | | | 2,179,270 | | | | 304,705,531 | |
| | |
| | | | | | | | |
| | |
| Household Products (1.6%) | | | | | | | | |
| The Procter & Gamble Co. | | | 2,763,159 | | | | 463,243,606 | |
| | |
| | | | | | | | |
| | | | | | | | |
| | |
| Equities | | | Shares | | |
| Market
Value ($) |
|
| | |
| Insurance (2.1%) | | | | | | | | |
| Marsh & McLennan Co., Inc. | | | 2,815,449 | | | | 598,029,522 | |
| | |
| | | | | | | | |
| | |
Interactive Media &
Services (5.0%) | | | | | | | | |
| Alphabet Inc., Class A | | | 7,670,958 | | | | 1,452,112,349 | |
| | |
| | | | | | | | |
| | |
Life Sciences Tools &
Services (3.9%) | | | | | | | | |
| Danaher Corp. | | | 2,451,759 | | | | 562,801,278 | |
| Thermo Fisher Scientific Inc. | | | 1,112,488 | | | | 578,749,632 | |
| | |
| | | | | | | | |
| | | | | | | 1,141,550,910 | |
| | |
| | | | | | | | |
| | |
| Machinery (3.6%) | | | | | | | | |
| Deere & Co. | | | 2,443,418 | | | | 1,035,276,207 | |
| | |
| | | | | | | | |
| | |
| Multiline Retail (6.3%) | | | | | | | | |
| Amazon.com Inc. q | | | 8,400,746 | | | | 1,843,039,665 | |
| | |
| | | | | | | | |
| | |
| Pharmaceuticals (2.0%) | | | | | | | | |
| Eli Lilly & Co. | | | 735,953 | | | | 568,155,716 | |
| | |
| | | | | | | | |
| | |
| Professional Services (2.7%) | | | | | | | | |
| Equifax Inc. | | | 1,419,155 | | | | 361,671,652 | |
| Verisk Analytics Inc., Class A | | | 1,516,962 | | | | 417,816,844 | |
| | |
| | | | | | | | |
| | | | | | | 779,488,496 | |
| | |
| | | | | | | | |
| | |
Semiconductors & Semiconductor
Equipment (11.3%) | | | | | | | | |
| Applied Materials Inc. | | | 2,535,526 | | | | 412,352,593 | |
| Broadcom Inc. | | | 3,714,948 | | | | 861,273,544 | |
| KLA Corp. | | | 461,933 | | | | 291,073,222 | |
| NVIDIA Corp. | | | 12,754,323 | | | | 1,712,778,036 | |
| | |
| | | | | | | | |
| | | | | | | 3,277,477,395 | |
| | |
| | | | | | | | |
| | |
| Software (15.6%) | | | | | | | | |
| Intuit Inc. | | | 879,846 | | | | 552,983,211 | |
| Microsoft Corp. | | | 4,475,508 | | | | 1,886,426,622 | |
| Oracle Corp. | | | 2,288,019 | | | | 381,275,486 | |
| Salesforce Inc. | | | 2,541,867 | | | | 849,822,394 | |
| Synopsys Inc. q | | | 931,328 | | | | 452,029,358 | |
| Workday Inc., Class A q | | | 1,633,830 | | | | 421,577,155 | |
| | |
| | | | | | | | |
| | | | | | | 4,544,114,226 | |
| | |
| | | | | | | | |
| | |
| Specialty Retail (2.4%) | | | | | | | | |
| AutoZone Inc. q | | | 219,779 | | | | 703,732,358 | |
| | |
| | | | | | | | |
| | |
| Technology Hardware, Storage & Peripherals (2.7%) | | | | | | | | |
| Apple Inc. | | | 3,094,973 | | | | 775,043,139 | |
| | |
| | | | | | | | |
| | |
| Trading Companies & Distributors (1.5%) | | | | | | | | |
| Ferguson Enterprises Inc. | | | 2,491,778 | | | | 432,497,907 | |
| | |
| | | | | | | | |
| |
Total investment in equities (99.2%)
(cost $20,673,867,104) | | | | 28,788,499,592 | |
| | |
| | | | | | | | |
29
| | | | |
| | |
| | | | Annual Report • 2024 |
Parnassus Core Equity Fund
Portfolio of Investments as of December 31, 2024 (continued)
| | | | | | | | | | | | | | | | |
| | | | |
| Short-Term Securities | | Interest
Rate | | | Maturity
Date | | | Principal
Amount ($) | | | Market
Value ($) | |
| | |
| Certificates of Deposit (0.0%) a | | | | | | | | | |
| Citizens Trust Bank | | | 1.00 | % | | | 01/14/2025 | | | | 250,000 | | | | 249,645 | |
| Community Vision Capital & Consulting | | | 0.25 | % | | | 01/31/2025 | | | | 250,000 | | | | 248,770 | |
| Self-Help Federal Credit Union | | | 4.60 | % | | | 02/17/2025 | | | | 1,000,000 | | | | 994,863 | |
| | | | |
| | | | | | | | | | | | | | | | |
| | | | | | | | | | | | | | | 1,493,278 | |
| | | | |
| | | | | | | | | | | | | | | | |
| | | | |
| Certificates of Deposit Account Registry Service (0.0%) a | | | | | | | | | | | | | | | | |
CDARS agreement with Beneficial State Bank,
dated 03/14/2024
Participating depository institutions:
Burke & Herbert Bank & Trust Company, par 143,000;
First Business Bank, par 235,500;
Freedom Financial Bank, par 235,500;
Frontier Bank, par 235,500;
Old National Bank, par 150,500;
River City Bank, par 235,500;
Signature Bank National Association, par 235,500;
Solera National Bank, par 235,500;
South Ottumwa Savings Bank, par 235,500;
The People Bank of Georgia, par 58,000;
(cost $1,984,396) | | | 4.18 | % | | | 03/13/2025 | | | | 2,000,000 | | | | 1,984,396 | |
| | | | |
| | | | | | | | | | | | | | | | |
| | | | |
| Community Development Loans (0.0%) a | | | | | | | | | | | | | | | | |
| Root Capital Inc. | | | 1.00 | % | | | 02/01/2025 | | | | 200,000 | | | | 198,984 | |
| | | | |
| | | | | | | | | | | | | | | | |
| | | | |
| Time Deposits (0.9%) | | | | | | | | | | | | | | | | |
| Citibank, New York | | | 3.68 | % | | | 01/02/2025 | | | | 200,000,000 | | | | 200,000,000 | |
| JPMorgan Chase, New York | | | 3.68 | % | | | 01/02/2025 | | | | 46,665,756 | | | | 46,665,756 | |
| | | | |
| | | | | | | | | | | | | | | | |
| | | | | | | | | | | | | | | 246,665,756 | |
| | | | |
| | | | | | | | | | | | | | | | |
| | | | |
Total short-term securities (0.9%)
(cost $250,342,414) | | | | | | | | | | | | | | | 250,342,414 | |
| | | | |
| | | | | | | | | | | | | | | | |
| | | | |
Total securities (100.1%)
(cost $20,924,209,518) | | | | | | | | | | | | | | | 29,038,842,006 | |
| | | | |
| | | | | | | | | | | | | | | | |
| | | | |
| | | | | | | | | | | | | | | | |
| | | | |
| Other assets and liabilities (-0.1%) | | | | | | | | | | | | | | | (22,417,532 | ) |
| | | | |
| Total net assets (100.0%) | | | | | | | | | | | | | | | 29,016,424,474 | |
| | | | |
| | | | | | | | | | | | | | | | |
q This security is non-income producing. | |
W Fund ownership consists of 5% or more of the shares outstanding of the Affiliated Issuer, as defined under the Investment Securities Act of 1940. | |
a Market value adjustments have been applied to these securities to reflect potential early withdrawal. Such securities have been classified as level 3. | |
| | | | |
plc Public Limited Company | | | | | | | | | | | | | | | | |
30
| | | | |
| | |
| Annual Report • 2024 | | | | |
Parnassus Growth Equity Fund
Portfolio of Investments as of December 31, 2024
| | | | | | | | |
| | |
| Equities | | Shares | | | Market
Value ($) | |
| | |
| Biotechnology (4.6%) | | | | | | | | |
| Exact Sciences Corp. q | | | 9,751 | | | | 547,909 | |
| Natera Inc. q | | | 9,524 | | | | 1,507,649 | |
| Vertex Pharmaceuticals Inc. q | | | 2,089 | | | | 841,240 | |
| | |
| | | | | | | | |
| | | | | | | 2,896,798 | |
| | |
| | | | | | | | |
| | |
| Capital Markets (5.1%) | | | | | | | | |
| Ares Management Corp., Class A | | | 7,113 | | | | 1,259,214 | |
| MSCI Inc., Class A | | | 1,345 | | | | 807,013 | |
| S&P Global Inc. | | | 2,343 | | | | 1,166,884 | |
| | |
| | | | | | | | |
| | | | | | | 3,233,111 | |
| | |
| | | | | | | | |
| | |
| Chemicals (2.8%) | | | | | | | | |
| Linde plc | | | 1,866 | | | | 781,238 | |
| The Sherwin-Williams Co. | | | 2,998 | | | | 1,019,110 | |
| | |
| | | | | | | | |
| | | | | | | 1,800,348 | |
| | |
| | | | | | | | |
| | |
| Diversified Financial Services (6.0%) | | | | | | | | |
| Adyen N.V., ADR q | | | 63,942 | | | | 937,390 | |
| Visa Inc., Class A | | | 9,163 | | | | 2,895,875 | |
| | |
| | | | | | | | |
| | | | | | | 3,833,265 | |
| | |
| | | | | | | | |
| | |
| Entertainment (1.6%) | | | | | | | | |
| Netflix Inc. q | | | 1,138 | | | | 1,014,322 | |
| | |
| | | | | | | | |
| | |
Equity Real Estate Investment
Trusts (1.2%) | | | | | | | | |
| CoStar Group Inc. q | | | 11,061 | | | | 791,857 | |
| | |
| | | | | | | | |
| | |
| Food & Staples Retailing (2.0%) | | | | | | | | |
| Costco Wholesale Corp. | | | 1,359 | | | | 1,245,211 | |
| | |
| | | | | | | | |
| | |
Health Care Equipment &
Supplies (3.7%) | | | | | | | | |
| Boston Scientific Corp. q | | | 13,697 | | | | 1,223,416 | |
| Intuitive Surgical Inc. q | | | 2,137 | | | | 1,115,429 | |
| | |
| | | | | | | | |
| | | | | | | 2,338,845 | |
| | |
| | | | | | | | |
| | |
| Hotels, Restaurants & Leisure (4.1%) | | | | | | | | |
| Airbnb Inc., Class A q | | | 6,173 | | | | 811,194 | |
| Chipotle Mexican Grill Inc., Class A q | | | 17,585 | | | | 1,060,375 | |
| DoorDash Inc., Class A q | | | 4,385 | | | | 735,584 | |
| | |
| | | | | | | | |
| | | | | | | 2,607,153 | |
| | |
| | | | | | | | |
| | |
| Interactive Media & Services (6.4%) | | | | | | | | |
| Alphabet Inc., Class A | | | 21,610 | | | | 4,090,773 | |
| | |
| | | | | | | | |
| | |
| IT Services (1.3%) | | | | | | | | |
| Cloudflare Inc., Class A q | | | 7,413 | | | | 798,232 | |
| | |
| | | | | | | | |
| | |
| Life Sciences Tools & Services (1.6%) | | | | | | | | |
| Thermo Fisher Scientific Inc. | | | 1,946 | | | | 1,012,368 | |
| | |
| | | | | | | | |
| | |
| Machinery (1.5%) | | | | | | | | |
| Deere & Co. | | | 2,312 | | | | 979,594 | |
| | |
| | | | | | | | |
| | | | | | | | |
| | |
| Equities | | | Shares | | |
| Market
Value ($) |
|
| | |
| Multiline Retail (6.1%) | | | | | | | | |
| Amazon.com Inc. q | | | 14,004 | | | | 3,072,338 | |
| MercadoLibre Inc. q | | | 460 | | | | 782,202 | |
| | |
| | | | | | | | |
| | | | | | | 3,854,540 | |
| | |
| | | | | | | | |
| | |
| Pharmaceuticals (2.9%) | | | | | | | | |
| Eli Lilly & Co. | | | 2,408 | | | | 1,858,976 | |
| | |
| | | | | | | | |
| | |
| Professional Services (1.1%) | | | | | | | | |
| Equifax Inc. | | | 2,854 | | | | 727,342 | |
| | |
| | | | | | | | |
| | |
| Semiconductors & Semiconductor Equipment (18.7%) | | | | | | | | |
| Advanced Micro Devices Inc. q | | | 7,957 | | | | 961,126 | |
| Applied Materials Inc. | | | 5,525 | | | | 898,531 | |
| Broadcom Inc. | | | 13,171 | | | | 3,053,565 | |
| NVIDIA Corp. | | | 42,309 | | | | 5,681,676 | |
| Taiwan Semiconductor Manufacturing Co. Ltd., ADR | | | 6,585 | | | | 1,300,472 | |
| | |
| | | | | | | | |
| | | | | | | 11,895,370 | |
| | |
| | | | | | | | |
| | |
| Software (22.4%) | | | | | | | | |
| Adobe Inc. q | | | 1,944 | | | | 864,458 | |
| Atlassian Corp., Class A q | | | 3,273 | | | | 796,583 | |
| Datadog Inc., Class A q | | | 4,791 | | | | 684,586 | |
| Intuit Inc. | | | 1,795 | | | | 1,128,157 | |
| Microsoft Corp. | | | 13,602 | | | | 5,733,243 | |
| Procore Technologies Inc. q | | | 12,606 | | | | 944,568 | |
| PTC Inc. q | | | 4,990 | | | | 917,511 | |
| Salesforce Inc. | | | 6,140 | | | | 2,052,786 | |
| Workday Inc., Class A q | | | 4,650 | | | | 1,199,839 | |
| | |
| | | | | | | | |
| | | | | | | 14,321,731 | |
| | |
| | | | | | | | |
| | |
| Technology Hardware, Storage & Peripherals (4.8%) | | | | | | | | |
| Apple Inc. | | | 12,232 | | | | 3,063,137 | |
| | |
| | | | | | | | |
| | |
Trading Companies &
Distributors (1.2%) | | | | | | | | |
| Ferguson Enterprises Inc. | | | 4,291 | | | | 744,789 | |
| | |
| | | | | | | | |
| |
Total investment in equities (99.1%)
(cost $49,646,353) | | | | 63,107,762 | |
| | |
| | | | | | | | |
31
| | | | |
| | |
| | | | Annual Report • 2024 |
Parnassus Growth Equity Fund
Portfolio of Investments as of December 31, 2024 (continued)
| | | | | | | | | | | | | | | | |
| | | | |
| Short-Term Securities | | Interest
Rate | | | Maturity
Date | | | Principal
Amount ($) | | | Market
Value ($) | |
| | | | |
| Time Deposits (0.6%) | | | | | | | | | | | | | | | | |
| JPMorgan Chase, New York | | | 3.68 | % | | | 01/02/2025 | | | | 374,787 | | | | 374,787 | |
| | | | |
| | | | | | | | | | | | | | | | |
| | | | |
Total short-term securities (0.6%)
(cost $374,787) | | | | | | | | | | | | | | | 374,787 | |
| | | | |
| | | | | | | | | | | | | | | | |
| | | | |
Total securities (99.7%)
(cost $50,021,140) | | | | | | | | | | | | | | | 63,482,549 | |
| | | | |
| | | | | | | | | | | | | | | | |
| | | | |
| Other assets and liabilities (0.3%) | | | | | | | | | | | | | | | 220,032 | |
| | | | |
| | | | | | | | | | | | | | | | |
| | | | |
| Total net assets (100.0%) | | | | | | | | | | | | | | | 63,702,581 | |
| | | | |
| | | | | | | | | | | | | | | | |
q This security is non-income producing. | | | | | | | | | | | | | | | | |
| | | | |
plc Public Limited Company | | | | | | | | | | | | | | | | |
N.V. Naamloze Vennootschap | | | | | | | | | | | | | | | | |
ADR American Depositary Receipt | | | | | | | | | | | | | | | | |
32
| | | | |
| | |
| Annual Report • 2024 | | | | |
Parnassus Value Equity Fund
Portfolio of Investments as of December 31, 2024
| | | | | | | | |
| | |
| Equities | | Shares | | | Market
Value ($) | |
| | |
| Air Freight & Logistics (1.8%) | | | | | | | | |
| FedEx Corp. | | | 301,210 | | | | 84,739,409 | |
| | |
| | | | | | | | |
| | |
| Banks (5.8%) | | | | | | | | |
| Bank of America Corp. | | | 3,615,546 | | | | 158,903,247 | |
| Citigroup Inc. | | | 1,725,687 | | | | 121,471,108 | |
| | |
| | | | | | | | |
| | | | | | | 280,374,355 | |
| | |
| | | | | | | | |
| | |
| Biotechnology (2.2%) | | | | | | | | |
| Gilead Sciences Inc. | | | 1,151,874 | | | | 106,398,601 | |
| | |
| | | | | | | | |
| | |
| Capital Markets (10.4%) | | | | | | | | |
| CME Group Inc., Class A | | | 366,827 | | | | 85,188,234 | |
| S&P Global Inc. | | | 339,991 | | | | 169,325,718 | |
| The Bank of New York Mellon Corp. | | | 1,605,471 | | | | 123,348,337 | |
| The Charles Schwab Corp. | | | 1,694,634 | | | | 125,419,862 | |
| | |
| | | | | | | | |
| | | | | | | 503,282,151 | |
| | |
| | | | | | | | |
| | |
| Containers & Packaging (2.6%) | | | | | | | | |
| Ball Corp. W | | | 2,308,169 | | | | 127,249,357 | |
| | |
| | | | | | | | |
| | |
| Diversified Financial Services (7.1%) | | | | | | | | |
| Global Payments Inc. | | | 1,098,035 | | | | 123,045,802 | |
| Mastercard Inc., Class A | | | 266,875 | | | | 140,528,369 | |
| Visa Inc., Class A | | | 250,085 | | | | 79,036,863 | |
| | |
| | | | | | | | |
| | | | | | | 342,611,034 | |
| | |
| | | | | | | | |
| | |
| Diversified Telecommunication Services (2.9%) | | | | | | | | |
| Verizon Communications Inc. | | | 3,533,571 | | | | 141,307,504 | |
| | |
| | | | | | | | |
| | |
Equity Real Estate Investment
Trusts (5.7%) | | | | | | | | |
| CBRE Group Inc., Class A q | | | 1,156,075 | | | | 151,781,087 | |
| Simon Property Group Inc. | | | 718,854 | | | | 123,793,847 | |
| | |
| | | | | | | | |
| | | | | | | 275,574,934 | |
| | |
| | | | | | | | |
| | |
| Food & Staples Retailing (3.2%) | | | | | | | | |
| Sysco Corp. | | | 2,040,678 | | | | 156,030,240 | |
| | |
| | | | | | | | |
| | |
Health Care Equipment &
Supplies (2.8%) | | | | | | | | |
| Align Technology Inc. q | | | 330,007 | | | | 68,809,760 | |
| Baxter International Inc. | | | 2,229,221 | | | | 65,004,084 | |
| | |
| | | | | | | | |
| | | | | | | 133,813,844 | |
| | |
| | | | | | | | |
| | |
Health Care Providers &
Services (3.6%) | | | | | | | | |
| The Cigna Group | | | 237,205 | | | | 65,501,789 | |
| UnitedHealth Group Inc. | | | 211,079 | | | | 106,776,423 | |
| | |
| | | | | | | | |
| | | | | | | 172,278,212 | |
| | |
| | | | | | | | |
| | |
| Hotels, Restaurants & Leisure (1.8%) | | | | | | | | |
| Airbnb Inc., Class A q | | | 648,524 | | | | 85,222,539 | |
| | |
| | | | | | | | |
| | |
| Household Durables (2.5%) | | | | | | | | |
| D.R. Horton Inc. | | | 864,230 | | | | 120,836,639 | |
| | |
| | | | | | | | |
| | |
| Independent Power & Renewable Electricity Producers (1.5%) | | | | | | | | |
| Brookfield Renewable Corp. q,l | | | 2,667,638 | | | | 73,786,867 | |
| | |
| | | | | | | | |
| | | | | | | | |
| | |
| Equities | | | Shares | | |
| Market
Value ($) |
|
| | |
| Insurance (2.2%) | | | | | | | | |
| The Progressive Corp. | | | 449,242 | | | | 107,642,876 | |
| | |
| | | | | | | | |
| | |
Interactive Media &
Services (2.8%) | | | | | | | | |
| Alphabet Inc., Class A | | | 711,028 | | | | 134,597,600 | |
| | |
| | | | | | | | |
| | |
Life Sciences Tools &
Services (4.8%) | | | | | | | | |
| Agilent Technologies Inc. | | | 944,194 | | | | 126,843,022 | |
Bio-Rad Laboratories Inc.,
Class A q | | | 310,732 | | | | 102,078,569 | |
| | |
| | | | | | | | |
| | | | | | | 228,921,591 | |
| | |
| | | | | | | | |
| | |
| Machinery (5.8%) | | | | | | | | |
| Cummins Inc. | | | 380,003 | | | | 132,469,046 | |
| Deere & Co. | | | 348,570 | | | | 147,689,109 | |
| | |
| | | | | | | | |
| | | | | | | 280,158,155 | |
| | |
| | | | | | | | |
| | |
| Media (1.5%) | | | | | | | | |
| Comcast Corp., Class A | | | 1,920,800 | | | | 72,087,624 | |
| | |
| | | | | | | | |
| | |
| Multiline Retail (2.3%) | | | | | | | | |
| Amazon.com Inc. q | | | 503,495 | | | | 110,461,768 | |
| | |
| | | | | | | | |
| | |
| Pharmaceuticals (5.1%) | | | | | | | | |
| AstraZeneca plc, ADR | | | 1,178,323 | | | | 77,203,723 | |
| Novo Nordisk, ADR | | | 593,722 | | | | 51,071,966 | |
| Pfizer Inc. | | | 4,390,705 | | | | 116,485,404 | |
| | |
| | | | | | | | |
| | | | | | | 244,761,093 | |
| | |
| | | | | | | | |
| | |
| Road & Rail (2.3%) | | | | | | | | |
| Union Pacific Corp. | | | 482,958 | | | | 110,133,742 | |
| | |
| | | | | | | | |
| | |
Semiconductors & Semiconductor
Equipment (8.8%) | | | | | | | | |
| Applied Materials Inc. | | | 371,973 | | | | 60,493,969 | |
| Broadcom Inc. | | | 589,550 | | | | 136,681,272 | |
| Intel Corp. | | | 2,207,479 | | | | 44,259,954 | |
| Micron Technology Inc. | | | 1,057,266 | | | | 88,979,507 | |
| Taiwan Semiconductor Manufacturing Co. Ltd., ADR | | | 478,823 | | | | 94,562,754 | |
| | |
| | | | | | | | |
| | | | | | | 424,977,456 | |
| | |
| | | | | | | | |
| | |
| Software (6.2%) | | | | | | | | |
| Microsoft Corp. | | | 288,746 | | | | 121,706,439 | |
| NICE Ltd., ADR q,l | | | 517,039 | | | | 87,813,904 | |
| Oracle Corp. | | | 537,967 | | | | 89,646,821 | |
| | |
| | | | | | | | |
| | | | | | | 299,167,164 | |
| | |
| | | | | | | | |
| | |
| Specialty Retail (2.1%) | | | | | | | | |
| Ross Stores Inc. | | | 676,514 | | | | 102,336,273 | |
| | |
| | | | | | | | |
| | |
| Technology Hardware, Storage & Peripherals (1.6%) | | | | | | | | |
| Western Digital Corp. q | | | 1,271,549 | | | | 75,822,467 | |
| | |
| | | | | | | | |
| |
Total investment in equities (99.4%)
(cost $3,783,000,450) | | | | 4,794,573,495 | |
| | |
| | | | | | | | |
33
| | | | |
| | |
| | | | Annual Report • 2024 |
Parnassus Value Equity Fund
Portfolio of Investments as of December 31, 2024 (continued)
| | | | | | | | | | | | | | | | |
| | | | |
| Short-Term Securities | | Interest
Rate | | | Maturity
Date | | | Principal
Amount ($) | | | Market
Value ($) | |
| | |
| Certificates of Deposit (0.0%) a | | | | | | | | | |
| Community Vision Capital & Consulting | | | 0.25 | % | | | 03/31/2025 | | | | 250,000 | | | | 246,343 | |
| Self-Help Federal Credit Union | | | 4.60 | % | | | 02/25/2025 | | | | 250,000 | | | | 248,501 | |
| | | | |
| | | | | | | | | | | | | | | | |
| | | | | | | | | | | | | | | 494,844 | |
| | | | |
| | | | | | | | | | | | | | | | |
| | | |
| Certificates of Deposit Account Registry Service (0.0%) a | | | | | | | | | | | | | |
CDARS agreement with Beneficial State Bank,
dated 03/14/2024
Participating depository institutions:
First Business Bank, par 230,073;
Frontier Bank, par 34,427;
Solera National Bank, par 235,500;
(cost $496,099) | | | 4.18 | % | | | 03/13/2025 | | | | 500,000 | | | | 496,099 | |
| | | | |
| | | | | | | | | | | | | | | | |
| | | | |
| Community Development Loans (0.0%) a | | | | | | | | | | | | | | | | |
| Root Capital Inc. | | | 1.00 | % | | | 02/01/2025 | | | | 100,000 | | | | 99,492 | |
| | | | |
| | | | | | | | | | | | | | | | |
| | | | |
| Securities Purchased with Cash Collateral from Securities Lending | | | | | | | | | | | | | | | | |
| | | | |
| Registered Investment Companies (0.4%) | | | | | | | | | | | | | | | | |
| Invesco Aim Government & Agency Portfolio Short-Term Investments Trust, Institutional Class | | | 4.36 | % | | | | | | | | | | | 18,925,463 | |
| | | | |
| | | | | | | | | | | | | | | | |
| | | | |
| Time Deposits (0.6%) | | | | | | | | | | | | | | | | |
| JPMorgan Chase, New York | | | 3.68 | % | | | 01/02/2025 | | | | 31,161,101 | | | | 31,161,101 | |
| | | | |
| | | | | | | | | | | | | | | | |
| | | | |
Total short-term securities (1.0%)
(cost $51,176,999) | | | | | | | | | | | | | | | 51,176,999 | |
| | | | |
| | | | | | | | | | | | | | | | |
| | | | |
Total securities (100.4%)
(cost $3,834,177,449) | | | | | | | | | | | | | | | 4,845,750,494 | |
| | | | |
| | | | | | | | | | | | | | | | |
| | | | |
| Payable upon return of securities loaned (-0.4%) | | | | | | | | | | | | | | | (18,925,463 | ) |
| | | | |
| | | | | | | | | | | | | | | | |
| | | | |
| Other assets and liabilities (0.0%) | | | | | | | | | | | | | | | (1,634,105 | ) |
| | | | |
| | | | | | | | | | | | | | | | |
| | | | |
| Total net assets (100.0%) | | | | | | | | | | | | | | | 4,825,190,926 | |
| | | | |
| | | | | | | | | | | | | | | | |
W Fund ownership consists of 5% or more of the shares outstanding of the Affiliated Issuer, as defined under the Investment Securities Act of 1940. | |
q This security is non-income producing. | |
l This security, or partial position of this security, was on loan at December 31, 2024. The total value of the securities on loan at December 31, 2024 was $18,482,852. | |
a Market value adjustments have been applied to these securities to reflect potential early withdrawal. Such securities have been classified as level 3. | |
| | | | |
plc Public Limited Company | | | | | | | | | | | | | | | | |
ADR American Depositary Receipt | | | | | | | | | | | | | | | | |
34
| | | | |
| | |
| Annual Report • 2024 | | | | |
Parnassus Mid Cap Fund
Portfolio of Investments as of December 31, 2024
| | | | | | | | |
| | |
| Equities | | Shares | | | Market
Value ($) | |
| | |
| Banks (3.3%) | | | | | | | | |
| Truist Financial Corp. | | | 2,141,993 | | | | 92,919,656 | |
| | |
| | | | | | | | |
| | |
| Capital Markets (6.9%) | | | | | | | | |
| Cboe Global Markets Inc. | | | 507,032 | | | | 99,074,053 | |
| The Bank of New York Mellon Corp. | | | 1,272,449 | | | | 97,762,257 | |
| | |
| | | | | | | | |
| | | | | | | 196,836,310 | |
| | |
| | | | | | | | |
| | |
| Chemicals (1.9%) | | | | | | | | |
| The Sherwin-Williams Co. | | | 156,283 | | | | 53,125,280 | |
| | |
| | | | | | | | |
| | |
Commercial Services &
Supplies (3.1%) | | | | | | | | |
| Republic Services Inc. | | | 430,341 | | | | 86,576,002 | |
| | |
| | | | | | | | |
| | |
| Containers & Packaging (1.6%) | | | | | | | | |
| Ball Corp. W | | | 837,069 | | | | 46,147,614 | |
| | |
| | | | | | | | |
| | |
| Distributors (2.5%) | | | | | | | | |
| Pool Corp. | | | 207,874 | | | | 70,872,561 | |
| | |
| | | | | | | | |
| | |
| Diversified Financial Services (4.0%) | | | | | | | | |
| Fidelity National Information Services | | | 1,409,635 | | | | 113,856,219 | |
| | |
| | | | | | | | |
| | |
Equity Real Estate Investment
Trusts (5.5%) | | | | | | | | |
| CBRE Group Inc., Class A q | | | 807,385 | | | | 106,001,577 | |
| Realty Income Corp. | | | 938,245 | | | | 50,111,665 | |
| | |
| | | | | | | | |
| | | | | | | 156,113,242 | |
| | |
| | | | | | | | |
| | |
Health Care Equipment &
Supplies (2.7%) | | | | | | | | |
| Hologic Inc. q | | | 1,063,421 | | | | 76,662,020 | |
| | |
| | | | | | | | |
| | |
| Hotels, Restaurants & Leisure (1.4%) | | | | | | | | |
| Hilton Worldwide Holdings Inc. | | | 162,648 | | | | 40,200,080 | |
| | |
| | | | | | | | |
| | |
| Household Durables (2.3%) | | | | | | | | |
| D.R. Horton Inc. | | | 469,471 | | | | 65,641,435 | |
| | |
| | | | | | | | |
| | |
| Independent Power & Renewable Electricity Producers (1.2%) | | | | | | | | |
| Brookfield Renewable Corp. l | | | 1,241,258 | | | | 34,333,196 | |
| | |
| | | | | | | | |
| | |
| Insurance (5.2%) | | | | | | | | |
| The Allstate Corp. | | | 446,841 | | | | 86,146,476 | |
| W R Berkley Corp. | | | 1,060,467 | | | | 62,058,529 | |
| | |
| | | | | | | | |
| | | | | | | 148,205,005 | |
| | |
| | | | | | | | |
| | |
Life Sciences Tools &
Services (3.8%) | | | | | | | | |
| IQVIA Holdings Inc. q | | | 334,178 | | | | 65,669,319 | |
| Repligen Corp. q | | | 297,730 | | | | 42,855,256 | |
| | |
| | | | | | | | |
| | | | | | | 108,524,575 | |
| | |
| | | | | | | | |
| | | | | | | | |
| | |
| Equities | | | Shares | | |
| Market
Value ($) |
|
| | |
| Machinery (7.3%) | | | | | | | | |
| Otis Worldwide Corp. | | | 771,116 | | | | 71,413,053 | |
| Pentair plc | | | 516,798 | | | | 52,010,551 | |
| Xylem Inc. | | | 735,489 | | | | 85,331,434 | |
| | |
| | | | | | | | |
| | | | | | | 208,755,038 | |
| | |
| | | | | | | | |
| | |
| Media (2.7%) | | | | | | | | |
| The Trade Desk, Inc., Class A q | | | 659,198 | | | | 77,475,541 | |
| | |
| | | | | | | | |
| | |
| Professional Services (6.6%) | | | | | | | | |
| Broadridge Financial Solutions Inc. | | | 349,510 | | | | 79,020,716 | |
| TransUnion | | | 1,167,746 | | | | 108,261,732 | |
| | |
| | | | | | | | |
| | | | | | | 187,282,448 | |
| | |
| | | | | | | | |
| | |
| Road & Rail (5.5%) | | | | | | | | |
| J.B. Hunt Transport Services Inc. | | | 595,060 | | | | 101,552,940 | |
| Old Dominion Freight Line Inc. | | | 305,089 | | | | 53,817,700 | |
| | |
| | | | | | | | |
| | | | | | | 155,370,640 | |
| | |
| | | | | | | | |
| | |
Semiconductors & Semiconductor
Equipment (4.6%) | | | | | | | | |
| KLA Corp. | | | 112,235 | | | | 70,721,518 | |
| Lam Research Corp. | | | 847,483 | | | | 61,213,697 | |
| | |
| | | | | | | | |
| | | | | | | 131,935,215 | |
| | |
| | | | | | | | |
| | |
| Software (16.4%) | | | | | | | | |
| Atlassian Corp., Class A q | | | 195,356 | | | | 47,545,743 | |
| Autodesk Inc. q | | | 284,146 | | | | 83,985,033 | |
| Fortinet Inc. q | | | 1,105,804 | | | | 104,476,362 | |
| Guidewire Software Inc. q | | | 384,447 | | | | 64,810,075 | |
| Roper Technologies Inc. | | | 179,137 | | | | 93,124,369 | |
| Workday Inc., Class A q | | | 267,536 | | | | 69,032,314 | |
| | |
| | | | | | | | |
| | | | | | | 462,973,896 | |
| | |
| | | | | | | | |
| | |
| Specialty Retail (5.6%) | | | | | | | | |
| O’Reilly Automotive Inc. q | | | 62,317 | | | | 73,895,499 | |
| Ross Stores Inc. | | | 571,949 | | | | 86,518,725 | |
| | |
| | | | | | | | |
| | | | | | | 160,414,224 | |
| | |
| | | | | | | | |
| | |
Technology Hardware,
Storage & Peripherals (2.8%) | | | | | | | | |
| Western Digital Corp. q | | | 1,339,847 | | | | 79,895,077 | |
| | |
| | | | | | | | |
| | |
| Trading Companies & Distributors (2.3%) | | | | | | | | |
| Ferguson Enterprises Inc. | | | 373,514 | | | | 64,830,825 | |
| | |
| | | | | | | | |
| |
Total investment in equities (99.2%)
(cost $2,223,324,251) | | | | 2,818,946,099 | |
| | |
| | | | | | | | |
35
| | | | |
| | |
| | | | Annual Report • 2024 |
Parnassus Mid Cap Fund
Portfolio of Investments as of December 31, 2024 (continued)
| | | | | | | | | | | | | | | | |
| | | | |
| Short-Term Securities | | Interest
Rate | | | Maturity
Date | | | Principal
Amount ($) | | | Market
Value ($) | |
| | |
| Certificates of Deposit (0.0%) a | | | | | | | | | |
| Beneficial State Bank | | | 4.00 | % | | | 03/27/2025 | | | | 250,000 | | | | 247,671 | |
| Citizens Trust Bank | | | 1.00 | % | | | 01/14/2025 | | | | 250,000 | | | | 249,645 | |
| Self-Help Federal Credit Union | | | 4.60 | % | | | 02/17/2025 | | | | 250,000 | | | | 248,716 | |
| | | | |
| | | | | | | | | | | | | | | | |
| | | | | | | | | | | | | | | 746,032 | |
| | | | |
| | | | | | | | | | | | | | | | |
| | | |
| Securities Purchased with Cash Collateral from Securities Lending | | | | | | | | | | | | | |
| | | | |
| Registered Investment Companies (0.3%) | | | | | | | | | | | | | | | | |
| Invesco Aim Government & Agency Portfolio Short-Term Investments Trust, Institutional Class | | | 4.36 | % | | | | | | | | | | | 9,686,000 | |
| | | | |
| | | | | | | | | | | | | | | | |
| | | | |
| Time Deposits (0.9%) | | | | | | | | | | | | | | | | |
| JPMorgan Chase, New York | | | 3.68 | % | | | 01/02/2025 | | | | 24,788,663 | | | | 24,788,663 | |
| | | | |
| | | | | | | | | | | | | | | | |
| | | | |
Total short-term securities (1.2%)
(cost $35,220,695) | | | | | | | | | | | | | | | 35,220,695 | |
| | | | |
| | | | | | | | | | | | | | | | |
| | | | |
Total securities (100.4%)
(cost $2,258,544,946) | | | | | | | | | | | | | | | 2,854,166,794 | |
| | | | |
| | | | | | | | | | | | | | | | |
| Payable upon return of securities loaned (-0.3%) | | | | | | | | | | | | | | | (9,686,000 | ) |
| | | | |
| | | | | | | | | | | | | | | | |
| Other assets and liabilities (-0.1%) | | | | | | | | | | | | | | | (2,039,021 | ) |
| | | | |
| | | | | | | | | | | | | | | | |
| | | | |
| Total net assets (100.0%) | | | | | | | | | | | | | | | 2,842,441,773 | |
| | | | |
| | | | | | | | | | | | | | | | |
W Fund ownership consists of 5% or more of the shares outstanding of the Affiliated Issuer, as defined under the Investment Securities Act of 1940. | |
q This security is non-income producing. | |
l This security, or partial position of this security, was on loan at December 31, 2024. The total value of the securities on loan at December 31, 2024 was $9,375,380. | |
a Market value adjustments have been applied to these securities to reflect potential early withdrawal. Such securities have been classified as level 3. | |
| |
plc Public Limited Company | | | | | |
36
| | | | |
| | |
| Annual Report • 2024 | | | | |
Parnassus Mid Cap Growth Fund
Portfolio of Investments as of December 31, 2024
| | | | | | | | |
| | |
| Equities | | Shares | | | Market
Value ($) | |
| | |
| Building Products (3.9%) | | | | | | | | |
| Trane Technologies plc | | | 88,575 | | | | 32,715,176 | |
| | |
| | | | | | | | |
| | |
| Capital Markets (5.2%) | | | | | | | | |
| Morningstar Inc. | | | 70,111 | | | | 23,610,580 | |
| MSCI Inc., Class A | | | 34,045 | | | | 20,427,340 | |
| | |
| | | | | | | | |
| | | | | | | 44,037,920 | |
| | |
| | | | | | | | |
| | |
| Chemicals (2.9%) | | | | | | | | |
| The Sherwin-Williams Co. | | | 71,196 | | | | 24,201,656 | |
| | |
| | | | | | | | |
| | |
Commercial Services &
Supplies (1.4%) | | | | | | | | |
| Cintas Corp. | | | 63,373 | | | | 11,578,247 | |
| | |
| | | | | | | | |
| | |
| Distributors (2.7%) | | | | | | | | |
| Pool Corp. | | | 66,291 | | | | 22,601,254 | |
| | |
| | | | | | | | |
| | |
| Diversified Financial Services (3.2%) | | | | | | | | |
| Block Inc., Class A q | | | 317,525 | | | | 26,986,450 | |
| | |
| | | | | | | | |
| | |
| Electrical Equipment (2.1%) | | | | | | | | |
| Rockwell Automation Inc. | | | 62,471 | | | | 17,853,587 | |
| | |
| | | | | | | | |
| | |
Health Care Equipment &
Supplies (2.4%) | | | | | | | | |
| IDEXX Laboratories Inc. q | | | 48,347 | | | | 19,988,584 | |
| | |
| | | | | | | | |
| | |
| Hotels, Restaurants & Leisure (3.1%) | | | | | | | | |
| Hilton Worldwide Holdings Inc. | | | 107,121 | | | | 26,476,026 | |
| | |
| | | | | | | | |
| | |
| IT Services (1.7%) | | | | | | | | |
| Cloudflare Inc., Class A q | | | 129,094 | | | | 13,900,842 | |
| | |
| | | | | | | | |
| | |
| Life Sciences Tools & Services (9.3%) | | | | | | | | |
| Agilent Technologies Inc. | | | 196,258 | | | | 26,365,300 | |
| Mettler-Toledo International Inc. q | | | 17,617 | | | | 21,557,571 | |
| Repligen Corp. q | | | 68,502 | | | | 9,860,178 | |
| West Pharmaceutical Services Inc. | | | 62,479 | | | | 20,465,621 | |
| | |
| | | | | | | | |
| | | | | | | 78,248,670 | |
| | |
| | | | | | | | |
| | |
| Media (2.9%) | | | | | | | | |
| The Trade Desk Inc., Class A q | | | 203,816 | | | | 23,954,494 | |
| | |
| | | | | | | | |
| | |
| Multiline Retail (3.4%) | | | | | | | | |
| MercadoLibre Inc. q | | | 16,805 | | | | 28,575,894 | |
| | |
| | | | | | | | |
| | |
| Professional Services (9.1%) | | | | | | | | |
| Broadridge Financial Solutions Inc. | | | 110,082 | | | | 24,888,439 | |
| Equifax Inc. | | | 145,781 | | | | 37,152,288 | |
| Verisk Analytics Inc., Class A | | | 54,248 | | | | 14,941,527 | |
| | |
| | | | | | | | |
| | | | | | | 76,982,254 | |
| | |
| | | | | | | | |
| | | | | | | | |
| | |
| Equities | | | Shares | | |
| Market
Value ($) |
|
| | |
| Road & Rail (8.0%) | | | | | | | | |
| J.B. Hunt Transport Services Inc. | | | 194,978 | | | | 33,274,946 | |
| Old Dominion Freight Line Inc. | | | 193,888 | | | | 34,201,843 | |
| | |
| | | | | | | | |
| | | | | | | 67,476,789 | |
| | |
| | | | | | | | |
| | |
| Semiconductors & Semiconductor Equipment (8.3%) | | | | | | | | |
| KLA Corp. | | | 35,307 | | | | 22,247,647 | |
| Monolithic Power Systems Inc. | | | 28,450 | | | | 16,833,865 | |
| Teradyne Inc. | | | 242,068 | | | | 30,481,203 | |
| | |
| | | | | | | | |
| | | | | | | 69,562,715 | |
| | |
| | | | | | | | |
| | |
| Software (22.6%) | | | | | | | | |
| Atlassian Corp., Class A q | | | 126,461 | | | | 30,778,078 | |
| Autodesk Inc. q | | | 67,209 | | | | 19,864,964 | |
| Cadence Design Systems Inc. q | | | 54,099 | | | | 16,254,586 | |
| Datadog Inc., Class A q | | | 182,922 | | | | 26,137,725 | |
| Fortinet Inc. q | | | 249,593 | | | | 23,581,547 | |
| Guidewire Software Inc. q | | | 115,164 | | | | 19,414,347 | |
| Procore Technologies Inc. q | | | 147,079 | | | | 11,020,629 | |
| PTC Inc. q | | | 92,332 | | | | 16,977,085 | |
| Workday Inc., Class A q | | | 104,573 | | | | 26,982,971 | |
| | |
| | | | | | | | |
| | | | | | | 191,011,932 | |
| | |
| | | | | | | | |
| | |
| Specialty Retail (4.5%) | | | | | | | | |
| O’Reilly Automotive Inc. q | | | 16,459 | | | | 19,517,082 | |
| Ross Stores Inc. | | | 123,305 | | | | 18,652,347 | |
| | |
| | | | | | | | |
| | | | | | | 38,169,429 | |
| | |
| | | | | | | | |
| | |
| Technology Hardware, Storage & Peripherals (2.6%) | | | | | | | | |
| Western Digital Corp. q | | | 368,651 | | | | 21,982,659 | |
| | |
| | | | | | | | |
| | |
Total investment in equities (99.3%)
(cost $596,744,056) | | | | | | | 836,304,578 | |
| | |
| | | | | | | | |
37
| | | | |
| | |
| | | | Annual Report • 2024 |
Parnassus Mid Cap Growth Fund
Portfolio of Investments as of December 31, 2024 (continued)
| | | | | | | | | | | | | | | | |
| | | | |
| Short-Term Securities | | Interest
Rate | | | Maturity
Date | | | Principal
Amount ($) | | | Market
Value ($) | |
| | | | |
| Certificates of Deposit (0.1%) a | | | | | | | | | | | | | | | | |
| Beneficial State Bank | | | 4.00 | % | | | 01/15/2025 | | | | 250,000 | | | | 249,617 | |
| Citizens Trust Bank | | | 1.00 | % | | | 01/14/2025 | | | | 200,000 | | | | 199,716 | |
| | | | |
| | | | | | | | | | | | | | | | |
| | | | | | | | | | | | | | | 449,333 | |
| | | | |
| | | | | | | | | | | | | | | | |
| | | | |
| Certificates of Deposit Account Registry Service (0.1%) a | | | | | | | | | | | | | | | | |
CDARS agreement with Beneficial State Bank,
dated 03/14/2024
Participating depository institutions:
First Business Bank, par 235,500;
Frontier Bank, par 141,898;
Solera National Bank, par 122,602;
(cost $496,099) | | | 4.18 | % | | | 03/13/2025 | | | | 500,000 | | | | 496,099 | |
| | | | |
| | | | | | | | | | | | | | | | |
| | | | |
| Community Development Loans (0.0%) a | | | | | | | | | | | | | | | | |
| Root Capital Inc. | | | 1.00 | % | | | 02/01/2025 | | | | 100,000 | | | | 99,492 | |
| | | | |
| | | | | | | | | | | | | | | | |
| | | | |
| Time Deposits (0.6%) | | | | | | | | | | | | | | | | |
| JPMorgan Chase, New York | | | 3.68 | % | | | 01/02/2025 | | | | 5,325,069 | | | | 5,325,069 | |
| | | | |
| | | | | | | | | | | | | | | | |
| | | | |
Total short-term securities (0.8%)
(cost $6,369,993) | | | | | | | | | | | | | | | 6,369,993 | |
| | | | |
| | | | | | | | | | | | | | | | |
| | | | |
Total securities (100.1%)
(cost $603,114,049) | | | | | | | | | | | | | | | 842,674,571 | |
| | | | |
| | | | | | | | | | | | | | | | |
| Other assets and liabilities (-0.1%) | | | | | | | | | | | | | | | (714,281 | ) |
| | | | |
| | | | | | | | | | | | | | | | |
| | | | |
| Total net assets (100.0%) | | | | | | | | | | | | | | | 841,960,290 | |
| | | | |
| | | | | | | | | | | | | | | | |
| | | | | | | | | | |
q This security is non-income producing. | |
a Market value adjustments have been applied to these securities to reflect potential early withdrawal. Such securities have been classified as level 3. | |
| | | | |
plc Public Limited Company | | | | | | | | | | |
38
| | | | |
| | |
| Annual Report • 2024 | | | | |
Parnassus Fixed Income Fund
Portfolio of Investments as of December 31, 2024
| | | | | | | | | | | | | | | | |
| | | | |
| Exchange-Traded Funds | | Interest
Rate | | | Maturity
Date | | | Shares | | | Market
Value ($) | |
| | | | |
| Mortgage Real Estate Investment Trusts (4.9%) | | | | | | | | | | | | | | | | |
| iShares MBS ETF | | | | | | | | | | | 155,000 | | | | 14,210,400 | |
| | | | |
| | | | | | | | | | | | | | | | |
| | | | |
Total investment in Exchange-Traded Funds (4.9%)
(cost $14,004,458) | | | | | | | | | | | | | | | 14,210,400 | |
| | | | |
| | | | | | | | | | | | | | | | |
| | | | | | | | | | | | | | | | |
| | | | |
| Preferred Stocks | | | | | | | | | | | | |
| | | | |
| Capital Markets (0.6%) | | | | | | | | | | | | | | | | |
| Morgan Stanley | | | 4.25 | % | | | 01/15/2027 | | | | 100,000 | | | | 1,841,000 | |
| | | | |
| | | | | | | | | | | | | | | | |
| | | | |
Total investment in Preferred Stocks (0.6%)
(cost $2,105,029) | | | | | | | | | | | | | | | 1,841,000 | |
| | | | |
| | | | | | | | | | | | | | | | |
| | | | | | | | | | | | | | | | |
| | | | |
| Corporate Bonds | | | | | | | | Principal
Amount ($) | | | | |
| | | | |
| Air Freight & Logistics (1.9%) | | | | | | | | | | | | | | | | |
| C.H. Robinson Worldwide Inc. | | | 4.20 | % | | | 04/15/2028 | | | | 3,000,000 | | | | 2,921,539 | |
| FedEx Corp. | | | 4.25 | % | | | 05/15/2030 | | | | 1,500,000 | | | | 1,452,934 | |
| FedEx Corp. | | | 4.75 | % | | | 11/15/2045 | | | | 1,500,000 | | | | 1,287,974 | |
| | | | |
| | | | | | | | | | | | | | | | |
| | | | | | | | | | | | | | | 5,662,447 | |
| | | | |
| | | | | | | | | | | | | | | | |
| | | | |
| Airlines (1.7%) | | | | | | | | | | | | | | | | |
| Alaska Airlines 2020-1 Class B Pass Through Trust, Class B l | | | 8.00 | % | | | 08/15/2025 | | | | 1,886,816 | | | | 1,903,797 | |
| Southwest Airlines Co. | | | 5.13 | % | | | 06/15/2027 | | | | 3,000,000 | | | | 3,013,634 | |
| | | | |
| | | | | | | | | | | | | | | | |
| | | | | | | | | | | | | | | 4,917,431 | |
| | | | |
| | | | | | | | | | | | | | | | |
| | | | |
| Auto Components (1.0%) | | | | | | | | | | | | | | | | |
| APTIV plc | | | 5.40 | % | | | 03/15/2049 | | | | 2,500,000 | | | | 2,147,407 | |
| APTIV plc | | | 4.15 | % | | | 05/01/2052 | | | | 1,000,000 | | | | 712,265 | |
| | | | |
| | | | | | | | | | | | | | | | |
| | | | | | | | | | | | | | | 2,859,672 | |
| | | | |
| | | | | | | | | | | | | | | | |
| | | | |
| Banks (1.5%) | | | | | | | | | | | | | | | | |
| Bank of America Corp. | | | 3.85 | % | | | 03/08/2037 | | | | 1,750,000 | | | | 1,550,432 | |
| Citigroup Inc. | | | 2.01 | % | | | 01/25/2026 | | | | 2,750,000 | | | | 2,743,873 | |
| | | | |
| | | | | | | | | | | | | | | | |
| | | | | | | | | | | | | | | 4,294,305 | |
| | | | |
| | | | | | | | | | | | | | | | |
| | | | |
| Building Products (0.9%) | | | | | | | | | | | | | | | | |
| Masco Corp. | | | 4.50 | % | | | 05/15/2047 | | | | 3,260,000 | | | | 2,666,332 | |
| | | | |
| | | | | | | | | | | | | | | | |
| | | | |
| Capital Markets (1.0%) | | | | | | | | | | | | | | | | |
| The Charles Schwab Corp. | | | 4.00 | % | | | 06/01/2026 | | | | 3,000,000 | | | | 2,904,616 | |
| | | | |
| | | | | | | | | | | | | | | | |
| | | | |
| Chemicals (1.5%) | | | | | | | | | | | | | | | | |
| International Flavors & Fragrances Inc. | | | 5.00 | % | | | 09/26/2048 | | | | 3,300,000 | | | | 2,835,360 | |
| The Sherwin-Williams Co. | | | 4.50 | % | | | 06/01/2047 | | | | 2,000,000 | | | | 1,684,010 | |
| | | | |
| | | | | | | | | | | | | | | | |
| | | | | | | | | | | | | | | 4,519,370 | |
| | | | |
| | | | | | | | | | | | | | | | |
| | | | |
| Commercial Services & Supplies (1.0%) | | | | | | | | | | | | | | | | |
| CCO Holdings LLC / CCO Holdings Capital Corp. l | | | 4.75 | % | | | 03/01/2030 | | | | 3,000,000 | | | | 2,739,499 | |
| | | | |
| | | | | | | | | | | | | | | | |
| | | | |
| Consumer Finance (0.6%) | | | | | | | | | | | | | | | | |
| Capital One Financial Corp. | | | 2.62 | % | | | 11/02/2032 | | | | 2,000,000 | | | | 1,656,308 | |
| | | | |
| | | | | | | | | | | | | | | | |
39
| | | | |
| | |
| | | | Annual Report • 2024 |
Parnassus Fixed Income Fund
Portfolio of Investments as of December 31, 2024 (continued)
| | | | | | | | | | | | | | | | |
| | | | |
| Corporate Bonds | | Interest
Rate | | | Maturity
Date | | | Principal
Amount ($) | | | Market
Value ($) | |
| | | | |
| Diversified Financial Services (4.8%) | | | | | | | | | | | | | | | | |
| Ares Finance Co. III LLC l | | | 4.13 | % | | | 06/30/2051 | | | | 2,500,000 | | | | 2,395,612 | |
| Fiserv Inc. | | | 5.60 | % | | | 03/02/2033 | | | | 2,500,000 | | | | 2,533,608 | |
| Global Payments Inc. | | | 5.95 | % | | | 08/15/2052 | | | | 3,000,000 | | | | 2,912,240 | |
| The Bank of New York Mellon Corp. | | | 3.75 | % | | | 10/31/2026 | | | | 3,000,000 | | | | 2,835,225 | |
| Truist Financial Corp. | | | 5.13 | % | | | 12/15/2027 | | | | 3,500,000 | | | | 3,419,906 | |
| | | | |
| | | | | | | | | | | | | | | | |
| | | | | | | | | | | | | | | 14,096,591 | |
| | | | |
| | | | | | | | | | | | | | | | |
| | | | |
| Diversified Telecommunication Services (0.9%) | | | | | | | | | | | | | | | | |
| Verizon Communications Inc. | | | 2.85 | % | | | 09/03/2041 | | | | 3,750,000 | | | | 2,594,729 | |
| | | | |
| | | | | | | | | | | | | | | | |
| | | | |
| Electric Utilities (1.9%) | | | | | | | | | | | | | | | | |
| Dominion Energy Inc. | | | 2.25 | % | | | 08/15/2031 | | | | 3,000,000 | | | | 2,497,995 | |
| Public Service Co. of Oklahoma | | | 2.20 | % | | | 08/15/2031 | | | | 3,500,000 | | | | 2,895,701 | |
| | | | |
| | | | | | | | | | | | | | | | |
| | | | | | | | | | | | | | | 5,393,696 | |
| | | | |
| | | | | | | | | | | | | | | | |
| | | | |
| Electronic Equipment, Instruments & Components (0.9%) | | | | | | | | | | | | | | | | |
| Trimble Inc. | | | 6.10 | % | | | 03/15/2033 | | | | 2,500,000 | | | | 2,596,568 | |
| | | | |
| | | | | | | | | | | | | | | | |
| | | | |
| Equity Real Estate Investment Trusts (3.1%) | | | | | | | | | | | | | | | | |
| Alexandria Real Estate Equities Inc. | | | 2.00 | % | | | 05/18/2032 | | | | 2,250,000 | | | | 1,794,302 | |
| Alexandria Real Estate Equities Inc. | | | 4.85 | % | | | 04/15/2049 | | | | 1,500,000 | | | | 1,289,426 | |
| American Tower Corp. | | | 3.70 | % | | | 10/15/2049 | | | | 4,000,000 | | | | 2,901,439 | |
| SBA Communications Corp. | | | 3.88 | % | | | 02/15/2027 | | | | 3,000,000 | | | | 2,876,025 | |
| | | | |
| | | | | | | | | | | | | | | | |
| | | | | | | | | | | | | | | 8,861,192 | |
| | | | |
| | | | | | | | | | | | | | | | |
| | | | |
| Food & Staples Retailing (0.9%) | | | | | | | | | | | | | | | | |
| Sysco Corp. | | | 2.40 | % | | | 02/15/2030 | | | | 3,000,000 | | | | 2,646,090 | |
| | | | |
| | | | | | | | | | | | | | | | |
| | | | |
| Food Products (1.1%) | | | | | | | | | | | | | | | | |
| McCormick & Co., Inc. | | | 2.50 | % | | | 04/15/2030 | | | | 3,500,000 | | | | 3,095,244 | |
| | | | |
| | | | | | | | | | | | | | | | |
| | | | |
| Health Care Equipment & Supplies (1.8%) | | | | | | | | | | | | | | | | |
| Baxter International Inc. | | | 2.54 | % | | | 02/01/2032 | | | | 3,000,000 | | | | 2,502,336 | |
| Becton, Dickinson and Co. | | | 4.69 | % | | | 12/15/2044 | | | | 3,000,000 | | | | 2,595,430 | |
| | | | |
| | | | | | | | | | | | | | | | |
| | | | | | | | | | | | | | | 5,097,766 | |
| | | | |
| | | | | | | | | | | | | | | | |
| | | | |
| Hotels, Restaurants & Leisure (0.9%) | | | | | | | | | | | | | | | | |
| Yum! Brands Inc. | | | 4.63 | % | | | 01/31/2032 | | | | 3,000,000 | | | | 2,772,095 | |
| | | | |
| | | | | | | | | | | | | | | | |
| | | | |
| Insurance (0.5%) | | | | | | | | | | | | | | | | |
| The Progressive Corp. | | | 3.20 | % | | | 03/26/2030 | | | | 1,500,000 | | | | 1,385,811 | |
| | | | |
| | | | | | | | | | | | | | | | |
| | | | |
| Life Sciences Tools & Services (1.0%) | | | | | | | | | | | | | | | | |
| Agilent Technologies Inc. | | | 2.75 | % | | | 09/15/2029 | | | | 3,250,000 | | | | 2,952,179 | |
| | | | |
| | | | | | | | | | | | | | | | |
| | | | |
| Machinery (2.0%) | | | | | | | | | | | | | | | | |
| Pentair Finance SA | | | 4.50 | % | | | 07/01/2029 | | | | 3,000,000 | | | | 2,916,729 | |
| Xylem Inc. | | | 2.25 | % | | | 01/30/2031 | | | | 3,500,000 | | | | 2,983,933 | |
| | | | |
| | | | | | | | | | | | | | | | |
| | | | | | | | | | | | | | | 5,900,662 | |
| | | | |
| | | | | | | | | | | | | | | | |
| | | | |
| Pharmaceuticals (1.0%) | | | | | | | | | | | | | | | | |
| Merck & Co., Inc. | | | 1.90 | % | | | 12/10/2028 | | | | 3,250,000 | | | | 2,931,836 | |
| | | | |
| | | | | | | | | | | | | | | | |
| | | | |
| Real Estate Investment Trust (1.0%) | | | | | | | | | | | | | | | | |
| Prologis LP | | | 2.88 | % | | | 11/15/2029 | | | | 3,250,000 | | | | 2,974,906 | |
| | | | |
| | | | | | | | | | | | | | | | |
40
| | | | |
| | |
| Annual Report • 2024 | | | | |
Parnassus Fixed Income Fund
Portfolio of Investments as of December 31, 2024 (continued)
| | | | | | | | | | | | | | | | |
| | | | |
| Corporate Bonds | | Interest
Rate | | | Maturity
Date | | | Principal
Amount ($) | | | Market
Value ($) | |
| | | | |
| Road & Rail (0.5%) | | | | | | | | | | | | | | | | |
| Canadian Pacific Railway Co. | | | 2.88 | % | | | 11/15/2029 | | | | 1,500,000 | | | | 1,368,722 | |
| | | | |
| | | | | | | | | | | | | | | | |
| | | | |
| Semiconductors & Semiconductor Equipment (3.0%) | | | | | | | | | | | | | | | | |
| Intel Corp. | | | 4.15 | % | | | 08/05/2032 | | | | 3,200,000 | | | | 2,912,895 | |
| Micron Technology Inc. | | | 2.70 | % | | | 04/15/2032 | | | | 3,500,000 | | | | 2,934,314 | |
| Qorvo Inc. l | | | 3.38 | % | | | 04/01/2031 | | | | 3,250,000 | | | | 2,779,568 | |
| | | | |
| | | | | | | | | | | | | | | | |
| | | | | | | | | | | | | | | 8,626,777 | |
| | | | |
| | | | | | | | | | | | | | | | |
| | | | |
| Software (2.9%) | | | | | | | | | | | | | | | | |
| Autodesk Inc. | | | 2.40 | % | | | 12/15/2031 | | | | 3,500,000 | | | | 2,941,269 | |
| Oracle Corp. | | | 6.13 | % | | | 07/08/2039 | | | | 2,750,000 | | | | 2,848,584 | |
| Roper Technologies Inc. | | | 2.95 | % | | | 09/15/2029 | | | | 3,000,000 | | | | 2,740,530 | |
| | | | |
| | | | | | | | | | | | | | | | |
| | | | | | | | | | | | | | | 8,530,383 | |
| | | | |
| | | | | | | | | | | | | | | | |
| | | | |
| Specialty Retail (2.9%) | | | | | | | | | | | | | | | | |
| Lowe’s Companies, Inc. | | | 2.80 | % | | | 09/15/2041 | | | | 3,750,000 | | | | 2,575,442 | |
| O’Reilly Automotive Inc. | | | 4.20 | % | | | 04/01/2030 | | | | 3,000,000 | | | | 2,883,730 | |
| Ross Stores Inc. | | | 4.80 | % | | | 04/15/2030 | | | | 3,000,000 | | | | 2,923,862 | |
| | | | |
| | | | | | | | | | | | | | | | |
| | | | | | | | | | | | | | | 8,383,034 | |
| | | | |
| | | | | | | | | | | | | | | | |
| | | | |
| Textiles, Apparel & Luxury Goods (0.7%) | | | | | | | | | | | | | | | | |
| VF Corp. | | | 6.00 | % | | | 10/15/2033 | | | | 2,000,000 | | | | 1,920,177 | |
| | | | |
| | | | | | | | | | | | | | | | |
| | | | |
| Transportation Infrastructure (0.9%) | | | | | | | | | | | | | | | | |
| Avantor Funding Inc. l | | | 4.63 | % | | | 07/15/2028 | | | | 2,750,000 | | | | 2,624,886 | |
| | | | |
| | | | | | | | | | | | | | | | |
| | | | |
| Wireless Telecommunication Services (0.9%) | | | | | | | | | | | | | | | | |
| T-Mobile USA Inc. | | | 4.38 | % | | | 04/15/2040 | | | | 3,000,000 | | | | 2,602,401 | |
| | | | |
| | | | | | | | | | | | | | | | |
| | | | |
Total investment in Corporate Bonds (44.7%)
(cost $136,759,284) | | | | | | | | | | | | | | | 129,575,725 | |
| | | | |
| | | | | | | | | | | | | | | | |
| | | | | | | | | | | | | | | | |
| | | | |
| Supranational Bonds | | | | | | | | | | | | |
| European Bank for Reconstruction & Development | | | 1.50 | % | | | 02/13/2025 | | | | 2,000,000 | | | | 1,993,301 | |
| European Investment Bank | | | 1.63 | % | | | 10/09/2029 | | | | 2,000,000 | | | | 1,759,684 | |
| European Investment Bank | | | 0.75 | % | | | 09/23/2030 | | | | 2,000,000 | | | | 1,626,337 | |
| International Bank for Reconstruction & Development | | | 3.13 | % | | | 11/20/2025 | | | | 4,000,000 | | | | 3,953,753 | |
| International Bank for Reconstruction & Development | | | 4.00 | % | | | 01/10/2031 | | | | 3,000,000 | | | | 2,909,828 | |
| International Bank for Reconstruction & Development | | | 4.50 | % | | | 04/10/2031 | | | | 3,000,000 | | | | 2,989,304 | |
| International Bank for Reconstruction & Development | | | 1.63 | % | | | 11/03/2031 | | | | 5,000,000 | | | | 4,135,743 | |
| International Finance Corp. | | | 2.13 | % | | | 04/07/2026 | | | | 6,000,000 | | | | 5,826,512 | |
| International Finance Corp. | | | 4.38 | % | | | 01/15/2027 | | | | 4,000,000 | | | | 3,996,780 | |
| | | | |
| | | | | | | | | | | | | | | | |
| | | | |
Total investment in Supranational Bonds (10.1%)
(cost $30,992,879) | | | | | | | | | | | | | | | 29,191,242 | |
| | | | |
| | | | | | | | | | | | | | | | |
| | | | | | | | | | | | | | | | |
| | | | |
| U.S. Government Agency Bonds | | | | | | | | | | | | |
| Fannie Mae Pool BY0205 | | | 5.50 | % | | | 05/01/2053 | | | | 1,727,953 | | | | 1,705,382 | |
| Fannie Mae Pool BY4185 | | | 5.00 | % | | | 07/01/2053 | | | | 2,315,161 | | | | 2,237,110 | |
| Fannie Mae Pool DA0007 | | | 5.50 | % | | | 09/01/2053 | | | | 3,755,551 | | | | 3,706,378 | |
| Fannie Mae Pool DB6905 | | | 6.00 | % | | | 07/01/2054 | | | | 2,383,981 | | | | 2,396,799 | |
| Fannie Mae Pool FS4736 | | | 6.50 | % | | | 05/01/2053 | | | | 2,850,667 | | | | 2,920,424 | |
41
| | | | |
| | |
| | | | Annual Report • 2024 |
Parnassus Fixed Income Fund
Portfolio of Investments as of December 31, 2024 (continued)
| | | | | | | | | | | | | | | | |
| | | | |
| U.S. Government Agency Bonds | | Interest
Rate | | | Maturity
Date | | | Principal
Amount ($) | | | Market Value ($) | |
| Fannie Mae Pool FS6916 | | | 5.00 | % | | | 06/01/2053 | | | | 1,887,960 | | | | 1,826,211 | |
| Fannie Mae Pool MA4379 | | | 2.50 | % | | | 07/01/2051 | | | | 2,203,356 | | | | 1,809,058 | |
| Fannie Mae Pool MA4709 | | | 5.00 | % | | | 07/01/2052 | | | | 1,623,181 | | | | 1,569,785 | |
| Fannie Mae Pool MA5216 | | | 6.00 | % | | | 12/01/2053 | | | | 3,323,185 | | | | 3,342,027 | |
| Fannie Mae Pool MA5444 | | | 5.50 | % | | | 08/01/2054 | | | | 2,418,472 | | | | 2,386,804 | |
| Fannie Mae Pool MA5550 | | | 4.00 | % | | | 12/01/2054 | | | | 2,990,237 | | | | 2,734,742 | |
| Freddie Mac Pool SD8315 | | | 5.00 | % | | | 04/01/2053 | | | | 2,681,288 | | | | 2,593,589 | |
| Freddie Mac Pool SD8431 | | | 5.50 | % | | | 05/01/2054 | | | | 2,309,173 | | | | 2,278,936 | |
| Ginnie Mae II Pool MA8348 | | | 5.00 | % | | | 10/20/2052 | | | | 2,098,955 | | | | 2,043,375 | |
| Ginnie Mae II Pool MA9665 | | | 4.00 | % | | | 05/20/2054 | | | | 2,947,117 | | | | 2,715,205 | |
| | | | |
| | | | | | | | | | | | | | | | |
| | | | |
Total investment in U.S. Government Agency Bonds (12.5%)
(cost $36,755,366) | | | | | | | | | | | | | | | 36,265,825 | |
| | | | |
| | | | | | | | | | | | | | | | |
| | | | | | | | | | | | | | | | |
| | | | |
| U.S. Government Treasury Bonds | | | | | | | | | | | | |
| U.S. Treasury | | | 3.88 | % | | | 03/31/2025 | | | | 3,250,000 | | | | 3,246,674 | |
| U.S. Treasury | | | 0.25 | % | | | 06/30/2025 | | | | 2,000,000 | | | | 1,961,738 | |
| U.S. Treasury | | | 2.25 | % | | | 11/15/2025 | | | | 3,000,000 | | | | 2,948,648 | |
| U.S. Treasury | | | 0.38 | % | | | 12/31/2025 | | | | 2,500,000 | | | | 2,407,285 | |
| U.S. Treasury | | | 3.63 | % | | | 05/15/2026 | | | | 3,000,000 | | | | 2,975,156 | |
| U.S. Treasury | | | 1.88 | % | | | 07/31/2026 | | | | 2,000,000 | | | | 1,928,203 | |
| U.S. Treasury | | | 4.63 | % | | | 10/15/2026 | | | | 3,500,000 | | | | 3,521,191 | |
| U.S. Treasury | | | 4.25 | % | | | 11/30/2026 | | | | 3,000,000 | | | | 2,999,180 | |
| U.S. Treasury | | | 3.75 | % | | | 08/15/2027 | | | | 3,000,000 | | | | 2,961,563 | |
| U.S. Treasury | | | 3.63 | % | | | 03/31/2028 | | | | 2,500,000 | | | | 2,448,242 | |
| U.S. Treasury | | | 4.63 | % | | | 09/30/2028 | | | | 3,000,000 | | | | 3,027,656 | |
| U.S. Treasury | | | 3.63 | % | | | 08/31/2029 | | | | 3,000,000 | | | | 2,904,375 | |
| U.S. Treasury | | | 3.75 | % | | | 05/31/2030 | | | | 2,500,000 | | | | 2,419,434 | |
| U.S. Treasury | | | 4.13 | % | | | 10/31/2031 | | | | 3,000,000 | | | | 2,936,250 | |
| U.S. Treasury | | | 4.13 | % | | | 11/30/2031 | | | | 3,000,000 | | | | 2,935,781 | |
| U.S. Treasury | | | 4.13 | % | | | 11/15/2032 | | | | 2,500,000 | | | | 2,438,379 | |
| U.S. Treasury | | | 3.50 | % | | | 02/15/2033 | | | | 3,000,000 | | | | 2,791,055 | |
| U.S. Treasury | | | 3.38 | % | | | 05/15/2033 | | | | 1,500,000 | | | | 1,378,594 | |
| U.S. Treasury | | | 4.38 | % | | | 05/15/2034 | | | | 2,500,000 | | | | 2,462,109 | |
| U.S. Treasury | | | 3.25 | % | | | 05/15/2042 | | | | 4,000,000 | | | | 3,257,188 | |
| U.S. Treasury | | | 4.00 | % | | | 11/15/2042 | | | | 4,500,000 | | | | 4,053,340 | |
| U.S. Treasury | | | 4.38 | % | | | 08/15/2043 | | | | 3,500,000 | | | | 3,296,699 | |
| U.S. Treasury | | | 4.75 | % | | | 11/15/2043 | | | | 2,000,000 | | | | 1,976,797 | |
| U.S. Treasury | | | 4.63 | % | | | 05/15/2044 | | | | 3,000,000 | | | | 2,911,406 | |
| U.S. Treasury | | | 2.00 | % | | | 02/15/2050 | | | | 2,000,000 | | | | 1,163,359 | |
| U.S. Treasury | | | 1.25 | % | | | 05/15/2050 | | | | 3,500,000 | | | | 1,662,500 | |
| U.S. Treasury | | | 4.63 | % | | | 05/15/2054 | | | | 2,000,000 | | | | 1,946,563 | |
| | | | |
| | | | | | | | | | | | | | | | |
| | | |
Total investment in U.S. Government Treasury Bonds (24.5%)
(cost $74,135,457) | | | | | | | | | | | | 70,959,365 | |
| | | | |
| | | | | | | | | | | | | | | | |
| | | | |
Total investment in long-term securities (97.3%)
(cost $294,752,473) | | | | | | | | | | | | | | | 282,043,557 | |
| | | | |
| | | | | | | | | | | | | | | | |
| | | | | | | | | | | | | | | | |
| | | | |
| Short-Term Securities | | | | | | | | | | | | |
| | | | |
| Government Obligations (1.4%) | | | | | | | | | | | | | | | | |
| United States Treasury Bill | | | 4.46 | % | | | 03/25/2025 | | | | 4,000,000 | | | | 3,959,475 | |
| | | | |
| | | | | | | | | | | | | | | | |
42
| | | | |
| | |
| Annual Report • 2024 | | | | |
Parnassus Fixed Income Fund
Portfolio of Investments as of December 31, 2024 (continued)
| | | | | | | | | | | | | | | | |
| | | | |
| Short-Term Securities | | Interest
Rate | | | Maturity
Date | | | Principal
Amount ($) | | | Market Value ($) | |
| | | | |
| Time Deposits (0.7%) | | | | | | | | | | | | | | | | |
| JPMorgan Chase, New York | | | 3.68 | % | | | 01/02/2025 | | | | 2,122,129 | | | | 2,122,129 | |
| | | | |
| | | | | | | | | | | | | | | | |
| | | | |
Total short-term securities (2.1%)
(cost $6,081,604) | | | | | | | | | | | | | | | 6,081,604 | |
| | | | |
| | | | | | | | | | | | | | | | |
| | | | |
Total securities (99.4%)
(cost $300,834,077) | | | | | | | | | | | | | | | 288,125,161 | |
| | | | |
| | | | | | | | | | | | | | | | |
| | | | |
| Other assets and liabilities (0.6%) | | | | | | | | | | | | | | | 1,614,144 | |
| | | | |
| | | | | | | | | | | | | | | | |
| | | | |
| Total net assets (100.0%) | | | | | | | | | | | | | | | 289,739,305 | |
| | | | |
| | | | | | | | | | | | | | | | |
l Security exempt from registration under Rule 144A of the Securities Act of 1933, as amended. The security may be resold in transactions exempt from registration normally to qualified institutional buyers. The security has been determined to be liquid in accordance with procedures adopted by the Funds’ Board of Trustees. At December 31, 2024, the aggregate value is $12,443,362, which is 4.29% of net assets. | |
| | | | |
MBS Mortgage-Backed Securities | | | | | | | | | | | | | | | | |
ETF Exchange-Traded Fund | | | | | | | | | | | | | | | | |
plc Public Limited Company | | | | | | | | | | | | | | | | |
LLC Limited Liability Company | | | | | | | | | | | | | | | | |
SA Société Anonyme | | | | | | | | | | | | | | | | |
LP Limited Partnership | | | | | | | | | | | | | | | | |
43
| | | | |
| | |
| | | | Annual Report • 2024 |
Statement of Assets and Liabilities
December 31, 2024
| | | | | | | | | | | | |
| | | |
| | | Parnassus
Core Equity
Fund | | | Parnassus
Growth Equity
Fund | | | Parnassus
Value Equity
Fund | |
| | | |
| Assets | | | | | | | | | | | | |
| | | |
Investments in stocks, exchange-traded funds and bonds, at market value – Unaffiliated (cost $19,779,719,541, $49,646,353, $3,649,414,570, $2,174,314,987, $596,744,056 and $294,752,473) | | $ | 28,106,217,272 | | | $ | 63,107,762 | | | $ | 4,667,324,138 | |
| | | |
Investments in stocks, at market value – Affiliated | | | | | | | | | | | | |
| | | |
(cost of $894,147,563, $0, $133,585,880, $49,009,264, $0 and $0) | | | 682,282,320 | | | | - | | | | 127,249,357 | |
| | | |
Investments in short-term securities | | | | | | | | | | | | |
| | | |
(at cost which approximates market value) | | | 250,342,414 | | | | 374,787 | | | | 51,176,999 | |
| | | |
Cash | | | 447,408 | | | | 778 | | | | 62,425 | |
| | | |
Receivables | | | | | | | | | | | | |
| | | |
Dividends and interest | | | 15,776,472 | | | | 13,545 | | | | 4,920,898 | |
| | | |
Capital shares sold | | | 16,998,841 | | | | 261,061 | | | | 2,105,789 | |
| | | |
Other assets | | | 285,524 | | | | 37,296 | | | | 68,227 | |
| | | |
Total assets | | $ | 29,072,350,251 | | | $ | 63,795,229 | | | $ | 4,852,907,833 | |
| | | |
| Liabilities | | | | | | | | | | | | |
| | | |
Payable upon return of loaned securities | | | - | | | | - | | | | 18,925,463 | |
| | | |
Capital shares redeemed | | | 38,521,914 | | | | 23,838 | | | | 5,488,371 | |
| | | |
Fees payable to Parnassus Investments | | | 15,231,775 | | | | 10,747 | | | | 2,734,324 | |
| | | |
Accounts payable and accrued expenses | | | 2,172,088 | | | | 58,063 | | | | 568,749 | |
| | | |
Total liabilities | | $ | 55,925,777 | | | $ | 92,648 | | | $ | 27,716,907 | |
| | | |
Net assets | | $ | 29,016,424,474 | | | $ | 63,702,581 | | | $ | 4,825,190,926 | |
| | | |
| Net assets consist of | | | | | | | | | | | | |
| | | |
Capital paid-in | | | 19,331,841,887 | | | | 49,491,429 | | | | 3,722,377,587 | |
| | | |
Total Distributable Earnings | | | 9,684,582,587 | | | | 14,211,152 | | | | 1,102,813,339 | |
| | | |
Total net assets | | $ | 29,016,424,474 | | | $ | 63,702,581 | | | $ | 4,825,190,926 | |
| | | |
| Net asset value and offering per share | | | | | | | | | | | | |
| | | |
Net assets investor shares | | $ | 13,311,327,311 | | | $ | 22,969,985 | | | $ | 3,118,642,368 | |
| | | |
Net assets institutional shares | | $ | 15,705,097,163 | | | $ | 40,732,596 | | | $ | 1,706,548,558 | |
| | | |
Shares outstanding investor shares | | | 223,443,816 | | | | 893,206 | | | | 59,463,278 | |
| | | |
Shares outstanding institutional shares | | | 262,833,479 | | | | 1,579,717 | | | | 32,449,705 | |
| | | |
Net asset values and redemption price per share | | | | | | | | | | | | |
| | | |
(Net asset value divided by shares outstanding) | | | | | | | | | | | | |
| | | |
Investor shares | | $ | 59.57 | | | $ | 25.72 | | | $ | 52.45 | |
| | | |
Institutional shares | | $ | 59.75 | | | $ | 25.78 | | | $ | 52.59 | |
44
| | | | |
| | |
| Annual Report • 2024 | | | | |
| | | | | | | | | | |
| | |
Parnassus
Mid Cap
Fund | | | Parnassus
Mid Cap Growth
Fund | | | Parnassus
Fixed Income
Fund | |
| | |
| | | | | | | | | | |
| | |
$ |
2,772,798,485 |
| | $ | 836,304,578 | | | $ | 282,043,557 | |
| | |
| | | | | | | | | | |
| | |
| | 46,147,614 | | | | – | | | | – | |
| | |
| | | | | | | | | | |
| | |
| | 35,220,695 | | | | 6,369,993 | | | | 6,081,604 | |
| | |
| | 30,666 | | | | 17,894 | | | | 9,383 | |
| | |
| | | | | | | | | | |
| | |
| | 1,266,956 | | | | 214,822 | | | | 2,364,140 | |
| | |
| | 2,536,189 | | | | 98,166 | | | | 30,941 | |
| | |
| | 52,469 | | | | 21,537 | | | | 15,280 | |
| | |
| $ | 2,858,053,074 | | | $ | 843,026,990 | | | $ | 290,544,905 | |
| | |
| | | | | | | | | | |
| | |
| | 9,686,000 | | | | – | | | | – | |
| | |
| | 3,370,267 | | | | 309,577 | | | | 559,437 | |
| | |
| | 1,934,934 | | | | 484,894 | | | | 81,797 | |
| | |
| | 620,100 | | | | 272,229 | | | | 164,366 | |
| | |
| $ | 15,611,301 | | | $ | 1,066,700 | | | $ | 805,600 | |
| | |
| $ | 2,842,441,773 | | | $ | 841,960,290 | | | $ | 289,739,305 | |
| | |
| | | | | | | | | | |
| | |
| | 2,188,875,242 | | | | 561,741,019 | | | | 359,978,882 | |
| | |
| | 653,566,531 | | | | 280,219,271 | | | | (70,239,577 | ) |
| | |
| $ | 2,842,441,773 | | | $ | 841,960,290 | | | $ | 289,739,305 | |
| | |
| | | | | | | | | | |
| | |
| $ | 1,265,448,794 | | | $ | 647,286,328 | | | $ | 107,490,978 | |
| | |
| $ | 1,576,992,979 | | | $ | 194,673,962 | | | $ | 182,248,327 | |
| | |
| | 33,829,168 | | | | 11,259,700 | | | | 7,357,910 | |
| | |
| | 41,953,135 | | | | 3,365,106 | | | | 12,461,253 | |
| | |
| | | | | | | | | | |
| | |
| | | | | | | | | | |
| | |
| $ | 37.41 | | | $ | 57.49 | | | $ | 14.61 | |
| | |
| $ | 37.59 | | | $ | 57.85 | | | $ | 14.63 | |
45
| | | | |
| | |
| | | | Annual Report • 2024 |
Statement of Operations
Year Ended December 31, 2024
| | | | | | | | | | | | |
| | | |
| | | Parnassus
Core Equity
Fund | | | Parnassus
Growth Equity
Fund | | | Parnassus
Value Equity
Fund | |
| | | |
| Investment income | | | | | | | | | | | | |
| | | |
Dividends – Unaffiliated | | $ | 321,432,870 | | | $ | 263,389 | | | $ | 91,090,941 | |
| | | |
Dividends – Affiliated | | | 11,024,579 | | | | - | | | | 1,881,538 | |
| | | |
Interest | | | 10,059,041 | | | | 27,808 | | | | 1,440,728 | |
| | | |
Securities lending | | | 5,963 | | | | - | | | | 87,104 | |
| | | |
Other income | | | - | | | | 1,956 | | | | - | |
| | | |
Foreign withholding tax | | | (3,820,201 | ) | | | (3,719 | ) | | | (1,165,833 | ) |
| | | |
Total investment income | | $ | 338,702,252 | | | $ | 289,434 | | | $ | 93,334,478 | |
| | | |
| Expenses | | | | | | | | | | | | |
| | | |
Investment advisory fees | | | 168,773,182 | | | | 360,314 | | | | 33,120,729 | |
| | | |
Transfer agent fees | | | | | | | | | | | | |
| | | |
Investor Shares | | | 196,640 | | | | 31,194 | | | | 129,223 | |
| | | |
Institutional Shares | | | 103,029 | | | | 33,946 | | | | 55,577 | |
| | | |
Fund administration | | | 9,228,750 | | | | 15,319 | | | | 1,551,395 | |
| | | |
Service provider fees | | | 26,824,728 | | | | 23,069 | | | | 6,250,470 | |
| | | |
Reports to shareholders | | | 875,194 | | | | 11,706 | | | | 210,366 | |
| | | |
Registration fees and expenses | | | 296,653 | | | | 48,024 | | | | 135,776 | |
| | | |
Custody fees | | | 1,038,813 | | | | 7,985 | | | | 119,417 | |
| | | |
Overdraft charges | | | 2,790 | | | | - | | | | 19,701 | |
| | | |
Professional fees | | | 385,518 | | | | 64,661 | | | | 106,462 | |
| | | |
Trustee fees and expenses | | | 954,821 | | | | 1,441 | | | | 161,169 | |
| | | |
Proxy voting fees | | | 3,844 | | | | 3,844 | | | | 3,844 | |
| | | |
Pricing service fees | | | 8,096 | | | | 8,096 | | | | 8,096 | |
| | | |
Other expenses | | | 259,607 | | | | 10,821 | | | | 54,600 | |
| | | |
Total expenses | | $ | 208,951,665 | | | $ | 620,420 | | | $ | 41,926,825 | |
| | | |
Fees waived and expenses reimbursed by Parnassus Investments | | | (392,679 | ) | | | (274,518 | ) | | | (1,943,811 | ) |
| | | |
Net expenses | | $ | 208,558,986 | | | $ | 345,902 | | | $ | 39,983,014 | |
| | | |
Net investment income (loss) | | $ | 130,143,266 | | | $ | (56,468 | ) | | $ | 53,351,464 | |
| | | |
| Realized and unrealized gain (loss) on investments | | | | | | | | | | | | |
| | | |
Net realized gain (loss) from securities transactions – Unaffiliated | | | 3,854,451,195 | | | | 3,933,390 | | | | 468,796,281 | |
| | | |
Net realized (loss) from securities transactions – Affiliated | | | (63,344,577 | ) | | | - | | | | (440,987 | ) |
| | | |
Net change in unrealized appreciation (depreciation) of securities – Unaffiliated | | | 1,115,624,309 | | | | 6,878,480 | | | | 54,324,463 | |
| | | |
Net change in unrealized appreciation (depreciation) of securities – Affiliated | | | 36,584,432 | | | | - | | | | (2,671,348 | ) |
| | | |
Net realized and unrealized gain (loss) on securities | | $ | 4,943,315,359 | | | $ | 10,811,870 | | | $ | 520,008,409 | |
| | | |
Net increase in net assets resulting from operations | | $ | 5,073,458,625 | | | $ | 10,755,402 | | | $ | 573,359,873 | |
46
| | | | |
| | |
| Annual Report • 2024 | | | | |
| | | | | | | | | | |
| | |
Parnassus
Mid Cap
Fund | | | Parnassus
Mid Cap Growth
Fund | | | Parnassus
Fixed Income
Fund | |
| | |
| | | | | | | | | | |
| | |
| $ | 35,497,847 | | | $ | 3,678,514 | | | $ | 923,327 | |
| | |
| | 784,659 | | | | - | | | | - | |
| | |
| | 1,427,938 | | | | 357,409 | | | | 10,917,862 | |
| | |
| | 7,179 | | | | 2,649 | | | | 1,002 | |
| | |
| | 29 | | | | - | | | | - | |
| | |
| | (369,661 | ) | | | (27,086 | ) | | | - | |
| | |
| $ | 37,347,991 | | | $ | 4,011,486 | | | $ | 11,842,191 | |
| | |
| | | | | | | | | | |
| | |
| | 24,083,643 | | | | 5,259,826 | | | | 1,379,357 | |
| | |
| | | | | | | | | | |
| | |
| | 86,324 | | | | 168,493 | | | | 75,151 | |
| | |
| | 46,982 | | | | 38,635 | | | | 36,889 | |
| | |
| | 1,051,035 | | | | 264,484 | | | | 88,291 | |
| | |
| | 2,329,480 | | | | 703,106 | | | | 170,277 | |
| | |
| | 490,559 | | | | 21,440 | | | | 10,801 | |
| | |
| | 183,210 | | | | 65,600 | | | | 57,252 | |
| | |
| | 81,901 | | | | 18,867 | | | | 8,118 | |
| | |
| | 26,433 | | | | 5,037 | | | | - | |
| | |
| | 113,683 | | | | 80,201 | | | | 80,180 | |
| | |
| | 126,337 | | | | 27,961 | | | | 9,173 | |
| | |
| | 3,844 | | | | 3,844 | | | | - | |
| | |
| | 8,096 | | | | 8,096 | | | | 10,343 | |
| | |
| | 57,853 | | | | 18,875 | | | | 13,643 | |
| | |
| $ | 28,689,380 | | | $ | 6,684,465 | | | $ | 1,939,475 | |
| | |
| | (546,821 | ) | | | (100,492 | ) | | | (617,289 | ) |
| | |
| $ | 28,142,559 | | | $ | 6,583,973 | | | $ | 1,322,186 | |
| | |
| $ | 9,205,432 | | | $ | (2,572,487 | ) | | $ | 10,520,005 | |
| | |
| | | | | | | | | | |
| | |
| | 474,195,040 | | | | 93,637,892 | | | | (4,656,123 | ) |
| | |
| | (57,676,762 | ) | | | (361,063 | ) | | | - | |
| | |
|
(162,686,337 |
) | | | (4,956,478 | ) | | | (344,596 | ) |
| | |
|
57,146,236 |
| | | (49,167 | ) | | | - | |
| | |
| $ | 310,978,177 | | | $ | 88,271,184 | | | $ | (5,000,719 | ) |
| | |
| $ | 320,183,609 | | | $ | 85,698,697 | | | $ | 5,519,286 | |
47
| | | | |
| | |
| | | | Annual Report • 2024 |
Statement of Changes in Net Assets
December 31, 2024
| | | | | | | | | | | | | | | | | | | | | | | | |
| | | |
| | | Parnassus Core Equity Fund | | | Parnassus Growth Equity Fund | | | Parnassus Value Equity Fund | |
| | | Year Ended
December 31,
2024 | | | Year Ended
December 31,
2023 | | | Year Ended
December 31,
2024 | | | Year Ended
December 31,
2023 | | | Year Ended
December 31,
2024 | | | Year Ended
December 31,
2023 | |
| | | | | | |
| Investment income from operations | | | | | | | | | | | | | | | | | | | | | | | | |
| | | | | | |
Net investment income (loss) | | $ | 130,143,266 | | | $ | 175,651,833 | | | $ | (56,468 | ) | | $ | 53,147 | | | $ | 53,351,464 | | | $ | 62,495,567 | |
| | | | | | |
Net realized gain (loss) from securities transactions | | | 3,791,106,618 | | | | 1,883,613,738 | | | | 3,933,390 | | | | 603,573 | | | | 468,355,294 | | | | 73,680,697 | |
| | | | | | |
Net change in unrealized appreciation (depreciation) of securities | | | 1,152,208,741 | | | | 3,729,624,120 | | | | 6,878,480 | | | | 6,623,223 | | | | 51,653,115 | | | | 471,396,606 | |
| | | | | | |
Increase in net assets resulting from operations | | $ | 5,073,458,625 | | | $ | 5,788,889,691 | | | $ | 10,755,402 | | | $ | 7,279,943 | | | $ | 573,359,873 | | | $ | 607,572,870 | |
| | | | | | |
| Net Dividends and Distributions | | | | | | | | | | | | | | | | | | | | | | | | |
| | | | | | |
Investor Shares | | | (1,249,928,135 | ) | | | (748,675,071 | ) | | | (1,111,785 | ) | | | (118,942 | ) | | | (244,642,673 | ) | | | (57,508,798 | ) |
| | | | | | |
Institutional Shares | | | (1,504,581,349 | ) | | | (885,452,302 | ) | | | (2,012,799 | ) | | | (392,106 | ) | | | (137,513,890 | ) | | | (32,490,513 | ) |
| | | | | | |
Distributions to shareholders | | $ | (2,754,509,484 | ) | | $ | (1,634,127,373 | ) | | $ | (3,124,584 | ) | | $ | (511,048 | ) | | $ | (382,156,563 | ) | | $ | (89,999,311 | ) |
| | | | | | |
| Capital share transactions | | | | | | | | | | | | | | | | | | | | | | | | |
| | | | | | |
Investor Shares | | | | | | | | | | | | | | | | | | | | | | | | |
| | | | | | |
Proceeds from sale of shares | | | 1,185,905,654 | | | | 1,429,730,222 | | | | 16,920,128 | | | | 7,561,832 | | | | 380,278,384 | | | | 568,039,536 | |
| | | | | | |
Reinvestment of dividends | | | 1,239,789,740 | | | | 742,926,535 | | | | 1,094,552 | | | | 117,437 | | | | 239,679,370 | | | | 56,362,215 | |
| | | | | | |
Shares repurchased | | | (3,105,781,656 | ) | | | (2,351,510,214 | ) | | | (5,411,110 | ) | | | (936,797 | ) | | | (898,939,078 | ) | | | (791,711,396 | ) |
| | | | | | |
Institutional Shares | | | | | | | | | | | | | | | | | | | | | | | | |
| | | | | | |
Proceeds from sale of shares | | | 2,600,890,321 | | | | 2,765,300,719 | | | | 12,516,237 | | | | 6,109,966 | | | | 328,377,689 | | | | 370,760,683 | |
| | | | | | |
Reinvestment of dividends | | | 1,403,587,617 | | | | 824,897,458 | | | | 2,012,799 | | | | 389,407 | | | | 119,635,361 | | | | 27,806,425 | |
| | | | | | |
Shares repurchased | | | (4,425,251,268 | ) | | | (3,677,956,769 | ) | | | (1,596,263 | ) | | | (275,880 | ) | | | (455,424,142 | ) | | | (434,725,087 | ) |
| | | | | | |
Increase (decrease) in net assets from capital share transactions | | | (1,100,859,592 | ) | | | (266,612,049 | ) | | | 25,536,343 | | | | 12,965,965 | | | | (286,392,416 | ) | | | (203,467,624 | ) |
| | | | | | |
Increase (decrease) in net assets | | $ | 1,218,089,549 | | | $ | 3,888,150,269 | | | $ | 33,167,161 | | | $ | 19,734,860 | | | $ | (95,189,106 | ) | | $ | 314,105,935 | |
| | | | | | |
| Net Assets | | | | | | | | | | | | | | | | | | | | | | | | |
| | | | | | |
Beginning of year | | | 27,798,334,925 | | | | 23,910,184,656 | | | | 30,535,420 | | | | 10,800,560 | | | | 4,920,380,032 | | | | 4,606,274,097 | |
| | | | | | |
End of year | | $ | 29,016,424,474 | | | $ | 27,798,334,925 | | | $ | 63,702,581 | | | $ | 30,535,420 | | | $ | 4,825,190,926 | | | $ | 4,920,380,032 | |
| | | | | | |
| Shares issued and redeemed | | | | | | | | | | | | | | | | | | | | | | | | |
| | | | | | |
Investor Shares | | | | | | | | | | | | | | | | | | | | | | | | |
| | | | | | |
Shares sold | | | 19,551,553 | | | | 27,589,143 | | | | 695,630 | | | | 403,821 | | | | 7,048,138 | | | | 12,182,448 | |
| | | | | | |
Shares issued through dividend reinvestment | | | 20,010,422 | | | | 14,200,348 | | | | 40,965 | | | | 5,608 | | | | 4,346,120 | | | | 1,161,573 | |
| | | | | | |
Shares repurchased | | | (50,716,521 | ) | | | (45,353,199 | ) | | | (219,336 | ) | | | (48,693 | ) | | | (16,585,105 | ) | | | (16,896,050 | ) |
| | | | | | |
Institutional Shares | | | | | | | | | | | | | | | | | | | | | | | | |
| | | | | | |
Shares sold | | | 42,889,201 | | | | 53,206,007 | | | | 510,879 | | | | 346,058 | | | | 6,033,600 | | | | 7,868,346 | |
| | | | | | |
Shares issued through dividend reinvestment | | | 22,580,225 | | | | 15,720,432 | | | | 75,129 | | | | 18,596 | | | | 2,162,863 | | | | 570,584 | |
| | | | | | |
Shares repurchased | | | (71,700,023 | ) | | | (70,675,669 | ) | | | (63,742 | ) | | | (14,536 | ) | | | (8,387,342 | ) | | | (9,269,262 | ) |
| | | | | | |
Net increase (decrease) in shares outstanding | | | | | | | | | | | | | | | | | | | | | | | | |
| | | | | | |
Investor Shares | | | (11,154,546 | ) | | | (3,563,708 | ) | | | 517,259 | | | | 360,736 | | | | (5,190,847 | ) | | | (3,552,029 | ) |
| | | | | | |
Institutional Shares | | | (6,230,597 | ) | | | (1,749,230 | ) | | | 522,266 | | | | 350,118 | | | | (190,879 | ) | | | (830,332 | ) |
48
| | | | |
| | |
| Annual Report • 2024 | | | | |
| | | | | | | | | | | | | | | | | | | | | | |
| | |
| Parnassus Mid Cap Fund | | | Parnassus Mid Cap Growth Fund | | | Parnassus Fixed Income Fund | |
Year Ended
December 31,
2024 | | | Year Ended
December 31,
2023 | | | Year Ended
December 31,
2024 | | | Year Ended
December 31,
2023 | | | Year Ended
December 31,
2024 | | | Year Ended
December 31,
2023 | |
| | | | | |
| | | | | | | | | | | | | | | | | | | | | | |
| | | | | |
| $ | 9,205,432 | | | $ | 24,250,221 | | | $ | (2,572,487 | ) | | $ | (2,017,466 | ) | | $ | 10,520,005 | | | $ | 9,133,639 | |
| | | | | |
| 416,518,278 | | | | 98,054,588 | | | | 93,276,829 | | | | 33,041,887 | | | | (4,656,123 | ) | | | (17,069,548 | ) |
| | | | | |
| (105,540,101 | ) | | | 515,546,777 | | | | (5,005,645 | ) | | | 192,813,842 | | | | (344,596 | ) | | | 25,853,643 | |
| | | | | |
$ | 320,183,609 | | | $ | 637,851,586 | | | $ | 85,698,697 | | | $ | 223,838,263 | | | $ | 5,519,286 | | | $ | 17,917,734 | |
| | | | | |
| | | | | | | | | | | | | | | | | | | | | | |
| | | | | |
| | (119,700,643 | ) | | | (35,431,185 | ) | | | (45,276,787 | ) | | | (17,988,852 | ) | | | (4,156,404 | ) | | | (4,001,945 | ) |
| | | | | |
| | (152,885,979 | ) | | | (96,571,449 | ) | | | (13,512,059 | ) | | | (4,910,790 | ) | | | (6,694,408 | ) | | | (4,970,263 | ) |
| | | | | |
| $ | (272,586,622 | ) | | $ | (132,002,634 | ) | | $ | (58,788,846 | ) | | $ | (22,899,642 | ) | | $ | (10,850,812 | ) | | $ | (8,972,208 | ) |
| | | | | |
| | | | | | | | | | | | | | | | | | | | | | |
| | | | | |
| | | | | | | | | | | | | | | | | | | | | | |
| | | | | |
| | 112,382,786 | | | | 165,924,493 | | | | 27,067,157 | | | | 27,028,916 | | | | 12,412,965 | | | | 19,600,024 | |
| | | | | |
| | 117,978,275 | | | | 34,261,123 | | | | 44,272,513 | | | | 17,626,660 | | | | 4,012,637 | | | | 3,865,642 | |
| | | | | |
| | (458,248,133 | ) | | | (843,213,613 | ) | | | (90,484,658 | ) | | | (70,413,362 | ) | | | (25,685,727 | ) | | | (40,475,030 | ) |
| | | | | |
| | | | | | | | | | | | | | | | | | | | | | |
| | | | | |
| | 230,699,125 | | | | 885,175,226 | | | | 21,005,542 | | | | 16,472,593 | | | | 47,256,969 | | | | 43,570,687 | |
| | | | | |
| | 132,926,972 | | | | 88,763,680 | | | | 12,595,641 | | | | 4,589,891 | | | | 6,175,669 | | | | 4,607,953 | |
| | | | | |
| | (2,739,694,715 | ) | | | (1,515,164,518 | ) | | | (27,685,781 | ) | | | (26,449,136 | ) | | | (29,518,206 | ) | | | (38,123,601 | ) |
| | | | | |
| (2,603,955,690 | ) | | | (1,184,253,609 | ) | | | (13,229,586 | ) | | | (31,144,438 | ) | | | 14,654,307 | | | | (6,954,325 | ) |
| | | | | |
| $ | (2,556,358,703 | ) | | $ | (678,404,657 | ) | | $ | 13,680,265 | | | $ | 169,794,183 | | | $ | 9,322,781 | | | $ | 1,991,201 | |
| | | | | |
| | | | | | | | | | | | | | | | | | | | | | |
| | | | | |
| | 5,398,800,476 | | | | 6,077,205,133 | | | | 828,280,025 | | | | 658,485,842 | | | | 280,416,524 | | | | 278,425,323 | |
| | | | | |
| $ | 2,842,441,773 | | | $ | 5,398,800,476 | | | $ | 841,960,290 | | | $ | 828,280,025 | | | $ | 289,739,305 | | | $ | 280,416,524 | |
| | | | | |
| | | | | | | | | | | | | | | | | | | | | | |
| | | | | |
| | | | | | | | | | | | | | | | | | | | | | |
| | | | | |
| | 2,833,761 | | | | 4,788,590 | | | | 457,586 | | | | 548,287 | | | | 842,301 | | | | 1,350,182 | |
| | | | | |
| 2,960,505 | | | | 992,424 | | | | 715,573 | | | | 352,181 | | | | 272,889 | | | | 267,847 | |
| | | | | |
| | (11,620,763 | ) | | | (24,399,581 | ) | | | (1,525,494 | ) | | | (1,450,794 | ) | | | (1,749,871 | ) | | | (2,819,587 | ) |
| | | | | |
| | | | | | | | | | | | | | | | | | | | | | |
| | | | | |
| | 5,867,469 | | | | 25,476,890 | | | | 351,648 | | | | 327,727 | | | | 3,201,130 | | | | 3,024,457 | |
| | | | | |
| 3,320,012 | | | | 2,546,029 | | | | 202,307 | | | | 91,287 | | | | 419,425 | | | | 319,129 | |
| | | | | |
| | (72,036,254 | ) | | | (43,818,164 | ) | | | (467,419 | ) | | | (542,010 | ) | | | (2,002,750 | ) | | | (2,638,092 | ) |
| | | | | |
| | | | | | | | | | | | | | | | | | | | | | |
| | | | | |
| | (5,826,497 | ) | | | (18,618,567 | ) | | | (352,335 | ) | | | (550,326 | ) | | | (634,681 | ) | | | (1,201,558 | ) |
| | | | | |
| | (62,848,773 | ) | | | (15,795,245 | ) | | | 86,536 | | | | (122,996 | ) | | | 1,617,805 | | | | 705,494 | |
The accompanying notes are an integral part of these financial statements.
49
| | | | |
| | |
| | | | Annual Report • 2024 |
Notes to Financial Statements
1. Organization
The Parnassus Funds are comprised of two Trusts, the Parnassus Funds trust and the Parnassus Income Funds trust (collectively the “Trusts”), organized as Massachusetts business trusts registered under the Investment Company Act of 1940, as amended (the “1940 Act”), as diversified, open-end management investment companies. The Parnassus Funds are comprised of six separate funds (each a “Fund” and, collectively, the “Funds”). The Parnassus Funds trust includes the Parnassus Mid Cap Growth Fund, which commenced operations on December 27, 1984, the Parnassus Value Equity Fund and the Parnassus Mid Cap Fund, both of which commenced operations on April 29, 2005, and the Parnassus Growth Equity Fund which commenced operation on December 28, 2022. The Parnassus Income Funds trust includes the Parnassus Core Equity Fund and the Parnassus Fixed Income Fund, both of which commenced operations on August 31, 1992, as well as the Parnassus ETFs which are presented in a separate report. Each Fund has distinct investment objectives and investment strategies. In general, each of the Funds seeks capital appreciation.
2. Significant Accounting Policies
Each Fund operates as a separate investment company that applies the accounting and reporting guidance issued in Accounting Standards Codification (“ASC”) Topic 946, Financial Services—Investment Companies issued by the Financial Accounting Standards Board (“FASB”). The presentation of the financial statements is made using specialized accounting principles applicable to investment companies.
Short-Term Securities
Short-term securities represent investments of excess cash and consist of time deposits, community development loans, certificates of deposit and money market funds.
Security Transactions and Related Investment Income and Expenses
Securities transactions are recorded on the date the securities are purchased or sold (trade date). Realized gains and losses on securities transactions are determined on the basis of first-in-first-out for both financial statement and federal income tax purposes. Dividend income is recognized on the ex-dividend date and interest income is recognized on an accrual basis. Discounts and premiums on securities purchased are amortized over the lives of the respective securities using the constant yield method,
which approximates the interest method. Expenses are recorded on an accrual basis.
Class Allocations
Income, fees and expenses (other than class-specific fees and expenses) and realized and unrealized gains and losses are allocated daily among the various share classes based on their relative net assets. Class-specific fees and expenses, such as broker service fees, and administrative and shareholder service fees, are charged directly to the respective share class.
Dividends and Distributions to Shareholders
Dividends and distributions to shareholders are recorded on the ex-dividend date to shareholders of record on the record date. The Parnassus Core Equity Fund pays income dividends quarterly and capital-gain dividends annually. The Parnassus Fixed Income Fund pays income dividends monthly and capital-gain dividends annually. The other Funds pay income and capital-gain dividends annually.
3. Securities Valuations
Methods and Inputs
The Funds’ investments in financial instruments are carried at fair value daily. Fair value is the price that would be received to sell an asset or paid to transfer a liability in an orderly transaction between market participants on the measurement date. When market quotations are not readily available the Funds’ Valuation Designee (as defined below) determines the fair value pursuant to duly adopted fair value methodologies. In compliance with Rule 2a-5 under the 1940 Act, the Board of Trustees of each Trust (collectively, the “Board”) has designated the Funds’ investment manager, Parnassus Investments, LLC (“Parnassus Investments” or the “Adviser”), as its valuation designee (the “Valuation Designee”), meaning the Adviser has day-to-day responsibility for fair valuation of the Funds’ portfolio investments, subject to the Board’s oversight.
Equity securities and exchange-traded funds that are listed or traded on a national securities exchange are stated at market value, based on recorded closing sales on the exchange or at the NASDAQ’s National Market official closing price. In the absence of a recorded sale, and for over-the-counter securities, equity securities are stated at the mean between the last recorded bid and asked prices. Investments in registered investment
50
| | | | |
| | |
| Annual Report • 2024 | | | | |
Notes to Financial Statements (continued)
companies that are not listed or traded on a national securities exchange are valued at their net asset value.
Fixed-income securities with an active market are valued at the “bid” price where such quotes are readily available from brokers and dealers and are representative of the actual market for such securities. Other fixed-income securities experiencing a less active market are valued as determined by the pricing services selected by the Valuation Designee, based on methods which include consideration of trading in securities of comparable yield, quality, coupon, maturity and type, as well as indications as to values from dealers and other market data without exclusive reliance upon quoted prices or over-the-counter prices, since such valuations are believed to reflect more accurately the value of such securities. Mortgage-backed and asset-backed securities are valued as determined by the pricing services selected by the Valuation Designee, based on methods which include standard inputs and cashflows, prepayment information, default rates, delinquency and loss assumptions, collateral characteristics, credit enhancements and specific deal information.
As noted above, investments where market quotations are not readily available are priced at their fair value, in accordance with fair value methodologies established by the Valuation Designee. These investments include certificates of deposit and community development loans. These investments carry interest rates ranging from 0.05% to 4.60% with maturities of one year or less. In determining fair value, the Valuation Designee may consider a variety of information including, but not limited to, the following: price based upon a multiple of earnings or sales, fundamental analytical data and an evaluation of market conditions. A valuation adjustment is applied to certificates of deposit, community development loans and other community development investments as an estimate of potential penalties for early withdrawal.
The Funds follow ASC Topic 820, Fair Value Measurements and Disclosure issued by the FASB, which defines fair value, establishes a framework for measuring fair value and expands disclosures about fair value measurements. Various inputs are used in determining the value of the Funds’ portfolio investments. These inputs are summarized in three levels, Level 1—unadjusted quoted prices in active markets for identical investments, Level 2—other significant observable inputs (including quoted prices for similar investments) and Level 3—significant unobservable inputs (including a Fund’s own assumptions in determining the fair value of investments).
Securities Lending
The Parnassus Funds have entered into an agreement with Brown Brothers Harriman & Co., (the “Agreement”), to provide securities lending services to the Funds. Under this program, the proceeds (cash collateral) received from borrowers are used to invest in money market funds.
Under the Agreement, the borrowers pay the Funds negotiated lenders’ fees and the Funds receive cash or other collateral in an amount equal to at least 102% of the market value of the loaned securities. The borrower of securities is at all times required to post collateral to the portfolio in an amount equal to 100% of the market value of the securities loaned based on the previous day’s market value of the securities loaned, marked-to-market daily. Any collateral shortfalls are adjusted the next business day. If the borrower defaults on its obligations to return the securities loaned because of insolvency or other reasons, the portfolio could experience delays and costs in recovering the securities loaned.
The Agreement provides the right in the event of default for the non-defaulting party to liquidate the collateral and calculate a net exposure to the defaulting party or request additional collateral. In the event that a borrower defaults, the Funds, as lender, would offset the market value of the collateral received against the market value of the securities loaned. When the value of the collateral is greater than that of the market value of the securities loaned, the lender is left with a net amount payable to the defaulting party. However, bankruptcy or insolvency laws of a particular jurisdiction may impose restrictions on or prohibitions against such a right of offset in the event of a counterparty’s bankruptcy or insolvency. Under the Agreement, the borrower can resell or re-pledge the loaned securities, and the Funds can reinvest applicable collateral, or, upon an event of default, resell or re-pledge the collateral.
The Funds retained beneficial ownership and all economic benefits in the securities they have loaned and continue to receive interest paid by the securities and payments equivalent to dividends, and to participate in any changes in their market value, but do not have the proxy voting rights with respect to loaned securities. The portfolio managers of the Funds have the responsibility to request that the securities lending agent call back securities which are out on loan to vote
51
| | | | |
| | |
| | | | Annual Report • 2024 |
Notes to Financial Statements (continued)
on material matters and it is the Funds’ policy that the portfolio managers vote on all material matters. However, the ability to timely recall shares for proxy voting purposes typically is not entirely within the control of the portfolio managers, the Funds or their securities lending agent. Under certain circumstances, the recall of shares in time for such shares to be voted may not be possible due to applicable proxy voting record dates and administrative considerations.
Income generated from securities lending is presented in the Statement of Operations. Cash collateral received
by the Funds is reflected as an asset in the Portfolio of Investments (securities purchased with cash collateral from securities lending). The related liability (payable upon return of securities loaned) is presented in the Statement of Assets and Liabilities.
As of December 31, 2024, the following tables are a summary of the Funds’ securities lending agreements by counterparty, which are subject to offset under the Agreement:
| | | | | | | | | | | | | | | | | | | | |
| |
| | | | Parnassus Value Equity Fund | |
| | | | Counterparty | | Securities Loaned at Value | | | Cash Collateral
Received1 | | | Net
Amount | | | | |
| | | | Barclays Capital Inc. | | | 4,879,099 | | | | (4,879,099 | ) | | | - | | | | | |
| | | | BNP Paribas Securities Corp. | | | 7,751,025 | | | | (7,751,025 | ) | | | - | | | | | |
| | | | Morgan Stanley & Co., LLC | | | 5,614,000 | | | | (5,614,000 | ) | | | - | | | | | |
| | | | National Financial Services LLC | | | 238,728 | | | | (238,728 | ) | | | - | | | | | |
| | | | Total | | | 18,482,852 | | | | (18,482,852 | ) | | | - | | | | | |
| |
| | | | Parnassus Mid Cap Fund | |
| | | | Counterparty | | Securities Loaned at Value | | | Cash Collateral
Received1 | | | Net
Amount | | | | |
| | | | BofA Securities Inc. | | | 9,375,380 | | | | (9,375,380 | ) | | | - | | | | | |
| | | | Total | | | 9,375,380 | | | | (9,375,380 | ) | | | - | | | | | |
1 Collateral values of $18,925,463 and $9,686,000 have been received in connection with securities lending agreements for Parnassus Value Equity Fund and Parnassus Mid Cap Fund, respectively. Collateral received in excess of the value of the securities loaned from the individual counterparty is shown for financial reporting purposes in the Funds’ financial statements.
As of December 31, 2024, the contractual maturity date is overnight and continuous for the gross obligation of the equity securities on loan in the Parnassus Value Equity Fund of $18,925,463 and in the Parnassus Mid Cap Fund of $9,686,000.
Community Development Investment Programs
The Parnassus Funds may each invest up to 2% of their assets in community investments and community-development loan funds. Each of the Funds may invest in obligations issued by community loan funds at below-market interest rates if the projects financed have a positive social impact, as determined by the Adviser. Generally, there is no secondary market on loan funds and thus loan funds are considered illiquid.
As part of our community development investment program, the Parnassus Core Equity Fund, Parnassus Value Equity Fund and Parnassus Mid Cap Growth Fund have entered into an agreement for fund investments through the Certificate of Deposit Account Registry Service (“CDARS”) network. The CDARS network allows members to place funds in time deposits with depository institutions whose accounts are insured by the Federal Deposit Insurance Corporation (“FDIC”). Provisions stipulate that participating institutions are FDIC insured; however, in the event of default or bankruptcy by any party to the agreement, the proceeds of the investment may be delayed or subject to legal proceedings and are subject to FDIC limits. While certain investments of the Funds may be bank deposits and may be covered by FDIC insurance, the Funds are themselves not covered by FDIC insurance.
52
| | | | |
| | |
| Annual Report • 2024 | | | | |
Notes to Financial Statements (continued)
Use of Estimates
The preparation of financial statements in conformity with U.S. Generally Accepted Accounting Principles (“GAAP”) requires management to make estimates and assumptions that affect the reported amounts of assets and liabilities at the date of the financial statements and the reported amount of revenues and expenses during the reporting period. Actual results could differ from those estimates.
4. Risk Factors
Investing in the Parnassus Funds may involve certain risks including, but not limited to those identified below. Please refer to the Funds’ current prospectus and statement of additional information for more information on the risks associated with investing in the Funds.
Market Conditions
The prices of, and the income generated by, the common stocks and other securities held by the Funds may decline in response to certain events taking place around the world, including those directly involving the companies whose securities are owned by the Funds; conditions affecting the general economy; overall market changes; local, regional or global political, social or economic instability; and public health emergencies (such as the spread of infectious disease); and currency, interest rate and commodity price fluctuations. Additionally, the values of, and the income generated by, most debt securities held by the Funds may be affected by changing interest rates and by changes in the effective maturities and credit ratings of these debt securities. The Adviser attempts to reduce these risks through diversification of each portfolio and ongoing credit analysis as well as by monitoring economic and legislative developments, but there can be no assurance that it will be successful at doing so. Investments in securities issued by entities based outside the U.S. may also be affected by currency controls; different accounting, auditing, financial reporting, and legal standards and practices; expropriation; changes in tax policy; greater market volatility; different securities market structures and higher transaction costs.
Investing Outside the U.S.
Securities of issuers domiciled outside the U.S., or with significant operations outside the U.S., may lose value because of political, social, economic or market developments or instability in the countries or regions
in which the issuer operates. These securities may also lose value due to changes in foreign currency exchange rates against the U.S. dollar and/or currencies of other countries. Securities markets in certain countries may be more volatile and/or less liquid than those in the U.S. Investment outside the U.S. may also be subject to different settlement and accounting practices and different regulatory, legal and reporting standards, and may be more difficult to value, than those in the U.S. The risks of investing outside the U.S. may be heightened in connection with investments in emerging and developing countries.
Contractual Obligations
Under the Trusts’ organizational documents, the officers and Trustees may be indemnified against certain liabilities and expenses arising out of the performance of their duties to the Trusts. Additionally, the Trusts have a variety of indemnification obligations under contracts with service providers. The Trusts’ maximum exposure under these arrangements is unknown, as this would involve future claims that may be made against the Trusts that have not yet occurred.
5. Taxation and Distributions
Federal Income Taxes
The Funds intend to comply with the requirements of the Internal Revenue Code applicable to regulated investment companies and to distribute all taxable income and capital gains to shareholders. Therefore, no federal income tax provision is required. Income distributions and capital-gain distributions are determined in accordance with income tax regulations, which may differ from GAAP.
The Funds follow ASC 740, Income Taxes, relating to uncertainty in income taxes and disclosures. ASC 740 establishes a minimum threshold for income tax benefits to be recognized in the financial statements. These tax benefits must meet a “more likely than not” threshold, which means that based on technical merits, they have a more than 50% likelihood of being sustained upon examination by the tax authority. Tax benefits meeting this threshold are measured as the largest amount of tax benefit that is greater than 50% likely of being realized upon ultimate settlement with the tax authority. As of and during the year ended December 31, 2024, the Funds did not have a liability for any unrecognized tax benefits. The Funds recognize interest and penalties, if any, related to unrecognized tax benefits as income tax expense in the
53
| | | | |
| | |
| | | | Annual Report • 2024 |
Notes to Financial Statements (continued)
Statement of Operations. During the year, the Funds did not incur interest or penalties. As of December 31, 2024, the Funds had no tax examinations or audits in progress.
Tax Matters and Distributions
As of December 31, 2024, the cost of investments in securities and net unrealized appreciation/depreciation for income tax purposes were as follows:
| | | | | | | | | | | | | | | | | | | | | | | | | | | | | | | | |
| | | | | | | | |
| | | | | | Parnassus Core
Equity Fund | | | Parnassus Growth
Equity Fund | | | Parnassus Value
Equity Fund | | | Parnassus
Mid Cap Fund | | | Parnassus
Mid Cap
Growth Fund | | | Parnassus
Fixed Income Fund | | | | |
| | | | Cost of investment | | $ | 20,938,635,897 | | | $ | 50,036,146 | | | $ | 3,842,978,843 | | | $ | 2,264,037,116 | | | $ | 603,545,773 | | | $ | 301,512,299 | | | | | |
| | | | Gross unrealized appreciation | | $ | 8,525,610,036 | | | $ | 14,101,141 | | | $ | 1,187,111,019 | | | $ | 666,571,234 | | | $ | 245,579,126 | | | $ | 2,183,078 | | | | | |
| | | | Gross unrealized depreciation | | $ | (425,403,927 | ) | | $ | (654,738 | ) | | $ | (184,339,368 | ) | | $ | (76,441,556 | ) | | $ | (6,450,328 | ) | | $ | (15,570,216 | ) | | | | |
| | | | Net unrealized appreciation (depreciation) | | $ | 8,100,206,109 | | | $ | 13,446,403 | | | $ | 1,002,771,651 | | | $ | 590,129,678 | | | $ | 239,128,798 | | | $ | (13,387,138 | ) | | | | |
| | | | Distributable earnings – ordinary income | | $ | 2,311,315 | | | $ | – | | | $ | 2,469,087 | | | $ | 861,767 | | | $ | – | | | $ | (108,925 | ) | | | | |
| | | | Distributable earnings – long-term capital gains | | $ | 1,567,638,784 | | | $ | 749,743 | | | $ | 88,771,231 | | | $ | 57,082,917 | | | $ | 40,658,750 | | | $ | (57,421,735 | ) | | | | |
| | | | Undistributed earnings – ordinary income | | $ | – | | | $ | 140,070 | | | $ | 2,543,067 | | | $ | 50,095,572 | | | $ | – | | | $ | 47,243 | | | | | |
| | | | Undistributed earnings – long-term capital gains | | $ | 1,584,376,478 | | | $ | 624,679 | | | $ | 97,498,645 | | | $ | 13,341,282 | | | $ | 41,090,474 | | | $ | – | | | | | |
| | | | | | | | | | | | | | | | | | | | | | | | | | | | | | | | |
| | | | | |
| | | | | | Parnassus Core
Equity Fund | | | Parnassus Growth
Equity Fund | | | Parnassus Value
Equity Fund | | | | |
| | | | Distributions paid from: | | 2024 | | | 2023 | | | 2024 | | | 2023 | | | 2024 | | | 2023 | | | | |
| | | | Ordinary Income | | $ | 141,221,060 | | | $ | 184,140,171 | | | $ | 584,753 | | | $ | 511,048 | | | $ | 71,781,455 | | | $ | 62,002,368 | | | | | |
| | | | Long-term capital gains | | $ | 2,613,288,424 | | | $ | 1,449,987,202 | | | $ | 2,539,831 | | | $ | – | | | $ | 310,375,108 | | | $ | 27,996,943 | | | | | |
| | | | Total distributions | | $ | 2,754,509,484 | | | $ | 1,634,127,373 | | | $ | 3,124,584 | | | $ | 511,048 | | | $ | 382,156,563 | | | $ | 89,999,311 | | | | | |
| | | | | | | | | | | | | | | | | | | | | | | | | | | | | | | | |
| | | | | |
| | | | | | Parnassus Mid
Cap Fund | | | Parnassus Mid
Cap Growth Fund | | | Parnassus Fixed
Income Fund | | | | |
| | | | Distributions paid from: | | 2024 | | | 2023 | | | 2024 | | | 2023 | | | 2024 | | | 2023 | | | | |
| | | | Ordinary Income | | $ | 139,846,151 | | | $ | 26,996,519 | | | $ | – | | | $ | – | | | $ | 10,850,812 | | | $ | 8,972,208 | | | | | |
| | | | Long-term capital gains | | $ | 132,740,471 | | | $ | 105,006,115 | | | $ | 58,788,846 | | | $ | 22,899,642 | | | $ | – | | | $ | – | | | | | |
| | | | Total distributions | | $ | 272,586,622 | | | $ | 132,002,634 | | | $ | 58,788,846 | | | $ | 22,899,642 | | | $ | 10,850,812 | | | $ | 8,972,208 | | | | | |
Net unrealized gain/loss differ for financial statement and income tax purposes primarily due to differing treatments of wash sales and return of capital distributions from real estate investment trusts (“REITS”). Reclassifications as shown in the following table have been made in each Fund’s capital accounts to report
these balances on a tax basis, excluding certain temporary differences, as of December 31, 2024. Additional permanent book to tax adjustments may be required in subsequent reporting periods. These reclassifications, which have no impact on the net asset value of the Funds, primarily relate to the utilization of
54
| | | | |
| | |
| Annual Report • 2024 | | | | |
Notes to Financial Statements (continued)
earnings and profits distributed to shareholders on redemption of shares, net operating losses, and certain differences in the computation of distributable income and capital gains under Federal tax rules versus GAAP.
For tax purposes, net realized capital losses may be carried over to offset future capital gains, if any. Funds are permitted to carry forward capital losses for an
indefinite period, and such losses will retain their character as either short-term or long-term capital losses.
As of December 31, 2024, Parnassus Fixed Income Fund had a net short-term capital loss carry forward of $11,307,891 and a net long-term capital loss carry forward of $45,591,791 .
| | | | | | | | | | | | | | | | |
| | | | |
| | | | Fund | | Increase/Decrease
in Total
Distributable
Earnings | | | Increase/Decrease in
Aggregate Capital
Paid-In | | | | |
| | | | Parnassus Core Equity Fund | | $ | (213,141,688 | ) | | $ | 213,141,688 | | | | | |
| | | | Parnassus Growth Equity Fund | | | (171,432 | ) | | | 171,432 | | | | | |
| | | | Parnassus Value Equity Fund | | | (52,043,868 | ) | | | 52,043,868 | | | | | |
| | | | Parnassus Mid Cap Fund | | | (152,070,659 | ) | | | 152,070,659 | | | | | |
| | | | Parnassus Mid Cap Growth Fund | | | (1,638,438 | ) | | | 1,638,438 | | | | | |
6. Fair Value Measurements
The following table summarizes the Funds’ financial assets as of December 31, 2024, that are valued at fair value on a recurring basis:
| | | | | | | | | | | | | | | | | | | | | | | | |
| | |
| | | | Parnassus Core Equity Fund | | | | | |
| | | | | | |
| | | | Investment Securities | | Level 1 | | | Level 2 | | | Level 3 | | | Total | | | | |
| | | | Equities: | | | | | | | | | | | | | | | | | | | | |
| | | | | | |
| | | | Communication Services | | $ | 1,864,557,132 | | | $ | - | | | $ | - | | | $ | 1,864,557,132 | | | | | |
| | | | | | |
| | | | Consumer Discretionary | | | 3,336,154,214 | | | | - | | | | - | | | | 3,336,154,214 | | | | | |
| | | | | | |
| | | | Consumer Staples | | | 975,856,355 | | | | - | | | | - | | | | 975,856,355 | | | | | |
| | | | | | |
| | | | Financials | | | 4,576,621,352 | | | | - | | | | - | | | | 4,576,621,352 | | | | | |
| | | | | | |
| | | | Health Care | | | 3,405,574,284 | | | | - | | | | - | | | | 3,405,574,284 | | | | | |
| | | | | | |
| | | | Industrials | | | 3,245,980,445 | | | | - | | | | - | | | | 3,245,980,445 | | | | | |
| | | | | | |
| | | | Information Technology | | | 8,596,634,760 | | | | - | | | | - | | | | 8,596,634,760 | | | | | |
| | | | | | |
| | | | Materials | | | 1,870,457,611 | | | | - | | | | - | | | | 1,870,457,611 | | | | | |
| | | | | | |
| | | | Real Estate | | | 916,663,439 | | | | - | | | | - | | | | 916,663,439 | | | | | |
| | | | | | |
| | | | Short-Term Investments | | | 246,665,756 | | | | - | | | | 3,676,658 | | | | 250,342,414 | | | | | |
| | | | Total | | $ | 29,035,165,348 | | | $ | - | | | $ | 3,676,658 | | | $ | 29,038,842,006 | | | | | |
55
| | | | |
| | |
| | | | Annual Report • 2024 |
Notes to Financial Statements (continued)
| | | | | | | | | | | | | | | | | | | | | | | | |
| | |
| | | | Parnassus Growth Equity Fund | | | | | |
| | | | | | |
| | | | Investment Securities | | Level 1 | | | Level 2 | | | Level 3 | | | Total | | | | |
| | | | Equities: | | | | | | | | | | | | | | | | | | | | |
| | | | | | |
| | | | Communication Services | | $ | 5,105,095 | | | $ | - | | | $ | - | | | $ | 5,105,095 | | | | | |
| | | | | | |
| | | | Consumer Discretionary | | | 6,461,693 | | | | - | | | | - | | | | 6,461,693 | | | | | |
| | | | | | |
| | | | Consumer Staples | | | 1,245,211 | | | | - | | | | - | | | | 1,245,211 | | | | | |
| | | | | | |
| | | | Financials | | | 7,066,376 | | | | - | | | | - | | | | 7,066,376 | | | | | |
| | | | | | |
| | | | Health Care | | | 8,106,987 | | | | - | | | | - | | | | 8,106,987 | | | | | |
| | | | | | |
| | | | Industrials | | | 2,451,725 | | | | - | | | | - | | | | 2,451,725 | | | | | |
| | | | | | |
| | | | Information Technology | | | 30,078,470 | | | | - | | | | - | | | | 30,078,470 | | | | | |
| | | | | | |
| | | | Materials | | | 1,800,348 | | | | - | | | | - | | | | 1,800,348 | | | | | |
| | | | | | |
| | | | Real Estate | | | 791,857 | | | | - | | | | - | | | | 791,857 | | | | | |
| | | | | | |
| | | | Short-Term Investments | | | 374,787 | | | | - | | | | - | | | | 374,787 | | | | | |
| | | | Total | | $ | 63,482,549 | | | $ | - | | | $ | - | | | $ | 63,482,549 | | | | | |
| | |
| | | | Parnassus Value Equity Fund | | | | | |
| | | | | | |
| | | | Investment Securities | | Level 1 | | | Level 2 | | | Level 3 | | | Total | | | | |
| | | | Equities: | | | | | | | | | | | | | | | | | | | | |
| | | | | | |
| | | | Communication Services | | $ | 347,992,728 | | | $ | - | | | $ | - | | | $ | 347,992,728 | | | | | |
| | | | | | |
| | | | Consumer Discretionary | | | 418,857,219 | | | | - | | | | - | | | | 418,857,219 | | | | | |
| | | | | | |
| | | | Consumer Staples | | | 156,030,240 | | | | - | | | | - | | | | 156,030,240 | | | | | |
| | | | | | |
| | | | Financials | | | 1,233,910,416 | | | | - | | | | - | | | | 1,233,910,416 | | | | | |
| | | | | | |
| | | | Health Care | | | 886,173,341 | | | | - | | | | - | | | | 886,173,341 | | | | | |
| | | | | | |
| | | | Industrials | | | 475,031,306 | | | | - | | | | - | | | | 475,031,306 | | | | | |
| | | | | | |
| | | | Information Technology | | | 799,967,087 | | | | - | | | | - | | | | 799,967,087 | | | | | |
| | | | | | |
| | | | Materials | | | 127,249,357 | | | | - | | | | - | | | | 127,249,357 | | | | | |
| | | | | | |
| | | | Real Estate | | | 275,574,934 | | | | - | | | | - | | | | 275,574,934 | | | | | |
| | | | | | |
| | | | Utilities | | | 73,786,867 | | | | - | | | | - | | | | 73,786,867 | | | | | |
| | | | | | |
| | | | Short-Term Investments | | | 50,086,564 | | | | - | | | | 1,090,435 | | | | 51,176,999 | | | | | |
| | | | Total | | $ | 4,844,660,059 | | | $ | - | | | $ | 1,090,435 | | | $ | 4,845,750,494 | | | | | |
| | |
| | | | Parnassus Mid Cap Fund | | | | | |
| | | | | | |
| | | | Investment Securities | | Level 1 | | | Level 2 | | | Level 3 | | | Total | | | | |
| | | | Equities: | | | | | | | | | | | | | | | | | | | | |
| | | | | | |
| | | | Communication Services | | $ | 77,475,541 | | | $ | - | | | $ | - | | | $ | 77,475,541 | | | | | |
| | | | | | |
| | | | Consumer Discretionary | | | 337,128,300 | | | | - | | | | - | | | | 337,128,300 | | | | | |
| | | | | | |
| | | | Financials | | | 551,817,190 | | | | - | | | | - | | | | 551,817,190 | | | | | |
| | | | | | |
| | | | Health Care | | | 185,186,595 | | | | - | | | | - | | | | 185,186,595 | | | | | |
| | | | | | |
| | | | Industrials | | | 702,814,953 | | | | - | | | | - | | | | 702,814,953 | | | | | |
| | | | | | |
| | | | Information Technology | | | 674,804,188 | | | | - | | | | - | | | | 674,804,188 | | | | | |
| | | | | | |
| | | | Materials | | | 99,272,894 | | | | - | | | | - | | | | 99,272,894 | | | | | |
| | | | | | |
| | | | Real Estate | | | 156,113,242 | | | | - | | | | - | | | | 156,113,242 | | | | | |
| | | | | | |
| | | | Utilities | | | 34,333,196 | | | | - | | | | - | | | | 34,333,196 | | | | | |
| | | | | | |
| | | | Short-Term Investments | | | 34,474,663 | | | | - | | | | 746,032 | | | | 35,220,695 | | | | | |
| | | | Total | | $ | 2,853,420,762 | | | $ | - | | | $ | 746,032 | | | $ | 2,854,166,794 | | | | | |
56
| | | | |
| | |
| Annual Report • 2024 | | | | |
Notes to Financial Statements (continued)
| | | | | | | | | | | | | | | | | | | | | | | | |
| | |
| | | | Parnassus Mid Cap Growth Fund | | | | | |
| | | | | | |
| | | | Investment Securities | | Level 1 | | | Level 2 | | | Level 3 | | | Total | | | | |
| | | | Equities: | | | | | | | | | | | | | | | | | | | | |
| | | | | | |
| | | | Communication Services | | $ | 23,954,494 | | | $ | - | | | $ | - | | | $ | 23,954,494 | | | | | |
| | | | | | |
| | | | Consumer Discretionary | | | 115,822,603 | | | | - | | | | - | | | | 115,822,603 | | | | | |
| | | | | | |
| | | | Financials | | | 71,024,370 | | | | - | | | | - | | | | 71,024,370 | | | | | |
| | | | | | |
| | | | Health Care | | | 98,237,254 | | | | - | | | | - | | | | 98,237,254 | | | | | |
| | | | | | |
| | | | Industrials | | | 206,606,053 | | | | - | | | | - | | | | 206,606,053 | | | | | |
| | | | | | |
| | | | Information Technology | | | 296,458,148 | | | | - | | | | - | | | | 296,458,148 | | | | | |
| | | | | | |
| | | | Materials | | | 24,201,656 | | | | - | | | | - | | | | 24,201,656 | | | | | |
| | | | | | |
| | | | Short-Term Investments | | | 5,325,069 | | | | - | | | | 1,044,924 | | | | 6,369,993 | | | | | |
| | | | Total | | $ | 841,629,647 | | | $ | - | | | $ | 1,044,924 | | | $ | 842,674,571 | | | | | |
| | |
| | | | Parnassus Fixed Income Fund | | | | | |
| | | | | | |
| | | | Investment Securities | | Level 1 | | | Level 2 | | | Level 3 | | | Total | | | | |
| | | | | | |
| | | | Exchange-Traded Funds | | $ | 14,210,400 | | | $ | - | | | $ | - | | | $ | 14,210,400 | | | | | |
| | | | | | |
| | | | Preferred Stock | | | 1,841,000 | | | | - | | | | - | | | | 1,841,000 | | | | | |
| | | | | | |
| | | | Corporate Bonds | | | - | | | | 129,575,725 | | | | - | | | | 129,575,725 | | | | | |
| | | | | | |
| | | | Supranational Bonds | | | - | | | | 29,191,242 | | | | - | | | | 29,191,242 | | | | | |
| | | | | | |
| | | | U.S. Government Agency Bonds | | | - | | | | 36,265,825 | | | | - | | | | 36,265,825 | | | | | |
| | | | | | |
| | | | U.S. Government Treasury Bonds | | | - | | | | 70,959,365 | | | | - | | | | 70,959,365 | | | | | |
| | | | | | |
| | | | Short-Term Investments | | | 2,122,129 | | | | 3,959,475 | | | | - | | | | 6,081,604 | | | | | |
| | | | Total | | $ | 18,173,529 | | | $ | 269,951,632 | | | $ | - | | | $ | 288,125,161 | | | | | |
The following table reconciles the valuation of the Funds’ Level 3 investment securities and related transactions as of December 31, 2024:
| | | | | | | | | | | | | | | | | | | | | | | | | | | | |
| | | | | | Parnassus Core
Equity Fund | | | Parnassus Value
Equity Fund | | | Parnassus
Mid Cap Fund | | | Parnassus Mid Cap
Growth Fund | | | Parnassus
Fixed Income
Fund | | | | |
| | | | | | Certificates of
Deposit | | | Certificates of
Deposit | | | Certificates of
Deposit | | | Certificates of
Deposit | | | Certificates of
Deposit | | | | |
| | | | | | Community
Development Loans | | | Community
Development Loans | | | | | | Community
Development Loans | | | | | | | |
| | | | | | | |
| | | | Balance as of December 31, 2023 | | $ | 5,481,990 | | | $ | 1,332,661 | | | $ | 1,287,700 | | | $ | 1,336,632 | | | $ | 484,290 | | | | | |
| | | | | | | |
| | | | Discounts/premiums amortization | | | 44,668 | | | | 7,774 | | | | 8,332 | | | | 8,292 | | | | 15,710 | | | | | |
| | | | | | | |
| | | | Purchases | | | 3,700,000 | | | | 1,100,000 | | | | 750,000 | | | | 1,050,000 | | | | - | | | | | |
| | | | | | | |
| | | | Sales | | | (5,550,000 | ) | | | (1,350,000 | ) | | | (1,300,000 | ) | | | (1,350,000 | ) | | | (500,000 | ) | | | | |
| | | | Balance as of December 31, 2024 | | $ | 3,676,658 | | | $ | 1,090,435 | | | $ | 746,032 | | | $ | 1,044,924 | | | $ | - | | | | | |
57
| | | | |
| | |
| | | | Annual Report • 2024 |
Notes to Financial Statements (continued)
The following table provides quantitative information about the Funds’ Level 3 fair value measurements:
| | | | | | | | | | | | | | | | | | |
| | | | | | |
| | | | | | Fair Value at
December 31, 2024 | | | Valuation
Technique | | Unobservable Input | | Range
(Weighted Average) | | | |
| | | | | |
| | | | Parnassus Core Equity Fund | | | | | | | | | | | |
| | | | Certificates of Deposit | | $ | 3,477,674 | | | Liquidity Discount | | Discount for Lack of Marketability | | 4% | | | | |
| | | | Community Development Loans | | $ | 198,984 | | | Liquidity Discount | | Discount for Lack of Marketability and Probability of Default | | 6% | | | | |
| | | | | |
| | | | Parnassus Value Equity Fund | | | | | | | | | | | |
| | | | Certificates of Deposit | | $ | 990,943 | | | Liquidity Discount | | Discount for Lack of Marketability | | 4% | | | | |
| | | | Community Development Loans | | $ | 99,492 | | | Liquidity Discount | | Discount for Lack of Marketability and Probability of Default | | 6% | | | | |
| | | | | |
| | | | Parnassus Mid Cap Fund | | | | | | | | | | | |
| | | | Certificates of Deposit | | $ | 746,032 | | | Liquidity Discount | | Discount for Lack of Marketability | | 4% | | | | |
| | | | | |
| | | | Parnassus Mid Cap Growth Fund | | | | | | | | | | | |
| | | | Certificates of Deposit | | $ | 945,432 | | | Liquidity Discount | | Discount for Lack of Marketability | | 4% | | | | |
| | | | Community Development Loans | | $ | 99,492 | | | Liquidity Discount | | Discount for Lack of Marketability and Probability of Default | | 6% | | | | |
The significant unobservable inputs used in fair value measurement of the Fund’s Certificates of Deposits are a discount for lack of marketability. The significant unobservable inputs used in the fair value measurement of the Fund’s Community Development Loans are a discount for lack of marketability and a discount for the probability of default. Significant increases in any of these inputs in isolation would result in a lower fair value measurement. Generally, a change in the assumption used for probability of default should be accompanied by a directionally-similar change in the assumption used for the lack of marketability.
The Valuation Designee has adopted fair value pricing methodologies to fair value each Fund’s securities
when market prices are not “readily available” or are unreliable. Determination of a fair value by the Valuation Designee may include significant unobservable inputs and therefore such financial instruments would be reflected within Level 3 of the fair value hierarchy. Fair value determinations are made in good faith in accordance with the duly adopted fair value pricing methodologies. The Valuation Designee provides quarterly and annual reports to the Board in connection with the Board’s obligation to oversee the Valuation Designee.
7. Capital Stock
Capital stock consists of an unlimited number of authorized shares of capital stock with no par value.
58
| | | | |
| | |
| Annual Report • 2024 | | | | |
Notes to Financial Statements (continued)
8. Purchases and Sales of Securities
Purchases and proceeds from sales of securities, excluding short-term securities, for the year ended December 31, 2024 were as follows:
| | | | | | | | | | | | | | | | | | | | | | | | |
| | | | | | |
| | | | Fund | | Affiliated
Purchases | | | Unaffiliated
Purchases | | | Affiliated
Sales | | | Unaffiliated
Sales | | | | |
| | | | Parnassus Core Equity Fund | | $ | 107,064,330 | | | $ | 9,930,863,946 | | | $ | 107,929,564 | | | $ | 13,605,267,898 | | | | | |
| | | | Parnassus Growth Equity Fund | | | - | | | | 39,262,491 | | | | - | | | | 16,850,817 | | | | | |
| | | | Parnassus Value Equity Fund | | | 299,421 | | | | 1,194,337,069 | | | | 13,289,648 | | | | 1,814,269,781 | | | | | |
| | | | Parnassus Mid Cap Fund | | | - | | | | 1,479,120,529 | | | | 118,212,546 | | | | 4,177,710,258 | | | | | |
| | | | Parnassus Mid Cap Growth Fund | | | - | | | | 349,443,586 | | | | 7,970,434 | | | | 416,128,531 | | | | | |
| | | | Parnassus Fixed Income Fund | | | - | | | | 104,406,858 | | | | - | | | | 78,446,349 | | | | | |
The above includes purchases and sales of U.S. Government securities in the amount of $65,829,262 and $17,518,137, respectively, within the Parnassus Fixed Income Fund.
9. Investment Advisory Agreement and Transactions with Affiliates
Under terms of an agreement which provides for furnishing investment management and advice to a Fund, the Adviser is entitled to receive fees, payable monthly, based on such Fund’s average daily net assets for the month, at the following annual rates:
Parnassus Growth Equity Fund: 0.75% of the first $30,000,000, 0.70% of the next $70,000,000, 0.65% of the next $400,000,000, 0.60% of the next $9,500,000,000 and 0.55% of the amount above $10,000,000,000. For the year ended December 31, 2024, Parnassus Investments has contractually agreed to limit total operating expenses to 0.84% of the net assets of the Parnassus Growth Equity Fund – Investor Shares and to 0.63% of net assets for the Parnassus Growth Equity Fund – Institutional Shares.
Parnassus Value Equity Fund: 0.85% of the first $100,000,000, 0.80% of the next $100,000,000, 0.75% of the next $300,000,000 and 0.65% of the amount above $500,000,000. For the year ended December 31, 2024, Parnassus Investments has contractually agreed to limit total operating expenses to 0.88% of net assets for the Parnassus Value Equity Fund – Investor Shares and to 0.65% of net assets for the Parnassus Value Equity Fund – Institutional Shares.
Parnassus Mid Cap Fund: 0.85% of the first $100,000,000, 0.80% of the next $100,000,000, 0.75%
of the next $300,000,000 and 0.70% of the amount above $500,000,000. For the year ended December 31, 2024, Parnassus Investments has contractually agreed to limit total operating expenses to 0.96% of the net assets of the Parnassus Mid Cap Fund – Investor Shares and to 0.75% of net assets for the Parnassus Mid Cap Fund – Institutional Shares.
Parnassus Mid Cap Growth Fund: 0.70% of the first $100,000,000, 0.65% of the next $100,000,000 and 0.60% of the amount above $200,000,000. For the year ended December 31, 2024, Parnassus Investments has contractually agreed to limit total operating expenses to 0.80% of the net assets of the Parnassus Mid Cap Growth Fund – Investor Shares and to 0.68% of the net assets of the Parnassus Mid Cap Growth Fund – Institutional Shares.
Parnassus Core Equity Fund: 0.75% of the first $30,000,000, 0.70% of the next $70,000,000, 0.65% of the next $400,000,000, 0.60% of the next $9,500,000,000 and 0.55% of the amount above $10,000,000,000. For the year ended December 31, 2024, Parnassus Investments has contractually agreed to limit total operating expenses to 0.82% of net assets of the Parnassus Core Equity Fund – Investor Shares and to 0.61% of net assets for the Parnassus Core Equity Fund – Institutional Shares.
Parnassus Fixed Income Fund: 0.50% of the first $200,000,000, 0.45% of the next $200,000,000 and 0.40% of the amount above $400,000,000. For the year ended December 31, 2024, Parnassus Investments has contractually agreed to limit total operating expenses to 0.58% of net assets for the Parnassus Fixed Income Fund – Investor Shares and to 0.39% of net assets for
59
| | | | |
| | |
| | | | Annual Report • 2024 |
Notes to Financial Statements (continued)
the Parnassus Fixed Income Fund – Institutional Shares. Parnassus Investments has contractually agreed to waive 0.10% of its management fee for each class.
The Adviser also serves as the fund accounting and fund administration agent for the Funds. The fund administration fee reflects annual rates based on net assets for all funds managed by Parnassus Investments, including the Funds, and was allocated based on respective Fund net assets at the following annual rates: 0.08% of the first $500,000,000, 0.07% of the next $500,000,000 and 0.03% of the amount above $1,000,000,000. The fund administration services fee was 0.03% of average net assets under this agreement for the year ended December 31, 2024.
The Adviser has appointed Brown Brothers Harriman as a sub administrator to the Funds. Brown Brothers Harriman provides day-to-day operational services to each Fund including, but not limited to fund accounting services. The fees payable to Brown Brothers Harriman for sub
administrative services are paid by the Adviser and not the Funds. Custodian fees are paid by the Funds.
The Funds have a shareholder services agreement with Ultimus Financial Solutions under which the Funds compensate Ultimus Financial Solutions for providing transfer agent services to each of the Funds’ share classes. These services include recordkeeping, shareholder communications and transaction processing.
10. Holdings of 5% Voting Securities of Portfolio Companies
The 1940 Act defines “affiliated companies” to include investments in portfolio companies in which a fund and/or funds under common control own 5% or more of the outstanding voting securities. Additionally, under the 1940 Act, an investment is presumed to be a “controlled affiliate” of a fund when a fund owns, either directly or indirectly, 25% or more of the affiliated company’s outstanding shares or has the power to exercise control over management or policies of such company.
During the year ended December 31, 2024, investments in “affiliated companies” were as follows:
| | | | | | | | | | | | | | | | | | | | | | | | | | | | | | | | | | | | | | | | |
| | | | | | Value at
Beginning of
Year | | | Purchases | | | Sales | | | Realized
Gain (Loss) | | | Net Change in
Unrealized
Appreciation
(Depreciation) | | | Value at End
of Year | | | Number of
Shares
Held at
End of Year | | | Investment
Income | | | | |
| | | | | | | | |
| | | | Parnassus Core Equity Fund | | | | | | | | | | | | | | | | | | | | | | | | | | | | | |
| | | | | | | | |
| | | | Non-Controlled Affiliates | | | | | | | | | | | | | | | | | | | | | | | | Dividends | | | | | |
| | | | | | | | | | |
| | | | | Ball Corp. | | $ | 709,907,699 | | | $ | 107,064,330 | | | $ | 107,929,564 | | | $ | (63,344,577 | ) | | $ | 36,584,432 | | | $ | 682,282,320 | | | | 12,375,881 | | | $ | 11,024,579 | | | | | |
| | | | | | | | | | |
| | | | Total Affiliates | | $ | 709,907,699 | | | $ | 107,064,330 | | | $ | 107,929,564 | | | $ | (63,344,577 | ) | | $ | 36,584,432 | | | $ | 682,282,320 | | | | 12,375,881 | | | $ | 11,024,579 | | | | | |
| | | | | | | | |
| | | | Parnassus Value Equity Fund | | | | | | | | | | | | | | | | | | | | | | | | | | | | | |
| | | | | | | | |
| | | | Non-Controlled Affiliates | | | | | | | | | | | | | | | | | | | | | | | | Dividends | | | | | |
| | | | | | | | | | |
| | | | | Ball Corp. | | $ | 143,351,919 | | | $ | 299,421 | | | $ | 13,289,648 | | | $ | (440,987 | ) | | $ | (2,671,348 | ) | | $ | 127,249,357 | | | | 2,308,169 | | | $ | 1,881,538 | | | | | |
| | | | | | | | | | |
| | | | Total Affiliates | | $ | 143,351,919 | | | $ | 299,421 | | | $ | 13,289,648 | | | $ | (440,987 | ) | | $ | (2,671,348 | ) | | $ | 127,249,357 | | | | 2,308,169 | | | $ | 1,881,538 | | | | | |
| | | | | | | | |
| | | | Parnassus Mid Cap Fund | | | | | | | | | | | | | | | | | | | | | | | | | | | | | |
| | | | | | | | |
| | | | Non-Controlled Affiliates | | | | | | | | | | | | | | | | | | | | | | | | Dividends | | | | | |
| | | | | | | | | | |
| | | | | Ball Corp. | | $ | 164,890,686 | | | $ | - | | | $ | 118,212,546 | | | $ | (57,676,762 | ) | | $ | 57,146,236 | | | $ | 46,147,614 | | | | 837,069 | | | $ | 784,659 | | | | | |
| | | | | | | | | | |
| | | | Total Affiliates | | $ | 164,890,686 | | | $ | - | | | $ | 118,212,546 | | | $ | (57,676,762 | ) | | $ | 57,146,236 | | | $ | 46,147,614 | | | | 837,069 | | | $ | 784,659 | | | | | |
| | | | | | | |
| | | | Parnassus Mid Cap Growth Fund | | | | | | | | | | | | | | | | | | | | | | | | | |
| | | | | | | | |
| | | | Non-Controlled Affiliates | | | | | | | | | | | | | | | | | | | | | | | | Dividends | | | | | |
| | | | | | | | | | |
| | | | | Ball Corp. | | $ | 8,380,664 | | | $ | - | | | $ | 7,970,434 | | | $ | (361,063 | ) | | $ | (49,167 | ) | | $ | - | | | | - | | | $ | - | | | | | |
| | | | Total Affiliates | | $ | 8,380,664 | | | $ | - | | | $ | 7,970,434 | | | $ | (361,063 | ) | | $ | (49,167 | ) | | $ | - | | | | - | | | $ | - | | | | | |
60
| | | | |
| | |
| Annual Report • 2024 | | | | |
Notes to Financial Statements (continued)
11. Segment Reporting
During the year, the Funds adopted FASB Accounting Standards Update 2023-07, Segment Reporting (Topic 280) - Improvements to Reportable Segment Disclosures (“ASU 2023-07”). ASU 2023-07 is intended to improve disclosures around reportable segments and to enhance disclosure requirements about significant segment expenses that are regularly provided to a public entity’s chief operating decision maker (“CODM”). An operating segment is defined as a component of a public entity that engages in business activities from which it may recognize revenues and incur expense, has operating results that are regularly reviewed by the CODM, and for which discrete financial information is available. Adoption of ASU 2023-07 had no impact on the Funds’ financial position or their results of operations.
Topic 280 requires a public entity to disclose the title and position of the CODM and an explanation of how the CODM uses the reported measure(s) of segment profit or loss in assessing segment performance and deciding how to allocate resources. The Funds’
President and Chief Executive Officer acts as the Funds’ CODM. The Funds operate as a single reportable segment, which reflects how the CODM monitors and manages the operating results of each Fund. The CODM manages the allocation of resources in accordance with each Fund’s investment objective and strategies as set forth in its prospectus and evaluates total returns of the Funds versus their comparative benchmarks. The financial information used by the CODM to assess the segment’s performance and to allocate resources, including total return, expense ratios, changes in net assets from operations and portfolio composition, is consistent with that presented within each Funds’ financial statements and financial highlights.
12. Subsequent Events
Management has evaluated the impact of all subsequent events on the Funds through the date the financial statements were issued and has determined that there were no subsequent events requiring adjustment to or additional disclosure in the financial statements.
61
| | | | |
| | |
| | | | Annual Report • 2024 |
Financial Highlights
Selected data for each share of capital stock outstanding, total return and ratios/supplement data for the year ended December 31, 2024 and each of the five years ended December 31 are as follows:
| | | | | | | | | | | | | | | | | | | | | | | | | | | | |
| | | | | | | |
For a Share
Outstanding
for the Year
Ended | | Net Asset
Value
Beginning
of Year | | | Net Investment
Income
(Loss)(a) | | | Net Realized and
Unrealized
Gain (Loss) on
Securities(a) | | | Total from
Investment
Operations(a) | | | Dividends
from Net
Investment
Income | | | Distributions
from Net
Realized
Gains on
Securities | | | Total
Dividends and
Distributions | |
| Parnassus Core Equity Fund – Investor Shares | |
2024 | | | $55.11 | | | | $0.20 | | | | $10.22 | | | | $10.42 | | | | $(0.23 | ) | | | $(5.73 | ) | | | $(5.96 | ) |
2023 | | | 46.92 | | | | 0.29 | | | | 11.21 | | | | 11.50 | | | | (0.31 | ) | | | (3.00 | ) | | | (3.31 | ) |
2022 | | | 63.41 | | | | 0.23 | | | | (11.97 | ) | | | (11.74 | ) | | | (0.23 | ) | | | (4.52 | ) | | | (4.75 | ) |
2021 | | | 53.65 | | | | 0.23 | | | | 14.46 | | | | 14.69 | | | | (0.53 | ) | | | (4.40 | ) | | | (4.93 | ) |
2020 | | | 47.03 | | | | 0.33 | | | | 9.44 | | | | 9.77 | | | | (0.31 | ) | | | (2.84 | ) | | | (3.15 | ) |
| Parnassus Core Equity Fund – Institutional Shares | |
2024 | | | 55.26 | | | | 0.32 | | | | 10.25 | | | | 10.57 | | | | (0.35 | ) | | | (5.73 | ) | | | (6.08 | ) |
2023 | | | 47.03 | | | | 0.40 | | | | 11.25 | | | | 11.65 | | | | (0.42 | ) | | | (3.00 | ) | | | (3.42 | ) |
2022 | | | 63.55 | | | | 0.34 | | | | (12.00 | ) | | | (11.66 | ) | | | (0.34 | ) | | | (4.52 | ) | | | (4.86 | ) |
2021 | | | 53.75 | | | | 0.36 | | | | 14.49 | | | | 14.85 | | | | (0.65 | ) | | | (4.40 | ) | | | (5.05 | ) |
2020 | | | 47.10 | | | | 0.44 | | | | 9.46 | | | | 9.90 | | | | (0.41 | ) | | | (2.84 | ) | | | (3.25 | ) |
| Parnassus Growth Equity Fund – Investor Shares | |
2024 | | | 21.30 | | | | (0.06 | ) | | | 5.82 | | | | 5.76 | | | | - | | | | (1.34 | ) | | | (1.34 | ) |
2023 | | | 14.95 | | | | 0.02 | | | | 6.68 | | | | 6.70 | | | | (0.35 | ) | | | - | | | | (0.35 | ) |
For the period ended
December 31, 2022(d) | | | 15.00 | | | | - | (g) | | | (0.05 | ) | | | (0.05 | ) | | | - | | | | - | | | | - | |
| Parnassus Growth Equity Fund – Institutional Shares | |
2024 | | | 21.30 | | | | (0.01 | ) | | | 5.83 | | | | 5.82 | | | | - | | | | (1.34 | ) | | | (1.34 | ) |
2023 | | | 14.95 | | | | 0.05 | | | | 6.68 | | | | 6.73 | | | | (0.38 | ) | | | - | | | | (0.38 | ) |
For the period ended
December 31, 2022(d) | | | 15.00 | | | | - | (g) | | | (0.05 | ) | | | (0.05 | ) | | | - | | | | - | | | | - | |
| Parnassus Value Equity Fund – Investor Shares | |
2024 | | | 50.54 | | | | 0.54 | | | | 5.70 | | | | 6.24 | | | | (0.56 | ) | | | (3.77 | ) | | | (4.33 | ) |
2023 | | | 45.27 | | | | 0.59 | | | | 5.57 | | | | 6.16 | | | | (0.60 | ) | | | (0.29 | ) | | | (0.89 | ) |
2022 | | | 54.03 | | | | 0.53 | | | | (7.99 | ) | | | (7.46 | ) | | | (0.54 | ) | | | (0.76 | ) | | | (1.30 | ) |
2021 | | | 48.31 | | | | 0.69 | | | | 14.08 | | | | 14.77 | | | | (0.97 | ) | | | (8.08 | ) | | | (9.05 | ) |
2020 | | | 38.18 | | | | 0.28 | | | | 10.19 | | | | 10.47 | | | | (0.34 | ) | | | - | | | | (0.34 | ) |
| Parnassus Value Equity Fund – Institutional Shares | |
2024 | | | 50.64 | | | | 0.66 | | | | 5.72 | | | | 6.38 | | | | (0.66 | ) | | | (3.77 | ) | | | (4.43 | ) |
2023 | | | 45.36 | | | | 0.70 | | | | 5.58 | | | | 6.28 | | | | (0.71 | ) | | | (0.29 | ) | | | (1.00 | ) |
2022 | | | 54.10 | | | | 0.64 | | | | (8.00 | ) | | | (7.36 | ) | | | (0.62 | ) | | | (0.76 | ) | | | (1.38 | ) |
2021 | | | 48.36 | | | | 0.80 | | | | 14.11 | | | | 14.91 | | | | (1.09 | ) | | | (8.08 | ) | | | (9.17 | ) |
2020 | | | 38.19 | | | | 0.36 | | | | 10.22 | | | | 10.58 | | | | (0.41 | ) | | | - | | | | (0.41 | ) |
| Parnassus Mid Cap Fund – Investor Shares | |
2024 | | | 37.25 | | | | 0.07 | | | | 3.80 | | | | 3.87 | | | | (0.08 | ) | | | (3.63 | ) | | | (3.71 | ) |
2023 | | | 33.88 | | | | 0.10 | | | | 4.13 | | | | 4.23 | | | | (0.14 | ) | | | (0.72 | ) | | | (0.86 | ) |
2022 | | | 45.20 | | | | 0.03 | | | | (9.78 | ) | | | (9.75 | ) | | | - | | | | (1.57 | ) | | | (1.57 | ) |
2021 | | | 40.78 | | | | (0.04 | ) | | | 6.66 | | | | 6.62 | | | | (0.01 | ) | | | (2.19 | ) | | | (2.20 | ) |
2020 | | | 35.63 | | | | 0.12 | | | | 5.18 | | | | 5.30 | | | | (0.08 | ) | | | (0.07 | ) | | | (0.15 | ) |
62
| | | | |
| | |
| Annual Report • 2024 | | | | |
| | | | | | | | | | | | | | | | | | | | | | | | | | |
| | | | | | |
Net Asset
Value
End of
Year | | | Total
Overall
Return | | | Net Assets
End of
Year
(000s) | | | Ratio of
Gross
Expenses to
Average
Net Assets | | | Ratio of Net Expenses
to Average Net Assets
(Net of Waiver and
Expense
Offset Arrangements)(b)(c) | | | Ratio of
Net Investment
Income (Loss)
to Average Net
Assets | | | Portfolio
Turnover
Rate | |
| | |
| | $59.57 | | | | 18.52 | % | | | $13,311,327 | | | | 0.81 | % | | | 0.81 | % | | | 0.33 | % | | | 34.20 | % |
| | 55.11 | | | | 24.93 | | | | 12,929,826 | | | | 0.82 | | | | 0.82 | | | | 0.56 | | | | 29.01 | |
| | 46.92 | | | | (18.61 | ) | | | 11,173,977 | | | | 0.85 | | | | 0.82 | | | | 0.42 | | | | 39.63 | |
| | 63.41 | | | | 27.55 | | | | 15,405,636 | | | | 0.82 | | | | 0.82 | | | | 0.38 | | | | 25.82 | |
| | 53.65 | | | | 21.19 | | | | 11,906,386 | | | | 0.84 | | | | 0.84 | | | | 0.69 | | | | 37.15 | |
| | |
| | 59.75 | | | | 18.75 | | | | 15,705,097 | | | | 0.61 | | | | 0.61 | | | | 0.53 | | | | 34.20 | |
| | 55.26 | | | | 25.21 | | | | 14,868,509 | | | | 0.62 | | | | 0.61 | | | | 0.77 | | | | 29.01 | |
| | 47.03 | | | | (18.45 | ) | | | 12,736,208 | | | | 0.62 | | | | 0.61 | | | | 0.64 | | | | 39.63 | |
| | 63.55 | | | | 27.81 | | | | 16,869,763 | | | | 0.61 | | | | 0.61 | | | | 0.60 | | | | 25.82 | |
| | 53.75 | | | | 21.47 | | | | 11,320,933 | | | | 0.62 | | | | 0.62 | | | | 0.91 | | | | 37.15 | |
| | |
| | 25.72 | | | | 26.85 | | | | 22,970 | | | | 1.40 | | | | 0.84 | | | | (0.25 | ) | | | 34.89 | |
| | 21.30 | | | | 44.82 | | | | 8,006 | | | | 2.89 | | | | 0.84 | | | | 0.10 | | | | 34.94 | |
| 14.95 | | | | (0.33 | )(e) | | | 227 | | | | 7.83 | (f) | | | 0.84 | (f) | | | 3.52 | (f) | | | - | |
| | |
| | 25.78 | | | | 27.13 | | | | 40,733 | | | | 1.18 | | | | 0.63 | | | | (0.04 | ) | | | 34.89 | |
| | 21.30 | | | | 45.09 | | | | 22,529 | | | | 1.86 | | | | 0.63 | | | | 0.30 | | | | 34.94 | |
| 14.95 | | | | (0.33 | )(e) | | | 10,573 | | | | 2.30 | (f) | | | 0.63 | (f) | | | 3.11 | (f) | | | - | |
| | |
| | 52.45 | | | | 12.01 | | | | 3,118,642 | | | | 0.91 | | | | 0.88 | | | | 0.99 | | | | 24.08 | |
| | 50.54 | | | | 13.70 | | | | 3,267,439 | | | | 0.93 | | | | 0.88 | | | | 1.26 | | | | 30.19 | |
| | 45.27 | | | | (13.81 | ) | | | 3,008,001 | | | | 0.92 | | | | 0.88 | | | | 1.11 | | | | 32.36 | |
| | 54.03 | | | | 31.12 | | | | 3,768,904 | | | | 0.90 | | | | 0.90 | | | | 1.20 | | | | 37.22 | |
| | 48.31 | | | | 27.42 | | | | 2,238,344 | | | | 0.94 | | | | 0.94 | | | | 0.75 | | | | 52.77 | |
| | |
| | 52.59 | | | | 12.27 | | | | 1,706,549 | | | | 0.71 | | | | 0.65 | | | | 1.22 | | | | 24.08 | |
| | 50.64 | | | | 13.94 | | | | 1,652,941 | | | | 0.72 | | | | 0.65 | | | | 1.49 | | | | 30.19 | |
| | 45.36 | | | | (13.61 | ) | | | 1,518,273 | | | | 0.72 | | | | 0.65 | | | | 1.35 | | | | 32.36 | |
| | 54.10 | | | | 31.37 | | | | 1,654,506 | | | | 0.71 | | | | 0.71 | | | | 1.39 | | | | 37.22 | |
| | 48.36 | | | | 27.72 | | | | 1,025,590 | | | | 0.73 | | | | 0.71 | | | | 0.96 | | | | 52.77 | |
| | |
| | 37.41 | | | | 9.99 | | | | 1,265,449 | | | | 0.95 | | | | 0.95 | | | | 0.17 | | | | 43.55 | |
| | 37.25 | | | | 12.67 | | | | 1,477,106 | | | | 0.98 | | | | 0.96 | | | | 0.28 | | | | 42.45 | |
| | 33.88 | | | | (21.56 | ) | | | 1,974,198 | | | | 0.97 | | | | 0.96 | | | | 0.09 | | | | 47.52 | |
| | 45.20 | | | | 16.39 | | | | 3,155,696 | | | | 0.96 | | | | 0.96 | | | | (0.08 | ) | | | 34.76 | |
| | 40.78 | | | | 14.88 | | | | 2,749,355 | | | | 0.98 | | | | 0.98 | | | | 0.34 | | | | 41.00 | |
63
| | | | |
| | |
| | | | Annual Report • 2024 |
Financial Highlights (continued)
| | | | | | | | | | | | | | | | | | | | | | | | | | | | |
| | | | | | | |
For a Share
Outstanding
for the Year
Ended | | Net Asset
Value
Beginning
of Year | | | Net Investment
Income
(Loss)(a) | | | Net Realized and
Unrealized
Gain (Loss) on
Securities(a) | | | Total from
Investment
Operations(a) | | | Dividends
from Net
Investment
Income | | | Distributions
from Net
Realized
Gains on
Securities | | | Total
Dividends and
Distributions | |
| Parnassus Mid Cap Fund – Institutional Shares | |
2024 | | | $37.42 | | | | $0.14 | | | | $3.83 | | | | $3.97 | | | | $(0.17 | ) | | | $(3.63 | ) | | | $(3.80 | ) |
2023 | | | 34.02 | | | | 0.17 | | | | 4.16 | | | | 4.33 | | | | (0.21 | ) | | | (0.72 | ) | | | (0.93 | ) |
2022 | | | 45.39 | | | | 0.11 | | | | (9.83 | ) | | | (9.72 | ) | | | (0.08 | ) | | | (1.57 | ) | | | (1.65 | ) |
2021 | | | 40.87 | | | | 0.05 | | | | 6.69 | | | | 6.74 | | | | (0.03 | ) | | | (2.19 | ) | | | (2.22 | ) |
2020 | | | 35.68 | | | | 0.20 | | | | 5.20 | | | | 5.40 | | | | (0.14 | ) | | | (0.07 | ) | | | (0.21 | ) |
| Parnassus Mid Cap Growth Fund – Investor Shares | |
2024 | | | 55.57 | | | | (0.19 | ) | | | 6.35 | | | | 6.16 | | | | - | | | | (4.24 | ) | | | (4.24 | ) |
2023 | | | 42.28 | | | | (0.15 | ) | | | 15.03 | | | | 14.88 | | | | - | | | | (1.59 | ) | | | (1.59 | ) |
2022 | | | 64.36 | | | | (0.17 | ) | | | (21.39 | ) | | | (21.56 | ) | | | - | | | | (0.52 | ) | | | (0.52 | ) |
2021 | | | 61.44 | | | | (0.34 | ) | | | 6.16 | | | | 5.82 | | | | (0.94 | ) | | | (1.96 | ) | | | (2.90 | ) |
2020 | | | 50.47 | | | | (0.02 | ) | | | 14.19 | | | | 14.17 | | | | (0.06 | ) | | | (3.14 | ) | | | (3.20 | ) |
| Parnassus Mid Cap Growth Fund – Institutional Shares | |
2024 | | | 55.83 | | | | (0.12 | ) | | | 6.38 | | | | 6.26 | | | | - | | | | (4.24 | ) | | | (4.24 | ) |
2023 | | | 42.42 | | | | (0.09 | ) | | | 15.09 | | | | 15.00 | | | | - | | | | (1.59 | ) | | | (1.59 | ) |
2022 | | | 64.50 | | | | (0.11 | ) | | | (21.45 | ) | | | (21.56 | ) | | | - | | | | (0.52 | ) | | | (0.52 | ) |
2021 | | | 61.49 | | | | (0.26 | ) | | | 6.17 | | | | 5.91 | | | | (0.94 | ) | | | (1.96 | ) | | | (2.90 | ) |
2020 | | | 50.43 | | | | 0.05 | | | | 14.21 | | | | 14.26 | | | | (0.06 | ) | | | (3.14 | ) | | | (3.20 | ) |
| Parnassus Fixed Income Fund – Investor Shares | |
2024 | | | 14.88 | | | | 0.53 | | | | (0.25 | ) | | | 0.28 | | | | (0.55 | ) | | | - | | | | (0.55 | ) |
2023 | | | 14.40 | | | | 0.47 | | | | 0.47 | | | | 0.94 | | | | (0.46 | ) | | | - | | | | (0.46 | ) |
2022 | | | 17.22 | | | | 0.37 | | | | (2.82 | ) | | | (2.45 | ) | | | (0.37 | ) | | | - | | | | (0.37 | ) |
2021 | | | 18.01 | | | | 0.29 | | | | (0.66 | ) | | | (0.37 | ) | | | (0.29 | ) | | | (0.13 | ) | | | (0.42 | ) |
2020 | | | 17.05 | | | | 0.29 | | | | 1.05 | | | | 1.34 | | | | (0.28 | ) | | | (0.10 | ) | | | (0.38 | ) |
| Parnassus Fixed Income Fund – Institutional Shares | |
2024 | | | 14.89 | | | | 0.56 | | | | (0.25 | ) | | | 0.31 | | | | (0.57 | ) | | | - | | | | (0.57 | ) |
2023 | | | 14.40 | | | | 0.50 | | | | 0.48 | | | | 0.98 | | | | (0.49 | ) | | | - | | | | (0.49 | ) |
2022 | | | 17.22 | | | | 0.40 | | | | (2.81 | ) | | | (2.41 | ) | | | (0.40 | ) | | | (0.01 | ) | | | (0.41 | ) |
2021 | | | 18.01 | | | | 0.33 | | | | (0.67 | ) | | | (0.34 | ) | | | (0.32 | ) | | | (0.13 | ) | | | (0.45 | ) |
2020 | | | 17.04 | | | | 0.33 | | | | 1.06 | | | | 1.39 | | | | (0.32 | ) | | | (0.10 | ) | | | (0.42 | ) |
64
| | | | |
| | |
| Annual Report • 2024 | | | | |
| | | | | | | | | | | | | | | | | | | | | | | | | | |
| | | | | | |
Net Asset
Value
End of
Year | | | Total
Overall
Return | | | Net Assets
End of
Year
(000s) | | | Ratio of
Gross
Expenses to
Average
Net Assets | | | Ratio of Net Expenses
to Average Net Assets
(Net of Waiver and
Expense
Offset Arrangements)(b)(c) | | | Ratio of
Net Investment
Income (Loss)
to Average Net
Assets | | | Portfolio
Turnover
Rate | |
| | |
| | $37.59 | | | | 10.21 | % | | | $1,576,993 | | | | 0.78 | % | | | 0.75 | % | | | 0.34 | % | | | 43.55 | % |
| | 37.42 | | | | 12.92 | | | | 3,921,694 | | | | 0.76 | | | | 0.75 | | | | 0.49 | | | | 42.45 | |
| | 34.02 | | | | (21.41 | ) | | | 4,103,007 | | | | 0.76 | | | | 0.75 | | | | 0.30 | | | | 47.52 | |
| | 45.39 | | | | 16.63 | | | | 5,518,086 | | | | 0.75 | | | | 0.75 | | | | 0.13 | | | | 34.76 | |
| | 40.87 | | | | 15.16 | | | | 4,211,267 | | | | 0.76 | | | | 0.75 | | | | 0.58 | | | | 41.00 | |
| | |
| | 57.49 | | | | 10.55 | | | | 647,286 | | | | 0.81 | | | | 0.80 | | | | (0.33 | ) | | | 41.45 | |
| | 55.57 | | | | 35.60 | | | | 645,243 | | | | 0.81 | | | | 0.80 | | | | (0.30 | ) | | | 47.49 | |
| | 42.28 | | | | (33.52 | ) | | | 514,193 | | | | 0.80 | | | | 0.80 | | | | (0.36 | ) | | | 58.11 | |
| | 64.36 | | | | 9.37 | | | | 880,724 | | | | 0.80 | | | | 0.80 | | | | (0.52 | ) | | | 28.73 | |
| | 61.44 | | | | 28.61 | | | | 860,120 | | | | 0.83 | | | | 0.83 | | | | (0.05 | ) | | | 82.46 | |
| | |
| | 57.85 | | | | 10.68 | | | | 194,674 | | | | 0.70 | | | | 0.68 | | | | (0.21 | ) | | | 41.45 | |
| | 55.83 | | | | 35.77 | | | | 183,037 | | | | 0.71 | | | | 0.68 | | | | (0.18 | ) | | | 47.49 | |
| | 42.42 | | | | (33.45 | ) | | | 144,292 | | | | 0.70 | | | | 0.68 | | | | (0.24 | ) | | | 58.11 | |
| | 64.50 | | | | 9.50 | | | | 237,137 | | | | 0.68 | | | | 0.68 | | | | (0.40 | ) | | | 28.73 | |
| | 61.49 | | | | 28.81 | | | | 218,962 | | | | 0.68 | | | | 0.68 | | | | 0.09 | | | | 82.46 | |
| | |
| | 14.61 | | | | 1.92 | | | | 107,491 | | | | 0.80 | | | | 0.58 | | | | 3.59 | | | | 28.44 | |
| | 14.88 | | | | 6.71 | | | | 118,945 | | | | 0.81 | | | | 0.58 | | | | 3.24 | | | | 48.72 | |
| | 14.40 | | | | (14.29 | ) | | | 132,391 | | | | 0.82 | | | | 0.68 | | | | 2.42 | | | | 58.67 | |
| | 17.22 | | | | (2.09 | ) | | | 230,471 | | | | 0.76 | | | | 0.68 | | | | 1.64 | | | | 31.29 | |
| | 18.01 | | | | 7.91 | | | | 233,496 | | | | 0.74 | | | | 0.68 | | | | 1.61 | | | | 37.77 | |
| | |
| | 14.63 | | | | 2.13 | | | | 182,248 | | | | 0.60 | | | | 0.39 | | | | 3.77 | | | | 28.44 | |
| | 14.89 | | | | 6.95 | | | | 161,471 | | | | 0.61 | | | | 0.39 | | | | 3.44 | | | | 48.72 | |
| | 14.40 | | | | (14.10 | ) | | | 146,034 | | | | 0.59 | | | | 0.45 | | | | 2.66 | | | | 58.67 | |
| | 17.22 | | | | (1.90 | ) | | | 233,649 | | | | 0.56 | | | | 0.45 | | | | 1.88 | | | | 31.29 | |
| | 18.01 | | | | 8.19 | | | | 163,671 | | | | 0.55 | | | | 0.45 | | | | 1.81 | | | | 37.77 | |
(a) Income (loss) from operations per share is based on average daily shares outstanding.
(b) Parnassus Investments has contractually limited expenses to an annualized rate of 0.82% for the Parnassus Core Equity Fund – Investor Shares, 0.84% for the Parnassus Growth Equity Fund – Investor Shares, 0.88% for the Parnassus Value Equity Fund – Investor Shares, 0.96% for the Parnassus Mid Cap Fund – Investor Shares, 0.80% for the Parnassus Mid Cap Growth Fund – Investor Shares and 0.58% for the Parnassus Fixed Income Fund – Investor Shares.
(c) Parnassus Investments has contractually limited expenses to an annualized rate of 0.61% for the Parnassus Core Equity Fund – Institutional Shares, 0.63% for the Parnassus Growth Equity Fund – Institutional Shares, 0.65% for the Parnassus Value Equity Fund – Institutional Shares, 0.75% for the Parnassus Mid Cap Fund – Institutional Shares, 0.68% for the Parnassus Mid Cap Growth Fund – Institutional Shares and 0.39% for the Parnassus Fixed Income Fund – Institutional Shares.
(d) The Parnassus Growth Equity Fund commenced operations on December 28, 2022, and the period shown is from December 28, 2022 through December 31, 2022.
(e) Total Return is not annualized for periods less than one year.
(f) Annualized.
(g) Amount less than $0.01.
65
| | | | |
| | |
| | | | Annual Report • 2024 |
Report of Independent Registered Public Accounting Firm
To the Board of Trustees of Parnassus Income Funds and Parnassus Funds and Shareholders of Parnassus Core Equity Fund, Parnassus Growth Equity Fund, Parnassus Value Equity Fund, Parnassus Mid Cap Fund, Parnassus Mid Cap Growth Fund and Parnassus Fixed Income Fund
Opinions on the Financial Statements
We have audited the accompanying statements of assets and liabilities, including the portfolios of investments, of Parnassus Core Equity Fund and Parnassus Fixed Income Fund (two of the funds constituting Parnassus Income Funds) and Parnassus Growth Equity Fund, Parnassus Value Equity Fund,
Parnassus Mid Cap Fund and Parnassus Mid Cap Growth Fund (constituting Parnassus Funds) (hereafter collectively referred to as the “Funds”) as of December 31, 2024, the related statements of operations and of changes in net assets for each of the periods indicated in the table below, including the related notes, and the financial highlights for each of the periods indicated in the table below (collectively referred to as the “financial statements”). In our opinion, the financial statements present fairly, in all material respects, the financial position of each of the Funds as of December 31, 2024, the results of each of their operations, the changes in each of their net assets, and each of the financial highlights for the periods indicated in the table below, in conformity with accounting principles generally accepted in the United States of America.
| | | | | | |
| | | |
| Fund | | Statement of Operations | | Statement of Changes in Net Assets | | Financial Highlights |
| | | |
| Parnassus Core Equity Fund | | For the year ended December 31, 2024 | | For each of the two years in the period ended December 31, 2024 | | For each of the four years in the period ended December 31, 2024 |
| | | |
| Parnassus Growth Equity Fund | | For the year ended December 31, 2024 | | For each of the two years in the period ended December 31, 2024 | | For each of the two years in the period ended December 31, 2024 and the period December 28, 2022 (commencement of operations) through December 31, 2022 |
| | | |
| Parnassus Value Equity Fund | | For the year ended December 31, 2024 | | For each of the two years in the period ended December 31, 2024 | | For each of the four years in the period ended December 31, 2024 |
| | | |
| Parnassus Mid Cap Fund | | For the year ended December 31, 2024 | | For each of the two years in the period ended December 31, 2024 | | For each of the four years in the period ended December 31, 2024 |
| | | |
| Parnassus Mid Cap Growth Fund | | For the year ended December 31, 2024 | | For each of the two years in the period ended December 31, 2024 | | For each of the four years in the period ended December 31, 2024 |
| | | |
| Parnassus Fixed Income Fund | | For the year ended December 31, 2024 | | For each of the two years in the period ended December 31, 2024 | | For each of the four years in the period ended December 31, 2024 |
The financial statements of Parnassus Core Equity Fund, Parnassus Value Equity Fund, Parnassus Mid Cap Fund, Parnassus Mid Cap Growth Fund and Parnassus Fixed Income Fund as of and for the year ended December 31, 2020 and the financial highlights for each of the periods ended on or prior to December 31, 2020 (not presented herein, other than the financial highlights) were audited by other auditors whose report dated January 28, 2021 expressed an unqualified opinion on those financial statements and financial highlights.
Basis for Opinions
These financial statements are the responsibility of the Funds’ management. Our responsibility is to express an opinion on the Funds’ financial statements based on our audits. We are a public accounting firm registered with the Public Company Accounting Oversight Board (United States) (PCAOB) and are required to be independent with respect to the Funds in accordance with the U.S. federal securities laws and the applicable rules and regulations of the Securities and Exchange Commission and the PCAOB.
66
| | | | |
| | |
| Annual Report • 2024 | | | | |
We conducted our audits of these financial statements in accordance with the standards of the PCAOB. Those standards require that we plan and perform the audit to obtain reasonable assurance about whether the financial statements are free of material misstatement, whether due to error or fraud.
Our audits included performing procedures to assess the risks of material misstatement of the financial statements, whether due to error or fraud, and performing procedures that respond to those risks. Such procedures included examining, on a test basis, evidence regarding the amounts and disclosures in the financial statements. Our audits also included evaluating the accounting principles used and significant estimates made by management, as well as evaluating the overall presentation of the financial statements. Our procedures included confirmation of securities owned as of December 31, 2024 by correspondence with the custodians. We believe that our audits provide a reasonable basis for our opinions.
/s/PricewaterhouseCoopers LLP
San Francisco, CA
February 11, 2025
We have served as the auditor of one or more investment companies in Parnassus Income Funds and Parnassus Funds since 2021.
67
| | | | |
| | |
| | | | Annual Report • 2024 |
Additional Information (unaudited)
Board of Trustees and Officers
| | | | | | | | | | | | | | |
| | |
| | | Independent Trustees§ | | Interested
Trustee† |
| Name | | Alecia A. DeCoudreaux | | Kay Yun | | Eric P. Rakowski | | Rajesh Atluru | | Roy Swan, Jr. | | Amy Johnson | | Benjamin E. Allen |
| Year of Birth | | 1954 | | 1963 | | 1958 | | 1969 | | 1964 | | 1966 | | 1977 |
| Address | | 1 Market Street, Suite 1600 San Francisco, California 94105 | | 1 Market Street, Suite 1600 San Francisco, California 94105 | | 1 Market Street, Suite 1600 San Francisco, California 94105 | | 1 Market Street, Suite 1600 San Francisco, California 94105 | | 1 Market Street, Suite 1600 San Francisco, California 94105 | | 1 Market Street, Suite 1600 San Francisco, California 94105 | | 1 Market Street, Suite 1600 San Francisco, California 94105 |
| Position(s) Held with Funds | | Lead Independent Trustee and Chairperson | | Trustee, Audit Committee Chairperson | | Trustee | | Trustee | | Trustee | | Trustee, Nominating & Governance Committee Chairperson | | President and Chief Executive Officer and Trustee |
| Term of Office and Length of Service | | Indefinite.* Since 2013. | | Indefinite.* Since 2017. | | Indefinite.* Since 2021. | | Indefinite.* Since 2021. | | Indefinite.* Since 2021. | | Indefinite.* Since 2022. | | Indefinite. As President and Chief Executive Officer Since 2017; as Trustee since 2021 for Parnassus Income Funds and Parnassus Funds |
| Principal Occupation(s) During Past 5 Years | | Director of CVS Health Corporation. Member of the CVS Health Corporation audit committee from 2015- 2024. Director of the William and Flora Hewlett Foundation since 2014 and Chair of Audit Committee from 2016-2022. Trustee Emerita of Wellesley College, Honorary Director of the Indiana University Foundation and Emerita Board Member of the Indiana University School of Law Board of Visitors. | | Partner and Chief Financial Officer at Health Evolution Partners in San Francisco since 2007. Currently an emeritus trustee at the American Conservatory Theater and a trustee at San Francisco University High School. | | Professor of Law, University of California at Berkeley School of Law since 1990. | | Founder and Managing Director of Activate Capital, a private equity/ venture capital investment firm focusing on sustainable investments in energy, mobility and industrial ecosystems. | | Head of The Ford Foundation’s Mission Investments program, responsible for the foundation’s impact investing and grantmaking dedicated to the ESG and impact investing field since 2018. Previously, Mr. Swan was a managing director at Morgan Stanley and held roles including co-head of Global Sustainable Finance, President & COO of Morgan Stanley Trust , and founding CEO and Managing Member of Morgan Stanley Impact Small Business Investment Company LLC, where he remains a Member. | | Managing Director and Global Head of Operations, Columbia Threadneedle Investments, the global asset management business of Ameriprise Financial, Inc. From 2016-2019. | | Chief Executive Officer of Parnassus Investments, LLC since 2018. President of Parnassus Investments, LLC since 2017. Vice President of Parnassus Investments from 2008 to 2017; employed by Parnassus Investments, LLC since 2005. Portfolio Manager of the Parnassus Core Equity Fund since 2012. |
68
| | | | |
| | |
| Annual Report • 2024 | | | | |
Additional Information (unaudited) (continued)
Board of Trustees and Officers (continued)
| | | | | | | | | | | | | | |
| | |
| | | Independent Trustees§ | | Interested
Trustee† |
| Name | | Alecia A. DeCoudreaux | | Kay Yun | | Eric P. Rakowski | | Rajesh Atluru | | Roy Swan, Jr. | | Amy Johnson | | Benjamin E. Allen |
| Portfolios in the Fund Complex Overseen by Trustee | | Eight | | Eight | | Eight | | Eight | | Eight | | Eight | | Eight |
| Other Directorships Held by Trustee | | CVS Health Corporation | | None | | AMG Funds (40 portfolios); AMG Pantheon Fund, LLC (1 portfolio); AMG Pantheon Master Fund, LLC (1 portfolio); AMG Pantheon Subsidiary Fund, LLC (1 portfolio); AMG Pantheon Lead Fund LLC (1 portfolio); AMG Pantheon Credit Solutions Fund (1 portfolio); Harding, Loevner Funds, Inc. (10 portfolios); Third Avenue Trust (3 portfolios) (2002-2019); AMG Comvest Senior Lending Fund (1 portfolio); and Third Avenue Variable Trust (1 portfolio) (2002-2019) | | None | | AQR Funds Advisory Board (22 portfolios) since February 2024; Federal Home Loan Mortgage Corporation (“Freddie Mac”) since January 2024; Aequi Acquisition Corp. (2020- 2023) | | Federal Home Loan and Bank of Des Moines | | None |
§ “Independent” Trustees are Trustees who are not deemed to be “interested persons” of the Funds as defined in the Investment Company Act of 1940.
† An “interested” Trustee is a Trustee who is deemed to be an “interested person” of the Funds, as defined in the Investment Company Act of 1940. BenjaminE. Allen is an interested person of the Funds because of his ownership in the Funds’ investment adviser and because he is an officer of the Trusts.
* Subject to the mandatory retirement age for independent Trustees.
Additional information about the Funds’ Board of Trustees is available in the Statement of Additional Information. The Statement of Additional Information is available without charge on the Securities and Exchange Commission’s website (www.sec.gov) or by calling us at (800) 999-3505 or at the Parnassus website, www.parnassus.com.
69
| | | | |
| | |
| | | | Annual Report • 2024 |
Additional Information (unaudited) (continued)
Board of Trustees and Officers (continued)
| | | | | | | | | | |
|
| Officers§ |
| Name | | Marc C. Mahon | | Todd C. Ahlsten | | John V. Skidmore II | | Downey H. Blount | | Stephanie J. Mahon |
| Year of Birth | | 1977 | | 1972 | | 1965 | | 1970 | | 1979 |
| Address | | 1 Market Street, Suite 1600 San Francisco, California 94105 | | 1 Market Street, Suite 1600 San Francisco, California 94105 | | 1 Market Street, Suite 1600 San Francisco, California 94105 | | 1 Market Street, Suite 1600 San Francisco, California 94105 | | 1 Market Street, Suite 1600 San Francisco, California 94105 |
| Position(s) Held with Funds | | Executive Vice President, Principal Accounting Officer and Treasurer | | Vice President | | Chief Compliance Officer, Fidelity Bond Officer and Secretary | | Assistant Secretary | | Assistant Treasurer |
| Term of Office and Length of Service | | Indefinite. As Principal Accounting Officer and Treasurer, since 2007. As Executive Vice President, since July 2017. | | Indefinite. Since 2001. | | Indefinite. Since 2008. | | Indefinite. Since 2015. | | Indefinite. Since 2024. |
| Principal Occupation(s) During Past 5 Years | | Chief Financial Officer of Parnassus Investments, LLC since 2007. Chief Operating Officer of Parnassus Investments since 2018. Executive Vice President of Parnassus Investments since 2017. | | Chief Investment Officer of Parnassus Investments, LLC since 2007; Vice President of Parnassus Investments from 2007 – 2021; Executive Vice President of Parnassus Investments since 2021; employed by Parnassus Investments since 1995. Portfolio Manager of the Parnassus Core Equity Fund since 2001. Vice President of Parnassus Funds and Parnassus Income Funds since 2001. | | Chief Compliance Officer of Parnassus Investments, LLC since 2008. | | Deputy Chief Compliance Officer of Parnassus Investments, LLC since 2019. Chief Compliance Officer of Parnassus Funds Distributor from 2015 to 2019. Senior Compliance Officer of Parnassus Investments, LLC from 2014 through 2018. | | Managing Director, Investment Operations of Parnassus Investments, LLC since 2024, Director of Operations of Parnassus Investments, LLC from 2015-2023. |
Proxy Disclosures
Parnassus proxy voting policies and procedures are available, without charge, on our website (www.parnassus.com), on the Securities and Exchange Commission’s website (www.sec.gov) and by calling us at (800) 999-3505. The Funds file a proxy voting record with the Securities and Exchange Commission for the 12 months ended June 30. The most recent report is available by calling Parnassus or it may be obtained from the Securities and Exchange Commission’s website or the Parnassus website.
Quarterly Portfolio Schedule
The Funds file their complete schedule of portfolio holdings with the Securities and Exchange Commission for the first and third quarters of each fiscal year as an exhibit to their reports on Form N-PORT. The Funds’ Form N-PORT reports are available on the Securities and Exchange Commission’s web site at http://www.sec.gov. The Funds publish their entire portfolio holdings information as of the end of each month and quarter on the Parnassus Funds’ website (www.parnassus.com). This information is available to anyone who visits the website and is updated on or about ten business days following the end of each month. Holdings information
70
| | | | |
| | |
| Annual Report • 2024 | | | | |
Additional Information (unaudited) (continued)
will remain on the website until updated for the subsequent time period.
Federal Income Tax Information
For the year ended December 31, 2024, the following percentages of ordinary income distributed by the
Funds that qualify for the individual qualified dividend income deduction (QDI) and the corporate dividends received deduction (DRD) are as follows:
| | | | | | | | |
| | |
| Fund | | QDI | | | DRD | |
Parnassus Core Equity Fund | | | 100.00 | % | | | 100.00 | % |
Parnassus Growth Equity Fund | | | 43.08 | % | | | 43.08 | % |
Parnassus Value Equity Fund | | | 100.00 | % | | | 100.00 | % |
Parnassus Mid Cap Fund | | | 100.00 | % | | | 100.00 | % |
Parnassus Mid Cap Growth Fund | | | 0.00 | % | | | 0.00 | % |
Parnassus Fixed Income Fund | | | 8.51 | % | | | 0.98 | % |
Tax information unaudited
We are required to advise you of the federal tax status of certain distributions received by shareholders
during the fiscal year. The fund hereby designates the following amounts for the fund’s fiscal year ended December 31, 2024:
| | | | | | | | | | |
| | | | | |
| | | Parnassus Core
Equity Fund | | Parnassus Growth
Equity Fund | | Parnassus Value
Equity Fund | | Parnassus Mid
Cap Fund | | Parnassus Mid Cap
Growth Fund |
Long-term capital gains | | $2,826,430,112 | | $2,711,263 | | $362,418,976 | | $284,811,130 | | $60,427,284 |
Individual shareholders should refer to their Form 1099 or other tax information, which was mailed in January 2025, to determine the calendar year amounts to be included on their 2024 tax returns. Shareholders should consult their tax advisors.
Liquidity Risk Management Program
Rule 22e-4 of the Investment Company Act of 1940 (the “Liquidity Rule”) required that the Board of Trustees (the “Trustees”) of the Parnassus Funds trust and the Parnassus Income Funds trust (the “Trusts”), which collectively are known as the Parnassus Funds (the “Funds”), approve a liquidity risk management program (the “Liquidity Program”) for the Funds. The purpose of the Liquidity Program is to assess and manage the Funds’ liquidity risk, which is the risk that the Funds would not be able to meet requests to redeem Fund shares without significant dilution of the remaining shareholders’ interests in the Funds. The Trustees designated a Liquidity Risk Management Committee as the administrator of the Liquidity Program (the “Program Administrator”).
The Program Administrator provided a written report regarding the Liquidity Program to the Trustees in advance of its meeting on March 23, 2022. The report
addressed the operation of the Liquidity Program, assessed the adequacy and effectiveness of its implementation, and described any material changes to the Liquidity Program during the review period. The report covered the period from March 1, 2021, through February 28, 2022 (the “Review Period). The Trusts’ executive vice president and principal accounting officer presented the report to the Board at the meeting and provided additional information regarding the Liquidity Program. The Board reviewed the Liquidity Program, and considered, among other items, the following:
| | 1. | The Program Administrator reviewed daily historical net redemption activity during the review period and during prior periods with higher-than-average redemption activity and concluded that the Funds have historically been able to meet requests to redeem Fund shares without significant dilution to the Funds’ remaining shareholders, and the Program Administrator expects the Funds to be able to continue to do so in the future during both normal and reasonably foreseeable stressed conditions. |
71
| | | | |
| | |
| | | | Annual Report • 2024 |
Additional Information (unaudited) (continued)
| | 2. | The Funds hold assets that are highly liquid investments and is therefore not required to establish a highly liquid investment minimum for the Funds or adopt policies and procedures for responding to a highly liquid investment minimum shortfall. |
| | 3. | The Program Administrator did not make any material changes to the Liquidity Program during the Review Period and did not recommend any changes to the Liquidity |
| | Program or the model inputs used to determine the liquidity classification of each security held by the Funds. |
| | 4. | The Program Administrator concluded that the Liquidity Program was reasonably designed to assess and manage the Funds’ liquidity risk, complies with the requirements of the Liquidity Rule, and was effectively implemented, having operated as intended during the Review Period. |
72
Cash Flow (free cash flow) is a measure of the amount of money coming into and going out of a company. Credit Spread is the difference in yield between two bonds of the same maturity. Duration is a measure of the sensitivity of the price (the value of principal) of a fixed income investment to a change in interest rates. Duration is expressed as a number of years. Rising interest rates mean falling bond prices, while declining interest rates mean rising bond prices. Investment Grade refers to the quality of an issuer’s credit. The term usually refers to bonds rated BBB or higher by an independent rating agency. A rating below BBB is considered to be noninvestment grade. The 30-Day SEC Yield is computed under an SEC standardized formula based on net income earned over the past 30 days. It is a “subsidized” yield, which means it includes contractual expense reimbursements and it would be lower without those reimbursements. The Unsubsidized 30-Day SEC Yield is computed under an SEC standardized formula based on net income earned over the past 30 days. It excludes contractual expense reimbursements, resulting in a lower yield. Price/Book (P/B) Ratio is the ratio of a stock’s latest closing price divided by its book value per share.
Price/Earnings (P/E) Ratio is a ratio of a stock’s current price to its per-share earnings over the past 12 months (or “trailing” 12 months); whereas, a Forward Price/Earnings (PE) Ratio is calculated using forecasted earnings.
The Yield to Worst (“YTW”) is the lowest potential bond yield received without the issuer defaulting, it assumes the worst-case scenario, or earliest redemption possible under terms of the bond and the Forward Earnings is an estimate of a company’s earnings for upcoming periods, usually the completion of the current fiscal year and often the following fiscal year whereas, a Forward Sales represents an estimate of a company’s expected sales over the next 12 months.
The Russell 1000® Growth Index, the Russell 1000® Value Index, the Russell Midcap® Index, the Russell Midcap® Growth Index, the Bloomberg U.S. Aggregate Bond Index, and the Standard & Poor’s 500 Composite Stock Price Index (the S&P 500 Index) are widely recognized indices of common stock prices. Index performance includes the reinvestment of dividends and capital gains. An index reflects no deductions for fees, expenses, or taxes. An investor cannot invest directly in an index.
The Russell 1000 Growth Index measures the performance of the large cap growth segment of the U.S. equity universe. It includes those Russell 1000 companies with relatively higher price-to-book ratios and higher expected earnings growth rates.
The Russell 1000 Value Index measures the performance of the large-cap value segment of the U.S. equity universe. It includes those Russell 1000 companies with lower price-to-book ratios and lower forecasted growth rates.
The Russell Midcap Index is a market capitalization-weighted index that measures the performance of the 800 smallest companies in the Russell 1000 Index, which represents approximately 30% of the total market capitalization of the Russell 1000 Index.
The Russell Midcap Growth Index measures the performance of the midcap growth segment of the US equity universe. It includes those Russell Midcap Index companies with higher price-to book ratios and higher forecasted growth values.
The Bloomberg U.S. Aggregate Bond Index is a broad-based, widely recognized index of fixed income security prices.
The S&P 500 Index is an unmanaged index of 500 common stocks primarily traded on the New York Stock Exchange, weighted by market capitalization. The S&P 500 Index is a product of S&P Dow Jones Indices LLC and/or its affiliates and has been licensed for use by Parnassus Investments. Copyright © 2025 by S&P Dow Jones Indices LLC, a subsidiary of McGraw-Hill Financial, Inc., and/or its affiliates. All rights reserved. Redistribution, reproduction and/or photocopying in whole or in part are prohibited without written permission of S&P Dow Jones Indices LLC. For more information on any of S&P Dow Jones Indices LLC’s indices please visit www.spdji.com. S&P® is a registered trademark of Standard & Poor’s Financial Services LLC and Dow Jones® is a registered trademark of Dow Jones Trademark Holdings LLC. Neither S&P Dow Jones Indices LLC, Dow Jones Trademark Holdings LLC, their affiliates nor their third party licensors make any representation or warranty, express or implied, as to the ability of any index to accurately represent the asset class or market sector that it purports to represent and neither S&P Dow Jones Indices LLC, Dow Jones Trademark Holdings LLC, their affiliates nor their third party licensors shall have any liability for any errors, omissions, or interruptions of any index or the data included therein.
Earnings growth is not representative of the fund’s future performance.
Mutual fund investing involves risk, and loss of principal is possible. The Fund’s share price may change daily based on the value of its security holdings. Stock markets can be volatile, and stock values fluctuate in response to the asset levels of individual companies and in response to general U.S. and international market and economic conditions. In addition to large cap companies, the Fund may invest in small and/or mid cap companies, which can be more volatile than large cap firms. Security holdings in the fund can vary significantly from broad market indexes.
Parnassus Fixed Income Fund: Bond prices are inversely related to interest rates. As interest rates drop, bond prices will increase, and as interest rates go up, the price of bonds will decrease. A security’s value may also be affected by the possibility that issuers of debt obligations will not pay the Fund interest or principal, or that their credit rating may be downgraded by a ratings agency. In addition, up to 20% of the Fund’s total net assets may be invested in convertible securities, which may not have an investment-grade rating. This would make them riskier than securities with an investment-grade rating.
Parnassus Growth Equity Fund and Parnassus Mid Cap Growth Fund: The adviser may be wrong in its assessment of a company’s potential for growth, and the growth stocks the fund holds may not grow as the advisor anticipates. In addition, there are periods when investing in growth stocks falls out of favor with investors and these stocks may underperform.
Parnassus Mid Cap and Parnassus Mid Cap Growth Funds: The Fund invests in small and/or mid cap growth companies, which are generally riskier than larger companies, and the Fund’s share price may be more volatile than funds that invest in larger companies.
ENVIRONMENTAL, SOCIAL, AND GOVERNANCE GUIDELINES: The Fund evaluates ESG factors as part of the investment decision-making process, considering a range of impacts they may have on future revenues, expenses, assets, liabilities and overall risk. The Fund also utilizes active ownership to encourage more sustainable business policies and practices and greater ESG transparency. Active ownership strategies include proxy voting, dialogue with company management and sponsorship of shareholder resolutions, and public policy advocacy. There is no guarantee that the ESG strategy will be successful.
Performance data quoted represent past performance and are no guarantee of future returns. Current performance may be lower or higher than the performance data quoted, and current performance information to the most recent month end is available on the Parnassus website (www.parnassus.com). Investment return and principal value will fluctuate, so an investor’s shares, when redeemed, may be worth more or less than their original principal cost.
Before investing, an investor should carefully consider the investment objectives, risks, charges and expenses of the Fund and should carefully read the prospectus or summary prospectus, which contain this and other information. The prospectus or summary prospectus can be obtained on the Parnassus website or by calling (800) 999-3505.
Investment Adviser
Parnassus Investments, LLC
1 Market Street, Suite 1600
San Francisco, CA 94105
Independent Registered Public Accounting Firm
PricewaterhouseCoopers LLP
405 Howard Street, Suite 600
San Francisco, CA 94105
Legal Counsel
Ropes & Gray LLP
3 Embarcadero Center
San Francisco, CA 94111
Distributor
Parnassus Funds Distributor, LLC
Three Canal Plaza, Suite 100
Portland, ME 04101

Sign up for electronic delivery of prospectuses, shareholder reports
and account statements at www.parnassus.com
If you do not hold your account directly with Parnassus, please contact
the firm that holds your account to inquire about electronic delivery.

© 2025 Parnassus Investments, LLC. All rights reserved. PARNASSUS, PARNASSUS INVESTMENTS, and PARNASSUS FUNDS are federally registered trademarks of Parnassus Investments, LLC. The Parnassus Funds are distributed by Parnassus Funds Distributor, LLC.
1 Market Street, Suite 1600 San Francisco, CA 94105^(800) 999-3505^www.parnassus.com
Item 8. Changes in and Disagreements with Accountants for Open-End Management Investment Companies.
Not applicable.
Item 9. Proxy Disclosures for Open-End Management Companies.
This information is included in materials filed under Item 7 of this form.
Item 10. Remuneration Paid to Directors, Officers, and Others of Open-End Management Companies.
This information is included in materials filed under Item 7 of this form.
Item 11. Statement Regarding Basis for Approval of Investment Advisory Contract.
This information is included in materials filed under Item 7 of this form.
Item 12. Disclosure of Proxy Voting Policies and Procedures for Closed-End Management Investment Companies.
Not applicable.
Item 13. Portfolio Managers of Closed-End Management Investment Companies.
Not applicable.
Item 14. Purchases of Equity Securities by Closed-End Management Investment Company and Affiliated Purchasers.
Not applicable.
Item 15. Submission of Matters to a Vote of Security Holders.
Not applicable.
Item 16. Controls and Procedures.
| (a) | The registrant’s certifying officers have reasonably designed such disclosure controls and procedures to ensure material information relating to the registrant is made known to them by others, particularly during the period in which this report is being prepared. The registrant’s certifying officers have determined that the registrant’s disclosure controls and procedures are effective based on their evaluation of these controls and procedures as of a date within 90 days prior to the filing date of this report. |
| (b) | There were no significant changes in the registrant’s internal controls over financial reporting, or in other factors that could significantly affect these controls, that occurred during the registrant’s fiscal half-year, including any corrective actions with regard to significant deficiencies and material weaknesses. |
Item 17. Disclosure of Securities Lending Activities for Closed-End Management Investment Companies.
Not applicable.
Item 18. Recovery of Erroneously Awarded Compensation.
Not applicable.
Item 19. Exhibits.
SIGNATURES
Pursuant to the requirements of the Securities Exchange Act of 1934 and the Investment Company Act of 1940, the Registrant has duly caused this report to be signed on its behalf by the undersigned, thereunto duly authorized.
| | |
(Registrant) Parnassus Funds and Parnassus Income Funds |
| |
| By: | | (Signature and Title) |
|
/s/ Benjamin E. Allen |
| Benjamin E. Allen |
| Title: | | President and Principal Executive Officer |
| Date: | | February 14, 2025 |
Pursuant to the requirements of the Securities Exchange Act of 1934 and the Investment Company Act of 1940, this report has been signed below by the following persons on behalf of the Registrant and in the capacities and on the dates indicated.
| | |
| By: | | (Signature and Title) |
|
/s/ Benjamin E. Allen |
| Benjamin E. Allen |
| Title: | | President and Principal Executive Officer |
| Date: | | February 14, 2025 |
| |
| By: | | (Signature and Title) |
|
/s/ Marc C. Mahon |
| Marc C. Mahon |
| Title: | | Treasurer and Principal Financial Officer |
| Date: | | February 14, 2025 |