UNITED STATES
SECURITIES AND EXCHANGE COMMISSION
WASHINGTON, D.C. 20549
FORM N-CSR
CERTIFIED SHAREHOLDER REPORT OF REGISTERED
MANAGEMENT INVESTMENT COMPANIES
Investment Company Act file number 811-4054
Oppenheimer AMT - Free New York Municipals
(Exact name of registrant as specified in charter)
6803 South Tucson Way, Centennial, Colorado 80112-3924
(Address of principal executive offices) (Zip code)
Arthur S. Gabinet
OppenheimerFunds, Inc.
Two World Financial Center, New York, New York 10281-1008
(Name and address of agent for service)
Registrant’s telephone number, including area code: (303) 768-3200
Date of fiscal year end: September 30
Date of reporting period: 9/28/2012
Item 1. Reports to Stockholders.
September 30, 2012
| | | | |
| | | Oppenheimer AMT-Free New York Municipals | | Management Commentary and Annual Report |

MANAGEMENT COMMENTARY
An Interview with Your Fund’s Portfolio Managers
ANNUAL REPORT
Listing of Top Holdings
Fund Performance Discussion
Financial Statements
“We hope that the recent strength of the municipal bond market has renewed investors’ confidence in the market’s powerful ability to help investors earn tax-advantaged income.”
Dan Loughran, Senior Vice President, Senior Portfolio Manager and Team Leader, OppenheimerFunds/Rochester

TOP HOLDINGS AND ALLOCATIONS
| | | | |
| |
Top Ten Categories
| |
| |
Tobacco-Master Settlement Agreement
| |
| 19.5
| %
|
Higher Education
| |
| 13.4
|
|
Sales Tax Revenue
| |
| 9.9
|
|
General Obligation
| |
| 8.2
|
|
Electric Utilities
| |
| 7.6
|
|
Hospital/Healthcare
| |
| 6.9
|
|
Not-for-Profit Organizations
| |
| 5.2
|
|
Real Estate
| |
| 5.0
|
|
Highways/Commuter Facilities
| |
| 3.8
|
|
| Water Utilities | | | 3.5 | |
|
| Portfolio holdings are subject to change. Percentages are as of September 28, 2012, the last business day of the Fund’s fiscal year, and are based on total assets. | |
| | |
| |
Credit Rating Breakdown
| | NRSRO Only Total
|
| | | | |
AAA
| |
| 6.3
| %
|
AA
| |
| 22.9
|
|
A
| |
| 15.2
|
|
BBB
| |
| 26.6
|
|
BB and lower
| |
| 14.5
|
|
Unrated
| |
| 14.5
|
|
| Total | | | 100.0 | % |
|
| The percentages above are based on the market value of the Fund’s securities as of September 28, 2012, the last business day of the Fund’s fiscal year, and are subject to change. All securities except for those labeled “unrated” have been rated by at least one Nationally Recognized Statistical Rating Organization (“NRSRO”), such as Standard & Poor’s (“S&P”). For securities rated only by an NRSRO other than S&P, OppenheimerFunds, Inc. (the “Manager”) converts that rating to the equivalent S&P rating. If two or more NRSROs have assigned a rating to a security, the highest rating is used. Unrated securities do not necessarily indicate low credit quality. | |
|
| For the purposes of this Credit Allocation table, “investment-grade” securities are securities rated within the NRSROs’ four highest rating categories, which include AAA, AA, A and BBB. Securities not rated by an NRSRO may or may not be equivalent of investment grade. For further details, please consult the Fund’s prospectus or Statement of Additional Information. | |
| | | | |
| 10 | | | | OPPENHEIMER AMT-FREE NEW YORK MUNICIPALS |
FUND PERFORMANCE DISCUSSION
How has the Fund performed? Below is a discussion by OppenheimerFunds, Inc., of the Fund’s performance during its fiscal year ended September 28, 2012, followed by a graphical comparison of the Fund’s performance to appropriate broad-based market indices.1
Management’s Discussion of Fund Performance. In the reporting period ended September 28, 2012, Oppenheimer AMT-Free New York Municipals benefited from a rally in the municipal market and produced an annual total return of 14.20% at net asset value (8.78% with sales charge).
The charts on pages 15 to 18 show the Fund’s performance. We encourage investors to remain focused on their personal financial objectives, and we believe that this Fund’s investments offer structural advantages that can help shareholders achieve their investment goals over the long term.
Securities issued in the Commonwealth of Puerto Rico, which are exempt from federal, state and local income taxes, represented 21.0% of the Fund’s net assets at the end of this reporting period. The Fund’s holdings come from many different sectors—among them sales tax revenue, tobacco and various utilities—as well as general obligation debt. Most of the Fund’s investments in the securities issued in Puerto Rico are supported by taxes and other revenues and are designed to help finance electric utilities, highways and education.
During this reporting period, the market continued to react favorably to better fiscal management under the leadership of Gov. Luis Fortuño.2 This discipline has helped Puerto Rico significantly reduce pressure on its municipal bonds. The administration proposed another deficit budget for the fiscal year that began July 1, 2012, but has lowered the size of the deficit relative to spending considerably in recent years.
Bond issuance remained strong this reporting period, despite concerns over credit quality. The ratings agencies have also raised concerns about the potential for Puerto Rico’s fiscal environment to delay structurally balanced budgets in the near future. During this reporting period, both S&P and Moody’s revised their outlooks on general obligation debt issued by the Commonwealth. As of September 28, 2012, Puerto Rico general obligation debt had investment-grade ratings from Standard & Poor’s, Moody’s Investors Service and Fitch Ratings; the outlook from Fitch was stable, while S&P and Moody’s held negative outlooks. While Puerto Rico still faces challenges related to its economic difficulties, we continue to remain confident in the Commonwealth’s ability to collect taxes and make its bond payments. The Fund’s Puerto Rico holdings contributed positively to the Fund’s total return this reporting period.
1. September 28, 2012, was the last business day of the Fund’s 2012 fiscal year.
2. On November 6, 2012, Gov. Fortuño lost the election to Alejandro Garcia Padilla.
| | | | |
| 11 | | | | OPPENHEIMER AMT-FREE NEW YORK MUNICIPALS |
FUND PERFORMANCE DISCUSSION
The Fund continued to be invested this reporting period in bonds backed by proceeds from the tobacco Master Settlement Agreement (the MSA), the national litigation settlement with U.S. tobacco manufacturers. At the end of this reporting period, MSA-backed tobacco bonds accounted for 19.5% of the Fund’s total assets and contributed positively to Fund performance.3
As in prior reporting periods, the tobacco bonds this Fund held during this reporting period made all scheduled payments of interest and principal on time and in full. Our long-term view of the sector remains bullish and, given attractive valuations, we will likely continue to hold a greater percentage of tobacco bonds in our portfolios than our peers. We believe that this sector will continue to provide high levels of tax-free income to the long-term benefit of our yield-seeking investors.
The Fund continued to favor the higher education sector this reporting period, which represented 13.4% of the Fund’s total assets and contributed positively to its total return. The investment-grade bonds we hold in this sector have regularly provided high levels of tax-free income with what we believe to be far less credit risk than their external ratings would suggest.
The Fund’s holdings in municipal bonds issued by utilities represented 11.1% of total assets at the end of this reporting period and contributed positively to Fund performance. This set of holdings as of September 28, 2012, included electric utilities with 7.6% and water utilities with 3.5%. Our holdings in this sector consist of securities in the mid-range of the credit spectrum, and the overall fundamentals in these sectors remained stable this reporting period.
As of March 30, 2012, the Fund’s holdings in the sales tax revenue sector represented 9.9% of the Fund’s total assets and were positive contributors to the Fund’s performance. Debt-service payments on securities in this sector are paid using the issuing municipality’s sales tax revenues. An investment in this sector requires Fund managers to consider the economic conditions that a municipality has experienced and will likely experience, as well as the aggregate face value of the sales tax revenue bonds being issued relative to the municipality’s historic and likely sales tax balances.
3. Investments in “tobacco bonds,” which are backed by the proceeds a state or territory receives from the 1998 national litigation settlement with tobacco manufacturers, may be vulnerable to economic and/or legislative events that affect issuers in a particular municipal market sector. Annual payments by MSA-participating manufacturers, for example, hinge on many factors, including annual domestic cigarette shipments, inflation and the relative market share of non-participating manufacturers. To date, we believe consumption figures remain within an acceptable range of the assumptions used to structure MSA bonds. Future MSA payments could be reduced if consumption were to fall more rapidly than originally forecast.
| | | | |
| 12 | | | | OPPENHEIMER AMT-FREE NEW YORK MUNICIPALS |
General obligation debt backed by the full faith and taxing authority of the state and local governments represented 8.2% of the Fund’s total assets as of September 28, 2012, and also made a positive contribution to Fund performance. While many municipalities faced budget challenges this reporting period, elected officials consistently safeguarded the debt service payments on their general obligation bonds
As of September 28, 2012, the Fund was invested in the hospital/healthcare sector, representing 6.9% of the Fund’s total assets. Our holdings in this sector consist of securities across the credit spectrum. The sector remained in the news this reporting period as politicians, lobbyists, activists and others continued to argue about the constitutionality of the Affordable Care Act of 2010. On June 28, 2012, the Supreme Court upheld the “individual mandate,” which was considered the most controversial element of the Act. Immediately after the court’s ruling, some politicians suggested that Congress would revisit and perhaps seek to override the legislation. The results of the presidential election will likely hold the key to the legislation’s future.4 We continue to maintain that our disciplined, security-specific approach to credit research can uncover many potentially advantageous opportunities for the Fund in this and other sectors. The hospital/healthcare sector contributed positively to the Fund’s total return this reporting period.
This Fund, which invests primarily in investment-grade municipal securities, may invest up to 25% of its total assets in below-investment grade securities, or “junk” bonds; the percentage of assets is measured at the time of purchase and the credit quality of the securities is based on a Nationally Recognized Statistical Rating Organization (“NRSRO”) ratings or, if no NRSRO rating, on internal ratings.
Our approach to municipal bond investing is flexible and responsive to market conditions. Shareholders should note that market conditions during this reporting period did not affect the Fund’s overall investment objectives or cause it to pay any capital gain distributions. In closing, we believe that the Fund’s structure and sector composition as well as our time-tested strategies will continue to benefit long-term investors through interest rate and economic cycles.
Comparing the Fund’s Performance to the Market. The graphs that follow show the performance of a hypothetical $10,000 investment in each Class of shares of the Fund held until September 28, 2012. In the case of Class A, Class B and Class C shares, performance is measured over a ten-fiscal-year period. In the case of Class Y shares, performance is measured from inception of the Class on January 31, 2011. The Fund’s performance reflects the deduction of the maximum initial sales charge on Class A shares, the applicable contingent deferred sales charge on Class B and Class C shares, and reinvestments of all dividends and capital gains distributions.
4. Since Election Day, which occurred after the end of this reporting period, the expectation is that there will be no further challenges to the Affordable Care Act.
| | | | |
| 13 | | | | OPPENHEIMER AMT-FREE NEW YORK MUNICIPALS |
FUND PERFORMANCE DISCUSSION
The Fund’s performance is compared to the performance of the Barclays Capital Municipal Bond Index, an unmanaged index of a broad range of investment grade municipal bonds that is widely regarded as a measure of the performance of the general municipal bond market and the Consumer Price Index, a non-securities index that measures change in the inflation rate. Index performance reflects the reinvestment of dividends but does not consider the effect of capital gains or transaction costs, and none of the data in the graphs that follow shows the effect of taxes. The Fund’s performance reflects the effects of Fund business and operating expenses. While index comparisons may be useful to provide a benchmark for the Fund’s performance, it must be noted that the Fund’s investments are not limited to the securities comprising the indices.
| | | | |
| 14 | | | | OPPENHEIMER AMT-FREE NEW YORK MUNICIPALS |
FUND PERFORMANCE DISCUSSION
Class A Shares
Comparison of Change in Value of $10,000 Hypothetical Investments in:
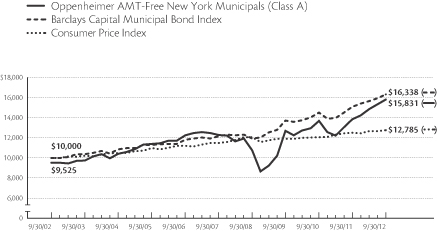
Average Annual Total Returns of Class A Shares With Sales Charge of the Fund at 9/28/121
1-Year 8.78% 5-Year 4.17% 10-Year 4.67%
The performance data quoted represents past performance, which does not guarantee future results. The investment return and principal value of an investment in the Fund will fluctuate so that an investor’s shares, when redeemed, may be worth more or less than their original cost. Current performance may be lower or higher than the performance quoted. Returns do not consider capital gains or income taxes on an individual’s investment. For performance data current to the most recent month-end, visit oppenheimerfunds.com or call 1.800.CALL OPP (225.5677). Fund returns include changes in share price, reinvestment of dividends and capital gains, and the applicable sales charge: for Class A shares, the current maximum initial sales charge of 4.75%; for Class B shares, the contingent deferred sales charge of 5% (1-year) and 2% (5-year); and for Class C shares, the contingent deferred sales charge of 1% for the 1-year period. There is no sales charge for Class Y shares. Because Class B shares convert to Class A shares 72 months after purchase, the 10-year return for Class B shares uses Class A performance for the period after conversion. See page 19 for further information.
1. September 28, 2012 was the last business day of the Fund’s fiscal year. See Note 1 of the accompanying Notes to Financial Statements. Index returns are calculated through September 30, 2012.
| | | | |
| 15 | | | | OPPENHEIMER AMT-FREE NEW YORK MUNICIPALS |
FUND PERFORMANCE DISCUSSION
Class B Shares
Comparison of Change in Value of $10,000 Hypothetical Investments in:
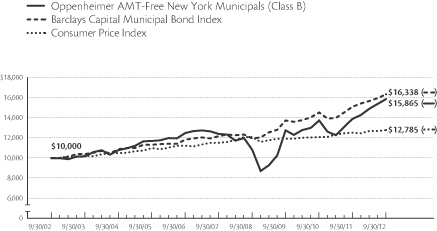
Average Annual Total Returns of Class B Shares With Sales Charge of the Fund at 9/28/121
1-Year 8.34% 5-Year 3.98% 10-Year 4.69%
| | | | |
| 16 | | | | OPPENHEIMER AMT-FREE NEW YORK MUNICIPALS |
Class C Shares
Comparison of Change in Value of $10,000 Hypothetical Investments in:

Average Annual Total Returns of Class C Shares With Sales Charge of the Fund at 9/28/121
1-Year 12.42% 5-Year 4.39% 10-Year 4.37%
The performance data quoted represents past performance, which does not guarantee future results. The investment return and principal value of an investment in the Fund will fluctuate so that an investor’s shares, when redeemed, may be worth more or less than their original cost. Current performance may be lower or higher than the performance quoted. Returns do not consider capital gains or income taxes on an individual’s investment. For performance data current to the most recent month-end, visit oppenheimerfunds.com or call 1.800.CALL OPP (225.5677). Fund returns include changes in share price, reinvestment of dividends and capital gains, and the applicable sales charge: for Class A shares, the current maximum initial sales charge of 4.75%; for Class B shares, the contingent deferred sales charge of 5% (1-year) and 2% (5-year); and for Class C shares, the contingent deferred sales charge of 1% for the 1-year period. There is no sales charge for Class Y shares. Because Class B shares convert to Class A shares 72 months after purchase, the 10-year return for Class B shares uses Class A performance for the period after conversion. See page 19 for further information.
1. September 28, 2012 was the last business day of the Fund’s fiscal year. See Note 1 of the accompanying Notes to Financial Statements. Index returns are calculated through September 30, 2012.
| | | | |
| 17 | | | | OPPENHEIMER AMT-FREE NEW YORK MUNICIPALS |
FUND PERFORMANCE DISCUSSION
Class Y Shares
Comparison of Change in Value of $10,000 Hypothetical Investments in:
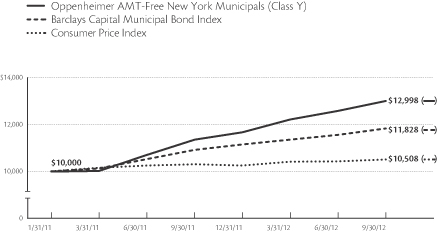
Cumulative Total Return of Class Y Shares of the Fund at 9/28/121
1-Year 14.43% 5-Year N/A Since Inception (1/31/11) 17.13%
The performance data quoted represents past performance, which does not guarantee future results. The investment return and principal value of an investment in the Fund will fluctuate so that an investor’s shares, when redeemed, may be worth more or less than their original cost. Current performance may be lower or higher than the performance quoted. Returns do not consider capital gains or income taxes on an individual’s investment. For performance data current to the most recent month-end, visit oppenheimerfunds.com or call 1.800.CALL OPP (225.5677). Fund returns include changes in share price, reinvestment of dividends and capital gains, and the applicable sales charge: for Class A shares, the current maximum initial sales charge of 4.75%; for Class B shares, the contingent deferred sales charge of 5% (1-year) and 2% (5-year); and for Class C shares, the contingent deferred sales charge of 1% for the 1-year period. There is no sales charge for Class Y shares. Because Class B shares convert to Class A shares 72 months after purchase, the 10-year return for Class B shares uses Class A performance for the period after conversion. See page 19 for further information.
1. September 28, 2012 was the last business day of the Fund’s fiscal year. See Note 1 of the accompanying Notes to Financial Statements. Index returns are calculated through September 30, 2012.
| | | | |
| 18 | | | | OPPENHEIMER AMT-FREE NEW YORK MUNICIPALS |
NOTES
Total returns and the ending account values in the graphs include changes in share price and reinvestment of dividends and capital gains distributions in a hypothetical investment for the periods shown. The Fund’s total returns shown do not reflect the deduction of income taxes on an individual’s investment. Taxes may reduce your actual investment returns on any gains you may realize if you sell your shares.
This annual report must be preceded or accompanied by the current prospectus of Oppenheimer AMT-Free New York Municipals. Before investing in any of the Oppenheimer funds, investors should carefully consider a fund’s investment objectives, risks, charges and expenses. Fund prospectuses and summary prospectuses contain this and other information about the funds, and may be obtained by asking your financial advisor, visiting oppenheimerfunds.com, or calling 1.800.CALL OPP (225.5677). Read prospectuses and summary prospectuses carefully before investing.
The Fund’s investment strategy and focus can change over time. The mention of specific fund holdings does not constitute a recommendation by OppenheimerFunds, Inc.
Class A shares were first publicly offered on 8/16/84. Unless otherwise noted, Class A returns include the current maximum initial sales charge of 4.75%.
Class B shares of the Fund were first publicly offered on 3/1/93. Unless otherwise noted, Class B returns include the applicable contingent deferred sales charge of 5% (1-year) and 2% (5-year). Because Class B shares convert to Class A shares 72 months after purchase, the 10-year return for Class B shares uses Class A performance for the period after conversion. Class B shares are subject to an annual 0.75% asset-based sales charge.
Class C shares of the Fund were first publicly offered on 8/29/95. Unless otherwise noted, Class C returns include the contingent deferred sales charge of 1% for the 1-year period. Class C shares are subject to an annual 0.75% asset-based sales charge.
Class Y shares of the Fund were first publicly offered on 1/31/11. Class Y shares are offered only to fee-based clients of dealers that have a special agreement with the Distributor, to certain institutional investors under a special agreement with the Distributor, and to present or former officers, directors, trustees or employees (and their eligible family members) of the Fund, the Manager, its affiliates, its parent company and the subsidiaries of its parent company, and retirement plans established for the benefit of such individuals. There is no sales charge for Class Y shares.
| | | | |
| 19 | | | | OPPENHEIMER AMT-FREE NEW YORK MUNICIPALS |
FUND EXPENSES
Fund Expenses. As a shareholder of the Fund, you incur two types of costs: (1) transaction costs, which may include sales charges (loads) on purchase payments, contingent deferred sales charges on redemptions and (2) ongoing costs, including management fees; distribution and service fees; and other Fund expenses. These examples are intended to help you understand your ongoing costs (in dollars) of investing in the Fund and to compare these costs with the ongoing costs of investing in other mutual funds.
The examples are based on an investment of $1,000.00 invested at the beginning of the period and held for the entire 6-month period ended September 28, 2012.
Actual Expenses. The first section of the table provides information about actual account values and actual expenses. You may use the information in this section for the class of shares you hold, together with the amount you invested, to estimate the expense that you paid over the period. Simply divide your account value by $1,000.00 (for example, an $8,600.00 account value divided by $1,000.00 = 8.60), then multiply the result by the number in the first section under the heading entitled “Expenses Paid During Period” to estimate the expenses you paid on your account during this period.
Hypothetical Example for Comparison Purposes. The second section of the table provides information about hypothetical account values and hypothetical expenses based on the Fund’s actual expense ratio for each class of shares, and an assumed rate of return of 5% per year for each class before expenses, which is not the actual return. The hypothetical account values and expenses may not be used to estimate the actual ending account balance or expenses you paid for the period. You may use this information to compare the ongoing costs of investing in the Fund and other funds. To do so, compare this 5% hypothetical example for the class of shares you hold with the 5% hypothetical examples that appear in the shareholder reports of the other funds.
Please note that the expenses shown in the table are meant to highlight your ongoing costs only and do not reflect any transactional costs, such as front-end or contingent deferred sales charges (loads), or a $12.00 fee imposed annually on accounts valued at less than $500.00 (subject to exceptions described in the Statement of Additional Information). Therefore, the “hypothetical” section of the table is useful in comparing ongoing costs only, and will not help you determine the relative total costs of owning different funds. In addition, if these transactional costs were included, your costs would have been higher.
| | | | |
| 20 | | | | OPPENHEIMER AMT-FREE NEW YORK MUNICIPALS |
| | | | | | | | | | | | |
| Actual | | Beginning
Account
Value
April 1, 2012 | | | Ending
Account
Value
September 28, 2012 | | | Expenses
Paid During
6 Months Ended
September 28, 2012 | |
| Class A | | $ | 1,000.00 | | | $ | 1,063.20 | | | $ | 4.86 | |
| Class B | | | 1,000.00 | | | | 1,058.70 | | | | 9.20 | |
| Class C | | | 1,000.00 | | | | 1,059.10 | | | | 8.84 | |
| Class Y | | | 1,000.00 | | | | 1,064.30 | | | | 3.68 | |
| | | |
Hypothetical
(5% return before expenses) | | | | | | | | | |
| Class A | | | 1,000.00 | | | | 1,020.03 | | | | 4.77 | |
| Class B | | | 1,000.00 | | | | 1,015.83 | | | | 9.04 | |
| Class C | | | 1,000.00 | | | | 1,016.17 | | | | 8.68 | |
| Class Y | | | 1,000.00 | | | | 1,021.17 | | | | 3.61 | |
Expenses are equal to the Fund’s annualized expense ratio for that class, multiplied by the average account value over the period, multiplied by 181/366 (to reflect the one-half year period). Those annualized expense ratios based on the 6-month period ended September 28, 2012 are as follows:
| | | | |
| Class | | Expense Ratios | |
| Class A | | | 0.95 | % |
| Class B | | | 1.80 | |
| Class C | | | 1.73 | |
| Class Y | | | 0.72 | |
The expense ratios reflect voluntary waivers and/or reimbursements of expenses by the Fund’s Manager. Some of these undertakings may be modified or terminated at any time, as indicated in the Fund’s prospectus. The “Financial Highlights” tables in the Fund’s financial statements, included in this report, also show the gross expense ratios, without such waivers or reimbursements and reduction to custodian expenses, if applicable.
| | | | |
| 21 | | | | OPPENHEIMER AMT-FREE NEW YORK MUNICIPALS |
STATEMENT OF INVESTMENTS September 28, 2012*
| | | | | | | | | | | | | | | | |
Principal
Amount | | | | | Coupon | | | Maturity | | | Value | |
| | Municipal Bonds and Notes—111.4% | | | | | | | | | | | | |
| | New York—86.6% | | | | | | | | | | | | |
| | $ 700,000 | | | Albany County, NY IDA (Albany College of Pharmacy) | | | 5.625 | % | | | 12/01/2034 | | | $ | 720,776 | |
| | 200,000 | | | Albany County, NY IDA (Wildwood Programs) | | | 4.900 | | | | 07/01/2021 | | | | 198,580 | |
| | 125,000 | | | Albany County, NY IDA (Wildwood Programs) | | | 5.000 | | | | 07/01/2026 | | | | 121,311 | |
| | 500,000 | | | Albany, NY Capital Resource Corp. (College Saint Rose)1 | | | 5.375 | | | | 07/01/2026 | | | | 551,120 | |
| | 500,000 | | | Albany, NY Capital Resource Corp. (College Saint Rose)1 | | | 5.625 | | | | 07/01/2031 | | | | 551,345 | |
| | 1,000,000 | | | Albany, NY Capital Resource Corp. (College Saint Rose)1 | | | 5.875 | | | | 07/01/2041 | | | | 1,109,240 | |
| | 2,900,000 | | | Albany, NY IDA (Albany Law School)1 | | | 5.000 | | | | 07/01/2031 | | | | 3,016,696 | |
| | 560,000 | | | Albany, NY IDA (Albany Law School)1 | | | 5.000 | | | | 07/01/2037 | | | | 578,127 | |
| | 285,000 | | | Albany, NY IDA (Brighter Choice Charter School) | | | 5.000 | | | | 04/01/2027 | | | | 286,827 | |
| | 150,000 | | | Albany, NY IDA (Brighter Choice Charter School) | | | 5.000 | | | | 04/01/2032 | | | | 150,179 | |
| | 100,000 | | | Albany, NY IDA (Brighter Choice Charter School) | | | 5.000 | | | | 04/01/2037 | | | | 97,517 | |
| | 14,325,885 | | | Albany, NY IDA (Charitable Leadership)2 | | | 5.750 | | | | 07/01/2026 | | | | 7,156,926 | |
| | 987,992 | | | Albany, NY IDA (Charitable Leadership)3 | | | 6.000 | | | | 07/01/2019 | | | | 493,591 | |
| | 100,000 | | | Albany, NY IDA (New Covenant Charter School)3 | | | 7.000 | | | | 05/01/2025 | | | | 15,000 | |
| | 670,000 | | | Albany, NY IDA (Sage Colleges)1 | | | 5.250 | | | | 04/01/2019 | | | | 670,013 | |
| | 3,765,000 | | | Albany, NY IDA (Sage Colleges)1 | | | 5.300 | | | | 04/01/2029 | | | | 3,636,463 | |
| | 1,000,000 | | | Albany, NY IDA (St. Peter’s Hospital) | | | 5.500 | | | | 11/15/2027 | | | | 1,102,810 | |
| | 1,380,000 | | | Albany, NY IDA, Series B | | | 5.750 | | | | 11/15/2032 | | | | 1,538,659 | |
| | 1,365,000 | | | Albany, NY IDA, Series D | | | 5.750 | | | | 11/15/2027 | | | | 1,528,158 | |
| | 4,550,000 | | | Amherst, NY IDA (Beechwood Health Care Center) | | | 5.200 | | | | 01/01/2040 | | | | 4,365,407 | |
| | 5,895,000 | | | Brookhaven, NY IDA (Alternatives for Children) | | | 7.550 | | | | 02/01/2033 | | | | 6,612,834 | |
| | 9,235,000 | | | Brookhaven, NY IDA (Dowling College)1 | | | 6.750 | | | | 11/01/2032 | | | | 9,426,719 | |
| | 350,000 | | | Broome County, NY IDA (University Plaza) | | | 5.200 | | | | 08/01/2030 | | | | 350,826 | |
| | 250,000 | | | Broome County, NY IDA (University Plaza) | | | 5.200 | | | | 08/01/2036 | | | | 248,630 | |
| | 270,000 | | | Buffalo & Erie County, NY Industrial Land Devel. (Buffalo State College Foundation Hsg. Corp.)1 | | | 5.375 | | | | 10/01/2041 | | | | 311,156 | |
| | 130,000 | | | Buffalo & Erie County, NY Industrial Land Devel. (Buffalo State College Foundation Hsg. Corp.)1 | | | 6.000 | | | | 10/01/2031 | | | | 159,917 | |
| | 140,000 | | | Build NYC Resource Corp. (YMCA of Greater New York)1 | | | 5.000 | | | | 08/01/2032 | | | | 159,919 | |
| | 300,000 | | | Bushnell Basin, NY Fire Assoc. (Volunteer Fire Dept.) | | | 5.750 | | | | 11/01/2030 | | | | 302,895 | |
| | 25,000 | | | Canandaigua & Bristol, NY GO | | | 5.000 | | | | 12/15/2027 | | | | 27,201 | |
| | 30,000 | | | Canandaigua & Bristol, NY GO | | | 5.000 | | | | 12/15/2028 | | | | 32,565 | |
| | 30,000 | | | Canandaigua & Bristol, NY GO | | | 5.000 | | | | 12/15/2029 | | | | 32,535 | |
| | 30,000 | | | Canandaigua & Bristol, NY GO | | | 5.000 | | | | 12/15/2030 | | | | 32,505 | |
| | | | |
| 22 | | | | OPPENHEIMER AMT-FREE NEW YORK MUNICIPALS |
| | | | | | | | | | | | | | | | |
Principal
Amount | | | | | Coupon | | | Maturity | | | Value | |
| | New York Continued | | | | | | | | | | | | |
| | $ 35,000 | | | Canandaigua & Bristol, NY GO | | | 5.000 | % | | | 12/15/2031 | | | $ | 37,888 | |
| | 35,000 | | | Canandaigua & Bristol, NY GO | | | 5.000 | | | | 12/15/2032 | | | | 37,871 | |
| | 35,000 | | | Canandaigua & Bristol, NY GO | | | 5.000 | | | | 12/15/2033 | | | | 37,923 | |
| | 40,000 | | | Canandaigua & Bristol, NY GO | | | 5.000 | | | | 12/15/2034 | | | | 43,340 | |
| | 40,000 | | | Canandaigua & Bristol, NY GO | | | 5.000 | | | | 12/15/2035 | | | | 43,281 | |
| | 45,000 | | | Canandaigua & Bristol, NY GO | | | 5.000 | | | | 12/15/2036 | | | | 48,646 | |
| | 45,000 | | | Canandaigua & Bristol, NY GO | | | 5.000 | | | | 12/15/2037 | | | | 48,623 | |
| | 50,000 | | | Canandaigua & Bristol, NY GO | | | 5.000 | | | | 12/15/2038 | | | | 53,877 | |
| | 50,000 | | | Canandaigua & Bristol, NY GO | | | 5.000 | | | | 12/15/2039 | | | | 53,753 | |
| | 55,000 | | | Canandaigua & Bristol, NY GO | | | 5.000 | | | | 12/15/2040 | | | | 59,020 | |
| | 55,000 | | | Canandaigua & Bristol, NY GO | | | 5.000 | | | | 12/15/2041 | | | | 58,939 | |
| | 60,000 | | | Canandaigua & Bristol, NY GO | | | 5.000 | | | | 12/15/2042 | | | | 64,178 | |
| | 200,000 | | | Cattaraugus County, NY IDA (St. Bonaventure University)1 | | | 5.000 | | | | 05/01/2023 | | | | 208,252 | |
| | 520,000 | | | Cattaraugus County, NY IDA (St. Bonaventure University)1 | | | 5.100 | | | | 05/01/2031 | | | | 534,212 | |
| | 1,185,000 | | | Cayuga County, NY COP (Auburn Memorial Hospital) | | | 6.000 | | | | 01/01/2021 | | | | 1,186,718 | |
| | 130,000 | | | Coeymans, NY Fire District | | | 5.000 | | | | 10/15/2024 | | | | 138,453 | |
| | 135,000 | | | Coeymans, NY Fire District | | | 5.000 | | | | 10/15/2025 | | | | 143,595 | |
| | 140,000 | | | Coeymans, NY Fire District | | | 5.000 | | | | 10/15/2026 | | | | 148,870 | |
| | 1,040,000 | | | Colonie, NY GO1 | | | 6.000 | | | | 04/01/2032 | | | | 1,193,629 | |
| | 840,000 | | | Colonie, NY GO1 | | | 6.000 | | | | 04/01/2033 | | | | 961,338 | |
| | 15,000 | | | Deerfield, NY GO | | | 5.500 | | | | 06/15/2021 | | | | 16,226 | |
| | 15,000 | | | Deerfield, NY GO | | | 5.500 | | | | 06/15/2022 | | | | 16,146 | |
| | 15,000 | | | Deerfield, NY GO | | | 5.500 | | | | 06/15/2023 | | | | 16,059 | |
| | 15,000 | | | Deerfield, NY GO | | | 5.500 | | | | 06/15/2024 | | | | 16,059 | |
| | 20,000 | | | Deerfield, NY GO | | | 5.500 | | | | 06/15/2025 | | | | 21,360 | |
| | 20,000 | | | Deerfield, NY GO | | | 5.600 | | | | 06/15/2026 | | | | 21,338 | |
| | 20,000 | | | Deerfield, NY GO | | | 5.600 | | | | 06/15/2027 | | | | 21,317 | |
| | 20,000 | | | Deerfield, NY GO | | | 5.600 | | | | 06/15/2028 | | | | 21,288 | |
| | 25,000 | | | Deerfield, NY GO | | | 5.600 | | | | 06/15/2029 | | | | 26,575 | |
| | 25,000 | | | Deerfield, NY GO | | | 5.600 | | | | 06/15/2030 | | | | 26,557 | |
| | 25,000 | | | Deerfield, NY GO | | | 5.600 | | | | 06/15/2031 | | | | 26,539 | |
| | 25,000 | | | Deerfield, NY GO | | | 5.600 | | | | 06/15/2032 | | | | 26,530 | |
| | 30,000 | | | Deerfield, NY GO | | | 5.600 | | | | 06/15/2033 | | | | 31,858 | |
| | 30,000 | | | Deerfield, NY GO | | | 5.600 | | | | 06/15/2034 | | | | 31,836 | |
| | 30,000 | | | Deerfield, NY GO | | | 5.600 | | | | 06/15/2035 | | | | 31,815 | |
| | 35,000 | | | Deerfield, NY GO | | | 5.600 | | | | 06/15/2036 | | | | 37,092 | |
| | | | |
| 23 | | | | OPPENHEIMER AMT-FREE NEW YORK MUNICIPALS |
STATEMENT OF INVESTMENTS Continued
| | | | | | | | | | | | | | | | |
Principal
Amount | | | | | Coupon | | | Maturity | | | Value | |
| | New York Continued | | | | | | | | | | | | |
| | $ 36,135,000 | | | Dutchess County, NY IDA (Bard College)1 | | | 5.000 | % | | | 08/01/2046 | | | $ | 38,010,045 | |
| | 8,085,000 | | | Dutchess County, NY IDA (Elant Fishkill) | | | 5.250 | | | | 01/01/2037 | | | | 7,543,952 | |
| | 570,000 | | | Dutchess County, NY Local Devel. Corp. (Anderson Center Services)1 | | | 6.000 | | | | 10/01/2030 | | | | 605,882 | |
| | 250,000 | | | Dutchess County, NY Local Devel. Corp. (Health Quest System)1 | | | 5.250 | | | | 07/01/2025 | | | | 288,945 | |
| | 450,000 | | | Dutchess County, NY Local Devel. Corp. (Health Quest System)1 | | | 5.750 | | | | 07/01/2030 | | | | 532,503 | |
| | 100,000 | | | Dutchess County, NY Local Devel. Corp. (Health Quest System)1 | | | 5.750 | | | | 07/01/2040 | | | | 116,606 | |
| | 1,230,000 | | | East Hampton, NY Town Hsg. Authority1 | | | 6.500 | | | | 05/01/2034 | | | | 1,461,548 | |
| | 265,000 | | | Erie County, NY IDA (Buffalo City School District)1 | | | 5.250 | | | | 05/01/2030 | | | | 313,267 | |
| | 225,000 | | | Erie County, NY IDA (Buffalo City School District)1 | | | 5.250 | | | | 05/01/2031 | | | | 264,857 | |
| | 135,000 | | | Erie County, NY IDA (Buffalo City School District)1 | | | 5.250 | | | | 05/01/2032 | | | | 158,019 | |
| | 500,000 | | | Erie County, NY IDA (Charter School Applied Tech)1 | | | 6.875 | | | | 06/01/2035 | | | | 529,035 | |
| | 1,330,000 | | | Erie County, NY IDA (DePaul Properties) | | | 5.750 | | | | 09/01/2028 | | | | 1,330,253 | |
| | 115,000 | | | Erie County, NY IDA (DePaul Properties) | | | 6.500 | | | | 09/01/2018 | | | | 118,542 | |
| | 195,000 | | | Erie County, NY IDA (Global Concepts Charter School) | | | 6.250 | | | | 10/01/2037 | | | | 198,422 | |
| | 5,600,000 | | | Erie County, NY IDA (Medaille College) | | | 7.625 | | | | 04/01/2035 | | | | 5,899,600 | |
| | 350,000 | | | Erie County, NY IDA (Orchard Park CCRC) | | | 5.000 | | | | 11/15/2014 | | | | 360,528 | |
| | 1,485,000 | | | Erie County, NY IDA (Orchard Park CCRC) | | | 5.125 | | | | 11/15/2016 | | | | 1,552,968 | |
| | 3,300,000 | | | Erie County, NY IDA (The Episcopal Church Home) | | | 5.875 | | | | 02/01/2018 | | | | 3,305,511 | |
| | 1,880,000 | | | Erie County, NY IDA (The Episcopal Church Home) | | | 6.000 | | | | 02/01/2028 | | | | 1,881,955 | |
| | 36,405,000 | | | Erie County, NY Tobacco Asset Securitization Corp. | | | 5.000 | | | | 06/01/2038 | | | | 27,937,197 | |
| | 29,515,000 | | | Erie County, NY Tobacco Asset Securitization Corp. | | | 5.000 | | | | 06/01/2045 | | | | 21,661,059 | |
| | 55,500,000 | | | Erie County, NY Tobacco Asset Securitization Corp. | | | 6.875 | 4 | | | 06/01/2050 | | | | 1,456,320 | |
| | 92,000,000 | | | Erie County, NY Tobacco Asset Securitization Corp. | | | 9.607 | 4 | | | 06/01/2055 | | | | 986,240 | |
| | 110,000 | | | Essex County, NY IDA (North Country Community College Foundation)1 | | | 5.300 | | | | 06/01/2035 | | | | 114,366 | |
| | 60,000 | | | Franklin County, NY IDA (North Country Community College Foundation)1 | | | 5.200 | | | | 06/01/2025 | | | | 63,086 | |
| | 815,000 | | | Genesee County, NY IDA (United Memorial Medical Center) | | | 5.000 | | | | 12/01/2027 | | | | 814,902 | |
| | 70,000 | | | Hempstead Village, NY GO1 | | | 5.000 | | | | 09/15/2025 | | | | 75,024 | |
| | 70,000 | | | Hempstead Village, NY GO1 | | | 5.000 | | | | 09/15/2026 | | | | 74,765 | |
| | 50,000 | | | Hempstead, NY IDA (Hofstra University)1 | | | 5.000 | | | | 07/01/2033 | | | | 50,661 | |
| | 410,000 | | | Hempstead, NY IDA (Peninsula Counseling Center) | | | 6.500 | | | | 11/01/2038 | | | | 406,773 | |
| | 4,840,000 | | | Hempstead, NY IDA (WORCA) | | | 6.900 | | | | 08/01/2033 | | | | 4,894,353 | |
| | 1,000,000 | | | Hempstead, NY Local Devel. Corp. (Molloy College)1 | | | 5.750 | | | | 07/01/2039 | | | | 1,141,740 | |
| | | | |
| 24 | | | | OPPENHEIMER AMT-FREE NEW YORK MUNICIPALS |
| | | | | | | | | | | | | | | | |
Principal
Amount | | | | | Coupon | | | Maturity | | | Value | |
| | New York Continued | | | | | | | | | | | | |
| | $ 1,790,000 | | | Herkimer County, NY IDA (Herkimer County College Foundation)1 | | | 6.250 | % | | | 08/01/2034 | | | $ | 1,812,357 | |
| | 8,045,000 | | | Hudson Yards, NY Infrastructure Corp. | | | 5.000 | | | | 02/15/2047 | | | | 8,530,516 | |
| | 3,400,000 | | | Hudson Yards, NY Infrastructure Corp. | | | 5.000 | | | | 02/15/2047 | | | | 3,612,296 | |
| | 5,600,000 | | | Hudson Yards, NY Infrastructure Corp. | | | 5.750 | | | | 02/15/2047 | | | | 6,623,680 | |
| | 2,420,000 | | | Islip, NY IDA (United Cerebral Palsy Assoc.) | | | 6.250 | | | | 12/01/2031 | | | | 2,392,049 | |
| | 280,000 | | | Islip, NY IDA (United Cerebral Palsy Assoc.) | | | 6.250 | | | | 12/01/2031 | | | | 276,766 | |
| | 5,000,000 | | | L.I., NY Power Authority | | | 6.000 | | | | 05/01/2033 | | | | 6,065,750 | |
| | 1,500,000 | | | L.I., NY Power Authority, Series A | | | 5.000 | | | | 09/01/2037 | | | | 1,693,290 | |
| | 9,000,000 | | | L.I., NY Power Authority, Series A | | | 5.000 | | | | 05/01/2038 | | | | 10,039,950 | |
| | 10,000,000 | | | L.I., NY Power Authority, Series A | | | 5.000 | | | | 09/01/2042 | | | | 11,208,200 | |
| | 4,850,000 | | | L.I., NY Power Authority, Series A | | | 5.750 | | | | 04/01/2039 | | | | 5,822,619 | |
| | 5,000,000 | | | L.I., NY Power Authority, Series A | | | 6.250 | | | | 04/01/2033 | | | | 6,261,300 | |
| | 2,000,000 | | | L.I., NY Power Authority, Series B | | | 5.000 | | | | 09/01/2029 | | | | 2,362,760 | |
| | 415,000 | | | Madison County, NY IDA (Commons II Student Hsg.)1 | | | 5.000 | | | | 06/01/2040 | | | | 426,728 | |
| | 5,000 | | | Monroe County, NY IDA (Cloverwood Senior
Living) | | | 6.000 | | | | 05/01/2013 | | | | 5,056 | |
| | 15,000 | | | Monroe County, NY IDA (Cloverwood Senior
Living) | | | 6.750 | | | | 05/01/2023 | | | | 15,105 | |
| | 350,000 | | | Monroe County, NY IDA (Rochester Institute of Technology)1 | | | 5.250 | | | | 04/01/2019 | | | | 350,249 | |
| | 705,000 | | | Monroe County, NY IDA (Rochester Institute of Technology)1 | | | 5.375 | | | | 04/01/2029 | | | | 705,360 | |
| | 200,000 | | | Monroe County, NY IDA (Summit at Brighton) | | | 5.375 | | | | 07/01/2032 | | | | 141,080 | |
| | 400,000 | | | Monroe County, NY IDA (Summit at Brighton) | | | 5.500 | | | | 07/01/2027 | | | | 307,896 | |
| | 150,000 | | | Monroe County, NY Industrial Devel. Corp. (Nazareth College of Rochester)1 | | | 5.000 | | | | 10/01/2026 | | | | 168,216 | |
| | 75,000 | | | Monroe County, NY Industrial Devel. Corp. (Nazareth College of Rochester)1 | | | 5.250 | | | | 10/01/2031 | | | | 84,726 | |
| | 325,000 | | | Monroe County, NY Industrial Devel. Corp. (Nazareth College of Rochester)1 | | | 5.500 | | | | 10/01/2041 | | | | 362,742 | |
| | 150,000 | | | Monroe County, NY Industrial Devel. Corp. (St. John Fisher College)1 | | | 5.625 | | | | 06/01/2026 | | | | 167,943 | |
| | 250,000 | | | Monroe County, NY Industrial Devel. Corp. (St. John Fisher College)1 | | | 6.000 | | | | 06/01/2034 | | | | 281,063 | |
| | 10,000,000 | | | Monroe County, NY Industrial Devel. Corp. (Unity Hospital Rochester)5 | | | 5.500 | | | | 08/15/2040 | | | | 11,602,900 | |
| | 4,475,000 | | | Monroe County, NY Industrial Devel. Corp. (Unity Hospital Rochester)5 | | | 5.750 | | | | 08/15/2035 | | | | 5,482,978 | |
| | 302,900,000 | | | Monroe County, NY Tobacco Asset Securitization Corp. (TASC) | | | 7.701 | 4 | | | 06/01/2061 | | | | 1,550,848 | |
| | | | |
| 25 | | | | OPPENHEIMER AMT-FREE NEW YORK MUNICIPALS |
STATEMENT OF INVESTMENTS Continued
| | | | | | | | | | | | | | | | |
Principal
Amount | | | | | Coupon | | | Maturity | | | Value | |
| | New York Continued | | | | | | | | | | | | |
| | $ 1,000,000 | | | Monroe, NY Newpower Corp1 | | | 5.625 | % | | | 01/01/2026 | | | $ | 1,022,330 | |
| | 4,000,000 | | | Monroe, NY Newpower Corp.1 | | | 5.500 | | | | 01/01/2034 | | | | 4,051,000 | |
| | 500,000 | | | Mount Vernon, NY IDA (Meadowview) | | | 6.200 | | | | 06/01/2029 | | | | 500,355 | |
| | 340,000 | | | Nassau County, NY IDA (ALIA-ACDS) | | | 6.125 | | | | 09/01/2018 | | | | 342,564 | |
| | 1,760,000 | | | Nassau County, NY IDA (ALIA-AP) | | | 7.000 | | | | 09/01/2028 | | | | 1,786,664 | |
| | 475,000 | | | Nassau County, NY IDA (ALIA-CMA) | | | 6.125 | | | | 09/01/2018 | | | | 478,582 | |
| | 525,000 | | | Nassau County, NY IDA (ALIA-CSMR) | | | 6.125 | | | | 09/01/2018 | | | | 528,959 | |
| | 330,000 | | | Nassau County, NY IDA (ALIA-EFLI) | | | 6.125 | | | | 09/01/2018 | | | | 332,488 | |
| | 200,000 | | | Nassau County, NY IDA (ALIA-HAII) | | | 6.125 | | | | 09/01/2018 | | | | 201,508 | |
| | 300,000 | | | Nassau County, NY IDA (ALIA-NCMRS) | | | 6.125 | | | | 09/01/2018 | | | | 302,262 | |
| | 180,000 | | | Nassau County, NY IDA (Amsterdam at Harborside) | | | 6.500 | | | | 01/01/2027 | | | | 122,515 | |
| | 4,330,000 | | | Nassau County, NY IDA (Amsterdam at Harborside) | | | 6.700 | | | | 01/01/2043 | | | | 2,888,456 | |
| | 185,000 | | | Nassau County, NY IDA (Hispanic Counseling Center) | | | 6.500 | | | | 11/01/2037 | | | | 183,588 | |
| | 2,485,000 | | | Nassau County, NY IDA (Hispanic Counseling Center) | | | 7.625 | | | | 06/01/2033 | | | | 2,553,710 | |
| | 35,000 | | | Nassau County, NY IDA (Life’s WORCA) | | | 5.950 | | | | 11/01/2022 | | | | 34,810 | |
| | 70,000 | | | Nassau County, NY IDA (United Veteran’s Beacon House) | | | 6.500 | | | | 11/01/2037 | | | | 69,466 | |
| | 475,000 | | | Nassau County, NY IDA, Series A-B | | | 6.000 | | | | 07/01/2021 | | | | 475,850 | |
| | 26,655,000 | | | Nassau County, NY Tobacco Settlement Corp. | | | 5.125 | | | | 06/01/2046 | | | | 18,724,071 | |
| | 85,990,000 | | | Nassau County, NY Tobacco Settlement Corp. | | | 6.151 | 4 | | | 06/01/2046 | | | | 3,347,591 | |
| | 60,000,000 | | | Nassau County, NY Tobacco Settlement Corp. | | | 6.763 | 4 | | | 06/01/2060 | | | | 371,400 | |
| | 37,830,000 | | | Nassau County, NY Tobacco Settlement Corp. (TASC) | | | 5.000 | | | | 06/01/2035 | | | | 27,217,928 | |
| | 2,500,000 | | | Niagara County, NY IDA (American Ref-Fuel Company)1 | | | 5.550 | | | | 11/15/2024 | | | | 2,516,700 | |
| | 575,000 | | | Niagara County, NY IDA (Niagara Falls Memorial Medical Center) | | | 5.750 | | | | 06/01/2018 | | | | 585,776 | |
| | 555,000 | | | Niagara County, NY Tobacco Asset Securitization Corp. | | | 6.250 | | | | 05/15/2034 | | | | 534,282 | |
| | 385,000 | | | Niagara County, NY Tobacco Asset Securitization Corp. | | | 6.250 | | | | 05/15/2040 | | | | 364,214 | |
| | 70,000 | | | Niagara Falls, NY Public Water Authority | | | 5.500 | | | | 07/15/2034 | | | | 73,591 | |
| | 100,000 | | | Niagara, NY Area Devel. Corp. (Niagara University)1 | | | 5.000 | | | | 05/01/2035 | | | | 110,286 | |
| | 150,000 | | | Niagara, NY Area Devel. Corp. (Niagara University)1 | | | 5.000 | | | | 05/01/2042 | | | | 164,921 | |
| | 1,185,000 | | | NY Counties Tobacco Trust I1 | | | 6.500 | | | | 06/01/2035 | | | | 1,168,280 | |
| | 14,670,000 | | | NY Counties Tobacco Trust II (TASC) | | | 5.625 | | | | 06/01/2035 | | | | 12,592,141 | |
| | 100,000 | | | NY Counties Tobacco Trust II (TASC) | | | 5.750 | | | | 06/01/2043 | | | | 83,491 | |
| | 5,120,000 | | | NY Counties Tobacco Trust III | | | 6.000 | | | | 06/01/2043 | | | | 5,123,277 | |
| | | | |
| 26 | | | | OPPENHEIMER AMT-FREE NEW YORK MUNICIPALS |
| | | | | | | | | | | | | | | | |
Principal
Amount | | | | | Coupon | | | Maturity | | | Value | |
| | New York Continued | | | | | | | | | | | | |
| | $ 850,000 | | | NY Counties Tobacco Trust IV | | | 5.000 | % | | | 06/01/2038 | | | $ | 635,613 | |
| | 5,905,000 | | | NY Counties Tobacco Trust IV (TASC) | | | 5.000 | | | | 06/01/2042 | | | | 4,115,490 | |
| | 11,240,000 | | | NY Counties Tobacco Trust IV (TASC) | | | 5.000 | | | | 06/01/2045 | | | | 7,462,348 | |
| | 3,500,000 | | | NY Counties Tobacco Trust IV (TASC) | | | 6.250 | | | | 06/01/2041 | | | | 3,357,585 | |
| | 84,200,000 | | | NY Counties Tobacco Trust V | | | 6.850 | 4 | | | 06/01/2055 | | | | 1,109,756 | |
| | 334,000,000 | | | NY Counties Tobacco Trust V | | | 7.850 | 4 | | | 06/01/2060 | | | | 1,710,080 | |
| | 4,910,000 | | | NY Liberty Devel. Corp. (Bank of America Tower at One Bryant Park)1 | | | 5.625 | | | | 01/15/2046 | | | | 5,646,402 | |
| | 30,000,000 | | | NY Liberty Devel. Corp. (Bank of America Tower)5 | | | 5.125 | | | | 01/15/2044 | | | | 33,328,200 | |
| | 20,000,000 | | | NY Liberty Devel. Corp. (Bank of America Tower)5 | | | 5.625 | | | | 01/15/2046 | | | | 22,999,600 | |
| | 10,610,000 | | | NY Liberty Devel. Corp. (Goldman Sachs Headquarters) | | | 5.250 | | | | 10/01/2035 | | | | 12,459,960 | |
| | 235,000 | | | NY MTA, Series 2008C | | | 6.500 | | | | 11/15/2028 | | | | 301,585 | |
| | 1,200,000 | | | NY MTA, Series A | | | 5.250 | | | | 11/15/2038 | | | | 1,373,460 | |
| | 2,675,000 | | | NY MTA, Series B | | | 5.000 | | | | 11/15/2033 | | | | 2,936,241 | |
| | 2,810,000 | | | NY MTA, Series C | | | 5.000 | | | | 11/15/2027 | | | | 3,342,355 | |
| | 5,000,000 | | | NY MTA, Series D | | | 5.000 | | | | 11/15/2028 | | | | 5,927,900 | |
| | 6,150,000 | | | NY MTA, Series D | | | 5.000 | | | | 11/15/2030 | | | | 7,150,298 | |
| | 5,000,000 | | | NY MTA, Series D | | | 5.000 | | | | 11/15/2031 | | | | 5,786,850 | |
| | 350,000 | | | NY MTA, Series D | | | 5.000 | | | | 11/15/2032 | | | | 406,928 | |
| | 1,000,000 | | | NY MTA, Series D | | | 5.000 | | | | 11/15/2034 | | | | 1,126,020 | |
| | 6,500,000 | | | NY MTA, Series D | | | 5.000 | | | | 11/15/2036 | | | | 7,351,045 | |
| | 2,450,000 | | | NY MTA, Series D-11 | | | 5.000 | | | | 11/01/2028 | | | | 2,903,177 | |
| | 3,175,000 | | | NY MTA, Series E | | | 5.000 | | | | 11/15/2025 | | | | 3,815,239 | |
| | 3,000,000 | | | NY MTA, Series E | | | 5.000 | | | | 11/15/2029 | | | | 3,539,400 | |
| | 7,580,000 | | | NY Seneca Nation Indians Capital Improvements1 | | | 5.000 | | | | 12/01/2023 | | | | 7,717,880 | |
| | 2,000,000 | | | NY Seneca Nation Indians Capital Improvements1 | | | 5.250 | | | | 12/01/2016 | | | | 2,055,240 | |
| | 400,000 | | | NY Triborough Bridge & Tunnel Authority | | | 5.000 | | | | 11/15/2030 | | | | 484,408 | |
| | 250,000 | | | NY Triborough Bridge & Tunnel Authority | | | 5.000 | | | | 11/15/2031 | | | | 300,783 | |
| | 1,500,000 | | | NY TSASC, Inc. (TFABs) | | | 5.000 | | | | 06/01/2026 | | | | 1,424,850 | |
| | 80,000,000 | | | NY TSASC, Inc. (TFABs) | | | 5.125 | | | | 06/01/2042 | | | | 60,744,000 | |
| | 5,000,000 | | | NYC Capital Resources Corp. (Albee Retail Devel.) | | | 7.250 | | | | 11/01/2042 | | | | 5,003,700 | |
| | 6,200,000 | | | NYC GO | | | 5.000 | | | | 08/01/2032 | | | | 7,328,152 | |
| | 700,000 | | | NYC GO | | | 5.000 | | | | 08/01/2035 | | | | 807,702 | |
| | 11,000,000 | | | NYC GO5 | | | 5.125 | | | | 03/01/2026 | | | | 12,984,290 | |
| | 60,000 | | | NYC GO | | | 5.300 | | | | 01/15/2026 | | | | 60,836 | |
| | 5,000 | | | NYC GO1 | | | 5.375 | | | | 08/01/2027 | | | | 5,020 | |
| | 15,000,000 | | | NYC GO5 | | | 5.375 | | | | 04/01/2036 | | | | 17,433,600 | |
| | 15,000 | | | NYC GO | | | 5.500 | | | | 11/15/2037 | | | | 15,063 | |
| | | | |
| 27 | | | | OPPENHEIMER AMT-FREE NEW YORK MUNICIPALS |
STATEMENT OF INVESTMENTS Continued
| | | | | | | | | | | | | | | | |
Principal
Amount | | | | | Coupon | | | Maturity | | | Value | |
| | New York Continued | | | | | | | | | | | | |
| | $ 20,000,000 | | | NYC GO5 | | | 5.625 | % | | | 11/15/2031 | | | $ | 24,213,906 | |
| | 45,000 | | | NYC GO | | | 6.000 | | | | 05/15/2022 | | | | 45,209 | |
| | 120,409 | | | NYC HDC (Cadman Towers) | | | 6.500 | | | | 11/15/2018 | | | | 120,804 | |
| | 33,924 | | | NYC HDC (Corlear) | | | 6.500 | | | | 11/15/2018 | | | | 35,797 | |
| | 450,000 | | | NYC HDC (Multifamily Hsg.)1 | | | 5.500 | | | | 11/01/2034 | | | | 496,841 | |
| | 410,000 | | | NYC HDC (Multifamily Hsg.)1 | | | 5.550 | | | | 11/01/2039 | | | | 451,476 | |
| | 1,590,000 | | | NYC HDC (Multifamily Hsg.)1 | | | 5.700 | | | | 11/01/2046 | | | | 1,757,030 | |
| | 15,000 | | | NYC HDC (Multifamily Hsg.), Series E1 | | | 6.250 | | | | 05/01/2036 | | | | 15,028 | |
| | 99,991 | | | NYC HDC (St. Martin Tower) | | | 6.500 | | | | 11/15/2018 | | | | 100,319 | |
| | 5,000,000 | | | NYC Health & Hospital Corp. (Health System) | | | 5.000 | | | | 02/15/2030 | | | | 5,673,450 | |
| | 60,000 | | | NYC IDA (Assoc. for Metro Area Autistic Children) | | | 4.500 | | | | 07/01/2021 | | | | 59,611 | |
| | 2,760,000 | | | NYC IDA (Beth Abraham Health Services) | | | 6.500 | | | | 02/15/2022 | | | | 2,831,622 | |
| | 500,000 | | | NYC IDA (Beth Abraham Health Services) | | | 6.500 | | | | 11/15/2027 | | | | 515,785 | |
| | 2,100,000 | | | NYC IDA (Beth Abraham Health Services) | | | 6.500 | | | | 11/15/2034 | | | | 2,140,089 | |
| | 6,000,000 | | | NYC IDA (Calhoun School) | | | 6.625 | | | | 12/01/2034 | | | | 6,360,180 | |
| | 500,000 | | | NYC IDA (Calhoun School) | | | 6.625 | | | | 12/01/2034 | | | | 542,465 | |
| | 960,000 | | | NYC IDA (Center for Elimination of Family Violence) | | | 7.375 | | | | 11/01/2036 | | | | 1,010,467 | |
| | 530,000 | | | NYC IDA (Center for Nursing/Rehabilitation) | | | 5.375 | | | | 08/01/2027 | | | | 527,016 | |
| | 795,000 | | | NYC IDA (Center for Nursing/Rehabilitation) | | | 5.375 | | | | 08/01/2027 | | | | 790,524 | |
| | 3,240,000 | | | NYC IDA (Chapin School) | | | 5.000 | | | | 11/01/2038 | | | | 3,289,248 | |
| | 150,000 | | | NYC IDA (Comprehensive Care Management) | | | 6.000 | | | | 05/01/2026 | | | | 156,351 | |
| | 350,000 | | | NYC IDA (Comprehensive Care Management) | | | 6.125 | | | | 11/01/2035 | | | | 350,126 | |
| | 780,000 | | | NYC IDA (Eger Harbor House)1 | | | 5.875 | | | | 05/20/2044 | | | | 821,449 | |
| | 725,000 | | | NYC IDA (Family Support Systems)3 | | | 7.500 | | | | 11/01/2034 | | | | 457,983 | |
| | 1,625,000 | | | NYC IDA (Guttmacher Institute) | | | 5.750 | | | | 12/01/2036 | | | | 1,578,395 | |
| | 455,000 | | | NYC IDA (Independent Living Assoc.) | | | 6.200 | | | | 07/01/2020 | | | | 466,402 | |
| | 4,000,000 | | | NYC IDA (Lycee Francais De New York)1 | | | 6.800 | | | | 06/01/2028 | | | | 4,064,400 | |
| | 420,000 | | | NYC IDA (Manhattan Community Access Corp.) | | | 6.000 | | | | 12/01/2036 | | | | 426,027 | |
| | 210,000 | | | NYC IDA (Margaret Tietz Nursing & Rehabilitation Center) | | | 6.375 | | | | 11/01/2038 | | | | 217,226 | |
| | 1,020,000 | | | NYC IDA (Margaret Tietz Nursing & Rehabilitation Center) | | | 6.375 | | | | 11/01/2038 | | | | 1,055,098 | |
| | 2,300,000 | | | NYC IDA (Montefiore Medical Center Corp.)1 | | | 5.125 | | | | 11/01/2035 | | | | 2,303,910 | |
| | 6,045,000 | | | NYC IDA (Mount St. Vincent) | | | 5.250 | | | | 06/01/2036 | | | | 6,048,990 | |
| | 1,375,000 | | | NYC IDA (Polytechnic University)1 | | | 5.250 | | | | 11/01/2027 | | | | 1,497,664 | |
| | 1,500,000 | | | NYC IDA (Polytechnic University)1 | | | 5.250 | | | | 11/01/2037 | | | | 1,616,250 | |
| | 2,070,000 | | | NYC IDA (PSCH) | | | 6.375 | | | | 07/01/2033 | | | | 2,087,098 | |
| | 750,000 | | | NYC IDA (Queens Baseball Stadium)1 | | | 5.000 | | | | 01/01/2031 | | | | 769,598 | |
| | 2,500,000 | | | NYC IDA (Queens Baseball Stadium)1 | | | 5.000 | | | | 01/01/2039 | | | | 2,551,675 | |
| | | | |
| 28 | | | | OPPENHEIMER AMT-FREE NEW YORK MUNICIPALS |
| | | | | | | | | | | | | | | | |
Principal
Amount | | | | | Coupon | | | Maturity | | | Value | |
| | New York Continued | | | | | | | | | | | | |
| | $ 750,000 | | | NYC IDA (Reece School) | | | 7.500 | % | | | 12/01/2037 | | | $ | 792,578 | |
| | 230,000 | | | NYC IDA (Special Needs Facilities Pooled Program) | | | 6.650 | | | | 07/01/2023 | | | | 230,524 | |
| | 756,500 | | | NYC IDA (Studio School) | | | 7.000 | | | | 11/01/2038 | | | | 502,422 | |
| | 5,345,000 | | | NYC IDA (The Child School) | | | 7.550 | | | | 06/01/2033 | | | | 5,485,948 | |
| | 945,000 | | | NYC IDA (Tides Two Rivers Foundation) | | | 5.650 | | | | 12/01/2039 | | | | 797,608 | |
| | 3,500,000 | | | NYC IDA (Unicef) | | | 5.300 | | | | 11/01/2038 | | | | 3,545,710 | |
| | 4,600,000 | | | NYC IDA (United Jewish Appeal-Federal Jewish Philanthropies)1 | | | 5.000 | | | | 07/01/2034 | | | | 5,381,264 | |
| | 5,600,000 | | | NYC IDA (Urban Resource Institute) | | | 7.375 | | | | 11/01/2033 | | | | 5,660,200 | |
| | 785,000 | | | NYC IDA (Vaughn College Aeronautics)1 | | | 5.000 | | | | 12/01/2021 | | | | 835,986 | |
| | 545,000 | | | NYC IDA (Vaughn College Aeronautics)1 | | | 5.000 | | | | 12/01/2021 | | | | 580,398 | |
| | 2,280,000 | | | NYC IDA (Vaughn College Aeronautics)1 | | | 5.250 | | | | 12/01/2036 | | | | 2,382,212 | |
| | 5,600,000 | | | NYC IDA (Vocational Instruction)3 | | | 7.750 | | | | 02/01/2033 | | | | 3,147,200 | |
| | 2,525,000 | | | NYC IDA (Yankee Stadium)1 | | | 7.000 | | | | 03/01/2049 | | | | 3,104,033 | |
| | 2,700,000 | | | NYC IDA (Yeled Yalda Early Childhood) | | | 5.725 | | | | 11/01/2037 | | | | 2,688,093 | |
| | 4,000,000 | | | NYC Municipal Water Finance Authority | | | 5.000 | | | | 06/15/2032 | | | | 4,698,080 | |
| | 1,000,000 | | | NYC Municipal Water Finance Authority | | | 5.000 | | | | 06/15/2035 | | | | 1,030,350 | |
| | 20,000,000 | | | NYC Municipal Water Finance Authority5 | | | 5.000 | | | | 06/15/2037 | | | | 21,929,990 | |
| | 40,000,000 | | | NYC Municipal Water Finance Authority5 | | | 5.500 | | | | 06/15/2040 | | | | 48,237,200 | |
| | 5,000,000 | | | NYC Municipal Water Finance Authority | | | 5.500 | | | | 06/15/2043 | | | | 5,982,200 | |
| | 20,000,000 | | | NYC Transitional Finance Authority5 | | | 5.000 | | | | 01/15/2034 | | | | 22,198,200 | |
| | 5,500,000 | | | NYC Transitional Finance Authority | | | 5.000 | | | | 02/01/2035 | | | | 6,352,335 | |
| | 5,870,000 | | | NYC Transitional Finance Authority (Building Aid) | | | 5.000 | | | | 07/15/2031 | | | | 6,983,422 | |
| | 5,000,000 | | | NYC Transitional Finance Authority (Building Aid) | | | 5.000 | | | | 07/15/2032 | | | | 5,910,750 | |
| | 16,000,000 | | | NYC Transitional Finance Authority (Building Aid) | | | 5.000 | | | | 07/15/2037 | | | | 18,514,400 | |
| | 5,500,000 | | | NYC Transitional Finance Authority (Building Aid) | | | 5.250 | | | | 07/15/2037 | | | | 6,434,120 | |
| | 300,000 | | | NYC Transitional Finance Authority (Building Aid) | | | 5.500 | | | | 01/15/2039 | | | | 346,923 | |
| | 10,000,000 | | | NYC Transitional Finance Authority (Future Tax) | | | 5.000 | | | | 05/01/2034 | | | | 11,797,600 | |
| | 15,000 | | | NYS DA (Audit & Control) | | | 5.000 | �� | | | 04/01/2029 | | | | 15,049 | |
| | 150,000 | | | NYS DA (Brooklyn Law School)1 | | | 5.000 | | | | 07/01/2027 | | | | 174,590 | |
| | 150,000 | | | NYS DA (Brooklyn Law School)1 | | | 5.000 | | | | 07/01/2028 | | | | 174,314 | |
| | 70,000 | | | NYS DA (Brooklyn Law School)1 | | | 5.000 | | | | 07/01/2029 | | | | 81,283 | |
| | 70,000 | | | NYS DA (Brooklyn Law School)1 | | | 5.000 | | | | 07/01/2030 | | | | 80,835 | |
| | 1,250,000 | | | NYS DA (Catholic Health System) | | | 4.750 | | | | 07/01/2039 | | | | 1,308,075 | |
| | 300,000 | | | NYS DA (Catholic Health System) | | | 4.750 | | | | 07/01/2039 | | | | 311,013 | |
| | 125,000 | | | NYS DA (Catholic Health System) | | | 5.000 | | | | 07/01/2032 | | | | 134,539 | |
| | 6,425,000 | | | NYS DA (FIT/FIT Student Hsg. Corp. Obligated Group)1 | | | 5.250 | | | | 07/01/2027 | | | | 7,609,834 | |
| | | | |
| 29 | | | | OPPENHEIMER AMT-FREE NEW YORK MUNICIPALS |
STATEMENT OF INVESTMENTS Continued
| | | | | | | | | | | | | | | | |
Principal
Amount | | | | | Coupon | | | Maturity | | | Value | |
| | New York Continued | | | | | | | | | | | | |
| | $ 3,765,000 | | | NYS DA (FIT/FIT Student Hsg. Corp. Obligated Group)1 | | | 5.250 | % | | | 07/01/2028 | | | $ | 4,484,341 | |
| | 750,000 | | | NYS DA (Highland Hospital of Rochester)1 | | | 5.000 | | | | 07/01/2026 | | | | 831,465 | |
| | 750,000 | | | NYS DA (Highland Hospital of Rochester)1 | | | 5.200 | | | | 07/01/2032 | | | | 835,125 | |
| | 550,000 | | | NYS DA (Interagency Council Pooled Loan Program) | | | 7.000 | | | | 07/01/2021 | | | | 595,348 | |
| | 830,000 | | | NYS DA (Interagency Council Pooled Loan Program) | | | 7.000 | | | | 07/01/2031 | | | | 897,247 | |
| | 920,000 | | | NYS DA (Interagency Council) | | | 7.000 | | | | 07/01/2035 | | | | 968,742 | |
| | 250,000 | | | NYS DA (Iona College)1 | | | 5.000 | | | | 07/01/2032 | | | | 276,945 | |
| | 2,000,000 | | | NYS DA (LIJMC/NSUH/NSUHGC Obligated Group) | | | 5.500 | | | | 05/01/2037 | | | | 2,288,620 | |
| | 365,000 | | | NYS DA (Manhattan College) | | | 5.300 | | | | 07/01/2037 | | | | 379,257 | |
| | 140,000 | | | NYS DA (Miriam Osborn Memorial Home Assoc.) | | | 5.000 | | | | 07/01/2029 | | | | 152,842 | |
| | 1,360,000 | | | NYS DA (New York Methodist Hospital)1 | | | 5.250 | | | | 07/01/2024 | | | | 1,401,698 | |
| | 1,000,000 | | | NYS DA (North Shore L.I. Jewish Obligated Group) | | | 5.000 | | | | 05/01/2039 | | | | 1,114,820 | |
| | 150,000 | | | NYS DA (North Shore L.I. Jewish Obligated Group) | | | 5.000 | | | | 05/01/2041 | | | | 165,921 | |
| | 1,500,000 | | | NYS DA (NYU)1 | | | 5.000 | | | | 07/01/2037 | | | | 1,736,280 | |
| | 325,000 | | | NYS DA (Ozanam Hall of Queens Nursing Home)1 | | | 5.000 | | | | 11/01/2026 | | | | 323,684 | |
| | 20,000,000 | | | NYS DA (Personal Income Tax)5 | | | 5.000 | | | | 03/15/2037 | | | | 22,586,400 | |
| | 1,990,000 | | | NYS DA (Providence Rest) | | | 5.000 | | | | 07/01/2035 | | | | 1,787,736 | |
| | 3,525,000 | | | NYS DA (Providence Rest) | | | 5.125 | | | | 07/01/2030 | | | | 3,368,349 | |
| | 340,000 | | | NYS DA (Providence Rest) | | | 5.250 | | | | 07/01/2025 | | | | 340,058 | |
| | 650,000 | | | NYS DA (Rochester General Hospital) | | | 5.000 | | | | 12/01/2035 | | | | 660,530 | |
| | 300,000 | | | NYS DA (Rochester Institute of Technology)1 | | | 5.000 | | | | 07/01/2040 | | | | 335,841 | |
| | 3,110,000 | | | NYS DA (Sarah Neuman Nursing Home) | | | 5.500 | | | | 08/01/2037 | | | | 3,115,411 | |
| | 250,000 | | | NYS DA (School District Bond Financing Program), Series C | | | 7.250 | | | | 10/01/2028 | | | | 318,350 | |
| | 360,000 | | | NYS DA (School District Bond Financing Program), Series C | | | 7.375 | | | | 10/01/2033 | | | | 454,705 | |
| | 200,000 | | | NYS DA (School District Bond Financing Program), Series C | | | 7.500 | | | | 04/01/2039 | | | | 250,708 | |
| | 200,000 | | | NYS DA (St. John’s University)1 | | | 5.000 | | | | 07/01/2027 | | | | 238,370 | |
| | 50,000 | | | NYS DA (St. John’s University)1 | | | 5.000 | | | | 07/01/2028 | | | | 59,311 | |
| | 1,955,000 | | | NYS DA (St. John’s University)1 | | | 5.000 | | | | 07/01/2030 | | | | 2,298,943 | |
| | 500,000 | | | NYS DA (St. Joseph’s College)1 | | | 5.250 | | | | 07/01/2035 | | | | 558,435 | |
| | 95,000 | | | NYS DA (St. Joseph’s Hospital Health Center)1 | | | 5.250 | | | | 07/01/2018 | | | | 95,435 | |
| | 20,000,000 | | | NYS DA (St. Mary’s Hospital for Children) | | | 7.875 | | | | 11/15/2041 | | | | 21,594,600 | |
| | 20,000,000 | | | NYS DA (State Personal Income Tax Authority)5 | | | 5.750 | | | | 03/15/2036 | | | | 24,546,539 | |
| | 3,000,000 | | | NYS DA (State University Educational Facilities) | | | 5.000 | | | | 05/15/2029 | | | | 3,605,580 | |
| | 1,000,000 | | | NYS DA (State University Educational Facilities) | | | 5.000 | | | | 05/15/2030 | | | | 1,197,150 | |
| | 2,000,000 | | | NYS DA (State University of New York) | | | 5.000 | | | | 07/01/2035 | | | | 2,321,880 | |
| | | | |
| 30 | | | | OPPENHEIMER AMT-FREE NEW YORK MUNICIPALS |
| | | | | | | | | | | | | | | | |
Principal
Amount | | | | | Coupon | | | Maturity | | | Value | |
| | New York Continued | | | | | | | | | | | | |
| | $ 560,000 | | | NYS DA (The Bronx-Lebanon Hospital Center)1 | | | 6.250 | % | | | 02/15/2035 | | | $ | 669,082 | |
| | 1,000,000 | | | NYS DA (The New School)1 | | | 5.000 | | | | 07/01/2031 | | | | 1,141,000 | |
| | 1,070,000 | | | NYS DA (Winthrop University Hospital) | | | 5.500 | | | | 07/01/2023 | | | | 1,087,109 | |
| | 100,000 | | | NYS DA (Winthrop University Hospital/SNCH Obligated Group) | | | 5.500 | | | | 07/01/2032 | | | | 101,249 | |
| | 360,000 | | | NYS DA (Yeshiva University)1 | | | 5.000 | | | | 11/01/2031 | | | | 417,690 | |
| | 2,040,000 | | | NYS DA (Yeshiva University)1 | | | 5.125 | | | | 07/01/2029 | | | | 2,131,290 | |
| | 5,000,000 | | | NYS EFC (Clean Water & Drinking Revolving Funds) | | | 5.000 | | | | 06/15/2036 | | | | 5,919,400 | |
| | 20,000 | | | NYS HFA (Affordable Hsg.)1 | | | 5.450 | | | | 11/01/2040 | | | | 21,660 | |
| | 5,000,000 | | | NYS Liberty Devel. Corp. (4 World Trade Center) | | | 5.000 | | | | 11/15/2031 | | | | 5,705,400 | |
| | 5,000,000 | | | NYS Liberty Devel. Corp. (4 World Trade Center) | | | 5.750 | | | | 11/15/2051 | | | | 5,921,900 | |
| | 2,500,000 | | | NYS Liberty Devel. Corp. (7 World Trade Center) | | | 5.000 | | | | 09/15/2043 | | | | 2,756,425 | |
| | 1,000,000 | | | NYS Power Authority | | | 5.000 | | | | 11/15/2038 | | | | 1,165,180 | |
| | 1,350,000 | | | NYS Thruway Authority1 | | | 5.000 | | | | 01/01/2032 | | | | 1,567,391 | |
| | 1,250,000 | | | NYS Thruway Authority | | | 5.000 | | | | 04/01/2032 | | | | 1,479,888 | |
| | 10,175,000 | | | NYS Thruway Authority1 | | | 5.000 | | | | 01/01/2037 | | | | 11,575,284 | |
| | 295,000 | | | NYS UDC (Subordinated Lien) | | | 5.500 | | | | 07/01/2022 | | | | 296,068 | |
| | 2,330,000 | | | NYS UDC (State Personal Income Tax Authority) | | | 5.000 | | | | 03/15/2037 | | | | 2,631,316 | |
| | 225,000 | | | Oneida County, NY IDA (Mohawk Valley Handicapped Services) | | | 5.300 | | | | 03/15/2019 | | | | 225,020 | |
| | 55,000 | | | Onondaga County, NY IDA (Salina Free Library) | | | 5.500 | | | | 12/01/2022 | | | | 56,388 | |
| | 2,250,000 | | | Onondaga County, NY Trust Cultural Resource Revenue (Syracuse University)1 | | | 5.000 | | | | 12/01/2036 | | | | 2,613,398 | |
| | 1,615,000 | | | Onondaga, NY Civic Devel Corp. (Le Moyne College)1 | | | 5.200 | | | | 07/01/2029 | | | | 1,769,572 | |
| | 1,810,000 | | | Onondaga, NY Civic Devel Corp. (Le Moyne College)1 | | | 5.375 | | | | 07/01/2040 | | | | 1,990,312 | |
| | 535,000 | | | Onondaga, NY Civic Devel Corp. (Upstate Properties)1 | | | 5.250 | | | | 12/01/2041 | | | | 594,808 | |
| | 665,000 | | | Orange County, NY IDA (Glen Arden) | | | 5.625 | | | | 01/01/2018 | | | | 618,909 | |
| | 275,000 | | | Orange County, NY IDA (Glen Arden) | | | 5.700 | | | | 01/01/2028 | | | | 228,676 | |
| | 5,000,000 | | | Port Authority NY/NJ, 166th Series | | | 5.250 | | | | 07/15/2036 | | | | 5,927,600 | |
| | 115,000 | | | Rensselaer County, NY IDA (Rensselaer Polytechnical Institute)1 | | | 5.000 | | | | 03/01/2036 | | | | 120,236 | |
| | 2,680,000 | | | Rensselaer County, NY Tobacco Asset Securitization Corp. | | | 5.625 | | | | 06/01/2035 | | | | 2,356,095 | |
| | 2,000,000 | | | Rensselaer County, NY Tobacco Asset Securitization Corp. | | | 5.750 | | | | 06/01/2043 | | | | 1,754,940 | |
| | 415,000 | | | Rensselaer County, NY Water Service Sewer Authority1 | | | 5.350 | | | | 09/01/2047 | | | | 455,168 | |
| | | | |
| 31 | | | | OPPENHEIMER AMT-FREE NEW YORK MUNICIPALS |
STATEMENT OF INVESTMENTS Continued
| | | | | | | | | | | | | | | | |
Principal
Amount | | | | | Coupon | | | Maturity | | | Value | |
| | New York Continued | | | | | | | | | | | | |
| | $ 6,810,000 | | | Rensselaer, NY City School District COP | | | 5.000 | % | | | 06/01/2026 | | | $ | 7,163,371 | |
| | 1,200,000 | | | Rensselaer, NY City School District COP | | | 5.000 | | | | 06/01/2036 | | | | 1,238,292 | |
| | 1,060,000 | | | Rockland County, NY Tobacco Asset Securitization Corp.1 | | | 5.625 | | | | 08/15/2035 | | | | 1,010,169 | |
| | 3,150,000 | | | Rockland County, NY Tobacco Asset Securitization Corp.1 | | | 5.750 | | | | 08/15/2043 | | | | 3,024,725 | |
| | 101,000,000 | | | Rockland County, NY Tobacco Asset Securitization Corp. | | | 6.252 | 4 | | | 08/15/2045 | | | | 4,218,770 | |
| | 53,000,000 | | | Rockland County, NY Tobacco Asset Securitization Corp. | | | 6.637 | 4 | | | 08/15/2050 | | | | 1,361,040 | |
| | 50,000,000 | | | Rockland County, NY Tobacco Asset Securitization Corp. | | | 7.676 | 4 | | | 08/15/2060 | | | | 256,000 | |
| | 230,000 | | | Saratoga County, NY IDA (Saratoga Hospital/Saratoga Care/Saratoga Care Family Health Centers)1 | | | 5.125 | | | | 12/01/2027 | | | | 243,584 | |
| | 105,000 | | | Seneca County, NY IDA (New York Chiropractic College)1 | | | 5.000 | | | | 10/01/2027 | | | | 110,795 | |
| | 45,000 | | | Sodus Village, NY GO1 | | | 5.000 | | | | 05/15/2032 | | | | 49,260 | |
| | 45,000 | | | Sodus Village, NY GO1 | | | 5.000 | | | | 05/15/2033 | | | | 49,280 | |
| | 45,000 | | | Sodus Village, NY GO1 | | | 5.000 | | | | 05/15/2034 | | | | 49,260 | |
| | 45,000 | | | Sodus Village, NY GO1 | | | 5.000 | | | | 05/15/2035 | | | | 49,239 | |
| | 45,000 | | | Sodus Village, NY GO1 | | | 5.000 | | | | 05/15/2036 | | | | 49,219 | |
| | 45,000 | | | Sodus Village, NY GO1 | | | 5.000 | | | | 05/15/2037 | | | | 49,199 | |
| | 240,000 | | | St. Lawrence County, NY IDA (Clarkson University)1 | | | 5.000 | | | | 09/01/2041 | | | | 270,842 | |
| | 100,000 | | | St. Lawrence County, NY IDA (Clarkson University)1 | | | 6.000 | | | | 09/01/2034 | | | | 121,803 | |
| | 810,000 | | | St. Lawrence County, NY IDA (Edwards John Noble Hospital) | | | 6.250 | | | | 10/01/2040 | | | | 890,433 | |
| | 2,050,000 | | | Suffolk County, NY Economic Devel. Corp. (Catholic Health Services) | | | 5.000 | | | | 07/01/2028 | | | | 2,355,983 | |
| | 1,000,000 | | | Suffolk County, NY Economic Devel. Corp. (Peconic Landing at Southold) | | | 6.000 | | | | 12/01/2040 | | | | 1,117,160 | |
| | 625,000 | | | Suffolk County, NY Economic Devel. Corp., Series A | | | 7.375 | | | | 12/01/2040 | | | | 674,831 | |
| | 95,000 | | | Suffolk County, NY IDA (ALIA-Adelante) | | | 6.500 | | | | 11/01/2037 | | | | 94,275 | |
| | 50,000 | | | Suffolk County, NY IDA (ALIA-DDI) | | | 5.950 | | | | 10/01/2021 | | | | 50,803 | |
| | 35,000 | | | Suffolk County, NY IDA (ALIA-IGHL) | | | 5.950 | | | | 11/01/2022 | | | | 34,810 | |
| | 4,000,000 | | | Suffolk County, NY IDA (ALIA-IGHL) | | | 7.250 | | | | 12/01/2033 | | | | 4,073,680 | |
| | 390,000 | | | Suffolk County, NY IDA (ALIA-UVBH) | | | 6.500 | | | | 11/01/2037 | | | | 387,024 | |
| | 8,515,000 | | | Suffolk County, NY IDA (Dowling College) | | | 5.000 | | | | 06/01/2036 | | | | 8,018,916 | |
| | 150,000 | | | Suffolk County, NY IDA (Dowling College)1 | | | 6.700 | | | | 12/01/2020 | | | | 150,113 | |
| | 340,000 | | | Suffolk County, NY IDA (Easter Long Island Hospital Assoc.) | | | 5.375 | | | | 01/01/2027 | | | | 343,771 | |
| | 9,000,000 | | | Suffolk County, NY IDA (Jefferson’s Ferry)1 | | | 5.000 | | | | 11/01/2028 | | | | 9,237,780 | |
| | | | |
| 32 | | | | OPPENHEIMER AMT-FREE NEW YORK MUNICIPALS |
| | | | | | | | | | | | | | | | |
Principal
Amount | | | | | Coupon | | | Maturity | | | Value | |
| | New York Continued | | | | | | | | | | | | |
| | $ 1,000,000 | | | Suffolk County, NY IDA (L.I. Network Community Services) | | | 7.550 | % | | | 02/01/2034 | | | $ | 1,166,350 | |
| | 620,000 | | | Suffolk County, NY IDA (Nassau-Suffolk Services for Autism) | | | 6.750 | | | | 11/01/2036 | | | | 644,496 | |
| | 210,000 | | | Suffolk County, NY IDA (Nassau-Suffolk Services for Autism) | | | 6.750 | | | | 11/01/2036 | | | | 210,120 | |
| | 1,000,000 | | | Suffolk County, NY IDA (New York Institute of Technology)1 | | | 5.000 | | | | 03/01/2026 | | | | 1,035,240 | |
| | 5,985,000 | | | Suffolk County, NY IDA (Pederson-Krager Center) | | | 7.000 | | | | 11/01/2035 | | | | 6,038,506 | |
| | 505,000 | | | Suffolk County, NY IDA (Pederson-Krager Center) | | | 7.200 | | | | 02/01/2035 | | | | 512,711 | |
| | 185,000 | | | Suffolk County, NY IDA (Southampton Hospital Assoc.) | | | 7.250 | | | | 01/01/2020 | | | | 185,255 | |
| | 215,000 | | | Suffolk County, NY IDA (Special Needs Facilities Pooled Program) | | | 5.250 | | | | 07/01/2022 | | | | 203,016 | |
| | 750,000 | | | Suffolk County, NY Tobacco Asset Securitization Corp.1 | | | 5.000 | | | | 06/01/2032 | | | | 804,968 | |
| | 700,000 | | | Suffolk County, NY Tobacco Asset Securitization Corp.1 | | | 5.250 | | | | 06/01/2037 | | | | 751,275 | |
| | 6,350,000 | | | Suffolk, NY Tobacco Asset Securitization Corp. | | | 0.000 | 6 | | | 06/01/2044 | | | | 5,981,891 | |
| | 7,155,000 | | | Suffolk, NY Tobacco Asset Securitization Corp. | | | 5.375 | | | | 06/01/2028 | | | | 6,392,921 | |
| | 1,500,000 | | | Suffolk, NY Tobacco Asset Securitization Corp. | | | 6.000 | | | | 06/01/2048 | | | | 1,218,390 | |
| | 15,750,000 | | | Suffolk, NY Tobacco Asset Securitization Corp. | | | 8.000 | 4 | | | 06/01/2048 | | | | 500,535 | |
| | 408,000 | | | Sullivan County, NY Community College COP3 | | | 5.750 | | | | 08/15/2025 | | | | 368,281 | |
| | 185,000 | | | Syracuse, NY IDA (Jewish Home of Central New York) | | | 7.375 | | | | 03/01/2021 | | | | 184,584 | |
| | 175,000 | | | Tompkins County, NY IDA (Kendal at Ithaca)1 | | | 5.500 | | | | 07/01/2024 | | | | 175,089 | |
| | 6,100,000 | | | Troy, NY Capital Resource Corp. (Rensselaer Polytechnic Institute)1 | | | 5.000 | | | | 09/01/2030 | | | | 6,933,931 | |
| | 1,000,000 | | | Ulster County, NY IDA (Kingston Regional Senior Living Corp.) | | | 6.000 | | | | 09/15/2042 | | | | 700,570 | |
| | 15,000 | | | Ulster County, NY IDA (Mid-Hudson Family Health Institute)1 | | | 5.300 | | | | 07/01/2016 | | | | 15,055 | |
| | 3,595,000 | | | Utica, NY IDA (Utica College Civic Facility) | | | 5.750 | | | | 08/01/2028 | | | | 3,597,768 | |
| | 1,250,000 | | | Utica, NY IDA (Utica College Civic Facility) | | | 6.750 | | | | 12/01/2021 | | | | 1,277,438 | |
| | 30,000 | | | Voorheesville, NY GO | | | 5.000 | | | | 02/15/2023 | | | | 33,309 | |
| | 35,000 | | | Voorheesville, NY GO | | | 5.000 | | | | 02/15/2024 | | | | 38,648 | |
| | 35,000 | | | Voorheesville, NY GO | | | 5.000 | | | | 02/15/2025 | | | | 38,509 | |
| | 35,000 | | | Voorheesville, NY GO | | | 5.000 | | | | 02/15/2026 | | | | 38,524 | |
| | 40,000 | | | Voorheesville, NY GO | | | 5.000 | | | | 02/15/2027 | | | | 43,958 | |
| | 40,000 | | | Voorheesville, NY GO | | | 5.000 | | | | 02/15/2028 | | | | 43,888 | |
| | 40,000 | | | Voorheesville, NY GO | | | 5.000 | | | | 02/15/2029 | | | | 43,871 | |
| | 45,000 | | | Voorheesville, NY GO | | | 5.000 | | | | 02/15/2030 | | | | 49,277 | |
| | | | |
| 33 | | | | OPPENHEIMER AMT-FREE NEW YORK MUNICIPALS |
STATEMENT OF INVESTMENTS Continued
| | | | | | | | | | | | | | | | |
Principal
Amount | | | | | Coupon | | | Maturity | | | Value | |
| | New York Continued | | | | | | | | | | | | |
| | $ 45,000 | | | Voorheesville, NY GO | | | 5.000 | % | | | 02/15/2031 | | | $ | 49,140 | |
| | 50,000 | | | Voorheesville, NY GO | | | 5.000 | | | | 02/15/2032 | | | | 54,579 | |
| | 50,000 | | | Voorheesville, NY GO | | | 5.000 | | | | 02/15/2033 | | | | 54,644 | |
| | 55,000 | | | Voorheesville, NY GO | | | 5.000 | | | | 02/15/2034 | | | | 60,085 | |
| | 55,000 | | | Voorheesville, NY GO | | | 5.000 | | | | 02/15/2035 | | | | 60,061 | |
| | 60,000 | | | Voorheesville, NY GO | | | 5.000 | | | | 02/15/2036 | | | | 65,469 | |
| | 60,000 | | | Voorheesville, NY GO | | | 5.000 | | | | 02/15/2037 | | | | 65,443 | |
| | 4,410,000 | | | Westchester County, NY Healthcare Corp., Series A1 | | | 5.000 | | | | 11/01/2030 | | | | 4,893,998 | |
| | 3,000,000 | | | Westchester County, NY Healthcare Corp., Series B1 | | | 6.125 | | | | 11/01/2037 | | | | 3,575,130 | |
| | 90,000 | | | Westchester County, NY Healthcare Corp., Series C-21 | | | 6.125 | | | | 11/01/2037 | | | | 107,254 | |
| | 3,335,000 | | | Westchester County, NY IDA (EBC White Plains) | | | 8.000 | | | | 11/01/2043 | | | | 3,709,887 | |
| | 3,330,000 | | | Westchester County, NY IDA (EBC White Plains) | | | 8.000 | | | | 11/01/2043 | | | | 3,704,325 | |
| | 3,335,000 | | | Westchester County, NY IDA (EBC White Plains) | | | 8.000 | | | | 11/01/2043 | | | | 3,709,887 | |
| | 370,000 | | | Westchester County, NY IDA (Field Home) | | | 6.500 | | | | 08/15/2022 | | | | 377,374 | |
| | 250,000 | | | Westchester County, NY IDA (Guiding Eyes for the Blind)1 | | | 5.375 | | | | 08/01/2024 | | | | 262,050 | |
| | 1,560,000 | | | Westchester County, NY IDA (Rippowam-Cisqua School)1 | | | 5.750 | | | | 06/01/2029 | | | | 1,561,700 | |
| | 320,000 | | | Westchester County, NY IDA (Schnurmacher Center) | | | 6.500 | | | | 11/01/2013 | | | | 330,826 | |
| | 600,000 | | | Westchester County, NY IDA (Schnurmacher Center) | | | 6.500 | | | | 11/01/2033 | | | | 629,154 | |
| | 300,000 | | | Westchester County, NY Tobacco Asset Securitization Corp. | | | 5.000 | | | | 06/01/2026 | | | | 297,051 | |
| | 10,790,000 | | | Westchester County, NY Tobacco Asset Securitization Corp. | | | 5.125 | | | | 06/01/2045 | | | | 8,894,844 | |
| | 885,000 | | | Yates County, NY IDA (Soldiers & Sailors Memorial Hospital) | | | 6.000 | | | | 02/01/2041 | | | | 932,100 | |
| | 750,000 | | | Yonkers, NY IDA (Michael Malotz Skilled Nursing Pavilion)1 | | | 5.650 | | | | 02/01/2039 | | | | 751,463 | |
| | 950,000 | | | Yonkers, NY IDA (Sarah Lawrence College) | | | 6.000 | | | | 06/01/2029 | | | | 1,093,583 | |
| | 4,000,000 | | | Yonkers, NY IDA (Sarah Lawrence College) | | | 6.000 | | | | 06/01/2041 | | | | 4,530,640 | |
| | 300,000 | | | Yonkers, NY IDA (St. Joseph’s Hospital), Series 98-B | |
| 6.150
|
| |
| 03/01/2015
|
| |
| 300,378
|
|
| | | | | | | | | | | | | | | | 1,185,998,680 | |
| | U.S. Possessions—24.8% | | | | | | | | | | | | |
| | 10,000,000 | | | Guam GO1 | | | 5.000 | | | | 11/15/2023 | | | | 10,307,100 | |
| | 1,465,000 | | | Guam GO1 | | | 5.250 | | | | 11/15/2037 | | | | 1,492,908 | |
| | 850,000 | | | Guam GO1 | | | 6.750 | | | | 11/15/2029 | | | | 957,602 | |
| | 10,925,000 | | | Guam GO1 | | | 7.000 | | | | 11/15/2039 | | | | 12,378,681 | |
| | 1,200,000 | | | Guam Government Business Privilege | | | 5.000 | | | | 01/01/2031 | | | | 1,372,356 | |
| | | | |
| 34 | | | | OPPENHEIMER AMT-FREE NEW YORK MUNICIPALS |
| | | | | | | | | | | | | | | | |
Principal
Amount | | | | | Coupon | | | Maturity | | | Value | |
| | U.S. Possessions Continued | | | | | | | | | | | | |
| | $ 2,000,000 | | | Guam Government Waterworks Authority & Wastewater System | | | 5.625 | % | | | 07/01/2040 | | | $ | 2,113,620 | |
| | 2,525,000 | | | Guam Government Waterworks Authority & Wastewater System | | | 5.875 | | | | 07/01/2035 | | | | 2,611,279 | |
| | 1,000,000 | | | Guam Government Waterworks Authority & Wastewater System | | | 6.000 | | | | 07/01/2025 | | | | 1,045,290 | |
| | 4,270,000 | | | Guam Power Authority, Series A1 | | | 5.125 | | | | 10/01/2029 | | | | 4,271,495 | |
| | 9,380,000 | | | Guam Power Authority, Series A1 | | | 5.250 | | | | 10/01/2034 | | | | 9,382,720 | |
| | 1,400,000 | | | Guam Power Authority, Series A | | | 5.500 | | | | 10/01/2030 | | | | 1,486,016 | |
| | 1,200,000 | | | Guam Power Authority, Series A | | | 5.500 | | | | 10/01/2040 | | | | 1,259,772 | |
| | 730,000 | | | Northern Mariana Islands Commonwealth, Series A | | | 5.000 | | | | 06/01/2017 | | | | 702,311 | |
| | 1,910,000 | | | Northern Mariana Islands Commonwealth, Series A | | | 5.000 | | | | 10/01/2022 | | | | 1,715,887 | |
| | 100,000 | | | Northern Mariana Islands Commonwealth, Series A1 | | | 6.750 | | | | 10/01/2033 | | | | 100,155 | |
| | 5,000,000 | | | Puerto Rico Aqueduct & Sewer Authority | | | 5.250 | | | | 07/01/2042 | | | | 4,995,850 | |
| | 6,280,000 | | | Puerto Rico Aqueduct & Sewer Authority | | | 6.000 | | | | 07/01/2038 | | | | 6,579,116 | |
| | 790,000 | | | Puerto Rico Aqueduct & Sewer Authority | | | 6.000 | | | | 07/01/2044 | | | | 824,823 | |
| | 21,210,000 | | | Puerto Rico Aqueduct & Sewer Authority | | | 6.125 | | | | 07/01/2024 | | | | 24,623,750 | |
| | 15,000 | | | Puerto Rico Children’s Trust Fund (TASC) | | | 5.375 | | | | 05/15/2033 | | | | 14,999 | |
| | 8,400,000 | | | Puerto Rico Children’s Trust Fund (TASC) | | | 5.500 | | | | 05/15/2039 | | | | 8,399,664 | |
| | 19,500,000 | | | Puerto Rico Children’s Trust Fund (TASC) | | | 5.625 | | | | 05/15/2043 | | | | 19,498,635 | |
| | 75,000 | | | Puerto Rico Commonwealth GO1 | | | 5.000 | | | | 07/01/2024 | | | | 76,537 | |
| | 4,595,000 | | | Puerto Rico Commonwealth GO | | | 5.250 | | | | 07/01/2031 | | | | 4,771,724 | |
| | 1,980,000 | | | Puerto Rico Commonwealth GO | | | 5.250 | | | | 07/01/2032 | | | | 2,055,715 | |
| | 485,000 | | | Puerto Rico Commonwealth GO | | | 5.500 | | | | 07/01/2018 | | | | 535,028 | |
| | 31,225,000 | | | Puerto Rico Commonwealth GO | | | 5.500 | | | | 07/01/2032 | | | | 32,896,474 | |
| | 1,500,000 | | | Puerto Rico Commonwealth GO | | | 5.625 | | | | 07/01/2033 | | | | 1,569,510 | |
| | 8,000,000 | | | Puerto Rico Commonwealth GO | | | 5.750 | | | | 07/01/2036 | | | | 8,493,520 | |
| | 5,000,000 | | | Puerto Rico Electric Power Authority, Series A | | | 5.000 | | | | 07/01/2042 | | | | 4,972,750 | |
| | 3,445,000 | | | Puerto Rico Electric Power Authority, Series AAA | | | 5.250 | | | | 07/01/2022 | | | | 3,741,546 | |
| | 5,450,000 | | | Puerto Rico Electric Power Authority, Series AAA | | | 5.250 | | | | 07/01/2024 | | | | 5,828,939 | |
| | 5,735,000 | | | Puerto Rico Electric Power Authority, Series AAA | | | 5.250 | | | | 07/01/2025 | | | | 6,094,699 | |
| | 3,410,000 | | | Puerto Rico Electric Power Authority, Series AAA | | | 5.250 | | | | 07/01/2027 | | | | 3,583,671 | |
| | 5,670,000 | | | Puerto Rico Electric Power Authority, Series AAA | | | 5.250 | | | | 07/01/2028 | | | | 5,943,578 | |
| | 1,945,000 | | | Puerto Rico Electric Power Authority, Series AAA | | | 5.250 | | | | 07/01/2029 | | | | 2,025,931 | |
| | 5,000,000 | | | Puerto Rico Electric Power Authority, Series AAA | | | 5.250 | | | | 07/01/2030 | | | | 5,201,400 | |
| | 2,155,000 | | | Puerto Rico Electric Power Authority, Series AAA | | | 5.250 | | | | 07/01/2031 | | | | 2,236,114 | |
| | 355,000 | | | Puerto Rico Highway & Transportation Authority1 | | | 5.000 | | | | 07/01/2028 | | | | 356,008 | |
| | 500,000 | | | Puerto Rico Highway & Transportation Authority | | | 5.300 | | | | 07/01/2035 | | | | 517,800 | |
| | 2,150,000 | | | Puerto Rico Highway & Transportation Authority1 | | | 5.500 | | | | 07/01/2030 | | | | 2,381,534 | |
| | | | |
| 35 | | | | OPPENHEIMER AMT-FREE NEW YORK MUNICIPALS |
STATEMENT OF INVESTMENTS Continued
| | | | | | | | | | | | | | | | |
Principal
Amount | | | | | Coupon | | | Maturity | | | Value | |
| | U.S. Possessions Continued | | | | | | | | | | | | |
| | $ 5,000 | | | Puerto Rico Highway & Transportation Authority, Series A1 | | | 5.000 | % | | | 07/01/2038 | | | $ | 5,000 | |
| | 7,405,000 | | | Puerto Rico Highway & Transportation Authority, Series K1 | | | 5.000 | | | | 07/01/2030 | | | | 7,469,868 | |
| | 225,000 | | | Puerto Rico Highway & Transportation Authority, Series N1 | | | 5.250 | | | | 07/01/2039 | | | | 238,565 | |
| | 4,000,000 | | | Puerto Rico Infrastructure1 | | | 5.000 | | | | 07/01/2041 | | | | 3,996,640 | |
| | 725,000 | | | Puerto Rico Infrastructure1 | | | 5.500 | | | | 07/01/2024 | | | | 783,007 | |
| | 15,000,000 | | | Puerto Rico Infrastructure | | | 5.650 | 4 | | | 07/01/2029 | | | | 5,848,500 | |
| | 4,600,000 | | | Puerto Rico Infrastructure | | | 7.460 | 4 | | | 07/01/2030 | | | | 1,655,908 | |
| | 2,500,000 | | | Puerto Rico Infrastructure (Mepsi Campus) | | | 6.500 | | | | 10/01/2037 | | | | 2,631,575 | |
| | 200,000 | | | Puerto Rico ITEMECF (Ana G. Mendez University)1 | | | 5.000 | | | | 04/01/2027 | | | | 206,260 | |
| | 1,100,000 | | | Puerto Rico ITEMECF (Ana G. Mendez University)1 | | | 5.000 | | | | 03/01/2036 | | | | 1,103,729 | |
| | 130,000 | | | Puerto Rico ITEMECF (Ana G. Mendez University)1 | | | 5.125 | | | | 04/01/2032 | | | | 133,494 | |
| | 190,000 | | | Puerto Rico ITEMECF (Ana G. Mendez University)1 | | | 5.375 | | | | 04/01/2042 | | | | 194,906 | |
| | 105,000 | | | Puerto Rico ITEMECF (Guaynabo Municipal Government Center)1 | | | 5.625 | | | | 07/01/2022 | | | | 105,240 | |
| | 100,000 | | | Puerto Rico ITEMECF (International American University)1 | | | 5.000 | | | | 10/01/2031 | | | | 111,366 | |
| | 4,305,000 | | | Puerto Rico ITEMECF (Polytechnic University)1 | | | 5.000 | | | | 08/01/2022 | | | | 4,306,808 | |
| | 1,500,000 | | | Puerto Rico ITEMECF (University of the Sacred Heart)1 | | | 5.250 | | | | 09/01/2031 | | | | 1,501,230 | |
| | 810,000 | | | Puerto Rico Public Buildings Authority1 | | | 5.250 | | | | 07/01/2029 | | | | 835,952 | |
| | 1,400,000 | | | Puerto Rico Public Buildings Authority1 | | | 6.500 | | | | 07/01/2030 | | | | 1,612,072 | |
| | 3,500,000 | | | Puerto Rico Public Buildings Authority1 | | | 6.750 | | | | 07/01/2036 | | | | 4,164,020 | |
| | 1,000,000 | | | Puerto Rico Public Buildings Authority1 | | | 7.000 | | | | 07/01/2021 | | | | 1,090,300 | |
| | 3,150,000 | | | Puerto Rico Public Buildings Authority1 | | | 7.000 | | | | 07/01/2025 | | | | 3,410,568 | |
| | 5,000,000 | | | Puerto Rico Public Finance Corp., Series B1 | | | 5.500 | | | | 08/01/2031 | | | | 5,254,950 | |
| | 14,995,000 | | | Puerto Rico Sales Tax Financing Corp., Series A5 | | | 5.250 | | | | 08/01/2057 | | | | 15,792,850 | |
| | 19,000,000 | | | Puerto Rico Sales Tax Financing Corp., Series A | | | 5.950 | 4 | | | 08/01/2056 | | | | 1,440,390 | |
| | 25,000,000 | | | Puerto Rico Sales Tax Financing Corp., Series A | | | 6.100 | 4 | | | 08/01/2044 | | | | 4,120,500 | |
| | 27,615,000 | | | Puerto Rico Sales Tax Financing Corp., Series A | | | 6.130 | 4 | | | 08/01/2043 | | | | 4,844,223 | |
| | 18,120,000 | | | Puerto Rico Sales Tax Financing Corp., Series A | | | 6.160 | 4 | | | 08/01/2036 | | | | 4,547,758 | |
| | 277,125,000 | | | Puerto Rico Sales Tax Financing Corp., Series A | | | 6.580 | 4 | | | 08/01/2054 | | | | 23,663,704 | |
| | 13,000,000 | | | Puerto Rico Sales Tax Financing Corp., Series C5 | | | 5.750 | | | | 08/01/2057 | | | | 14,342,640 | |
| | 26,550,000 | | | Puerto Rico Sales Tax Financing Corp., Series C | | | 6.190 | 4 | | | 08/01/2038 | | | | 5,813,123 | |
| | 1,000,000 | | | University of Puerto Rico1 | | | 5.000 | | | | 06/01/2025 | | | | 1,028,540 | |
| | 5,925,000 | | | University of Puerto Rico, Series Q1 | | | 5.000 | | | | 06/01/2030 | | | | 6,067,259 | |
| | | | |
| 36 | | | | OPPENHEIMER AMT-FREE NEW YORK MUNICIPALS |
| | | | | | | | | | | | | | | | |
Principal
Amount | | | | | Coupon | | | Maturity | | | Value | |
| | U.S. Possessions Continued | | | | | | | | | | | | |
| | $ 1,700,000 | | | University of Puerto Rico, Series Q1 | |
| 5.000
| %
| |
| 06/01/2036
|
| | $
| 1,726,926
|
|
| | | | | | | | | | | | | | | | 339,464,378 | |
| | Total Investments, at Value (Cost $1,520,057,831)—111.4% | | | | | | | | | | | 1,525,463,058 | |
| | Liabilities in Excess of Other Assets—(11.4) | | | | | | | | | | | (155,701,461 | ) |
| | | | | | | | | | | | | | |
|
|
|
| | Net Assets—100.0% | | | | | | | | | | $ | 1,369,761,597 | |
| | | | | | | | | | | | | | |
|
|
|
Footnotes to Statement of Investments
*September 28, 2012 represents the last business day of the Fund’s 2012 fiscal year. See Note 1 of the accompanying Notes.
1. All or a portion of the security position has been segregated for collateral to cover borrowings. See Note 6 of the accompanying Notes.
2. This security is accruing partial income at an anticipated effective rate based on expected interest and/or principal payments. The rate shown is the original contractual interest rate.
3. This security is not accruing income because the issuer has missed an interest payment on it and/or is not anticipated to make future interest and/or principal payments. The rate shown is the original contractual interest rate. See Note 1 of the accompanying Notes.
4. Zero coupon bond reflects effective yield on the date of purchase.
5. Security represents the underlying municipal bond with respect to an inverse floating rate security held by the Fund. The bond was purchased by the Fund and subsequently transferred to a trust, which issued the related inverse floating rate security. See Note 1 of the accompanying Notes.
6. Denotes a step bond: a zero coupon bond that converts to a fixed or variable interest rate at a designated future date.
| | | | |
| 37 | | | | OPPENHEIMER AMT-FREE NEW YORK MUNICIPALS |
STATEMENT OF INVESTMENTS Continued
To simplify the listings of securities, abbreviations are used per the table below:
| | |
| ACDS | | Assoc. for Children with Down Syndrome |
| ALIA | | Alliance of Long Island Agencies |
| AP | | Advantage Planning, Inc. |
| CCRC | | Continuing Care Retirement Community |
| CMA | | Community Mainstreaming Associates, Inc. |
| COP | | Certificates of Participation |
| CSMR | | Community Services for the Mentally Retarded |
| DA | | Dormitory Authority |
| DDI | | Developmental Disabilities Institute |
| DRIVERS | | Derivative Inverse Tax Exempt Receipts |
| EBC | | Engel Berman Corp. |
| EFC | | Environmental Facilities Corp. |
| EFLI | | Epilepsy Foundation of L.I., Inc. |
| FIT | | Fashion Institute of Technology |
| GO | | General Obligation |
| HAII | | Homes Anew II, Inc. |
| HDC | | Housing Devel. Corp. |
| HFA | | Housing Finance Agency |
| IDA | | Industrial Devel. Agency |
| IGHL | | Independent Group Home for Living |
| ITEMECF | | Industrial, Tourist, Educational, Medical and Environmental Community Facilities |
| | |
| L.I. | | Long Island |
| LIJMC | | Long Island Jewish Medical Center |
| MTA | | Metropolitan Transportation Authority |
| NCMRS | | Nassau Community Mental Retardation Services Company |
| NSUH | | North Shore University Hospital |
| NSUHGC | | North Shore University Hospital at Glen Cove |
| NY/NJ | | New York/New Jersey |
| NYC | | New York City |
| NYS | | New York State |
| NYU | | New York University |
| PSCH | | Professional Service Centers for the Handicapped, Inc. |
| ROLs | | Residual Option Longs |
| SNCH | | South Nassau Communities Hospital |
| TASC | | Tobacco Settlement Asset-Backed Bonds |
| TFABs | | Tobacco Flexible Amortization Bonds |
| UDC | | Urban Development Corporation |
| UVBH | | United Veteran’s Beacon House |
| WORCA | | Working Organization for Retarded Children and Adults |
| YMCA | | Young Men’s Christian Assoc. |
See accompanying Notes to Financial Statements.
| | | | |
| 38 | | | | OPPENHEIMER AMT-FREE NEW YORK MUNICIPALS |
STATEMENT OF ASSETS AND LIABILITIES September 28, 20121
| | | | |
| Assets | | | |
| Investments, at value (cost $1,520,057,831)—see accompanying statement of investments | | $ | 1,525,463,058 | |
| Cash | | | 4,709,025 | |
| Receivables and other assets: | | | | |
| Interest | | | 20,049,071 | |
| Shares of beneficial interest sold | | | 2,735,733 | |
| Investments sold | | | 165,000 | |
| Other | |
| 381,851
|
|
| Total assets | | | 1,553,503,738 | |
| Liabilities | | | |
| Payables and other liabilities: | | | | |
| Payable for short-term floating rate notes issued (See Note 1) | | | 163,980,000 | |
| Payable on borrowings (See Note 6) | | | 16,800,000 | |
| Shares of beneficial interest redeemed | | | 1,242,687 | |
| Dividends | | | 1,099,685 | |
| Distribution and service plan fees | | | 271,296 | |
| Trustees’ compensation | | | 209,206 | |
| Transfer and shareholder servicing agent fees | | | 29,613 | |
| Shareholder communications | | | 24,290 | |
| Interest expense on borrowings | | | 1,671 | |
| Other | |
| 83,693
|
|
| Total liabilities | | | 183,742,141 | |
| Net Assets | | $
| 1,369,761,597
|
|
| Composition of Net Assets | | | |
| Par value of shares of beneficial interest | | $ | 112,036 | |
| Additional paid-in capital | | | 1,452,680,443 | |
| Accumulated net investment income | | | 11,894,631 | |
| Accumulated net realized loss on investments | | | (100,330,740 | ) |
| Net unrealized appreciation on investments | |
| 5,405,227
|
|
| Net Assets | | $
| 1,369,761,597
|
|
1. September 28, 2012 represents the last business day of the Fund’s 2012 fiscal year. See Note 1 of the accompanying Notes.
| | | | |
| 39 | | | | OPPENHEIMER AMT-FREE NEW YORK MUNICIPALS |
STATEMENT OF ASSETS AND LIABILITIES Continued
| | | | |
| Net Asset Value Per Share | | | |
| Class A Shares: | | | | |
| Net asset value and redemption price per share (based on net assets of $1,166,114,932 and 95,387,848 shares of beneficial interest outstanding) | | $ | 12.22 | |
| Maximum offering price per share (net asset value plus sales charge of 4.75% of offering price) | | $ | 12.83 | |
| Class B Shares: | | | | |
| Net asset value, redemption price (excludes applicable contingent deferred sales charge) and offering price per share (based on net assets of $9,804,358 and 801,522 shares of beneficial interest outstanding) | | $ | 12.23 | |
| Class C Shares: | | | | |
| Net asset value, redemption price (excludes applicable contingent deferred sales charge) and offering price per share (based on net assets of $154,673,710 and 12,645,120 shares of beneficial interest outstanding) | | $ | 12.23 | |
| Class Y Shares: | | | | |
| Net asset value, redemption price and offering price per share (based on net assets of $39,168,597 and 3,201,472 shares of beneficial interest outstanding) | | $ | 12.23 | |
See accompanying Notes to Financial Statements.
| | | | |
| 40 | | | | OPPENHEIMER AMT-FREE NEW YORK MUNICIPALS |
STATEMENT OF OPERATIONS For the Year Ended September 28, 20121
| | | | |
| Investment Income | | | |
| Interest | | $ | 81,315,308 | |
| Other income | |
| 1,884
|
|
| Total investment income | | | 81,317,192 | |
| Expenses | | | |
| Management fees | | | 5,738,325 | |
| Distribution and service plan fees: | | | | |
| Class A | | | 2,581,923 | |
| Class B | | | 112,484 | |
| Class C | | | 1,396,958 | |
| Transfer and shareholder servicing agent fees: | | | | |
| Class A | | | 283,670 | |
| Class B | | | 13,602 | |
| Class C | | | 57,374 | |
| Class Y | | | 10,112 | |
| Shareholder communications: | | | | |
| Class A | | | 44,208 | |
| Class B | | | 80 | |
| Class C | | | 6,384 | |
| Class Y | | | 1,102 | |
| Interest expense and fees on short-term floating rate notes issued (See Note 1) | | | 1,718,782 | |
| Borrowing fees | | | 1,049,489 | |
| Interest expense on borrowings | | | 34,723 | |
| Trustees’ compensation | | | 33,117 | |
| Custodian fees and expenses | | | 8,909 | |
| Administration service fees | | | 1,500 | |
| Other | |
| 268,692
|
|
| Total expenses | | | 13,361,434 | |
| Less waivers and reimbursements of expenses | |
| (174,932
| )
|
| Net expenses | | | 13,186,502 | |
| Net Investment Income | | | 68,130,690 | |
| Realized and Unrealized Gain | | | |
| Net realized gain on investments | | | 3,019,292 | |
| Net change in unrealized appreciation/depreciation on investments | | | 93,082,930 | |
| Net Increase in Net Assets Resulting from Operations | | $
| 164,232,912
|
|
1. September 28, 2012 represents the last business day of the Fund’s 2012 fiscal year. See Note 1 of the accompanying Notes.
See accompanying Notes to Financial Statements.
| | | | |
| 41 | | | | OPPENHEIMER AMT-FREE NEW YORK MUNICIPALS |
STATEMENTS OF CHANGES IN NET ASSETS
| | | | | | | | |
| | | Year Ended
September 28,
20121 | | | Year Ended
September 30,
2011 | |
| Operations | | | | | | |
| Net investment income | | $ | 68,130,690 | | | $ | 70,335,759 | |
| Net realized gain (loss) | | | 3,019,292 | | | | (20,539,174 | ) |
| Net change in unrealized appreciation/depreciation | |
| 93,082,930
|
| |
| (53,624,520
| )
|
| Net increase (decrease) in net assets resulting from operations | | | 164,232,912 | | | | (3,827,935 | ) |
| Dividends and/or Distributions to Shareholders | | | | | | |
| Dividends from net investment income: | | | | | | | | |
| Class A | | | (61,901,133 | ) | | | (64,323,944 | ) |
| Class B | | | (555,525 | ) | | | (774,633 | ) |
| Class C | | | (6,954,133 | ) | | | (7,494,177 | ) |
| Class Y | |
| (1,356,003
| )
| |
| (227,872
| )
|
| | | | (70,766,794 | ) | | | (72,820,626 | ) |
| Beneficial Interest Transactions | | | | | | |
| Net increase (decrease) in net assets resulting from beneficial interest transactions: | | | | | | | | |
| Class A | | | 87,187,287 | | | | (85,375,879 | ) |
| Class B | | | (3,794,454 | ) | | | (3,589,310 | ) |
| Class C | | | 17,318,480 | | | | (20,810,343 | ) |
| Class Y | |
| 31,503,761
|
| |
| 5,408,765
|
|
| | | | 132,215,074 | | | | (104,366,767 | ) |
| Net Assets | | | | | | |
| Total increase (decrease) | | | 225,681,192 | | | | (181,015,328 | ) |
| Beginning of period | |
| 1,144,080,405
|
| |
| 1,325,095,733
|
|
| End of period (including accumulated net investment income of $11,894,631 and $14,869,997, respectively) | | $
| 1,369,761,597
|
| | $
| 1,144,080,405
|
|
1. September 28, 2012 represents the last business day of the Fund’s 2012 fiscal year. See Note 1 of the accompanying Notes.
See accompanying Notes to Financial Statements.
| | | | |
| 42 | | | | OPPENHEIMER AMT-FREE NEW YORK MUNICIPALS |
STATEMENT OF CASH FLOWS For the Year Ended September 28, 20121
| | | | |
| Cash Flows from Operating Activities | | | |
| Net increase in net assets from operations | | $ | 164,232,912 | |
Adjustments to reconcile net increase in net assets from operations
to net cash used in operating activities: | | | | |
Purchase of investment securities | | | (302,678,549 | ) |
Proceeds from disposition of investment securities | | | 192,295,746 | |
Short-term investment securities, net | | | 9,362,041 | |
Premium amortization | | | 1,989,534 | |
Discount accretion | | | (8,348,015 | ) |
Net realized gain on investments | | | (3,019,292 | ) |
Net change in unrealized appreciation/depreciation on investments | | | (93,082,930 | ) |
| Change in assets: | | | | |
Decrease in receivable for securities sold | | | 115,396 | |
Increase in other assets | | | (141,346 | ) |
Increase in interest receivable | | | (963,486 | ) |
| Change in liabilities: | | | | |
Increase in other liabilities | | | 31,929 | |
Decrease in payable for securities purchased | |
| (7,754,955
| )
|
| Net cash used in operating activities | | | (47,961,015 | ) |
| Cash Flows from Financing Activities | | | | |
| Proceeds from bank borrowings | | | 298,900,000 | |
| Payments on bank borrowings | | | (285,000,000 | ) |
| Payments on short-term floating rate notes issued | | | (21,310,000 | ) |
| Proceeds from shares sold | | | 255,048,139 | |
| Payments on shares redeemed | | | (181,448,875 | ) |
| Cash distributions paid | |
| (13,754,554
| )
|
| Net cash provided by financing activities | | | 52,434,710 | |
| Net increase in cash | | | 4,473,695 | |
| Cash, beginning balance | |
| 235,330
|
|
| Cash, ending balance | | $
| 4,709,025
|
|
| Supplemental disclosure of cash flow information: | | | | |
| Noncash financing activities not included herein consist of reinvestment of dividends and distributions of $56,509,782. | | | | |
| Cash paid for interest on bank borrowings—$34,090. | | | | |
| Cash paid for interest on short-term floating rate notes issued—$1,718,782. | | | | |
1. September 28, 2012 represents the last business day of the Fund’s 2012 fiscal year. See Note 1 of the accompanying Notes.
See accompanying Notes to Financial Statements.
| | | | |
| 43 | | | | OPPENHEIMER AMT-FREE NEW YORK MUNICIPALS |
FINANCIAL HIGHLIGHTS
| | | | | | | | | | | | | | | | | | | | |
| | | Year Ended
September 28, | | | Year Ended September 30, | |
| Class A | | 20121 | | | 2011 | | | 2010 | | | 2009 | | | 2008 | |
| | | | | | | | | | | | | | | | | | | | | |
| Per Share Operating Data | | | | | | | | | | | | | | | |
| Net asset value, beginning of period | | $ | 11.33 | | | $ | 11.97 | | | $ | 11.73 | | | $ | 10.60 | | | $ | 12.68 | |
| Income (loss) from investment operations: | | | | | | | | | | | | | | | | | |
| Net investment income2 | | | .66 | | | | .69 | | | | .69 | | | | .65 | | | | .62 | |
| Net realized and unrealized gain (loss) | |
| .91
|
| |
| (.61
| )
| |
| .19
|
| |
| 1.07
|
| |
| (2.13
| )
|
| Total from investment operations | | | 1.57 | | | | .08 | | | | .88 | | | | 1.72 | | | | (1.51 | ) |
| Dividends and/or distributions to shareholders: | | | | | | | | | | | | | | | | | |
| Dividends from net investment income | | | (.68 | ) | | | (.72 | ) | | | (.64 | ) | | | (.59 | ) | | | (.57 | ) |
| Net asset value, end of period | | $
| 12.22
|
| | $
| 11.33
|
| | $
| 11.97
|
| | $
| 11.73
|
| | $
| 10.60
|
|
| Total Return, at Net Asset Value3 | | | 14.20 | % | | | 1.12 | % | | | 7.90 | % | | | 17.86 | % | | | (12.31 | )% |
| | | | | | | | | | | | | | | | | | | | | |
| Ratios/Supplemental Data | | | | | | | | | | | | | | | |
| Net assets, end of period (in thousands) | | | $1,166,115 | | | | $998,502 | | | | $1,150,410 | | | | $1,176,870 | | | | $1,095,341 | |
| Average net assets (in thousands) | | | $1,072,671 | | | | $984,892 | | | | $1,121,641 | | | | $ 933,439 | | | | $1,244,330 | |
| Ratios to average net assets:4 | | | | | | | | | | | | | | | | | | | | |
| Net investment income | | | 5.56 | % | | | 6.31 | % | | | 5.97 | % | | | 6.91 | % | | | 5.13 | % |
| Expenses excluding interest and fees on short-term floating rate notes issued and interest and fees from borrowings | | | 0.75 | % | | | 0.77 | % | | | 0.75 | % | | | 0.78 | % | | | 0.74 | % |
| Interest and fees from borrowings | | | 0.09 | % | | | 0.10 | % | | | 0.14 | % | | | 0.64 | % | | | 0.08 | % |
| Interest and fees on short-term floating rate notes issued5 | |
| 0.14
| %
| |
| 0.16
| %
| |
| 0.08
| %
| |
| 0.32
| %
| |
| 0.60
| %
|
| Total expenses | | | 0.98 | % | | | 1.03 | % | | | 0.97 | % | | | 1.74 | % | | | 1.42 | % |
| Expenses after payments, waivers and/or reimbursements and reduction to custodian expenses | | | 0.97 | % | | | 1.03 | % | | | 0.97 | % | | | 1.74 | % | | | 1.42 | % |
| Portfolio turnover rate | | | 14 | % | | | 21 | % | | | 16 | % | | | 22 | % | | | 34 | % |
1. September 28, 2012 represents the last business day of the Fund’s 2012 fiscal year. See Note 1 of the accompanying Notes.
2. Per share amounts calculated based on the average shares outstanding during the period.
3. Assumes an initial investment on the business day before the first day of the fiscal period, with all dividends and distributions reinvested in additional shares on the reinvestment date, and redemption at the net asset value calculated on the last business day of the fiscal period. Sales charges are not reflected in the total returns. Total returns are not annualized for periods less than one full year. Returns do not reflect the deduction of taxes that a shareholder would pay on fund distributions or the redemption of fund shares.
4. Annualized for periods less than one full year.
5. Interest and fee expense relates to the Fund’s liability for short-term floating rate notes issued in conjunction with inverse floating rate security transactions.
See accompanying Notes to Financial Statements.
| | | | |
| 44 | | | | OPPENHEIMER AMT-FREE NEW YORK MUNICIPALS |
| | | | | | | | | | | | | | | | | | | | |
| | | Year Ended September 28, | | | Year Ended September 30, | |
| Class B | | 20121 | | | 2011 | | | 2010 | | | 2009 | | | 2008 | |
| | | | | | | | | | | | | | | | | | | | | |
| Per Share Operating Data | | | | | | | | | | | | | | | |
| Net asset value, beginning of period | | $ | 11.33 | | | $ | 11.98 | | | $ | 11.73 | | | $ | 10.61 | | | $ | 12.68 | |
| Income (loss) from investment operations: | | | | | | | | | | | | | | | | | |
| Net investment income2 | | | .56 | | | | .59 | | | | .59 | | | | .57 | | | | .52 | |
| Net realized and unrealized gain (loss) | |
| .92
|
| |
| (.62
| )
| |
| .21
|
| |
| 1.06
|
| |
| (2.12
| )
|
| Total from investment operations | | | 1.48 | | | | (.03 | ) | | | .80 | | | | 1.63 | | | | (1.60 | ) |
| Dividends and/or distributions to shareholders: | | | | | | | | | | | | | | | | | |
| Dividends from net investment income | | | (.58 | ) | | | (.62 | ) | | | (.55 | ) | | | (.51 | ) | | | (.47 | ) |
| Net asset value, end of period | | $
| 12.23
|
| | $
| 11.33
|
| | $
| 11.98
|
| | $
| 11.73
|
| | $
| 10.61
|
|
| Total Return, at Net Asset Value3 | | | 13.34 | % | | | 0.13 | % | | | 7.09 | % | | | 16.75 | % | | | (12.96 | )% |
| | | | | | | | | | | | | | | | | | | | | |
| Ratios/Supplemental Data | | | | | | | | | | | | | | | |
| Net assets, end of period (in thousands) | | | $ 9,804 | | | | $12,712 | | | | $17,430 | | | | $20,239 | | | | $22,079 | |
| Average net assets (in thousands) | | | $11,225 | | | | $13,766 | | | | $17,741 | | | | $17,152 | | | | $27,621 | |
| Ratios to average net assets:4 | | | | | | | | | | | | | | | | | | | | |
| Net investment income | | | 4.76 | % | | | 5.41 | % | | | 5.12 | % | | | 6.06 | % | | | 4.29 | % |
| Expenses excluding interest and fees on short-term floating rate notes issued and interest and fees from borrowings | | | 1.61 | % | | | 1.66 | % | | | 1.60 | % | | | 1.64 | % | | | 1.57 | % |
| Interest and fees from borrowings | | | 0.09 | % | | | 0.10 | % | | | 0.14 | % | | | 0.64 | % | | | 0.08 | % |
| Interest and fees on short-term floating rate notes issued5 | |
| 0.14
| %
| |
| 0.16
| %
| |
| 0.08
| %
| |
| 0.32
| %
| |
| 0.60
| %
|
| Total expenses | | | 1.84 | % | | | 1.92 | % | | | 1.82 | % | | | 2.60 | % | | | 2.25 | % |
| Expenses after payments, waivers and/or reimbursements and reduction to custodian expenses | | | 1.83 | % | | | 1.92 | % | | | 1.82 | % | | | 2.60 | % | | | 2.25 | % |
| Portfolio turnover rate | | | 14 | % | | | 21 | % | | | 16 | % | | | 22 | % | | | 34 | % |
1. September 28, 2012 represents the last business day of the Fund’s 2012 fiscal year. See Note 1 of the accompanying Notes.
2. Per share amounts calculated based on the average shares outstanding during the period.
3. Assumes an initial investment on the business day before the first day of the fiscal period, with all dividends and distributions reinvested in additional shares on the reinvestment date, and redemption at the net asset value calculated on the last business day of the fiscal period. Sales charges are not reflected in the total returns. Total returns are not annualized for periods less than one full year. Returns do not reflect the deduction of taxes that a shareholder would pay on fund distributions or the redemption of fund shares.
4. Annualized for periods less than one full year.
5. Interest and fee expense relates to the Fund’s liability for short-term floating rate notes issued in conjunction with inverse floating rate security transactions.
See accompanying Notes to Financial Statements.
| | | | |
| 45 | | | | OPPENHEIMER AMT-FREE NEW YORK MUNICIPALS |
FINANCIAL HIGHLIGHTS Continued
| | | | | | | | | | | | | | | | | | | | |
| | | Year Ended
September 28, | | | | | | Year Ended September 30, | |
| Class C | | 20121 | | | 2011 | | | 2010 | | | 2009 | | | 2008 | |
| | | | | | | | | | | | | | | | | | | | | |
| Per Share Operating Data | | | | | | | | | | | | | | | |
| Net asset value, beginning of period | | $ | 11.33 | | | $ | 11.98 | | | $ | 11.73 | | | $ | 10.61 | | | $ | 12.68 | |
| Income (loss) from investment operations: | | | | | | | | | | | | | | | | | |
| Net investment income2 | | | .57 | | | | .60 | | | | .60 | | | | .58 | | | | .53 | |
| Net realized and unrealized gain (loss) | |
| .92
|
| |
| (.61
| )
| |
| .20
|
| |
| 1.06
|
| |
| (2.12
| )
|
| Total from investment operations | | | 1.49 | | | | (.01 | ) | | | .80 | | | | 1.64 | | | | (1.59 | ) |
| Dividends and/or distributions to shareholders: | | | | | | | | | | | | | | | | | |
| Dividends from net investment income | | | (.59 | ) | | | (.64 | ) | | | (.55 | ) | | | (.52 | ) | | | (.48 | ) |
| Net asset value, end of period | | $
| 12.23
|
| | $
| 11.33
|
| | $
| 11.98
|
| | $
| 11.73
|
| | $
| 10.61
|
|
| Total Return, at Net Asset Value3 | | | 13.42 | % | | | 0.24 | % | | | 7.17 | % | | | 16.84 | % | | | (12.92 | )% |
| | | | | | | | | | | | | | | | | | | | | |
| Ratios/Supplemental Data | | | | | | | | | | | | | | | |
| Net assets, end of period (in thousands) | | | $154,674 | | | | $126,880 | | | | $157,256 | | | | $158,179 | | | | $141,579 | |
| Average net assets (in thousands) | | | $139,433 | | | | $130,387 | | | | $150,880 | | | | $122,746 | | | | $160,910 | |
| Ratios to average net assets:4 | | | | | | | | | | | | | | | | | | | | |
| Net investment income | | | 4.78 | % | | | 5.53 | % | | | 5.19 | % | | | 6.14 | % | | | 4.35 | % |
| Expenses excluding interest and fees on short-term floating rate notes issued and interest and fees from borrowings | | | 1.53 | % | | | 1.55 | % | | | 1.52 | % | | | 1.56 | % | | | 1.52 | % |
| Interest and fees from borrowings | | | 0.09 | % | | | 0.10 | % | | | 0.14 | % | | | 0.64 | % | | | 0.08 | % |
| Interest and fees on short-term floating rate notes issued5 | |
| 0.14
| %
| |
| 0.16
| %
| |
| 0.08
| %
| |
| 0.32
| %
| |
| 0.60
| %
|
| Total expenses | | | 1.76 | % | | | 1.81 | % | | | 1.74 | % | | | 2.52 | % | | | 2.20 | % |
| Expenses after payments, waivers and/or reimbursements and reduction to custodian expenses | | | 1.75 | % | | | 1.81 | % | | | 1.74 | % | | | 2.52 | % | | | 2.20 | % |
| Portfolio turnover rate | | | 14 | % | | | 21 | % | | | 16 | % | | | 22 | % | | | 34 | % |
1. September 28, 2012 represents the last business day of the Fund’s 2012 fiscal year. See Note 1 of the accompanying Notes.
2. Per share amounts calculated based on the average shares outstanding during the period.
3. Assumes an initial investment on the business day before the first day of the fiscal period, with all dividends and distributions reinvested in additional shares on the reinvestment date, and redemption at the net asset value calculated on the last business day of the fiscal period. Sales charges are not reflected in the total returns. Total returns are not annualized for periods less than one full year. Returns do not reflect the deduction of taxes that a shareholder would pay on fund distributions or the redemption of fund shares.
4. Annualized for periods less than one full year.
5. Interest and fee expense relates to the Fund’s liability for short-term floating rate notes issued in conjunction with inverse floating rate security transactions.
See accompanying Notes to Financial Statements.
| | | | |
| 46 | | | | OPPENHEIMER AMT-FREE NEW YORK MUNICIPALS |
| | | | | | | | |
| | | Year Ended
September 28, | | | Period Ended
September 30, | |
| Class Y | | 20121 | | | 20112 | |
| | | | | | | | | |
| Per Share Operating Data | | | | | | |
| Net asset value, beginning of period | | $ | 11.34 | | | $ | 10.46 | |
| Income (loss) from investment operations: | | | | | | | | |
| Net investment income3 | | | .67 | | | | .47 | |
| Net realized and unrealized gain | |
| .92
|
| |
| .91
|
|
| Total from investment operations | | | 1.59 | | | | 1.38 | |
| Dividends and/or distributions to shareholders: | | | | | | | | |
| Dividends from net investment income | | | (.70 | ) | | | (.50 | ) |
| Net asset value, end of period | | $
| 12.23
|
| | $
| 11.34
|
|
| Total Return, at Net Asset Value4 | | | 14.43 | % | | | 13.69 | % |
| | | | | | | | | |
| Ratios/Supplemental Data | | | | | | |
| Net assets, end of period (in thousands) | | | $39,169 | | | | $5,986 | |
| Average net assets (in thousands) | | | $22,893 | | | | $4,972 | |
| Ratios to average net assets:5 | | | | | | | | |
| Net investment income | | | 5.69 | % | | | 6.55 | % |
| Expenses excluding interest and fees on short-term floating rate notes issued and interest and fees from borrowings | | | 0.53 | % | | | 0.54 | % |
| Interest and fees from borrowings | | | 0.09 | % | | | 0.10 | % |
| Interest and fees on short-term floating rate notes issued6 | |
| 0.14
| %
| |
| 0.16
| %
|
| Total expenses | | | 0.76 | % | | | 0.80 | % |
| Expenses after payments, waivers and/or reimbursements and reduction to custodian expenses | | | 0.75 | % | | | 0.80 | % |
| Portfolio turnover rate | | | 14 | % | | | 21 | % |
1. September 28, 2012 represents the last business day of the Fund’s 2012 fiscal year. See Note 1 of the accompanying Notes.
2. For the period from January 31, 2011 (inception of offering) to September 30, 2011.
3. Per share amounts calculated based on the average shares outstanding during the period.
4. Assumes an initial investment on the business day before the first day of the fiscal period, with all dividends and distributions reinvested in additional shares on the reinvestment date, and redemption at the net asset value calculated on the last business day of the fiscal period. Sales charges are not reflected in the total returns. Total returns are not annualized for periods less that one full year. Returns do not reflect the deduction of taxes that a shareholder would pay on fund distributions or the redemption of fund shares.
5. Annualized for periods less than one full year.
6. Interest and fee expense relates to the Fund’s liability for short-term floating rate notes issued in conjunction with inverse floating rate security transactions.
See accompanying Notes to Financial Statements.
| | | | |
| 47 | | | | OPPENHEIMER AMT-FREE NEW YORK MUNICIPALS |
NOTES TO FINANCIAL STATEMENTS
1. Significant Accounting Policies
Oppenheimer AMT-Free New York Municipals (the “Fund”) is registered under the Investment Company Act of 1940, as amended, as an open-end management investment company. The Fund’s investment objective is to seek the maximum current income exempt from federal, New York State and New York City income taxes for individual investors consistent with preservation of capital. The Fund’s investment adviser is OppenheimerFunds, Inc. (the “Manager”).
The Fund offers Class A, Class C and Class Y shares, and previously offered Class B shares for new purchase through June 29, 2012. Subsequent to that date, no new purchases of Class B shares will be permitted, however reinvestment of dividend and/or capital gain distributions and exchanges of Class B shares into and from other Oppenheimer funds will be allowed. Class A shares are sold at their offering price, which is normally net asset value plus a front-end sales charge. Class C shares are sold, and Class B shares were sold, without a front-end sales charge but may be subject to a contingent deferred sales charge (“CDSC”). Class Y shares are sold to certain institutional investors or intermediaries without either a front-end sales charge or a CDSC, however, the intermediaries may impose charges on their accountholders who beneficially own Class Y shares. All classes of shares have identical rights and voting privileges with respect to the Fund in general and exclusive voting rights on matters that affect that class alone. Earnings, net assets and net asset value per share may differ due to each class having its own expenses, such as transfer and shareholder servicing agent fees and shareholder communications, directly attributable to that class. Class A, B and C shares have separate distribution and/or service plans under which they pay fees. Class Y shares do not pay such fees. Class B shares will automatically convert to Class A shares 72 months after the date of purchase.
The following is a summary of significant accounting policies consistently followed by the Fund.
Fiscal Year End. The last day of the Fund’s fiscal year was the last day the New York Stock Exchange was open for trading. The Fund’s financial statements have been presented through that date to maintain consistency with the Fund’s net asset value calculations used for shareholder transactions.
Inverse Floating Rate Securities. The Fund invests in inverse floating rate securities that pay interest at a rate that varies inversely with short-term interest rates. Because inverse floating rate securities are leveraged instruments, the value of an inverse floating rate security will change more significantly in response to changes in interest rates and other market fluctuations than the market value of a conventional fixed-rate municipal security of similar maturity and credit quality, including the municipal bond underlying an inverse floating rate security.
An inverse floating rate security is created as part of a financial transaction referred to as a “tender option bond” transaction. In most cases, in a tender option bond transaction the Fund sells a fixed-rate municipal bond (the “underlying municipal bond”) to a broker dealer (the “sponsor”). The sponsor creates a trust (the “Trust”) into which it deposits the
| | | | |
| 48 | | | | OPPENHEIMER AMT-FREE NEW YORK MUNICIPALS |
underlying municipal bond. The Trust then issues and sells short-term floating rate securities with a fixed principal amount representing a senior interest in the underlying municipal bond to third parties and a residual, subordinate interest in the underlying municipal bond (referred to as an “inverse floating rate security”) to the Fund. The interest rate on the short-term floating rate securities resets periodically, usually weekly, to a prevailing market rate and holders of these securities are granted the option to tender their securities back to the Trust for repurchase at their principal amount plus accrued interest thereon (the “purchase price”) periodically, usually daily or weekly. A remarketing agent for the Trust is required to attempt to re-sell any tendered short-term floating rate securities to new investors for the purchase price. If the remarketing agent is unable to successfully re-sell the tendered short-term floating rate securities, a liquidity provider to the Trust (typically an affiliate of the sponsor) must contribute cash to the Trust to ensure that the tendering holders receive the purchase price of their securities on the repurchase date.
Because holders of the short-term floating rate securities are granted the right to tender their securities to the Trust for repurchase at frequent intervals for the purchase price, with such payment effectively guaranteed by the liquidity provider, the securities generally bear short-term rates of interest commensurate with money market instruments. When interest is paid on the underlying municipal bond to the Trust, such proceeds are first used to pay the Trust’s administrative expenses and accrued interest to holders of the short-term floating rate securities, with any remaining amounts being paid to the Fund, as the holder of the inverse floating rate security. Accordingly, the amount of such interest on the underlying municipal bond paid to the Fund is inversely related the rate of interest on the short-term floating rate securities. Additionally, because the principal amount of the short-term floating rate securities is fixed and is not adjusted in response to changes in the market value of the underlying municipal bond, any change in the market value of the underlying municipal bond is reflected entirely in a change to the value of the inverse floating rate security.
Typically, the terms of an inverse floating rate security grant certain rights to the Fund, as holder. For example, the Fund may have the right upon request to require that the Trust compel a tender of the short-term floating rate securities to facilitate the Fund’s acquisition of the underlying municipal bond. Following such a request, the Fund pays the Trust the purchase price of the short-term floating rate securities and a specified portion of any market value gain on the underlying municipal bond since its deposit into the Trust, which the Trust uses to redeem the short-term floating rate securities. The Trust then distributes the underlying municipal bond to the Fund. Similarly, the Fund may have the right to directly purchase the underlying municipal bond from the Trust by paying to the Trust the purchase price of the short-term floating rate securities and a specified portion of any market value gain on the underlying municipal bond since its deposit into the Trust, which the Trust uses to redeem the short-term floating rate securities. Through the exercise of either of these rights, the Fund can voluntarily terminate or “collapse” the Trust, terminate its investment in the related inverse floating rate security and obtain the underlying municipal bond. Additionally, the Fund also typically has the right to exchange
| | | | |
| 49 | | | | OPPENHEIMER AMT-FREE NEW YORK MUNICIPALS |
NOTES TO FINANCIAL STATEMENTS Continued
1. Significant Accounting Policies Continued
with the Trust (i) a principal amount of short-term floating rate securities held by the Fund for a corresponding additional principal amount of the inverse floating rate security or (ii) a principal amount of the inverse floating rate security held by the Fund for a corresponding additional principal amount of short-term floating rate securities (which are typically then sold to other investors). Through the exercise of this right, the Fund may increase (or decrease) the principal amount of short-term floating rate securities outstanding, thereby increasing (or decreasing) the amount of leverage provided by the short-term floating rate securities to the Fund’s investment exposure to the underlying municipal bond.
The Fund’s investments in inverse floating rate securities involve certain risks. As short-term interest rates rise, an inverse floating rate security produces less current income (and, in extreme cases, may pay no income) and as short-term interest rates fall, an inverse floating rate security produces more current income. Thus, if short-term interest rates rise after the issuance of the inverse floating rate security, any yield advantage is reduced or eliminated. All inverse floating rate securities entail some degree of leverage represented by the outstanding principal amount of the related short-term floating rate securities. The value of, and income earned on, an inverse floating rate security that has a higher degree of leverage will fluctuate more significantly in response to changes in interest rates and to changes in the market value of the related underlying municipal bond than that of an inverse floating rate security with a lower degree of leverage, and is more likely to be eliminated entirely under adverse market conditions. Changes in the value of an inverse floating rate security will also be more significant than changes in the market value of the related underlying municipal bond because the leverage provided by the related short-term floating rate securities increases the sensitivity of an inverse floating rate security to changes in interest rates and to the market value of the underlying municipal bond. An inverse floating rate security can be expected to underperform fixed-rate municipal bonds when the difference between long-term and short-term interest rates is decreasing (or is already small) or when long-term interest rates are rising, but can be expected to outperform fixed-rate municipal bonds when the difference between long-term and short-term interest rates is increasing (or is already large) or when long-term interest rates are falling. Additionally, a tender option bond transaction typically provides for the automatic termination or “collapse” of a Trust upon the occurrence of certain adverse events, usually referred to as “mandatory tender events” or “tender option termination events.” These events may include, among others, a credit ratings downgrade of the underlying municipal bond below a specified level, a decrease in the market value of the underlying municipal bond below a specified amount, a bankruptcy of the liquidity provider or the inability of the remarketing agent to re-sell to new investors short-term floating rate securities that have been tendered for repurchase by holders thereof. Following the occurrence of such an event, the underlying municipal bond is generally sold for current market value and the proceeds distributed to holders of the short-term floating rate securities and inverse floating rate security, with the holder of the inverse floating rate security (the Fund)
| | | | |
| 50 | | | | OPPENHEIMER AMT-FREE NEW YORK MUNICIPALS |
generally receiving the proceeds of such sale only after the holders of the short-term floating rate securities have received proceeds equal to the purchase price of their securities (and the liquidity provider is generally required to contribute cash to the Trust only in an amount sufficient to ensure that the holders of the short-term floating rate securities receive the purchase price of their securities in connection with such termination of the Trust). Following the occurrence of such events, the Fund could potentially lose the entire amount of its investment in the inverse floating rate security.
Finally, the Fund may enter into shortfall/reimbursement agreements with the liquidity provider of certain tender option bond transactions in connection with certain inverse floating rate securities held by the Fund. These agreements commit the Fund to reimburse the liquidity provider to the extent that the liquidity provider must provide cash to a Trust, including following the termination of a Trust resulting from the occurrence of a “mandatory tender event.” In connection with the occurrence of such an event and the termination of the Trust triggered thereby, the shortfall/reimbursement agreement will make the Fund liable for the amount of the negative difference, if any, between the liquidation value of the underlying municipal bond and the purchase price of the short-term floating rate securities issued by the Trust. Under the standard terms of a tender option bond transaction, absent such a shortfall/reimbursement agreement, the Fund, as holder of the inverse floating rate security, would not be required to make such a reimbursement payment to the liquidity provider. The Manager monitors the Fund’s potential exposure with respect to these agreements on a daily basis and intends to take action to terminate the Fund’s investment in related inverse floating rate securities, if it deems it appropriate to do so. As of September 28, 2012, the Fund’s maximum exposure under such agreements is estimated at $119,070,000.
When the Fund creates an inverse floating rate security in a tender option bond transaction by selling an underlying municipal bond to a sponsor for deposit into a Trust, the transaction is considered a secured borrowing for financial reporting purposes. As a result of such accounting treatment, the Fund includes the underlying municipal bond on its Statement of Investments and as an asset on its Statement of Assets and Liabilities (but does not separately include the related inverse floating rate security on either). The Fund also includes a liability on its Statement of Assets and Liabilities equal to the outstanding principal amount and accrued interest on the related short-term floating rate securities issued by the Trust. Interest on the underlying municipal bond is recorded as investment income on the Fund’s Statement of Operations, while interest payable on the related short-term floating rate securities is recorded as interest expense. At September 28, 2012, municipal bond holdings with a value of $297,679,293 shown on the Fund’s Statement of Investments are held by such Trusts and serve as the underlying municipal bonds for the related $163,980,000 in short-term floating rate securities issued and outstanding at that date.
| | | | |
| 51 | | | | OPPENHEIMER AMT-FREE NEW YORK MUNICIPALS |
NOTES TO FINANCIAL STATEMENTS Continued
1. Significant Accounting Policies Continued
At September 28, 2012, the inverse floating rate securities associated with tender option bond transactions accounted for as secured borrowings were as follows:
| | | | | | | | | | | | | | | | |
Principal
Amount | | | Inverse Floater1 | | Coupon
Rate2 | | | Maturity
Date | | | Value | |
| | $ 2,240,000 | | | Monroe County, NY Industrial Devel. Corp. (Unity Hospital Rochester) ROLs3 | | | 10.930 | % | | | 8/15/35 | | | $ | 3,247,978 | |
| | 5,000,000 | | | Monroe County, NY Industrial Devel. Corp. (Unity Hospital Rochester) ROLs3 | | | 10.433 | | | | 8/15/40 | | | | 6,602,900 | |
| | 15,000,000 | | | NY Liberty Devel. Corp. (Bank of America Tower at One Bryant Park) ROLs3 | | | 9.661 | | | | 1/15/44 | | | | 18,328,200 | |
| | 10,000,000 | | | NY Liberty Devel. Corp. (Bank of America Tower at One Bryant Park) ROLs3 | | | 10.617 | | | | 1/15/46 | | | | 12,999,600 | |
| | 6,670,000 | | | NYC GO DRIVERS | | | 15.356 | | | | 11/15/31 | | | | 10,883,906 | |
| | 2,750,000 | | | NYC GO ROLs | | | 18.252 | | | | 3/1/26 | | | | 4,734,290 | |
| | 3,750,000 | | | NYC GO ROLs3 | | | 19.478 | | | | 4/1/36 | | | | 6,183,600 | |
| | 10,000,000 | | | NYC Municipal Water Finance Authority ROLs3 | | | 19.987 | | | | 6/15/40 | | | | 18,237,200 | |
| | 4,160,000 | | | NYC Municipal Water Finance Authority ROLs3 | | | 21.622 | | | | 6/15/37 | | | | 6,089,990 | |
| | 10,000,000 | | | NYC Transitional Finance Authority ROLs3 | | | 9.437 | | | | 1/15/29 | | | | 12,198,200 | |
| | 10,000,000 | | | NYS DA (Personal Income Tax) DRIVERS | | | 9.268 | | | | 9/15/31 | | | | 12,586,400 | |
| | 6,670,000 | | | NYS DA (State Personal Income Tax Authority) | | | 15.736 | | | | 3/15/36 | | | | 11,216,539 | |
| | 5,000,000 | | | Puerto Rico Sales Tax Financing Corp. ROLs3 | | | 14.423 | | | | 8/1/57 | | | | 5,797,850 | |
| | 3,250,000 | | | Puerto Rico Sales Tax Financing Corp. ROLs3 | | | 20.943 | | | | 8/1/57 | | | | 4,592,640 | |
| | | | | | | | | | | | | | |
|
|
|
| | | | | | | | | | | | | | | $ | 133,699,293 | |
| | | | | | | | | | | | | | |
|
|
|
1. For a list of abbreviations used in the Inverse Floater table see the Portfolio Abbreviations table at the end of the Statement of Investments.
2. Represents the current interest rate for the inverse floating rate security.
3. Represents an inverse floating rate security that is subject to a shortfall/reimbursement agreement.
The Fund may also purchase an inverse floating rate security created as part of a tender option bond transaction not initiated by the Fund when a third party, such as a municipal issuer or financial institution, transfers an underlying municipal bond to a Trust. For financial reporting purposes, the Fund includes the inverse floating rate security related to such transaction on its Statement of Investments and as an asset on its Statement of Assets and Liabilities, and interest on the security is recorded as investment income on the Fund’s Statement of Operations.
The Fund may invest in inverse floating rate securities with any degree of leverage (as measured by the outstanding principal amount of related short-term floating rate securities). However, the Fund may only expose up to 20% of its total assets to the effects of leverage from its investments in inverse floating rate securities. This limitation is measured by comparing the aggregate principal amount of the short-term floating rate securities that are related to the inverse floating rate securities held by the Fund to the total assets of the Fund. The Fund’s exposure to the effects of leverage from its investments in inverse floating rate securities amounts to $163,980,000 or 10.56% of its total assets as of September 28, 2012.
Credit Risk. The Fund invests in high-yield, non-investment-grade bonds, which may be subject to a greater degree of credit risk. Credit risk relates to the ability of the issuer to
| | | | |
| 52 | | | | OPPENHEIMER AMT-FREE NEW YORK MUNICIPALS |
meet interest or principal payments or both as they become due. The Fund may acquire securities that have missed an interest payment, and is not obligated to dispose of securities whose issuers or underlying obligors subsequently miss an interest payment. Information concerning securities not accruing interest as of September 28, 2012 is as follows:
| | | | |
| Cost | | $ | 7,826,130 | |
| Market Value | | $ | 4,482,055 | |
| Market Value as a % of Net Assets | | | 0.33 | % |
Concentration Risk. There are certain risks arising from geographic concentration in any state, commonwealth or territory. Certain economic, regulatory or political developments occurring in the state, commonwealth or territory may impair the ability of certain issuers of municipal securities to pay principal and interest on their obligations.
Allocation of Income, Expenses, Gains and Losses. Income, expenses (other than those attributable to a specific class), gains and losses are allocated on a daily basis to each class of shares based upon the relative proportion of net assets represented by such class. Operating expenses directly attributable to a specific class are charged against the operations of that class.
Federal Taxes. The Fund intends to comply with provisions of the Internal Revenue Code applicable to regulated investment companies and to distribute substantially all of its investment company taxable income, including any net realized gain on investments not offset by capital loss carryforwards, if any, to shareholders. Therefore, no federal income or excise tax provision is required. The Fund files income tax returns in U.S. federal and applicable state jurisdictions. The statute of limitations on the Fund’s tax return filings generally remain open for the three preceding fiscal reporting period ends.
The tax components of capital shown in the following table represent distribution requirements the Fund must satisfy under the income tax regulations, losses the Fund may be able to offset against income and gains realized in future years and unrealized appreciation or depreciation of securities and other investments for federal income tax purposes.
| | | | | | | | | | | | |
Undistributed
Net Investment
Income | | Undistributed
Long-Term
Gain | | | Accumulated
Loss
Carryforward1,2,3 | | | Net Unrealized
Appreciation
Based on Cost of
Securities and Other
Investments for Federal
Income Tax Purposes | |
| $15,108,705 | | $ | — | | | $ | 97,182,436 | | | $ | 2,256,917 | |
1. As of September 28, 2012, the Fund had $97,182,436 of net capital loss carryforwards available to offset future realized capital gains, if any, and thereby reduce future taxable gain distributions. Details of the capital loss carryforwards are included in the table below. Capital loss carryovers with no expiration, if any, must be utilized prior to those with expiration dates.
| | | | |
| 53 | | | | OPPENHEIMER AMT-FREE NEW YORK MUNICIPALS |
NOTES TO FINANCIAL STATEMENTS Continued
1. Significant Accounting Policies Continued
| | | | |
| Expiring | | | |
| 2016 | | $ | 6,626,486 | |
| 2017 | | | 26,431,288 | |
| 2018 | | | 43,255,092 | |
| No expiration | | | 20,869,570 | |
| | |
|
|
|
| Total | | $ | 97,182,436 | |
| | |
|
|
|
2. During the fiscal year ended September 28, 2012, the Fund did not utilize any capital loss carryforward.
3. During the fiscal year ended September 30, 2011, the Fund utilized $124,290 of capital loss carryforward to offset capital gains realized in that fiscal year.
Net investment income (loss) and net realized gain (loss) may differ for financial statement and tax purposes. The character of dividends and distributions made during the fiscal year from net investment income or net realized gains may differ from their ultimate characterization for federal income tax purposes. Also, due to timing of dividends and distributions, the fiscal year in which amounts are distributed may differ from the fiscal year in which the income or net realized gain was recorded by the Fund.
Accordingly, the following amounts have been reclassified for September 30, 2012. Net assets of the Fund were unaffected by the reclassifications.
| | | | |
Reduction
to Accumulated
Net Investment
Income | | Reduction
to Accumulated Net
Realized Loss
on Investments | |
| $339,262 | | $ | 339,262 | |
The tax character of distributions paid during the years ended September 30, 2012 and September 30, 2011 was as follows:
| | | | | | | | |
| | | Year Ended
September 30, 2012 | | | Year Ended
September 30, 2011 | |
| Distributions paid from: | | | | | | | | |
| Exempt-interest dividends | | $ | 70,499,805 | | | $ | 71,440,873 | |
| Ordinary income | | | 266,989 | | | | 1,379,753 | |
| | |
|
|
| |
|
|
|
| Total | | $ | 70,766,794 | | | $ | 72,820,626 | |
| | |
|
|
| |
|
|
|
The aggregate cost of securities and other investments and the composition of unrealized appreciation and depreciation of securities and other investments for federal income tax purposes as of September 28, 2012 are noted in the following table. The primary difference between book and tax appreciation or depreciation of securities and other investments, if applicable, is attributable to the tax deferral of losses or tax realization of financial statement unrealized gain or loss.
| | | | |
| Federal tax cost of securities | | $ | 1,359,459,026 | 1 |
| | |
|
|
|
| Gross unrealized appreciation | | $ | 109,803,370 | |
| Gross unrealized depreciation | | | (107,546,453 | ) |
| | |
|
|
|
| Net unrealized appreciation | | $ | 2,256,917 | |
| | |
|
|
|
1. The Federal tax cost of securities does not include cost of $163,747,115, which has otherwise been recognized for financial reporting purposes, related to bonds placed into trusts in conjunction with certain investment transactions. See the Inverse Floating Rate Securities note above.
| | | | |
| 54 | | | | OPPENHEIMER AMT-FREE NEW YORK MUNICIPALS |
Trustees’ Compensation. The Fund has adopted an unfunded retirement plan (the “Plan”) for the Fund’s independent trustees. Benefits are based on years of service and fees paid to each trustee during their period of service. The Plan was frozen with respect to adding new participants effective December 31, 2006 (the “Freeze Date”) and existing Plan Participants as of the Freeze Date will continue to receive accrued benefits under the Plan. Active independent trustees as of the Freeze Date have each elected a distribution method with respect to their benefits under the Plan. During the year ended September 28, 2012, the Fund’s projected benefit obligations, payments to retired trustees and accumulated liability were as follows:
| | | | |
| Projected Benefit Obligations Increased | | $ | 14,574 | |
| Payments Made to Retired Trustees | | | 14,130 | |
| Accumulated Liability as of September 28, 2012 | | | 107,457 | |
The Board of Trustees has adopted a compensation deferral plan for independent trustees that enables trustees to elect to defer receipt of all or a portion of the annual compensation they are entitled to receive from the Fund. For purposes of determining the amount owed to the Trustee under the plan, deferred amounts are treated as though equal dollar amounts had been invested in shares of the Fund or in other Oppenheimer funds selected by the Trustee. The Fund purchases shares of the funds selected for deferral by the Trustee in amounts equal to his or her deemed investment, resulting in a Fund asset equal to the deferred compensation liability. Such assets are included as a component of “Other” within the asset section of the Statement of Assets and Liabilities. Deferral of trustees’ fees under the plan will not affect the net assets of the Fund, and will not materially affect the Fund’s assets, liabilities or net investment income per share. Amounts will be deferred until distributed in accordance with the compensation deferral plan.
Dividends and Distributions to Shareholders. Dividends and distributions to shareholders, which are determined in accordance with income tax regulations and may differ from U.S. generally accepted accounting principles, are recorded on the ex-dividend date. Income distributions, if any, are declared daily and paid monthly. Capital gain distributions, if any, are declared and paid annually.
Investment Income. Interest income is recognized on an accrual basis. Discount and premium, which are included in interest income on the Statement of Operations, are amortized or accreted daily.
Custodian Fees. “Custodian fees and expenses” in the Statement of Operations may include interest expense incurred by the Fund on any cash overdrafts of its custodian account during the period. Such cash overdrafts may result from the effects of failed trades in portfolio securities and from cash outflows resulting from unanticipated shareholder redemption activity. The Fund pays interest to its custodian on such cash overdraft at a rate equal to the 1 Month LIBOR Rate plus 2.00%. The “Reduction to custodian expenses” line item, if applicable, represents earnings on cash balances maintained by the Fund during the period. Such interest expense and other custodian fees may be paid with these earnings.
| | | | |
| 55 | | | | OPPENHEIMER AMT-FREE NEW YORK MUNICIPALS |
NOTES TO FINANCIAL STATEMENTS Continued
1. Significant Accounting Policies Continued
Security Transactions. Security transactions are recorded on the trade date. Realized gains and losses on securities sold are determined on the basis of identified cost.
Indemnifications. The Fund’s organizational documents provide current and former trustees and officers with a limited indemnification against liabilities arising in connection with the performance of their duties to the Fund. In the normal course of business, the Fund may also enter into contracts that provide general indemnifications. The Fund’s maximum exposure under these arrangements is unknown as this would be dependent on future claims that may be made against the Fund. The risk of material loss from such claims is considered remote.
Other. The preparation of financial statements in conformity with accounting principles generally accepted in the United States of America requires management to make estimates and assumptions that affect the reported amounts of assets and liabilities and disclosure of contingent assets and liabilities at the date of the financial statements and the reported amounts of increases and decreases in net assets from operations during the reporting period. Actual results could differ from those estimates.
2. Securities Valuation
The Fund calculates the net asset value of its shares as of the close of the New York Stock Exchange (the “Exchange”), normally 4:00 P.M. Eastern time, on each day the Exchange is open for trading.
The Fund’s Board has adopted procedures for the valuation of the Fund’s securities and has delegated the day-to-day responsibility for valuation determinations under those procedures to the Manager. The Manager has established a Valuation Committee which is responsible for determining a “fair valuation” for any security for which market quotations are not “readily available.” The Valuation Committee’s fair valuation determinations are subject to review, approval and ratification by the Fund’s Board at its next regularly scheduled meeting covering the calendar quarter in which the fair valuation was determined.
Valuation Methods and Inputs
Securities are valued using unadjusted quoted market prices, when available, as supplied primarily by third party pricing services or dealers.
The following methodologies are used to determine the market value or the fair value of the types of securities described below:
Securities traded on a registered U.S. securities exchange (including exchange-traded derivatives other than futures and futures options) are valued based on the last sale price of the security reported on the principal exchange on which it is traded, prior to the time when the Fund’s assets are valued. In the absence of a sale, the security is valued at the last sale price on the prior trading day, if it is within the spread of the current day’s closing “bid” and “asked” prices, and if not, at the current day’s closing bid price. A security of a foreign issuer traded on a foreign exchange but not listed on a registered U.S. securities
| | | | |
| 56 | | | | OPPENHEIMER AMT-FREE NEW YORK MUNICIPALS |
exchange is valued based on the last sale price on the principal exchange on which the security is traded, as identified by the third party pricing service used by the Manager, prior to the time when the Fund’s assets are valued. If the last sale price is unavailable, the security is valued at the most recent official closing price on the principal exchange on which it is traded. If the last sales price or official closing price for a foreign security is not available, the security is valued at the mean between the bid and asked price per the exchange or, if not available from the exchange, obtained from two dealers. If bid and asked prices are not available from either the exchange or two dealers, the security is valued by using one of the following methodologies (listed in order of priority); (1) using a bid from the exchange, (2) the mean between the bid and asked price as provided by a single dealer, or (3) a bid from a single dealer.
Shares of a registered investment company that are not traded on an exchange are valued at that investment company’s net asset value per share.
Corporate and government debt securities (of U.S. or foreign issuers) and municipal debt securities, event-linked bonds, loans, mortgage-backed securities, collateralized mortgage obligations, and asset-backed securities are valued at the mean between the “bid” and “asked” prices utilizing evaluated prices obtained from third party pricing services or broker-dealers who may use matrix pricing methods to determine the evaluated prices.
Short-term money market type debt securities with a remaining maturity of sixty days or less are valued at cost adjusted by the amortization of discount or premium to maturity (amortized cost), which approximates market value. Short-term debt securities with a remaining maturity in excess of sixty days are valued at the mean between the “bid” and “asked” prices utilizing evaluated prices obtained from third party pricing services or broker-dealers.
A description of the standard inputs that may generally be considered by the third party pricing vendors in determining their evaluated prices is provided below.
| | |
| Security Type | | Standard Inputs Generally Considered by Third-Party
Pricing Vendors |
| Corporate debt, government debt, municipal, mortgage-backed and asset-backed securities | | Reported trade data, broker-dealer price quotations, benchmark yields, issuer spreads on comparable securities, the credit quality, yield, maturity, and other appropriate factors. |
| Loans | | Information obtained from market participants regarding reported trade data and broker-dealer price quotations. |
| Event-linked bonds | | Information obtained from market participants regarding reported trade data and broker-dealer price quotations. |
If a market value or price cannot be determined for a security using the methodologies described above, or if, in the “good faith” opinion of the Manager, the market value or price obtained does not constitute a “readily available market quotation,” or a significant event has occurred that would materially affect the value of the security the security is fair valued either (i) by a standardized fair valuation methodology applicable to the security type or the significant event as previously approved by the Valuation Committee and the Fund’s Board or (ii) as determined in good faith by the Manager’s Valuation Committee. The Valuation Committee considers all relevant facts that are reasonably available, through
| | | | |
| 57 | | | | OPPENHEIMER AMT-FREE NEW YORK MUNICIPALS |
NOTES TO FINANCIAL STATEMENTS Continued
2. Securities Valuation Continued
either public information or information available to the Manager, when determining the fair value of a security. Fair value determinations by the Manager are subject to review, approval and ratification by the Fund’s Board at its next regularly scheduled meeting covering the calendar quarter in which the fair valuation was determined. Those fair valuation standardized methodologies include, but are not limited to, valuing securities at the last sale price or initially at cost and subsequently adjusting the value based on: changes in company specific fundamentals, changes in an appropriate securities index, or changes in the value of similar securities which may be further adjusted for any discounts related to security-specific resale restrictions. When possible, such methodologies use observable market inputs such as unadjusted quoted prices of similar securities, observable interest rates, currency rates and yield curves. The methodologies used for valuing securities are not necessarily an indication of the risks associated with investing in those securities nor can it be assured that the Fund can obtain the fair value assigned to a security if it were to sell the security.
To assess the continuing appropriateness of security valuations, the Manager, or its third party service provider who is subject to oversight by the Manager, regularly compares prior day prices, prices on comparable securities, and sale prices to the current day prices and challenges those prices exceeding certain tolerance levels with the third party pricing service or broker source. For those securities valued by fair valuations, whether through a standardized fair valuation methodology or a fair valuation determination, the Valuation Committee reviews and affirms the reasonableness of the valuations based on such methodologies and fair valuation determinations on a regular basis after considering all relevant information that is reasonably available.
Classifications
Each investment asset or liability of the Fund is assigned a level at measurement date based on the significance and source of the inputs to its valuation. Various data inputs are used in determining the value of each of the Fund’s investments as of the reporting period end. These data inputs are categorized in the following hierarchy under applicable financial accounting standards:
| 1) | | Level 1—unadjusted quoted prices in active markets for identical assets or liabilities (including securities actively traded on a securities exchange) |
| 2) | | Level 2—inputs other than unadjusted quoted prices that are observable for the asset or liability (such as unadjusted quoted prices for similar assets and market corroborated inputs such as interest rates, prepayment speeds, credit risks, etc.) |
| 3) | | Level 3—significant unobservable inputs (including the Manager’s own judgments about assumptions that market participants would use in pricing the asset or liability). |
The inputs used for valuing securities are not necessarily an indication of the risks associated with investing in those securities.
| | | | |
| 58 | | | | OPPENHEIMER AMT-FREE NEW YORK MUNICIPALS |
The table below categorizes amounts that are included in the Fund’s Statement of Assets and Liabilities as of September 28, 2012 based on valuation input level:
| | | | | | | | | | | | | | | | |
| | | Level 1—
Unadjusted
Quoted Prices | | | Level 2—
Other Significant
Observable Inputs | | | Level 3—
Significant
Unobservable
Inputs | | | Value | |
| Assets Table | | | | | | | | | | | | | | | | |
| Investments, at Value: | | | | | | | | | | | | | | | | |
| Municipal Bonds and Notes | | | | | | | | | | | | | | | | |
New York | | $ | — | | | $ | 1,185,983,680 | | | $ | 15,000 | | | $ | 1,185,998,680 | |
U.S. Possessions | | | — | | | | 339,464,378 | | | | — | | | | 339,464,378 | |
| | |
|
|
| |
|
|
| |
|
|
|
| Total Assets | | $ | — | | | $ | 1,525,448,058 | | | $ | 15,000 | | | $ | 1,525,463,058 | |
| | |
|
|
| |
|
|
| |
|
|
|
Currency contracts and forwards, if any, are reported at their unrealized appreciation/depreciation at measurement date, which represents the change in the contract’s value from trade date. Futures, if any, are reported at their variation margin at measurement date, which represents the amount due to/from the Fund at that date. All additional assets and liabilities included in the above table are reported at their market value at measurement date.
There have been no significant changes to the fair valuation methodologies of the Fund during the period.
3. Shares of Beneficial Interest
The Fund has authorized an unlimited number of $0.001 par value shares of beneficial interest of each class. Transactions in shares of beneficial interest were as follows:
| | | | | | | | | | | | | | | | |
| | | Year Ended September 28, 2012 | | | Year Ended September 30, 20111 | |
| | | Shares | | | Amount | | | Shares | | | Amount | |
| Class A | | | | | | | | | | | | | | | | |
| Sold | | | 15,871,727 | | | $ | 188,327,944 | | | �� | 10,357,987 | | | $ | 112,992,433 | |
Dividends and/or
distributions reinvested | | | 4,252,769 | | | | 50,364,985 | | | | 4,348,527 | | | | 47,191,602 | |
| Redeemed | | | (12,888,309 | ) | | | (151,505,642 | ) | | | (22,638,129 | ) | | | (245,559,914 | ) |
| | |
|
|
| |
|
|
| |
|
|
| |
|
|
|
| Net increase (decrease) | | | 7,236,187 | | | $ | 87,187,287 | | | | (7,931,615 | ) | | $ | (85,375,879 | ) |
| | |
|
|
| |
|
|
| |
|
|
| |
|
|
|
| | | | | | | | | | | | | | | | | |
| Class B | | | | | | | | | | | | | | | | |
| Sold | | | 109,381 | | | $ | 1,280,060 | | | | 113,843 | | | $ | 1,251,560 | |
Dividends and/or
distributions reinvested | | | 39,405 | | | | 465,279 | | | | 54,623 | | | | 592,414 | |
| Redeemed | | | (468,947 | ) | | | (5,539,793 | ) | | | (501,832 | ) | | | (5,433,284 | ) |
| | |
|
|
| |
|
|
| |
|
|
| |
|
|
|
| Net decrease | | | (320,161 | ) | | $ | (3,794,454 | ) | | | (333,366 | ) | | $ | (3,589,310 | ) |
| | |
|
|
| |
|
|
| |
|
|
| |
|
|
|
| | | | | | | | | | | | | | | | | |
| Class C | | | | | | | | | | | | | | | | |
| Sold | | | 2,744,278 | | | $ | 32,552,213 | | | | 1,516,382 | | | $ | 16,493,732 | |
Dividends and/or
distributions reinvested | | | 424,978 | | | | 5,035,525 | | | | 460,643 | | | | 4,998,327 | |
| Redeemed | | | (1,719,821 | ) | | | (20,269,258 | ) | | | (3,909,147 | ) | | | (42,302,402 | ) |
| | |
|
|
| |
|
|
| |
|
|
| |
|
|
|
| Net increase (decrease) | | | 1,449,435 | | | $ | 17,318,480 | | | | (1,932,122 | ) | | $ | (20,810,343 | ) |
| | |
|
|
| |
|
|
| |
|
|
| |
|
|
|
| | | | |
| 59 | | | | OPPENHEIMER AMT-FREE NEW YORK MUNICIPALS |
NOTES TO FINANCIAL STATEMENTS Continued
3. Shares of Beneficial Interest Continued
| | | | | | | | | | | | | | | | |
| | |
| | | Year Ended September 28, 2012 | | | Year Ended September 30, 20111 | |
| | | Shares | | | Amount | | | Shares | | | Amount | |
| Class Y | | | | | | | | | | | | | | | | |
| Sold | | | 2,978,970 | | | $ | 35,132,435 | | | | 747,166 | | | $ | 7,828,272 | |
Dividends and/or
distributions reinvested | | | 53,858 | | | | 643,993 | | | | 20,053 | | | | 220,490 | |
| Redeemed | | | (359,484 | ) | | | (4,272,667 | ) | | | (239,091 | ) | | | (2,639,997 | ) |
| | |
|
|
| |
|
|
| |
|
|
| |
|
|
|
| Net increase | | | 2,673,344 | | | $ | 31,503,761 | | | | 528,128 | | | $ | 5,408,765 | |
| | |
|
|
| |
|
|
| |
|
|
| |
|
|
|
1. For the year ended September 30, 2011, for Class A, B, and C shares, and for the period from January 31, 2011 (inception of offering) to September 30, 2011 for Class Y shares.
4. Purchases and Sales of Securities
The aggregate cost of purchases and proceeds from sales of securities, other than short-term obligations, for the year ended September 28, 2012, were as follows:
| | | | | | | | |
| | | Purchases | | | Sales | |
| Investment securities | | $ | 302,678,549 | | | $ | 192,295,746 | |
5. Fees and Other Transactions with Affiliates
Management Fees. Under the investment advisory agreement, the Fund pays the Manager a management fee based on the daily net assets of the Fund at an annual rate as shown in the following table:
| | | | |
| Fee Schedule | | | |
| Up to $200 million | | | 0.60 | % |
| Next $100 million | | | 0.55 | |
| Next $200 million | | | 0.50 | |
| Next $250 million | | | 0.45 | |
| Next $250 million | | | 0.40 | |
| Over $1 billion | | | 0.35 | |
Administration Service Fees. The Fund pays the Manager a fee of $1,500 per year for preparing and filing the Fund’s tax returns.
Transfer Agent Fees. OppenheimerFunds Services (“OFS”), a division of the Manager, acts as the transfer and shareholder servicing agent for the Fund. The Fund pays OFS a per account fee. For the year ended September 28, 2012, the Fund paid $367,733 to OFS for services to the Fund.
Additionally, Class Y shares are subject to minimum fees of $10,000 annually for assets of $10 million or more. The Class Y shares are subject to the minimum fees in the event that the per account fee does not equal or exceed the applicable minimum fees. OFS may voluntarily waive the minimum fees.
Distribution and Service Plan (12b-1) Fees. Under its General Distributor’s Agreement with the Fund, OppenheimerFunds Distributor, Inc. (the “Distributor”) acts as the Fund’s principal underwriter in the continuous public offering of the Fund’s classes of shares.
| | | | |
| 60 | | | | OPPENHEIMER AMT-FREE NEW YORK MUNICIPALS |
Service Plan for Class A Shares. The Fund has adopted a Service Plan (the “Plan”) for Class A shares under Rule 12b-1 of the Investment Company Act of 1940. Under the Plan, the Fund reimburses the Distributor for a portion of its costs incurred for services provided to accounts that hold Class A shares. Reimbursement is made periodically at an annual rate of up to 0.25% of the daily net assets of Class A shares of the Fund. The Distributor currently uses all of those fees to pay dealers, brokers, banks and other financial institutions periodically for providing personal service and maintenance of accounts of their customers that hold Class A shares. Any unreimbursed expenses the Distributor incurs with respect to Class A shares in any fiscal year cannot be recovered in subsequent periods. Fees incurred by the Fund under the Plan are detailed in the Statement of Operations.
Distribution and Service Plans for Class B and Class C Shares. The Fund has adopted Distribution and Service Plans (the “Plans”) for Class B and Class C shares under Rule 12b-1 of the Investment Company Act of 1940 to compensate the Distributor for its services in connection with the distribution of those shares and servicing accounts. Under the Plans, the Fund pays the Distributor an annual asset-based sales charge of 0.75% on Class B and Class C shares daily net assets. The Distributor also receives a service fee of 0.25% per year under each plan. If either the Class B or Class C plan is terminated by the Fund or by the shareholders of a class, the Board of Trustees and its independent trustees must determine whether the Distributor shall be entitled to payment from the Fund of all or a portion of the service fee and/or asset-based sales charge in respect to shares sold prior to the effective date of such termination. Fees incurred by the Fund under the Plans are detailed in the Statement of Operations. The Distributor determines its uncompensated expenses under the Plans at calendar quarter ends. The Distributor’s aggregate uncompensated expenses under the Plans at September 28, 2012 were as follows:
| | | | |
| Class B | | $ | 1,621,126 | |
| Class C | | | 2,614,431 | |
Sales Charges. Front-end sales charges and contingent deferred sales charges (“CDSC”) do not represent expenses of the Fund. They are deducted from the proceeds of sales of Fund shares prior to investment or from redemption proceeds prior to remittance, as applicable. The sales charges retained by the Distributor from the sale of shares and the CDSC retained by the Distributor on the redemption of shares is shown in the following table for the period indicated.
| | | | | | | | | | | | | | | | |
| Year Ended | | Class A Front-End
Sales Charges
Retained by
Distributor | | | Class A
Contingent
Deferred
Sales Charges
Retained by
Distributor | | | Class B Contingent
Deferred
Sales Charges
Retained by
Distributor | | | Class C
Contingent
Deferred
Sales Charges
Retained by
Distributor | |
| September 28, 2012 | | $ | 205,701 | | | $ | 222 | | | $ | 16,873 | | | $ | 22,415 | |
Waivers and Reimbursements of Expenses. The Manager has voluntarily agreed to reimburse the Fund for a portion of the legal costs and fees incurred in connection with
| | | | |
| 61 | | | | OPPENHEIMER AMT-FREE NEW YORK MUNICIPALS |
NOTES TO FINANCIAL STATEMENTS Continued
5. Fees and Other Transactions with Affiliates Continued
the pending litigation matters discussed in the “Pending Litigation” note which appears later in this report. During the year ended September 28, 2012, the Manager reimbursed the Fund $174,932 for legal costs and fees.
OFS has voluntarily agreed to limit transfer and shareholder servicing agent fees for Classes B, C and Y shares to 0.35% of average annual net assets per class; this limit also applied to Class A shares prior to December 1, 2011. Effective December 1, 2011, OFS has voluntarily agreed to limit its fees for Class A shares to 0.30% of average annual net assets of the class.
Some of these undertakings may be modified or terminated at any time; some may not be modified or terminated until after one year from the date of the current prospectus, as indicated therein.
6. Borrowings
The Fund can borrow money from banks in amounts up to one third of its total assets (including the amount borrowed) less all liabilities and indebtedness other than borrowings (meaning that the value of those assets must be at least 300% of the amount borrowed). The Fund can use those borrowings for investment-related purposes such as purchasing portfolio securities. The Fund also may borrow to meet redemption obligations or for temporary and emergency purposes. When the Fund invests borrowed money in portfolio securities, it is using a speculative investment technique known as leverage and changes in the value of the Fund’s investments will have a larger effect on its share price than if it did not borrow because of the effect of leverage.
The Fund can also use the borrowings for other investment-related purposes, including in connection with the Fund’s inverse floater investments as discussed in Note 1. The Fund may use the borrowings to reduce the leverage amount of, or unwind or “collapse” trusts that issued “inverse floaters” owned by the Fund, or in circumstances in which the Fund has entered into a shortfall and forbearance agreement with the sponsor of the inverse floater trust to meet the Fund’s obligation to reimburse the sponsor of the inverse floater for the difference between the liquidation value of the underlying bond and the amount due to holders of the short-term floating rate notes issued by the Trust. See the discussion in Note 1 (Inverse Floating Rate Securities) for additional information.
The Fund will pay interest and may pay other fees in connection with loans. If the Fund does borrow, it will be subject to greater expenses than funds that do not borrow. The interest on borrowed money and the other fees incurred in conjunction with loans are an expense that might reduce the Fund’s yield and return. Expenses incurred by the Fund with respect to interest on borrowings and commitment fees are disclosed separately or as other expenses on the Statement of Operations.
The Fund entered into a Revolving Credit and Security Agreement (the “Agreement”) with conduit lenders and Citibank N.A. which enables it to participate with certain other Oppenheimer funds in a committed, secured borrowing facility that permits borrowings of up to $2.0 billion, collectively, by the Oppenheimer Rochester Funds. To secure the loan,
| | | | |
| 62 | | | | OPPENHEIMER AMT-FREE NEW YORK MUNICIPALS |
the Fund pledges investment securities in accordance with the terms of the Agreement. Securities held in collateralized accounts to cover these borrowings are noted in the Statement of Investments. Interest is charged to the Fund, based on its borrowings, at current commercial paper issuance rates (0.1979% as of September 28, 2012). The Fund pays additional fees annually to its lender on its outstanding borrowings to manage and administer the facility and is allocated its pro-rata share of an annual structuring fee and ongoing commitment fees both of which are based on the total facility size. Total fees and interest that are included in expenses on the Fund’s Statement of Operations related to its participation in the borrowing facility during the year ended September 28, 2012 equal 0.07% of the Fund’s average net assets on an annualized basis. The Fund has the right to prepay such loans and terminate its participation in the conduit loan facility at any time upon prior notice.
As of September 28, 2012, the Fund had borrowings outstanding at an interest rate of 0.1979%. Details of the borrowings for the year ended September 28, 2012 are as follows:
| | | | |
| Average Daily Loan Balance | | $ | 12,293,716 | |
| Average Daily Interest Rate | | | 0.266 | % |
| Fees Paid | | $ | 853,181 | |
| Interest Paid | | $ | 34,090 | |
7. Reverse Repurchase Agreements
The Fund may engage in reverse repurchase agreements. A reverse repurchase agreement is the sale of one or more securities to a counterparty at an agreed-upon purchase price with the simultaneous agreement to repurchase those securities on a future date at a higher repurchase price. The repurchase price represents the repayment of the purchase price and interest accrued thereon over the term of the repurchase agreement. The cash received by the Fund in connection with a reverse repurchase agreement may be used for investment-related purposes such as purchasing portfolio securities or for other purposes such as those described in the preceding “Borrowings” note.
The Fund entered into a Committed Repurchase Transaction Facility (the “Facility”) with J.P. Morgan Securities LLC (the “counterparty’) which enables it to participate with certain other Oppenheimer funds in a committed reverse repurchase agreement facility that permits aggregate outstanding reverse repurchase agreements of up to $750 million, collectively. Interest is charged to the Fund on the purchase price of outstanding reverse repurchase agreements at current LIBOR rates plus an applicable spread. The Fund is also allocated its pro-rata share of an annual structuring fee based on the total Facility size and ongoing commitment fees based on the total unused amount of the Facility. The Fund retains the economic exposure to fluctuations in the value of securities subject to reverse repurchase agreements under the Facility and therefore these transactions are considered secured borrowings for financial reporting purposes. The Fund also continues to receive the economic benefit of interest payments received on securities subject to reverse repurchase agreements, in the form of a direct payment from the counterparty. These payments are included in interest income on the Statement of Operations. Total fees and
| | | | |
| 63 | | | | OPPENHEIMER AMT-FREE NEW YORK MUNICIPALS |
NOTES TO FINANCIAL STATEMENTS Continued
7. Reverse Repurchase Agreements Continued
interest related to the Fund’s participation in the Facility during the year ended September 28, 2012 are included in expenses on the Fund’s Statement of Operations and equal 0.02% of the Fund’s average net assets on an annualized basis.
The securities subject to reverse repurchase agreements under the Facility are valued on a daily basis. To the extent this value, after adjusting for certain margin requirements of the Facility, exceeds the cash proceeds received, the Fund may request the counterparty to return securities equal in margin value to this excess. To the extent that the cash proceeds received exceed the margin value of the securities subject to the transaction, the counterparty may request additional securities from the Fund. The Fund has the right to declare the first or fifteenth day of any calendar month as the repurchase date for any outstanding reverse repurchase agreement upon delivery of advanced notification and may also recall any security subject to such a transaction by substituting eligible securities of equal or greater margin value according to the Facility’s terms.
The Fund executed no transactions under the Facility during the year ended September 28, 2012.
8. Pending Litigation
Since 2009, a number of class action lawsuits have been pending in federal and state courts against OppenheimerFunds, Inc., the Fund’s investment advisor (the “Manager”), OppenheimerFunds Distributor, Inc., the Fund’s principal underwriter and distributor (the “Distributor”), and certain funds – including the Fund – advised by the Manager and distributed by the Distributor (the “Defendant Funds”). Several of these lawsuits also name as defendants certain officers and current and former trustees of the respective Defendant Funds. The lawsuits raise claims under federal securities law and allege, among other things, that the disclosure documents of the respective Defendant Funds contained misrepresentations and omissions and that the respective Defendant Funds’ investment policies were not followed. The plaintiffs in these actions seek unspecified damages, equitable relief and awards of attorneys’ fees and litigation expenses. The Defendant Funds’ Boards of Trustees have also engaged counsel to represent the Funds and the present and former Independent Trustees named in those suits.
Other class action and individual lawsuits have been filed since 2008 in various state and federal courts against the Manager and certain of its affiliates by investors seeking to recover investments they allegedly lost as a result of the “Ponzi” scheme run by Bernard L. Madoff and his firm, Bernard L. Madoff Investment Securities, LLC (“BLMIS”). Plaintiffs in these suits allege that they suffered losses as a result of their investments in several funds managed by an affiliate of the Manager and assert a variety of claims, including breach of fiduciary duty, fraud, negligent misrepresentation, unjust enrichment, and violation of federal and state securities laws and regulations, among others. They seek unspecified damages, equitable relief and awards of attorneys’ fees and litigation expenses. Neither the Distributor, nor any of the Oppenheimer mutual funds, their independent trustees or directors are named as defendants in these lawsuits. None of the Oppenheimer mutual
| | | | |
| 64 | | | | OPPENHEIMER AMT-FREE NEW YORK MUNICIPALS |
funds invested in any funds or accounts managed by Madoff or BLMIS. On February 28, 2011, a stipulation of partial settlement of three groups of consolidated putative class action lawsuits relating to these matters was filed in the U.S. District Court for the Southern District of New York. On August 19, 2011, the court entered an order and final judgment approving the settlement as fair, reasonable and adequate. In September 2011, certain parties filed notices of appeal from the court’s order approving the settlement. The settlement does not resolve other outstanding lawsuits against the Manager and its affiliates relating to BLMIS.
On April 16, 2010, a lawsuit was filed in New York state court against the Manager, an affiliate of the Manager and AAArdvark IV Funding Limited (“AAArdvark IV”), an entity advised by the Manager’s affiliate, in connection with investments made by the plaintiffs in AAArdvark IV. Plaintiffs allege breach of contract against the defendants and seek compensatory damages, costs and disbursements, including attorney fees. On July 15, 2011, a lawsuit was filed in New York state court against the Manager, an affiliate of the Manager and AAArdvark Funding Limited (“AAArdvark I”), an entity advised by the Manager’s affiliate, in connection with investments made by the plaintiffs in AAArdvark I. The complaint alleges breach of contract against the defendants and seeks compensatory damages, costs and disbursements, including attorney fees. On November 9, 2011, a lawsuit was filed in New York state court against the Manager, an affiliate of the Manager and AAArdvark XS Funding Limited (“AAArdvark XS”), an entity advised by the Manager’s affiliate, in connection with investments made by the plaintiffs in AAArdvark XS. The complaint alleges breach of contract against the defendants and seeks compensatory damages, costs and disbursements, including attorney fees.
The Manager believes the lawsuits and appeals described above are without legal merit and, with the exception of actions it has settled, is defending against them vigorously. While it is premature to render any opinion as to the outcome in these lawsuits, or whether any costs that the Defendant Funds may bear in defending the suits might not be reimbursed by insurance, the Manager believes that these suits should not impair the ability of the Manager or the Distributor to perform their respective duties to the Fund, and that the outcome of all of the suits together should not have any material effect on the operations of any of the Oppenheimer mutual funds.
| | | | |
| 65 | | | | OPPENHEIMER AMT-FREE NEW YORK MUNICIPALS |
REPORT OF INDEPENDENT REGISTERED PUBLIC ACCOUNTING FIRM
The Board of Trustees and Shareholders of Oppenheimer AMT-Free New York Municipals:
We have audited the accompanying statement of assets and liabilities of Oppenheimer AMT-Free New York Municipals, including the statement of investments, as of September 28, 2012, and the related statement of operations and cash flows for the year then ended, the statements of changes in net assets for each of the years in the two-year period then ended, and the financial highlights for each of the years or periods in the five-year period then ended. These financial statements and financial highlights are the responsibility of the Fund’s management. Our responsibility is to express an opinion on these financial statements and financial highlights based on our audits.
We conducted our audits in accordance with the standards of the Public Company Accounting Oversight Board (United States). Those standards require that we plan and perform the audit to obtain reasonable assurance about whether the financial statements and financial highlights are free of material misstatement. An audit includes examining, on a test basis, evidence supporting the amounts and disclosures in the financial statements. Our procedures included confirmation of securities owned as of September 28, 2012, by correspondence with the custodian. An audit also includes assessing the accounting principles used and significant estimates made by management, as well as evaluating the overall financial statement presentation. We believe that our audits provide a reasonable basis for our opinion.
In our opinion, the financial statements and financial highlights referred to above present fairly, in all material respects, the financial position of Oppenheimer AMT-Free New York Municipals as of September 28, 2012, the results of its operations and cash flows for the year then ended, the changes in its net assets for each of the years in the two-year period then ended, and the financial highlights for each of the years or periods in the five-year period then ended, in conformity with U.S. generally accepted accounting principles.
KPMGLLP
Denver, Colorado
November 21, 2012
| | | | |
| 66 | | | | OPPENHEIMER AMT-FREE NEW YORK MUNICIPALS |
CREDIT ALLOCATION Unaudited
This table provides further information regarding the “Unrated” securities category shown in the “Credit Allocation-Credit Rating Breakdown” table located earlier in this report. The third column below titled “Unrated by a NRSRO; Internally Rated by the Manager” shows the credit allocation of Unrated securities as determined by the Fund’s investment adviser, OppenheimerFunds, Inc. (the “Manager”). These internally rated securities are not rated by any nationally recognized statistical rating organization (NRSRO), such as Standard & Poor’s.
The Manager determines the credit allocation of these securities using its own credit analysis to assign ratings using a rating scale or categories similar to that used by S&P. The Manager is not required to, and does not attempt to, employ the same credit analysis process, procedures or methodologies used by S&P or any other NRSRO in assigning a credit rating to an Unrated security. There can be no assurance, nor is it intended, that the Manager’s credit analysis process is consistent or comparable with the credit analysis process that would be used by S&P or any other NRSRO if it were to rate the same security. Securities rated investment-grade or above by the Manager may or may not be the equivalent to an investment grade or above rating assigned by an NRSRO. More information about the Manager’s internal credit analysis process for Unrated (or internally-rated) securities and securities ratings is contained in the Fund’s Prospectus and Statement of Additional Information.
The second column below titled “NRSRO-Rated” shows the ratings by nationally recognized statistical rating organizations (NRSROs), such as Standard & Poor’s. For securities rated by an NRSRO other than S&P, the Manager converts that rating to the equivalent S&P rating. If two or more NRSROs have assigned a rating to a security, the highest rating is used.
The credit allocations below are as of September 28, 2012 and are subject to change. The percentages are based on the market value of the Fund’s securities as of September 28, 2012 and are subject to change; market value does not include cash. AAA, AA, A, and BBB are investment-grade ratings.
| | | | | | | | | | | | |
| | | NRSRO-Rated | | | Unrated by
a NRSRO;
Internally
Rated by
the Manager | | | Total | |
| AAA | | | 6.3 | % | | | 0.0 | % | | | 6.3 | % |
| AA | | | 22.9 | | | | 0.0 | | | | 22.9 | |
| A | | | 15.2 | | | | 0.3 | | | | 15.5 | |
| BBB | | | 26.6 | | | | 5.6 | | | | 32.2 | |
| BB or lower | | | 14.5 | | | | 8.6 | | | | 23.1 | |
| | |
|
|
|
| Total | | | 85.5 | % | | | 14.5 | % | | | 100.0 | % |
| | |
|
|
|
| | | | |
| 67 | | | | OPPENHEIMER AMT-FREE NEW YORK MUNICIPALS |
FEDERAL INCOME TAX INFORMATION Unaudited
In early 2012, if applicable, shareholders of record received information regarding all dividends and distributions paid to them by the Fund during calendar year 2011.
None of the dividends paid by the Fund during the fiscal year ended September 28, 2012 are eligible for the corporate dividend-received deduction. 99.62% of the dividends were derived from interest on municipal bonds and are not subject to federal income taxes. To the extent a shareholder is subject to any state or local tax laws, some or all of the dividends received may be taxable.
The foregoing information is presented to assist shareholders in reporting distributions received from the Fund to the Internal Revenue Service. Because of the complexity of the federal regulations which may affect your individual tax return and the many variations in state and local tax regulations, we recommend that you consult your tax advisor for specific guidance.
| | | | |
| 68 | | | | OPPENHEIMER AMT-FREE NEW YORK MUNICIPALS |
BOARD APPROVAL OF THE FUND’S INVESTMENT
ADVISORY AGREEMENT Unaudited
Each year, the Board of Trustees (the “Board”), including a majority of the independent Trustees, is required to determine whether to renew the Fund’s investment advisory agreement (the “Agreement”). The Investment Company Act of 1940, as amended, requires that the Board request and evaluate, and that the Manager provide, such information as may be reasonably necessary to evaluate the terms of the Agreement. The Board employs an independent consultant to prepare a report that provides information, including comparative information that the Board requests for that purpose. In addition to in-person meetings focused on this evaluation, the Board receives information throughout the year regarding Fund services, fees, expenses and performance.
The Manager and the independent consultant provided information to the Board on the following factors: (i) the nature, quality and extent of the Manager’s services, (ii) the investment performance of the Fund and the Manager, (iii) the fees and expenses of the Fund, including comparative expense information, (iv) the profitability of the Manager and its affiliates, including an analysis of the cost of providing services, (v) whether economies of scale are realized as the Fund grows and whether fee levels reflect these economies of scale for Fund investors and (vi) other benefits to the Manager from its relationship with the Fund. The Board was aware that there are alternatives to retaining the Manager.
Outlined below is a summary of the principal information considered by the Board as well as the Board’s conclusions.
Nature, Quality and Extent of Services. The Board considered information about the nature, quality and extent of the services provided to the Fund and information regarding the Manager’s key personnel who provide such services. The Manager’s duties include providing the Fund with the services of the portfolio managers and the Manager’s investment team, who provide research, analysis and other advisory services in regard to the Fund’s investments; securities trading services; oversight of third-party service providers; monitoring compliance with applicable Fund policies and procedures and adherence to the Fund’s investment restrictions; and risk management. The Manager is responsible for providing certain administrative services to the Fund as well. Those services include providing and supervising all administrative and clerical personnel who are necessary in order to provide effective corporate administration for the Fund; compiling and maintaining records with respect to the Fund’s operations; preparing and filing reports required by the Securities and Exchange Commission; preparing periodic reports regarding the operations of the Fund for its shareholders; preparing proxy materials for shareholder meetings; and preparing the registration statements required by Federal and state securities laws for the sale of the Fund’s shares. The Manager also provides the Fund with office space, facilities and equipment.
| | | | |
| 69 | | | | OPPENHEIMER AMT-FREE NEW YORK MUNICIPALS |
BOARD APPROVAL OF THE FUND’S INVESTMENT
ADVISORY AGREEMENT Unaudited / Continued
The Board also considered the quality of the services provided and the quality of the Manager’s resources that are available to the Fund. The Board took account of the fact that the Manager has had over fifty years of experience as an investment adviser and that its assets under management rank it among the top mutual fund managers in the United States. The Board evaluated the Manager’s advisory, administrative, accounting, legal, compliance services and risk management, and information the Board has received regarding the experience and professional qualifications of the Manager’s key personnel and the size and functions of its staff. In its evaluation of the quality of the portfolio management services provided, the Board considered the experience of Daniel Loughran, Scott Cottier, Troy Willis, Mark DeMitry, Michael Camarella, and Charles Pulire, the portfolio managers for the Fund, and the Manager’s investment team and analysts. The Board members also considered the totality of their experiences with the Manager as directors or trustees of the Fund and other funds advised by the Manager. The Board considered information regarding the quality of services provided by affiliates of the Manager, which its members have become knowledgeable about in connection with the renewal of the Fund’s service agreements. The Board concluded, in light of the Manager’s experience, reputation, personnel, operations and resources that the Fund benefits from the services provided under the Agreement.
Investment Performance of the Manager and the Fund. Throughout the year, the Manager provided information on the investment performance of the Fund and the Manager, including comparative performance information. The Board also reviewed information, prepared by the Manager and by the independent consultant, comparing the Fund’s historical performance to relevant market indices and to the performance of other retail front-end load and no-load New York municipal debt funds. The Board noted that the Fund’s one-year and three-year performance was better than its peer group median and its ten-year performance was equal to its peer group median although its five-year performance was below its peer group median.
Costs of Services by the Manager. The Board reviewed the fees paid to the Manager and the other expenses borne by the Fund. The Board also considered the comparability of the fees charged and the services provided to the Fund to the fees and services for other clients or accounts advised by the Manager. The independent consultant provided comparative data in regard to the fees and expenses of the Fund and other retail front-end load New York municipal debt funds with comparable asset levels and distribution features. The Board noted that the Fund’s actual management fees were equal to its peer group median and higher than its peer group average. The Fund’s contractual management fees
| | | | |
| 70 | | | | OPPENHEIMER AMT-FREE NEW YORK MUNICIPALS |
were lower than its peer group median and its peer group average. The Fund’s total expenses were equal to its peer group median and lower than its peer group average.
Economies of Scale and Profits Realized by the Manager. The Board considered information regarding the Manager’s costs in serving as the Fund’s investment adviser, including the costs associated with the personnel and systems necessary to manage the Fund, and information regarding the Manager’s profitability from its relationship with the Fund. The Board reviewed whether the Manager may realize economies of scale in managing and supporting the Fund. The Board noted that the Fund currently has management fee breakpoints, which are intended to share with Fund shareholders economies of scale that may exist as the Fund’s assets grow.
Other Benefits to the Manager. In addition to considering the profits realized by the Manager, the Board considered information that was provided regarding the direct and indirect benefits the Manager receives as a result of its relationship with the Fund, including compensation paid to the Manager’s affiliates. The Board also considered that the Manager must be able to pay and retain experienced professional personnel at competitive rates to provide quality services to the Fund.
Conclusions. These factors were also considered by the independent Trustees meeting separately from the full Board, assisted by experienced counsel to the Fund and to the independent Trustees. Fund counsel and the independent Trustees’ counsel are independent of the Manager within the meaning and intent of the Securities and Exchange Commission Rules.
Based on its review of the information it received and its evaluations described above, the Board, including a majority of the independent Trustees, decided to continue the Agreement. In addition, the Board, including a majority of the Independent Trustees, approved the restructuring of the Fund’s investment advisory arrangement so that, effective January 1, 2013, (i) OFI Global Asset Management, Inc. (“OFI Global”), a wholly owned subsidiary of the Manager, will serve as the investment adviser to the Fund in place of the Manager under a Restated Advisory Agreement (“Restated Advisory Agreement”), and (ii) OFI Global will enter into a Sub-Advisory Agreement (“Sub-Advisory Agreement”) with the Manager to provide investment sub-advisory services to the Fund. OFI Global will pay the Manager a percentage of the net investment advisory fee (after all applicable waivers have been deducted) that it receives from the Fund. The Agreement will continue until the earlier of September 30, 2013 or the effective date of the Restated Advisory Agreement between the Fund and OFI Global. The Restated Advisory Agreement and Sub-Advisory Agreement will continue until September 30, 2013.
In arriving at its decisions, the Board did not single out any factor or factors as being more important than others, but considered all of the above information, and considered the terms and conditions of the Agreement, Restated Advisory Agreement and Sub-Advisory Agreement, including the management fees, in light of all of the surrounding circumstances.
| | | | |
| 71 | | | | OPPENHEIMER AMT-FREE NEW YORK MUNICIPALS |
PORTFOLIO PROXY VOTING POLICIES AND PROCEDURES;
UPDATES TO STATEMENTS OF INVESTMENTS Unaudited
The Fund has adopted Portfolio Proxy Voting Policies and Procedures under which the Fund votes proxies relating to securities (“portfolio proxies”) held by the Fund. A description of the Fund’s Portfolio Proxy Voting Policies and Procedures is available (i) without charge, upon request, by calling the Fund toll-free at 1.800.CALL OPP (225.5677), (ii) on the Fund’s website at oppenheimerfunds.com, and (iii) on the SEC’s website at www.sec.gov. In addition, the Fund is required to file Form N-PX, with its complete proxy voting record for the 12 months ended June 30th, no later than August 31st of each year. The Fund’s voting record is available (i) without charge, upon request, by calling the Fund toll-free at 1.800.CALL OPP (225.5677), and (ii) in the Form N-PX filing on the SEC’s website at www.sec.gov.
The Fund files its complete schedule of portfolio holdings with the SEC for the first quarter and the third quarter of each fiscal year on Form N-Q. The Fund’s Form N-Q filings are available on the SEC’s website at www.sec.gov. Those forms may be reviewed and copied at the SEC’s Public Reference Room in Washington, D.C. Information on the operation of the Public Reference Room may be obtained by calling 1-800-SEC-0330.
Householding—Delivery of Shareholder Documents
This is to inform you about OppenheimerFunds’ “householding” policy. If more than one member of your household maintains an account in a particular fund, OppenheimerFunds will mail only one copy of the fund’s prospectus (or, if available, the fund’s summary prospectus), annual and semiannual report and privacy policy. The consolidation of these mailings, called householding, benefits your fund through reduced mailing expense, and benefits you by reducing the volume of mail you receive from OppenheimerFunds. Householding does not affect the delivery of your account statements.
Please note that we will continue to household these mailings for as long as you remain an OppenheimerFunds shareholder, unless you request otherwise. If you prefer to receive multiple copies of these materials, please call us at 1.800.CALL-OPP (225-5677). You may also notify us in writing or via email. We will begin sending you individual copies of the prospectus (or, if available, the summary prospectus), reports and privacy policy within 30 days of receiving your request to stop householding.
| | | | |
| 72 | | | | OPPENHEIMER AMT-FREE NEW YORK MUNICIPALS |
TRUSTEES AND OFFICERS BIOS Unaudited
| | |
| Name, Position(s) Held with the Fund, Length of Service, Age | | Principal Occupation(s) During the Past 5 Years; Other Trusteeships/Directorships Held; Number of Portfolios in the Fund Complex Currently Overseen |
| |
| INDEPENDENT TRUSTEES | | The address of each Trustee in the chart below is 6803 S. Tucson Way, Centennial, Colorado 80112-3924. Each Trustee serves for an indefinite term, or until his or her resignation, retirement, death or removal. |
| |
Brian F. Wruble,
Chairman of the Board of Trustees (since 2007), Trustee (since 2005)
Age: 69 | | Director of Community Foundation of the Florida Keys (non-profit) (since July 2012); Chairman Emeritus and Non-Voting Trustee of The Jackson Laboratory (non-profit) (since August 2011); Director of Special Value Opportunities Fund, LLC (registered investment company) (affiliate of the Manager’s parent company) (since September 2004); Member of Zurich Insurance Advisory Council (insurance) (since 2004); Treasurer (since 2007) and Trustee of the Institute for Advanced Study (non-profit educational institute) (since May 1992); Chairman (August 2007-August 2011) and Trustee (since August 1991) of the Board of Trustees of The Jackson Laboratory (non-profit); General Partner of Odyssey Partners, L.P. (hedge fund) (September 1995-December 2007); Special Limited Partner of Odyssey Investment Partners, LLC (private equity investment) (January 1999-September 2004). Oversees 58 portfolios in the OppenheimerFunds complex. Mr. Wruble has served on the Boards of certain Oppenheimer funds since April 2001, during which time he has become familiar with the Fund’s (and other Oppenheimer funds’) financial, accounting, regulatory and investment matters and has contributed to the Boards’ deliberations. |
| |
David K. Downes,
Trustee (since 2007)
Age: 72 | | Director of THL Credit Inc. (since June 2009); Independent Chairman GSK Employee Benefit Trust (since April 2006); Trustee of Employee Trusts (since January 2006); Chief Executive Officer and Board Member of Community Capital Management (investment management company) (since January 2004); President of The Community Reinvestment Act Qualified Investment Fund (investment management company) (since 2004); Director of Internet Capital Group (information technology company) (since October 2003); Director of Correctnet (January 2006-2007); Independent Chairman of the Board of Trustees of Quaker Investment Trust (registered investment company) (2004-2007); Chief Operating Officer and Chief Financial Officer of Lincoln National Investment Companies, Inc. (subsidiary of Lincoln National Corporation, a publicly traded company) and Delaware Investments U.S., Inc. (investment management subsidiary of Lincoln National Corporation) (1993-2003); President, Chief Executive Officer and Trustee of Delaware Investment Family of Funds (1993-2003); President and Board Member of Lincoln National Convertible Securities Funds, Inc. and the Lincoln National Income Funds, TDC (1993-2003); Chairman and Chief Executive Officer of Retirement Financial Services, Inc. (registered transfer agent and investment adviser and subsidiary of Delaware Investments U.S., Inc.) (1993-2003); President and Chief Executive Officer of Delaware Service Company, Inc. (1995-2003); Chief Administrative Officer, Chief Financial Officer, Vice Chairman and Director of Equitable Capital Management Corporation (investment subsidiary of Equitable Life Assurance Society) (1985-1992); Corporate Controller of Merrill Lynch Company (financial services holding company) (1977-1985); held the following positions at the Colonial Penn Group, Inc. (insurance company): Corporate Budget Director (1974-1977), Assistant Treasurer (1972-1974) and Director of Corporate Taxes (1969-1972); held the following positions at Price Waterhouse Company (financial services firm): Tax Manager (1967-1969), Tax Senior (1965-1967) and Staff Accountant (1963-1965); United States Marine Corps (1957-1959). Oversees 58 portfolios in the OppenheimerFunds complex. Mr. Downes has served on the Boards of certain Oppenheimer funds since December 2005, during which time he has become familiar with the Fund’s (and other Oppenheimer funds’) financial, accounting, regulatory and investment matters and has contributed to the Boards’ deliberations. |
| | | | |
| 73 | | | | OPPENHEIMER AMT-FREE NEW YORK MUNICIPALS |
TRUSTEES AND OFFICERS BIOS Unaudited / Continued
| | |
Matthew P. Fink,
Trustee (since 2005)
Age: 71 | | Trustee of the Committee for Economic Development (policy research foundation) (2005-2011); Director of ICI Education Foundation (education foundation) (October 1991-August 2006); President of the Investment Company Institute (trade association) (October 1991-June 2004); Director of ICI Mutual Insurance Company (insurance company) (October 1991-June 2004); Author of The Rise of Mutual Funds: An Insider’s View published by Oxford University Press (second edition 2010). Oversees 58 portfolios in the OppenheimerFunds complex. Mr. Fink has served on the Boards of certain Oppenheimer funds since January 2005, during which time he has become familiar with the Fund’s (and other Oppenheimer funds’) financial, accounting, regulatory and investment matters and has contributed to the Boards’ deliberations. |
| |
Phillip A. Griffiths,
Trustee (since 1999)
Age: 73 | | Fellow of the Carnegie Corporation (since 2007); Member of the National Academy of Sciences (since 1979); Council on Foreign Relations (since 2002); Foreign Associate of Third World Academy of Sciences (since 2002); Chair of Science Initiative Group (since 1999); Member of the American Philosophical Society (since 1996); Trustee of Woodward Academy (since 1983); Director of GSI Lumonics Inc. (precision technology products company) (2001-2010); Senior Advisor of The Andrew W. Mellon Foundation (2001-2010); Distinguished Presidential Fellow for International Affairs of the National Academy of Science (2002-2010); Director of the Institute for Advanced Study (1991-2004); Director of Bankers Trust New York Corporation (1994-1999); Provost at Duke University (1983-1991). Oversees 58 portfolios in the OppenheimerFunds complex. Mr. Griffiths has served on the Boards of certain Oppenheimer funds since June 1999, during which time he has become familiar with the Fund’s (and other Oppenheimer funds’) financial, accounting, regulatory and investment matters and has contributed to the Boards’ deliberations. |
| |
Mary F. Miller, Trustee (since 2004) Age: 69 | | Trustee of International House (not-for-profit) (since June 2007); Trustee of the American Symphony Orchestra (not-for-profit) (October 1998-November 2011); and Senior Vice President and General Auditor of American Express Company (financial services company) (July 1998-February 2003). Oversees 58 portfolios in the OppenheimerFunds complex. Ms. Miller has served on the Boards of certain Oppenheimer funds since August 2004, during which time she has become familiar with the Fund’s (and other Oppenheimer funds’) financial, accounting, regulatory and investment matters and has contributed to the Boards’ deliberations. |
| |
Joel W. Motley, Trustee (since 2002) Age: 60 | | Member of the Vestry of Trinity Wall Street (since April 2012); Director of Southern Africa Legal Services Foundation (since March 2012); Board Member of Pulitzer Center for Crisis Reporting (non-profit journalism) (since December 2010); Managing Director of Public Capital Advisors, LLC (privately-held financial advisor) (since January 2006); Managing Director of Carmona Motley, Inc. (privately-held financial advisor) (since January 2002); Director of Columbia Equity Financial Corp. (privately-held financial advisor) (2002-2007); Managing Director of Carmona Motley Hoffman Inc. (privately-held financial advisor) (January 1998-December 2001); Member of the Finance and Budget Committee of the Council on Foreign Relations, Chairman of the Investment Committee of the Episcopal Church of America, Member of the Investment Committee and Board of Human Rights Watch and Member of the Investment Committee and Board of Historic Hudson Valley. Oversees 58 portfolios in the OppenheimerFunds complex. Mr. Motley has served on the Boards of certain Oppenheimer funds since October 2002, during which time he has become familiar with the Fund’s (and other Oppenheimer funds’) financial, accounting, regulatory and investment matters and has contributed to the Boards’ deliberations. |
| | | | |
| 74 | | | | OPPENHEIMER AMT-FREE NEW YORK MUNICIPALS |
| | |
Mary Ann Tynan, Trustee (since 2008) Age: 66 | | Director and Secretary of the Appalachian Mountain Club (non-profit outdoor organization) (since January 2012); Director of Opera House Arts (non-profit arts organization) (since October 2011); Independent Director of the ICI Board of Governors (since October 2011); Vice Chair of Board of Trustees of Brigham and Women’s/Faulkner Hospitals (non-profit hospital) (since 2000); Chair of Board of Directors of Faulkner Hospital (non-profit hospital) (since 1990); Member of Audit and Compliance Committee of Partners Health Care System (non-profit) (since 2004); Board of Trustees of Middlesex School (educational institution) (since 1994); Board of Directors of Idealswork, Inc. (financial services provider) (since 2003); Partner, Senior Vice President and Director of Regulatory Affairs of Wellington Management Company, LLP (global investment manager) (1976-2002); Vice President and Corporate Secretary, John Hancock Advisers, Inc. (mutual fund investment adviser) (1970-1976). Oversees 58 portfolios in the OppenheimerFunds complex. Ms. Tynan has served on the Boards of certain Oppenheimer funds since October 2008, during which time she has become familiar with the Fund’s (and other Oppenheimer funds’) financial, accounting, regulatory and investment matters and has contributed to the Boards’ deliberations. |
| |
Joseph M. Wikler, Trustee (since 2005) Age: 71 | | Director of C-TASC (bio-statistics services) (2007-2012); formerly, Director of the following medical device companies: Medintec (1992-2011) and Cathco (1996-2011); Member of the Investment Committee of the Associated Jewish Charities of Baltimore (since 1994); Director of Lakes Environmental Association (environmental protection organization) (1996-2008); Director of Fortis/Hartford mutual funds (1994-December 2001). Oversees 58 portfolios in the OppenheimerFunds complex. Mr. Wikler has served on the Boards of certain Oppenheimer funds since August 2005, during which time he has become familiar with the Fund’s (and other Oppenheimer funds’) financial, accounting, regulatory and investment matters and has contributed to the Boards’ deliberations. |
| |
Peter I. Wold, Trustee (since 2005) Age: 64 | | Director of Arch Coal, Inc. (since 2010); Director and Chairman of Wyoming Enhanced Oil Recovery Institute Commission (enhanced oil recovery study) (since 2004); President of Wold Oil Properties, Inc. (oil and gas exploration and production company) (since 1994); Vice President of American Talc Company, Inc. (talc mining and milling) (since 1999); Managing Member of Hole-in-the-Wall Ranch (cattle ranching) (since 1979); Director and Chairman of the Denver Branch of the Federal Reserve Bank of Kansas City (1993-1999); and Director of PacifiCorp. (electric utility) (1995-1999). Oversees 58 portfolios in the OppenheimerFunds complex. Mr. Wold has served on the Boards of certain Oppenheimer funds since August 2005, during which time he has become familiar with the Fund’s (and other Oppenheimer funds’) financial, accounting, regulatory and investment matters and has contributed to the Boards’ deliberations. |
| OFFICERS OF THE FUND | | The addresses of the Officers in the chart below are as follows: for Messrs. Glavin, Gabinet and Ms. Nasta, Two World Financial Center, 225 Liberty Street, New York, New York 10281-1008, for Messrs. Vandehey and Wixted, 6803 S. Tucson Way, Centennial, Colorado 80112-3924 and for Messrs. Loughran, Cottier, Willis, DeMitry, Camarella, Pulire and Stein, 350 Linden Oaks, Rochester, New York 14625. Each Officer serves for an indefinite term or until his or her resignation, retirement, death or removal. |
| | | | |
| 75 | | | | OPPENHEIMER AMT-FREE NEW YORK MUNICIPALS |
TRUSTEES AND OFFICERS BIOS Unaudited / Continued
| | |
Daniel G. Loughran, Vice President (since 2005) Age: 48 | | Senior Vice President of the Manager (since July 2007); Vice President of the Manager (April 2001-June 2007) and a Portfolio Manager with the Manager (1999-2001). Team leader, a Senior Portfolio Manager, an officer and a trader for the Fund and other Oppenheimer funds. |
| |
Scott S. Cottier, Vice President (since 2005) Age: 40 | | Vice President of the Manager (since September 2002). Portfolio Manager and trader at Victory Capital Management (1999-2002). Senior Portfolio Manager, an officer and a trader for the Fund and other Oppenheimer funds. |
| |
Troy E. Willis, Vice President (since 2005) Age: 39 | | Vice President of the Manager (since July 2009); Assistant Vice President of the Manager (July 2005-June 2009). Portfolio Manager of the Manager (2003- 2005). Corporate Attorney for Southern Resource Group (1999-2003). Senior Portfolio Manager, an officer and a trader for the Fund and other Oppenheimer funds. |
| |
Mark R. DeMitry, Vice President (since 2009) Age: 36 | | Vice President of the Manager (since July 2009); Associate Portfolio Manager of the Fund (September 2006-June 2009). Research Analyst of the Manager (June 2003-September 2006) and a Credit Analyst of the Manager (July 2001-May 2003). Senior Portfolio Manager, an officer and a trader for the Fund and other Oppenheimer funds. |
| |
Michael L. Camarella, Vice President (since 2009) Age: 36 | | Vice President of the Manager (since January 2011); Assistant Vice President of the Manager (July 2009-December 2010); Associate Portfolio Manager of the Manager (January 2008-November 2010). Research analyst of the Manager (April 2006-December 2007) and a credit analyst of the Manager (June 2003-March 2006). Associate Portfolio Manager, an officer and a trader for the Fund and other Oppenheimer funds. |
| |
Charles S. Pulire, Vice President (since 2011) Age: 35 | | Assistant Vice President of the Manager (since December 2010); Research Analyst of the Manager (February 2008-November 2010); Credit Analyst of the Manager (May 2006-January 2008). Portfolio Manager, an officer and a trader for the Fund and other Oppenheimer funds. |
| |
Richard Stein, Vice President (since 2007) Age: 54 | | Director of the Rochester Credit Analysis team (since March 2004); Senior Vice President of the Manager (since June 2011) and a Vice President of the Manager (1997-May 2011); headed Rochester’s Credit Analysis team (since May 1993). |
| |
William F. Glavin, Jr., President and Principal Executive Officer (since 2009) Age: 54 | | Chairman of the Manager (since December 2009); Chief Executive Officer and Director of the Manager (since January 2009); President of the Manager (since May 2009); Director of Oppenheimer Acquisition Corp. (“OAC”) (the Manager’s parent holding company) (since June 2009); Executive Vice President (March 2006-February 2009) and Chief Operating Officer (July 2007-February 2009) of Massachusetts Mutual Life Insurance Company (OAC’s parent company); Director (May 2004-March 2006) and Chief Operating Officer and Chief Compliance Officer (May 2004-January 2005), President (January 2005-March 2006) and Chief Executive Officer (June 2005-March 2006) of Babson Capital Management LLC; Director (March 2005-March 2006), President (May 2003-March 2006) and Chief Compliance Officer (July 2005-March 2006) of Babson Capital Securities, Inc. (a broker-dealer); President (May 2003-March 2006) of Babson Investment Company, Inc.; Director (May 2004-August 2006) of Babson Capital Europe Limited; Director (May 2004-October 2006) of Babson Capital Guernsey Limited; Director (May 2004-March 2006) of Babson Capital Management LLC; Non-Executive Director (March 2005-March 2007) of Baring Asset Management Limited; Director (February 2005-June 2006) Baring Pension Trustees Limited; Director and Treasurer (December 2003-November 2006) of Charter Oak Capital Management, Inc.; Director |
| | | | |
| 76 | | | | OPPENHEIMER AMT-FREE NEW YORK MUNICIPALS |
| | |
William F. Glavin, Jr., Continued | | (May 2006-September 2006) of C.M. Benefit Insurance Company; Director (May 2008-June 2009) and Executive Vice President (June 2007-July 2009) of C.M. Life Insurance Company; President (March 2006-May 2007) of MassMutual Assignment Company; Director (January 2005-December 2006), Deputy Chairman (March 2005-December 2006) and President (February 2005-March 2005) of MassMutual Holdings (Bermuda) Limited; Director (May 2008-June 2009) and Executive Vice President (June 2007-July 2009) of MML Bay State Life Insurance Company; Chief Executive Officer and President (April 2007-January 2009) of MML Distributors, LLC; and Chairman (March 2006-December 2008) and Chief Executive Officer (May 2007-December 2008) of MML Investors Services, Inc. Oversees 62 portfolios as a Trustee/Director and 94 portfolios as an officer in the OppenheimerFunds complex. |
| |
Arthur S. Gabinet, Secretary and Chief Legal Officer (since 2011) Age: 54 | | Executive Vice President (since May 2010) and General Counsel (since January 2011) of the Manager; General Counsel of the Distributor (since January 2011); General Counsel of Centennial Asset Management Corporation (since January 2011); Executive Vice President and General Counsel of HarbourView Asset Management Corporation (since January 2011); Assistant Secretary (since January 2011) and Director (since January 2011) of OppenheimerFunds International Ltd. and OppenheimerFunds plc; Vice President and Director of Oppenheimer Partnership Holdings, Inc. (since January 2011); Director of Oppenheimer Real Asset Management, Inc. (since January 2011); Executive Vice President and General Counsel of Shareholder Financial Services, Inc. and Shareholder Services, Inc. (since January 2011); Executive Vice President and General Counsel of OFI Private Investments, Inc. (since January 2011); Vice President of OppenheimerFunds Legacy Program (January 2011-January 2012); Executive Vice President and General Counsel of OFI Institutional Asset Management, Inc. (since January 2011); General Counsel, Asset Management of the Manager (May 2010-December 2010); Principal, The Vanguard Group (November 2005-April 2010); District Administrator, U.S. Securities and Exchange Commission (January 2003-October 2005). An officer of 94 portfolios in the OppenheimerFunds complex. |
| |
Christina M. Nasta, Vice President and Chief Business Officer (since 2011) Age: 39 | | Senior Vice President of the Manager (since July 2010); Vice President of the Manager (since January 2003); Vice President of OppenheimerFunds Distributor, Inc. (since January 2003). An officer of 94 portfolios in the OppenheimerFunds complex. |
| |
Mark S. Vandehey, Vice President and Chief Compliance Officer (since 2004) Age: 62 | | Senior Vice President and Chief Compliance Officer of the Manager (since March 2004); Chief Compliance Officer of OppenheimerFunds Distributor, Inc., Centennial Asset Management and Shareholder Services, Inc. (since March 2004); Vice President of OppenheimerFunds Distributor, Inc., Centennial Asset Management Corporation and Shareholder Services, Inc. (since June 1983). An officer of 94 portfolios in the OppenheimerFunds complex. |
| |
Brian W. Wixted, Treasurer and Principal Financial & Accounting Officer (since 1999) Age: 52 | | Senior Vice President of the Manager (since March 1999); Treasurer of the Manager and the following: HarbourView Asset Management Corporation, Shareholder Financial Services, Inc., Shareholder Services, Inc., Oppenheimer Real Asset Management, Inc. and Oppenheimer Partnership Holdings, Inc. (March 1999-June 2008), OFI Private Investments, Inc. (March 2000-June 2008), OppenheimerFunds International Ltd. and OppenheimerFunds plc (since May 2000), OFI Institutional Asset Management, Inc. (since November 2000), and OppenheimerFunds Legacy Program (charitable trust program established by the Manager) (June 2003-January 2012); Treasurer and Chief Financial Officer of OFI Trust Company (trust company subsidiary of the Manager) (since May 2000); Assistant Treasurer of OAC (March 1999-June 2008). An officer of 94 portfolios in the OppenheimerFunds complex. |
The Fund’s Statement of Additional Information contains additional information about the Fund’s Trustees and Officers and is available without charge upon request, by calling 1.800.CALL OPP (225.5677).
| | | | |
| 77 | | | | OPPENHEIMER AMT-FREE NEW YORK MUNICIPALS |
OPPENHEIMER AMT-FREE NEW YORK MUNICIPALS
| | |
| Manager | | OppenheimerFunds, Inc. |
| Distributor | | OppenheimerFunds Distributor, Inc. |
| Transfer and Shareholder Servicing Agent | | OppenheimerFunds Services |
Independent
Registered Public Accounting Firm | | KPMG LLP |
| Legal Counsel | | Kramer Levin Naftalis & Frankel LLP |
©2012 OppenheimerFunds, Inc. All rights reserved.
| | | | |
| 78 | | | | OPPENHEIMER AMT-FREE NEW YORK MUNICIPALS |
PRIVACY POLICY NOTICE
As an Oppenheimer fund shareholder, you are entitled to know how we protect your personal information and how we limit its disclosure.
Information Sources
We obtain nonpublic personal information about our shareholders from the following sources:
| l | | Applications or other forms |
| l | | When you create a user ID and password for online account access |
| l | | When you enroll in eDocs Direct, our electronic document delivery service |
| l | | Your transactions with us, our affiliates or others |
| l | | A software program on our website, often referred to as a “cookie,” which indicates which parts of our site you’ve visited |
| l | | When you set up challenge questions to reset your password online |
If you visit oppenheimerfunds.com and do not log on to the secure account information areas, we do not obtain any personal information about you. When you do log on to a secure area, we do obtain your user ID and password to identify you. We also use this information to provide you with products and services you have requested, to inform you about products and services that you may be interested in and assist you in other ways.
We do not collect personal information through our website unless you willingly provide it to us, either directly by email or in those areas of the website that request information. In order to update your personal information (including your mailing address, email address and phone number) you must first log on and visit your user profile.
If you have set your browser to warn you before accepting cookies, you will receive the warning message with each cookie. You can refuse cookies by turning them off in your browser. However, doing so may limit your access to certain sections of our website.
We use cookies to help us improve and manage our website. For example, cookies help us recognize new versus repeat visitors to the site, track the pages visited, and enable some special features on the website. This data helps us provide a better service for our website visitors.
Protection of Information
We do not disclose any non-public personal information (such as names on a customer list) about current or former customers to anyone, except as permitted by law.
Disclosure of Information
We send your financial advisor (as designated by you) copies of confirmations, account statements and other documents reporting activity in your fund accounts. We may also use details about you and your investments to help us, our financial service affiliates, or firms that jointly market their financial products and services with ours, to better serve your investment needs or suggest financial services or educational material that may be of interest to you. If this requires us to provide you with an opportunity to “opt in” or “opt out” of such information sharing with a firm not affiliated with us, you will receive notification on how to do so, before any such sharing takes place.
Right of Refusal
We will not disclose your personal information to unaffiliated third parties (except as permitted by law), unless we first offer you a reasonable opportunity to refuse or “opt out” of such disclosure.
Internet Security and Encryption
In general, the email services provided by our website are encrypted and provide a secure and private means of communication with us. To protect your own privacy, confidential and/or personal information should only be communicated via email when you are advised that you are using a secure website.
| | | | |
| 79 | | | | OPPENHEIMER AMT-FREE NEW YORK MUNICIPALS |
PRIVACY POLICY NOTICE
As a security measure, we do not include personal or account information in non-secure emails, and we advise you not to send such information to us in non-secure emails. Instead, you may take advantage of the secure features of our website to encrypt your email correspondence. To do this, you will need to use a browser that supports Secure Sockets Layer (SSL) protocol.
We do not guarantee or warrant that any part of our website, including files available for download, are free of viruses or other harmful code. It is your responsibility to take appropriate precautions, such as use of an anti-virus software package, to protect your computer hardware and software.
| l | | All transactions, including redemptions, exchanges and purchases, are secured by SSL and 128-bit encryption. SSL is used to establish a secure connection between your PC and OppenheimerFunds’ server. It transmits information in an encrypted and scrambled format. |
| l | | Encryption is achieved through an electronic scrambling technology that uses a “key” to code and then decode the data. Encryption acts like the cable converter box you may have on your television set. It scrambles data with a secret code so that no one can make sense of it while it is being transmitted. When the data reaches its destination, the same software unscrambles the data. |
| l | | You can exit the secure area by either closing your browser, or for added security, you can use the Log Out button before you close your browser. |
Other Security Measures
We maintain physical, electronic and procedural safeguards to protect your personal account information. Our employees and agents have access to that information only so that they may offer you products or provide services, for example, when responding to your account questions.
How You Can Help
You can also do your part to keep your account information private and to prevent unauthorized transactions. If you obtain a user ID and password for your account, do not allow it to be used by anyone else. Also, take special precautions when accessing your account on a computer used by others.
Who We Are
This joint notice describes the privacy policies of the Oppenheimer funds, OppenheimerFunds Distributor, Inc., the trustee of OppenheimerFunds Individual Retirement Accounts (IRAs) and the custodian of the OppenheimerFunds 403(b)(7) tax sheltered custodial accounts. It applies to all Oppenheimer fund accounts you presently have, or may open in the future, using your Social Security number—whether or not you remain a shareholder of our funds. This notice was last updated January 16, 2004. In the event it is updated or changed, we will post an updated notice on our website at oppenheimerfunds.com. If you have any questions about these privacy policies, write to us at P.O. Box 5270, Denver, CO 80217-5270, email us by clicking on the Contact Us section of our website at oppenheimerfunds.com or call us at 1.800.CALL OPP (225.5677).
| | | | |
| 80 | | | | OPPENHEIMER AMT-FREE NEW YORK MUNICIPALS |
Item 2. Code of Ethics.
The registrant has adopted a code of ethics that applies to the registrant’s principal executive officer, principal financial officer, principal accounting officer or controller or persons performing similar functions.
Item 3. Audit Committee Financial Expert.
The Board of Trustees of the registrant has determined that David Downes, the Board’s Audit Committee Chairman, is an audit committee financial expert and that Mr. Downes is “independent” for purposes of this Item 3.
Item 4. Principal Accountant Fees and Services.
The principal accountant for the audit of the registrant’s annual financial statements billed $42,000 in fiscal 2012 and $41,200 in fiscal 2011.
The principal accountant for the audit of the registrant’s annual financial statements billed $2,500 in fiscal 2012 and $2,619 in fiscal 2011.
The principal accountant for the audit of the registrant’s annual financial statements billed $416,206 in fiscal 2012 and $153,900 in fiscal 2011 to the registrant’s investment adviser or any entity controlling, controlled by, or under common control with the adviser that provides ongoing services to the registrant.
Such services include: Internal control reviews, compliance procedures, GIPS attestation procedures, internal audit training, and surprise exams
The principal accountant for the audit of the registrant’s annual financial statements billed no such fees in fiscal 2012 and $4,650 in fiscal 2011.
The principal accountant for the audit of the registrant’s annual financial statements billed $359,124 in fiscal 2012 and no such fees in fiscal 2011 to the registrant’s investment adviser or any entity controlling, controlled by, or under common control with the adviser that provides ongoing services to the registrant.
Such services include: tax compliance, tax planning and tax advice. Tax compliance generally involves preparation of original and amended tax returns, claims for a refund and tax payment-planning services. Tax planning and tax advice includes assistance with tax audits and appeals, tax advice related to mergers and acquisitions and requests for rulings or technical advice from taxing authorities.
The principal accountant for the audit of the registrant’s annual financial statements billed no such fees in fiscal 2012 and no such fees in fiscal 2011.
The principal accountant for the audit of the registrant’s annual financial statements billed no such fees in fiscal 2012 and no such fees in fiscal 2011 to the registrant’s investment adviser or any entity controlling, controlled by, or under common control with the adviser that provides ongoing services to the registrant.
Such fees would include the cost to the principal accountant of attending audit committee meetings and consultations regarding the registrant’s retirement plan with respect to its Trustees.
| (e) | (1) During its regularly scheduled periodic meetings, the registrant’s audit committee will pre-approve all audit, audit-related, tax and other services to be provided by the principal accountants of the registrant. |
The audit committee has delegated pre-approval authority to its Chairman for any subsequent new engagements that arise between regularly scheduled meeting dates provided that any fees such pre-approved are presented to the audit committee at its next regularly scheduled meeting.
Under applicable laws, pre-approval of non-audit services maybe waived provided that: 1) the aggregate amount of all such services provided constitutes no more than five percent of the total amount of fees paid by the registrant to it principal accountant during the fiscal year in which services are provided 2) such services were not recognized by the registrant at the time of engagement as non-audit services and 3) such services are promptly brought to the attention of the audit committee of the registrant and approved prior to the completion of the audit.
(2) 100%
| (f) | Not applicable as less than 50%. |
| (g) | The principal accountant for the audit of the registrant’s annual financial statements billed $777,830 in fiscal 2012 and $161,169 in fiscal 2011 to the registrant and the registrant’s investment adviser or any entity controlling, controlled by, or under common control with the adviser that provides ongoing services to the registrant related to non-audit fees. Those billings did not include any prohibited non-audit services as defined by the Securities Exchange Act of 1934. |
| (h) | The registrant’s audit committee of the board of Trustees has considered whether the provision of non-audit services that were rendered to the registrant’s investment adviser, and any entity controlling, controlled by, or under common control with the investment adviser that provides ongoing services to the registrant that were not pre-approved pursuant to paragraph (c)(7)(ii) of Rule 2-01 of Regulation S-X is compatible with maintaining the principal accountant’s independence. No such services were rendered. |
Item 5. Audit Committee of Listed Registrants
Not applicable.
Item 6. Schedule of Investments.
a) Not applicable. The complete schedule of investments is included in Item 1 of this Form N-CSR.
b) Not applicable.
Item 7. Disclosure of Proxy Voting Policies and Procedures for Closed-End Management Investment Companies.
Not applicable.
Item 8. Portfolio Managers of Closed-End Management Investment Companies.
Not applicable.
Item 9. Purchases of Equity Securities by Closed-End Management Investment Company and Affiliated Purchasers.
Not applicable.
Item 10. Submission of Matters to a Vote of Security Holders.
The Fund’s Governance Committee Provisions with Respect to Nominations of Directors/Trustees to the Respective Boards
| 1. | The Fund’s Governance Committee (the “Committee”) will evaluate potential Board candidates to assess their qualifications. The Committee shall have the authority, upon approval of the Board, to retain an executive search firm to assist in this effort. The Committee may consider recommendations by business and personal contacts of current |
| | Board members and by executive search firms which the Committee may engage from time to time and may also consider shareholder recommendations. The Committee may consider the advice and recommendation of the Funds’ investment manager and its affiliates in making the selection. |
| 2. | The Committee shall screen candidates for Board membership. The Committee has not established specific qualifications that it believes must be met by a trustee nominee. In evaluating trustee nominees, the Committee considers, among other things, an individual’s background, skills, and experience; whether the individual is an “interested person” as defined in the Investment Company Act of 1940; and whether the individual would be deemed an “audit committee financial expert” within the meaning of applicable SEC rules. The Committee also considers whether the individual’s background, skills, and experience will complement the background, skills, and experience of other nominees and will contribute to the Board. There are no differences in the manner in which the Committee evaluates nominees for trustees based on whether the nominee is recommended by a shareholder. |
| 3. | The Committee may consider nominations from shareholders for the Board at such times as the Committee meets to consider new nominees for the Board. The Committee shall have the sole discretion to determine the candidates to present to the Board and, in such cases where required, to shareholders. Recommendations for trustee nominees should, at a minimum, be accompanied by the following: |
| | • | | the name, address, and business, educational, and/or other pertinent background of the person being recommended; |
| | • | | a statement concerning whether the person is an “interested person” as defined in the Investment Company Act of 1940; |
| | • | | any other information that the Funds would be required to include in a proxy statement concerning the person if he or she was nominated; and |
| | • | | the name and address of the person submitting the recommendation and, if that person is a shareholder, the period for which that person held Fund shares. |
The recommendation also can include any additional information which the person submitting it believes would assist the Committee in evaluating the recommendation.
| 4. | Shareholders should note that a person who owns securities issued by Massachusetts Mutual Life Insurance Company (the parent company of the Funds’ investment adviser) would be deemed an “interested person” under the Investment Company Act of 1940. In addition, certain other relationships with Massachusetts Mutual Life Insurance Company or its subsidiaries, with registered broker-dealers, or with the Funds’ outside legal counsel may cause a person to be deemed an “interested person.” |
| 5. | Before the Committee decides to nominate an individual as a trustee, Committee members and other directors customarily interview the individual in person. In addition, the individual customarily is asked to complete a detailed questionnaire which is designed to elicit information which must be disclosed under SEC and stock exchange rules and to determine whether the individual is subject to any statutory disqualification from serving as a trustee of a registered investment company. |
Item 11. Controls and Procedures.
Based on their evaluation of the registrant’s disclosure controls and procedures (as defined in rule 30a-3(c) under the Investment Company Act of 1940 (17 CFR 270.30a-3(c)) as of 9/28/2012, the registrant’s principal executive officer and principal financial officer found the registrant’s disclosure controls and procedures to provide reasonable assurances that information required to be disclosed by the registrant in the reports that it files under the Securities Exchange Act of 1934 (a) is accumulated and communicated to registrant’s management, including its principal executive officer and principal financial officer, to allow timely decisions regarding required disclosure, and (b) is recorded, processed, summarized and reported, within the time periods specified in the rules and forms adopted by the U.S. Securities and Exchange Commission.
There have been no changes in the registrant’s internal controls over financial reporting that occurred during the registrant’s second fiscal quarter of the period covered by this report that have materially affected, or are reasonably likely to materially affect, the registrant’s internal control over financial reporting.
Item 12. Exhibits.
| (a) | (1) Exhibit attached hereto. |
(2) Exhibits attached hereto.
(3) Not applicable.
| (b) | Exhibit attached hereto. |
SIGNATURES
Pursuant to the requirements of the Securities Exchange Act of 1934 and the Investment Company Act of 1940, the registrant has duly caused this report to be signed on its behalf by the undersigned, thereunto duly authorized.
Oppenheimer AMT - Free New York Municipals
| | |
| By: | | /s/ William F. Glavin, Jr. |
| | William F. Glavin, Jr. |
| | Principal Executive Officer |
| Date: | | 11/12/2012 |
Pursuant to the requirements of the Securities Exchange Act of 1934 and the Investment Company Act of 1940, this report has been signed below by the following persons on behalf of the registrant and in the capacities and on the dates indicated.
| | |
| By: | | /s/ William F. Glavin, Jr. |
| | William F. Glavin, Jr. |
| | Principal Executive Officer |
| Date: | | 11/12/2012 |
| | |
| By: | | /s/ Brian W. Wixted |
| | Brian W. Wixted |
| | Principal Financial Officer |
| Date: | | 11/12/2012 |