UNITED STATES
SECURITIES AND EXCHANGE COMMISSION
WASHINGTON, D.C. 20549
FORM N-CSR
CERTIFIED SHAREHOLDER REPORT OF REGISTERED MANAGEMENT
INVESTMENT COMPANIES
Investment Company Act file number 811-4054
Oppenheimer Rochester AMT - Free New York Municipal Fund
(Exact name of registrant as specified in charter)
6803 South Tucson Way, Centennial, Colorado 80112-3924
(Address of principal executive offices) (Zip code)
Cynthia Lo Bessette
OFI Global Asset Management, Inc.
225 Liberty Street, New York, New York 10281-1008
(Name and address of agent for service)
Registrant’s telephone number, including area code: (303) 768-3200
Date of fiscal year end: September 30
Date of reporting period: 9/30/2017
Item 1. Reports to Stockholders.
Table of Contents
Class A Shares
AVERAGE ANNUAL TOTAL RETURNS AT 9/30/17
| | | | | | |
| | | Class A Shares of the Fund | | |
| | | Without Sales Charge | | With Sales Charge | | Bloomberg Barclays Municipal Bond Index |
| 1-Year | | 0.08% | | -4.67% | | 0.87% |
| 5-Year | | 3.21 | | 2.21 | | 3.01 |
| 10-Year | | 4.19 | | 3.69 | | 4.52 |
Performance data quoted represents past performance, which does not guarantee future results. The investment return and principal value of an investment in the Fund will fluctuate so that an investor’s shares, when redeemed, may be worth more or less than their original cost. Fund returns include changes in share price, reinvested distributions, and a 4.75% maximum applicable sales charge except where “without sales charge” is indicated. Current performance may be lower or higher than the performance quoted. Returns do not consider capital gains or income taxes on an individual’s investment. For performance data current to the most recent month-end, visit oppenheimerfunds.com or call 1.800.CALL OPP (225.5677).
Our Twitter handle is @RochesterFunds.
|
| 2 OPPENHEIMER ROCHESTER AMT-FREE NEW YORK MUNICIPAL FUND |
Fund Performance Discussion
Oppenheimer Rochester AMT-Free New York Municipal Fund continued to generate attractive levels of tax-free income during the most recent reporting period. As of September 30, 2017, the Class A shares provided a distribution yield at net asset value (NAV) of 3.11%. For New York State and New York City residents in the top 2017 tax bracket, the taxable equivalent yield was 4.41% and 4.62%, respectively, as of September 30, 2017. Falling bond prices at the outset and end of the reporting period caused the Fund’s NAVs to decline and the 12-month total return of the Fund’s Class A shares was 0.08% at NAV as of September 30, 2017. Tax-free income comprised 100% of the total return this reporting period.
MARKET OVERVIEW
U.S. equities extended their rally during this reporting period, repeatedly topping previous record high closes, and yields on AAA-rated municipal bonds and Treasury securities improved. Prices in the municipal bond market declined sharply after Election Day, rebounded thereafter and then declined slightly during the final three months of this reporting period. The fluctuations in bond prices served to limit the total return of the Bloomberg Barclays. Municipal Bond Index, which is this Fund’s benchmark and a widely used index of the performance of the general muni market.
The average distribution yield in Lipper’s New York Municipal Debt Funds category was 2.89% at the end of this reporting period. At 3.11%, the distribution yield at NAV for this Fund’s Class A shares was 22 basis points higher than the category average.
At its September meeting, the Federal Reserve Open Market Committee (FOMC) held the Fed Funds target rate to a range of 0.75% to 1.00%. The FOMC, noting that it expects economic conditions to “evolve in a manner
| | | | |
YIELDS & DISTRIBUTIONS FOR CLASS A SHARES | | | | |
| Dividend Yield w/o sales charge | | | 3.11% | |
| Dividend Yield with sales charge | | | 2.96 | |
| Standardized Yield | | | 2.26 | |
| Taxable Equivalent Yield | | | 4.41 | |
| Last distribution (9/26/17) | | $ | 0.029 | |
| Total distributions (10/1/16 to 9/30/17) | | $ | 0.416 | |
Endnotes for this discussion begin on page 17 of this report.
|
| 3 OPPENHEIMER ROCHESTER AMT-FREE NEW YORK MUNICIPAL FUND |
that will warrant gradual increases” in the Fed Funds rate, continued to signal its intent to increase the rate once more in 2017 and three times in 2018. As had been previewed in the second quarter of 2017, the Fed’s $4.5 trillion balance sheet will begin to be “normalized.” Reductions of $10 billion a month, it was announced, would commence in October 2017 and rise to $50 billion a month over the next year.
The benchmark interest rate was raised in December 2016, March 2017 and June 2017, each time by one-quarter of 1 percentage point. From December 2008 until December 2015, the key rate was held to a range of zero to 0.25%.
We remind investors that a change in the Fed Funds rate does not automatically translate into a change in longer-term interest rates, which are determined by the marketplace. During this reporting period, the muni market’s reactions to the Fed’s moves did not appear to be especially significant or lasting. This Fund’s portfolio managers do not adjust their investment style in response to Fed actions.
At the end of this reporting period, the BofA Merrill Lynch AAA Municipal Securities Index, which is the AAA subset of the broader BofA Merrill Lynch US Municipal Securities Index – was 1.83, 39 basis points higher than on September 30, 2016. Additionally, the entire yield curve for high-grade municipal bonds was higher at the end of this reporting period than on September 30, 2016.
The Treasury yield curve also was higher at the end of the reporting period than at its outset: Yields at the shorter end of the Treasury curve rose slightly more than yields at the curve’s longer end, and the Treasury curve largely maintained its shape.
The muni yield curve, by contrast, steepened as the yields on longer-term munis rose more than the yields on shorter-term munis. While a steepening yield curve reflects investors’ expectations for a stronger economy and, perhaps, rising inflation, we note that some longer-term, high-grade munis offered higher nominal yields than Treasury securities with comparable maturities.
On an after-tax basis, munis of all maturities provided taxpayers in the top four federal tax brackets more favorable after-tax yields than Treasury securities with comparable maturities; Treasury bonds are backed by the full faith and credit of the U.S. government.
This reporting period was also characterized by credit spread tightening, which occurs when the difference between yields on low-rated municipal bonds and higher-rated bonds decreases. As credit spreads tighten, investments in BBB-rated, lower-rated and unrated securities typically outperform municipal securities with higher credit ratings.
After six years of on-time budgets, a $153 billion spending plan for New York State’s fiscal year 2018 was approved on April 9, 2017, nine days late. It included free State University of New York (SUNY) tuition for
|
| 4 OPPENHEIMER ROCHESTER AMT-FREE NEW YORK MUNICIPAL FUND |
eligible students, ride-hailing services for upstate New York, a 4.4% increase in aid to schools, $200 million to fight heroin addiction and $200 million for a statewide recreational trail. Other investments include a 5-year, $2.5 billion fund to improve the state’s drinking water infrastructure and $207 million for the Rochester photonics institute and other SUNY Polytechnic Institute projects.
In July 2017, Gov. Andrew Cuomo announced a $5.6 billion transformation of the Long Island Rail Road that will include 1,000 projects including emergency track and signal interlocking work around Penn Station, Jamaica Station reconstruction, 39 renovated Long Island Rail Road stations and grade-crossing eliminations.
The first span of the new Tappan Zee Bridge opened with much fanfare on August 24, 2017. To be officially renamed as The Governor Mario M. Cuomo Bridge, the $4 billion project will carry 50 million cars a year across the Hudson River to New York City suburbs. The second span is scheduled to be completed by Spring 2018. The new bridge was funded by an $850 million bond issue from the New York State Thruway Authority and a $1.6 billion loan from the federal Department of Transportation. The remainder of the cost is expected to be covered by toll revenues, with current toll rates frozen through 2020.
Plans for the redevelopment of the JFK International Airport continue as the Port Authority issued requests for proposals for
preliminary engineering and design work for the $10 billion project. New York State is devoting $1.5 billion to improve the Van Wyck Expressway and Kew Gardens Interchange to reduce congestion near the airport.
A groundbreaking ceremony for the new Delta Air Lines terminal at LaGuardia Airport took place in August 2017. The Port Authority of New York and New Jersey is providing $600 million for the project, and the remaining $3.6 billion cost will be privately funded by Delta and its partners.
As of September 30, 2017, New York State’s general obligation (G.O.) bonds were rated Aa1 by Moody’s Investors Service and AA-plus by S&P Global Ratings (S&P) and Fitch Ratings. G.O.s are backed by the full faith and taxing authority of the state or local government that issues them.
Three weeks ahead of the July 1, 2017 deadline, Mayor Bill de Blasio and the New York City Council announced an $85.2 billion budget for fiscal year 2018. It was later adjusted to $88 billion to include prepayments from the prior year. The spending plan included $1.2 billion for the general reserve, $4.2 billion in retiree health benefits, and $250 million for the capital stabilization reserve. The spending plan was 3.8% larger than the previous fiscal year’s, despite savings related to a partial hiring freeze and debt service obligations.
In June 2017, the mayor announced New York Works, a
10-year job initiative to create
|
| 5 OPPENHEIMER ROCHESTER AMT-FREE NEW YORK MUNICIPAL FUND |
The Rochester Portfolio Managers

100,000 good-paying jobs through a $1 billion investment in targeted industries such as technology, cybersecurity, life sciences and health care, industrial and manufacturing, and the creative and cultural sectors. Mayor De Blasio said he would add $250 million in new spending to the November and January budget updates.
Major construction for a new Moynihan Train Hall in the Farley Post Office building began in August 2017. A concourse linking the Farley
building to Penn Station opened in June 2017. The $1.6 billion project is scheduled to be completed in 2020.
As of September 30, 2017, Fitch and S&P affirmed their AA ratings for New York City’s G.O. bonds and Moody’s assigned an Aa2 rating.
The Commonwealth of Puerto Rico remained in the headlines throughout this reporting period, and more detailed information about
|
| 6 OPPENHEIMER ROCHESTER AMT-FREE NEW YORK MUNICIPAL FUND |
The Rochester Credit Research Team

|
| 7 OPPENHEIMER ROCHESTER AMT-FREE NEW YORK MUNICIPAL FUND |
the developments discussed below can be found on our online PR Roundup (oppenheimerfunds.com/puerto-rico).
In early September 2016, Francisco Besosa, a U.S. District Court judge, said he would not halt a lawsuit in which plaintiffs allege that then-Gov. Alejandro García Padilla violated PROMESA (the Puerto Rico Oversight, Management and Economic Stability Act, enacted in June 2016) by declaring a moratorium on payments of constitutionally backed debt. Also in September 2016, S&P downgraded several senior unsecured Government Development Bank (GDB) bonds because the GDB had failed to make its August 1 and September 1 interest payments.
On October 14, 2016, the governor presented a fiscal plan to the federal oversight board that had been established by PROMESA. The plan was immediately challenged by Carlos Garcia, a member of the oversight board, who took issue with the government’s assessment of its fiscal situation.
Ricardo Rosselló Nevares, who was elected governor of the Commonwealth in November 2016, began his term in office by signing several executive orders related to fiscal and economic conditions in the Commonwealth, including a measure that required reductions in the operating expenses of all government agencies. Gov. Rosselló also ordered the use of zero-base budgets beginning with fiscal 2018 (which began July 1, 2017) and the creation of an entity to expedite the approvals
of permits and certifications for infrastructure projects.
On January 3, 2017, PREPA, Puerto Rico’s electric utility, made its $192.5 million interest payment in full. Also in early January, subsidiaries of the insurer Assured Guaranty made payments of $39 million and $5 million on G.O. debt and Public Building Authority debt, respectively. The Commonwealth, as expected, failed to pay $358 million of interest on its G.O. bonds on January 3.
In the first month of his administration, Gov. Rosselló tried to secure some changes to deadlines set forth in PROMESA. The federal oversight board was amenable but imposed certain conditions, including a commitment not to take more loans to provide short-term liquidity. Simultaneously, the federal oversight board told Gov. Rosselló that his plan had to make spending cuts and certain revenue increases.
Also in January 2017, the governor signed an extension through December 2021 to a tax on foreign corporations, as expected. The Act 154 tax has historically been a significant source of government revenue. The governor also signed a new measure, the Puerto Rico Financial Emergency and Fiscal Responsibility Act, to replace the Debt Moratorium Act, which had given the former governor the power to suspend debt payments.
Full coupon payments were made on February 1, 2017 on bonds backed by Puerto Rico’s sales and use tax (COFINA bonds)
|
| 8 OPPENHEIMER ROCHESTER AMT-FREE NEW YORK MUNICIPAL FUND |
as well as bonds issued by the Puerto Rico Industrial Development Company, PRASA (the Commonwealth’s aqueduct and sewer authority), and PRHTA (its highways and transportation authority). However, the GDB, the Public Finance Corporation (PFC) and the Puerto Rico Infrastructure and Finance Authority (PRIFA) failed to make certain payments on that date; like the GDB, the PFC and PRIFA had missed earlier payments.
In February 2017, Gov. Rosselló discussed his 10-year fiscal plan. The plan did not meet the federal oversight board’s requirement that certain fiscal adjustments be made to close the fiscal 2019 budget gap. The federal oversight board voiced concerns about the Commonwealth’s liquidity and the accuracy of revenue projections. The board later approved an amended plan and established a number of milestones for the Rosselló administration.
In other developments related to the fiscal plan, the federal fiscal 2018 budget proposal that President Trump announced in May 2017 calls for $1.59 billion to fund Medicaid in Puerto Rico, an increase of $1.24 billion versus the official Medicaid cap for the Commonwealth and in line will historic Medicaid funding for the Commonwealth. Puerto Rico officials did not adjust the Commonwealth’s fiscal plan, which assumes the federal government’s Medicaid allocation is zero.
Despite the portfolio management team’s multi-year efforts to reach negotiated settlements with various issuers in Puerto
Rico, the federal oversight board in May 2017 commenced proceedings under Title III of PROMESA, similar to a Chapter 9 bankruptcy, for the Commonwealth, the Puerto Rico Sales Tax Financing Corporation (issuer of COFINA bonds), the PRHTA and the Employee Retirement System. The commencement of these proceedings effectively blocked various lawsuits that had been filed soon after the May 1 expiration of the stay of litigation, which had been included in PROMESA and subsequently extended.
The Puerto Rico Electric Power Authority (PREPA) and its forbearing bondholders, including Oppenheimer Rochester, worked throughout this reporting period to finalize a restructuring support agreement (RSA) whose terms were agreed on in September 2015. In December 2016, PREPA and its forbearing bondholders agreed to extend the RSA until March 31, 2017; further extensions pushed the RSA’s expiration until the end of June 2017.
PREPA allowed the nearly finalized RSA to terminate in late June 2017, even though the forbearing creditors had offered to extend the agreement again. On July 2, 2017, the federal oversight board voted against the RSA and commenced PREPA’s Title III proceeding; the utility did not make its July 3 payments of principal and interest.
In Title III, the unresolved issues among debtors and creditors will proceed along separate tracks: mediation and litigation. While court-facilitated mediation may
|
| 9 OPPENHEIMER ROCHESTER AMT-FREE NEW YORK MUNICIPAL FUND |
be an effective and efficient process, investors should be aware that protracted litigation remains a very real possibility. These developments affect current dividend distribution calculations for funds with holdings subject to Title III. The Title III proceedings are being overseen by U.S. District Judge Laura Taylor Swain, who was selected by the Chief Justice of the U.S. Supreme Court, John Roberts.
In late June 2017, the federal oversight board approved its own consolidated budget. The new budget came as a response to the governor’s proposed $9.56 billion general fund budget, which had been released in May and had called for a 6.3% increase in spending but very limited money available for debt service, inconsistent with the requirements of PROMESA.
In mid-July 2017, the federal oversight board approved a restructuring plan for the GDB, giving bondholders between 55% and 75% of the face value of their debt; the size of the “haircut” depends on the interest rate of the newly issued debt. In late July, the mayor of San Juan announced intentions to challenge this plan as a means to protect the city’s GDB deposits. (This Fund does not hold GDB debt; the Oppenheimer Rochester funds’ holdings of GDB debt represent less than one-hundredth of 1% of the assets of a single fund, Oppenheimer Rochester Limited Term California Municipal Fund.)
In other news, the Commonwealth held a vote regarding statehood in June. Those who
voted in the nonbinding referendum were overwhelmingly in favor of changing the Commonwealth’s status to U.S. statehood, but less than one-quarter of the electorate voted.
For fiscal year 2017, which ended June 30, 2017, general fund net revenues exceeded estimates by 2.6% (or $235 million), which Puerto Rico’s Treasury Secretary called “a significant fiscal accomplishment.” Puerto Rico’s cash position as of June 30, 2017 was $1.5 billion higher than Judge Swain had been told it would be, according to figures released in early August, raising new questions about why the Commonwealth claimed it could not make debt payments. Meanwhile, the U.S. Census Bureau reported that the median income on Puerto Rico rose in 2016.
In August 2017, the Puerto Rico Legislature and the federal oversight board approved a budget for fiscal year 2018 and announced plans to conduct a “comprehensive investigation” of the Commonwealth’s debt. Also in August, the Commonwealth’s Supreme Court denied the governor’s request to keep his initial draft budget (submitted to the board in late April) and other documents under wraps.
At an August 9 hearing, Judge Swain approved an agreement establishing a procedure to resolve, by December 15, the debt dispute between Puerto Rico and certain COFINA bondholders. Debt restructurings for GDB securities, which were approved by the
|
| 10 OPPENHEIMER ROCHESTER AMT-FREE NEW YORK MUNICIPAL FUND |
Puerto Rico Legislature two days later, have yet to receive approval from the U.S. District Court.
In mid-August, the governor swore in a seven-member Puerto Rico Statehood Commission, a delegation that will seek to be seated in the U.S. Congress as the Commonwealth’s representatives. Since 1796, when the territory of Tennessee sent its delegation of statehood advocates to the nation’s capital, this approach has been called the Tennessee Plan. The governor has acknowledged that Congress is not likely to act with haste, but he nonetheless hopes that the commission can “draw attention and sensitize the nation about the need for Puerto Ricans to be recognized in equality as American citizens.” Given all that is currently on Congress’s agenda, we do not believe it likely that the delegation or the push for Puerto Rican statehood will gain significant attention.
In late September, two hurricanes – Irma and Maria – caused damage on Puerto Rico. Irma passed to the north of the Commonwealth, and Maria made landfall: According to preliminary government reports, nearly 50 people died, structural damage was extensive, and millions were left without power or drinking water. Military personnel and representatives of FEMA (the Federal Emergency Management Agency) were deployed. (Damage from Maria was also significant on the U.S. Virgin Islands.)
The work of the federal oversight board and Title III proceedings under PROMESA
were temporarily halted. The Puerto Rican government was rightly focused on immediate needs. A creditors group that included Oppenheimer Rochester offered PREPA a loan of $1 billion in the form of debtor in possession notes (DIPs). The offer, which was designed to provide immediate relief and help Puerto Rico qualify for matching funds from FEMA, also gave creditors the right to exchange up to $1 billion of existing bonds for $850 million of additional DIP notes, enabling PREPA to cancel up to $150 million of existing debt. The offer was rejected despite the government’s assertion that its cash position was weakening.
Developments after September 30: Following his visit to Puerto Rico, President Donald J. Trump spoke of wiping out Puerto Rico’s debt, a comment that led to steep declines in securities issued by the Commonwealth of Puerto Rico on October 4. Mick Mulvaney, Mr. Trump’s budget director, later explained that “what you heard the president say is that Puerto Rico is going to have to figure out a way to solve its debt problems.”
Later in October, Gov. Rosselló traveled to the White House to request an estimated $4.6 billion in block grants and other funding. The governor set a new timetable for restoring electrical service, pledging that 95% of customers would have electricity by mid- December; earlier, officials had said it could take 6 months to a year to restore power throughout the Commonwealth. Also in late October, the U.S. Congress passed a $36.5
|
| 11 OPPENHEIMER ROCHESTER AMT-FREE NEW YORK MUNICIPAL FUND |
billion disaster relief package, its second such package for areas affected by Hurricanes Harvey, Irma and Maria.
While the official figure for deaths caused by Hurricane Maria was said to be in the mid-50s as of November 1, 2017, news reports indicated that the figure was substantially higher. Significant portions of the island remained without power as of mid-November amid a controversy that led to the cancellation of a $300 million contract that had been awarded to Whitefish Energy Holdings, a small Montana-based company. Parts of the island do not have running water. The National Guard and FEMA, among other organizations, continue to be deployed in Puerto Rico, but the commander overseeing the U.S. military’s mission in Puerto Rico said in early November that the military is preparing to wind down operations. The Trump administration has agreed to release FEMA aid faster than is typical, and FEMA will cover 90% of the costs to rebuild public infrastructure, up from the standard 75%. The agreement also calls for third-party estimates for the costs and expenditures on “big-ticket projects.”
Meanwhile, the Rosselló administration, the federal oversight board and various bondholders remained at odds about the extent of the board’s authority. Officials seeking to resolve these disputes appeared before Congressional hearings in the first half of November. On November 13, 2017, the governor submitted a request for $94.4 billion in hurricane relief and Judge Swain ruled that
the oversight board was not authorized to replace PREPA’s executive director with a chief transformation officer of its choosing.
FUND PERFORMANCE
Oppenheimer Rochester AMT-Free New York Municipal Fund held more than 480 securities as of September 30, 2017. The Fund was invested in a broad range of sectors, providing shareholders with a diversity of holdings that we believe would be difficult and costly to replicate in an individual portfolio.
During this reporting period, a rally in U.S. equities and persistent low interest rates put pressure on the dividends of many fixed income investments. This Fund’s Class A dividend, which was 4.3 cents per share at the outset of this reporting period, was reduced to 3.8 cents per share beginning with the November 2016 payout, to 3.5 cents per share with the February 2017 payout, to 3.2 cents per share with the June 2017 payout and to 2.9 cents per share beginning with the July 2017 payout. In all, the Fund distributed 41.6 cents per Class A share this reporting period. Shareholders should note that market conditions during this reporting period did not affect the Fund’s overall investment goals or cause it to pay any capital gain distributions.
Six of the Fund’s ten largest sectors were among the top ten contributors to the Fund’s performance during this reporting period. The Fund’s performance this reporting period was primarily driven by its holdings of tobacco bonds. These high-yielding securities, which
|
| 12 OPPENHEIMER ROCHESTER AMT-FREE NEW YORK MUNICIPAL FUND |
are backed by proceeds from the landmark 1998 Master Settlement Agreement (MSA), constituted the Fund’s third-largest sector as of September 30, 2017. Other leading contributors to performance were the Fund’s largest sector (higher education) and its fifth- through seventh-largest sectors (Special Tax, hospital/healthcare and real estate, respectively) and its ninth-largest (diversified financial services).
Research-based security selection continued to be a factor in the strong performance of these sectors. The investment-grade bonds we hold in the higher education sector, some of which were invested in Puerto Rico, have regularly provided high levels of tax-free income with what we believe to be far less credit risk than their external ratings would suggest; the sector was the second-strongest contributor to the Fund’s performance this reporting period. The third-strongest contributor was the hospital/ healthcare sector, which includes securities across the credit spectrum, most of which are investment grade. The small marine/aviation facilities sector, which represented 4.0% of the Fund’s total assets as of September 30, 2017, was the fourth-strongest contributor to performance this reporting period. The Special Tax sector, which consists of bonds backed by various taxes, was the tenth-best performer as of September 30, 2017. The hospital/healthcare sector – which includes securities across the credit spectrum, most of which are investment grade – was the fifth-best performer sector this reporting period. The real estate and diversified financial
services sector were ranked third and ninth for contribution to the Fund’s total return this reporting period. Both sectors tend to perform well in a growing economy.
Seven sectors detracted from the Fund’s total return during the reporting period. Securities in the G.O., sales tax revenue and electric utilities sectors – the Fund’s second-, eighth- and tenth-largest sectors, respectively – were adversely affected by developments in Puerto Rico (as discussed above); some of the Puerto Rico bonds in these sectors are insured. Also detracting from the Fund’s performance were securities in three smaller sectors: municipal leases; tax increment financing (TIF); U.S. government obligations; and hotels, restaurants and leisure; as of September 30, 2017, the Fund had no investments in the latter sector.
In aggregate, the Fund’s substantial investments in securities issued in the Commonwealth of Puerto Rico detracted from performance this reporting period. (As discussed above, the Commonwealth continued to experience significant financial difficulties this reporting period; the Fund’s current dividend distribution calculations reflect adjustments based on the failure of various Commonwealth issuers to make their debt-service payments on time and in full.) The securities are exempt from federal, state and local income taxes, and the Fund’s holdings include the aforementioned G.O. bonds and securities from many different sectors. Most of the Fund’s investments in securities issued in Puerto Rico are supported
|
| 13 OPPENHEIMER ROCHESTER AMT-FREE NEW YORK MUNICIPAL FUND |
by taxes and other revenues and are designed to help finance electric utilities, highways and education, among other entities.
Investors should note that some of this Fund’s investments, including some securities issued in the U.S. territories of Guam and Puerto Rico, are insured. A complete listing of securities held by this Fund can be found in this report’s Statement of Investments.
INVESTMENT STRATEGY
The Rochester investment team focuses exclusively on municipal bonds, and this Fund invests primarily in investment-grade municipal securities. It may invest up to 25% of its total assets in below-investment grade securities, or “junk” bonds; the percentage of assets is measured at the time of purchase as is the credit quality of the securities. Additionally, the credit quality is based on
Nationally Recognized Statistical Rating Organization (“NRSRO”) ratings or, if no NRSRO rating, on internal ratings.
While market conditions can and do fluctuate, the Fund’s portfolio management team adheres to a consistent investment approach based on its belief that tax-free yield can help investors achieve their long-term financial objectives. The team does not manage its funds based on predictions of interest rate changes. Further details about the Rochester team’s investment approach can be found on our landing page, oppenheimerfunds. com/rochesterway.
In closing, we believe that the structure and sector composition of this Fund and the team’s use of time-tested strategies will continue to benefit fixed income investors through interest rate and economic cycles.
| | |
 | | 
Scott S. Cottier, CFA Senior Vice President, Senior Portfolio Manager and Team Leader |
| | |
 | | 
Troy E. Willis, CFA, J.D. Senior Vice President, Senior Portfolio Manager and Team Leader |
On behalf of the rest of the Rochester portfolio managers: Mark R. DeMitry, Michael L. Camarella, Charles S. Pulire and Elizabeth S. Mossow.
|
| 14 OPPENHEIMER ROCHESTER AMT-FREE NEW YORK MUNICIPAL FUND |
Top Holdings and Allocations
TOP TEN CATEGORIES
| | | | |
| Higher Education | | | 13.3 | % |
| General Obligation | | | 8.7 | |
| Tobacco Master Settlement Agreement | | | 8.4 | |
| Highways/Commuter Facilities | | | 8.2 | |
| Special Tax | | | 7.0 | |
| Hospital/Healthcare | | | 6.4 | |
| Real Estate | | | 5.4 | |
| Sales Tax Revenue | | | 4.6 | |
| Diversified Financial Services | | | 4.5 | |
| Electric Utilities | | | 4.4 | |
Portfolio holdings are subject to change. Percentages are as of September 30, 2017 and are based on total assets.
CREDIT ALLOCATION
| | | | | | | | | | | | |
| | | NRSRO- Rated | | | Sub- Adviser- Rated | | | Total | |
| AAA | | | 8.0% | | | | 0.2% | | | | 8.2% | |
| AA | | | 33.5 | | | | 0.0 | | | | 33.5 | |
| A | | | 22.0 | | | | 0.1 | | | | 22.1 | |
| BBB | | | 9.4 | | | | 4.4 | | | | 13.8 | |
| BB or lower | | | 14.7 | | | | 7.7 | | | | 22.4 | |
| Total | | | 87.6% | | | | 12.4% | | | | 100.0% | |
The percentages above are based on the market value of the securities as of September 30, 2017 and are subject to change. OppenheimerFunds, Inc. determines the credit allocation of the Fund’s assets using ratings by nationally recognized statistical rating organizations (NRSROs), such as S&P Global Ratings (S&P). For any security rated by an NRSRO other than S&P, the sub-adviser, OppenheimerFunds, Inc., converts that security’s rating to the equivalent S&P rating. If two or more NRSROs have assigned a rating to a security, the highest rating is used. For securities not rated by an NRSRO, the sub-adviser uses its own credit analysis to assign ratings in categories similar to those of S&P. The use of similar categories is not an indication that the sub-adviser’s credit analysis process is consistent or comparable with any NRSRO’s process were that NRSRO to rate the same security.
For the purposes of this Credit Allocation table, securities rated within the NRSROs’ four highest categories—AAA, AA, A and BBB—are investment-grade securities. For further details, please consult the Fund’s prospectus or Statement of Additional Information.
|
| 15 OPPENHEIMER ROCHESTER AMT-FREE NEW YORK MUNICIPAL FUND |
Performance
DISTRIBUTION YIELDS
As of 9/30/17
| | | | |
| | | Without Sales
Charge | | With Sales
Charge |
| Class A | | 3.11% | | 2.96% |
| Class B | | 2.17 | | N/A |
| Class C | | 2.21 | | N/A |
| Class Y | | 3.37 | | N/A |
TAXABLE EQUIVALENT YIELDS
| | | | |
| As of 9/30/17 |
| Class A | | 4.41% | | |
| Class B | | 3.02 | | |
| Class C | | 3.10 | | |
| Class Y | | 5.09 | | |
STANDARDIZED YIELDS
| | | | |
| For the 30 Days Ended 9/30/17 |
| Class A | | 2.26% | | |
| Class B | | 1.55 | | |
| Class C | | 1.59 | | |
| Class Y | | 2.61 | | |
UNSUBSIDIZED STANDARDIZED YIELDS
| | | | |
| For the 30 Days Ended 9/30/17 |
| Class A | | 2.25% | | |
| Class B | | 1.55 | | |
| Class C | | 1.59 | | |
| Class Y | | 2.61 | | |
AVERAGE ANNUAL TOTAL RETURNS WITHOUT SALES CHARGE AS OF 9/30/17
| | | | | | | | | | |
| | | Inception Date | | 1-Year | | 5-Year | | 10-Year | | Since Inception |
| Class A (OPNYX) | | 8/16/84 | | 0.08% | | 3.21% | | 4.19% | | 6.51% |
| Class B (ONYBX) | | 3/1/93 | | -0.70 | | 2.37 | | 3.67 | | 4.67 |
| Class C (ONYCX) | | 8/29/95 | | -0.68 | | 2.41 | | 3.40 | | 4.19 |
| Class Y (ONYYX) | | 1/31/11 | | 0.32 | | 3.46 | | N/A | | 6.72 |
AVERAGE ANNUAL TOTAL RETURNS WITH SALES CHARGE AS OF 9/30/17
| | | | | | | | | | |
| | | Inception Date | | 1-Year | | 5-Year | | 10-Year | | Since Inception |
| Class A (OPNYX) | | 8/16/84 | | -4.67% | | 2.21% | | 3.69% | | 6.35% |
| Class B (ONYBX) | | 3/1/93 | | -5.52 | | 2.04 | | 3.67 | | 4.67 |
| Class C (ONYCX) | | 8/29/95 | | -1.65 | | 2.41 | | 3.40 | | 4.19 |
| Class Y (ONYYX) | | 1/31/11 | | 0.32 | | 3.46 | | N/A | | 6.72 |
|
| 16 OPPENHEIMER ROCHESTER AMT-FREE NEW YORK MUNICIPAL FUND |
COMPARISON OF CHANGE IN VALUE OF $10,000 HYPOTHETICAL INVESTMENTS IN:
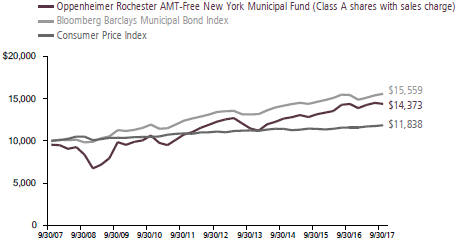
Performance data quoted represents past performance, which does not guarantee future results. The investment return and principal value of an investment in the Fund will fluctuate so that an investor’s shares, when redeemed, may be worth more or less than their original cost. Current performance may be lower or higher than the performance quoted. Returns do not consider capital gains or income taxes on an individual’s investments. For performance data current to the most recent month-end, visit oppenheimerfunds.com or call 1.800. CALL OPP (225.5677). Fund returns include changes in share price, reinvested distributions, and the applicable sales charge: for Class A shares, the current maximum initial sales charge of 4.75%; for Class B shares, the contingent deferred sales charge of 5% (1-year) and 2% (5-year); and for Class C, the contingent deferred sales charge of 1% for the 1-year period. There is no sales charge for Class Y shares. Because Class B shares convert to Class A shares 72 months after purchase, the 10-year return for Class B shares uses Class A performance for the period after conversion.
The Fund’s performance is compared to the performance of the Bloomberg Barclays Municipal Bond Index, an index of a broad range of investment-grade municipal bonds that measures the performance of the general municipal bond market. The Fund’s performance is also compared to the Consumer Price Index, a non-securities index that measures changes in the inflation rate. Indices are unmanaged and cannot be purchased by investors. While index comparisons may be useful to provide a benchmark for the Fund’s performance, it must be noted that the Fund’s investments are not limited to the investments comprising the indices. Index performance includes reinvestment of income, but does not reflect transaction costs, fees, expenses or taxes. Index performance is shown for illustrative purposes only as a benchmark for the Fund’s performance, and does not predict or depict performance of the Fund. The Fund’s performance reflects the effects of the Fund’s business and operating expenses.
Distribution yields for Class A shares are based on dividends of $0.029 for the 35-day accrual period ended September 26, 2017. The yield without sales charge for Class A shares is calculated by dividing annualized dividends by the Class A net asset value (NAV) on September 26, 2017; for the yield with charge, the denominator is the Class A maximum offering price on that date. Distribution yields for Class B, C and Y are annualized based on
|
| 17 OPPENHEIMER ROCHESTER AMT-FREE NEW YORK MUNICIPAL FUND |
dividends of $0.0202, $0.0206 and $0.0315, respectively, for the 35-day accrual period ended September 26, 2017 and on the corresponding net asset values on that date.
Standardized yield is based on an SEC-standardized formula designed to approximate the Fund’s annualized hypothetical current income from securities less expenses for the 30-day period ended September 30, 2017 and that date’s maximum offering price (for Class A shares) or net asset value (for all other share classes). Each result is compounded semiannually and then annualized. Falling share prices will tend to artificially raise yields. The unsubsidized standardized yield is computed under an SEC-standardized formula based on net income earned for the 30-day period ended September 30, 2017. The calculation excludes any expense reimbursements and thus may result in a lower yield.
The average distribution yield in this Fund’s Lipper category was calculated based on the distributions and the final NAVs of the reporting period for the funds in each category. The average yield at NAV in Lipper’s New York Municipal Debt Funds category is based on 97 NAVs, one for each class of each fund in the category; a fund can have up to 4 classes. Lipper yields do not include sales charges, which – if included – would reduce results.
Taxable equivalent yield is based on the standardized yield and the 2017 top federal and New York tax rate of 48.7% (51.1% for residents of New York City). Calculations factor in the 3.8% tax on unearned income under the Patient Protection and Affordable Care Act, as applicable. A portion of the Fund’s distributions may be subject to tax; distributions may also increase an investor’s exposure to the alternative minimum tax. Capital gains distributions are taxable as capital gains. Tax treatments of the Fund’s distributions and capital gains may vary by state; investors should consult a tax advisor to determine if the Fund is appropriate for them. Each result is compounded semiannually and annualized. Falling share prices artificially increase yields. This Report must be preceded or accompanied by a Fund prospectus.
Investments in “tobacco bonds,” which are backed by the proceeds a state or territory receives from the 1998 national litigation settlement with tobacco manufacturers, may be vulnerable to economic and/or legislative events that affect issuers in a particular municipal market sector. Annual payments by MSA-participating manufacturers, for example, hinge on many factors, including annual domestic cigarette shipments, inflation and the relative market share of non-participating manufacturers. To date, we believe consumption figures remain within an acceptable range of the assumptions used to structure MSA bonds. Future MSA payments could be reduced if consumption were to fall more rapidly than originally forecast.
The BofA Merrill Lynch AAA Municipal Securities index is the AAA subset of the BofA Merrill Lynch US Municipal Securities Index, which tracks the performance of dollar-denominated, investment-grade, tax-exempt debt issued by U.S. states and territories and their political subdivisions; index constituents are weighted based on capitalization, and accrued interest is calculated assuming next-day settlement.
The Fund’s investment strategy and focus can change over time. The mention of specific fund holdings does not constitute a recommendation by OppenheimerFunds, Inc. or its affiliates.
Before investing in any of the Oppenheimer funds, investors should carefully consider a fund’s investment objectives, risks, charges and expenses. Fund prospectuses and summary prospectuses contain this and other information about the funds, and may be obtained by asking your financial advisor, visiting
|
| 18 OPPENHEIMER ROCHESTER AMT-FREE NEW YORK MUNICIPAL FUND |
oppenheimerfunds.com, or calling 1.800.CALL OPP (225.5677). Read prospectuses and summary prospectuses carefully before investing.
Shares of Oppenheimer funds are not deposits or obligations of any bank, are not guaranteed by any bank, are not insured by the FDIC or any other agency, and involve investment risks, including the possible loss of the principal amount invested.
|
| 19 OPPENHEIMER ROCHESTER AMT-FREE NEW YORK MUNICIPAL FUND |
Fund Expenses
Fund Expenses. As a shareholder of the Fund, you incur two types of costs: (1) transaction costs, which may include sales charges (loads) on purchase payments and/or contingent deferred sales charges on redemptions; and (2) ongoing costs, including management fees; distribution and service fees; and other Fund expenses. These examples are intended to help you understand your ongoing costs (in dollars) of investing in the Fund and to compare these costs with the ongoing costs of investing in other mutual funds.
The examples are based on an investment of $1,000.00 invested at the beginning of the period and held for the entire 6-month period ended September 30, 2017.
Actual Expenses. The first section of the table provides information about actual account values and actual expenses. You may use the information in this section for the class of shares you hold, together with the amount you invested, to estimate the expense that you paid over the period. Simply divide your account value by $1,000.00 (for example, an $8,600.00 account value divided by $1,000.00 = 8.60), then multiply the result by the number in the first section under the heading entitled “Expenses Paid During 6 Months Ended September 30, 2017” to estimate the expenses you paid on your account during this period.
Hypothetical Example for Comparison Purposes. The second section of the table provides information about hypothetical account values and hypothetical expenses based on the Fund’s actual expense ratio for each class of shares, and an assumed rate of return of 5% per year for each class before expenses, which is not the Fund’s actual return. The hypothetical account values and expenses may not be used to estimate the actual ending account balance or expenses you paid for the period. You may use this information to compare the ongoing costs of investing in the Fund and other funds. To do so, compare this 5% hypothetical example for the class of shares you hold with the 5% hypothetical examples that appear in the shareholder reports of the other funds.
Please note that the expenses shown in the table are meant to highlight your ongoing costs only and do not reflect any transactional costs, such as front-end or contingent deferred sales charges (loads). Therefore, the “hypothetical” section of the table is useful in comparing ongoing costs only, and will not help you determine the relative total costs of owning different funds. In addition, if these transactional costs were included, your costs would have been higher.
|
| 20 OPPENHEIMER ROCHESTER AMT-FREE NEW YORK MUNICIPAL FUND |
| | | | | | |
| Actual | | Beginning Account Value April 1, 2017 | | Ending Account Value September 30, 2017 | | Expenses Paid During 6 Months Ended
September 30, 2017 |
| Class A | | $ 1,000.00 | | $ 1,008.70 | | $ 5.10 |
| Class B | | 1,000.00 | | 1,004.70 | | 9.09 |
| Class C | | 1,000.00 | | 1,004.80 | | 8.93 |
| Class Y | | 1,000.00 | | 1,009.90 | | 3.94 |
| | |
Hypothetical (5% return before expenses) | | | | |
| Class A | | 1,000.00 | | 1,020.00 | | 5.13 |
| Class B | | 1,000.00 | | 1,016.04 | | 9.14 |
| Class C | | 1,000.00 | | 1,016.19 | | 8.99 |
| Class Y | | 1,000.00 | | 1,021.16 | | 3.96 |
Expenses are equal to the Fund’s annualized expense ratio for that class, multiplied by the average account value over the period, multiplied by 183/365 (to reflect the one-half year period). Those annualized expense ratios, excluding indirect expenses from affiliated funds, based on the 6-month period ended September 30, 2017 are as follows:
| | | | |
| Class | | Expense Ratios | |
| Class A | | | 1.01 | % |
| Class B | | | 1.80 | |
| Class C | | | 1.77 | |
| Class Y | | | 0.78 | |
|
| 21 OPPENHEIMER ROCHESTER AMT-FREE NEW YORK MUNICIPAL FUND |
STATEMENT OF INVESTMENTS September 30, 2017
| | | | | | | | | | | | | | |
Principal Amount | | | | Coupon | | Maturity | | | Value | |
| Municipal Bonds and Notes—110.3% | | | | | | | | | |
| New York—94.0% | | | | | | | | | |
| $165,000 | | Albany County, NY IDA (Wildwood Programs)1 | | | 4.900 | % | | | 07/01/2021 | | | $ | 165,043 | |
| 125,000 | | Albany County, NY IDA (Wildwood Programs)1 | | | 5.000 | | | | 07/01/2026 | | | | 125,005 | |
| 500,000 | | Albany, NY Capital Resource Corp. (College Saint Rose)1 | | | 5.375 | | | | 07/01/2026 | | | | 538,170 | |
| 500,000 | | Albany, NY Capital Resource Corp. (College Saint Rose)1 | | | 5.625 | | | | 07/01/2031 | | | | 536,330 | |
| 1,000,000 | | Albany, NY Capital Resource Corp. (College Saint Rose)1 | | | 5.875 | | | | 07/01/2041 | | | | 1,071,200 | |
| 200,000 | | Albany, NY Capital Resource Corp. (Empire Commons Student Hsg.)1 | | | 5.000 | | | | 05/01/2027 | | | | 239,116 | |
| 200,000 | | Albany, NY Capital Resource Corp. (Empire Commons Student Hsg.)1 | | | 5.000 | | | | 05/01/2032 | | | | 231,724 | |
| 285,000 | | Albany, NY IDA (Brighter Choice Charter School)1 | | | 5.000 | | | | 04/01/2027 | | | | 277,849 | |
| 150,000 | | Albany, NY IDA (Brighter Choice Charter School)1 | | | 5.000 | | | | 04/01/2032 | | | | 139,171 | |
| 100,000 | | Albany, NY IDA (Brighter Choice Charter School)1 | | | 5.000 | | | | 04/01/2037 | | | | 89,652 | |
| 220,000 | | Albany, NY IDA (Sage Colleges)1 | | | 5.250 | | | | 04/01/2019 | | | | 220,024 | |
| 3,765,000 | | Albany, NY IDA (Sage Colleges)1 | | | 5.300 | | | | 04/01/2029 | | | | 3,578,218 | |
| 8,755,000 | | Brookhaven, NY IDA (Dowling College)2,7 | | | 6.750 | | | | 11/01/2032 | | | | 6,128,588 | |
| 215,000 | | Brookhaven, NY Local Devel. Corp. (Jefferson’s Ferry)1 | | | 5.250 | | | | 11/01/2036 | | | | 244,068 | |
| 5,000,000 | | Brooklyn, NY Local Devel. Corp. (Brooklyn Events Center)1 | | | 5.000 | | | | 07/15/2042 | | | | 5,594,650 | |
| 270,000 | | Buffalo & Erie County, NY Industrial Land Devel. (Buffalo State College Foundation Hsg. Corp.)1 | | | 5.375 | | | | 10/01/2041 | | | | 303,191 | |
| 130,000 | | Buffalo & Erie County, NY Industrial Land Devel. (Buffalo State College Foundation Hsg. Corp.)1 | | | 6.000 | | | | 10/01/2031 | | | | 149,114 | |
| 160,000 | | Buffalo & Erie County, NY Industrial Land Devel. (Charter School for Applied Technologies)1 | | | 5.000 | | | | 06/01/2035 | | | | 173,254 | |
| 850,000 | | Buffalo & Erie County, NY Industrial Land Devel. (Medaille College)1 | | | 5.000 | | | | 04/01/2022 | | | | 883,303 | |
| 3,615,000 | | Buffalo & Erie County, NY Industrial Land Devel. (Medaille College)1 | | | 5.250 | | | | 04/01/2035 | | | | 3,666,044 | |
| 420,000 | | Build NYC Resource Corp. (Chapin School)1 | | | 5.000 | | | | 11/01/2026 | | | | 525,676 | |
| 230,000 | | Build NYC Resource Corp. (Institute for Community Living/Eden II School for Autistic Children Obligated Group)1 | | | 5.000 | | | | 07/01/2018 | | | | 230,202 | |
| 1,325,000 | | Build NYC Resource Corp. (Institute for Community Living/Eden II School for Autistic Children Obligated Group)1 | | | 5.250 | | | | 07/01/2023 | | | | 1,322,999 | |
| 1,690,000 | | Build NYC Resource Corp. (Institute for Community Living/Eden II School for Autistic Children Obligated Group)1 | | | 5.375 | | | | 07/01/2028 | | | | 1,680,992 | |
| 790,000 | | Build NYC Resource Corp. (Institute for Community Living/Eden II School for Autistic Children Obligated Group)1 | | | 5.750 | | | | 07/01/2033 | | | | 790,008 | |
| 170,000 | | Build NYC Resource Corp. (Manhattan College)1 | | | 5.000 | | | | 08/01/2032 | | | | 200,522 | |
| 290,000 | | Build NYC Resource Corp. (Manhattan College)1 | | | 5.000 | | | | 08/01/2036 | | | | 335,605 | |
| 320,000 | | Build NYC Resource Corp. (Manhattan College)1 | | | 5.000 | | | | 08/01/2047 | | | | 367,693 | |
|
| 22 OPPENHEIMER ROCHESTER AMT-FREE NEW YORK MUNICIPAL FUND |
| | | | | | | | | | | | | | |
Principal Amount | | | | Coupon | | Maturity | | | Value | |
| New York (Continued) | | | | | | | | | |
| $4,300,000 | | Build NYC Resource Corp. (New York Law School)1 | | | 5.000 | % | | | 07/01/2030 | | | $ | 4,882,521 | |
| 650,000 | | Build NYC Resource Corp. (New York Law School)1 | | | 5.000 | | | | 07/01/2041 | | | | 715,923 | |
| 140,000 | | Build NYC Resource Corp. (YMCA of Greater New York)1 | | | 5.000 | | | | 08/01/2032 | | | | 153,976 | |
| 270,000 | | Bushnell Basin, NY Fire Assoc. (Volunteer Fire Dept.)1,3 | | | 5.750 | | | | 11/01/2030 | | | | 272,746 | |
| 25,000 | | Canandaigua & Bristol, NY GO1 | | | 5.000 | | | | 12/15/2027 | | | | 25,103 | |
| 30,000 | | Canandaigua & Bristol, NY GO1 | | | 5.000 | | | | 12/15/2028 | | | | 30,119 | |
| 30,000 | | Canandaigua & Bristol, NY GO1 | | | 5.000 | | | | 12/15/2029 | | | | 30,115 | |
| 30,000 | | Canandaigua & Bristol, NY GO1 | | | 5.000 | | | | 12/15/2030 | | | | 30,113 | |
| 35,000 | | Canandaigua & Bristol, NY GO1 | | | 5.000 | | | | 12/15/2031 | | | | 35,132 | |
| 35,000 | | Canandaigua & Bristol, NY GO1 | | | 5.000 | | | | 12/15/2032 | | | | 35,131 | |
| 35,000 | | Canandaigua & Bristol, NY GO1 | | | 5.000 | | | | 12/15/2033 | | | | 35,128 | |
| 40,000 | | Canandaigua & Bristol, NY GO1 | | | 5.000 | | | | 12/15/2034 | | | | 40,144 | |
| 40,000 | | Canandaigua & Bristol, NY GO1 | | | 5.000 | | | | 12/15/2035 | | | | 40,142 | |
| 45,000 | | Canandaigua & Bristol, NY GO1 | | | 5.000 | | | | 12/15/2036 | | | | 45,157 | |
| 45,000 | | Canandaigua & Bristol, NY GO1 | | | 5.000 | | | | 12/15/2037 | | | | 45,156 | |
| 50,000 | | Canandaigua & Bristol, NY GO1 | | | 5.000 | | | | 12/15/2038 | | | | 50,171 | |
| 50,000 | | Canandaigua & Bristol, NY GO1 | | | 5.000 | | | | 12/15/2039 | | | | 50,167 | |
| 55,000 | | Canandaigua & Bristol, NY GO1 | | | 5.000 | | | | 12/15/2040 | | | | 55,181 | |
| 55,000 | | Canandaigua & Bristol, NY GO1 | | | 5.000 | | | | 12/15/2041 | | | | 55,179 | |
| 60,000 | | Canandaigua & Bristol, NY GO1 | | | 5.000 | | | | 12/15/2042 | | | | 60,193 | |
| 100,000 | | Cattaraugus County, NY Capital Resource Corp. (St. Bonaventure University)1 | | | 5.000 | | | | 05/01/2034 | | | | 108,940 | |
| 100,000 | | Cattaraugus County, NY Capital Resource Corp. (St. Bonaventure University)1 | | | 5.000 | | | | 05/01/2039 | | | | 107,840 | |
| 1,040,000 | | Colonie, NY GO1 | | | 6.000 | | | | 04/01/2032 | | | | 1,066,988 | |
| 840,000 | | Colonie, NY GO1 | | | 6.000 | | | | 04/01/2033 | | | | 861,798 | |
| 15,000 | | Deerfield, NY GO1 | | | 5.500 | | | | 06/15/2021 | | | | 15,089 | |
| 15,000 | | Deerfield, NY GO1 | | | 5.500 | | | | 06/15/2022 | | | | 15,083 | |
| 15,000 | | Deerfield, NY GO1 | | | 5.500 | | | | 06/15/2023 | | | | 15,079 | |
| 15,000 | | Deerfield, NY GO1 | | | 5.500 | | | | 06/15/2024 | | | | 15,078 | |
| 20,000 | | Deerfield, NY GO1 | | | 5.500 | | | | 06/15/2025 | | | | 20,097 | |
| 20,000 | | Deerfield, NY GO1 | | | 5.600 | | | | 06/15/2026 | | | | 20,091 | |
| 20,000 | | Deerfield, NY GO1 | | | 5.600 | | | | 06/15/2027 | | | | 20,089 | |
| 20,000 | | Deerfield, NY GO1 | | | 5.600 | | | | 06/15/2028 | | | | 20,086 | |
| 25,000 | | Deerfield, NY GO1 | | | 5.600 | | | | 06/15/2029 | | | | 25,103 | |
| 25,000 | | Deerfield, NY GO1 | | | 5.600 | | | | 06/15/2030 | | | | 25,102 | |
| 25,000 | | Deerfield, NY GO1 | | | 5.600 | | | | 06/15/2031 | | | | 25,101 | |
| 25,000 | | Deerfield, NY GO1 | | | 5.600 | | | | 06/15/2032 | | | | 25,101 | |
| 30,000 | | Deerfield, NY GO1 | | | 5.600 | | | | 06/15/2033 | | | | 30,117 | |
| 30,000 | | Deerfield, NY GO1 | | | 5.600 | | | | 06/15/2034 | | | | 30,115 | |
| 30,000 | | Deerfield, NY GO1 | | | 5.600 | | | | 06/15/2035 | | | | 30,114 | |
| 35,000 | | Deerfield, NY GO1 | | | 5.600 | | | | 06/15/2036 | | | | 35,131 | |
| 510,000 | | Dutchess County, NY Local Devel. Corp. (Anderson Center Services)1,3 | | | 6.000 | | | | 10/01/2030 | | | | 524,928 | |
|
| 23 OPPENHEIMER ROCHESTER AMT-FREE NEW YORK MUNICIPAL FUND |
STATEMENT OF INVESTMENTS Continued
| | | | | | | | | | | | | | |
Principal Amount | | | | Coupon | | Maturity | | | Value | |
| New York (Continued) | | | | | | | | | |
| $11,400,000 | | Dutchess County, NY Local Devel. Corp. (HQS/PHCtr/NDH/VBHosp Obligated Group)1 | | | 5.000 | % | | | 07/01/2046 | | | $ | 12,770,622 | |
| 250,000 | | Dutchess County, NY Local Devel. Corp. (HQS/VBHosp/NDH/PHCtr Obligated Group)1 | | | 5.250 | | | | 07/01/2025 | | | | 274,002 | |
| 450,000 | | Dutchess County, NY Local Devel. Corp. (HQS/VBHosp/NDH/PHCtr Obligated Group)1 | | | 5.750 | | | | 07/01/2030 | | | | 497,628 | |
| 100,000 | | Dutchess County, NY Local Devel. Corp. (HQS/VBHosp/NDH/PHCtr Obligated Group)1 | | | 5.750 | | | | 07/01/2040 | | | | 109,973 | |
| 160,000 | | Dutchess County, NY Local Devel. Corp. (Vassar College)1 | | | 5.000 | | | | 07/01/2034 | | | | 190,162 | |
| 160,000 | | Dutchess County, NY Local Devel. Corp. (Vassar College)1 | | | 5.000 | | | | 07/01/2036 | | | | 188,813 | |
| 235,000 | | Dutchess County, NY Local Devel. Corp. (Vassar College)1 | | | 5.000 | | | | 07/01/2037 | | | | 276,661 | |
| 500,000 | | Dutchess County, NY Local Devel. Corp. (Vassar College)1 | | | 5.000 | | | | 07/01/2042 | | | | 583,550 | |
| 125,000 | | East Rochester, NY Hsg. Authority (Woodland Village)1 | | | 5.500 | | | | 08/01/2033 | | | | 125,315 | |
| 265,000 | | Erie County, NY IDA (Buffalo City School District)1 | | | 5.250 | | | | 05/01/2030 | | | | 301,456 | |
| 225,000 | | Erie County, NY IDA (Buffalo City School District)1 | | | 5.250 | | | | 05/01/2031 | | | | 255,190 | |
| 135,000 | | Erie County, NY IDA (Buffalo City School District)1 | | | 5.250 | | | | 05/01/2032 | | | | 152,354 | |
| 375,000 | | Erie County, NY IDA (Global Concepts Charter School)1,3 | | | 6.250 | | | | 10/01/2037 | | | | 383,156 | |
| 950,000 | | Erie County, NY IDA (The Episcopal Church Home)1 | | | 6.000 | | | | 02/01/2028 | | | | 951,615 | |
| 75,000 | | Erie County, NY Tobacco Asset Securitization Corp.1 | | | 5.000 | | | | 06/01/2031 | | | | 75,322 | |
| 74,000,000 | | Erie County, NY Tobacco Asset Securitization Corp. | | | 8.223 | 4 | | | 06/01/2055 | | | | 3,539,420 | |
| 715,000 | | Genesee County, NY IDA (United Memorial Medical Center)1 | | | 5.000 | | | | 12/01/2027 | | | | 715,701 | |
| 18,750,000 | | Glen Cove, NY Local Assistance Corp. (Gravies Point Public Improvement) | | | 5.982 | 4 | | | 01/01/2045 | | | | 4,790,062 | |
| 100,000 | | Hempstead, NY Local Devel. Corp. (Molloy College)1 | | | 5.000 | | | | 07/01/2029 | | | | 118,009 | |
| 300,000 | | Hempstead, NY Local Devel. Corp. (Molloy College)1 | | | 5.000 | | | | 07/01/2029 | | | | 335,073 | |
| 80,000 | | Hempstead, NY Local Devel. Corp. (Molloy College)1 | | | 5.000 | | | | 07/01/2030 | | | | 94,035 | |
| 75,000 | | Hempstead, NY Local Devel. Corp. (Molloy College)1 | | | 5.000 | | | | 07/01/2031 | | | | 87,532 | |
| 135,000 | | Hempstead, NY Local Devel. Corp. (Molloy College)1 | | | 5.000 | | | | 07/01/2032 | | | | 156,692 | |
| 300,000 | | Hempstead, NY Local Devel. Corp. (Molloy College)1 | | | 5.000 | | | | 07/01/2034 | | | | 327,414 | |
| 135,000 | | Hempstead, NY Local Devel. Corp. (Molloy College)1 | | | 5.000 | | | | 07/01/2035 | | | | 154,246 | |
| 110,000 | | Hempstead, NY Local Devel. Corp. (Molloy College)1 | | | 5.000 | | | | 07/01/2036 | | | | 125,189 | |
|
| 24 OPPENHEIMER ROCHESTER AMT-FREE NEW YORK MUNICIPAL FUND |
| | | | | | | | | | | | | | |
Principal Amount | | | | Coupon | | Maturity | | | Value | |
| New York (Continued) | | | | | | | | | |
| $80,000 | | Hempstead, NY Local Devel. Corp. (Molloy College)1 | | | 5.000 | % | | | 07/01/2038 | | | $ | 90,832 | |
| 250,000 | | Hempstead, NY Local Devel. Corp. (Molloy College)1 | | | 5.000 | | | | 07/01/2039 | | | | 270,032 | |
| 200,000 | | Hempstead, NY Local Devel. Corp. (Molloy College)1 | | | 5.000 | | | | 07/01/2044 | | | | 214,786 | |
| 1,000,000 | | Hempstead, NY Local Devel. Corp. (Molloy College)1 | | | 5.750 | | | | 07/01/2039 | | | | 1,082,440 | |
| 13,500,000 | | Hudson Yards, NY Infrastructure Corp.5 | | | 5.000 | | | | 02/15/2042 | | | | 15,703,342 | |
| 12,265,000 | | Hudson Yards, NY Infrastructure Corp.1 | | | 5.000 | | | | 02/15/2042 | | | | 14,278,545 | |
| 5,000,000 | | Hudson Yards, NY Infrastructure Corp.5 | | | 5.000 | | | | 02/15/2045 | | | | 5,816,053 | |
| 2,250,000 | | Huntington, NY Local Devel. Corp.1 | | | 6.500 | | | | 12/01/2046 | | | | 2,321,617 | |
| 2,000,000 | | Johnson City, NY GO | | | 3.750 | | | | 10/05/2017 | | | | 2,000,240 | |
| 1,185,000 | | L.I., NY Power Authority, Series A1 | | | 5.000 | | | | 09/01/2039 | | | | 1,344,797 | |
| 2,970,000 | | L.I., NY Power Authority, Series A1 | | | 5.000 | | | | 09/01/2044 | | | | 3,356,575 | |
| 4,850,000 | | L.I., NY Power Authority, Series A1 | | | 5.750 | | | | 04/01/2039 | | | | 5,144,298 | |
| 2,500,000 | | L.I., NY Power Authority, Series B1 | | | 5.000 | | | | 09/01/2035 | | | | 2,905,800 | |
| 1,250,000 | | L.I., NY Power Authority, Series B1 | | | 5.000 | | | | 09/01/2036 | | | | 1,448,637 | |
| 1,680,000 | | L.I., NY Power Authority, Series B1 | | | 5.000 | | | | 09/01/2041 | | | | 1,941,274 | |
| 1,450,000 | | Monroe County, NY IDA (Rochester General Hospital)1 | | | 5.000 | | | | 12/01/2032 | | | | 1,602,554 | |
| 3,200,000 | | Monroe County, NY IDA (Rochester General Hospital)1 | | | 5.000 | | | | 12/01/2046 | | | | 3,565,696 | |
| 350,000 | | Monroe County, NY Industrial Devel. Corp. (Monroe Community College)1 | | | 5.000 | | | | 01/15/2028 | | | | 400,589 | |
| 500,000 | | Monroe County, NY Industrial Devel. Corp. (Monroe Community College)1 | | | 5.000 | | | | 01/15/2029 | | | | 569,485 | |
| 150,000 | | Monroe County, NY Industrial Devel. Corp. (Monroe Community College)1 | | | 5.000 | | | | 01/15/2038 | | | | 167,085 | |
| 150,000 | | Monroe County, NY Industrial Devel. Corp. (Nazareth College of Rochester)1 | | | 5.000 | | | | 10/01/2026 | | | | 164,719 | |
| 75,000 | | Monroe County, NY Industrial Devel. Corp. (Nazareth College of Rochester)1 | | | 5.250 | | | | 10/01/2031 | | | | 82,364 | |
| 540,000 | | Monroe County, NY Industrial Devel. Corp. (Nazareth College of Rochester)1 | | | 5.500 | | | | 10/01/2041 | | | | 589,318 | |
| 1,400,000 | | Monroe County, NY Industrial Devel. Corp. (Rochester General Hospital)1 | | | 5.000 | | | | 12/01/2036 | | | | 1,591,730 | |
| 100,000 | | Monroe County, NY Industrial Devel. Corp. (St. John Fisher College)1 | | | 5.000 | | | | 06/01/2029 | | | | 115,906 | |
| 285,000 | | Monroe County, NY Industrial Devel. Corp. (St. John Fisher College)1 | | | 5.000 | | | | 06/01/2044 | | | | 320,323 | |
| 180,000 | | Monroe County, NY Industrial Devel. Corp. (St. John Fisher College)1 | | | 5.500 | | | | 06/01/2034 | | | | 211,538 | |
| 150,000 | | Monroe County, NY Industrial Devel. Corp. (St. John Fisher College)1 | | | 5.625 | | | | 06/01/2026 | | | | 167,893 | |
| 250,000 | | Monroe County, NY Industrial Devel. Corp. (St. John Fisher College)1 | | | 6.000 | | | | 06/01/2034 | | | | 279,950 | |
| 3,420,000 | | Nassau County, NY GO1 | | | 5.000 | | | | 01/01/2034 | | | | 3,927,528 | |
| 3,415,000 | | Nassau County, NY GO1 | | | 5.000 | | | | 04/01/2040 | | | | 3,888,660 | |
|
| 25 OPPENHEIMER ROCHESTER AMT-FREE NEW YORK MUNICIPAL FUND |
STATEMENT OF INVESTMENTS Continued
| | | | | | | | | | | | | | |
Principal Amount | | | | Coupon | | Maturity | | | Value | |
| New York (Continued) | | | | | | | | | |
| $65,000 | | Nassau County, NY IDA (ALIA-ACDS)1 | | | 6.125 | % | | | 09/01/2018 | | | $ | 65,894 | |
| 1,395,000 | | Nassau County, NY IDA (ALIA-AP)1 | | | 7.000 | | | | 09/01/2028 | | | | 1,410,582 | |
| 1,220,557 | | Nassau County, NY IDA (Amsterdam at Harborside)2 | | | 2.000 | | | | 01/01/2049 | | | | 203,467 | |
| 135,000 | | Nassau County, NY IDA (Amsterdam at Harborside)1 | | | 6.500 | | | | 01/01/2032 | | | | 137,369 | |
| 3,247,500 | | Nassau County, NY IDA (Amsterdam at Harborside)1 | | | 6.700 | | | | 01/01/2049 | | | | 3,304,429 | |
| 185,000 | | Nassau County, NY IDA (Hispanic Counseling Center)1 | | | 6.500 | | | | 11/01/2037 | | | | 186,286 | |
| 2,185,000 | | Nassau County, NY IDA (Hispanic Counseling Center)1 | | | 7.625 | | | | 06/01/2033 | | | | 2,186,202 | |
| 2,000,000 | | Nassau County, NY Local Economic Assistance Corp. (South Nassau Communities Hospital)1 | | | 5.000 | | | | 07/01/2031 | | | | 2,201,100 | |
| 60,000,000 | | Nassau County, NY Tobacco Settlement Corp. (TASC) | | | 6.761 | 4 | | | 06/01/2060 | | | | 878,400 | |
| 350,000 | | New Rochelle, NY Corp. Devel. (Iona College)1 | | | 5.000 | | | | 07/01/2032 | | | | 390,152 | |
| 565,000 | | New Rochelle, NY Corp. Devel. (Iona College)1 | | | 5.000 | | | | 07/01/2033 | | | | 625,737 | |
| 450,000 | | New Rochelle, NY Corp. Devel. (Iona College)1 | | | 5.000 | | | | 07/01/2034 | | | | 496,440 | |
| 200,000 | | New Rochelle, NY Corp. Devel. (Iona College)1 | | | 5.000 | | | | 07/01/2040 | | | | 217,942 | |
| 225,000 | | New Rochelle, NY Corp. Devel. (Iona College)1 | | | 5.000 | | | | 07/01/2045 | | | | 243,605 | |
| 70,000 | | Niagara County, NY IDA (Niagara Falls Memorial Medical Center) | | | 5.750 | | | | 06/01/2018 | | | | 70,122 | |
| 100,000 | | Niagara, NY Area Devel. Corp. (Niagara University)1 | | | 5.000 | | | | 05/01/2035 | | | | 109,410 | |
| 150,000 | | Niagara, NY Area Devel. Corp. (Niagara University)1 | | | 5.000 | | | | 05/01/2042 | | | | 163,238 | |
| 1,595,000 | | NY Counties Tobacco Trust I1 | | | 6.500 | | | | 06/01/2035 | | | | 1,625,783 | |
| 2,690,000 | | NY Counties Tobacco Trust II (TASC)1 | | | 5.625 | | | | 06/01/2035 | | | | 2,741,917 | |
| 15,000 | | NY Counties Tobacco Trust II (TASC)1 | | | 5.750 | | | | 06/01/2043 | | | | 15,024 | |
| 395,000 | | NY Counties Tobacco Trust III (TASC)1 | | | 6.000 | | | | 06/01/2043 | | | | 402,623 | |
| 850,000 | | NY Counties Tobacco Trust IV1 | | | 5.000 | | | | 06/01/2038 | | | | 828,767 | |
| 84,200,000 | | NY Counties Tobacco Trust V | | | 6.845 | 4 | | | 06/01/2055 | | | | 1,987,962 | |
| 155,400,000 | | NY Counties Tobacco Trust V | | | 7.845 | 4 | | | 06/01/2060 | | | | 1,226,106 | |
| 17,195,000 | | NY Counties Tobacco Trust VI1 | | | 5.625 | | | | 06/01/2035 | | | | 19,128,406 | |
| 2,085,000 | | NY Counties Tobacco Trust VI1 | | | 5.750 | | | | 06/01/2043 | | | | 2,337,535 | |
| 2,895,000 | | NY Counties Tobacco Trust VI1 | | | 6.000 | | | | 06/01/2043 | | | | 3,209,918 | |
| 600,000 | | NY Counties Tobacco Trust VI (TASC)1 | | | 5.000 | | | | 06/01/2045 | | | | 634,332 | |
| 1,125,000 | | NY Counties Tobacco Trust VI (TASC)1 | | | 5.000 | | | | 06/01/2051 | | | | 1,160,381 | |
| 20,000,000 | | NY Liberty Devel. Corp. (Bank of America Tower)5 | | | 5.625 | | | | 01/15/2046 | | | | 21,972,600 | |
| 15,475,000 | | NY MTA5 | | | 5.250 | | | | 11/15/2056 | | | | 18,012,714 | |
| 5,000,000 | | NY MTA (Green Bond)1 | | | 5.000 | | | | 11/15/2051 | | | | 5,749,350 | |
| 10,000,000 | | NY MTA (Green Bond)5 | | | 5.250 | | | | 11/15/2057 | | | | 11,873,800 | |
| 19,500,000 | | NY MTA Hudson Rail Yards1 | | | 5.000 | | | | 11/15/2056 | | | | 21,849,945 | |
| 1,200,000 | | NY MTA, Series A1 | | | 5.250 | | | | 11/15/2038 | | | | 1,370,784 | |
| 2,000,000 | | NY MTA, Series B1 | | | 5.000 | | | | 11/15/2035 | | | | 2,343,400 | |
| 10,000,000 | | NY MTA, Series B1 | | | 5.000 | | | | 11/15/2037 | | | | 11,647,000 | |
| 900,000 | | NY MTA, Series B1 | | | 5.250 | | | | 11/15/2039 | | | | 1,052,073 | |
| 1,550,000 | | NY MTA, Series D1 | | | 5.000 | | | | 11/15/2024 | | | | 1,558,416 | |
|
| 26 OPPENHEIMER ROCHESTER AMT-FREE NEW YORK MUNICIPAL FUND |
| | | | | | | | | | | | | | |
Principal Amount | | | | Coupon | | Maturity | | | Value | |
| New York (Continued) | | | | | | | | | |
| $350,000 | | NY MTA, Series D1 | | | 5.000 | % | | | 11/15/2032 | | | $ | 403,924 | |
| 1,000,000 | | NY MTA, Series D1 | | | 5.000 | | | | 11/15/2034 | | | | 1,106,940 | |
| 400,000 | | NY MTA, Series H1 | | | 5.000 | | | | 11/15/2033 | | | | 461,628 | |
| 300,000 | | NY Triborough Bridge & Tunnel Authority1 | | | 5.000 | | | | 11/15/2029 | | | | 349,365 | |
| 400,000 | | NY Triborough Bridge & Tunnel Authority1 | | | 5.000 | | | | 11/15/2030 | | | | 469,332 | |
| 875,000 | | NY Triborough Bridge & Tunnel Authority1 | | | 5.000 | | | | 11/15/2032 | | | | 1,059,459 | |
| 900,000 | | NY Triborough Bridge & Tunnel Authority1 | | | 5.000 | | | | 11/15/2033 | | | | 1,082,898 | |
| 575,000 | | NY Triborough Bridge & Tunnel Authority1 | | | 5.000 | | | | 11/15/2034 | | | | 688,603 | |
| 2,000,000 | | NY Triborough Bridge & Tunnel Authority1 | | | 5.000 | | | | 11/15/2035 | | | | 2,387,640 | |
| 2,550,000 | | NY Triborough Bridge & Tunnel Authority1 | | | 5.000 | | | | 11/15/2036 | | | | 3,029,961 | |
| 2,500,000 | | NY Triborough Bridge & Tunnel Authority1 | | | 5.000 | | | | 11/15/2037 | | | | 2,963,575 | |
| 900,000 | | NY Triborough Bridge & Tunnel Authority1 | | | 5.000 | | | | 11/15/2037 | | | | 1,066,887 | |
| 1,900,000 | | NY Triborough Bridge & Tunnel Authority1 | | | 5.000 | | | | 11/15/2038 | | | | 2,241,772 | |
| 300,000 | | NY Triborough Bridge & Tunnel Authority1 | | | 5.000 | | | | 11/15/2038 | | | | 353,964 | |
| 2,000,000 | | NY Triborough Bridge & Tunnel Authority1 | | | 5.000 | | | | 11/15/2041 | | | | 2,323,460 | |
| 1,260,000 | | NY Triborough Bridge & Tunnel Authority1 | | | 5.000 | | | | 11/15/2046 | | | | 1,456,484 | |
| 1,000,000 | | NY Triborough Bridge & Tunnel Authority1 | | | 5.000 | | | | 11/15/2047 | | | | 1,165,220 | |
| 5,000,000 | | NY TSASC, Inc. (TFABs)1 | | | 5.000 | | | | 06/01/2034 | | | | 5,663,300 | |
| 3,000,000 | | NY TSASC, Inc. (TFABs)1 | | | 5.000 | | | | 06/01/2035 | | | | 3,371,640 | |
| 3,000,000 | | NY TSASC, Inc. (TFABs)1 | | | 5.000 | | | | 06/01/2036 | | | | 3,358,560 | |
| 3,000,000 | | NY TSASC, Inc. (TFABs)1 | | | 5.000 | | | | 06/01/2041 | | | | 3,328,170 | |
| 5,000,000 | | NYC GO1 | | | 5.000 | | | | 08/01/2030 | | | | 5,901,400 | |
| 865,000 | | NYC GO1 | | | 5.000 | | | | 10/01/2032 | | | | 1,004,351 | |
| 750,000 | | NYC GO1 | | | 5.000 | | | | 03/01/2033 | | | | 865,897 | |
| 700,000 | | NYC GO1 | | | 5.000 | | | | 08/01/2035 | | | | 785,806 | |
| 1,700,000 | | NYC GO1 | | | 5.000 | | | | 08/01/2037 | | | | 1,989,544 | |
| 7,360,000 | | NYC GO1 | | | 5.000 | | | | 12/01/2037 | | | | 8,654,992 | |
| 14,780,000 | | NYC GO1 | | | 5.000 | | | | 12/01/2038 | | | | 17,367,535 | |
| 25,740,000 | | NYC GO5 | | | 5.000 | | | | 12/01/2041 | | | | 30,065,092 | |
| 11,000,000 | | NYC GO5 | | | 5.125 | | | | 03/01/2026 | | | | 11,627,550 | |
| 10,450,000 | | NYC GO5 | | | 5.375 | | | | 04/01/2036 | | | | 11,114,829 | |
| 4,550,000 | | NYC GO5 | | | 5.375 | | | | 04/01/2036 | | | | 4,839,471 | |
| 15,000 | | NYC GO | | | 5.500 | | | | 11/15/2037 | | | | 15,056 | |
| 45,000 | | NYC GO1 | | | 6.000 | | | | 05/15/2022 | | | | 45,189 | |
| 450,000 | | NYC HDC (Multifamily Hsg.)1 | | | 5.500 | | | | 11/01/2034 | | | | 469,458 | |
| 410,000 | | NYC HDC (Multifamily Hsg.)1 | | | 5.550 | | | | 11/01/2039 | | | | 424,129 | |
| 1,590,000 | | NYC HDC (Multifamily Hsg.)1 | | | 5.700 | | | | 11/01/2046 | | | | 1,651,056 | |
| 5,000 | | NYC HDC (Multifamily Hsg.), Series E1 | | | 6.250 | | | | 05/01/2036 | | | | 5,010 | |
| 5,000,000 | | NYC Health & Hospital Corp. (Health System)1 | | | 5.000 | | | | 02/15/2030 | | | | 5,349,400 | |
| 145,000 | | NYC IDA (Center for Nursing/Rehabilitation)1 | | | 5.375 | | | | 08/01/2027 | | | | 136,325 | |
| 145,000 | | NYC IDA (Comprehensive Care Management)1 | | | 6.000 | | | | 05/01/2026 | | | | 148,131 | |
| 300,000 | | NYC IDA (Comprehensive Care Management)1 | | | 6.125 | | | | 11/01/2035 | | | | 300,390 | |
| 1,625,000 | | NYC IDA (Guttmacher Institute)1 | | | 5.750 | | | | 12/01/2036 | | | | 1,622,790 | |
| 70,000 | | NYC IDA (Independent Living Assoc.)1 | | | 6.200 | | | | 07/01/2020 | | | | 70,030 | |
| 210,000 | | NYC IDA (Margaret Tietz Nursing & Rehabilitation Center)1 | | | 6.375 | | | | 11/01/2038 | | | | 216,569 | |
| 1,020,000 | | NYC IDA (Margaret Tietz Nursing & Rehabilitation Center)1 | | | 6.375 | | | | 11/01/2038 | | | | 1,051,906 | |
|
| 27 OPPENHEIMER ROCHESTER AMT-FREE NEW YORK MUNICIPAL FUND |
STATEMENT OF INVESTMENTS Continued
| | | | | | | | | | | | | | |
Principal Amount | | | | Coupon | | Maturity | | | Value | |
| New York (Continued) | | | | | | | | | |
| $2,300,000 | | NYC IDA (Montefiore Medical Center Corp.)1 | | | 5.125 | % | | | 11/01/2035 | | | $ | 2,307,613 | |
| 25,000 | | NYC IDA (RS/AFMAC/IACMR&DDA/HC/L&WS/YAI Obligated Group)1 | | | 4.500 | | | | 07/01/2021 | | | | 24,999 | |
| 4,310,000 | | NYC IDA (The Child School)1 | | | 7.550 | | | | 06/01/2033 | | | | 4,317,672 | |
| 4,600,000 | | NYC IDA (United Jewish Appeal-Federation of Jewish Philanthropies of New York)1 | | | 5.000 | | | | 07/01/2034 | | | | 5,090,774 | |
| 1,200,000 | | NYC IDA (Yankee Stadium)1,6 | | | 2.568 | | | | 03/01/2022 | | | | 1,200,840 | |
| 120,000 | | NYC IDA (Yankee Stadium)1 | | | 5.000 | | | | 03/01/2036 | | | | 121,712 | |
| 2,525,000 | | NYC IDA (Yankee Stadium)1 | | | 7.000 | | | | 03/01/2049 | | | | 2,734,954 | |
| 2,700,000 | | NYC IDA (Yeled Yalda Early Childhood)1 | | | 5.725 | | | | 11/01/2037 | | | | 2,711,502 | |
| 6,065,000 | | NYC Municipal Water Finance Authority1 | | | 5.000 | | | | 06/15/2038 | | | | 7,163,068 | |
| 5,000,000 | | NYC Municipal Water Finance Authority1 | | | 5.500 | | | | 06/15/2043 | | | | 5,642,150 | |
| 20,000,000 | | NYC Transitional Finance Authority5 | | | 5.000 | | | | 01/15/2034 | | | | 20,236,400 | |
| 2,000,000 | | NYC Transitional Finance Authority (Building Aid)1 | | | 5.000 | | | | 07/15/2034 | | | | 2,332,000 | |
| 1,395,000 | | NYC Transitional Finance Authority (Building Aid)1 | | | 5.000 | | | | 07/15/2034 | | | | 1,613,094 | |
| 1,500,000 | | NYC Transitional Finance Authority (Building Aid)1 | | | 5.000 | | | | 07/15/2035 | | | | 1,747,860 | |
| 12,485,000 | | NYC Transitional Finance Authority (Building Aid)1 | | | 5.000 | | | | 07/15/2035 | | | | 14,427,916 | |
| 1,500,000 | | NYC Transitional Finance Authority (Building Aid)1 | | | 5.000 | | | | 07/15/2036 | | | | 1,743,270 | |
| 835,000 | | NYC Transitional Finance Authority (Building Aid)1 | | | 5.000 | | | | 07/15/2043 | | | | 958,772 | |
| 5,500,000 | | NYC Transitional Finance Authority (Building Aid)1 | | | 5.250 | | | | 07/15/2037 | | | | 6,209,280 | |
| 300,000 | | NYC Transitional Finance Authority (Building Aid)1 | | | 5.500 | | | | 01/15/2039 | | | | 316,893 | |
| 2,920,000 | | NYC Transitional Finance Authority (Future Tax)1 | | | 5.000 | | | | 11/01/2030 | | | | 3,557,903 | |
| 2,490,000 | | NYC Transitional Finance Authority (Future Tax)1 | | | 5.000 | | | | 11/01/2031 | | | | 3,015,415 | |
| 1,735,000 | | NYC Transitional Finance Authority (Future Tax)1 | | | 5.000 | | | | 11/01/2032 | | | | 2,089,617 | |
| 5,000,000 | | NYC Transitional Finance Authority (Future Tax)1 | | | 5.000 | | | | 02/01/2037 | | | | 5,820,900 | |
| 2,387,000 | | NYC Transitional Finance Authority (Future Tax)1 | | | 5.000 | | | | 02/01/2040 | | | | 2,761,592 | |
| 7,750,000 | | NYC Transitional Finance Authority (Future Tax)1 | | | 5.000 | | | | 05/01/2040 | | | | 8,985,737 | |
| 9,245,000 | | NYC Transitional Finance Authority (Future Tax)1 | | | 5.000 | | | | 02/01/2041 | | | | 10,578,869 | |
| 1,000,000 | | NYC Trust for Cultural Resources (Wildlife Conservation Society)1 | | | 5.000 | | | | 08/01/2033 | | | | 1,152,020 | |
| 2,700,000 | | NYS DA (ALIA-PSCH)1 | | | 4.800 | | | | 12/01/2023 | | | | 2,708,154 | |
| 6,910,000 | | NYS DA (ALIA-PSCH)1 | | | 5.350 | | | | 12/01/2035 | | | | 6,925,824 | |
| 2,675,000 | | NYS DA (ALIA-PSCH)1 | | | 6.175 | | | | 12/01/2031 | | | | 2,681,393 | |
| 150,000 | | NYS DA (Brooklyn Law School)1 | | | 5.000 | | | | 07/01/2027 | | | | 166,854 | |
| 150,000 | | NYS DA (Brooklyn Law School)1 | | | 5.000 | | | | 07/01/2028 | | | | 166,214 | |
| 70,000 | | NYS DA (Brooklyn Law School)1 | | | 5.000 | | | | 07/01/2029 | | | | 77,401 | |
| 70,000 | | NYS DA (Brooklyn Law School)1 | | | 5.000 | | | | 07/01/2030 | | | | 77,319 | |
| 1,250,000 | | NYS DA (Catholic Health System)1 | | | 4.750 | | | | 07/01/2039 | | | | 1,315,037 | |
| 300,000 | | NYS DA (Catholic Health System)1 | | | 4.750 | | | | 07/01/2039 | | | | 315,609 | |
| 125,000 | | NYS DA (Catholic Health System)1 | | | 5.000 | | | | 07/01/2032 | | | | 135,478 | |
| 50,000 | | NYS DA (Culinary Institute of America)1 | | | 5.000 | | | | 07/01/2034 | | | | 53,688 | |
| 6,425,000 | | NYS DA (FIT/FIT Student Hsg. Corp. Obligated Group)1 | | | 5.250 | | | | 07/01/2027 | | | | 7,636,691 | |
| 3,765,000 | | NYS DA (FIT/FIT Student Hsg. Corp. Obligated Group)1 | | | 5.250 | | | | 07/01/2028 | | | | 4,502,338 | |
| 100,000 | | NYS DA (Fordham University)1 | | | 5.000 | | | | 07/01/2030 | | | | 116,360 | |
| 1,000,000 | | NYS DA (Fordham University)1 | | | 5.000 | | | | 07/01/2036 | | | | 1,159,630 | |
| 765,000 | | NYS DA (Fordham University)1 | | | 5.000 | | | | 07/01/2041 | | | | 879,467 | |
| 750,000 | | NYS DA (Highland Hospital of Rochester)1 | | | 5.000 | | | | 07/01/2026 | | | | 810,015 | |
|
| 28 OPPENHEIMER ROCHESTER AMT-FREE NEW YORK MUNICIPAL FUND |
| | | | | | | | | | | | | | |
Principal Amount | | | | Coupon | | Maturity | | | Value | |
| New York (Continued) | | | | | | | | | |
| $750,000 | | NYS DA (Highland Hospital of Rochester)1 | | | 5.200 | % | | | 07/01/2032 | | | $ | 805,935 | |
| 565,000 | | NYS DA (Interagency Council)1 | | | 7.000 | | | | 07/01/2035 | | | | 653,874 | |
| 250,000 | | NYS DA (Iona College)1 | | | 5.000 | | | | 07/01/2032 | | | | 268,438 | |
| 3,200,000 | | NYS DA (L.I. University)1 | | | 5.000 | | | | 09/01/2025 | | | | 3,579,296 | |
| 140,000 | | NYS DA (Miriam Osborn Memorial Home Assoc.)1 | | | 5.000 | | | | 07/01/2029 | | | | 145,578 | |
| 400,000 | | NYS DA (New School)1 | | | 5.000 | | | | 07/01/2040 | | | | 458,844 | |
| 1,350,000 | | NYS DA (New York State Dormitory Authority)1 | | | 5.000 | | | | 07/01/2030 | | | | 1,600,682 | |
| 1,300,000 | | NYS DA (New York State Dormitory Authority)1 | | | 5.000 | | | | 07/01/2031 | | | | 1,533,805 | |
| 1,400,000 | | NYS DA (New York State Dormitory Authority)1 | | | 5.000 | | | | 07/01/2032 | | | | 1,643,152 | |
| 1,750,000 | | NYS DA (New York State Dormitory Authority)1 | | | 5.000 | | | | 07/01/2033 | | | | 2,043,213 | |
| 1,750,000 | | NYS DA (New York State Dormitory Authority)1 | | | 5.000 | | | | 07/01/2040 | | | | 2,010,068 | |
| 1,000,000 | | NYS DA (NHlth / LIJMC / NSUH / FrankHosp / SIUH / NSUHSFCEC&R / HHA / Shosp / LHH / GCH / FHH / PlainH / NHlthcare Obligated Group)1 | | | 5.000 | | | | 05/01/2039 | | | | 1,096,360 | |
| 645,000 | | NYS DA (NYU Hospitals Center)1 | | | 5.000 | | | | 07/01/2028 | | | | 754,908 | |
| 11,920,000 | | NYS DA (NYU)1 | | | 5.000 | | | | 07/01/2034 | | | | 14,085,387 | |
| 6,425,000 | | NYS DA (NYU)1 | | | 5.000 | | | | 07/01/2035 | | | | 7,570,192 | |
| 1,500,000 | | NYS DA (NYU)1 | | | 5.000 | | | | 07/01/2037 | | | | 1,722,225 | |
| 1,110,000 | | NYS DA (NYU)1 | | | 5.000 | | | | 07/01/2045 | | | | 1,269,152 | |
| 600,000 | | NYS DA (Orange Regional Medical Center)1 | | | 5.000 | | | | 12/01/2029 | | | | 677,214 | |
| 400,000 | | NYS DA (Orange Regional Medical Center)1 | | | 5.000 | | | | 12/01/2030 | | | | 448,996 | |
| 300,000 | | NYS DA (Orange Regional Medical Center)1 | | | 5.000 | | | | 12/01/2032 | | | | 333,774 | |
| 300,000 | | NYS DA (Orange Regional Medical Center)1 | | | 5.000 | | | | 12/01/2033 | | | | 331,968 | |
| 300,000 | | NYS DA (Orange Regional Medical Center)1 | | | 5.000 | | | | 12/01/2035 | | | | 328,896 | |
| 200,000 | | NYS DA (Orange Regional Medical Center)1 | | | 5.000 | | | | 12/01/2036 | | | | 218,418 | |
| 200,000 | | NYS DA (Orange Regional Medical Center)1 | | | 5.000 | | | | 12/01/2037 | | | | 218,248 | |
| 325,000 | | NYS DA (Ozanam Hall of Queens Nursing Home)1 | | | 5.000 | | | | 11/01/2026 | | | | 325,331 | |
| 500,000 | | NYS DA (Pratt Institute)1 | | | 5.000 | | | | 07/01/2046 | | | | 565,780 | |
| 300,000 | | NYS DA (Rochester Institute of Technology)1 | | | 5.000 | | | | 07/01/2040 | | | | 327,384 | |
| 10,000,000 | | NYS DA (Sales Tax)1 | | | 5.000 | | | | 03/15/2035 | | | | 11,778,700 | |
| 200,000 | | NYS DA (St. John’s University)1 | | | 5.000 | | | | 07/01/2027 | | | | 229,240 | |
| 50,000 | | NYS DA (St. John’s University)1 | | | 5.000 | | | | 07/01/2028 | | | | 57,261 | |
| 1,955,000 | | NYS DA (St. John’s University)1 | | | 5.000 | | | | 07/01/2030 | | | | 2,223,578 | |
| 100,000 | | NYS DA (St. John’s University)1 | | | 5.000 | | | | 07/01/2034 | | | | 115,463 | |
| 500,000 | | NYS DA (St. Joseph’s College)1 | | | 5.250 | | | | 07/01/2035 | | | | 515,530 | |
| 17,100,000 | | NYS DA (St. Mary’s Hospital for Children)1 | | | 7.875 | | | | 11/15/2041 | | | | 18,423,027 | |
| 10,000,000 | | NYS DA (State Personal Income Tax Authority)1 | | | 5.000 | | | | 03/15/2035 | | | | 11,690,900 | |
| 5,000,000 | | NYS DA (State Personal Income Tax Authority)1 | | | 5.000 | | | | 02/15/2041 | | | | 5,799,500 | |
| 20,000,000 | | NYS DA (State Personal Income Tax Authority)5 | | | 5.750 | | | | 03/15/2036 | | | | 21,392,563 | |
| 1,000,000 | | NYS DA (State University Educational Facilities)1 | | | 5.000 | | | | 05/15/2030 | | | | 1,154,600 | |
| 3,320,000 | | NYS DA (State University of New York)1 | | | 5.000 | | | | 07/01/2035 | | | | 3,930,282 | |
| 3,025,000 | | NYS DA (State University of New York)1 | | | 5.000 | | | | 07/01/2038 | | | | 3,550,049 | |
| 560,000 | | NYS DA (The Bronx-Lebanon Hospital Center)1 | | | 6.250 | | | | 02/15/2035 | | | | 592,642 | |
| 1,000,000 | | NYS DA (The New School)1 | | | 5.000 | | | | 07/01/2031 | | | | 1,114,530 | |
| 1,755,000 | | NYS DA (The New School)1 | | | 5.000 | | | | 07/01/2035 | | | | 2,030,605 | |
| 510,000 | | NYS DA (The New School)1 | | | 5.000 | | | | 07/01/2036 | | | | 588,311 | |
| 765,000 | | NYS DA (The New School)1 | | | 5.000 | | | | 07/01/2037 | | | | 881,135 | |
|
| 29 OPPENHEIMER ROCHESTER AMT-FREE NEW YORK MUNICIPAL FUND |
STATEMENT OF INVESTMENTS Continued
| | | | | | | | | | | | | | |
Principal Amount | | | | Coupon | | Maturity | | | Value | |
| New York (Continued) | | | | | | | | | |
| $595,000 | | NYS DA (The New School)1 | | | 5.000 | % | | | 07/01/2041 | | | $ | 681,721 | |
| 6,650,000 | | NYS DA (The New School)1 | | | 5.000 | | | | 07/01/2046 | | | | 7,567,767 | |
| 4,800,000 | | NYS DA (United Cerebral Palsy Assoc. of NYS)1 | | | 5.375 | | | | 09/01/2050 | | | | 4,836,816 | |
| 1,110,000 | | NYS DA (Yeshiva University)1 | | | 5.000 | | | | 11/01/2031 | | | | 1,149,327 | |
| 4,330,000 | | NYS DA (Yeshiva University)1 | | | 5.000 | | | | 09/01/2038 | | | | 4,362,951 | |
| 3,750,000 | | NYS EFC (Clean Water & Drinking Revolving Funds)1 | | | 5.000 | | | | 06/15/2033 | | | | 4,482,900 | |
| 5,650,000 | | NYS EFC (Clean Water & Drinking Revolving Funds)1 | | | 5.000 | | | | 06/15/2035 | | | | 6,705,533 | |
| 20,000 | | NYS HFA (Affordable Hsg.)1 | | | 5.450 | | | | 11/01/2040 | | | | 20,211 | |
| 5,000,000 | | NYS Liberty Devel. Corp. (3 World Trade Center)1 | | | 5.000 | | | | 11/15/2044 | | | | 5,458,450 | |
| 2,000,000 | | NYS Liberty Devel. Corp. (4 World Trade Center)1 | | | 5.000 | | | | 11/15/2031 | | | | 2,262,840 | |
| 5,000,000 | | NYS Liberty Devel. Corp. (4 World Trade Center)1 | | | 5.750 | | | | 11/15/2051 | | | | 5,777,850 | |
| 4,910,000 | | NYS Liberty Devel. Corp. (Bank of America Tower at One Bryant Park)1 | | | 5.625 | | | | 01/15/2046 | | | | 5,394,273 | |
| 32,795,000 | | NYS Liberty Devel. Corp. (Goldman Sachs Headquarters)1 | | | 5.250 | | | | 10/01/2035 | | | | 42,046,797 | |
| 5,025,000 | | NYS Liberty Devel. Corp. (Goldman Sachs Headquarters)1 | | | 5.500 | | | | 10/01/2037 | | | | 6,652,045 | |
| 5,000,000 | | NYS Liberty Devel. Corp. (One Bryant Park)1 | | | 5.125 | | | | 01/15/2044 | | | | 5,387,150 | |
| 3,300,000 | | NYS Power Authority1 | | | 5.000 | | | | 11/15/2047 | | | | 3,316,665 | |
| 3,250,000 | | NYS Thruway Authority1 | | | 5.000 | | | | 01/01/2026 | | | | 3,282,273 | |
| 1,350,000 | | NYS Thruway Authority1 | | | 5.000 | | | | 01/01/2032 | | | | 1,533,303 | |
| 10,175,000 | | NYS Thruway Authority1 | | | 5.000 | | | | 01/01/2037 | | | | 11,480,554 | |
| 5,140,000 | | NYS Thruway Authority1 | | | 5.000 | | | | 01/01/2041 | | | | 5,846,287 | |
| 6,300,000 | | NYS Thruway Authority1 | | | 5.000 | | | | 01/01/2046 | | | | 7,121,583 | |
| 3,000,000 | | NYS Thruway Authority1 | | | 5.250 | | | | 01/01/2056 | | | | 3,475,680 | |
| 55,000 | | Onondaga County, NY IDA (Salina Free Library)1 | | | 5.500 | | | | 12/01/2022 | | | | 55,183 | |
| 280,000 | | Onondaga County, NY Trust Cultural Resource Revenue (Abby Lane Hsg. Corp.)1 | | | 5.000 | | | | 05/01/2033 | | | | 326,105 | |
| 200,000 | | Onondaga County, NY Trust Cultural Resource Revenue (Abby Lane Hsg. Corp.)1 | | | 5.000 | | | | 05/01/2034 | | | | 231,848 | |
| 250,000 | | Onondaga County, NY Trust Cultural Resource Revenue (Abby Lane Hsg. Corp.)1 | | | 5.000 | | | | 05/01/2037 | | | | 287,123 | |
| 150,000 | | Onondaga County, NY Trust Cultural Resource Revenue (Abby Lane Hsg. Corp.)1 | | | 5.000 | | | | 05/01/2040 | | | | 171,341 | |
| 2,250,000 | | Onondaga County, NY Trust Cultural Resource Revenue (Syracuse University)1 | | | 5.000 | | | | 12/01/2036 | | | | 2,542,770 | |
| 1,615,000 | | Onondaga, NY Civic Devel. Corp. (Le Moyne College)1 | | | 5.200 | | | | 07/01/2029 | | | | 1,743,441 | |
| 1,810,000 | | Onondaga, NY Civic Devel. Corp. (Le Moyne College)1 | | | 5.375 | | | | 07/01/2040 | | | | 1,942,148 | |
| 1,060,000 | | Onondaga, NY Civic Devel. Corp. (Onondaga Community College Hsg. Devel. Corp.)1 | | | 5.000 | | | | 10/01/2030 | | | | 1,197,206 | |
| 2,345,000 | | Onondaga, NY Civic Devel. Corp. (Onondaga Community College Hsg. Devel. Corp.)1 | | | 5.000 | | | | 10/01/2040 | | | | 2,561,350 | |
| 535,000 | | Onondaga, NY Civic Devel. Corp. (Upstate Properties)1 | | | 5.250 | | | | 12/01/2041 | | | | 608,584 | |
|
| 30 OPPENHEIMER ROCHESTER AMT-FREE NEW YORK MUNICIPAL FUND |
| | | | | | | | | | | | | | |
Principal Amount | | | | Coupon | | Maturity | | | Value | |
| New York (Continued) | | | | | | | | | |
| $2,300,000 | | Port Authority NY/NJ (JFK International Air Terminal)1 | | | 6.500 | % | | | 12/01/2028 | | | $ | 2,392,000 | |
| 5,000,000 | | Port Authority NY/NJ, 166th Series1 | | | 5.250 | | | | 07/15/2036 | | | | 5,616,900 | |
| 9,475,000 | | Port Authority NY/NJ, 198th Series1 | | | 5.000 | | | | 11/15/2041 | | | | 11,060,357 | |
| 5,000,000 | | Port Authority NY/NJ, 198th Series1 | | | 5.250 | | | | 11/15/2056 | | | | 5,865,550 | |
| 3,000,000 | | Port Authority NY/NJ, 200th Series1 | | | 5.000 | | | | 10/15/2042 | | | | 3,513,750 | |
| 6,000,000 | | Port Authority NY/NJ, 200th Series1 | | | 5.000 | | | | 10/15/2047 | | | | 6,989,460 | |
| 5,000,000 | | Port Authority NY/NJ, 205th Series1 | | | 5.250 | | | | 11/15/2057 | | | | 5,932,150 | |
| 305,000 | | Rensselaer County, NY Water Service Sewer Authority1 | | | 5.350 | | | | 09/01/2047 | | | | 309,490 | |
| 2,510,000 | | Rockland County, NY Tobacco Asset Securitization Corp.1 | | | 5.625 | | | | 08/15/2035 | | | | 2,558,443 | |
| 3,150,000 | | Rockland County, NY Tobacco Asset Securitization Corp.1 | | | 5.750 | | | | 08/15/2043 | | | | 3,210,795 | |
| 1,000,000 | | Schenectady, NY Metroplex Devel. Authority1 | | | 5.500 | | | | 08/01/2033 | | | | 1,179,260 | |
| 45,000 | | Sodus Village, NY GO1 | | | 5.000 | | | | 05/15/2032 | | | | 45,121 | |
| 45,000 | | Sodus Village, NY GO1 | | | 5.000 | | | | 05/15/2033 | | | | 45,119 | |
| 45,000 | | Sodus Village, NY GO1 | | | 5.000 | | | | 05/15/2034 | | | | 45,117 | |
| 45,000 | | Sodus Village, NY GO1 | | | 5.000 | | | | 05/15/2035 | | | | 45,116 | |
| 45,000 | | Sodus Village, NY GO1 | | | 5.000 | | | | 05/15/2036 | | | | 45,116 | |
| 45,000 | | Sodus Village, NY GO1 | | | 5.000 | | | | 05/15/2037 | | | | 45,115 | |
| 240,000 | | St. Lawrence County, NY IDA (Clarkson University)1 | | | 5.000 | | | | 09/01/2041 | | | | 261,814 | |
| 100,000 | | St. Lawrence County, NY IDA (Clarkson University)1 | | | 6.000 | | | | 09/01/2034 | | | | 114,906 | |
| 225,000 | | St. Lawrence County, NY IDA (St. Lawrence University)1 | | | 5.000 | | | | 07/01/2030 | | | | 254,133 | |
| 230,000 | | St. Lawrence County, NY IDA (St. Lawrence University)1 | | | 5.000 | | | | 07/01/2031 | | | | 258,870 | |
| 815,000 | | St. Lawrence County, NY IDA (St. Lawrence University)1 | | | 5.000 | | | | 07/01/2032 | | | | 919,010 | |
| 1,000,000 | | Suffolk County, NY Economic Devel. Corp. (Peconic Landing at Southold)1 | | | 6.000 | | | | 12/01/2040 | | | | 1,091,040 | |
| 520,000 | | Suffolk County, NY Economic Devel. Corp., Series A1 | | | 7.375 | | | | 12/01/2040 | | | | 539,765 | |
| 95,000 | | Suffolk County, NY IDA (ALIA-Adelante)1 | | | 6.500 | | | | 11/01/2037 | | | | 95,663 | |
| 8,515,000 | | Suffolk County, NY IDA (Dowling College) | | | 5.000 | | | | 06/01/2036 | | | | 8,002,397 | |
| 110,000 | | Suffolk County, NY IDA (Dowling College)2,7 | | | 6.700 | | | | 12/01/2020 | | | | 32,992 | |
| 750,000 | | Suffolk County, NY Tobacco Asset Securitization Corp.1 | | | 5.000 | | | | 06/01/2032 | | | | 809,813 | |
| 700,000 | | Suffolk County, NY Tobacco Asset Securitization Corp.1 | | | 5.250 | | | | 06/01/2037 | | | | 757,673 | |
| 1,075,000 | | Suffolk, NY Tobacco Asset Securitization Corp. | | | 5.375 | | | | 06/01/2028 | | | | 1,084,729 | |
| 1,390,000 | | Suffolk, NY Tobacco Asset Securitization Corp. | | | 6.000 | | | | 06/01/2048 | | | | 1,390,626 | |
| 15,750,000 | | Suffolk, NY Tobacco Asset Securitization Corp. | | | 7.996 | 4 | | | 06/01/2048 | | | | 1,186,763 | |
| 1,160,000 | | Sullivan County, NY Infrastructure (Adelaar)1 | | | 5.350 | | | | 11/01/2049 | | | | 1,057,862 | |
| 2,790,000 | | Sullivan County, NY Infrastructure (Adelaar)1 | | | 5.350 | | | | 11/01/2049 | | | | 2,543,978 | |
| 760,000 | | Sullivan County, NY Infrastructure (Adelaar)1 | | | 5.350 | | | | 11/01/2049 | | | | 692,983 | |
| 1,175,000 | | Sullivan County, NY Infrastructure (Adelaar)1 | | | 5.350 | | | | 11/01/2049 | | | | 1,071,389 | |
|
| 31 OPPENHEIMER ROCHESTER AMT-FREE NEW YORK MUNICIPAL FUND |
STATEMENT OF INVESTMENTS Continued
| | | | | | | | | | | | | | |
Principal Amount | | | | Coupon | | Maturity | | | Value | |
| New York (Continued) | | | | | | | | | |
| $8,220,000 | | Sullivan County, NY Infrastructure (Adelaar)1 | | | 5.350 | % | | | 11/01/2049 | | | $ | 7,495,160 | |
| 2,785,000 | | Tompkins County, NY Devel. Corp. (Tompkins Cortland Community College Foundation)1 | | | 5.000 | | | | 07/01/2038 | | | | 2,827,778 | |
| 6,100,000 | | Troy, NY Capital Resource Corp. (Rensselaer Polytechnic Institute)1 | | | 5.000 | | | | 09/01/2030 | | | | 6,681,757 | |
| 13,000,000 | | Troy, NY Capital Resource Corp. (Rensselaer Polytechnic Institute)1 | | | 5.125 | | | | 09/01/2040 | | | | 14,226,160 | |
| 30,000 | | Voorheesville, NY GO1 | | | 5.000 | | | | 02/15/2023 | | | | 30,330 | |
| 35,000 | | Voorheesville, NY GO1 | | | 5.000 | | | | 02/15/2024 | | | | 35,370 | |
| 35,000 | | Voorheesville, NY GO1 | | | 5.000 | | | | 02/15/2025 | | | | 35,354 | |
| 35,000 | | Voorheesville, NY GO1 | | | 5.000 | | | | 02/15/2026 | | | | 35,331 | |
| 40,000 | | Voorheesville, NY GO1 | | | 5.000 | | | | 02/15/2027 | | | | 40,375 | |
| 40,000 | | Voorheesville, NY GO1 | | | 5.000 | | | | 02/15/2028 | | | | 40,363 | |
| 40,000 | | Voorheesville, NY GO1 | | | 5.000 | | | | 02/15/2029 | | | | 40,349 | |
| 45,000 | | Voorheesville, NY GO1 | | | 5.000 | | | | 02/15/2030 | | | | 45,387 | |
| 45,000 | | Voorheesville, NY GO1 | | | 5.000 | | | | 02/15/2031 | | | | 45,372 | |
| 50,000 | | Voorheesville, NY GO1 | | | 5.000 | | | | 02/15/2032 | | | | 50,412 | |
| 50,000 | | Voorheesville, NY GO1 | | | 5.000 | | | | 02/15/2033 | | | | 50,406 | |
| 55,000 | | Voorheesville, NY GO1 | | | 5.000 | | | | 02/15/2034 | | | | 55,438 | |
| 55,000 | | Voorheesville, NY GO1 | | | 5.000 | | | | 02/15/2035 | | | | 55,434 | |
| 60,000 | | Voorheesville, NY GO1 | | | 5.000 | | | | 02/15/2036 | | | | 60,472 | |
| 60,000 | | Voorheesville, NY GO1 | | | 5.000 | | | | 02/15/2037 | | | | 60,469 | |
| 7,410,000 | | Westchester County, NY Healthcare Corp., Series A1 | | | 5.000 | | | | 11/01/2030 | | | | 8,061,932 | |
| 325,000 | | Westchester County, NY Healthcare Corp., Series B1 | | | 6.125 | | | | 11/01/2037 | | | | 356,857 | |
| 10,000 | | Westchester County, NY Healthcare Corp., Series C-21 | | | 6.125 | | | | 11/01/2037 | | | | 10,980 | |
| 80,000 | | Westchester County, NY Healthcare Corp., Series C-21 | | | 6.125 | | | | 11/01/2037 | | | | 92,157 | |
| 500,000 | | Westchester County, NY Local Devel. Corp. (Wartburg Senior Hsg.)1 | | | 5.000 | | | | 06/01/2030 | | | | 504,645 | |
| 1,000,000 | | Westchester County, NY Local Devel. Corp. (Westchester County Healthcare Corp.)1 | | | 5.000 | | | | 11/01/2029 | | | | 1,138,810 | |
| 1,500,000 | | Westchester County, NY Local Devel. Corp. (Westchester County Healthcare Corp.)1 | | | 5.000 | | | | 11/01/2032 | | | | 1,685,355 | |
| 4,500,000 | | Westchester County, NY Tobacco Asset Securitization Corp.1 | | | 5.000 | | | | 06/01/2045 | | | | 4,571,820 | |
| 950,000 | | Yonkers, NY IDA (Sarah Lawrence College)1 | | | 6.000 | | | | 06/01/2029 | | | | 1,029,221 | |
| | | | | | | | | | | | | 982,963,837 | |
| | | | | | | | | | | | | | | |
| U.S. Possessions—16.3% | | | | | | | | | |
| 1,200,000 | | Guam Government Business Privilege1 | | | 5.000 | | | | 01/01/2031 | | | | 1,267,128 | |
| 210,000 | | Guam Power Authority, Series A1 | | | 5.000 | | | | 10/01/2023 | | | | 238,900 | |
| 260,000 | | Guam Power Authority, Series A1 | | | 5.000 | | | | 10/01/2024 | | | | 294,260 | |
| 470,000 | | Guam Power Authority, Series A1 | | | 5.000 | | | | 10/01/2030 | | | | 527,843 | |
| 1,135,000 | | Northern Mariana Islands Commonwealth, Series A1,3 | | | 5.000 | | | | 10/01/2022 | | | | 1,090,236 | |
| 6,280,000 | | Puerto Rico Aqueduct & Sewer Authority | | | 6.000 | | | | 07/01/2038 | | | | 4,846,339 | |
|
| 32 OPPENHEIMER ROCHESTER AMT-FREE NEW YORK MUNICIPAL FUND |
| | | | | | | | | | | | | | |
Principal Amount | | | | Coupon | | Maturity | | | Value | |
| U.S. Possessions (Continued) | | | | | | | | | |
| $14,985,000 | | Puerto Rico Aqueduct & Sewer Authority | | | 6.125 | %8 | | | 07/01/2024 | | | $ | 11,668,819 | |
| 695,000 | | Puerto Rico Children’s Trust Fund (TASC)1 | | | 5.375 | | | | 05/15/2033 | | | | 700,845 | |
| 3,455,000 | | Puerto Rico Children’s Trust Fund (TASC)1 | | | 5.500 | | | | 05/15/2039 | | | | 3,458,455 | |
| 14,700,000 | | Puerto Rico Children’s Trust Fund (TASC)1 | | | 5.625 | | | | 05/15/2043 | | | | 14,735,280 | |
| 6,300,000 | | Puerto Rico Children’s Trust Fund (TASC) | | | 7.591 | 4 | | | 05/15/2050 | | | | 713,097 | |
| 2,000,000 | | Puerto Rico Commonwealth GO2 | | | 5.000 | | | | 07/01/2020 | | | | 917,500 | |
| 75,000 | | Puerto Rico Commonwealth GO, AGC1 | | | 5.000 | | | | 07/01/2024 | | | | 75,160 | |
| 3,120,000 | | Puerto Rico Commonwealth GO2 | | | 5.125 | | | | 07/01/2028 | | | | 1,431,300 | |
| 1,225,000 | | Puerto Rico Commonwealth GO2 | | | 5.125 | | | | 07/01/2031 | | | | 561,969 | |
| 6,000,000 | | Puerto Rico Commonwealth GO2 | | | 5.250 | | | | 07/01/2030 | | | | 2,752,500 | |
| 4,595,000 | | Puerto Rico Commonwealth GO2 | | | 5.250 | | | | 07/01/2031 | | | | 2,107,956 | |
| 2,500,000 | | Puerto Rico Commonwealth GO2 | | | 5.375 | | | | 07/01/2033 | | | | 1,146,875 | |
| 485,000 | | Puerto Rico Commonwealth GO2 | | | 5.500 | | | | 07/01/2018 | | | | 222,494 | |
| 26,225,000 | | Puerto Rico Commonwealth GO2 | | | 5.500 | | | | 07/01/2032 | | | | 12,030,719 | |
| 1,500,000 | | Puerto Rico Commonwealth GO2 | | | 5.625 | | | | 07/01/2033 | | | | 688,125 | |
| 8,000,000 | | Puerto Rico Commonwealth GO2 | | | 5.750 | | | | 07/01/2036 | | | | 3,670,000 | |
| 726,441 | | Puerto Rico Electric Power Authority2 | | | 10.000 | | | | 07/01/2019 | | | | 350,094 | |
| 726,440 | | Puerto Rico Electric Power Authority2 | | | 10.000 | | | | 07/01/2019 | | | | 350,093 | |
| 544,830 | | Puerto Rico Electric Power Authority2 | | | 10.000 | | | | 01/01/2021 | | | | 262,777 | |
| 544,830 | | Puerto Rico Electric Power Authority2 | | | 10.000 | | | | 07/01/2021 | | | | 262,853 | |
| 181,611 | | Puerto Rico Electric Power Authority2 | | | 10.000 | | | | 01/01/2022 | | | | 87,854 | |
| 181,610 | | Puerto Rico Electric Power Authority2 | | | 10.000 | | | | 07/01/2022 | | | | 87,854 | |
| 8,425,000 | | Puerto Rico Electric Power Authority, Series A2 | | | 5.000 | | | | 07/01/2029 | | | | 4,065,063 | |
| 2,000,000 | | Puerto Rico Electric Power Authority, Series A2 | | | 5.000 | | | | 07/01/2042 | | | | 965,000 | |
| 3,445,000 | | Puerto Rico Electric Power Authority, Series AAA2 | | | 5.250 | | | | 07/01/2022 | | | | 1,662,212 | |
| 5,450,000 | | Puerto Rico Electric Power Authority, Series AAA2 | | | 5.250 | | | | 07/01/2024 | | | | 2,629,625 | |
| 5,735,000 | | Puerto Rico Electric Power Authority, Series AAA2 | | | 5.250 | | | | 07/01/2025 | | | | 2,767,137 | |
| 5,670,000 | | Puerto Rico Electric Power Authority, Series AAA2 | | | 5.250 | | | | 07/01/2028 | | | | 2,735,775 | |
| 5,000,000 | | Puerto Rico Electric Power Authority, Series AAA2 | | | 5.250 | | | | 07/01/2030 | | | | 2,412,500 | |
| 2,155,000 | | Puerto Rico Electric Power Authority, Series AAA2 | | | 5.250 | | | | 07/01/2031 | | | | 1,039,788 | |
| 1,000,000 | | Puerto Rico Electric Power Authority, Series RR, SGI | | | 5.000 | | | | 07/01/2027 | | | | 894,640 | |
| 3,100,000 | | Puerto Rico Electric Power Authority, Series TT2 | | | 5.000 | | | | 07/01/2025 | | | | 1,495,750 | |
| 3,750,000 | | Puerto Rico Electric Power Authority, Series TT2 | | | 5.000 | | | | 07/01/2026 | | | | 1,809,375 | |
| 1,685,000 | | Puerto Rico Electric Power Authority, Series WW2 | | | 5.000 | | | | 07/01/2028 | | | | 813,012 | |
| 2,535,000 | | Puerto Rico Electric Power Authority, Series WW2 | | | 5.500 | | | | 07/01/2038 | | | | 1,223,137 | |
| 1,825,000 | | Puerto Rico Electric Power Authority, Series XX2 | | | 5.250 | | | | 07/01/2027 | | | | 880,562 | |
| 355,000 | | Puerto Rico Highway & Transportation Authority2 | | | 5.000 | | | | 07/01/2028 | | | | 4,437 | |
| 1,000,000 | | Puerto Rico Highway & Transportation Authority2 | | | 5.300 | | | | 07/01/2035 | | | | 592,500 | |
| 2,150,000 | | Puerto Rico Highway & Transportation Authority2 | | | 5.500 | | | | 07/01/2030 | | | | 1,287,312 | |
| 5,000 | | Puerto Rico Highway & Transportation Authority, Series A2 | | | 5.000 | | | | 07/01/2038 | | | | 1,194 | |
| 7,405,000 | | Puerto Rico Highway & Transportation Authority, Series K2 | | | 5.000 | | | | 07/01/2030 | | | | 1,767,944 | |
| 225,000 | | Puerto Rico Highway & Transportation Authority, Series N, FGIC9 | | | 5.250 | | | | 07/01/2039 | | | | 141,806 | |
| 4,000,000 | | Puerto Rico Infrastructure10 | | | 5.000 | | | | 07/01/2041 | | | | 275,000 | |
| 725,000 | | Puerto Rico Infrastructure, FGIC9 | | | 5.500 | | | | 07/01/2024 | | | | 455,844 | |
| 15,000,000 | | Puerto Rico Infrastructure, AMBAC | | | 5.646 | 4 | | | 07/01/2029 | | | | 7,783,800 | |
|
| 33 OPPENHEIMER ROCHESTER AMT-FREE NEW YORK MUNICIPAL FUND |
STATEMENT OF INVESTMENTS Continued
| | | | | | | | | | | | | | |
Principal Amount | | | | Coupon | | Maturity | | | Value | |
| U.S. Possessions (Continued) | | | | | | | | | |
| $4,600,000 | | Puerto Rico Infrastructure, FGIC9 | | | 7.458 | %4 | | | 07/01/2030 | | | $ | 1,226,268 | |
| 2,500,000 | | Puerto Rico Infrastructure (Mepsi Campus)2 | | | 6.500 | | | | 10/01/2037 | | | | 1,240,975 | |
| 200,000 | | Puerto Rico ITEMECF (Ana G. Mendez University)1 | | | 5.000 | | | | 04/01/2027 | | | | 194,836 | |
| 1,100,000 | | Puerto Rico ITEMECF (Ana G. Mendez University)1 | | | 5.000 | | | | 03/01/2036 | | | | 1,006,962 | |
| 130,000 | | Puerto Rico ITEMECF (Ana G. Mendez University)1 | | | 5.125 | | | | 04/01/2032 | | | | 123,921 | |
| 190,000 | | Puerto Rico ITEMECF (Ana G. Mendez University)1 | | | 5.375 | | | | 04/01/2042 | | | | 178,798 | |
| 640,000 | | Puerto Rico ITEMECF (Guaynabo Municipal Government Center)1 | | | 5.625 | | | | 07/01/2022 | | | | 503,443 | |
| 100,000 | | Puerto Rico ITEMECF (International American University)1 | | | 5.000 | | | | 10/01/2031 | | | | 103,441 | |
| 3,675,000 | | Puerto Rico ITEMECF (Polytechnic University), ACA1 | | | 5.000 | | | | 08/01/2022 | | | | 3,639,022 | |
| 150,000 | | Puerto Rico ITEMECF (University of the Sacred Heart)1 | | | 5.000 | | | | 10/01/2042 | | | | 103,482 | |
| 4,200,000 | | Puerto Rico Public Buildings Authority10 | | | 5.000 | | | | 07/01/2032 | | | | 1,816,500 | |
| 810,000 | | Puerto Rico Public Buildings Authority2 | | | 5.250 | | | | 07/01/2029 | | | | 350,325 | |
| 4,795,000 | | Puerto Rico Public Buildings Authority10 | | | 5.625 | | | | 07/01/2039 | | | | 2,073,837 | |
| 235,000 | | Puerto Rico Public Buildings Authority10 | | | 6.000 | | | | 07/01/2041 | | | | 101,637 | |
| 1,400,000 | | Puerto Rico Public Buildings Authority10 | | | 6.500 | | | | 07/01/2030 | | | | 605,500 | |
| 3,500,000 | | Puerto Rico Public Buildings Authority2 | | | 6.750 | | | | 07/01/2036 | | | | 1,513,750 | |
| 1,000,000 | | Puerto Rico Public Buildings Authority2 | | | 7.000 | | | | 07/01/2021 | | | | 432,500 | |
| 3,150,000 | | Puerto Rico Public Buildings Authority2 | | | 7.000 | | | | 07/01/2025 | | | | 1,362,375 | |
| 4,055,000 | | Puerto Rico Public Finance Corp., Series B2 | | | 5.500 | | | | 08/01/2031 | | | | 131,788 | |
| 410,000 | | Puerto Rico Sales Tax Financing Corp., Series A2 | | | 5.000 | | | | 08/01/2043 | | | | 85,588 | |
| 4,280,000 | | Puerto Rico Sales Tax Financing Corp., Series A, NPFGC | | | 5.807 | 4 | | | 08/01/2042 | | | | 1,065,549 | |
| 38,265,000 | | Puerto Rico Sales Tax Financing Corp., Series A, NPFGC | | | 6.021 | 4 | | | 08/01/2044 | | | | 8,492,917 | |
| 8,305,000 | | Puerto Rico Sales Tax Financing Corp., Series A, NPFGC | | | 6.219 | 4 | | | 08/01/2041 | | | | 2,183,135 | |
| 34,720,000 | | Puerto Rico Sales Tax Financing Corp., Series A, NPFGC | | | 6.261 | 4 | | | 08/01/2043 | | | | 8,163,019 | |
| 2,095,000 | | Puerto Rico Sales Tax Financing Corp., Series A, NPFGC | | | 6.718 | 4 | | | 08/01/2045 | | | | 440,704 | |
| 38,120,000 | | Puerto Rico Sales Tax Financing Corp., Series A2 | | | 7.535 | 4 | | | 08/01/2036 | | | | 2,390,886 | |
| 17,275,000 | | Puerto Rico Sales Tax Financing Corp., Series C2 | | | 5.000 | | | | 08/01/2040 | | | | 9,198,938 | |
| 8,600,000 | | Puerto Rico Sales Tax Financing Corp., Series C2 | | | 5.000 | | | | 08/01/2046 | | | | 4,579,500 | |
| 3,000,000 | | Puerto Rico Sales Tax Financing Corp., Series C2 | | | 5.250 | | | | 08/01/2041 | | | | 626,250 | |
| 5,000,000 | | Puerto Rico Sales Tax Financing Corp., Series C2 | | | 5.500 | | | | 08/01/2040 | | | | 1,043,750 | |
| 26,550,000 | | Puerto Rico Sales Tax Financing Corp., Series C2 | | | 5.546 | 4 | | | 08/01/2038 | | | | 1,500,872 | |
| 5,000,000 | | Puerto Rico Sales Tax Financing Corp., Series C2 | | | 5.750 | | | | 08/01/2057 | | | | 2,662,500 | |
| 7,450,000 | | Puerto Rico Sales Tax Financing Corp., Series C2 | | | 6.500 | | | | 08/01/2035 | | | | 1,555,188 | |
| 770,000 | | Puerto Rico Sales Tax Financing Corp., Series C2 | | | 6.750 | 8 | | | 08/01/2032 | | | | 160,738 | |
| 1,000,000 | | University of Puerto Rico | | | 5.000 | | | | 06/01/2025 | | | | 665,000 | |
| 5,925,000 | | University of Puerto Rico, Series Q | | | 5.000 | | | | 06/01/2030 | | | | 3,940,125 | |
|
| 34 OPPENHEIMER ROCHESTER AMT-FREE NEW YORK MUNICIPAL FUND |
| | | | | | | | | | | | | | |
Principal Amount | | | | Coupon | | Maturity | | | Value | |
| U.S. Possessions (Continued) | | | | | | | | | |
| $1,700,000 | | University of Puerto Rico, Series Q | | | 5.000 | % | | | 06/01/2036 | | | $ | 1,130,499 | |
| | | | | | | | | | | | | 170,845,256 | |
| Total Municipal Bonds and Notes (Cost $1,231,998,491) | | | | | | | | | | | 1,153,809,093 | |
| | | | |
| | | | | | | | | | | | | | | |
| Corporate Bond and Note—0.5% | | | | | | | | | | | | |
| 5,305,000 | | Dowling College, NY, Series 2015 Taxable Revenue Bond7,10,11 (Cost $5,305,000) | | | 7.500 | | | | 06/15/2018 | | | | 5,039,750 | |
| | | | |
| Shares | | | | | | | | | | |
| Common Stock—0.8% | | | | | | | | | | | | |
| 3,100 | | CMS Liquidating Trust7,11,12 (Cost $9,920,000) | | | | | | | | | | | 8,447,500 | |
| | | | |
| | | | | | | | | | | | | | | |
| Total Investments, at Value (Cost $1,247,223,491)—111.6% | | | | | | | | | | | 1,167,296,343 | |
| Net Other Assets (Liabilities)—(11.6) | | | | | | | | | | | (121,332,638 | ) |
| Net Assets—100.0% | | | | | | | | | | $ | 1,045,963,705 | |
| | | | | | | | | | | | | | |
Footnotes to Statement of Investments
1. All or a portion of the security position has been segregated for collateral to cover borrowings. See Note 9 of the accompanying Notes.
2. This security is not accruing income because its issuer has missed or is expected to miss interest and/or principal payments. The rate shown is the contractual interest rate. See Note 4 of the accompanying Notes.
3. All or a portion of the security position is when-issued or delayed delivery to be delivered and settled after period end. See Note 4 of the accompanying Notes.
4. Zero coupon bond reflects effective yield on the original acquisition date.
5. Security represents the underlying municipal bond with respect to an inverse floating rate security held by the Fund. The bond was purchased by the Fund and subsequently transferred to a trust, which issued the related inverse floating rate security. See Note 4 of the accompanying Notes.
6. Denotes an inflation-indexed security: coupon or principal are indexed to a consumer price index.
7. The value of this security was determined using significant unobservable inputs. See Note 3 of the accompanying Notes.
8. Denotes a step bond: a zero coupon bond that converts to a fixed or variable interest rate at a designated future date.
9. The issuer of this security has missed or is expected to miss interest and/or principal payments on this security. The security is insured and is accruing partial income at a rate anticipated to be recovered through the insurer. The rate shown is the contractual interest rate.
10. This security is accruing partial income at an anticipated effective rate based on expected interest and/or principal payments. The rate shown is the contractual interest rate.
11. Received as a result of a corporate action.
12. Non-income producing security.
To simplify the listings of securities, abbreviations are used per the table below:
| | |
| ACA | | American Capital Access |
| ACDS | | Assoc. for Children with Down Syndrome |
| AFMAC | | Association for Metro Area Autistic Children |
| AGC | | Assured Guaranty Corp. |
| ALIA | | Alliance of Long Island Agencies |
| AMBAC | | AMBAC Indemnity Corp. |
|
| 35 OPPENHEIMER ROCHESTER AMT-FREE NEW YORK MUNICIPAL FUND |
STATEMENT OF INVESTMENTS Continued
| | |
| To simplify the listings of securities, abbreviations are used per the table below: (Continued) |
| AP | | Advantage Planning, Inc. |
| DA | | Dormitory Authority |
| EFC | | Environmental Facilities Corp. |
| FGIC | | Financial Guaranty Insurance Co. |
| FHH | | Forest Hills Hospital |
| FIT | | Fashion Institute of Technology |
| FrankHosp | | Franklin Hospital |
| GCH | | Glen Cove Hospital |
| GO | | General Obligation |
| HC | | HASC Center |
| HDC | | Housing Devel. Corp. |
| HFA | | Housing Finance Agency |
| HHA | | Huntington Hospital Association |
| HQS | | Health Quest System |
| IACMR&DDA | | Inter-Agency Council of Mental Retardation & Development Disabilities Agencies |
| IDA | | Industrial Devel. Agency |
| ITEMECF | | Industrial, Tourist, Educational, Medical and Environmental Community Facilities |
| JFK | | John Fitzgerald Kennedy |
| L.I. | | Long Island |
| L&WS | | Leake & Watts Services |
| LHH | | Lenox Hill Hospital |
| LIJMC | | Long Island Jewish Medical Center |
| MTA | | Metropolitan Transportation Authority |
| NDH | | Northern Dutchess Hospital |
| NHlth | | Northwell Health |
| NHlthcare | | Northwell Healthcare |
| NPFGC | | National Public Finance Guarantee Corp. |
| NSUH | | North Shore University Hospital |
| NSUHSFCEC&R | | North Shore University Hospital Stern Family Center for Extended Care & Rehabilitation |
| NY/NJ | | New York/New Jersey |
| NYC | | New York City |
| NYS | | New York State |
| NYU | | New York University |
| PHCtr | | Putnam Hospital Center |
| PlainH | | Plainview Hospital |
| PSCH | | Professional Service Centers for the Handicapped, Inc. |
| RS | | Rivendell School |
| SGI | | Syncora Guarantee, Inc. |
| Shosp | | Southside Hospital |
| SIUH | | Staten Island University Hospital |
| TASC | | Tobacco Settlement Asset-Backed Bonds |
| TFABs | | Tobacco Flexible Amortization Bonds |
| VBHosp | | Vassar Brothers Hospital |
| YAI | | Young Adult Institute |
| YMCA | | Young Men’s Christian Assoc. |
See accompanying Notes to Financial Statements.
|
| 36 OPPENHEIMER ROCHESTER AMT-FREE NEW YORK MUNICIPAL FUND |
STATEMENT OF ASSETS AND LIABILITIES September 30, 2017
| | |
|
| Assets | | |
| Investments, at value(cost $1,247,223,491)—see accompanying statement of investments | | $ 1,167,296,343 |
|
| Cash | | 625,864 |
|
| Receivables and other assets: | | |
| Interest | | 13,245,644 |
| Investments sold on a when-issued or delayed delivery basis | | 3,872,380 |
| Shares of beneficial interest sold | | 293,145 |
| Other | | 388,406 |
| | |
| Total assets | | 1,185,721,782 |
| | |
|
| Liabilities | | |
| Payables and other liabilities: | | |
| Payable for short-term floating rate notes issued (See Note 4) | | 100,490,000 |
| Payable for borrowings (See Note 9) | | 36,200,000 |
| Shares of beneficial interest redeemed | | 2,147,955 |
| Dividends | | 384,171 |
| Distribution and service plan fees | | 205,713 |
| Trustees’ compensation | | 163,723 |
| Interest expense on borrowings | | 40,643 |
| Shareholder communications | | 8,329 |
| Other | | 117,543 |
| | |
| Total liabilities | | 139,758,077 |
| | |
|
| Net Assets | | $ 1,045,963,705 |
| | |
| | |
|
| Composition of Net Assets | | |
| Par value of shares of beneficial interest | | $ 94,100 |
|
| Additional paid-in capital | | 1,230,874,770 |
|
| Accumulated net investment loss | | (3,217,060) |
|
| Accumulated net realized loss on investments | | (101,860,957) |
|
| Net unrealized depreciation on investments | | (79,927,148) |
| | |
| Net Assets | | $ 1,045,963,705 |
| | |
|
| 37 OPPENHEIMER ROCHESTER AMT-FREE NEW YORK MUNICIPAL FUND |
STATEMENT OF ASSETS AND LIABILITIES Continued
| | | | |
| |
| Net Asset Value Per Share | | | | |
Class A Shares: | | | | |
Net asset value and redemption price per share (based on net assets of $872,007,717 and 78,460,691 shares of beneficial interest outstanding) | | $ | 11.11 | |
| Maximum offering price per share (net asset value plus sales charge of 4.75% of offering price) | | $ | 11.66 | |
| |
| |
Class B Shares: | | | | |
| Net asset value, redemption price (excludes applicable contingent deferred sales charge) and offering price per share (based on net assets of $568,555 and 51,114 shares of beneficial interest outstanding) | | $
| 11.12
|
|
| |
| |
Class C Shares: | | | | |
| Net asset value, redemption price (excludes applicable contingent deferred sales charge) and offering price per share (based on net assets of $104,009,866 and 9,353,431 shares of beneficial interest outstanding) | | $ | 11.12 | |
| |
| |
Class Y Shares: | | | | |
| Net asset value, redemption price and offering price per share (based on net assets of $69,377,567 and 6,234,494 shares of beneficial interest outstanding) | | $ | 11.13 | |
See accompanying Notes to Financial Statements.
|
| 38 OPPENHEIMER ROCHESTER AMT-FREE NEW YORK MUNICIPAL FUND |
STATEMENT OF
OPERATIONS For the Year Ended September 30, 2017
| | | | |
| |
| Investment Income | | | | |
| Interest | | $ | 50,141,676 | |
| |
| Expenses | | | | |
| Management fees | | | 5,254,438 | |
| |
| Distribution and service plan fees: | | | | |
| Class A | | | 2,200,638 | |
| Class B | | | 7,687 | |
| Class C | | | 1,150,377 | |
| |
| Transfer and shareholder servicing agent fees: | | | | |
| Class A | | | 924,503 | |
| Class B | | | 769 | |
| Class C | | | 115,080 | |
| Class Y | | | 68,059 | |
| |
| Shareholder communications: | | | | |
| Class A | | | 24,236 | |
| Class B | | | 160 | |
| Class C | | | 6,848 | |
| Class Y | | | 3,652 | |
| |
| Borrowing fees | | | 1,123,654 | |
| |
| Interest expense and fees on short-term floating rate notes issued (See Note 4) | | | 659,807 | |
| |
| Interest expense on borrowings | | | 299,444 | |
| |
| Trustees’ compensation | | | 16,448 | |
| |
| Custodian fees and expenses | | | 9,861 | |
| |
| Other | | | 91,080 | |
| | | | |
| Total expenses | | | 11,956,741 | |
| |
| Net Investment Income | | | 38,184,935 | |
| | | | |
| |
| Realized and Unrealized Loss | | | | |
| Net realized loss on investment transactions | | | (26,484,278) | |
| |
| Net change in unrealized appreciation/depreciation on investment transactions | | | (12,986,283) | |
| |
| Net Decrease in Net Assets Resulting from Operations | | $ | (1,285,626) | |
| | | | |
See accompanying Notes to Financial Statements.
|
| 39 OPPENHEIMER ROCHESTER AMT-FREE NEW YORK MUNICIPAL FUND |
STATEMENTS OF CHANGES IN NET ASSETS
| | | | | | | | |
| | | Year Ended
September 30, 2017 | | | Year Ended September 30, 2016 | |
| |
| Operations | | | | | | | | |
| Net investment income | | $ | 38,184,935 | | | $ | 46,587,168 | |
| |
| Net realized gain (loss) | | | (26,484,278 | ) | | | 7,660,174 | |
| |
| Net change in unrealized appreciation/depreciation | | | (12,986,283 | ) | | | 45,272,994 | |
| | | | |
| Net increase (decrease) in net assets resulting from operations | | | (1,285,626 | ) | | | 99,520,336 | |
| | | | | | | | |
| |
| Dividends and/or Distributions to Shareholders | | | | | | | | |
| Dividends from net investment income: | | | | | | | | |
| Class A | | | (34,341,693 | ) | | | (47,231,337) | |
| Class B | | | (23,172 | ) | | | (69,499) | |
| Class C | | | (3,412,040 | ) | | | (5,027,493) | |
| Class Y | | | (2,646,742 | ) | | | (2,667,147) | |
| | | | |
| | | (40,423,647 | ) | | | (54,995,476) | |
| | | | | | | | |
| |
| Beneficial Interest Transactions | | | | | | | | |
| Net increase (decrease) in net assets resulting from beneficial interest transactions: | | | | | | | | |
| Class A | | | (88,563,542 | ) | | | 27,866,803 | |
| Class B | | | (622,785 | ) | | | (1,139,966) | |
| Class C | | | (17,484,842 | ) | | | 4,960,009 | |
| Class Y | | | 12,142,830 | | | | 11,949,154 | |
| | | | |
| | | (94,528,339 | ) | | | 43,636,000 | |
| | | | | | | | |
| |
| Net Assets | | | | | | | | |
| Total increase (decrease) | | | (136,237,612 | ) | | | 88,160,860 | |
| |
| Beginning of period | | | 1,182,201,317 | | | | 1,094,040,457 | |
| | | | |
| End of period (including accumulated net investment loss of $3,217,060 and $869,019, respectively) | | $ | 1,045,963,705 | | | $ | 1,182,201,317 | |
| | | | |
See accompanying Notes to Financial Statements.
|
| 40 OPPENHEIMER ROCHESTER AMT-FREE NEW YORK MUNICIPAL FUND |
STATEMENT OF
CASH FLOWS For the Year Ended September 30, 2017
| | | | |
| |
| Cash Flows from Operating Activities | | | | |
| Net decrease in net assets from operations | | $ | (1,285,626) | |
| |
| Adjustments to reconcile net decrease in net assets from operations to net cash provided by operating activities: | | | | |
Purchase of investment securities | | | (564,747,691) | |
Proceeds from disposition of investment securities | | | 580,456,620 | |
Short-term investment securities, net | | | 1,773,975 | |
Premium amortization | | | 8,364,365 | |
Discount accretion | | | (7,762,368) | |
Net realized loss on investment transactions | | | 26,484,278 | |
Net change in unrealized appreciation/depreciation on investment transactions | | | 12,986,283 | |
| Change in assets: | | | | |
Decrease in other assets | | | 7,234 | |
Increase in interest receivable | | | (604,213) | |
Decrease in receivable for securities sold | | | 1,832,620 | |
| Change in liabilities: | | | | |
Increase in other liabilities | | | 37,155 | |
Decrease in payable for securities purchased | | | (11,189,687) | |
| | | | |
| Net cash provided by operating activities | | | 46,352,945 | |
| | | | |
| |
| Cash Flows from Financing Activities | | | | |
| Proceeds from borrowings | | | 371,400,000 | |
| Payments on borrowings | | | (335,200,000) | |
| Proceeds on short-term floating rate notes issued | | | 47,660,000 | |
| Proceeds from shares sold | | | 155,429,075 | |
| Payments on shares redeemed | | | (283,978,488) | |
| Cash distributions paid | | | (5,571,614) | |
| | | | |
| Net cash used in financing activities | | | (50,261,027) | |
| |
| Net decrease in cash | | | (3,908,082) | |
| |
| Cash, beginning balance | | | 4,533,946 | |
| | | | |
| Cash, ending balance | | $ | 625,864 | |
| | | | |
Supplemental disclosure of cash flow information:
Noncash financing activities not included herein consist of reinvestment of dividends and distributions of $34,934,244.
Cash paid for interest on borrowings—$260,430.
Cash paid for interest on short-term floating rate notes issued—$659,807.
See accompanying Notes to Financial Statements.
|
| 41 OPPENHEIMER ROCHESTER AMT-FREE NEW YORK MUNICIPAL FUND |
FINANCIAL HIGHLIGHTS
| | | | | | | | | | | | | | | | | | | | |
| Class A | | Year Ended
September
30, 2017 | | | Year Ended
September
30, 2016 | | | Year Ended
September
30, 2015 | | | Year Ended
September
30, 2014 | | | Year Ended
September
30, 2013 | |
| |
| Per Share Operating Data | | | | | | | | | | | | | | | | | | | | |
| Net asset value, beginning of period | | | $11.52 | | | | $11.08 | | | | $11.24 | | | | $10.80 | | | | $12.22 | |
| |
| Income (loss) from investment operations: | | | | | | | | | | | | | | | | | | | | |
| Net investment income1 | | | 0.39 | | | | 0.47 | | | | 0.59 | | | | 0.63 | | | | 0.62 | |
| Net realized and unrealized gain (loss) | | | (0.38) | | | | 0.53 | | | | (0.14) | | | | 0.45 | | | | (1.39) | |
| | | | |
| Total from investment operations | | | 0.01 | | | | 1.00 | | | | 0.45 | | | | 1.08 | | | | (0.77) | |
| |
| Dividends and/or distributions to shareholders: | | | | | | | | | | | | | | | | | | | | |
| Dividends from net investment income | | | (0.42) | | | | (0.56) | | | | (0.61) | | | | (0.64) | | | | (0.65) | |
| |
| Net asset value, end of period | | | $11.11 | | | | $11.52 | | | | $11.08 | | | | $11.24 | | | | $10.80 | |
| | | | |
| | | | | | | | | | | | | | | | | | | | |
| |
| Total Return, at Net Asset Value2 | | | 0.08% | | | | 9.24% | | | | 4.07% | | | | 10.28% | | | | (6.68)% | |
|
| |
| Ratios/Supplemental Data | | | | | | | | | | | | | | | | | | | | |
| Net assets, end of period (in thousands) | | | $872,008 | | | | $995,737 | | | | $930,256 | | | | $995,042 | | | | $1,016,554 | |
| |
| Average net assets (in thousands) | | | $924,142 | | | | $955,376 | | | | $975,212 | | | | $997,908 | | | | $1,174,169 | |
| |
| Ratios to average net assets:3 | | | | | | | | | | | | | | | | | | | | |
| Net investment income | | | 3.52% | | | | 4.20% | | | | 5.26% | | | | 5.78% | | | | 5.19% | |
| Expenses excluding specific expenses listed below | | | 0.82% | | | | 1.00% | | | | 0.83% | | | | 0.80% | | | | 0.75% | |
| Interest and fees from borrowings | | | 0.13% | | | | 0.06% | | | | 0.05% | | | | 0.07% | | | | 0.08% | |
| Interest and fees on short-term floating rate notes issued4 | | | 0.06% | | | | 0.07% | | | | 0.07% | | | | 0.11% | | | | 0.11% | |
| | | | |
| Total expenses | | | 1.01% | | | | 1.13% | | | | 0.95% | | | | 0.98% | | | | 0.94% | |
| Expenses after payments, waivers and/or reimbursements and reduction to custodian expenses | | | 1.01% | | | | 1.13% | | | | 0.95% | | | | 0.98%5 | | | | 0.94%5 | |
| |
| Portfolio turnover rate | | | 47% | | | | 34% | | | | 7% | | | | 10% | | | | 15% | |
1. Per share amounts calculated based on the average shares outstanding during the period.
2. Assumes an initial investment on the business day before the first day of the fiscal period, with all dividends and distributions reinvested in additional shares on the reinvestment date, and redemption at the net asset value calculated on the last business day of the fiscal period. Sales charges are not reflected in the total returns. Total returns are not annualized for periods less than one full year. Returns do not reflect the deduction of taxes that a shareholder would pay on fund distributions or the redemption of fund shares.
3. Annualized for periods less than one full year.
4. Interest and fee expense relates to the Fund’s liability for short-term floating rate notes issued in conjunction with inverse floating rate security transactions.
5. Waiver was less than 0.005%.
See accompanying Notes to Financial Statements.
|
| 42 OPPENHEIMER ROCHESTER AMT-FREE NEW YORK MUNICIPAL FUND |
| | | | | | | | | | | | | | | | | | | | |
| Class B | | Year Ended
September
30, 2017 | | | Year Ended
September
30, 2016 | | | Year Ended
September
30, 2015 | | | Year Ended
September
30, 2014 | | | Year Ended
September
30, 2013 | |
| |
| Per Share Operating Data | |
| Net asset value, beginning of period | | | $11.53 | | | | $11.09 | | | | $11.25 | | | | $10.81 | | | | $12.23 | |
| |
| Income (loss) from investment operations: | | | | | | | | | | | | | | | | | | | | |
| Net investment income1 | | | 0.32 | | | | 0.40 | | | | 0.50 | | | | 0.55 | | | | 0.51 | |
| Net realized and unrealized gain (loss) | | | (0.40) | | | | 0.51 | | | | (0.14) | | | | 0.44 | | | | (1.40) | |
| | | | |
| Total from investment operations | | | (0.08) | | | | 0.91 | | | | 0.36 | | | | 0.99 | | | | (0.89) | |
| |
| Dividends and/or distributions to shareholders: | | | | | | | | | | | | | | | | | | | | |
| Dividends from net investment income | | | (0.33) | | | | (0.47) | | | | (0.52) | | | | (0.55) | | | | (0.53) | |
| |
| Net asset value, end of period | | | $11.12 | | | | $11.53 | | | | $11.09 | | | | $11.25 | | | | $10.81 | |
| | | | |
| | | | | | | | | | | | | | | | | | | | |
| |
| Total Return, at Net Asset Value2 | | | (0.70)% | | | | 8.38% | | | | 3.27% | | | | 9.41% | | | | (7.54)% | |
|
| |
| Ratios/Supplemental Data | | | | | | | | | | | | | | | | | | | | |
| Net assets, end of period (in thousands) | | | $568 | | | | $1,229 | | | | $2,313 | | | | $3,060 | | | | $4,738 | |
| |
| Average net assets (in thousands) | | | $767 | | | | $1,646 | | | | $2,643 | | | | $3,730 | | | | $7,451 | |
| |
| Ratios to average net assets:3 | | | | | | | | | | | | | | | | | | | | |
| Net investment income | | | 2.81% | | | | 3.58% | | | | 4.50% | | | | 5.01% | | | | 4.22% | |
| Expenses excluding specific expenses listed below | | | 1.60% | | | | 1.78% | | | | 1.61% | | | | 1.61% | | | | 1.66% | |
| Interest and fees from borrowings | | | 0.13% | | | | 0.06% | | | | 0.05% | | | | 0.07% | | | | 0.08% | |
| Interest and fees on short-term floating rate notes issued4 | | | 0.06% | | | | 0.07% | | | | 0.07% | | | | 0.11% | | | | 0.11% | |
| | | | |
| Total expenses | | | 1.79% | | | | 1.91% | | | | 1.73% | | | | 1.79% | | | | 1.85% | |
| Expenses after payments, waivers and/or reimbursements and reduction to custodian expenses | | | 1.79% | | | | 1.91% | | | | 1.73% | | | | 1.79%5 | | | | 1.85%5 | |
| |
| Portfolio turnover rate | | | 47% | | | | 34% | | | | 7% | | | | 10% | | | | 15% | |
1. Per share amounts calculated based on the average shares outstanding during the period.
2. Assumes an initial investment on the business day before the first day of the fiscal period, with all dividends and distributions reinvested in additional shares on the reinvestment date, and redemption at the net asset value calculated on the last business day of the fiscal period. Sales charges are not reflected in the total returns. Total returns are not annualized for periods less than one full year. Returns do not reflect the deduction of taxes that a shareholder would pay on fund distributions or the redemption of fund shares.
3. Annualized for periods less than one full year.
4. Interest and fee expense relates to the Fund’s liability for short-term floating rate notes issued in conjunction with inverse floating rate security transactions.
5. Waiver was less than 0.005%.
See accompanying Notes to Financial Statements.
|
| 43 OPPENHEIMER ROCHESTER AMT-FREE NEW YORK MUNICIPAL FUND |
FINANCIAL HIGHLIGHTS Continued
| | | | | | | | | | | | | | | | | | | | |
| Class C | | Year Ended
September
30, 2017 | | | Year Ended
September
30, 2016 | | | Year Ended
September
30, 2015 | | | Year Ended
September
30, 2014 | | | Year Ended
September
30, 2013 | |
| |
| Per Share Operating Data | |
| Net asset value, beginning of period | | | $11.53 | | | | $11.09 | | | | $11.25 | | | | $10.81 | | | | $12.23 | |
| |
| Income (loss) from investment operations: | | | | | | | | | | | | | | | | | | | | |
| Net investment income1 | | | 0.31 | | | | 0.39 | | | | 0.50 | | | | 0.55 | | | | 0.53 | |
| Net realized and unrealized gain (loss) | | | (0.39) | | | | 0.53 | | | | (0.14) | | | | 0.44 | | | | (1.40) | |
| | | | |
| Total from investment operations | | | (0.08) | | | | 0.92 | | | | 0.36 | | | | 0.99 | | | | (0.87) | |
| |
| Dividends and/or distributions to shareholders: | | | | | | | | | | | | | | | | | | | | |
| Dividends from net investment income | | | (0.33) | | | | (0.48) | | | | (0.52) | | | | (0.55) | | | | (0.55) | |
| |
| Net asset value, end of period | | | $11.12 | | | | $11.53 | | | | $11.09 | | | | $11.25 | | | | $10.81 | |
| | | | |
| | | | | | | | | | | | | | | | | | | | |
| |
| Total Return, at Net Asset Value2 | | | (0.68)% | | | | 8.41% | | | | 3.28% | | | | 9.43% | | | | (7.41)% | |
|
| |
| Ratios/Supplemental Data | | | | | | | | | | | | | | | | | | | | |
| Net assets, end of period (in thousands) | | | $104,010 | | | | $125,732 | | | | $116,022 | | | | $123,105 | | | | $125,711 | |
| |
| Average net assets (in thousands) | | | $115,022 | | | | $120,211 | | | | $123,420 | | | | $122,766 | | | | $151,268 | |
| |
| Ratios to average net assets:3 | | | | | | | | | | | | | | | | | | | | |
| Net investment income | | | 2.78% | | | | 3.44% | | | | 4.50% | | | | 5.01% | | | | 4.39% | |
| Expenses excluding specific expenses listed below | | | 1.59% | | | | 1.76% | | | | 1.59% | | | | 1.57% | | | | 1.54% | |
| Interest and fees from borrowings | | | 0.13% | | | | 0.06% | | | | 0.05% | | | | 0.07% | | | | 0.08% | |
| Interest and fees on short-term floating rate notes issued4 | | | 0.06% | | | | 0.07% | | | | 0.07% | | | | 0.11% | | | | 0.11% | |
| | | | |
| Total expenses | | | 1.78% | | | | 1.89% | | | | 1.71% | | | | 1.75% | | | | 1.73% | |
| Expenses after payments, waivers and/or reimbursements and reduction to custodian expenses | | | 1.78% | | | | 1.89% | | | | 1.71% | | | | 1.75%5 | | | | 1.73%5 | |
| |
| Portfolio turnover rate | | | 47% | | | | 34% | | | | 7% | | | | 10% | | | | 15% | |
1. Per share amounts calculated based on the average shares outstanding during the period.
2. Assumes an initial investment on the business day before the first day of the fiscal period, with all dividends and distributions reinvested in additional shares on the reinvestment date, and redemption at the net asset value calculated on the last business day of the fiscal period. Sales charges are not reflected in the total returns. Total returns are not annualized for periods less than one full year. Returns do not reflect the deduction of taxes that a shareholder would pay on fund distributions or the redemption of fund shares.
3. Annualized for periods less than one full year.
4. Interest and fee expense relates to the Fund’s liability for short-term floating rate notes issued in conjunction with inverse floating rate security transactions.
5. Waiver was less than 0.005%.
See accompanying Notes to Financial Statements.
|
| 44 OPPENHEIMER ROCHESTER AMT-FREE NEW YORK MUNICIPAL FUND |
| | | | | | | | | | | | | | | | | | | | |
| Class Y | | Year Ended
September
30, 2017 | | | Year Ended
September
30, 2016 | | | Year Ended
September
30, 2015 | | | Year Ended
September
30, 2014 | | | Year Ended
September
30, 2013 | |
| |
| Per Share Operating Data | |
| Net asset value, beginning of period | | | $11.54 | | | | $11.09 | | | | $11.25 | | | | $10.81 | | | | $12.23 | |
| |
| Income (loss) from investment operations: | | | | | | | | | | | | | | | | | | | | |
| Net investment income1 | | | 0.41 | | | | 0.49 | | | | 0.62 | | | | 0.65 | | | | 0.65 | |
| Net realized and unrealized gain (loss) | | | (0.38) | | | | 0.55 | | | | (0.15) | | | | 0.45 | | | | (1.40) | |
| | | | |
| Total from investment operations | | | 0.03 | | | | 1.04 | | | | 0.47 | | | | 1.10 | | | | (0.75) | |
| |
| Dividends and/or distributions to shareholders: | | | | | | | | | | | | | | | | | | | | |
| Dividends from net investment income | | | (0.44) | | | | (0.59) | | | | (0.63) | | | | (0.66) | | | | (0.67) | |
| |
| Net asset value, end of period | | | $11.13 | | | | $11.54 | | | | $11.09 | | | | $11.25 | | | | $10.81 | |
| | | | |
| | | | | | | | | | | | | | | | | | | | |
| |
| Total Return, at Net Asset Value2 | | | 0.32% | | | | 9.58% | | | | 4.22% | | | | 10.54% | | | | (6.45)% | |
|
| |
| Ratios/Supplemental Data | | | | | | | | | | | | | | | | | | | | |
| Net assets, end of period (in thousands) | | | $69,378 | | | | $59,503 | | | | $45,449 | | | | $50,021 | | | | $49,435 | |
| |
| Average net assets (in thousands) | | | $68,096 | | | | $51,694 | | | | $49,242 | | | | $41,597 | | | | $48,673 | |
| |
| Ratios to average net assets:3 | | | | | | | | | | | | | | | | | | | | |
| Net investment income | | | 3.69% | | | | 4.40% | | | | 5.50% | | | | 5.98% | | | | 5.39% | |
| Expenses excluding specific expenses listed below | | | 0.59% | | | | 0.76% | | | | 0.59% | | | | 0.56% | | | | 0.51% | |
| Interest and fees from borrowings | | | 0.13% | | | | 0.06% | | | | 0.05% | | | | 0.07% | | | | 0.08% | |
| Interest and fees on short-term floating rate notes issued4 | | | 0.06% | | | | 0.07% | | | | 0.07% | | | | 0.11% | | | | 0.11% | |
| | | | |
| Total expenses | | | 0.78% | | | | 0.89% | | | | 0.71% | | | | 0.74% | | | | 0.70% | |
| Expenses after payments, waivers and/or reimbursements and reduction to custodian expenses | | | 0.78% | | | | 0.89% | | | | 0.71% | | | | 0.74% | | | | 0.70%5 | |
| |
| Portfolio turnover rate | | | 47% | | | | 34% | | | | 7% | | | | 10% | | | | 15% | |
1. Per share amounts calculated based on the average shares outstanding during the period.
2. Assumes an initial investment on the business day before the first day of the fiscal period, with all dividends and distributions reinvested in additional shares on the reinvestment date, and redemption at the net asset value calculated on the last business day of the fiscal period. Sales charges are not reflected in the total returns. Total returns are not annualized for periods less than one full year. Returns do not reflect the deduction of taxes that a shareholder would pay on fund distributions or the redemption of fund shares.
3. Annualized for periods less than one full year.
4. Interest and fee expense relates to the Fund’s liability for short-term floating rate notes issued in conjunction with inverse floating rate security transactions.
5. Waiver was less than 0.005%.
See accompanying Notes to Financial Statements.
|
| 45 OPPENHEIMER ROCHESTER AMT-FREE NEW YORK MUNICIPAL FUND |
NOTES TO FINANCIAL STATEMENTS September 30, 2017
1. Organization
Oppenheimer Rochester AMT-Free New York Municipal Fund (the “Fund”) is a diversified open-end management investment company registered under the Investment Company Act of 1940 (“1940 Act”), as amended. The Fund’s investment objective is to seek tax-free income. The Fund’s investment adviser is OFI Global Asset Management, Inc. (“OFI Global” or the “Manager”), a wholly-owned subsidiary of OppenheimerFunds, Inc. (“OFI” or the “Sub-Adviser”). The Manager has entered into a sub-advisory agreement with OFI.
The Fund offers Class A, Class C and Class Y shares, and previously offered Class B shares for new purchase through June 29, 2012. Subsequent to that date, no new purchases of Class B shares are permitted, however reinvestment of dividend and/or capital gain distributions and exchanges of Class B shares into and from other Oppenheimer funds are allowed. Class A shares are sold at their offering price, which is normally net asset value plus a front-end sales charge. Class C shares are sold, and Class B shares were sold, without a front-end sales charge but may be subject to a contingent deferred sales charge (“CDSC”). Class Y shares are sold to certain institutional investors or intermediaries without either a front-end sales charge or a CDSC, however, the intermediaries may impose charges on their accountholders who beneficially own Class Y shares. All classes of shares have identical rights and voting privileges with respect to the Fund in general and exclusive voting rights on matters that affect that class alone. Earnings, net assets and net asset value per share may differ due to each class having its own expenses, such as transfer and shareholder servicing agent fees and shareholder communications, directly attributable to that class. Class A, B and C shares have separate distribution and/or service plans under which they pay fees. Class Y shares do not pay such fees. Class B shares will automatically convert to Class A shares 72 months after the date of purchase.
The following is a summary of significant accounting policies followed in the Fund’s preparation of financial statements in accordance with accounting principles generally accepted in the United States (“U.S. GAAP”).
2. Significant Accounting Policies
Security Valuation. All investments in securities are recorded at their estimated fair value, as described in Note 3.
Allocation of Income, Expenses, Gains and Losses. Income, expenses (other than those attributable to a specific class), gains and losses are allocated on a daily basis to each class of shares based upon the relative proportion of net assets represented by such class. Operating expenses directly attributable to a specific class are charged against the operations of that class.
Dividends and Distributions to Shareholders. Dividends and distributions to shareholders, which are determined in accordance with income tax regulations and may differ from U.S. GAAP, are recorded on the ex-dividend date. Income distributions, if any, are declared daily and paid monthly. Capital gain distributions, if any, are declared and paid
|
| 46 OPPENHEIMER ROCHESTER AMT-FREE NEW YORK MUNICIPAL FUND |
2. Significant Accounting Policies (Continued)
annually or at other times as deemed necessary by the Manager.
Investment Income. Interest income is recognized on an accrual basis. Discount and premium, which are included in interest income on the Statement of Operations, are amortized or accreted daily.
Custodian Fees. “Custodian fees and expenses” in the Statement of Operations may include interest expense incurred by the Fund on any cash overdrafts of its custodian account during the period. Such cash overdrafts may result from the effects of failed trades in portfolio securities and from cash outflows resulting from unanticipated shareholder redemption activity. The Fund pays interest to its custodian on such cash overdraft at a rate equal to the Prime Rate plus 0.35%. The “Reduction to custodian expenses” line item, if applicable, represents earnings on cash balances maintained by the Fund during the period. Such interest expense and other custodian fees may be paid with these earnings.
Security Transactions. Security transactions are recorded on the trade date. Realized gains and losses on securities sold are determined on the basis of identified cost.
Indemnifications. The Fund’s organizational documents provide current and former Trustees and officers with a limited indemnification against liabilities arising in connection with the performance of their duties to the Fund. In the normal course of business, the Fund may also enter into contracts that provide general indemnifications. The Fund’s maximum exposure under these arrangements is unknown as this would be dependent on future claims that may be made against the Fund. The risk of material loss from such claims is considered remote.
Federal Taxes. The Fund intends to comply with provisions of the Internal Revenue Code applicable to regulated investment companies and to distribute substantially all of its investment company taxable income, including any net realized gain on investments not offset by capital loss carryforwards, if any, to shareholders. Therefore, no federal income or excise tax provision is required. The Fund files income tax returns in U.S. federal and applicable state jurisdictions. The statute of limitations on the Fund’s tax return filings generally remains open for the three preceding fiscal reporting period ends. The Fund has analyzed its tax positions for the fiscal year ended September 30, 2017, including open tax years, and does not believe there are any uncertain tax positions requiring recognition in the Fund’s financial statements.
The tax components of capital shown in the following table represent distribution requirements the Fund must satisfy under the income tax regulations, losses the Fund may be able to offset against income and gains realized in future years and unrealized appreciation or depreciation of securities and other investments for federal income tax purposes.
|
| 47 OPPENHEIMER ROCHESTER AMT-FREE NEW YORK MUNICIPAL FUND |
NOTES TO FINANCIAL STATEMENTS Continued
2. Significant Accounting Policies (Continued)
| | | | | | | | | | | | |
Undistributed Net Investment Income | | Undistributed
Long-Term
Gain | | | Accumulated
Loss
Carryforward1,2,3,4 | | | Net Unrealized
Depreciation
Based on cost of
Securities and
Other Investments
for Federal Income
Tax Purposes | |
| $8,886,445 | | | $— | | | | $98,232,718 | | | | $84,681,959 | |
1. At period end, the Fund had $98,232,718 of net capital loss carryforward available to offset future realized capital gains, if any, and thereby reduce future taxable gain distributions. Details of the capital loss carryforwards are included in the table below. Capital loss carryovers with no expiration, if any, must be utilized prior to those with expiration dates.
| | | | |
| Expiring | | | |
| 2018 | | $ | 43,255,092 | |
| No expiration | | | 54,977,626 | |
| | | | |
| Total | | $ | 98,232,718 | |
| | | | |
2. During the reporting period, the Fund did not utilize any capital loss carryforward.
3. During the previous reporting period, the Fund utilized $8,670,210 of capital loss carryforward to offset capital gains realized in that fiscal year.
4. During the reporting period, $26,431,288 of unused capital loss carryforward expired.
Net investment income (loss) and net realized gain (loss) may differ for financial statement and tax purposes. The character of dividends and distributions made during the fiscal year from net investment income or net realized gains are determined in accordance with federal income tax requirements, which may differ from the character of net investment income or net realized gains presented in those financial statements in accordance with U.S. GAAP. Also, due to timing of dividends and distributions, the fiscal year in which amounts are distributed may differ from the fiscal year in which the income or net realized gain was recorded by the Fund.
Accordingly, the following amounts have been reclassified for the reporting period. Net assets of the Fund were unaffected by the reclassifications.
| | | | | | | | |
Reduction to Paid-in Capital | | Increase to Accumulated
Net Investment
Loss | | | Reduction to Accumulated Net
Realized Loss on Investments | |
| $26,431,288 | | | $109,329 | | | | $26,540,617 | |
The tax character of distributions paid during the reporting periods:
|
| 48 OPPENHEIMER ROCHESTER AMT-FREE NEW YORK MUNICIPAL FUND |
2. Significant Accounting Policies (Continued)
| | | | | | | | |
| | | Year Ended
September 30, 2017 | | | Year Ended
September 30, 2016 | |
| Distributions paid from: | | | | | | | | |
| Exempt-interest dividends | | $ | 39,697,289 | | | $ | 54,545,405 | |
| Ordinary income | | | 726,358 | | | | 450,071 | |
| | | | |
| Total | | $ | 40,423,647 | | | $ | 54,995,476 | |
| | | | |
The aggregate cost of securities and other investments and the composition of unrealized appreciation and depreciation of securities and other investments for federal income tax purposes at period end are noted in the following table. The primary difference between book and tax appreciation or depreciation of securities and other investments, if applicable, is attributable to the tax deferral of losses or tax realization of financial statement unrealized gain or loss.
| | | | |
| Federal tax cost of securities | | $ | 1,153,353,728 | |
| | | | |
| Gross unrealized appreciation | | $ | 44,266,306 | |
| Gross unrealized depreciation | | | (128,948,265) | |
| | | | |
| Net unrealized depreciation | | $ | (84,681,959) | |
| | | | |
1. The Federal tax cost of securities does not include cost of $98,624,574, which has otherwise been recognized for financial reporting purposes, related to bonds placed into trusts in conjunction with certain investment transactions. See the Inverse Floating Rate Securities note in Note 4.
Use of Estimates. The preparation of financial statements in conformity with U.S. GAAP requires management to make estimates and assumptions that affect the reported amounts of assets and liabilities and disclosure of contingent assets and liabilities at the date of the financial statements and the reported amounts of increases and decreases in net assets from operations during the reporting period. Actual results could differ from those estimates.
3. Securities Valuation
The Fund calculates the net asset value of its shares as of 4:00 P.M. Eastern time, on each day the New York Stock Exchange (the “Exchange”) is open for trading, except in the case of a scheduled early closing of the Exchange, in which case the Fund will calculate net asset value of the shares as of the scheduled early closing time of the Exchange.
The Fund’s Board has adopted procedures for the valuation of the Fund’s securities and has delegated the day-to-day responsibility for valuation determinations under those procedures to the Manager. The Manager has established a Valuation Committee which is responsible for determining a fair valuation for any security for which market quotations are not readily available. The Valuation Committee’s fair valuation determinations are subject to review, approval and ratification by the Fund’s Board at its next regularly scheduled meeting covering the calendar quarter in which the fair valuation was determined.
|
| 49 OPPENHEIMER ROCHESTER AMT-FREE NEW YORK MUNICIPAL FUND |
NOTES TO FINANCIAL STATEMENTS Continued
3. Securities Valuation (Continued)
Valuation Methods and Inputs
Securities are valued primarily using unadjusted quoted market prices, when available, as supplied by third party pricing services or broker-dealers.
The following methodologies are used to determine the market value or the fair value of the types of securities described below:
Equity securities traded on a securities exchange (including exchange-traded derivatives other than futures and futures options) are valued based on the official closing price on the principal exchange on which the security is traded, as identified by the Manager, prior to the time when the Fund’s assets are valued. If the official closing price is unavailable, the security is valued at the last sale price on the principal exchange on which it is traded, or if no sales occurred, the security is valued at the mean between the quoted bid and asked prices. Over-the-counter equity securities are valued at the last published sale price, or if no sales occurred, at the mean between the quoted bid and asked prices. Events occurring after the close of trading on foreign exchanges may result in adjustments to the valuation of foreign securities to more accurately reflect their fair value as of the time when the Fund’s assets are valued.
Corporate and government debt securities (of U.S. or foreign issuers) and municipal debt securities, short-term notes, mortgage-backed securities, collateralized mortgage obligations, and asset-backed securities are valued at the mean between the bid and asked prices utilizing evaluated prices obtained from third party pricing services or broker-dealers who may use matrix pricing methods to determine the evaluated prices. Pricing services generally price debt securities assuming orderly transactions of an institutional “round lot” size, but some trades may occur in smaller, “odd lot” sizes, sometimes at lower prices than institutional round lot trades. Standard inputs generally considered by third-party pricing vendors include reported trade data, broker-dealer price quotations, benchmark yields, issuer spreads on comparable securities, the credit quality, yield, maturity, as well as other appropriate factors.
Securities for which market quotations are not readily available or a significant event has occurred that would materially affect the value of the security, the security is fair valued either (i) by a standardized fair valuation methodology applicable to the security type or the significant event as previously approved by the Valuation Committee and the Fund’s Board or (ii) as determined in good faith by the Manager’s Valuation Committee. The Valuation Committee considers all relevant facts that are reasonably available, through either public information or information available to the Manager, when determining the fair value of a security. Those standardized fair valuation methodologies include, but are not limited to, valuing securities at the last sale price or initially at cost and subsequently adjusting the value based on: changes in company specific fundamentals, changes in an appropriate securities index, or changes in the value of similar securities which may be further adjusted for any discounts related to security-specific resale restrictions. When possible, such methodologies use observable market inputs such as unadjusted quoted prices of similar securities, observable interest rates, currency rates and yield curves. The methodologies used for valuing securities are not necessarily an indication of the risks associated with investing in those securities nor can it be assured that the Fund can obtain the fair value assigned to a security if it were to sell the security.
|
| 50 OPPENHEIMER ROCHESTER AMT-FREE NEW YORK MUNICIPAL FUND |
3. Securities Valuation (Continued)
To assess the continuing appropriateness of security valuations, the Manager regularly compares prior day prices and sale prices to the current day prices and challenges those prices exceeding certain tolerance levels with the third party pricing service or broker source. For those securities valued by fair valuations, whether through a standardized fair valuation methodology or a fair valuation determination, the Valuation Committee reviews and affirms the reasonableness of the valuations based on such methodologies and fair valuation determinations on a regular basis after considering all relevant information that is reasonably available.
Classifications
Each investment asset or liability of the Fund is assigned a level at measurement date based on the significance and source of the inputs to its valuation. Various data inputs may be used in determining the value of each of the Fund’s investments as of the reporting period end. These data inputs are categorized in the following hierarchy under applicable financial accounting standards:
1) Level 1-unadjusted quoted prices in active markets for identical assets or liabilities (including securities actively traded on a securities exchange)
2) Level 2-inputs other than unadjusted quoted prices that are observable for the asset or liability (such as unadjusted quoted prices for similar assets and market corroborated inputs such as interest rates, prepayment speeds, credit risks, etc.)
3) Level 3-significant unobservable inputs (including the Manager’s own judgments about assumptions that market participants would use in pricing the asset or liability).
The inputs used for valuing securities are not necessarily an indication of the risks associated with investing in those securities.
The table below categorizes amounts that are included in the Fund’s Statement of Assets and Liabilities at period end based on valuation input level:
| | | | | | | | | | | | | | | | |
| | | Level 1— Unadjusted Quoted Prices | | | Level 2— Other Significant Observable Inputs | | | Level 3—
Significant
Unobservable
Inputs | | | Value | |
| |
| Assets Table | | | | | | | | | | | | | | | | |
| Investments, at Value: | | | | | | | | | | | | | | | | |
| Municipal Bonds and Notes | | | | | | | | | | | | | | | | |
New York | | $ | — | | | $ | 976,802,257 | | | $ | 6,161,580 | | | $ | 982,963,837 | |
U.S. Possessions | | | — | | | | 170,845,256 | | | | — | | | | 170,845,256 | |
| Corporate Bond and Note | | | — | | | | — | | | | 5,039,750 | | | | 5,039,750 | |
| Common Stock | | | — | | | | — | | | | 8,447,500 | | | | 8,447,500 | |
| | | | |
| Total Assets | | $ | — | | | $ | 1,147,647,513 | | | $ | 19,648,830 | | | $ | 1,167,296,343 | |
| | | | |
Forward currency exchange contracts and futures contracts, if any, are reported at their unrealized appreciation/depreciation at measurement date, which represents the change in the contract’s value from trade date. All additional assets and liabilities included in the above table are reported at their market value at measurement date.
|
| 51 OPPENHEIMER ROCHESTER AMT-FREE NEW YORK MUNICIPAL FUND |
NOTES TO FINANCIAL STATEMENTS Continued
3. Securities Valuation (Continued)
The table below shows the transfers between Level 2 and Level 3. The Fund’s policy is to recognize transfers in and transfers out as of the beginning of the reporting period.
| | | | | | | | | | | | | | | | |
| | | Transfers into
Level 2* | | | Transfers out of
Level 2** | | | Transfers into
Level 3** | | | Transfers out
of Level 3* | |
| |
| Assets Table | | | | | | | | | | | | | | | | |
| Investments, at Value: | | | | | | | | | | | | | | | | |
| Municipal Bonds and Notes | | | | | | | | | | | | | | | | |
New York | | $ | — | | | $ | (5,252,124) | | | $ | 5,252,124 | | | $ | — | |
U.S. Possessions | | | 2,313,058 | | | | — | | | | — | | | | (2,313,058) | |
| Corporate Bond and Note | | | — | | | | (5,157,733) | | | | 5,157,733 | | | | — | |
| | | | |
| Total Assets | | $ | 2,313,058 | | | $ | (10,409,857) | | | $ | 10,409,857 | | | $ | (2,313,058) | |
| | | | |
| * | Transferred from Level 3 to Level 2 due to the availability of market data for this security. |
** Transferred from Level 2 to Level 3 because of the lack of observable market data due to a decrease in market activity for these securities.
The following is a reconciliation of assets in which significant unobservable inputs (level 3) were used in determining fair value:
| | | | | | | | | | | | |
| | | | | | Value as of
September 30,
2016 | | | Change in
unrealized
appreciation/
depreciation | |
| |
| Assets Table | | | | | | | | | | | | |
| Investments, at Value: | | | | | | | | | | | | |
| Municipal Bonds and Notes | | | | | | | | | | | | |
New York | | | | | | $ | 32,996 | | | $ | 876,460 | |
U.S. Possessions | | | | | | | 2,313,058 | | | | — | |
| Corporate Bond and Note | | | | | | | — | | | | (117,983) | |
| Common Stock | | | | | | | 8,678,140 | | | | (230,640) | |
| | | | | | | | |
| Total Assets | | | | | | $ | 11,024,194 | | | $ | 527,837 | |
| | | | | | | | |
| | | |
| | | Transfers
into Level 3 | | | Transfers out
of Level 3 | | | Value as of
September 30,
2017 | |
| |
| Assets Table | | | | | | | | | | | | |
| Investments, at Value: | | | | | | | | | | | | |
| Municipal Bond and Note | | | | | | | | | | | | |
New York | | $ | 5,252,124 | | | $ | — | | | $ | 6,161,580 | |
U.S. Possessions | | | — | | | | (2,313,058) | | | | — | |
| Corporate Bond and Note | | | 5,157,733 | | | | — | | | | 5,039,750 | |
| Common Stock | | | — | | | | — | | | | 8,447,500 | |
| | | | |
| Total Assets | | $ | 10,409,857 | | | $ | (2,313,058) | | | $ | 19,648,830 | |
| | | | |
The total change in unrealized appreciation/depreciation included in the Statement of Operations attributable to Level 3 investments still held at period end:
|
| 52 OPPENHEIMER ROCHESTER AMT-FREE NEW YORK MUNICIPAL FUND |
3. Securities Valuation (Continued)
| | | | |
| | | Change in
unrealized
appreciation/
depreciation | |
| |
| Assets Table | | | | |
| Investment, at Value | | | | |
| Municipal Bonds and Notes | | | | |
New York | | $ | 876,460 | |
| Corporate Bond and Note | | | (117,983) | |
| Common Stock | | | (230,640) | |
| | | | |
| Total | | $ | 527,837 | |
| | | | |
The following table summarizes the valuation techniques and significant unobservable inputs used in determining fair value measurements for those investments classified as Level 3 at period end:
| | | | | | | | | | | | | | | | | | | | | | | | |
| | | Value as of
September 30, 2017 | | | Valuation
Technique | | | Unobservable
Input | | | Range of
Unobservable
Inputs | | | Unobservable
Input Used | | | | |
| |
| Assets Table | | | | | | | | | | | | | | | | | | | | | | | | |
| Investments, at Value: | | | | | | | | | | | | | | | | | | | | | | | | |
| Municipal Bonds and Notes | | | | | | | | | | | | | | | | | | | | | | | | |
New York | | $ | 6,161,580 | | | | Pricing service | | | | N/A | | | | N/A | | | | N/A | | | | (a) | |
| Corporate Bond and Note | | | 5,039,750 | | | | Pricing service | | | | N/A | | | | N/A | | | | N/A | | | | (a) | |
| Common Stock | | | 8,447,500 | | | | Pricing service | | | | N/A | | | | N/A | | | | N/A | | | | (a) | |
| | | | | | | | | | | | | | | | | | | | | | | | |
| Total | | $ | 19,648,830 | | | | | | | | | | | | | | | | | | | | | |
| | | | | | | | | | | | | | | | | | | | | | | | |
(a) Securities classified as Level 3 whose unadjusted values were provided by a pricing service and for which such inputs are unobservable. The Manager periodically reviews pricing vendor methodologies and inputs to confirm they are determined using unobservable inputs and have been appropriately classified. Such securities’ fair valuations could change significantly based on changes in unobservable inputs used by the pricing service.
4. Investments and Risks
Inverse Floating Rate Securities. The Fund invests in inverse floating rate securities that pay interest at a rate that varies inversely with short-term interest rates. Because inverse floating rate securities are leveraged instruments, the value of an inverse floating rate security will change more significantly in response to changes in interest rates and other market fluctuations than the market value of a conventional fixed-rate municipal security of similar maturity and credit quality, including the municipal bond underlying an inverse floating rate security.
An inverse floating rate security is created as part of a financial transaction referred to as a “tender option bond” transaction. In most cases, in a tender option bond transaction the Fund sells a fixed-rate municipal bond (the “underlying municipal bond”) to a trust (the “Trust”). The Trust then issues and sells short-term floating rate securities with a fixed principal amount representing a senior interest in the underlying municipal bond to third parties and a residual, subordinate interest in the underlying municipal bond (referred to as an “inverse floating rate security”) to the Fund. The interest rate on the short-term floating rate securities resets
|
| 53 OPPENHEIMER ROCHESTER AMT-FREE NEW YORK MUNICIPAL FUND |
NOTES TO FINANCIAL STATEMENTS Continued
4. Investments and Risks (Continued)
periodically, usually weekly, to a prevailing market rate and holders of these securities are granted the option to tender their securities back to the Trust for repurchase at their principal amount plus accrued interest thereon (the “purchase price”) periodically, usually daily or weekly. A remarketing agent for the Trust is required to attempt to re-sell any tendered short-term floating rate securities to new investors for the purchase price. If the remarketing agent is unable to successfully re-sell the tendered short-term floating rate securities, a liquidity provider to the Trust must contribute cash to the Trust to ensure that the tendering holders receive the purchase price of their securities on the repurchase date.
Because holders of the short-term floating rate securities are granted the right to tender their securities to the Trust for repurchase at frequent intervals for the purchase price, with such payment effectively guaranteed by the liquidity provider, the securities generally bear short-term rates of interest commensurate with money market instruments. When interest is paid on the underlying municipal bond to the Trust, such proceeds are first used to pay the Trust’s administrative expenses and accrued interest to holders of the short-term floating rate securities, with any remaining amounts being paid to the Fund, as the holder of the inverse floating rate security. Accordingly, the amount of such interest on the underlying municipal bond paid to the Fund is inversely related to the rate of interest on the short-term floating rate securities. Additionally, because the principal amount of the short-term floating rate securities is fixed and is not adjusted in response to changes in the market value of the underlying municipal bond, any change in the market value of the underlying municipal bond is reflected entirely in a change to the value of the inverse floating rate security.
Typically, the terms of an inverse floating rate security grant certain rights to the Fund, as holder. For example, the Fund typically has the right upon request to require that the Trust compel a tender of the short-term floating rate securities to facilitate the Fund’s acquisition of the underlying municipal bond. Following such a request, the Fund pays the Trust the purchase price of the short-term floating rate securities and a specified portion of any market value gain on the underlying municipal bond since its deposit into the Trust, which the Trust uses to redeem the short-term floating rate securities. The Trust then distributes the underlying municipal bond to the Fund. Through the exercise of this right, the Fund can voluntarily terminate or “collapse” the Trust, terminate its investment in the related inverse floating rate security and obtain the underlying municipal bond. Additionally, the Fund also typically has the right to exchange with the Trust (i) a principal amount of short-term floating rate securities held by the Fund for a corresponding additional principal amount of the inverse floating rate security or (ii) a principal amount of the inverse floating rate security held by the Fund for a corresponding additional principal amount of short-term floating rate securities (which are typically then sold to other investors). Through the exercise of this right, the Fund may increase (or decrease) the principal amount of short-term floating rate securities outstanding, thereby increasing (or decreasing) the amount of leverage provided by the short-term floating rate securities to the Fund’s investment exposure to the underlying municipal bond.
The Fund’s investments in inverse floating rate securities involve certain risks. As short-term interest rates rise, an inverse floating rate security produces less current income (and, in extreme cases, may pay no income) and as short-term interest rates fall, an inverse floating
|
| 54 OPPENHEIMER ROCHESTER AMT-FREE NEW YORK MUNICIPAL FUND |
4. Investments and Risks (Continued)
rate security produces more current income. Thus, if short-term interest rates rise after the issuance of the inverse floating rate security, any yield advantage is reduced or eliminated. All inverse floating rate securities entail some degree of leverage represented by the outstanding principal amount of the related short-term floating rate securities, relative to the par value of the underlying municipal bond. The value of, and income earned on, an inverse floating rate security that has a higher degree of leverage will fluctuate more significantly in response to changes in interest rates and to changes in the market value of the related underlying municipal bond than that of an inverse floating rate security with a lower degree of leverage, and is more likely to be eliminated entirely under adverse market conditions. Changes in the value of an inverse floating rate security will also be more significant than changes in the market value of the related underlying municipal bond because the leverage provided by the related short-term floating rate securities increases the sensitivity of an inverse floating rate security to changes in interest rates and to the market value of the underlying municipal bond. An inverse floating rate security can be expected to underperform fixed-rate municipal bonds when the difference between long-term and short-term interest rates is decreasing (or is already small) or when long-term interest rates are rising, but can be expected to outperform fixed-rate municipal bonds when the difference between long-term and short-term interest rates is increasing (or is already large) or when long-term interest rates are falling. Additionally, a tender option bond transaction typically provides for the automatic termination or “collapse” of a Trust upon the occurrence of certain adverse events, usually referred to as “mandatory tender events” or “tender option termination events.” These events may include, among others, a credit ratings downgrade of the underlying municipal bond below a specified level, a decrease in the market value of the underlying municipal bond below a specified amount, a bankruptcy of the liquidity provider or the inability of the remarketing agent to re-sell to new investors short-term floating rate securities that have been tendered for repurchase by holders thereof. Following the occurrence of such an event, the underlying municipal bond is generally sold for current market value and the proceeds distributed to holders of the short-term floating rate securities and inverse floating rate security, with the holder of the inverse floating rate security (the Fund) generally receiving the proceeds of such sale only after the holders of the short-term floating rate securities have received proceeds equal to the purchase price of their securities (and the liquidity provider is generally required to contribute cash to the Trust only in an amount sufficient to ensure that the holders of the short-term floating rate securities receive the purchase price of their securities in connection with such termination of the Trust). Following the occurrence of such events, the Fund could potentially lose the entire amount of its investment in the inverse floating rate security.
Finally, the Fund may enter into shortfall/reimbursement agreements with the liquidity provider of certain tender option bond transactions in connection with certain inverse floating rate securities held by the Fund. These agreements commit the Fund to reimburse the liquidity provider to the extent that the liquidity provider must provide cash to a Trust, including following the termination of a Trust resulting from the occurrence of a “mandatory tender event.” In connection with the occurrence of such an event and the termination of the Trust triggered thereby, the shortfall/reimbursement agreement will make the Fund liable for the
|
| 55 OPPENHEIMER ROCHESTER AMT-FREE NEW YORK MUNICIPAL FUND |
NOTES TO FINANCIAL STATEMENTS Continued
4. Investments and Risks (Continued)
amount of the negative difference, if any, between the liquidation value of the underlying municipal bond and the purchase price of the short-term floating rate securities issued by the Trust. Under the standard terms of a tender option bond transaction, absent such a shortfall/ reimbursement agreement, the Fund, as holder of the inverse floating rate security, would not be required to make such a reimbursement payment to the liquidity provider. The Manager monitors the Fund’s potential exposure with respect to these agreements on a daily basis and intends to take action to terminate the Fund’s investment in related inverse floating rate securities, if it deems it appropriate to do so. At period end, the Fund’s maximum exposure under such agreements is estimated at $28,250,000.
When the Fund creates an inverse floating rate security in a tender option bond transaction by selling an underlying municipal bond to a Trust, the transaction is considered a secured borrowing for financial reporting purposes. As a result of such accounting treatment, the Fund includes the underlying municipal bond on its Statement of Investments and as an asset on its Statement of Assets and Liabilities (but does not separately include the related inverse floating rate security on either). The Fund also includes a liability on its Statement of Assets and Liabilities equal to the outstanding principal amount and accrued interest on the related short-term floating rate securities issued by the Trust. Interest on the underlying municipal bond is recorded as investment income on the Fund’s Statement of Operations, while interest payable on the related short-term floating rate securities is recorded as interest expense. At period end, municipal bond holdings with a value of $172,654,414 shown on the Fund’s Statement of Investments are held by such Trusts and serve as the underlying municipal bonds for the related $100,490,000 in short-term floating rate securities issued and outstanding at that date.
At period end, the inverse floating rate securities associated with tender option bond transactions accounted for as secured borrowings were as follows:
| | | | | | | | | | | | | | | | |
Principal
Amount | | | Inverse Floater1 | | Coupon
Rate2 | | | Maturity
Date | | | Value | |
| | $ 6,750,000 | | | Hudson Yards, NY Infrastructure Corp. Tender Option Bond Series 2017-XF0551-1 Trust | | | 8.528% | | | | 2/15/42 | | | $ | 8,966,295 | |
| | 2,500,000 | | | Hudson Yards, NY Infrastructure Corp. Tender Option Bond Series 2017-XF0551-2 Trust | | | 8.528 | | | | 2/15/45 | | | | 3,303,100 | |
| | 3,870,000 | | | NY MTA (Green Bond) Tender Option Bond Series 2017-XF2498 Trust | | | 16.504 | | | | 11/15/56 | | | | 6,407,714 | |
| | 2,500,000 | | | NY MTA (Green Bond) Tender Option Bond Series 2017-XF2499 Trust | | | 16.688 | | | | 11/15/57 | | | | 4,373,800 | |
| | 2,750,000 | | | NYC GO Tender Option Bond Series 2015-XF2014 Trust3 | | | 15.992 | | | | 3/1/26 | | | | 3,377,550 | |
| | 3,750,000 | | | NYC GO Tender Option Bond Series 2015-XF2108 Trust | | | 17.003 | | | | 4/1/36 | | | | 4,704,300 | |
| | 6,435,000 | | | NYC GO Tender Option Bond Series 2017-XF0552 Trust | | | 15.652 | | | | 12/1/41 | | | | 10,760,092 | |
| | 10,000,000 | | | NYC Transitional Finance Authority Tender Option Bond Series 2015-XF2152 Trust3 | | | 8.588 | | | | 1/15/34 | | | | 10,236,400 | |
|
| 56 OPPENHEIMER ROCHESTER AMT-FREE NEW YORK MUNICIPAL FUND |
4. Investments and Risks (Continued)
| | | | | | | | | | | | | | | | |
Principal
Amount | | | Inverse Floater1 | | Coupon
Rate2 | | | Maturity
Date | | | Value | |
| | |
| | $ 6,670,000 | | | NYS DA (Personal Income Tax) Tender Option Bond Series 2015-XF0012 Trust | | | 14.240% | | | | 3/15/36 | | | $ | 8,062,563 | |
| | 10,000,000 | | | NYS Liberty Devel. Corp. (Bank of America Tower at One Bryant Park) Tender Option Bond Series 2015-XF2023 Trust3 | | | 9.767 | | | | 1/15/46 | | | | 11,972,600 | |
| | | | | | | | | | | | | | | | |
| | | | | | | | | | | | | | $ | 72,164,414 | |
| | | | | | | | | | | | | | | | |
1. For a list of abbreviations used in the Inverse Floater table see the Portfolio Abbreviations table at the end of the Statement of Investments.
2. Represents the current interest rate for the inverse floating rate security.
3. Represents an inverse floating rate security that is subject to a shortfall/reimbursement agreement.
The Fund may also purchase an inverse floating rate security created as part of a tender option bond transaction not initiated by the Fund when a third party, such as a municipal issuer or financial institution, transfers an underlying municipal bond to a Trust. For financial reporting purposes, the Fund includes the inverse floating rate security related to such transaction on its Statement of Investments and as an asset on its Statement of Assets and Liabilities, and interest on the security is recorded as investment income on the Fund’s Statement of Operations.
The Fund may invest in inverse floating rate securities with any degree of leverage (as measured by the outstanding principal amount of related short-term floating rate securities). However, the Fund may only expose up to 20% of its total assets to the effects of leverage from its investments in inverse floating rate securities. This limitation is measured by comparing the aggregate principal amount of the short-term floating rate securities that are related to the inverse floating rate securities held by the Fund to the total assets of the Fund. The Fund’s exposure to the effects of leverage from its investments in inverse floating rate securities amounts to $100,490,000 or 8.48% of its total assets at period end.
Securities on a When-Issued or Delayed Delivery Basis. The Fund may purchase securities on a “when-issued” basis, and may purchase or sell securities on a “delayed delivery” basis. “When-issued” or “delayed delivery” refers to securities whose terms and indenture are available and for which a market exists, but which are not available for immediate delivery. Delivery and payment for securities that have been purchased by the Fund on a when-issued basis normally takes place within six months and possibly as long as two years or more after the trade date. During this period, such securities do not earn interest, are subject to market fluctuation and may increase or decrease in value prior to their delivery. The purchase of securities on a when-issued basis may increase the volatility of the Fund’s net asset value to the extent the Fund executes such transactions while remaining substantially fully invested. When the Fund engages in when-issued or delayed delivery transactions, it relies on the buyer or seller, as the case may be, to complete the transaction. Their failure to do so may cause the Fund to lose the opportunity to obtain or dispose of the security at a price and yield it considers advantageous. The Fund may also sell securities that it purchased on a
|
| 57 OPPENHEIMER ROCHESTER AMT-FREE NEW YORK MUNICIPAL FUND |
NOTES TO FINANCIAL STATEMENTS Continued
4. Investments and Risks (Continued)
when-issued basis or forward commitment prior to settlement of the original purchase.
At period end, the Fund had purchased securities issued on a when-issued or delayed delivery basis and sold securities issued on a delayed delivery basis as follows:
| | | | |
| | | When-Issued or
Delayed Delivery
Basis Transactions | |
| Sold securities | | | 3,872,380 | |
Equity Security Risk. Stocks and other equity securities fluctuate in price. The value of the Fund’s portfolio may be affected by changes in the equity markets generally. Equity markets may experience significant short-term volatility and may fall sharply at times. Different markets may behave differently from each other and U.S. equity markets may move in the opposite direction from one or more foreign stock markets. Adverse events in any part of the equity or fixed-income markets may have unexpected negative effects on other market segments.
The prices of individual equity securities generally do not all move in the same direction at the same time and a variety of factors can affect the price of a particular company’s securities. These factors may include, but are not limited to, poor earnings reports, a loss of customers, litigation against the company, general unfavorable performance of the company’s sector or industry, or changes in government regulations affecting the company or its industry.
Credit Risk. The Fund invests in high-yield, non-investment-grade bonds, which may be subject to a greater degree of credit risk. Credit risk relates to the ability of the issuer to meet interest or principal payments or both as they become due. The Fund may acquire securities that have missed an interest payment, and is not obligated to dispose of securities whose issuers or underlying obligors subsequently miss an interest and/or principal payment.
In June 2016, Congress passed the Puerto Rico Oversight, Management, and Economic Stability Act (“PROMESA”). PROMESA established a federally-appointed fiscal oversight board (the “Oversight Board”) to oversee Puerto Rico’s financial operations and allows the Oversight Board to file cases on behalf of the Commonwealth of Puerto Rico or one of its instrumentalities to restructure debt and other obligations of the relevant entity in a “Title III” proceeding. Title III incorporates many provisions of the federal Bankruptcy Code for U.S. territories, and incorporates legal mechanisms for a litigation stay and restructuring of pension and debt obligations, among other provisions. In early May 2017, Title III petitions were filed for the Commonwealth of Puerto Rico and the Puerto Rico Sales Tax Financing Corporation (“COFINA”), two of the largest issuers of Puerto Rico debt. Title III petitions for Puerto Rico Highways & Transportation Authority (“PRHTA”) and Puerto Rico Electric Power Authority (“PREPA”) were subsequently filed in mid-May and early July, respectively. Title III petitions for additional Puerto Rican instrumentalities are expected to be filed. These restructuring proceedings create uncertainty as to the treatment of claims of varying degrees of seniority and the levels and priorities of payment from the affected entities.
Information concerning securities not accruing interest at period end is as follows:
|
| 58 OPPENHEIMER ROCHESTER AMT-FREE NEW YORK MUNICIPAL FUND |
4. Investments and Risks (Continued)
| | | | | | | | |
| Cost | | | $179,070,138 | | | | | |
| Market Value | | | $90,284,256 | | | | | |
| Market Value as % of Net Assets | | | 8.63% | | | | | |
Concentration Risk. The Fund invests a large percentage of its total assets in obligations of issuers within its respective state and U.S. territories. Risks may arise from geographic concentration in any state, commonwealth or territory, such as Puerto Rico, the U.S. Virgin Islands, Guam or the Northern Mariana Islands. Certain economic, regulatory or political developments occurring in the state, commonwealth or territory such as ongoing developments in Puerto Rico may impair the ability of certain issuers of municipal securities to pay principal and interest on their obligations.
5. Market Risk Factors
The Fund’s investments in securities and/or financial derivatives may expose the Fund to various market risk factors:
Commodity Risk. Commodity risk relates to the change in value of commodities or commodity indexes as they relate to increases or decreases in the commodities market. Commodities are physical assets that have tangible properties. Examples of these types of assets are crude oil, heating oil, metals, livestock, and agricultural products.
Credit Risk. Credit risk relates to the ability of the issuer of debt to meet interest and principal payments, or both, as they come due. In general, lower-grade, higher-yield debt securities are subject to credit risk to a greater extent than lower-yield, higher-quality securities.
Equity Risk. Equity risk relates to the change in value of equity securities as they relate to increases or decreases in the general market.
Foreign Exchange Rate Risk. Foreign exchange rate risk relates to the change in the U.S. dollar value of a security held that is denominated in a foreign currency. The U.S. dollar value of a foreign currency denominated security will decrease as the dollar appreciates against the currency, while the U.S. dollar value will increase as the dollar depreciates against the currency.
Interest Rate Risk. Interest rate risk refers to the fluctuations in value of fixed-income securities resulting from the inverse relationship between price and yield. For example, an increase in general interest rates will tend to reduce the market value of already issued fixed-income investments, and a decline in general interest rates will tend to increase their value. In addition, debt securities with longer maturities, which tend to have higher yields, are subject to potentially greater fluctuations in value from changes in interest rates than obligations with shorter maturities.
Volatility Risk. Volatility risk refers to the magnitude of the movement, but not the direction of the movement, in a financial instrument’s price over a defined time period. Large increases or decreases in a financial instrument’s price over a relative time period typically indicate greater volatility risk, while small increases or decreases in its price typically indicate lower volatility risk.
|
| 59 OPPENHEIMER ROCHESTER AMT-FREE NEW YORK MUNICIPAL FUND |
NOTES TO FINANCIAL STATEMENTS Continued
6. Shares of Beneficial Interest
The Fund has authorized an unlimited number of $0.001 par value shares of beneficial interest of each class. Transactions in shares of beneficial interest were as follows:
| | | | | | | | | | | | | | | | |
| | | Year Ended September 30, 2017 | | | Year Ended September 30, 2016 | |
| | | Shares | | | Amount | | | Shares | | | Amount | |
| Class A | | | | | | | | | | | | | | | | |
| Sold | | | 8,739,314 | | | $ | 97,449,291 | | | | 11,414,577 | | | $ | 127,870,287 | |
| Dividends and/or distributions reinvested | | | 2,687,260 | | | | 30,097,256 | | | | 3,685,706 | | | | 41,343,440 | |
| Redeemed | | | (19,386,253 | ) | | | (216,110,089 | ) | | | (12,634,533 | ) | | | (141,346,924 | ) |
| Net increase (decrease) | | | (7,959,679 | ) | | $ | (88,563,542 | ) | | | 2,465,750 | | | $ | 27,866,803 | |
| | | | | | | | | | | | | | | | |
| | | | | | | | | | | | | | | | | |
| Class B | | | | | | | | | | | | | | | | |
| Sold | | | 126 | | | $ | 1,413 | | | | 4,745 | | | $ | 53,519 | |
| Dividends and/or distributions reinvested | | | 1,727 | | | | 19,348 | | | | 4,948 | | | | 55,364 | |
| Redeemed | | | (57,301 | ) | | | (643,546 | ) | | | (111,739 | ) | | | (1,248,849 | ) |
| Net decrease | | | (55,448 | ) | | $ | (622,785 | ) | | | (102,046 | ) | | $ | (1,139,966 | ) |
| | | | | | | | | | | | | | | | |
| | | | | | | | | | | | | | | | | |
| Class C | | | | | | | | | | | | | | | | |
| Sold | | | 1,365,280 | | | $ | 15,280,479 | | | | 2,171,064 | | | $ | 24,295,580 | |
| Dividends and/or distributions reinvested | | | 254,252 | | | | 2,849,314 | | | | 364,489 | | | | 4,089,406 | |
| Redeemed | | | (3,172,781 | ) | | | (35,614,635 | ) | | | (2,094,417 | ) | | | (23,424,977 | ) |
| Net increase (decrease) | | | (1,553,249 | ) | | $ | (17,484,842 | ) | | | 441,136 | | | $ | 4,960,009 | |
| | | | | | | | | | | | | | | | |
| | | | | | | | | | | | | | | | | |
| Class Y | | | | | | | | | | | | | | | | |
| Sold | | | 3,706,983 | | | $ | 41,473,405 | | | | 1,996,267 | | | $ | 22,402,007 | |
| Dividends and/or distributions reinvested | | | 175,353 | | | | 1,968,326 | | | | 166,177 | | | | 1,869,093 | |
| Redeemed | | | (2,806,082 | ) | | | (31,298,901 | ) | | | (1,101,247 | ) | | | (12,321,946 | ) |
| Net increase | | | 1,076,254 | | | $ | 12,142,830 | | | | 1,061,197 | | | $ | 11,949,154 | |
| | | | | | | | | | | | | | | | |
7. Purchases and Sales of Securities
The aggregate cost of purchases and proceeds from sales of securities, other than short-term obligations, for the reporting period were as follows:
| | | | | | | | |
| | | Purchases | | | Sales | |
| Investment securities | | $ | 564,747,691 | | | $ | 580,456,620 | |
8. Fees and Other Transactions with Affiliates
Management Fees. Under the investment advisory agreement, the Fund pays the Manager a management fee based on the daily net assets of the Fund at an annual rate as shown in the following table:
|
| 60 OPPENHEIMER ROCHESTER AMT-FREE NEW YORK MUNICIPAL FUND |
8. Fees and Other Transactions with Affiliates (Continued)
| | | | |
| Fee Schedule | | | |
| Up to $200 million | | | 0.60% | |
| Next $100 million | | | 0.55 | |
| Next $200 million | | | 0.50 | |
| Next $250 million | | | 0.45 | |
| Next $250 million | | | 0.40 | |
| Next $4 billion | | | 0.35 | |
| Over $5 billion | | | 0.33 | |
The Fund’s effective management fee for the reporting period was 0.47% of average annual net assets before any applicable waivers.
Sub-Adviser Fees. The Manager has retained the Sub-Adviser to provide the day-to-day portfolio management of the Fund. Under the Sub-Advisory Agreement, the Manager pays the Sub-Adviser an annual fee in monthly installments, equal to a percentage of the investment management fee collected by the Manager from the Fund, which shall be calculated after any investment management fee waivers. The fee paid to the Sub-Adviser is paid by the Manager, not by the Fund.
Transfer Agent Fees. OFI Global (the “Transfer Agent”) serves as the transfer and shareholder servicing agent for the Fund. The Fund pays the Transfer Agent a fee based on annual net assets, which shall be calculated after any applicable fee waivers. Fees incurred and average net assets for each class with respect to these services are detailed in the Statement of Operations and Financial Highlights, respectively.
Sub-Transfer Agent Fees. The Transfer Agent has retained Shareholder Services, Inc., a wholly-owned subsidiary of OFI (the “Sub-Transfer Agent”), to provide the day-to-day transfer agent and shareholder servicing of the Fund. Under the Sub-Transfer Agency Agreement, the Transfer Agent pays the Sub-Transfer Agent an annual fee in monthly installments, equal to a percentage of the transfer agent fee collected by the Transfer Agent from the Fund, which shall be calculated after any applicable fee waivers. The fee paid to the Sub-Transfer Agent is paid by the Transfer Agent, not by the Fund.
Trustees’ Compensation. The Fund has adopted an unfunded retirement plan (the “Plan”) for the Fund’s Independent Trustees. Benefits are based on years of service and fees paid to each Trustee during their period of service. The Plan was frozen with respect to adding new participants effective December 31, 2006 (the “Freeze Date”) and existing Plan Participants as of the Freeze Date will continue to receive accrued benefits under the Plan. Active
Independent Trustees as of the Freeze Date have each elected a distribution method with respect to their benefits under the Plan. During the reporting period, the Fund’s projected benefit obligations, payments to retired Trustees and accumulated liability were as follows:
| | | | |
| Projected Benefit Obligations Increased | | $ | — | |
| Payments Made to Retired Trustees | | | 9,457 | |
| Accumulated Liability as of September 30, 2017 | | | 68,351 | |
|
| 61 OPPENHEIMER ROCHESTER AMT-FREE NEW YORK MUNICIPAL FUND |
NOTES TO FINANCIAL STATEMENTS Continued
8. Fees and Other Transactions with Affiliates (Continued)
The Fund’s Board of Trustees (“Board”) has adopted a compensation deferral plan for Independent Trustees that enables Trustees to elect to defer receipt of all or a portion of the annual compensation they are entitled to receive from the Fund. For purposes of determining the amount owed to the Trustee under the plan, deferred amounts are treated as though equal dollar amounts had been invested in shares of the Fund or in other Oppenheimer funds selected by the Trustee. The Fund purchases shares of the funds selected for deferral by the Trustee in amounts equal to his or her deemed investment, resulting in a Fund asset equal to the deferred compensation liability. Such assets are included as a component of “Other” within the asset section of the Statement of Assets and Liabilities. Deferral of Trustees’ fees under the plan will not affect the net assets of the Fund and will not materially affect the Fund’s assets, liabilities or net investment income per share. Amounts will be deferred until distributed in accordance with the compensation deferral plan.
Distribution and Service Plan (12b-1) Fees. Under its General Distributor’s Agreement with the Fund, OppenheimerFunds Distributor, Inc. (the “Distributor”) acts as the Fund’s principal underwriter in the continuous public offering of the Fund’s classes of shares.
Service Plan for Class A Shares. The Fund has adopted a Service Plan (the “Plan”) for Class A shares pursuant to Rule 12b-1 under the 1940 Act. Under the Plan, the Fund reimburses the Distributor for a portion of its costs incurred for services provided to accounts that hold Class A shares. Reimbursement is made periodically at an annual rate of up to 0.25% of the daily net assets of Class A shares of the Fund. The Distributor currently uses all of those fees to pay dealers, brokers, banks and other financial institutions periodically for providing personal service and maintenance of accounts of their customers that hold Class A shares. Any unreimbursed expenses the Distributor incurs with respect to Class A shares in any fiscal year cannot be recovered in subsequent periods. Fees incurred by the Fund under the Plan are detailed in the Statement of Operations.
Distribution and Service Plans for Class B and Class C Shares. The Fund has adopted Distribution and Service Plans (the “Plans”) for Class B and Class C shares pursuant to Rule 12b-1 under the 1940 Act to compensate the Distributor for distributing those share classes, maintaining accounts and providing shareholder services. Under the Plans, the Fund pays the Distributor an annual asset-based sales charge of 0.75% on Class B and Class C shares’ daily net assets. The Fund also pays a service fee under the Plans at an annual rate of 0.25% of daily net assets. The Plans continue in effect from year to year only if the Fund’s Board of Trustees votes annually to approve their continuance at an in person meeting called for that purpose. Fees incurred by the Fund under the Plans are detailed in the Statement of Operations.
Sales Charges. Front-end sales charges and CDSC do not represent expenses of the Fund. They are deducted from the proceeds of sales of Fund shares prior to investment or from redemption proceeds prior to remittance, as applicable. The sales charges retained
|
| 62 OPPENHEIMER ROCHESTER AMT-FREE NEW YORK MUNICIPAL FUND |
8. Fees and Other Transactions with Affiliates (Continued)
by the Distributor from the sale of shares and the CDSC retained by the Distributor on the redemption of shares is shown in the following table for the period indicated.
| | | | | | | | | | | | | | | | |
| Year Ended | | Class A
Front-End
Sales Charges
Retained by
Distributor | | | Class A
Contingent
Deferred
Sales Charges
Retained by
Distributor | | | Class B
Contingent
Deferred
Sales Charges
Retained by
Distributor | | | Class C
Contingent
Deferred
Sales Charges
Retained by
Distributor | |
| September 30, 2017 | | | $62,850 | | | | $29,863 | | | | $1,130 | | | | $8,405 | |
9. Borrowings and Other Financing
Borrowings. The Fund can borrow money from banks in amounts up to one third of its total assets (including the amount borrowed) less all liabilities and indebtedness other than borrowings (meaning that the value of those assets must be at least 300% of the amount borrowed). The Fund can use those borrowings for investment-related purposes such as purchasing portfolio securities. The Fund also may borrow to meet redemption obligations or for temporary and emergency purposes. When the Fund invests borrowed money in portfolio securities, it is using a speculative investment technique known as leverage and changes in the value of the Fund’s investments will have a larger effect on its share price than if it did not borrow because of the effect of leverage.
The Fund can also use the borrowings for other investment-related purposes, including in connection with the Fund’s inverse floater investments as discussed in Note 4. The Fund may use the borrowings to reduce the leverage amount of, or unwind or “collapse” trusts that issued “inverse floaters” owned by the Fund, or in circumstances in which the Fund has entered into a shortfall and forbearance agreement with the sponsor of the inverse floater trust to meet the Fund’s obligation to reimburse the sponsor of the inverse floater for the difference between the liquidation value of the underlying bond and the amount due to holders of the short-term floating rate notes issued by the Trust. See the discussion in Note 4 (Inverse Floating Rate Securities) for additional information.
The Fund will pay interest and may pay other fees in connection with loans. If the Fund does borrow, it will be subject to greater expenses than funds that do not borrow. The interest on borrowed money and the other fees incurred in conjunction with loans are an expense that might reduce the Fund’s yield and return. Expenses incurred by the Fund with respect to interest on borrowings and commitment fees are disclosed separately or as other expenses on the Statement of Operations.
The Fund entered into a Revolving Credit and Security Agreement (the “Agreement”) with conduit lenders and Citibank N.A. which enables it to participate with certain other Oppenheimer funds in a committed, secured borrowing facility that permits borrowings of up to $2.5 billion, collectively, by the Oppenheimer Rochester Funds. To secure the loan, the Fund pledges investment securities in accordance with the terms of the Agreement. Securities held in collateralized accounts to cover these borrowings are noted in the Statement of Investments. Interest is charged to the Fund, based on its borrowings, at current commercial
|
| 63 OPPENHEIMER ROCHESTER AMT-FREE NEW YORK MUNICIPAL FUND |
NOTES TO FINANCIAL STATEMENTS Continued
9. Borrowings and Other Financing (Continued)
paper issuance rates (1.2596% at period end). The Fund pays additional fees monthly to its lender on its outstanding borrowings to manage and administer the facility and is allocated its pro-rata share of an annual structuring fee and ongoing commitment fees both of which are based on the total facility size. Total fees and interest that are included in expenses on the Fund’s Statement of Operations related to its participation in the borrowing facility during the reporting period equal 0.10% of the Fund’s average net assets on an annualized basis. The Fund has the right to prepay such loans and terminate its participation in the conduit loan facility at any time upon prior notice.
At period end, the Fund had borrowings outstanding at an interest rate of 1.2596%.
Details of the borrowings for the reporting period are as follows:
| | | | |
| Average Daily Loan Balance | | $ | 28,984,658 | |
| Average Daily Interest Rate | | | 0.994 | % |
| Fees Paid | | $ | 776,244 | |
| Interest Paid | | $ | 260,430 | |
Reverse Repurchase Agreements. The Fund may engage in reverse repurchase agreements. A reverse repurchase agreement is the sale of one or more securities to a counterparty at an agreed-upon purchase price with the simultaneous agreement to repurchase those securities on a future date at a higher repurchase price. The repurchase price represents the repayment of the purchase price and interest accrued thereon over the term of the repurchase agreement. The cash received by the Fund in connection with a reverse repurchase agreement may be used for investment-related purposes such as purchasing portfolio securities or for other purposes such as those described in the preceding “Borrowings” note.
The Fund entered into a Committed Repurchase Transaction Facility (the “Facility”) with J.P. Morgan Securities LLC (the “counterparty”) which enables it to participate with certain other Oppenheimer funds in a committed reverse repurchase agreement facility that permits aggregate outstanding reverse repurchase agreements of up to $750 million, collectively. Interest is charged to the Fund on the purchase price of outstanding reverse repurchase agreements at current LIBOR rates plus an applicable spread. The Fund is also allocated its pro-rata share of an annual structuring fee based on the total Facility size and ongoing commitment fees based on the total unused amount of the Facility. The Fund retains the economic exposure to fluctuations in the value of securities subject to reverse repurchase agreements under the Facility and therefore these transactions are considered secured borrowings for financial reporting purposes. The Fund also continues to receive the economic benefit of interest payments received on securities subject to reverse repurchase agreements, in the form of a direct payment from the counterparty. These payments are included in interest income on the Statement of Operations. Total fees and interest related to the Fund’s participation in the Facility during the reporting period are included in expenses on the Fund’s Statement of Operations and equal 0.03% of the Fund’s average net assets on an annualized basis.
The securities subject to reverse repurchase agreements under the Facility are valued on
|
| 64 OPPENHEIMER ROCHESTER AMT-FREE NEW YORK MUNICIPAL FUND |
9. Borrowings and Other Financing (Continued)
a daily basis. To the extent this value, after adjusting for certain margin requirements of the Facility, exceeds the cash proceeds received, the Fund may request the counterparty to return securities equal in margin value to this excess. To the extent that the cash proceeds received exceed the margin value of the securities subject to the transaction, the counterparty may request additional securities from the Fund. The Fund has the right to declare each Wednesday as the repurchase date for any outstanding reverse repurchase agreement upon delivery of advanced notification and may also recall any security subject to such a transaction by substituting eligible securities of equal or greater margin value according to the Facility’s terms.
The Fund executed no transactions under the Facility during the reporting period.
Details of reverse repurchase agreement transactions for the reporting period are as follows:
10. Subsequent Event
During the reporting period there were two hurricanes that impacted Puerto Rico and the U.S. Virgin Islands causing significant damages. Subsequent to fiscal year end and through financial statement issuance date, the change in market value of the Fund’s investments in Puerto Rico and the U.S. Virgin Islands had a negative impact on the Fund’s net assets by less than 4%.
|
| 65 OPPENHEIMER ROCHESTER AMT-FREE NEW YORK MUNICIPAL FUND |
REPORT OF INDEPENDENT REGISTERED PUBLIC ACCOUNTING FIRM
The Board of Trustees and Shareholders of Oppenheimer Rochester AMT-Free New York Municipal Fund:
We have audited the accompanying statement of assets and liabilities of Oppenheimer Rochester AMT-Free New York Municipal Fund (the Fund), including the statement of investments, as of September 30, 2017, and the related statements of operations and cash flows for the year then ended, the statements of changes in net assets for each of the years in the two-year period then ended, and the financial highlights for each of the years in the five-year period then ended. These financial statements and financial highlights are the responsibility of the Fund’s management. Our responsibility is to express an opinion on these financial statements and financial highlights based on our audits.
We conducted our audits in accordance with the standards of the Public Company Accounting Oversight Board (United States). Those standards require that we plan and perform the audit to obtain reasonable assurance about whether the financial statements and financial highlights are free of material misstatement. An audit includes examining, on a test basis, evidence supporting the amounts and disclosures in the financial statements. Our procedures included confirmation of securities owned as of September 30, 2017, by correspondence with the custodian. An audit also includes assessing the accounting principles used and significant estimates made by management, as well as evaluating the overall financial statement presentation. We believe that our audits provide a reasonable basis for our opinion.
In our opinion, the financial statements and financial highlights referred to above present fairly, in all material respects, the financial position of Oppenheimer Rochester AMT-Free New York Municipal Fund as of September 30, 2017, the results of its operations and cash flows for the year then ended, the changes in its net assets for each of the years in the two-year period then ended, and the financial highlights for each of the years in the five-year period then ended, in conformity with U.S. generally accepted accounting principles.
KPMG LLP
Denver, Colorado
November 22, 2017
|
| 66 OPPENHEIMER ROCHESTER AMT-FREE NEW YORK MUNICIPAL FUND |
FEDERAL INCOME TAX INFORMATION Unaudited
In early 2017, if applicable, shareholders of record received information regarding all dividends and distributions paid to them by the Fund during calendar year 2016.
None of the dividends paid by the Fund during the reporting period are eligible for the corporate dividend-received deduction. 98.20% of the dividends were derived from interest on municipal bonds and are not subject to federal income taxes. To the extent a shareholder is subject to any state or local tax laws, some or all of the dividends received may be taxable.
The foregoing information is presented to assist shareholders in reporting distributions received from the Fund to the Internal Revenue Service. Because of the complexity of the federal regulations which may affect your individual tax return and the many variations in state and local tax regulations, we recommend that you consult your tax advisor for specific guidance.
|
| 67 OPPENHEIMER ROCHESTER AMT-FREE NEW YORK MUNICIPAL FUND |
BOARD APPROVAL OF THE FUND’S INVESTMENT ADVISORY
AND SUB-ADVISORY AGREEMENTS Unaudited
The Fund has entered into an investment advisory agreement with OFI Global Asset Management, Inc. (“OFI Global” or the “Adviser”), a wholly-owned subsidiary of OppenheimerFunds, Inc. (“OFI” or the “Sub-Adviser”) (“OFI Global” and “OFI” together the “Managers”) and OFI Global has entered into a sub-advisory agreement with OFI whereby OFI provides investment sub-advisory services to the Fund (collectively, the “Agreements”). Each year, the Board of Trustees (the “Board”), including a majority of the independent Trustees, is required to determine whether to approve the terms of the Agreements and the renewal thereof. The Investment Company Act of 1940, as amended, requires that the Board request and evaluate, and that the Managers provide, such information as may be reasonably necessary to evaluate the terms of the Agreements. The Board employs an independent consultant to prepare a report that provides information, including comparative information that the Board requests for that purpose. In addition to in-person meetings focused on this evaluation, the Board receives information throughout the year regarding Fund services, fees, expenses and performance.
The Managers and the independent consultant provided information to the Board on the following factors: (i) the nature, quality and extent of the Managers’ services, (ii) the comparative investment performance of the Fund and the Managers, (iii) the fees and expenses of the Fund, including comparative fee and expense information, (iv) the profitability of the Managers and their affiliates, including an analysis of the cost of providing services, (v) whether economies of scale are realized as the Fund grows and whether fee levels reflect these economies of scale for Fund investors and (vi) other benefits to the Managers from their relationship with the Fund. The Board was aware that there are alternatives to retaining the Managers.
Outlined below is a summary of the principal information considered by the Board as well as the Board’s conclusions.
Nature, Quality and Extent of Services. The Board considered information about the nature, quality and extent of the services provided to the Fund and information regarding the Managers’ key personnel who provide such services. The Managers’ duties include providing the Fund with the services of the portfolio managers and the Sub-Adviser’s investment team, who provide research, analysis and other advisory services in regard to the Fund’s investments; and securities trading services. OFI Global is responsible for oversight of third-party service providers; monitoring compliance with applicable Fund policies and procedures and adherence to the Fund’s investment restrictions; risk management; and oversight of the Sub-Adviser. OFI Global is also responsible for providing certain administrative services to the Fund. Those services include providing and supervising all administrative and clerical personnel who are necessary in order to provide effective corporate administration for the Fund; compiling and maintaining records with respect to the Fund’s operations; preparing and filing reports required by the U.S. Securities and Exchange Commission; preparing periodic reports regarding the operations of the Fund for its shareholders; preparing proxy materials for shareholder meetings; and preparing the registration statements required by federal and state securities laws for the sale of the Fund’s shares. OFI Global also provides the Fund with office space, facilities and equipment.
|
| 68 OPPENHEIMER ROCHESTER AMT-FREE NEW YORK MUNICIPAL FUND |
The Board also considered the quality of the services provided and the quality of the Managers’ resources that are available to the Fund. The Board took account of the fact that the Sub-Adviser has over fifty years of experience as an investment adviser and that its assets under management rank it among the top mutual fund managers in the United States. The Board evaluated the Managers’ advisory, administrative, accounting, legal, compliance and risk management services, among other services, and information the Board has received regarding the experience and professional qualifications of the Managers’ key personnel and the size and functions of its staff. In its evaluation of the quality of the portfolio management services provided, the Board considered the experience of Scott Cottier, Troy Willis, Mark DeMitry, Michael Camarella, Charles Pulire, and Elizabeth Mossow, the portfolio managers for the Fund, and the Sub-Adviser’s investment team and analysts. The Board members also considered the totality of their experiences with the Managers as directors or trustees of the Fund and other funds advised by the Managers. The Board considered information regarding the quality of services provided by affiliates of the Managers, which the Board members have become knowledgeable about through their experiences with the Managers and in connection with the review or renewal of the Fund’s service agreements or service providers. The Board concluded, in light of the Managers’ experience, reputation, personnel, operations and resources that the Fund benefits from the services provided under the Agreements.
Investment Performance of the Managers and the Fund. Throughout the year, the Managers provided information on the investment performance of the Fund, the Adviser and the Sub-Adviser, including comparative performance information. The Board also reviewed information, prepared by the Managers and by the independent consultant, comparing the Fund’s historical performance to relevant benchmarks or market indices and to the performance of other retail funds in the muni New York long category. The Board noted that the Fund’s one-year, three-year and five-year performance was better than its category median although its ten-year performance was below its category median.
Fees and Expenses of the Fund. The Board reviewed the fees paid to the Adviser and the other expenses borne by the Fund. The independent consultant provided comparative data in regard to the fees and expenses of the Fund and other retail front-end load muni New York long funds with comparable asset levels and distribution features. The Board noted that the Fund’s contractual management fees were lower than its peer group median and category median. The Board also noted that the Fund’s total expenses were higher than its peer group median and category median.
Economies of Scale and Profits Realized by the Managers. The Board considered information regarding the Managers’ costs in serving as the Fund’s investment adviser and sub-adviser, including the costs associated with the personnel and systems necessary to manage the Fund, and information regarding the Managers’ profitability from their relationship with the Fund. The Board also considered that the Managers must be able to pay and retain experienced professional personnel at competitive rates to provide quality services to the Fund. The Board reviewed whether the Managers may realize economies of scale in managing and supporting the Fund. The Board noted that the Fund currently has management fee breakpoints, which are intended to share with Fund shareholders economies of scale that may exist as the Fund’s assets grow.
|
| 69 OPPENHEIMER ROCHESTER AMT-FREE NEW YORK MUNICIPAL FUND |
BOARD APPROVAL OF THE FUND’S INVESTMENT ADVISORY
AND SUB-ADVISORY AGREEMENTS Unaudited / Continued
Other Benefits to the Managers. In addition to considering the profits realized by the Managers, the Board considered information that was provided regarding the direct and indirect benefits the Managers receive as a result of their relationship with the Fund, including compensation paid to the Managers’ affiliates.
Conclusions. These factors were also considered by the independent Trustees meeting separately from the full Board, assisted by experienced counsel to the Fund and to the independent Trustees. Fund counsel and the independent Trustees’ counsel are independent of the Managers within the meaning and intent of the Securities and Exchange Commission Rules.
Based on its review of the information it received and its evaluations described above, the Board, including a majority of the independent Trustees, decided to continue the Agreements through September 30, 2018. In arriving at its decision, the Board did not identify any factor or factors as being more important than others, but considered all of the above information, and considered the terms and conditions of the Agreements, including the management fees, in light of all the surrounding circumstances.
|
| 70 OPPENHEIMER ROCHESTER AMT-FREE NEW YORK MUNICIPAL FUND |
PORTFOLIO PROXY VOTING POLICIES AND GUIDELINES;
UPDATES TO STATEMENTS OF INVESTMENTS Unaudited
The Fund has adopted Portfolio Proxy Voting Policies and Guidelines under which the Fund votes proxies relating to securities (“portfolio proxies”) held by the Fund. A description of the Fund’s Portfolio Proxy Voting Policies and Guidelines is available (i) without charge, upon request, by calling the Fund toll-free at 1.800. CALL OPP (225.5677), (ii) on the Fund’s website at www.oppenheimerfunds.com, and (iii) on the SEC’s website at www.sec.gov. In addition, the Fund is required to file Form N-PX, with its complete proxy voting record for the 12 months ended June 30th, no later than August 31st of each year. The Fund’s voting record is available (i) without charge, upon request, by calling the Fund toll-free at 1. 800. CALL OPP (225.5677), and (ii) in the Form N-PX filing on the SEC’s website at www.sec.gov.
The Fund files its complete schedule of portfolio holdings with the SEC for the first quarter and the third quarter of each fiscal year on Form N-Q. The Fund’s Form N-Q filings are available on the SEC’s website at www.sec.gov. Those forms may be reviewed and copied at the SEC’s Public Reference Room in Washington, D.C. Information on the operation of the Public Reference Room may be obtained by calling 1-800-SEC-0330.
Householding—Delivery of Shareholder Documents
This is to inform you about OppenheimerFunds’ “householding” policy. If more than one member of your household maintains an account in a particular fund, OppenheimerFunds will mail only one copy of the fund’s prospectus (or, if available, the fund’s summary prospectus), annual and semiannual report and privacy policy. The consolidation of these mailings, called householding, benefits your fund through reduced mailing expense, and benefits you by reducing the volume of mail you receive from OppenheimerFunds. Householding does not affect the delivery of your account statements.
Please note that we will continue to household these mailings for as long as you remain an OppenheimerFunds shareholder, unless you request otherwise. If you prefer to receive multiple copies of these materials, please call us at 1.800. CALL-OPP (225-5677). You may also notify us in writing or via email. We will begin sending you individual copies of the prospectus (or, if available, the summary prospectus), reports and privacy policy within 30 days of receiving your request to stop householding.
|
| 71 OPPENHEIMER ROCHESTER AMT-FREE NEW YORK MUNICIPAL FUND |
DISTRIBUTION SOURCES Unaudited
For any distribution that took place over the last six months of the Fund’s reporting period, the table below details on a per-share basis the percentage of the Fund’s total distribution payment amount that was derived from the following sources: net income, net profit from the sale of securities, and other capital sources. Other capital sources represent a return of capital. A return of capital may occur, for example, when some or all of the money that you invested in the Fund is paid back to you. A return of capital distribution does not necessarily reflect the Fund’s investment performance and should not be confused with “yield” or “income.” You should not draw any conclusions about each Fund’s investment performance from the amounts of these distributions. This information is based upon income and capital gains using generally accepted accounting principles as of the date of each distribution. Because the Fund is actively managed, the relative amount of the Fund’s total distributions derived from various sources over the calendar year may change. Please note that this information should not be used for tax reporting purposes as the tax character of distributable income may differ from the amounts used for this notification. You will receive IRS tax forms in the first quarter of each calendar year detailing the actual amount of the taxable and non-taxable portion of distributions paid to you during the tax year.
For the most current information, please go to oppenheimerfunds.com. Select your Fund and scroll down to the ‘Dividends’ table under ‘Analytics’. The Fund’s latest distribution information will be followed by the sources of any distribution, updated daily.
| | | | | | | | | | | | | | | | |
| Fund Name | | Pay
Date | | | Net Income | | | Net Profit
from Sale | | | Other
Capital
Sources | |
| |
Oppenheimer Rochester AMT-Free New York Municipal Fund | | | 5/23/17 | | | | 93.0% | | | | 0.0% | | | | 7.0% | |
| |
Oppenheimer Rochester AMT-Free New York
Municipal Fund | | | 7/25/17 | | | | 20.9% | | | | 0.0% | | | | 79.1% | |
| |
Oppenheimer Rochester AMT-Free New York
Municipal Fund | | | 8/22/17 | | | | 75.6% | | | | 0.0% | | | | 24.4% | |
| |
|
| 72 OPPENHEIMER ROCHESTER AMT-FREE NEW YORK MUNICIPAL FUND |
TRUSTEES AND OFFICERS Unaudited
| | |
| Name, Position(s) Held with the Fund, Length of Service, Year of Birth | | Principal Occupation(s) During the Past 5 Years; Other Trusteeships/ Directorships Held; Number of Portfolios in the Fund Complex Currently Overseen |
| |
| INDEPENDENT TRUSTEES | | The address of each Trustee in the chart below is 6803 S. Tucson Way, Centennial, Colorado 80112-3924. Each Trustee serves for an indefinite term, or until his or her resignation, retirement, death or removal. |
| |
Brian F. Wruble, Chairman of the Board of Trustees (since 2007), Trustee (since 2005) Year of Birth: 1943 | | Governor of Community Foundation of the Florida Keys (non-profit) (since July 2012); Director of TCP Capital, Inc. (since November 2015); Chairman Emeritus of the Board of Trustees (since August 2011), Chairman of the Board of Trustees (August 2007-August 2011), Trustee of the Board of Trustees (since August 1991) of The Jackson Laboratory (non-profit); Member of Zurich Insurance Group’s Investment Management Advisory Council (insurance) (October 2004-February 2017); Treasurer (since 2007) and Trustee (since May 1992) of the Institute for Advanced Study (non-profit educational institute); Director of Special Value Opportunities Fund, LLC (registered investment company) (affiliate of the Sub-Adviser’s parent company) (September 2004-June 2015); General Partner of Odyssey Partners, L.P. (hedge fund) (September 1995-December 2007); Special Limited Partner of Odyssey Investment Partners, LLC (private equity investment) (January 1999-September 2004). Oversees 57 portfolios in the OppenheimerFunds complex. Mr. Wruble has served on the Boards of certain Oppenheimer funds since April 2001, during which time he has become familiar with the Fund’s (and other Oppenheimer funds’) financial, accounting, regulatory and investment matters and has contributed to the Boards’ deliberations. |
| |
Beth Ann Brown, Trustee (since 2016) Year of Birth: 1968 | | Advisor, Board of Advisors of Caron Engineering Inc. (since December 2014); Independent Consultant (since September 2012); held the following positions at Columbia Management Investment Advisers LLC: Head of Intermediary Distribution (2008-2012), Managing Director, Strategic Relations (2005-2008), Managing Director, Head of National Accounts (2004-2005); Senior Vice President, National Account Manager (2002-2004), Senior Vice President, Key Account Manager (1999-2002) and Vice President, Key Account Manager (1996-1999) of Liberty Funds Distributor, Inc.; President and Director, of Acton Shapleigh Youth Conservation Corps (non-profit) (since 2012); and Vice President and Director of Grahamtastic Connection (non-profit) (since May 2013). Oversees 57 portfolios in the OppenheimerFunds complex. Ms. Brown has served on the Boards of certain Oppenheimer funds since January 2016, during which time she has become familiar with the Fund’s (and other Oppenheimer funds’) financial, accounting, regulatory and investment matters and has contributed to the Board’s deliberations. |
| |
Edmund P. Giambastiani, Jr., Trustee (since 2013) Year of Birth: 1948 | | Advisory Board Member of the Maxwell School of Citizenship and Public Affairs of Syracuse University (since April 2012); Director of Mercury Defense Systems Inc. (information technology) (August 2011-February 2013); Trustee of the U.S. Naval Academy Foundation Athletic & Scholarship Program (since November 2010); Advisory Board Member of the Massachusetts Institute of Technology Lincoln Laboratory (federally-funded research development center) (since May 2010); Director of The Boeing Company (aerospace and defense) (since October 2009); Trustee of MITRE Corporation (federally-funded research development center) (since September 2008); Independent Director of QinetiQ Group Plc (defense technology and security) (February 2008-August 2011); Chairman of Monster Worldwide, Inc. (on-line career services) (March 2015-November 2016), Director of Monster Worldwide, Inc. (on-line career services) (February 2008-June 2011); Lead |
|
| 73 OPPENHEIMER ROCHESTER AMT-FREE NEW YORK MUNICIPAL FUND |
TRUSTEES AND OFFICERS Unaudited / Continued
| | |
Edmund P. Giambastiani, Jr., continued | | Director (June 2011-March 2015); Chairman of Alenia North America, Inc. (military and defense products) (January 2008-October 2009); Director of SRA International, Inc. (information technology and services) (January 2008-July 2011); President of Giambastiani Group LLC (national security and energy consulting) (since October 2007); United States Navy, career nuclear submarine officer (June 1970-October 2007), Vice Chairman of the Joint Chiefs of Staff (2005-October 2007), Supreme Allied Commander of NATO Commander Transformation (2003-2005), Commander, U.S. Joint Forces Command (2002-2005). Since his retirement from the U.S. Navy in October 2007, Admiral Giambastiani has also served on numerous U.S. Government advisory boards, investigations and task forces for the Secretaries of Defense, State and Interior and the Central Intelligence Agency. He recently completed serving as a federal commissioner on the Military Compensation and Retirement Modernization Commission. Oversees 57 portfolios in the OppenheimerFunds complex. Admiral Giambastiani has served on the Boards of certain Oppenheimer funds since February 2013, including as an Advisory Board Member for certain Oppenheimer funds, during which time he has become familiar with the Fund’s (and other Oppenheimer funds’) financial, accounting, regulatory and investment matters and has contributed to the Boards’ deliberations. For purposes of this report, Admiral Giambastiani is identified as a Trustee. |
| |
Elizabeth Krentzman, Trustee (since 2014)| Year of Birth: 1959 | | Member of the University of Florida National Board Foundation (since September 2017); Member of the Cartica Funds Board of Directors (private investment funds) (since January 2017); Member of the University of Florida College of Law Association Board of Trustees and Audit Committee Member (since April 2016); Member of University of Florida Law Advisory Board, Washington, DC Alumni Group (since 2015); Advisory Board Member of the Securities and Exchange Commission Historical Society (since 2007); held the following positions at Deloitte & Touche LLP: Principal and Chief Regulatory Advisor for Asset Management Services (2007 - 2014) and U.S. Mutual Fund Leader (2011 - 2014); General Counsel of the Investment Company Institute (trade association) (June 2004 - April 2007); held the following positions at Deloitte & Touche LLP: National Director of the Investment Management Regulatory Consulting Practice (1997 - 2004), Principal (2003 - 2004), Director (1998 - 2003) and Senior Manager (1997 - 1998); Assistant Director of the Division of Investment Management - Office of Disclosure and Investment Adviser Regulation of the U.S. Securities and Exchange Commission (1996 - 1997) and various positions with the Division of Investment Management – Office of Regulatory Policy (1991 - 1996) of the U.S. Securities and Exchange Commission; Associate at Ropes & Gray LLP (1987 – 1991). Oversees 57 portfolios in the OppenheimerFunds complex. Ms. Krentzman has served on the Boards of certain Oppenheimer funds since August 2014, during which time she has become familiar with the Fund’s (and other Oppenheimer funds’) financial, accounting, regulatory and investment matters and has contributed to the Boards’ deliberations. |
| |
Mary F. Miller, Trustee (since 2004) Year of Birth: 1942 | | Trustee of International House (not-for-profit) (since June 2007); Trustee of the American Symphony Orchestra (not-for-profit) (October 1998-November 2011); and Senior Vice President and General Auditor of American Express Company (financial services company) (July 1998-February 2003). Oversees 57 portfolios in the OppenheimerFunds complex. Ms. Miller has served on the Boards of certain Oppenheimer funds since August 2004, during which time she has become familiar with the Fund’s (and other Oppenheimer funds’) financial, accounting, regulatory and investment matters and has contributed to the Boards’ deliberations. |
|
| 74 OPPENHEIMER ROCHESTER AMT-FREE NEW YORK MUNICIPAL FUND |
| | |
Joel W. Motley, Trustee (since 2002) Year of Birth: 1952 | | Director of Office of Finance Federal Home Loan Bank (since September 2016); Director of Greenwall Foundation (since October 2013); Member of Board and Investment Committee of The Greenwall Foundation (since April 2013); Member of the Vestry of Trinity Wall Street (since April 2012); Director of Southern Africa Legal Services Foundation (since March 2012); Board Member of Pulitzer Center for Crisis Reporting (non-profit journalism) (since March 2011); Managing Director of Public Capital Advisors, LLC (privately-held financial advisor) (since January 2006); Managing Director of Carmona Motley, Inc. (privately-held financial advisor) (since January 2002); Director of Columbia Equity Financial Corp. (privately-held financial advisor) (2002-2007); Managing Director of Carmona Motley Hoffman Inc. (privately-held financial advisor) (January 1998-December 2001); Member of the Finance and Budget Committee of the Council on Foreign Relations, Member of the Investment Committee and Board of Human Rights Watch (since July 2000) and Member of the Investment Committee and Board of Historic Hudson Valley (since February 2010). Oversees 57 portfolios in the OppenheimerFunds complex. Mr. Motley has served on the Boards of certain Oppenheimer funds since October 2002, during which time he has become familiar with the Fund’s (and other Oppenheimer funds’) financial, accounting, regulatory and investment matters and has contributed to the Boards’ deliberations. |
| |
Joanne Pace, Trustee (since 2012) Year of Birth: 1958 | | Advisory Board Director of Massey Quick and Company, LLC (since October 2014); Board Director of Horizon Blue Cross Blue Shield of New Jersey (since November 2012); Advisory Board Director of The Alberleen Group LLC (since March, 2012); Board Member (since January 2015), Board Member of 100 Women in Hedge Funds (non-profit) (since January 2015); Advisory Council Member of Morgan Stanley Children’s Hospital (non-profit) (since May, 2012); Senior Advisor of SECOR Asset Management, LP (2010-2011); Managing Director and Chief Operating Officer of Morgan Stanley Investment Management (2006-2010); Partner and Chief Operating Officer of FrontPoint Partners, LLC (hedge fund) (2005-2006); held the following positions at Credit Suisse: Managing Director (2003-2005); Global Head of Human Resources and member of Executive Board and Operating Committee (2004-2005), Global Head of Operations and Product Control (2003-2004); held the following positions at Morgan Stanley: Managing Director (1997-2003), Controller and Principal Accounting Officer (1999-2003); Chief Financial Officer (temporary assignment) for the Oversight Committee, Long Term Capital Management (1998-1999). Lead Independent Director and Chair of the Audit and Nominating Committee of The Global Chartist Fund, LLC of Oppenheimer Asset Management (2011-2012); Board Director of Managed Funds Association (2008- 2010); Board Director of Morgan Stanley Foundation (2007-2010) and Investment Committee Chair (2008-2010). Oversees 57 portfolios in the OppenheimerFunds complex. Ms. Pace has served on the Boards of certain Oppenheimer funds since November 2012, including as an Advisory Board Member for certain Oppenheimer funds, during which time she has become familiar with the Fund’s (and other Oppenheimer funds’) financial, accounting, regulatory and investment matters and has contributed to the Board’s deliberations. For purposes of this report, Ms. Pace is identified as a Trustee. |
|
| 75 OPPENHEIMER ROCHESTER AMT-FREE NEW YORK MUNICIPAL FUND |
TRUSTEES AND OFFICERS Unaudited / Continued
| | |
| |
Daniel Vandivort, Trustee (since 2014) Year of Birth: 1954 | | Chairman and Lead Independent Director/Trustee (March 2010-September 2014), Chairman of the Audit Committee (March 2009-September 2014) and Director/ Trustee (December 2008-September 2014) of the Board of Directors/Trustees of Value Line Funds; Trustee, Board of Trustees of Huntington Disease Foundation of America (since January 2015 and June 2007-December 2013) and Treasurer, Chairman of the Audit and Finance Committee (since January 2016); Trustee, Board of Trustees, RIM Retirement Savings Plan (2005-2007); President and Chief Investment Officer, Robeco Investment Management, formerly known as Weiss Peck and Greer (January 2005-June 2007); Member, Management Committee of Robeco Investment Management (2001-2007); Chairman and Trustee of the Board of Trustees of Weiss, Peck and Greer Funds (2004-2005); Managing Director and Head of Fixed Income, Weiss, Peck and Greer (November 1994-January 2005); Managing Director and Head of Fixed Income, CS First Boston Investment Management (January 1992-November 1994); Director, Global Product Development, First Boston Asset Management (November 1989 to January 1992); Vice President, Fixed Income Sales, First Boston Corp. (May 1984-November 1989). Oversees 57 portfolios in the OppenheimerFunds complex. Mr. Vandivort has served on the Boards of certain Oppenheimer funds since 2014, during which time he has become familiar with the Fund’s (and other Oppenheimer funds’) financial, accounting, regulatory and investment matters and has contributed to the Boards’ deliberations. |
|
| INTERESTED TRUSTEES | | Mr. Steinmetz is an “Interested Trustee” because he is affiliated with the Manager and the Sub-Adviser by virtue of his positions as Chairman of the Sub-Adviser and officer and director of the Manager. Both as a Trustee and as an officer, Mr. Steinmetz serves for an indefinite term, or until his resignation, retirement, death or removal. Mr. Steinmetz’s address is 225 Liberty Street, New York, New York 10281-1008. |
| |
Arthur P. Steinmetz, Trustee (since 2015), President and Principal Executive Officer (since 2014) Year of Birth: 1958 | | Chairman of the Sub-Adviser (since January 2015); CEO and Chairman of the Manager (since July 2014), President of the Manager (since May 2013), a Director of the Manager (since January 2013), Director of the Sub-Adviser (since July 2014), President, Management Director and CEO of Oppenheimer Acquisition Corp. (the Sub-Adviser’s parent holding company) (since July 2014), and President and Director of OFI SteelPath, Inc. (since January 2013). Chief Investment Officer of the OppenheimerFunds advisory entities from (January 2013-December 2013); Executive Vice President of the Manager (January 2013-May 2013); Chief Investment Officer of the Sub-Adviser (October 2010-December 2012); Chief Investment Officer, Fixed-Income, of the Sub-Adviser (April 2009-October 2010); Executive Vice President of the Sub-Adviser (October 2009-December 2012); Director of Fixed Income of the Sub-Adviser (January 2009-April 2009); and a Senior Vice President of the Sub-Adviser (March 1993-September 2009). An officer of 101 portfolios in the OppenheimerFunds complex. |
|
| OTHER OFFICERS OF THE FUND | | The addresses of the Officers in the chart below are as follows: for Messrs. Cottier, Willis, DeMitry, Camarella, Pulire, Stein, Mss. Mossow, Lo Bessette, Foxson and Picciotto, 225 Liberty Street, New York, New York 10281-1008, for Mr. Petersen, 6803 S. Tucson Way, Centennial, Colorado 80112-3924. Each Officer serves for an indefinite term or until his or her resignation, retirement, death or removal. |
| |
Scott S. Cottier, Vice President (since 2005) Year of Birth: 1971 | | Senior Vice President of the Sub-Adviser (since January 2017) and a Senior Portfolio Manager (since September 2002). Vice President of the Sub-Adviser (September 2002-January 2017). Portfolio Manager and trader at Victory Capital Management (1999-2002). Team Leader, a Senior Portfolio Manager, an officer and a trader for the Fund and other Oppenheimer funds. |
|
| 76 OPPENHEIMER ROCHESTER AMT-FREE NEW YORK MUNICIPAL FUND |
| | |
Troy E. Willis, Vice President (since 2005) Year of Birth: 1972 | | Senior Vice President of the Sub-Adviser (since January 2017) and a Senior Portfolio Manager (since January 2006); Vice President of the Sub-Adviser (July 2009-January 2017); Assistant Vice President of the Sub-Adviser (July 2005- June 2009). Portfolio Manager of the Sub-Adviser (June 2002-December 2005). Corporate Attorney for Southern Resource Group (June 1999-July 2001). Team Leader, a Senior Portfolio Manager, an officer and a trader for the Fund and other Oppenheimer funds. |
| |
Mark R. DeMitry, Vice President (since 2009) Year of Birth: 1976 | | Vice President of the Sub-Adviser and a Senior Portfolio Manager (since July 2009); Associate Portfolio Manager of the Fund (September 2006- June 2009). Research Analyst of the Sub-Adviser (June 2003-September 2006) and a Credit Analyst of the Sub-Adviser (July 2001-May 2003). Senior Portfolio Manager, an officer and a trader for the Fund and other Oppenheimer funds. |
| |
Michael L. Camarella, Vice President (since 2009) Year of Birth: 1976 | | Vice President of the Sub-Adviser and a Senior Portfolio Manager (since January 2011); Assistant Vice President of the Sub-Adviser (July 2009-December 2010); Associate Portfolio Manager of the Sub-Adviser (January 2008-December 2010). Research Analyst of the Sub-Adviser (April 2006-December 2007) and a Credit Analyst of the Sub-Adviser (June 2003-March 2006). Senior Portfolio Manager, an officer and a trader for the Fund and other Oppenheimer funds. |
| |
Charles S. Pulire, Vice President (since 2011) Year of Birth: 1977 | | Vice President of the Sub-Adviser and a Senior Portfolio Manager (since February 2013); Assistant Vice President of the Sub-Adviser (December 2010-January 2013); Research Analyst of the Manager (February 2008-November 2010); Credit Analyst of the Sub-Adviser (May 2006-January 2008). Senior Portfolio Manager, an officer and a trader for the Fund and other Oppenheimer funds. |
| |
Elizabeth S. Mossow, Vice President (since 2013) Year of Birth: 1978 | | Vice President of the Sub-Adviser (since January 2016) and Senior Portfolio Manager of the Sub-Adviser (since January 2017); Portfolio Manager of the Sub-Adviser (January 2016-January 2017); Assistant Vice President of the Sub-Adviser (January 2011-January 2016). Associate Portfolio Manager (June 2013-January 2016). Research Analyst of the Sub-Adviser (June 2011-June 2013) and was a Credit Analyst of the Sub-Adviser (May 2007-May 2011). She was a Risk Management Analyst at Manning & Napier Associates (September 2006-May 2007); Analyst/Trading Assistant at The Baupost Group (August 2000-March 2006). Portfolio Manager, an officer and a trader for the Fund and other Oppenheimer funds. |
| |
Richard A. Stein, Vice President (since 2007) Year of Birth: 1957 | | Director of the Rochester Credit Analysis team (since March 2004); Senior Vice President of the Sub-Adviser (since June 2011) and a Vice President of the Sub-Adviser (November 1997-May 2011); heads up the Rochester Credit Analysis team (since May 1993). |
| |
Cynthia Lo Bessette, Secretary and Chief Legal Officer (since 2016) Year of Birth: 1969 | | Executive Vice President, General Counsel and Secretary of the Manager (since February 2016); Senior Vice President and Deputy General Counsel of the Manager (March 2015-February 2016); Chief Legal Officer of the Sub-Adviser and the Distributor (since February 2016); Vice President, General Counsel and Secretary of Oppenheimer Acquisition Corp. (since February 2016); General Counsel of OFI SteelPath, Inc., VTL Associates, LLC and Index Management Solutions, LLC (since February 2016); Chief Legal Officer of OFI Global Institutional, Inc., HarbourView Asset Management Corporation, OFI Global Trust Company, Oppenheimer Real Asset Management, Inc., OFI Private Investments Inc., Shareholder Services, Inc. and Trinity Investment Management Corporation (since February 2016); Corporate Counsel (February 2012-March 2015) and Deputy Chief Legal Officer (April 2013-March 2015) of Jennison Associates LLC; Assistant General Counsel |
|
| 77 OPPENHEIMER ROCHESTER AMT-FREE NEW YORK MUNICIPAL FUND |
TRUSTEES AND OFFICERS Unaudited / Continued
| | |
Cynthia Lo Bessette, continued | | (April 2008-September 2009) and Deputy General Counsel (October 2009-February 2012) of Lord Abbett & Co. LLC. An officer of 101 portfolios in the OppenheimerFunds complex. |
| |
Jennifer Foxson, Vice President and Chief Business Officer (since 2014) Year of Birth: 1969 | | Senior Vice President of OppenheimerFunds Distributor, Inc. (since June 2014); Vice President of OppenheimerFunds Distributor, Inc. (April 2006-June 2014); Vice President of the Sub-Adviser (January 1998-March 2006); Assistant Vice President of the Sub-Adviser (October 1991-December 1998). An officer of 101 portfolios in the OppenheimerFunds complex. |
| |
Mary Ann Picciotto, Chief Compliance Officer and Chief Anti-Money Laundering Officer (since 2014) Year of Birth: 1973 | | Senior Vice President and Chief Compliance Officer of the Manager (since March 2014); Chief Compliance Officer of the Sub-Adviser, OFI SteelPath, Inc., OFI Global Trust Company, OFI Global Institutional, Inc., Oppenheimer Real Asset Management, Inc., OFI Private Investments, Inc., Harborview Asset Management Corporation, Trinity Investment Management Corporation, and Shareholder Services, Inc. (since March 2014); Managing Director of Morgan Stanley Investment Management Inc. and certain of its various affiliated entities; Chief Compliance Officer of various Morgan Stanley Funds (May 2010-January 2014); Chief Compliance Officer of Morgan Stanley Investment Management Inc. (April 2007-January 2014). An officer of 101 portfolios in the OppenheimerFunds complex. |
| |
Brian S. Petersen, Treasurer and Principal Financial & Accounting Officer (since 1999) Year of Birth: 1970 | | Senior Vice President of the Manager (since January 2017); Vice President of the Manager (January 2013-January 2017); Vice President of the Sub-Adviser (February 2007-December 2012); Assistant Vice President of the Sub-Adviser (August 2002- 2007). An officer of 101 portfolios in the OppenheimerFunds complex. |
The Fund’s Statement of Additional Information contains additional information about the Fund’s Trustees and Officers and is available without charge upon request by calling 1.800.CALL OPP (225.5677).
|
| 78 OPPENHEIMER ROCHESTER AMT-FREE NEW YORK MUNICIPAL FUND |
OPPENHEIMER ROCHESTER AMT-FREE NEW YORK MUNICIPAL FUND
| | |
| |
| Manager | | OFI Global Asset Management, Inc. |
| |
| Sub-Adviser | | OppenheimerFunds, Inc. |
| |
| Distributor | | OppenheimerFunds Distributor, Inc. |
| |
Transfer and Shareholder Servicing Agent | | OFI Global Asset Management, Inc. |
| |
| Sub-Transfer Agent | | Shareholder Services, Inc. DBA OppenheimerFunds Services |
| |
Independent Registered Public Accounting Firm | | KPMG LLP |
| |
| Legal Counsel | | Kramer Levin Naftalis & Frankel LLP |
© 2017 OppenheimerFunds, Inc. All rights reserved.
|
| 79 OPPENHEIMER ROCHESTER AMT-FREE NEW YORK MUNICIPAL FUND |
PRIVACY POLICY NOTICE
As an Oppenheimer fund shareholder, you are entitled to know how we protect your personal information and how we limit its disclosure.
Information Sources
We obtain nonpublic personal information about our shareholders from the following sources:
| ● | | Applications or other forms |
| ● | | When you create a user ID and password for online account access |
| ● | | When you enroll in eDocs Direct,SM our electronic document delivery service |
| ● | | Your transactions with us, our affiliates or others |
| ● | | Technologies on our website, including: “cookies” and web beacons, which are used to collect data on the pages you visit and the features you use. |
If you visit oppenheimerfunds.com and do not log on to the secure account information areas, we do not obtain any personal information about you. When you do log on to a secure area, we do obtain your user ID and password to identify you. We also use this information to provide you with products and services you have requested, to inform you about products and services that you may be interested in and assist you in other ways.
We do not collect personal information through our website unless you willingly provide it to us, either directly by email or in those areas of the website that request information. In order to update your personal information (including your mailing address, email address and phone number) you must first log on and visit your user profile.
If you have set your browser to warn you before accepting cookies, you will receive the warning message with each cookie. You can refuse cookies by turning them off in your browser. However, doing so may limit your access to certain sections of our website.
We use cookies to help us improve and manage our website. For example, cookies help us recognize new versus repeat visitors to the site, track the pages visited, and enable some special features on the website. This data helps us provide a better service for our website visitors.
Protection of Information
We do not disclose any non-public personal information (such as names on a customer list) about current or former customers to anyone, except as permitted by law.
Disclosure of Information
Copies of confirmations, account statements and other documents reporting activity in your fund accounts are made available to your financial advisor (as designated by you). We may also use details about you and your investments to help us, our financial service affiliates, or firms that jointly market their financial products and services with ours, to better serve your investment needs or suggest educational material that may be of interest to you. If this requires us to provide you with an opportunity to “opt in” or “opt out” of such information sharing with a firm not affiliated with us, you will receive notification on how to do so, before any such sharing takes place.
Right of Refusal
We will not disclose your personal information to unaffiliated third parties (except as permitted by law), unless we first offer you a reasonable opportunity to refuse or “opt out” of such disclosure.
|
| 80 OPPENHEIMER ROCHESTER AMT-FREE NEW YORK MUNICIPAL FUND |
Internet Security and Encryption
In general, the email services provided by our website are encrypted and provide a secure and private means of communication with us. To protect your own privacy, confidential and/or personal information should only be communicated via email when you are advised that you are using a secure website. As a security measure, we do not include personal or account information in non-secure emails, and we advise you not to send such information to us in non-secure emails. Instead, you may take advantage of the secure features of our website to encrypt your email correspondence. To do this, you will need to use a browser that supports Secure Sockets Layer (SSL) protocol.
| ● | | All transactions, including redemptions, exchanges and purchases, are secured by SSL and 256-bit encryption. SSL is used to establish a secure connection between your PC and OppenheimerFunds’ server. It transmits information in an encrypted and scrambled format. |
| ● | | Encryption is achieved through an electronic scrambling technology that uses a “key” to code and then decode the data. Encryption acts like the cable converter box you may have on your television set. It scrambles data with a secret code so that no one can make sense of it while it is being transmitted. When the data reaches its destination, the same software unscrambles the data. |
| ● | | You can exit the secure area by either closing your browser, or for added security, you can use the Log Out button before you close your browser. |
Other Security Measures
We maintain physical, electronic and procedural safeguards to protect your personal account information. Our employees and agents have access to that information only so that they may offer you products or provide services, for example, when responding to your account questions.
How You Can Help
You can also do your part to keep your account information private and to prevent unauthorized transactions. If you obtain a user ID and password for your account, safeguard that information. Also, take special precautions when accessing your account on a computer used by others.
Who We Are
This joint notice describes the privacy policies of the Oppenheimer funds, OppenheimerFunds, Inc., each of its investment adviser subsidiaries, OppenheimerFunds Distributor, Inc. and OFI Global Trust Co. It applies to all Oppenheimer fund accounts you presently have, or may open in the future, using your Social Security number—whether or not you remain a shareholder of our funds. This notice was last updated November 2016. In the event it is updated or changed, we will post an updated notice on our website at oppenheimerfunds.com. If you have any questions about this privacy policy, write to us at P.O. Box 5270, Denver, CO 80217-5270, email us by clicking on the Contact Us section of our website at oppenheimerfunds.com or call us at 1.800.CALL OPP (225.5677).
|
| 81 OPPENHEIMER ROCHESTER AMT-FREE NEW YORK MUNICIPAL FUND |
THIS PAGE INTENTIONALLY LEFT BLANK.
|
| 82 OPPENHEIMER ROCHESTER AMT-FREE NEW YORK MUNICIPAL FUND |
THIS PAGE INTENTIONALLY LEFT BLANK.
|
| 83 OPPENHEIMER ROCHESTER AMT-FREE NEW YORK MUNICIPAL FUND |
THIS PAGE INTENTIONALLY LEFT BLANK.
|
| 84 OPPENHEIMER ROCHESTER AMT-FREE NEW YORK MUNICIPAL FUND |
THIS PAGE INTENTIONALLY LEFT BLANK.
|
| 85 OPPENHEIMER ROCHESTER AMT-FREE NEW YORK MUNICIPAL FUND |
THIS PAGE INTENTIONALLY LEFT BLANK.
|
| 86 OPPENHEIMER ROCHESTER AMT-FREE NEW YORK MUNICIPAL FUND |
THIS PAGE INTENTIONALLY LEFT BLANK.
|
| 87 OPPENHEIMER ROCHESTER AMT-FREE NEW YORK MUNICIPAL FUND |
| | |
| |  |
| |
| | Visit us at oppenheimerfunds.com for 24-hr access to account information and transactions or call us at 800.CALL OPP (800.225.5677) for 24-hr automated information and automated transactions. Representatives also available Mon–Fri 8am-8pm ET. |
| |
Visit Us oppenheimerfunds.com | | |
| |
Call Us 800 225 5677 | | |
| |
Follow Us 
| | Oppenheimer funds are distributed by OppenheimerFunds Distributor, Inc. 225 Liberty Street, New York, NY 10281-1008 © 2017 OppenheimerFunds Distributor, Inc. All rights reserved. RA0360.001.0917 November 21, 2017 |
Item 2. Code of Ethics.
The registrant has adopted a code of ethics that applies to the registrant’s principal executive officer, principal financial officer, principal accounting officer or controller or persons performing similar functions.
Item 3. Audit Committee Financial Expert.
The Board of Trustees of the registrant has determined that Joanne Pace, the Board’s Audit Committee Chairwoman, is an audit committee financial expert and that Ms. Pace is “independent” for purposes of this Item 3.
Item 4. Principal Accountant Fees and Services.
The principal accountant for the audit of the registrant’s annual financial statements billed $51,400 in fiscal 2017 and $49,700 in fiscal 2016.
The principal accountant for the audit of the registrant’s annual financial statements billed $4,050 in fiscal 2017 and $3,929 in fiscal 2016.
The principal accountant for the audit of the registrant’s annual financial statements billed $386,986 in fiscal 2017 and $598,285 in fiscal 2016 to the registrant’s investment adviser or any entity controlling, controlled by, or under common control with the adviser that provides ongoing services to the registrant.
Such services include: Internal control reviews, GIPS attestation procedures, custody audits, and additional audit services
The principal accountant for the audit of the registrant’s annual financial statements billed no such fees in fiscal 2017 and no such fees in fiscal 2016.
The principal accountant for the audit of the registrant’s annual financial statements billed $286,402 in fiscal 2017 and $45,432 in fiscal 2016 to the registrant’s investment adviser or any entity controlling, controlled by, or under common control with the adviser that provides ongoing services to the registrant.
Such services include: tax compliance, tax planning and tax advice. Tax compliance generally involves preparation of original and amended tax returns, claims for a refund and tax payment-planning services. Tax planning and tax advice includes assistance with tax audits and appeals, tax advice related to mergers and acquisitions and requests for rulings or technical advice from taxing authorities.
The principal accountant for the audit of the registrant’s annual financial statements billed no such fees in fiscal 2017 and no such fees in fiscal 2016.
The principal accountant for the audit of the registrant’s annual financial statements billed no such fees in fiscal 2017 and no such fees in fiscal 2016 to the registrant’s investment adviser or any entity controlling, controlled by, or under common control with the adviser that provides ongoing services to the registrant.
Such fees would include the cost to the principal accountant of attending audit committee meetings and consultations regarding the registrant’s retirement plan with respect to its Trustees.
| (e) | (1) During its regularly scheduled periodic meetings, the registrant’s audit committee will pre-approve all audit, audit-related, tax and other services to be provided by the principal accountants of the registrant. |
The audit committee has delegated pre-approval authority to its Chairwoman for any subsequent new engagements that arise between regularly scheduled meeting dates provided that any fees such pre-approved are presented to the audit committee at its next regularly scheduled meeting.
Under applicable laws, pre-approval of non-audit services may be waived provided that: 1) the aggregate amount of all such services provided constitutes no more than five percent of the total amount of fees paid by the registrant to its principal accountant during the fiscal year in which services are provided 2) such services were not recognized by the registrant at the time of engagement as non-audit services and 3) such services are promptly brought to the attention of the audit committee of the registrant and approved prior to the completion of the audit.
(2) 0%
| (f) | Not applicable as less than 50%. |
| (g) | The principal accountant for the audit of the registrant’s annual financial statements billed $677,438 in fiscal 2017 and $647,646 in fiscal 2016 to the registrant and the registrant’s investment adviser or any entity controlling, controlled by, or under common control with the adviser that provides ongoing services to the registrant related to non-audit fees. Those billings did not include any prohibited non-audit services as defined by the Securities Exchange Act of 1934. |
| (h) | The registrant’s audit committee of the board of Trustees has considered whether the provision of non-audit services that were rendered to the registrant’s investment adviser, and any entity controlling, controlled by, or under common control with the investment adviser that provides ongoing services to the registrant that were not pre-approved pursuant to paragraph (c)(7)(ii) of Rule 2-01 of Regulation S-X is compatible with maintaining the principal accountant’s independence. No such services were rendered. |
Item 5. Audit Committee of Listed Registrants
Not applicable.
Item 6. Schedule of Investments.
a) Not applicable. The complete schedule of investments is included in Item 1 of this Form N-CSR.
b) Not applicable.
Item 7. Disclosure of Proxy Voting Policies and Procedures for Closed-End Management Investment Companies.
Not applicable.
Item 8. Portfolio Managers of Closed-End Management Investment Companies.
Not applicable.
Item 9. Purchases of Equity Securities by Closed-End Management Investment Company and Affiliated Purchasers.
Not applicable.
Item 10. Submission of Matters to a Vote of Security Holders.
The Fund’s Governance Committee Provisions with Respect to Nominations of Directors/Trustees to the Respective Boards
None
Item 11. Controls and Procedures.
Based on their evaluation of the registrant’s disclosure controls and procedures (as defined in rule 30a-3(c) under the Investment Company Act of 1940 (17 CFR 270.30a-3(c)) as of 9/30/2017, the registrant’s principal executive officer and principal financial officer found the registrant’s disclosure controls and procedures to provide reasonable assurances that information required to be disclosed by the registrant in the reports that it files under the Securities Exchange Act of 1934 (a) is accumulated and communicated to registrant’s management, including its principal executive officer and principal financial officer, to allow timely decisions regarding required disclosure, and (b) is recorded, processed, summarized and reported, within the time periods specified in the rules and forms adopted by the U.S. Securities and Exchange Commission.
There have been no changes in the registrant’s internal controls over financial reporting that occurred during the registrant’s second fiscal quarter of the period covered by this report that
have materially affected, or are reasonably likely to materially affect, the registrant’s internal control over financial reporting.
Item 12. Exhibits.
| (a) | (1) Exhibit attached hereto. |
(2) Exhibits attached hereto.
(3) Not applicable.
| (b) | Exhibit attached hereto. |
SIGNATURES
Pursuant to the requirements of the Securities Exchange Act of 1934 and the Investment Company Act of 1940, the registrant has duly caused this report to be signed on its behalf by the undersigned, thereunto duly authorized.
Oppenheimer Rochester AMT - Free New York Municipal Fund
| | |
| By: | | /s/ Arthur P. Steinmetz |
| | Arthur P. Steinmetz |
| | Principal Executive Officer |
| Date: | | 11/14/2017 |
Pursuant to the requirements of the Securities Exchange Act of 1934 and the Investment Company Act of 1940, this report has been signed below by the following persons on behalf of the registrant and in the capacities and on the dates indicated.
| | |
| By: | | /s/ Arthur P. Steinmetz |
| | Arthur P. Steinmetz |
| | Principal Executive Officer |
| Date: | | 11/14/2017 |
| |
| By: | | /s/ Brian S. Petersen |
| | Brian S. Petersen |
| | Principal Financial Officer |
| Date: | | 11/14/2017 |