UNITED STATES
SECURITIES AND EXCHANGE COMMISSION
WASHINGTON, D.C. 20549
FORM N-CSR
CERTIFIED SHAREHOLDER REPORT OF REGISTERED MANAGEMENT
INVESTMENT COMPANIES
Investment Company Act file number 811-4054
Oppenheimer AMT - Free New York Municipals
(Exact name of registrant as specified in charter)
6803 South Tucson Way, Centennial, Colorado 80112-3924
(Address of principal executive offices) (Zip code)
Robert G. Zack, Esq.
OppenheimerFunds, Inc.
Two World Financial Center, New York, New York 10281-1008
(Name and address of agent for service)
Registrant’s telephone number, including area code: (303) 768-3200
Date of fiscal year end: September 30
Date of reporting period: 09/30/2008
Item 1. Reports to Stockholders.
| September 30, 2008 Oppenheimer Management AMT-Free New York Commentaries and Municipals Annual Report MANAGEMENT COMMENTARIES Market Recap and Outlook Listing of Top Holdings ANNUAL REPORT Fund Performance Discussion Listing of Investments Financial Statements “After 25 years in the business of municipal fund management, I still don’t pretend to have seen it all. But, allowing tax-free yields to compound over time has clearly been a winning strategy for shareholders.” — Ronald H. Fielding, Chief Strategist, Senior Vice President and Senior Portfolio Manager, OppenheimerFunds/Rochester 1234 |
TOP HOLDINGS AND ALLOCATIONS
Top Ten Categories
| | | | | |
| Tobacco—Master Settlement Agreement | | | 23.4 | % |
| Higher Education | | | 9.9 | |
| General Obligation | | | 6.2 | |
| Highways/Commuter Facilities | | | 5.9 | |
| Hospital/Health Care | | | 5.6 | |
| Sales Tax Revenue | | | 4.4 | |
| Not-for-Profit Organizations | | | 4.1 | |
| Electric Utilities | | | 4.1 | |
| Special Tax | | | 4.1 | |
| Real Estate | | | 3.7 | |
Portfolio holdings are subject to change. Percentages are as of September 30, 2008, and are based on the total market value of investments.
Credit Allocation
| | | | | |
| AAA | | | 4.5 | % |
| AA | | | 16.0 | |
| A | | | 19.2 | |
| BBB | | | 44.9 | |
| BB or lower | | | 15.4 | |
Allocations are subject to change. Percentages are as of September 30, 2008, and are dollar-weighted based on the total market value of investments. Market value, the total value of the Fund’s securities, does not include cash. Securities rated by any rating organization are included in the equivalent Standard & Poor’s rating category in the allocation above. The allocation above also includes unrated securities whose ratings have been assigned by the Manager; these unrated securities, currently 18.68% of the Fund’s market value, are deemed comparable in the Manager’s judgment to the rated securities in each category. Credit ratings of AAA, AA, A and BBB and their equivalents denote investment-grade securities.
17 | OPPENHEIMER AMT-FREE NEW YORK MUNICIPALS
FUND PERFORMANCE DISCUSSION
How has the Fund performed? Below is a discussion by OppenheimerFunds, Inc., of the Fund’s performance during its fiscal year ended September 30 2008, followed by a graphical comparison of the Fund’s performance to an appropriate broad-based market index.
Management’s Discussion of Fund Performance. In a 12-month period marked by significant turbulence in the world’s equity and credit markets and by broad price volatility as investors adjusted their perspectives on risk tolerance, the net asset value (NAV) of Oppenheimer AMT-Free New York Municipals’s Class A shares fell and the Fund’s total returns were negative. According to Lipper Inc., the Fund nonetheless provided the third highest level of tax-free income among its peer funds as of September 30, 2008, and more income, on a tax-equivalent basis, than many corporate fixed-income alternatives. Based on the distribution for the 28-day accrual period ended September 23, 2008, the distribution yield at the end of this reporting period for the Fund’s Class A shares was 5.25% at NAV.1
Oppenheimer AMT-Free New York Municipals distributed dividends of 57.4 cents per Class A share this reporting period, including a small amount of ordinary income. The monthly dividend distribution per Class A share of Oppenheimer AMT-Free New York Municipals increased from 4.7 cents to 4.8 cents with the March 2008 payout and to 4.9 cents with the July 2008 payout. No capital gains were distributed this reporting period.
At the end of this reporting period, the Fund had an overall credit quality of A-minus and all bonds in the Fund’s portfolio were current in their scheduled interest payments.
As the charts on pages 22 to 24 show, the Fund’s total returns were negative this reporting period as investors grew increasingly concerned about risk and widening credit spreads. Credit spread widening is typically more detrimental to the sectors and types of securities the Fund favors than to our Fund’s benchmark.
Two acquisitions this reporting period illustrate how the Fund benefited from its entry into the auction rate securities (ARS) market. An ARS is a long-term municipal security with an interest rate that resets at a specific frequency (typically 7 to 35 days) through an auction process. Many municipal auctions failed this reporting period because bidders were in short supply. These auction failures created financial headaches for investors who bought bonds with the assumption that their investments would remain highly liquid, and they also pushed the short-term rates on some bonds into the double digits. Intrigued by the opportunity to purchase high-yielding bonds, we applied our credit research expertise to the municipal auction inventory and identified some highly attractive bonds with resetting rates. For example, in mid-February, the Fund purchased insured Puerto Rico
1. Falling share prices artificially increase yields.
18 | OPPENHEIMER AMT-FREE NEW YORK MUNICIPALS
general obligation bonds with a yield of 10% and AAA-rated civic facility revenue bonds with a yield of 9% that were issued by the Dutchess County (N.Y.) IDA to support Vassar Brothers Medical Center. Even though these bonds were sold by month’s end as rates became less favorable, both helped the Fund deliver high levels of tax-free yield to investors this reporting period, despite their brief tenures in our portfolio. By September 30, 2008, more than $100 billion of municipal auction rate securities had been refinanced into lower-yielding credit structures, and the municipal auctions became far less attractive to yield-seeking investors. The Fund’s participation in the municipal auctions, we believe, demonstrates the Rochester investment team’s flexibility and responsiveness to evolving market conditions.
The Fund continued to maintain sizable holdings in bonds backed by proceeds from the tobacco Master Settlement Agreement (the MSA), the national litigation settlement with U.S. tobacco manufacturers. The Rochester investment team was among the early believers in the structural and yield advantages of these types of bonds, which are backed by state and/or territory proceeds from a national litigation settlement with tobacco manufacturers. At the end of this reporting period, MSA-backed tobacco bonds accounted for nearly one-quarter of Fund investments and comprised the Fund’s largest sector.2
The Fund’s current weighting in MSA-backed bonds reflects our belief that these bonds offer an exceptional opportunity for yield-seeking investors. Over the years, many tobacco bonds have repaid principal earlier than their scheduled final maturity. Additionally, interest payments and scheduled payments of principal on the tobacco bonds this Fund holds have always been made in a timely manner. The widening of credit spreads has continued to exert pressure on the prices of tobacco bonds this reporting period, and we took advantage of this market condition to add high-yielding MSA-backed securities to the Fund’s portfolio.
As we have seen, industry litigation can create headline-induced volatility in this sector. We nonetheless continue to believe that the long-term impact of tobacco-related court cases should be negligible. If anything, the latest headlines have been quite favorable. In early April, a three-judge panel in federal appeals court reversed an earlier decision that had granted class-action status to smokers of “light” cigarettes. The panel ruled that individual cases were too distinct from one another to qualify as a “class.” In June, the U.S. Supreme Court announced that it would take a third look at a long-running dispute
2. Bond investments may be vulnerable to economic and/or legislative events that affect issuers in a particular municipal market sector. Annual payments by MSA-participating manufacturers, for example, hinge on many factors, including annual domestic cigarette shipments, inflation and the relative market share of non-participating manufacturers. While consumption has largely been in line with the assumptions used to structure MSA-backed bonds, future MSA payments could be reduced if consumption were to fall more rapidly than originally forecast.
19 | OPPENHEIMER AMT-FREE NEW YORK MUNICIPALS
FUND PERFORMANCE DISCUSSION
between the family of a deceased smoker and Philip Morris. Twice before, the Supreme Court has ruled that the punitive damages awarded in Oregon were excessive. The Philip Morris case is one of two tobacco-related cases on the Supreme Court’s fall docket. The Court will also rule on a dispute about which laws regulate the advertising of “light” cigarettes.
In the reporting period ended September 30, 2008, our in-house credit research team continued to identify yield-enhancing municipal issues in the Commonwealth of Puerto Rico, despite ongoing economic difficulties and political scandals there. Most of these investments (35.9% of the Fund’s net assets as of September 30, 2008) involve “creatures of the state”—which are supported by taxes and help finance electric utilities, education and highways—versus project financing. As such, we remain confident in the government’s ability to collect the taxes and make bond payments using tax proceeds.
The Fund continues to monitor news about Puerto Rico’s government. In March 2008, many islanders were stunned by the indictment of Gov. Anibal Acevedo Vila and members of his campaign committee on charges that included wire fraud and conspiracy. Five charges were added in August, bringing the total to 24. The charges relate to allegations that the governor illegally raised money to pay off debts incurred while campaigning for his terms as the island’s delegate to Congress. The governor has denied any misuse of public funds, and the Government Development Bank, the commonwealth’s financing arm, has offered assurances that Puerto Rico’s financial obligations would be honored.3 Gov. Vila’s trial is scheduled to begin in February 2009.
We are also closely following news about the commonwealth’s creditworthiness. In November 2007, Moody’s revised its outlook on the commonwealth’s debt to stable, from negative, while maintaining its rating of Baa3. One month later, S&P upgraded the long-term debt issued by the Government Development Bank to BBB, from BBB-minus. In June 2008, S&P placed the A-plus-rated Puerto Rico Sales Tax Financing Corporation on credit watch, with negative implications, after Gov. Vila proposed suspending sales and use taxes. The credit watch was lifted in September, because lawmakers did not vote on this proposal before the end of their legislative session. Importantly, the commonwealth, its agencies and the Government Development Bank retained their investment-grade ratings from S&P and Moody’s this reporting period, and both consider the outlook to be stable.
The Fund continued to invest in municipal inverse-floating-rate securities this reporting period. These are tax-exempt securities whose interest payments move inversely to changes in short-term interest rates. With generally higher tax-free yields than regular
3. Gov. Vila was defeated by Luis Fortuno on Election Day 2008.
20 | OPPENHEIMER AMT-FREE NEW YORK MUNICIPALS
fixed-rate bonds of comparable maturity and credit quality, these securities helped the Fund provide higher dividends this reporting period as the yield curve steepened. However, these securities often face greater price volatility than comparable fixed-rate bonds, and the volatility this reporting period detracted from the Fund’s overall performance.
The Fund also invested in percentage of LIBOR notes (PLNs), a type of bond structure that experienced price declines this reporting period when another U.S. financial institution sold a large position at a loss. This move depressed the prices of PLNs across the board even though PLN credit quality, which varies among tax-free issuers, generally remained solid. PLNs are bonds that pay a variable rate based on LIBOR and most are A-rated or better. We continue to believe that this type of bond will be a valuable source of revenue once more normal rate relations are in place and, therefore, remain invested in a diverse basket of bonds with this structure.
Our approach to municipal bond investing is flexible and responsive to market conditions; our strategies are intended to balance many different types of risk to reduce overall portfolio risk. Shareholders should note that market conditions during this reporting period did not affect the Fund’s overall investment strategies or cause it to pay any capital gain distributions. In closing, we believe that the Fund’s structure and composition as well as our time-tested strategies will continue to benefit long-term investors through interest rate and economic cycles.
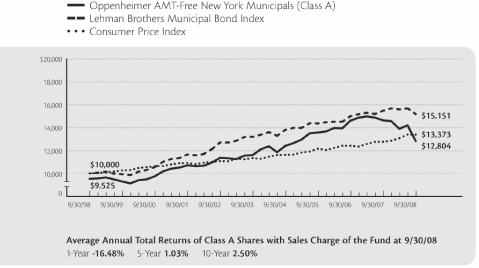
Comparing the Fund’s Performance to the Market. The graphs that follow show the performance of a hypothetical $10,000 investment in each class of shares of the Fund held until September 30, 2008. In the case of Class A, Class B and Class C shares, performance is measured over a ten-fiscal-year period. The Fund’s performance reflects the deduction of the maximum initial sales charge on Class A shares, the applicable contingent deferred sales charge on Class B and Class C shares, and reinvestments of all dividends and capital gains distributions.
The Fund’s performance is compared to the performance of the Lehman Brothers Municipal Bond Index, an unmanaged index of a broad range of investment grade municipal bonds that is widely regarded as a measure of the performance of the general municipal bond market, and the Consumer Price Index, a non-securities index that measures change in the inflation rate. Index performance reflects the reinvestment of dividends but does not consider the effect of capital gains or transaction costs, and none of the data in the graphs that follow shows the effect of taxes. The Fund’s performance reflects the effects of Fund business and operating expenses. While index comparisons may be useful to provide a benchmark for the Fund’s performance, it must be noted that the Fund’s investments are not limited to the securities in the index.
21 | OPPENHEIMER AMT-FREE NEW YORK MUNICIPALS
FUND PERFORMANCE DISCUSSION
Class A Shares
Comparison of Change in Value of $10,000 Hypothetical Investments in:
22 | OPPENHEIMER AMT-FREE NEW YORK MUNICIPALS
Class B Shares
Comparison of Change in Value of $10,000 Hypothetical Investments in:
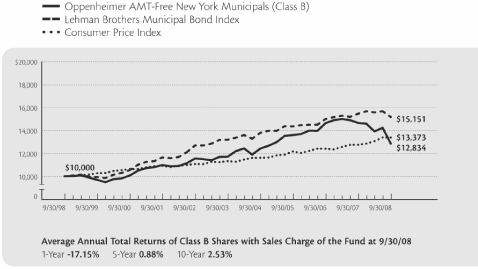
The performance data quoted represents past performance, which does not guarantee future results. The investment return and principal value of an investment in the Fund will fluctuate so that an investor’s shares, when redeemed, may be worth more or less than their original cost. Current performance may be lower or higher than the performance quoted. For performance data current to the most recent month end, visit us at www.oppenheimerfunds.com, or call us at 1.800.525.7048. Fund returns include changes in share price, reinvestment of dividends and capital gains, and the applicable sales charge: for Class A shares, the current maximum initial sales charge of 4.75%; for Class B shares, the contingent deferred sales charge of 5% (1-year) and 2% (5-year); and for Class C shares, the contingent 1% deferred sales charge for the 1-year period. Because Class B shares convert to Class A shares 72 months after purchase, the 10-year return for Class B shares uses Class A performance for the period after conversion. See page 25 for further information.
23 | OPPENHEIMER AMT-FREE NEW YORK MUNICIPALS
FUND PERFORMANCE DISCUSSION
Class C Shares
Comparison of Change in Value of $10,000 Hypothetical Investments in:
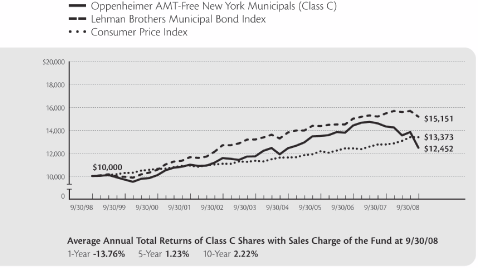
The performance data quoted represents past performance, which does not guarantee future results. The investment return and principal value of an investment in the Fund will fluctuate so that an investor’s shares, when redeemed, may be worth more or less than their original cost. Current performance may be lower or higher than the performance quoted. For performance data current to the most recent month end, visit us at www.oppenheimerfunds.com, or call us at 1.800.525.7048. Fund returns include changes in share price, reinvestment of dividends and capital gains, and the applicable sales charge: for Class A shares, the current maximum initial sales charge of 4.75%; for Class B shares, the contingent deferred sales charge of 5% (1-year) and 2% (5-year); and for Class C shares, the contingent 1% deferred sales charge for the 1-year period. Because Class B shares convert to Class A shares 72 months after purchase, the 10-year return for Class B shares uses Class A performance for the period after conversion. See page 25 for further information.
24 | OPPENHEIMER AMT-FREE NEW YORK MUNICIPALS
NOTES
Total returns and the ending account values in the graphs include changes in share price and reinvestment of dividends and capital gains distributions in a hypothetical investment for the periods shown. The Fund’s total returns shown do not reflect the deduction of income taxes on an individual’s investment. Taxes may reduce your actual investment returns on any gains you may realize if you sell your shares.
Investors should consider the Fund’s investment objectives, risks, and other charges and expenses carefully before investing. The Fund’s prospectus contains this and other information about the Fund, and may be obtained by asking your financial advisor, calling us at 1.800.525.7048 or visiting our website at www.oppenheimerfunds.com. Read the prospectus carefully before investing.
The Fund’s investment strategy and focus can change over time. The mention of specific fund holdings does not constitute a recommendation by OppenheimerFunds, Inc.
Class A shares were first publicly offered on 8/16/84. Unless otherwise noted, Class A returns include the current maximum initial sales charge of 4.75%.
Class B shares of the Fund were first publicly offered on 3/1/93. Unless otherwise noted, Class B returns include the applicable contingent deferred sales charge of 5% (1-year) and 2% (5-year). Because Class B shares convert to Class A shares 72 months after purchase, the 10-year return for Class B uses Class A performance for the period after conversion. Class B shares are subject to an annual 0.75% asset-based sales charge.
Class C shares of the Fund were first publicly offered on 8/29/95. Unless otherwise noted, Class C returns include the contingent deferred sales charge of 1% for the 1-year period. Class C shares are subject to an annual 0.75% asset-based sales charge.
An explanation of the calculation of performance is in the Fund’s Statement of Additional Information.
25 | OPPENHEIMER AMT-FREE NEW YORK MUNICIPALS
FUND EXPENSES
Fund Expenses. As a shareholder of the Fund, you incur two types of costs: (1) transaction costs, which may include sales charges (loads) on purchase payments, contingent deferred sales charges on redemptions; and redemption fees (if applicable); and (2) ongoing costs, including management fees; distribution and service fees; and other Fund expenses. These examples are intended to help you understand your ongoing costs (in dollars) of investing in the Fund and to compare these costs with the ongoing costs of investing in other mutual funds.
The examples are based on an investment of $1,000.00 invested at the beginning of the period and held for the entire 6-month period ended September 30, 2008.
Actual Expenses. The first section of the table provides information about actual account values and actual expenses. You may use the information in this section for the class of shares you hold, together with the amount you invested, to estimate the expense that you paid over the period. Simply divide your account value by $1,000.00 (for example, an $8,600.00 account value divided by $1,000.00 = 8.60), then multiply the result by the number in the first section under the heading entitled “Expenses Paid During Period” to estimate the expenses you paid on your account during this period.
Hypothetical Example for Comparison Purposes. The second section of the table provides information about hypothetical account values and hypothetical expenses based on the Fund’s actual expense ratio for each class of shares, and an assumed rate of return of 5% per year for each class before expenses, which is not the actual return. The hypothetical account values and expenses may not be used to estimate the actual ending account balance or expenses you paid for the period. You may use this information to compare the ongoing costs of investing in the Fund and other funds. To do so, compare this 5% hypothetical example for the class of shares you hold with the 5% hypothetical examples that appear in the shareholder reports of the other funds.
Please note that the expenses shown in the table are meant to highlight your ongoing costs only and do not reflect any transactional costs, such as front-end or contingent deferred sales charges (loads), or a $12.00 fee imposed annually on accounts valued at less than $500.00 (subject to exceptions described in
26 | OPPENHEIMER AMT-FREE NEW YORK MUNICIPALS
the Statement of Additional Information). Therefore, the “hypothetical” section of the table is useful in comparing ongoing costs only, and will not help you determine the relative total costs of owning different funds. In addition, if these transactional costs were included, your costs would have been higher.
| | | | | | | | | | | | | |
| | | Beginning | | Ending | | Expenses |
| | | Account | | Account | | Paid During |
| | | Value | | Value | | 6 Months Ended |
| | | April 1, 2008 | | September 30, 2008 | | September 30, 2008 |
| |
Actual | | | | | | | | | | | | |
| Class A | | $ | 1,000.00 | | | $ | 923.20 | | | $ | 7.05 | |
| Class B | | | 1,000.00 | | | | 920.20 | | | | 11.06 | |
| Class C | | | 1,000.00 | | | | 920.50 | | | | 10.77 | |
| | | | | | | | | | | | | |
Hypothetical | | | | | | | | | | | | |
| (5% return before expenses) | | | | | | | | | | | | |
| Class A | | | 1,000.00 | | | | 1,017.70 | | | | 7.39 | |
| Class B | | | 1,000.00 | | | | 1,013.55 | | | | 11.59 | |
| Class C | | | 1,000.00 | | | | 1,013.85 | | | | 11.29 | |
Expenses are equal to the Fund’s annualized expense ratio for that class, multiplied by the average account value over the period, multiplied by 183/366 (to reflect the one-half year period). Those annualized expense ratios based on the 6-month period ended September 30, 2008 are as follows:
| | | | | |
| Class | | Expense Ratios |
| |
| Class A | | | 1.46 | % |
| Class B | | | 2.29 | |
| Class C | | | 2.23 | |
The expense ratios reflect reduction to custodian expenses. The “Financial Highlights” tables in the Fund’s financial statements, included in this report, also show the gross expense ratios, without such waivers or reimbursements and reduction to custodian expenses, if applicable.
27 | OPPENHEIMER AMT-FREE NEW YORK MUNICIPALS
THIS PAGE INTENTIONALLY LEFT BLANK.
28 | OPPENHEIMER AMT-FREE NEW YORK MUNICIPALS
STATEMENT OF INVESTMENTS September 30, 2008
| | | | | | | | | | | | | | | | | |
| Principal | | | | | | | | | | | | |
| Amount | | | | | Coupon | | | Maturity | | | Value | |
| |
| Municipal Bonds and Notes—121.4% | | | | | | | | | | | | |
| New York—83.7% | | | | | | | | | | | | |
| $ | 700,000 | | | Albany County, NY IDA (Albany College of Pharmacy)1 | | | 5.625 | % | | | 12/01/2034 | | | $ | 606,095 | |
| | 200,000 | | | Albany County, NY IDA (Wildwood Programs) | | | 4.900 | | | | 07/01/2021 | | | | 169,130 | |
| | 125,000 | | | Albany County, NY IDA (Wildwood Programs) | | | 5.000 | | | | 07/01/2026 | | | | 105,175 | |
| | 3,000,000 | | | Albany, NY IDA (Albany Law School)1 | | | 5.000 | | | | 07/01/2031 | | | | 2,473,530 | |
| | 310,000 | | | Albany, NY IDA (Albany Law School) | | | 5.000 | | | | 07/01/2037 | | | | 248,614 | |
| | 335,000 | | | Albany, NY IDA (Brighter Choice Charter School) | | | 5.000 | | | | 04/01/2027 | | | | 278,211 | |
| | 150,000 | | | Albany, NY IDA (Brighter Choice Charter School) | | | 5.000 | | | | 04/01/2032 | | | | 119,727 | |
| | 100,000 | | | Albany, NY IDA (Brighter Choice Charter School) | | | 5.000 | | | | 04/01/2037 | | | | 78,190 | |
| | 14,500,000 | | | Albany, NY IDA (Charitable Leadership)1 | | | 5.750 | | | | 07/01/2026 | | | | 12,645,740 | |
| | 1,000,000 | | | Albany, NY IDA (Charitable Leadership)1 | | | 6.000 | | | | 07/01/2019 | | | | 954,190 | |
| | 100,000 | | | Albany, NY IDA (New Covenant Charter School) | | | 7.000 | | | | 05/01/2025 | | | | 75,024 | |
| | 1,140,000 | | | Albany, NY IDA (Sage Colleges)1 | | | 5.250 | | | | 04/01/2019 | | | | 1,077,904 | |
| | 500,000 | | | Albany, NY IDA (Sage Colleges)1 | | | 5.300 | | | | 04/01/2029 | | | | 435,880 | |
| | 2,550,000 | | | Albany, NY IDA (St. Peter’s Hospital) | | | 5.250 | | | | 11/15/2027 | | | | 2,257,158 | |
| | 3,350,000 | | | Albany, NY IDA (St. Peter’s Hospital)1 | | | 5.250 | | | | 11/15/2032 | | | | 2,853,999 | |
| | 1,000,000 | | | Albany, NY IDA (St. Peter’s Hospital) | | | 5.500 | | | | 11/15/2027 | | | | 912,750 | |
| | 1,380,000 | | | Albany, NY IDA, Series B1 | | | 5.750 | | | | 11/15/2032 | | | | 1,259,360 | |
| | 4,205,000 | | | Albany, NY IDA, Series D1 | | | 5.375 | | | | 11/15/2032 | | | | 3,646,156 | |
| | 1,365,000 | | | Albany, NY IDA, Series D1 | | | 5.750 | | | | 11/15/2027 | | | | 1,284,997 | |
| | 100,000 | | | Albany, NY Municipal Water Finance Authority1 | | | 5.000 | | | | 12/01/2033 | | | | 92,199 | |
| | 10,000 | | | Albany, NY Parking Authority | | | 5.625 | | | | 07/15/2025 | | | | 9,688 | |
| | 5,730,000 | | | Allegany County, NY IDA (Houghton College)1 | | | 5.250 | | | | 01/15/2024 | | | | 5,374,110 | |
| | 2,875,000 | | | Amherst, NY IDA (Beechwood Health Care Center) | | | 5.200 | | | | 01/01/2040 | | | | 2,090,355 | |
| | 50,000 | | | Bethlehem, NY IDA (American Hsg. Foundation) | | | 6.875 | | | | 06/01/2039 | | | | 52,836 | |
| | 5,895,000 | | | Brookhaven, NY IDA (Alternatives for Children) | | | 7.550 | | | | 02/01/2033 | | | | 5,587,222 | |
| | 9,235,000 | | | Brookhaven, NY IDA (Dowling College)1 | | | 6.750 | | | | 11/01/2032 | | | | 8,578,576 | |
| | 100,000 | | | Broome County, NY IDA (Good Shepard Village) | | | 6.750 | | | | 07/01/2028 | | | | 92,658 | |
| | 200,000 | | | Broome County, NY IDA (Good Shepard Village) | | | 6.875 | | | | 07/01/2040 | | | | 185,318 | |
| �� | 350,000 | | | Broome County, NY IDA (University Plaza) | | | 5.200 | | | | 08/01/2030 | | | | 255,819 | |
| | 250,000 | | | Broome County, NY IDA (University Plaza) | | | 5.200 | | | | 08/01/2036 | | | | 175,900 | |
| | 300,000 | | | Bushnell Basin, NY Fire Assoc. (Volunteer Fire Dept.) | | | 5.750 | | | | 11/01/2030 | | | | 253,890 | |
| | 25,000 | | | Canandaigua & Bristol, NY GO | | | 5.000 | | | | 12/15/2027 | | | | 22,359 | |
| | 30,000 | | | Canandaigua & Bristol, NY GO | | | 5.000 | | | | 12/15/2028 | | | | 26,614 | |
| | 30,000 | | | Canandaigua & Bristol, NY GO | | | 5.000 | | | | 12/15/2029 | | | | 26,523 | |
| | 30,000 | | | Canandaigua & Bristol, NY GO | | | 5.000 | | | | 12/15/2030 | | | | 26,276 | |
| | 35,000 | | | Canandaigua & Bristol, NY GO | | | 5.000 | | | | 12/15/2031 | | | | 30,524 | |
| | 35,000 | | | Canandaigua & Bristol, NY GO | | | 5.000 | | | | 12/15/2032 | | | | 30,398 | |
| | 35,000 | | | Canandaigua & Bristol, NY GO | | | 5.000 | | | | 12/15/2033 | | | | 30,315 | |
F1 | OPPENHEIMER AMT-FREE NEW YORK MUNICIPALS
STATEMENT OF INVESTMENTS Continued
| | | | | | | | | | | | | | | | | |
| Principal | | | | | | | | | | | | |
| Amount | | | | | Coupon | | | Maturity | | | Value | |
| |
| New York Continued | | | | | | | | | | | | |
| $ | 40,000 | | | Canandaigua & Bristol, NY GO | | | 5.000 | % | | | 12/15/2034 | | | $ | 34,421 | |
| | 40,000 | | | Canandaigua & Bristol, NY GO | | | 5.000 | | | | 12/15/2035 | | | | 34,331 | |
| | 45,000 | | | Canandaigua & Bristol, NY GO | | | 5.000 | | | | 12/15/2036 | | | | 38,318 | |
| | 45,000 | | | Canandaigua & Bristol, NY GO | | | 5.000 | | | | 12/15/2037 | | | | 38,176 | |
| | 50,000 | | | Canandaigua & Bristol, NY GO | | | 5.000 | | | | 12/15/2038 | | | | 42,320 | |
| | 50,000 | | | Canandaigua & Bristol, NY GO | | | 5.000 | | | | 12/15/2039 | | | | 42,228 | |
| | 55,000 | | | Canandaigua & Bristol, NY GO | | | 5.000 | | | | 12/15/2040 | | | | 46,347 | |
| | 55,000 | | | Canandaigua & Bristol, NY GO | | | 5.000 | | | | 12/15/2041 | | | | 46,256 | |
| | 60,000 | | | Canandaigua & Bristol, NY GO | | | 5.000 | | | | 12/15/2042 | | | | 50,366 | |
| | 85,000 | | | Cattaraugus County, NY IDA (Olean General Hospital)1 | | | 5.250 | | | | 08/01/2023 | | | | 83,618 | |
| | 500,000 | | | Cattaraugus County, NY IDA (St. Bonaventure University)1 | | | 5.000 | | | | 05/01/2023 | | | | 437,245 | |
| | 620,000 | | | Cattaraugus County, NY IDA (St. Bonaventure University)1 | | | 5.100 | | | | 05/01/2031 | | | | 505,325 | |
| | 1,570,000 | | | Cayuga County, NY COP (Auburn Memorial Hospital)1 | | | 6.000 | | | | 01/01/2021 | | | | 1,567,127 | |
| | 90,000 | | | Chautauqua, NY Utility District1 | | | 5.000 | | | | 06/01/2022 | | | | 85,212 | |
| | 100,000 | | | Chautauqua, NY Utility District1 | | | 5.000 | | | | 06/01/2024 | | | | 92,606 | |
| | 110,000 | | | Chautauqua, NY Utility District1 | | | 5.000 | | | | 06/01/2026 | | | | 100,117 | |
| | 1,690,000 | | | Clarence, NY IDA (Bristol Village) | | | 6.000 | | | | 01/20/2044 | | | | 1,724,341 | |
| | 125,000 | | | Coeymans, NY Fire District | | | 5.000 | | | | 10/15/2023 | | | | 118,780 | |
| | 130,000 | | | Coeymans, NY Fire District | | | 5.000 | | | | 10/15/2024 | | | | 122,335 | |
| | 135,000 | | | Coeymans, NY Fire District | | | 5.000 | | | | 10/15/2025 | | | | 125,894 | |
| | 140,000 | | | Coeymans, NY Fire District | | | 5.000 | | | | 10/15/2026 | | | | 129,634 | |
| | 1,040,000 | | | Colonie, NY GO2 | | | 6.000 | | | | 04/01/2032 | | | | 1,023,277 | |
| | 1,090,000 | | | Colonie, NY GO2 | | | 6.000 | | | | 04/01/2033 | | | | 1,074,860 | |
| | 15,000 | | | Deerfield, NY GO | | | 5.500 | | | | 06/15/2021 | | | | 14,565 | |
| | 15,000 | | | Deerfield, NY GO | | | 5.500 | | | | 06/15/2022 | | | | 14,426 | |
| | 15,000 | | | Deerfield, NY GO | | | 5.500 | | | | 06/15/2023 | | | | 14,287 | |
| | 15,000 | | | Deerfield, NY GO | | | 5.500 | | | | 06/15/2024 | | | | 14,247 | |
| | 20,000 | | | Deerfield, NY GO | | | 5.500 | | | | 06/15/2025 | | | | 18,859 | |
| | 20,000 | | | Deerfield, NY GO | | | 5.600 | | | | 06/15/2026 | | | | 18,739 | |
| | 20,000 | | | Deerfield, NY GO | | | 5.600 | | | | 06/15/2027 | | | | 18,663 | |
| | 20,000 | | | Deerfield, NY GO | | | 5.600 | | | | 06/15/2028 | | | | 18,541 | |
| | 25,000 | | | Deerfield, NY GO | | | 5.600 | | | | 06/15/2029 | | | | 23,070 | |
| | 25,000 | | | Deerfield, NY GO | | | 5.600 | | | | 06/15/2030 | | | | 22,887 | |
| | 25,000 | | | Deerfield, NY GO | | | 5.600 | | | | 06/15/2031 | | | | 22,759 | |
| | 25,000 | | | Deerfield, NY GO | | | 5.600 | | | | 06/15/2032 | | | | 22,701 | |
| | 30,000 | | | Deerfield, NY GO | | | 5.600 | | | | 06/15/2033 | | | | 27,175 | |
| | 30,000 | | | Deerfield, NY GO | | | 5.600 | | | | 06/15/2034 | | | | 27,062 | |
| | 30,000 | | | Deerfield, NY GO | | | 5.600 | | | | 06/15/2035 | | | | 26,944 | |
| | 35,000 | | | Deerfield, NY GO | | | 5.600 | | | | 06/15/2036 | | | | 31,219 | |
| | 55,460,000 | | | Dutchess County, NY IDA (Bard College) | | | 5.000 | | | | 08/01/2046 | | | | 48,329,508 | |
F2 | OPPENHEIMER AMT-FREE NEW YORK MUNICIPALS
| | | | | | | | | | | | | | | | | |
| Principal | | | | | | | | | | | | |
| Amount | | | | | Coupon | | | Maturity | | | Value | |
| |
| New York Continued | | | | | | | | | | | | |
| $ | 8,440,000 | | | Dutchess County, NY IDA (Elant Fishkill) | | | 5.250 | % | | | 01/01/2037 | | | $ | 6,333,376 | |
| | 1,840,000 | | | East Rochester, NY Hsg. Authority (St. John’s Meadows) | | | 5.000 | | | | 02/15/2047 | | | | 1,593,293 | |
| | 500,000 | | | Erie County, NY IDA (Charter School Applied Tech) | | | 6.875 | | | | 06/01/2035 | | | | 467,205 | |
| | 1,200,000 | | | Erie County, NY IDA (DePaul Properties) | | | 5.750 | | | | 09/01/2028 | | | | 904,200 | |
| | 160,000 | | | Erie County, NY IDA (DePaul Properties) | | | 6.500 | | | | 09/01/2018 | | | | 142,160 | |
| | 200,000 | | | Erie County, NY IDA (Global Concepts Charter School) | | | 6.250 | | | | 10/01/2037 | | | | 171,020 | |
| | 5,600,000 | | | Erie County, NY IDA (Medaille College) | | | 7.625 | | | | 04/01/2035 | | | | 5,769,232 | |
| | 1,000,000 | | | Erie County, NY IDA (Orchard Park CCRC) | | | 5.000 | | | | 11/15/2014 | | | | 924,170 | |
| | 1,485,000 | | | Erie County, NY IDA (Orchard Park CCRC) | | | 5.125 | | | | 11/15/2016 | | | | 1,340,153 | |
| | 4,750,000 | | | Erie County, NY IDA (Orchard Park CCRC) | | | 6.000 | | | | 11/15/2036 | | | | 3,872,200 | |
| | 9,175,000 | | | Erie County, NY IDA (The Episcopal Church Home) | | | 5.875 | | | | 02/01/2018 | | | | 8,464,488 | |
| | 10,170,000 | | | Erie County, NY IDA (The Episcopal Church Home)1 | | | 6.000 | | | | 02/01/2028 | | | | 8,726,063 | |
| | 36,405,000 | | | Erie County, NY Tobacco Asset Securitization Corp.1 | | | 5.000 | | | | 06/01/2038 | | | | 27,846,549 | |
| | 29,515,000 | | | Erie County, NY Tobacco Asset Securitization Corp. | | | 5.000 | | | | 06/01/2045 | | | | 22,153,074 | |
| | 56,000,000 | | | Erie County, NY Tobacco Asset Securitization Corp. | | | 6.875 | 3 | | | 06/01/2050 | | | | 1,601,040 | |
| | 30,000,000 | | | Erie County, NY Tobacco Asset Securitization Corp. | | | 7.029 | 3 | | | 06/01/2055 | | | | 472,500 | |
| | 100,000 | | | Essex County, NY IDA (North Country Community College Foundation)1 | | | 5.000 | | | | 06/01/2020 | | | | 90,051 | |
| | 130,000 | | | Essex County, NY IDA (North Country Community College Foundation)1 | | | 5.200 | | | | 06/01/2025 | | | | 111,613 | |
| | 110,000 | | | Essex County, NY IDA (North Country Community College Foundation)1 | | | 5.300 | | | | 06/01/2035 | | | | 89,458 | |
| | 175,000 | | | Franklin County, NY IDA (North Country Community College Foundation)1 | | | 5.200 | | | | 06/01/2025 | | | | 150,248 | |
| | 815,000 | | | Genesee County, NY IDA (United Memorial Medical Center) | | | 5.000 | | | | 12/01/2027 | | | | 624,486 | |
| | 3,750,000 | | | Geneva, NY IDA (Hobart & William Smith Colleges)1 | | | 5.375 | | | | 02/01/2033 | | | | 3,667,538 | |
| | 4,285,000 | | | Green Island, NY Power Authority1 | | | 5.125 | | | | 03/15/2033 | | | | 3,752,589 | |
| | 75,000 | | | Hempstead Village, NY GO1 | | | 5.000 | | | | 09/15/2024 | | | | 68,370 | |
| | 70,000 | | | Hempstead Village, NY GO1 | | | 5.000 | | | | 09/15/2025 | | | | 63,234 | |
| | 70,000 | | | Hempstead Village, NY GO1 | | | 5.000 | | | | 09/15/2026 | | | | 62,864 | |
| | 50,000 | | | Hempstead, NY IDA (Hofstra University)1 | | | 5.000 | | | | 07/01/2033 | | | | 46,193 | |
| | 410,000 | | | Hempstead, NY IDA (Peninsula Counseling Center) | | | 6.500 | | | | 11/01/2038 | | | | 352,571 | |
| | 5,210,000 | | | Hempstead, NY IDA (WORCA) | | | 6.900 | | | | 08/01/2033 | | | | 4,529,835 | |
| | 875,000 | | | Herkimer County, NY IDA (Folts Adult Home) | | | 5.500 | | | | 03/20/2040 | | | | 835,625 | |
| | 1,790,000 | | | Herkimer County, NY IDA (Herkimer County College Foundation)1 | | | 6.250 | | | | 08/01/2034 | | | | 1,656,466 | |
| | 25,685,000 | | | Hudson Yards, NY Infrastructure Corp. | | | 5.000 | | | | 02/15/2047 | | | | 22,977,801 | |
| | 11,500,000 | | | Hudson Yards, NY Infrastructure Corp. | | | 5.000 | | | | 02/15/2047 | | | | 10,353,680 | |
| | 2,420,000 | | | Islip, NY IDA (United Cerebral Palsy Assoc.) | | | 6.250 | | | | 12/01/2031 | | | | 1,958,385 | |
| | 280,000 | | | Islip, NY IDA (United Cerebral Palsy Assoc.) | | | 6.250 | | | | 12/01/2031 | | | | 226,590 | |
| | 665,000 | | | Madison County, NY IDA (Commons II Student Hsg.) | | | 5.000 | | | | 06/01/2040 | | | | 557,164 | |
F3 | OPPENHEIMER AMT-FREE NEW YORK MUNICIPALS
STATEMENT OF INVESTMENTS Continued
| | | | | | | | | | | | | | | | | |
| Principal | | | | | | | | | | | | |
| Amount | | | | | Coupon | | | Maturity | | | Value | |
| |
| New York Continued | | | | | | | | | | | | |
| $ | 10,000 | | | Monroe County, NY IDA (Cloverwood Senior Living) | | | 6.000 | % | | | 05/01/2013 | | | $ | 9,437 | |
| | 125,000 | | | Monroe County, NY IDA (Cloverwood Senior Living) | | | 6.640 | 4 | | | 05/01/2033 | | | | 122,905 | |
| | 350,000 | | | Monroe County, NY IDA (Rochester Institute of Technology)1 | | | 5.250 | | | | 04/01/2019 | | | | 328,465 | |
| | 525,000 | | | Monroe County, NY IDA (Rochester Institute of Technology)1 | | | 5.375 | | | | 04/01/2029 | | | | 455,942 | |
| | 50,000 | | | Monroe County, NY IDA (St. John Fisher College)1 | | | 5.200 | | | | 06/01/2019 | | | | 46,623 | |
| | 200,000 | | | Monroe County, NY IDA (Summit at Brighton) | | | 5.375 | | | | 07/01/2032 | | | | 151,912 | |
| | 400,000 | | | Monroe County, NY IDA (Summit at Brighton) | | | 5.500 | | | | 07/01/2027 | | | | 318,736 | |
| | 302,900,000 | | | Monroe County, NY Tobacco Asset Securitization Corp. (TASC) | | | 7.701 | 3 | | | 06/01/2061 | | | | 2,798,796 | |
| | 1,000,000 | | | Monroe, NY Newpower Corp.1 | | | 5.625 | | | | 01/01/2026 | | | | 875,170 | |
| | 4,000,000 | | | Monroe, NY Newpower Corp.1 | | | 5.500 | | | | 01/01/2034 | | | | 3,285,080 | |
| | 225,000 | | | Nassau County, NY Bridge Authority1 | | | 5.500 | | | | 10/01/2019 | | | | 227,635 | |
| | 115,000 | | | Nassau County, NY IDA (ACDS) | | | 5.950 | | | | 11/01/2022 | | | | 102,667 | |
| | 510,000 | | | Nassau County, NY IDA (ALIA-ACDS) | | | 6.125 | | | | 09/01/2018 | | | | 471,322 | |
| | 1,975,000 | | | Nassau County, NY IDA (ALIA-AP) | | | 7.000 | | | | 09/01/2028 | | | | 1,841,352 | |
| | 710,000 | | | Nassau County, NY IDA (ALIA-CMA) | | | 6.125 | | | | 09/01/2018 | | | | 656,154 | |
| | 785,000 | | | Nassau County, NY IDA (ALIA-CSMR) | | | 6.125 | | | | 09/01/2018 | | | | 725,466 | |
| | 505,000 | | | Nassau County, NY IDA (ALIA-EFLI) | | | 6.125 | | | | 09/01/2018 | | | | 466,701 | |
| | 405,000 | | | Nassau County, NY IDA (ALIA-HAII) | | | 6.125 | | | | 09/01/2018 | | | | 374,285 | |
| | 470,000 | | | Nassau County, NY IDA (ALIA-NCMRS) | | | 6.125 | | | | 09/01/2018 | | | | 434,355 | |
| | 180,000 | | | Nassau County, NY IDA (Amsterdam at Harborside) | | | 6.500 | | | | 01/01/2027 | | | | 172,028 | |
| | 1,295,000 | | | Nassau County, NY IDA (Amsterdam at Harborside) | | | 6.700 | | | | 01/01/2043 | | | | 1,240,053 | |
| | 765,000 | | | Nassau County, NY IDA (CSMR) | | | 5.950 | | | | 11/01/2022 | | | | 682,961 | |
| | 100,000 | | | Nassau County, NY IDA (Epilepsy Foundation of L.I.) | | | 5.950 | | | | 11/01/2022 | | | | 89,276 | |
| | 185,000 | | | Nassau County, NY IDA (Hispanic Counseling Center) | | | 6.500 | | | | 11/01/2037 | | | | 159,546 | |
| | 2,655,000 | | | Nassau County, NY IDA (Hispanic Counseling Center) | | | 7.625 | | | | 06/01/2033 | | | | 2,418,174 | |
| | 100,000 | | | Nassau County, NY IDA (Life’s WORCA) | | | 5.950 | | | | 11/01/2022 | | | | 89,276 | |
| | 180,000 | | | Nassau County, NY IDA (PLUS Group Home) | | | 6.150 | | | | 11/01/2022 | | | | 160,835 | |
| | 70,000 | | | Nassau County, NY IDA (United Veteran’s Beacon House) | | | 6.500 | | | | 11/01/2037 | | | | 60,369 | |
| | 50,000 | | | Nassau County, NY IDA, Series A-A | | | 6.000 | | | | 07/02/2021 | | | | 45,350 | |
| | 840,000 | | | Nassau County, NY IDA, Series A-B | | | 6.000 | | | | 07/01/2021 | | | | 761,880 | |
| | 30,000 | | | Nassau County, NY IDA, Series A-C | | | 6.000 | | | | 07/01/2021 | | | | 27,210 | |
| | 35,000 | | | Nassau County, NY IDA, Series A-D | | | 6.000 | | | | 07/01/2021 | | | | 31,745 | |
| | 25,550,000 | | | Nassau County, NY Tobacco Settlement Corp. | | | 5.125 | | | | 06/01/2046 | | | | 19,567,212 | |
| | 85,990,000 | | | Nassau County, NY Tobacco Settlement Corp. | | | 6.151 | 3 | | | 06/01/2046 | | | | 4,091,404 | |
| | 60,000,000 | | | Nassau County, NY Tobacco Settlement Corp. | | | 6.763 | 3 | | | 06/01/2060 | | | | 730,800 | |
| | 42,830,000 | | | Nassau County, NY Tobacco Settlement Corp. (TASC)1 | | | 5.000 | | | | 06/01/2035 | | | | 33,113,586 | |
| | 115,000 | | | New Hartford, NY GO1 | | | 5.000 | | | | 09/15/2022 | | | | 106,691 | |
F4 | OPPENHEIMER AMT-FREE NEW YORK MUNICIPALS
| | | | | | | | | | | | | | | | | |
| Principal | | | | | | | | | | | | |
| Amount | | | | | Coupon | | | Maturity | | | Value | |
| |
| New York Continued | | | | | | | | | | | | |
| $ | 2,500,000 | | | Niagara County, NY IDA (American Ref-Fuel Company)1 | | | 5.550 | % | | | 11/15/2024 | | | $ | 2,335,775 | |
| | 975,000 | | | Niagara County, NY IDA (Niagara Falls Memorial Medical Center) | | | 5.750 | | | | 06/01/2018 | | | | 969,004 | |
| | 500,000 | | | Niagara County, NY Tobacco Asset Securitization Corp.1 | | | 6.250 | | | | 05/15/2034 | | | | 490,875 | |
| | 375,000 | | | Niagara County, NY Tobacco Asset Securitization Corp. | | | 6.250 | | | | 05/15/2040 | | | | 362,693 | |
| | 20,000 | | | Niagara County, NY Tobacco Asset Securitization Corp. (TASC)1 | | | 5.500 | | | | 05/15/2019 | | | | 19,120 | |
| | 1,185,000 | | | NY Counties Tobacco Trust I1 | | | 6.500 | | | | 06/01/2035 | | | | 1,187,868 | |
| | 14,670,000 | | | NY Counties Tobacco Trust II (TASC)1 | | | 5.625 | | | | 06/01/2035 | | | | 13,060,848 | |
| | 20,000 | | | NY Counties Tobacco Trust II (TASC) | | | 5.750 | | | | 06/01/2043 | | | | 17,829 | |
| | 5,120,000 | | | NY Counties Tobacco Trust III | | | 6.000 | | | | 06/01/2043 | | | | 4,738,816 | |
| | 850,000 | | | NY Counties Tobacco Trust IV1 | | | 5.000 | | | | 06/01/2038 | | | | 650,174 | |
| | 3,500,000 | | | NY Counties Tobacco Trust IV (TASC) | | | 0.000 | 5 | | | 06/01/2041 | | | | 3,290,035 | |
| | 5,900,000 | | | NY Counties Tobacco Trust IV (TASC) | | | 5.000 | | | | 06/01/2042 | | | | 4,461,757 | |
| | 9,240,000 | | | NY Counties Tobacco Trust IV (TASC) | | | 5.000 | | | | 06/01/2045 | | | | 6,935,267 | |
| | 3,500,000 | | | NY Counties Tobacco Trust IV (TASC) | | | 6.650 | 4 | | | 06/01/2041 | | | | 355,775 | |
| | 84,200,000 | | | NY Counties Tobacco Trust V | | | 6.850 | 3 | | | 06/01/2055 | | | | 1,571,172 | |
| | 334,000,000 | | | NY Counties Tobacco Trust V | | | 7.850 | 3 | | | 06/01/2060 | | | | 3,373,400 | |
| | 400,000 | | | NY Liberty Devel. Corp. (Goldman Sachs Headquarters)1 | | | 5.250 | | | | 10/01/2035 | | | | 336,308 | |
| | 19,420,000 | | | NY MTA Service Contract, Series A1 | | | 5.125 | | | | 01/01/2029 | | | | 18,153,233 | |
| | 30,000,000 | | | NY MTA, Series A6 | | | 5.000 | | | | 11/15/2031 | | | | 27,390,450 | |
| | 13,840,000 | | | NY MTA, Series A6 | | | 5.125 | | | | 11/15/2031 | | | | 12,924,761 | |
| | 2,000,000 | | | NY MTA, Series F1 | | | 5.000 | | | | 11/15/2030 | | | | 1,825,080 | |
| | 1,680,000 | | | NY Seneca Nation Indians Capital Improvements1 | | | 5.000 | | | | 12/01/2023 | | | | 1,393,610 | |
| | 50,000 | | | NY Tobacco Settlement Financing Corp. (TASC)1 | | | 5.250 | | | | 06/01/2012 | | | | 50,046 | |
| | 25,000 | | | NY Triborough Bridge & Tunnel Authority1 | | | 5.000 | | | | 01/01/2020 | | | | 25,102 | |
| | 10,240,000 | | | NY Triborough Bridge & Tunnel Authority, Series B6 | | | 5.000 | | | | 11/15/2027 | | | | 9,837,312 | |
| | 64,340,000 | | | NY Triborough Bridge & Tunnel Authority, Series B2,6 | | | 5.000 | | | | 11/15/2032 | | | | 61,137,912 | |
| | 18,200,000 | | | NY Triborough Bridge & Tunnel Authority, Series B2,6 | | | 5.125 | | | | 11/15/2029 | | | | 17,684,171 | |
| | 3,620,000 | | | NY TSASC, Inc. (TFABs)1 | | | 4.750 | | | | 06/01/2022 | | | | 3,103,100 | |
| | 4,875,000 | | | NY TSASC, Inc. (TFABs)1 | | | 5.000 | | | | 06/01/2034 | | | | 3,784,316 | |
| | 125,445,000 | | | NY TSASC, Inc. (TFABs) | | | 5.125 | | | | 06/01/2042 | | | | 96,794,616 | |
| | 20,000,000 | | | NYC GO6 | | | 5.000 | | | | 08/01/2021 | | | | 19,477,700 | |
| | 10,000 | | | NYC GO1 | | | 5.300 | | | | 01/15/2026 | | | | 9,747 | |
| | 10,000 | | | NYC GO1 | | | 5.375 | | | | 08/01/2027 | | | | 10,011 | |
| | 70,000 | | | NYC GO1 | | | 5.500 | | | | 08/01/2010 | | | | 70,491 | |
| | 45,000 | | | NYC GO1 | | | 5.500 | | | | 06/01/2022 | | | | 45,154 | |
| | 105,000 | | | NYC GO1 | | | 5.500 | | | | 11/15/2037 | | | | 103,344 | |
| | 680,000 | | | NYC GO1 | | | 5.875 | | | | 08/01/2019 | | | | 718,053 | |
| | 45,000 | | | NYC GO1 | | | 6.000 | | | | 05/15/2022 | | | | 45,085 | |
F5 | OPPENHEIMER AMT-FREE NEW YORK MUNICIPALS
STATEMENT OF INVESTMENTS Continued
| | | | | | | | | | | | | | | | | |
| Principal | | | | | | | | | | | | |
| Amount | | | | | Coupon | | | Maturity | | | Value | |
| |
| New York Continued | | | | | | | | | | | | |
| $ | 5,000 | | | NYC GO1 | | | 7.500 | % | | | 02/01/2019 | | | $ | 5,017 | |
| | 1,262,859 | | | NYC HDC (Keith Plaza) | | | 6.500 | | | | 02/15/2018 | | | | 1,264,362 | |
| | 2,000,000 | | | NYC HDC (Multifamily Hsg.)1 | | | 5.250 | | | | 11/01/2031 | | | | 1,887,580 | |
| | 250,000 | | | NYC HDC (Multifamily Hsg.), Series E1 | | | 6.250 | | | | 05/01/2036 | | | | 253,633 | |
| | 100,000 | | | NYC Health & Hospital Corp.1 | | | 5.375 | | | | 02/15/2026 | | | | 94,386 | |
| | 1,975,000 | | | NYC Health & Hospital Corp.1 | | | 5.450 | | | | 02/15/2026 | | | | 1,880,101 | |
| | 1,425,000 | | | NYC IDA (American Council of Learned Societies)1 | | | 5.250 | | | | 07/01/2027 | | | | 1,346,882 | |
| | 60,000 | | | NYC IDA (Assoc. for Metroarea Autistic Children) | | | 4.500 | | | | 07/01/2021 | | | | 47,606 | |
| | 2,760,000 | | | NYC IDA (Beth Abraham Health Services) | | | 6.500 | | | | 02/15/2022 | | | | 2,457,338 | |
| | 500,000 | | | NYC IDA (Beth Abraham Health Services) | | | 6.500 | | | | 11/15/2027 | | | | 454,130 | |
| | 2,100,000 | | | NYC IDA (Beth Abraham Health Services) | | | 6.500 | | | | 11/15/2034 | | | | 1,868,874 | |
| | 6,000,000 | | | NYC IDA (Calhoun School) | | | 6.625 | | | | 12/01/2034 | | | | 5,880,480 | |
| | 500,000 | | | NYC IDA (Calhoun School) | | | 6.625 | | | | 12/01/2034 | | | | 490,040 | |
| | 960,000 | | | NYC IDA (Center for Elimination of Family Violence) | | | 7.375 | | | | 11/01/2036 | | | | 879,610 | |
| | 830,000 | | | NYC IDA (Center for Nursing/Rehabilitation) | | | 5.375 | | | | 08/01/2027 | | | | 648,479 | |
| | 205,000 | | | NYC IDA (Center for Nursing/Rehabilitation) | | | 5.375 | | | | 08/01/2027 | | | | 160,544 | |
| | 3,240,000 | | | NYC IDA (Chapin School) | | | 5.000 | | | | 11/01/2038 | | | | 2,621,452 | |
| | 3,675,000 | | | NYC IDA (Community Resource Developmentally Disabled) | | | 7.500 | | | | 08/01/2026 | | | | 3,723,841 | |
| | 150,000 | | | NYC IDA (Comprehensive Care Management) | | | 6.000 | | | | 05/01/2026 | | | | 127,595 | |
| | 350,000 | | | NYC IDA (Comprehensive Care Management) | | | 6.125 | | | | 11/01/2035 | | | | 294,396 | |
| | 980,000 | | | NYC IDA (Eger Harbor House) | | | 5.875 | | | | 05/20/2044 | | | | 986,390 | |
| | 725,000 | | | NYC IDA (Family Support Systems) | | | 7.500 | | | | 11/01/2034 | | | | 653,363 | |
| | 1,530,000 | | | NYC IDA (Gateway School of New York) | | | 5.550 | | | | 06/01/2039 | | | | 1,259,006 | |
| | 220,000 | | | NYC IDA (Global Country World Peace) | | | 7.250 | | | | 11/01/2025 | | | | 187,909 | |
| | 170,000 | | | NYC IDA (Global Country World Peace) | | | 7.250 | | | | 11/01/2025 | | | | 145,202 | |
| | 1,825,000 | | | NYC IDA (Guttmacher Institute) | | | 5.750 | | | | 12/01/2036 | | | | 1,439,232 | |
| | 790,000 | | | NYC IDA (Independent Living Assoc.) | | | 6.200 | | | | 07/01/2020 | | | | 695,421 | |
| | 24,110,000 | | | NYC IDA (Liberty-7 World Trade Center)1,2 | | | 6.250 | | | | 03/01/2015 | | | | 24,108,553 | |
| | 16,000,000 | | | NYC IDA (Liberty-7 World Trade Center)2,7 | | | 6.500 | | | | 03/01/2035 | | | | 16,130,080 | |
| | 10,850,000 | | | NYC IDA (Liberty-7 World Trade Center)1 | | | 6.750 | | | | 03/01/2015 | | | | 11,077,416 | |
| | 12,050,000 | | | NYC IDA (Liberty-IAC/Interactive Corp.)1 | | | 5.000 | | | | 09/01/2035 | | | | 9,693,141 | |
| | 3,700,000 | | | NYC IDA (Lycee Francais De New York)1 | | | 5.375 | | | | 06/01/2023 | | | | 3,202,609 | |
| | 4,000,000 | | | NYC IDA (Lycee Francais De New York)1 | | | 6.800 | | | | 06/01/2028 | | | | 4,021,440 | |
| | 950,000 | | | NYC IDA (Magen David Yeshivah) | | | 5.700 | | | | 06/15/2027 | | | | 832,010 | |
| | 420,000 | | | NYC IDA (Manhattan Community Access Corp.) | | | 6.000 | | | | 12/01/2036 | | | | 331,376 | |
| | 210,000 | | | NYC IDA (Margaret Tietz Nursing & Rehabilitation Center) | | | 6.375 | | | | 11/01/2038 | | | | 182,307 | |
| | 1,020,000 | | | NYC IDA (Margaret Tietz Nursing & Rehabilitation Center) | | | 6.375 | | | | 11/01/2038 | | | | 885,493 | |
F6 | OPPENHEIMER AMT-FREE NEW YORK MUNICIPALS
| | | | | | | | | | | | | | | | | |
| Principal | | | | | | | | | | | | |
| Amount | | | | | Coupon | | | Maturity | | | Value | |
| |
| New York Continued | | | | | | | | | | | | |
| $ | 180,000 | | | NYC IDA (Metropolitan College of New York) | | | 5.750 | % | | | 03/01/2020 | | | $ | 166,491 | |
| | 2,300,000 | | | NYC IDA (Montefiore Medical Center Corp.)1 | | | 5.125 | | | | 11/01/2035 | | | | 2,182,240 | |
| | 6,510,000 | | | NYC IDA (Mount St. Vincent)1 | | | 5.250 | | | | 06/01/2036 | | | | 5,349,007 | |
| | 1,375,000 | | | NYC IDA (Polytechnic University)1 | | | 5.250 | | | | 11/01/2027 | | | | 1,156,719 | |
| | 1,200,000 | | | NYC IDA (Polytechnic University)1 | | | 5.250 | | | | 11/01/2037 | | | | 961,692 | |
| | 1,380,000 | | | NYC IDA (PSCH) | | | 6.375 | | | | 07/01/2033 | | | | 1,264,701 | |
| | 750,000 | | | NYC IDA (Reece School) | | | 7.500 | | | | 12/01/2037 | | | | 712,605 | |
| | 295,000 | | | NYC IDA (Reece School) | | | 7.500 | | | | 12/01/2037 | | | | 280,291 | |
| | 1,445,000 | | | NYC IDA (Staten Island University Hospital)1 | | | 6.450 | | | | 07/01/2032 | | | | 1,285,833 | |
| | 756,500 | | | NYC IDA (Studio School) | | | 7.000 | | | | 11/01/2038 | | | | 611,411 | |
| | 5,345,000 | | | NYC IDA (The Child School) | | | 7.550 | | | | 06/01/2033 | | | | 5,023,926 | |
| | 995,000 | | | NYC IDA (Tides Two Rivers Foundation) | | | 5.650 | | | | 12/01/2039 | | | | 783,901 | |
| | 3,560,000 | | | NYC IDA (Unicef) | | | 5.300 | | | | 11/01/2038 | | | | 2,749,815 | |
| | 5,600,000 | | | NYC IDA (Urban Resource Institute) | | | 7.375 | | | | 11/01/2033 | | | | 5,149,816 | |
| | 785,000 | | | NYC IDA (Vaughn College Aeronautics)1 | | | 5.000 | | | | 12/01/2021 | | | | 656,040 | |
| | 310,000 | | | NYC IDA (Vaughn College Aeronautics)1 | | | 5.000 | | | | 12/01/2021 | | | | 259,073 | |
| | 150,000 | | | NYC IDA (Vaughn College Aeronautics)1 | | | 5.000 | | | | 12/01/2028 | | | | 113,466 | |
| | 360,000 | | | NYC IDA (Vaughn College Aeronautics)1 | | | 5.000 | | | | 12/01/2028 | | | | 272,318 | |
| | 100,000 | | | NYC IDA (Vaughn College Aeronautics)1 | | | 5.000 | | | | 12/01/2031 | | | | 73,580 | |
| | 2,020,000 | | | NYC IDA (Vaughn College Aeronautics)1 | | | 5.250 | | | | 12/01/2036 | | | | 1,503,021 | |
| | 5,600,000 | | | NYC IDA (Vocational Instruction)8 | | | 7.750 | | | | 02/01/2033 | | | | 4,025,840 | |
| | 9,900,000 | | | NYC IDA (Yankee Stadium) | | | 5.000 | | | | 03/01/2046 | | | | 8,585,973 | |
| | 2,700,000 | | | NYC IDA (Yeled Yalda Early Childhood) | | | 5.725 | | | | 11/01/2037 | | | | 2,143,260 | |
| | 4,555,000 | | | NYC IDA (YMCA of Greater New York)1 | | | 5.250 | | | | 08/01/2021 | | | | 4,494,874 | |
| | 80,000 | | | NYC IDA (YMCA of Greater New York)1 | | | 5.800 | | | | 08/01/2016 | | | | 82,350 | |
| | 20,000,000 | | | NYC Municipal Water Finance Authority2,6 | | | 4.750 | | | | 06/15/2035 | | | | 17,782,759 | |
| | 20,000,000 | | | NYC Municipal Water Finance Authority6 | | | 5.000 | | | | 06/15/2037 | | | | 18,563,219 | |
| | 50,000 | | | NYC Municipal Water Finance Authority1 | | | 5.000 | | | | 06/15/2032 | | | | 47,148 | |
| | 20,000 | | | NYC Municipal Water Finance Authority1 | | | 5.250 | | | | 06/15/2025 | | | | 20,025 | |
| | 50,000 | | | NYC Trust for Cultural Resources (Museum of American Folk Art) | | | 6.000 | | | | 07/01/2022 | | | | 45,624 | |
| | 100,000 | | | NYS DA (Amsterdam Memorial Hospital) | | | 6.000 | | | | 08/01/2035 | | | | 100,136 | |
| | 20,000 | | | NYS DA (Audit & Control)1 | | | 5.000 | | | | 04/01/2029 | | | | 18,733 | |
| | 385,000 | | | NYS DA (Chapel Oaks)1 | | | 5.450 | | | | 07/01/2026 | | | | 376,068 | |
| | 425,000 | | | NYS DA (Concord Nursing Home)1 | | | 5.500 | | | | 02/15/2030 | | | | 404,371 | |
| | 175,000 | | | NYS DA (Health Quest Systems)1 | | | 5.250 | | | | 07/01/2027 | | | | 171,308 | |
| | 300,000 | | | NYS DA (Health Quest Systems)1 | | | 5.250 | | | | 07/01/2027 | | | | 293,670 | |
| | 1,870,000 | | | NYS DA (Lenox Hill Hospital Obligated Group)1 | | | 5.500 | | | | 07/01/2030 | | | | 1,588,266 | |
| | 1,000,000 | | | NYS DA (Maimonides Medical Center)1 | | | 5.750 | | | | 08/01/2024 | | | | 1,001,180 | |
| | 365,000 | | | NYS DA (Manhattan College)1 | | | 5.300 | | | | 07/01/2037 | | | | 331,084 | |
F7 | OPPENHEIMER AMT-FREE NEW YORK MUNICIPALS
STATEMENT OF INVESTMENTS Continued
| | | | | | | | | | | | | | | | | |
| Principal | | | | | | | | | | | | |
| Amount | | | | | Coupon | | | Maturity | | | Value | |
| |
| New York Continued | | | | | | | | | | | | |
| $ | 1,290,000 | | | NYS DA (Memorial Sloan-Kettering)1 | | | 5.000 | % | | | 07/01/2035 | | | $ | 1,198,384 | |
| | 735,000 | | | NYS DA (Montefiore Medical Center)1 | | | 5.450 | | | | 08/01/2029 | | | | 730,414 | |
| | 600,000 | | | NYS DA (MSH/NYU Hospital Center/HJDOI Obligated Group)1 | | | 5.500 | | | | 07/01/2026 | | | | 552,084 | |
| | 8,990,000 | | | NYS DA (MSH/NYU Hospital Center/HJDOI Obligated Group)1 | | | 6.500 | | | | 07/01/2025 | | | | 9,076,484 | |
| | 900,000 | | | NYS DA (Mt. Sinai/NYU Health)1 | | | 5.500 | | | | 07/01/2026 | | | | 829,935 | |
| | 40,000 | | | NYS DA (Mt. Sinai/NYU Health)1 | | | 6.500 | | | | 07/01/2017 | | | | 40,984 | |
| | 270,000 | | | NYS DA (Municipal Health Facilities)1 | | | 5.500 | | | | 05/15/2017 | | | | 273,143 | |
| | 1,360,000 | | | NYS DA (New York Methodist Hospital)1 | | | 5.250 | | | | 07/01/2024 | | | | 1,228,583 | |
| | 6,885,000 | | | NYS DA (North Shore University Hospital/L.I. Jewish Medical Center)6 | | | 2.706 | 4 | | | 05/01/2033 | | | | 4,888,340 | |
| | 2,500,000 | | | NYS DA (North Shore University Hospital/L.I. Jewish Medical Center)1 | | | 5.000 | | | | 05/01/2032 | | | | 2,163,925 | |
| | 1,000,000 | | | NYS DA (North Shore University Hospital/L.I. Jewish Medical Center)1 | | | 5.000 | | | | 05/01/2037 | | | | 851,980 | |
| | 5,500,000 | | | NYS DA (NSLIJHS/LIMC/NSUHGC Obligated Group)1 | | | 5.000 | | | | 11/01/2026 | | | | 4,881,030 | |
| | 680,000 | | | NYS DA (Nursing Home) | | | 4.900 | | | | 02/15/2041 | | | | 597,183 | |
| | 810,000 | | | NYS DA (Nursing Home) | | | 4.950 | | | | 02/15/2045 | | | | 713,699 | |
| | 2,000,000 | | | NYS DA (NYU Hospitals Center)1 | | | 5.000 | | | | 07/01/2036 | | | | 1,612,120 | |
| | 275,000 | | | NYS DA (Orange Regional Medical Center)1 | | | 6.125 | | | | 12/01/2029 | | | | 250,038 | |
| | 2,120,000 | | | NYS DA (Orange Regional Medical Center)1 | | | 6.250 | | | | 12/01/2037 | | | | 1,915,865 | |
| | 325,000 | | | NYS DA (Ozanam Hall of Queens Nursing Home)1 | | | 5.000 | | | | 11/01/2026 | | | | 307,938 | |
| | 490,000 | | | NYS DA (Providence Rest) | | | 5.000 | | | | 07/01/2035 | | | | 340,888 | |
| | 1,300,000 | | | NYS DA (Providence Rest) | | | 5.125 | | | | 07/01/2030 | | | | 982,449 | |
| | 340,000 | | | NYS DA (Providence Rest) | | | 5.250 | | | | 07/01/2025 | | | | 273,768 | |
| | 650,000 | | | NYS DA (Rochester General Hospital)1 | | | 5.000 | | | | 12/01/2035 | | | | 530,569 | |
| | 70,000 | | | NYS DA (Sarah Neuman Nursing Home)1 | | | 5.500 | | | | 08/01/2037 | | | | 69,196 | |
| | 4,000,000 | | | NYS DA (SS Joachim & Anne Residence)1 | | | 5.250 | | | | 07/01/2027 | | | | 3,741,480 | |
| | 65,000 | | | NYS DA (St. Joseph’s Hospital Health Center)1 | | | 5.250 | | | | 07/01/2018 | | | | 65,552 | |
| | 13,200,000 | | | NYS DA (St. Luke’s Roosevelt Hospital)2,6 | | | 4.900 | | | | 08/15/2031 | | | | 11,750,728 | |
| | 5,420,000 | | | NYS DA (The Highlands Living) | | | 6.600 | | | | 02/01/2034 | | | | 5,438,699 | |
| | 1,000,000 | | | NYS DA (W.K. Nursing Home)1 | | | 6.125 | | | | 02/01/2036 | | | | 1,000,400 | |
| | 1,220,000 | | | NYS DA (Winthrop University Hospital)1 | | | 5.500 | | | | 07/01/2023 | | | | 1,149,325 | |
| | 100,000 | | | NYS DA (Winthrop University Hospital/South Nassau Communities Hospital Obligated Group)1 | | | 5.500 | | | | 07/01/2032 | | | | 88,965 | |
| | 20,000 | | | NYS EFC (Clean Water & Drinking Revolving Funds)1 | | | 5.000 | | | | 06/15/2027 | | | | 19,292 | |
| | 85,000 | | | NYS EFC (NYS Water Services)1 | | | 6.600 | | | | 09/15/2012 | | | | 85,244 | |
| | 10,000 | | | NYS EFC (State Water Revolving Fund)1 | | | 5.750 | | | | 01/15/2013 | | | | 10,020 | |
| | 1,815,000 | | | NYS ERDA (Brooklyn Union Gas Company)1 | | | 5.500 | | | | 01/01/2021 | | | | 1,821,806 | |
| | 10,000 | | | NYS HFA (Hospital & Healthcare)1 | | | 5.150 | | | | 11/01/2016 | | | | 10,114 | |
F8 | OPPENHEIMER AMT-FREE NEW YORK MUNICIPALS
| | | | | | | | | | | | | | | | | |
| Principal | | | | | | | | | | | | |
| Amount | | | | | Coupon | | | Maturity | | | Value | |
| |
| New York Continued | | | | | | | | | | | | |
| $ | 9,260,000 | | | NYS HFA, Series A1 | | | 6.100 | % | | | 11/01/2015 | | | $ | 9,282,780 | |
| | 120,000 | | | NYS Medcare (Hospital & Nursing Home)1 | | | 5.400 | | | | 08/15/2033 | | | | 117,580 | |
| | 65,000 | | | NYS Medcare (Hospital & Nursing Home)1 | | | 6.200 | | | | 08/15/2023 | | | | 65,124 | |
| | 640,000 | | | NYS Medcare (Hospital & Nursing Home)1 | | | 6.300 | | | | 08/15/2023 | | | | 641,274 | |
| | 50,000 | | | NYS Medcare (Hospital & Nursing Home)1 | | | 6.375 | | | | 08/15/2033 | | | | 50,084 | |
| | 15,000 | | | NYS UDC (Subordinated Lien)1 | | | 5.375 | | | | 07/01/2022 | | | | 15,006 | |
| | 295,000 | | | NYS UDC (Subordinated Lien)1 | | | 5.500 | | | | 07/01/2022 | | | | 295,047 | |
| | 250,000 | | | Oneida County, NY IDA (Mohawk Valley Handicapped Services) | | | 5.300 | | | | 03/15/2019 | | | | 225,020 | |
| | 55,000 | | | Onondaga County, NY IDA (Salina Free Library) | | | 5.500 | | | | 12/01/2022 | | | | 53,369 | |
| | 1,000,000 | | | Orange County, NY IDA (Glen Arden) | | | 5.625 | | | | 01/01/2018 | | | | 901,700 | |
| | 275,000 | | | Orange County, NY IDA (Glen Arden) | | | 5.700 | | | | 01/01/2028 | | | | 220,913 | |
| | 1,600,000 | | | Otsego County, NY IDA (Hartwick College)1 | | | 5.900 | | | | 07/01/2022 | | | | 1,459,136 | |
| | 38,280,000 | | | Port Authority NY/NJ, 140th Series6 | | | 5.000 | | | | 12/01/2034 | | | | 36,099,188 | |
| | 3,180,000 | | | Rensselaer County, NY IDA (Emma Willard School)1 | | | 5.000 | | | | 01/01/2026 | | | | 3,062,308 | |
| | 3,550,000 | | | Rensselaer County, NY IDA (Emma Willard School)1 | | | 5.000 | | | | 01/01/2031 | | | | 3,349,532 | |
| | 6,275,000 | | | Rensselaer County, NY IDA (Emma Willard School)1 | | | 5.000 | | | | 01/01/2036 | | | | 5,867,627 | |
| | 2,680,000 | | | Rensselaer County, NY Tobacco Asset Securitization Corp.1 | | | 5.625 | | | | 06/01/2035 | | | | 2,386,031 | |
| | 2,000,000 | | | Rensselaer County, NY Tobacco Asset Securitization Corp. | | | 5.750 | | | | 06/01/2043 | | | | 1,782,900 | |
| | 230,000 | | | Rensselaer County, NY Water Service Sewer Authority1 | | | 5.250 | | | | 09/01/2038 | | | | 213,348 | |
| | 285,000 | | | Rensselaer County, NY Water Service Sewer Authority | | | 5.250 | | | | 09/01/2038 | | | | 265,133 | |
| | 340,000 | | | Rensselaer County, NY Water Service Sewer Authority | | | 5.350 | | | | 09/01/2047 | | | | 314,932 | |
| | 415,000 | | | Rensselaer County, NY Water Service Sewer Authority | | | 5.350 | | | | 09/01/2047 | | | | 384,402 | |
| | 10,605,000 | | | Rensselaer, NY City School District COP1 | | | 5.000 | | | | 06/01/2026 | | | | 9,363,579 | |
| | 1,060,000 | | | Rockland County, NY Tobacco Asset Securitization Corp.1 | | | 5.625 | | | | 08/15/2035 | | | | 943,411 | |
| | 3,150,000 | | | Rockland County, NY Tobacco Asset Securitization Corp. | | | 5.750 | | | | 08/15/2043 | | | | 2,807,595 | |
| | 101,000,000 | | | Rockland County, NY Tobacco Asset Securitization Corp. | | | 6.252 | 3 | | | 08/15/2045 | | | | 4,782,350 | |
| | 53,000,000 | | | Rockland County, NY Tobacco Asset Securitization Corp. | | | 6.637 | 3 | | | 08/15/2050 | | | | 1,489,300 | |
| | 50,000,000 | | | Rockland County, NY Tobacco Asset Securitization Corp. | | | 7.676 | 3 | | | 08/15/2060 | | | | 495,500 | |
| | 2,500,000 | | | Saratoga County, NY IDA (Saratoga Hospital/Saratoga Care/Benedict Community Health Center)1 | | | 5.125 | | | | 12/01/2033 | | | | 2,131,375 | |
| | 450,000 | | | Saratoga County, NY IDA (Saratoga Hospital/Saratoga Care/Saratoga Care Family Health Centers)1 | | | 5.125 | | | | 12/01/2027 | | | | 397,521 | |
| | 1,000,000 | | | Saratoga County, NY IDA (Saratoga Hospital/Saratoga Care/Saratoga Care Family Health Centers)1 | | | 5.250 | | | | 12/01/2032 | | | | 864,910 | |
| | 350,000 | | | Seneca County, NY IDA (New York Chiropractic College)1 | | | 5.000 | | | | 10/01/2027 | | | | 298,379 | |
| | 45,000 | | | Sodus Village, NY GO1 | | | 5.000 | | | | 05/15/2032 | | | | 41,186 | |
| | 45,000 | | | Sodus Village, NY GO1 | | | 5.000 | | | | 05/15/2033 | | | | 41,077 | |
| | 45,000 | | | Sodus Village, NY GO1 | | | 5.000 | | | | 05/15/2034 | | | | 40,943 | |
| | 45,000 | | | Sodus Village, NY GO1 | | | 5.000 | | | | 05/15/2035 | | | | 40,765 | |
F9 | OPPENHEIMER AMT-FREE NEW YORK MUNICIPALS
STATEMENT OF INVESTMENTS Continued
| | | | | | | | | | | | | | | | | |
| Principal | | | | | | | | | | | | |
| Amount | | | | | Coupon | | | Maturity | | | Value | |
| |
| New York Continued | | | | | | | | | | | | |
| $ | 45,000 | | | Sodus Village, NY GO1 | | | 5.000 | % | | | 05/15/2036 | | | $ | 40,468 | |
| | 45,000 | | | Sodus Village, NY GO1 | | | 5.000 | | | | 05/15/2037 | | | | 40,344 | |
| | 250,000 | | | SONYMA, Series 831 | | | 5.550 | | | | 10/01/2027 | | | | 250,023 | |
| | 15,000 | | | St. Lawrence County, NY IDA (Clarkson University)1 | | | 5.000 | | | | 07/01/2033 | | | | 13,450 | |
| | 115,000 | | | Suffolk County, NY IDA (ALIA-ACLD) | | | 5.950 | | | | 10/01/2021 | | | | 98,533 | |
| | 95,000 | | | Suffolk County, NY IDA (ALIA-Adelante) | | | 6.500 | | | | 11/01/2037 | | | | 81,058 | |
| | 170,000 | | | Suffolk County, NY IDA (ALIA-Civic Facility) | | | 5.950 | | | | 11/01/2022 | | | | 150,385 | |
| | 245,000 | | | Suffolk County, NY IDA (ALIA-DDI) | | | 5.950 | | | | 10/01/2021 | | | | 209,918 | |
| | 45,000 | | | Suffolk County, NY IDA (ALIA-FREE) | | | 5.950 | | | | 10/01/2021 | | | | 38,556 | |
| | 25,000 | | | Suffolk County, NY IDA (ALIA-IGHL) | | | 5.950 | | | | 10/01/2021 | | | | 21,420 | |
| | 115,000 | | | Suffolk County, NY IDA (ALIA-IGHL) | | | 5.950 | | | | 11/01/2022 | | | | 101,731 | |
| | 20,000 | | | Suffolk County, NY IDA (ALIA-IGHL) | | | 6.000 | | | | 10/01/2031 | | | | 16,147 | |
| | 4,000,000 | | | Suffolk County, NY IDA (ALIA-IGHL) | | | 7.250 | | | | 12/01/2033 | | | | 3,911,440 | |
| | 305,000 | | | Suffolk County, NY IDA (ALIA-LIHIA) | | | 5.950 | | | | 11/01/2022 | | | | 269,809 | |
| | 110,000 | | | Suffolk County, NY IDA (ALIA-NYS ARC) | | | 5.950 | | | | 11/01/2022 | | | | 97,308 | |
| | 100,000 | | | Suffolk County, NY IDA (ALIA-UCPAGS) | | | 5.950 | | | | 10/01/2021 | | | | 85,681 | |
| | 390,000 | | | Suffolk County, NY IDA (ALIA-UVBH) | | | 6.500 | | | | 11/01/2037 | | | | 332,764 | |
| | 105,000 | | | Suffolk County, NY IDA (ALIA-WORCA) | | | 5.950 | | | | 11/01/2022 | | | | 92,885 | |
| | 10,000 | | | Suffolk County, NY IDA (DDI) | | | 6.000 | | | | 10/01/2020 | | | | 9,074 | |
| | 8,460,000 | | | Suffolk County, NY IDA (Dowling College) | | | 5.000 | | | | 06/01/2036 | | | | 6,059,813 | |
| | 195,000 | | | Suffolk County, NY IDA (Dowling College)1 | | | 6.700 | | | | 12/01/2020 | | | | 193,124 | |
| | 660,000 | | | Suffolk County, NY IDA (Easter Long Island Hospital Assoc.) | | | 5.375 | | | | 01/01/2027 | | | | 520,040 | |
| | 685,000 | | | Suffolk County, NY IDA (Easter Long Island Hospital Assoc.) | | | 5.500 | | | | 01/01/2037 | | | | 514,853 | |
| | 10,000 | | | Suffolk County, NY IDA (Independent Group Home Living) | | | 6.000 | | | | 10/01/2020 | | | | 9,074 | |
| | 10,550,000 | | | Suffolk County, NY IDA (Jefferson’s Ferry)1 | | | 5.000 | | | | 11/01/2028 | | | | 8,778,128 | |
| | 1,000,000 | | | Suffolk County, NY IDA (L.I. Network Community Services) | | | 7.550 | | | | 02/01/2034 | | | | 924,930 | |
| | 620,000 | | | Suffolk County, NY IDA (Nassau-Suffolk Services for Autism) | | | 6.750 | | | | 11/01/2036 | | | | 511,977 | |
| | 210,000 | | | Suffolk County, NY IDA (Nassau-Suffolk Services for Autism) | | | 6.750 | | | | 11/01/2036 | | | | 173,412 | |
| | 5,985,000 | | | Suffolk County, NY IDA (Pederson-Krager Center) | | | 7.000 | | | | 11/01/2035 | | | | 5,753,021 | |
| | 505,000 | | | Suffolk County, NY IDA (Pederson-Krager Center) | | | 7.200 | | | | 02/01/2035 | | | | 497,349 | |
| | 150,000 | | | Suffolk County, NY IDA (Southampton Hospital Assoc.) | | | 7.250 | | | | 01/01/2020 | | | | 148,053 | |
| | 215,000 | | | Suffolk County, NY IDA (Special Needs Facilities Pooled Program) | | | 5.250 | | | | 07/01/2022 | | | | 184,644 | |
| | 25,000 | | | Suffolk County, NY IDA (Suffolk Hotels) | | | 6.000 | | | | 10/01/2020 | | | | 22,685 | |
| | 6,350,000 | | | Suffolk, NY Tobacco Asset Securitization Corp. | | | 0.000 | 5 | | | 06/01/2044 | | | | 4,294,823 | |
F10 | OPPENHEIMER AMT-FREE NEW YORK MUNICIPALS
| | | | | | | | | | | | | | | | | |
| Principal | | | | | | | | | | | | |
| Amount | | | | | Coupon | | | Maturity | | | Value | |
| |
| New York Continued | | | | | | | | | | | | |
| $ | 500,000 | | | Suffolk, NY Tobacco Asset Securitization Corp. | | | 5.375 | % | | | 06/01/2028 | | | $ | 438,960 | |
| | 1,500,000 | | | Suffolk, NY Tobacco Asset Securitization Corp. | | | 6.000 | | | | 06/01/2048 | | | | 1,326,570 | |
| | 15,750,000 | | | Suffolk, NY Tobacco Asset Securitization Corp. | | | 8.000 | 3 | | | 06/01/2048 | | | | 590,783 | |
| | 494,000 | | | Sullivan County, NY Community College COP7 | | | 5.750 | | | | 08/15/2025 | | | | 406,187 | |
| | 530,000 | | | Sullivan County, NY IDA (Center for Discovery) | | | 5.625 | | | | 06/01/2013 | | | | 493,388 | |
| | 1,570,000 | | | Sullivan County, NY IDA (Center for Discovery) | | | 5.875 | | | | 07/01/2022 | | | | 1,328,832 | |
| | 645,000 | | | Sullivan County, NY IDA (Center for Discovery) | | | 6.000 | | | | 06/01/2019 | | | | 566,807 | |
| | 1,540,000 | | | Sullivan County, NY IDA (Center for Discovery) | | | 6.000 | | | | 07/01/2037 | | | | 1,232,000 | |
| | 430,000 | | | Sullivan County, NY IDA (Center for Discovery) | | | 6.500 | | | | 06/01/2025 | | | | 375,188 | |
| | 505,000 | | | Sullivan County, NY IDA (Center for Discovery) | | | 6.950 | | | | 02/01/2035 | | | | 486,658 | |
| | 445,000 | | | Syracuse, NY IDA (Crouse Irving Companies)1 | | | 5.250 | | | | 01/01/2017 | | | | 446,406 | |
| | 175,000 | | | Tompkins County, NY IDA (Kendal at Ithaca)1 | | | 5.500 | | | | 07/01/2024 | | | | 163,107 | |
| | 1,475,000 | | | Ulster County, NY IDA (Benedictine Hospital) | | | 6.500 | | | | 11/01/2036 | | | | 1,246,021 | |
| | 1,000,000 | | | Ulster County, NY IDA (Kingston Regional Senior Living Corp.) | | | 6.000 | | | | 09/15/2042 | | | | 851,700 | |
| | 25,000 | | | Ulster County, NY IDA (Mid-Hudson Family Health Institute)1 | | | 5.300 | | | | 07/01/2016 | | | | 25,267 | |
| | 4,000,000 | | | Utica, NY IDA (Utica College Civic Facility) | | | 5.750 | | | | 08/01/2028 | | | | 3,479,280 | |
| | 1,250,000 | | | Utica, NY IDA (Utica College Civic Facility) | | | 6.750 | | | | 12/01/2021 | | | | 1,267,488 | |
| | 30,000 | | | Voorheesville, NY GO | | | 5.000 | | | | 02/15/2023 | | | | 29,189 | |
| | 35,000 | | | Voorheesville, NY GO | | | 5.000 | | | | 02/15/2024 | | | | 33,761 | |
| | 35,000 | | | Voorheesville, NY GO | | | 5.000 | | | | 02/15/2025 | | | | 33,489 | |
| | 35,000 | | | Voorheesville, NY GO | | | 5.000 | | | | 02/15/2026 | | | | 33,281 | |
| | 40,000 | | | Voorheesville, NY GO | | | 5.000 | | | | 02/15/2027 | | | | 37,951 | |
| | 40,000 | | | Voorheesville, NY GO | | | 5.000 | | | | 02/15/2028 | | | | 37,750 | |
| | 40,000 | | | Voorheesville, NY GO | | | 5.000 | | | | 02/15/2029 | | | | 37,565 | |
| | 45,000 | | | Voorheesville, NY GO | | | 5.000 | | | | 02/15/2030 | | | | 41,922 | |
| | 45,000 | | | Voorheesville, NY GO | | | 5.000 | | | | 02/15/2031 | | | | 41,577 | |
| | 50,000 | | | Voorheesville, NY GO | | | 5.000 | | | | 02/15/2032 | | | | 46,107 | |
| | 50,000 | | | Voorheesville, NY GO | | | 5.000 | | | | 02/15/2033 | | | | 45,972 | |
| | 55,000 | | | Voorheesville, NY GO | | | 5.000 | | | | 02/15/2034 | | | | 50,457 | |
| | 55,000 | | | Voorheesville, NY GO | | | 5.000 | | | | 02/15/2035 | | | | 50,195 | |
| | 60,000 | | | Voorheesville, NY GO | | | 5.000 | | | | 02/15/2036 | | | | 54,364 | |
| | 60,000 | | | Voorheesville, NY GO | | | 5.000 | | | | 02/15/2037 | | | | 54,201 | |
| | 370,000 | | | Westchester County, NY IDA (Field Home) | | | 6.500 | | | | 08/15/2022 | | | | 337,174 | |
| | 250,000 | | | Westchester County, NY IDA (Guiding Eyes for the Blind)1 | | | 5.375 | | | | 08/01/2024 | | | | 226,318 | |
| | 1,765,000 | | | Westchester County, NY IDA (Rippowam-Cisqua School)1 | | | 5.750 | | | | 06/01/2029 | | | | 1,495,079 | |
| | 320,000 | | | Westchester County, NY IDA (Schnurmacher Center) | | | 6.500 | | | | 11/01/2013 | | | | 319,165 | |
| | 600,000 | | | Westchester County, NY IDA (Schnurmacher Center) | | | 6.500 | | | | 11/01/2033 | | | | 536,724 | |
F11 | OPPENHEIMER AMT-FREE NEW YORK MUNICIPALS
STATEMENT OF INVESTMENTS Continued
| | | | | | | | | | | | | | | | | |
| Principal | | | | | | | | | | | | |
| Amount | | | | | Coupon | | | Maturity | | | Value | |
| |
| New York Continued | | | | | | | | | | | | |
| $ | 300,000 | | | Westchester County, NY Tobacco Asset Securitization Corp.1 | | | 5.000 | % | | | 06/01/2026 | | | $ | 256,617 | |
| | 10,790,000 | | | Westchester County, NY Tobacco Asset Securitization Corp. | | | 5.125 | | | | 06/01/2045 | | | | 8,278,520 | |
| | | | | | | | | | | | | | | | |
| | | | | | | | | | | | | | | | 1,053,968,106 | |
| | | | | | | | | | | | | | | | | |
| U.S. Possessions—37.7% | | | | | | | | | | | | |
| | 3,280,000 | | | Guam GO1 | | | 5.400 | | | | 11/15/2018 | | | | 3,094,024 | |
| | 1,000,000 | | | Guam Government Waterworks Authority and Wastewater System1 | | | 5.875 | | | | 07/01/2035 | | | | 894,340 | |
| | 5,295,000 | | | Guam Power Authority, Series A1 | | | 5.125 | | | | 10/01/2029 | | | | 4,682,527 | |
| | 10,100,000 | | | Guam Power Authority, Series A1 | | | 5.250 | | | | 10/01/2034 | | | | 8,927,895 | |
| | 1,000,000 | | | Guam Tobacco Settlement Economic Devel. & Commerce Authority (TASC) | | | 5.625 | | | | 06/01/2047 | | | | 833,130 | |
| | 21,210,000 | | | Puerto Rico Aqueduct & Sewer Authority1 | | | 0.000 | 5 | | | 07/01/2024 | | | | 17,148,709 | |
| | 16,060,000 | | | Puerto Rico Aqueduct & Sewer Authority1,2 | | | 6.000 | | | | 07/01/2038 | | | | 15,351,915 | |
| | 14,645,000 | | | Puerto Rico Aqueduct & Sewer Authority | | | 6.000 | | | | 07/01/2044 | | | | 13,952,145 | |
| | 15,000 | | | Puerto Rico Children’s Trust Fund (TASC)1 | | | 5.375 | | | | 05/15/2033 | | | | 13,006 | |
| | 11,900,000 | | | Puerto Rico Children’s Trust Fund (TASC) | | | 5.500 | | | | 05/15/2039 | | | | 9,904,251 | |
| | 30,000,000 | | | Puerto Rico Children’s Trust Fund (TASC) | | | 5.625 | | | | 05/15/2043 | | | | 25,290,900 | |
| | 124,000,000 | | | Puerto Rico Children’s Trust Fund (TASC) | | | 6.426 | 3 | | | 05/15/2050 | | | | 4,460,280 | |
| | 4,030,000 | | | Puerto Rico Commonwealth GO1 | | | 5.000 | | | | 07/01/2027 | | | | 3,571,305 | |
| | 5,200,000 | | | Puerto Rico Commonwealth GO1 | | | 5.250 | | | | 07/01/2024 | | | | 4,810,624 | |
| | 4,940,000 | | | Puerto Rico Commonwealth GO1 | | | 5.250 | | | | 07/01/2031 | | | | 4,409,889 | |
| | 12,380,000 | | | Puerto Rico Commonwealth GO1 | | | 5.250 | | | | 07/01/2032 | | | | 11,025,133 | |
| | 1,185,000 | | | Puerto Rico Commonwealth GO1 | | | 5.250 | | | | 07/01/2034 | | | | 1,047,907 | |
| | 3,500,000 | | | Puerto Rico Commonwealth GO1 | | | 5.250 | | | | 07/01/2037 | | | | 3,064,460 | |
| | 1,005,000 | | | Puerto Rico Commonwealth GO1 | | | 5.500 | | | | 07/01/2018 | | | | 1,006,407 | |
| | 10,000,000 | | | Puerto Rico Commonwealth GO1 | | | 5.500 | | | | 07/01/2021 | | | | 9,705,000 | |
| | 27,225,000 | | | Puerto Rico Commonwealth GO1 | | | 5.500 | | | | 07/01/2032 | | | | 25,091,105 | |
| | 5,235,000 | | | Puerto Rico Commonwealth GO | | | 6.000 | | | | 07/01/2027 | | | | 5,159,145 | |
| | 580,000 | | | Puerto Rico Commonwealth GO | | | 6.000 | | | | 07/01/2028 | | | | 572,019 | |
| | 19,075,000 | | | Puerto Rico Electric Power Authority, Series TT1 | | | 5.000 | | | | 07/01/2032 | | | | 16,762,156 | |
| | 3,575,000 | | | Puerto Rico Electric Power Authority, Series TT1 | | | 5.000 | | | | 07/01/2037 | | | | 3,100,848 | |
| | 40,500,000 | | | Puerto Rico Electric Power Authority, Series UU6 | | | 2.550 | 4 | | | 07/01/2045 | | | | 26,677,148 | |
| | 19,600,000 | | | Puerto Rico Electric Power Authority, Series UU6 | | | 2.570 | 4 | | | 07/01/2031 | | | | 12,910,422 | |
| | 10,000,000 | | | Puerto Rico Electric Power Authority, Series UU7 | | | 2.550 | 4 | | | 07/01/2025 | | | | 6,750,000 | |
| | 2,000,000 | | | Puerto Rico Electric Power Authority, Series WW1 | | | 5.250 | | | | 07/01/2033 | | | | 1,795,820 | |
| | 10,000,000 | | | Puerto Rico Electric Power Authority, Series WW1 | | | 5.500 | | | | 07/01/2038 | | | | 9,374,800 | |
| | 200,000 | | | Puerto Rico HFA Capital Fund Modernization (Puerto Rico Public Hsg.)1 | | | 5.125 | | | | 12/01/2027 | | | | 184,052 | |
F12 | OPPENHEIMER AMT-FREE NEW YORK MUNICIPALS
| | | | | | | | | | | | | | | | | |
| Principal | | | | | | | | | | | | |
| Amount | | | | | Coupon | | | Maturity | | | Value | |
| |
| U.S. Possessions Continued | | | | | | | | | | | | |
| $ | 355,000 | | | Puerto Rico Highway & Transportation Authority1 | | | 5.000 | % | | | 07/01/2028 | | | $ | 313,082 | |
| | 15,000 | | | Puerto Rico Highway & Transportation Authority, Series A1 | | | 5.000 | | | | 07/01/2038 | | | | 12,837 | |
| | 1,100,000 | | | Puerto Rico Highway & Transportation Authority, Series AA1 | | | 5.000 | | | | 07/01/2035 | | | | 933,614 | |
| | 7,045,000 | | | Puerto Rico Highway & Transportation Authority, Series G | | | 5.000 | | | | 07/01/2042 | | | | 5,985,221 | |
| | 5,000,000 | | | Puerto Rico Highway & Transportation Authority, Series K1 | | | 5.000 | | | | 07/01/2027 | | | | 4,430,900 | |
| | 20,855,000 | | | Puerto Rico Highway & Transportation Authority, Series K1 | | | 5.000 | | | | 07/01/2030 | | | | 18,200,576 | |
| | 5,000,000 | | | Puerto Rico Highway & Transportation Authority, Series M | | | 5.000 | | | | 07/01/2046 | | | | 4,209,050 | |
| | 22,000,000 | | | Puerto Rico Highway & Transportation Authority, Series N6 | | | 2.400 | 4 | | | 07/01/2045 | | | | 12,539,977 | |
| | 20,225,000 | | | Puerto Rico Highway & Transportation Authority, Series N | | | 5.250 | | | | 07/01/2039 | | | | 18,327,895 | |
| | 5,480,000 | | | Puerto Rico IMEPCF (American Airlines)1 | | | 6.450 | | | | 12/01/2025 | | | | 2,847,901 | |
| | 24,550,000 | | | Puerto Rico Infrastructure | | | 5.000 | | | | 07/01/2041 | | | | 20,891,805 | |
| | 43,180,000 | | | Puerto Rico Infrastructure | | | 5.000 | | | | 07/01/2046 | | | | 36,349,356 | |
| | 15,000,000 | | | Puerto Rico Infrastructure | | | 5.650 | 5 | | | 07/01/2029 | | | | 4,044,900 | |
| | 105,000 | | | Puerto Rico ITEMECF (Guaynabo Municipal Government Center)1 | | | 5.625 | | | | 07/01/2022 | | | | 100,485 | |
| | 4,305,000 | | | Puerto Rico ITEMECF (Polytechnic University)1 | | | 5.000 | | | | 08/01/2022 | | | | 3,735,362 | |
| | 5,000,000 | | | Puerto Rico Public Buildings Authority1 | | | 5.000 | | | | 07/01/2036 | | | | 4,285,800 | |
| | 2,500,000 | | | Puerto Rico Public Buildings Authority1 | | | 5.000 | | | | 07/01/2037 | | | | 2,141,050 | |
| | 10,000 | | | Puerto Rico Public Buildings Authority1 | | | 5.125 | | | | 07/01/2022 | | | | 9,223 | |
| | 910,000 | | | Puerto Rico Public Buildings Authority1 | | | 5.250 | | | | 07/01/2029 | | | | 818,554 | |
| | 1,000,000 | | | Puerto Rico Public Buildings Authority1 | | | 6.000 | | | | 07/01/2028 | | | | 986,240 | |
| | 1,000,000 | | | Puerto Rico Public Buildings Authority, Series D1 | | | 5.250 | | | | 07/01/2036 | | | | 878,400 | |
| | 16,000,000 | | | Puerto Rico Sales Tax Financing Corp., Series A6 | | | 2.806 | 4 | | | 08/01/2057 | | | | 10,560,000 | |
| | 35,495,000 | | | Puerto Rico Sales Tax Financing Corp., Series A | | | 5.250 | | | | 08/01/2057 | | | | 31,727,916 | |
| | 19,000,000 | | | Puerto Rico Sales Tax Financing Corp., Series A | | | 5.950 | 3 | | | 08/01/2056 | | | | 891,290 | |
| | 402,125,000 | | | Puerto Rico Sales Tax Financing Corp., Series A | | | 6.461 | 3 | | | 08/01/2054 | | | | 22,454,660 | |
| | 4,080,000 | | | University of Puerto Rico1 | | | 5.000 | | | | 06/01/2025 | | | | 3,645,562 | |
| | 1,000,000 | | | University of Puerto Rico1 | | | 5.000 | | | | 06/01/2025 | | | | 902,290 | |
| | 5,925,000 | | | University of Puerto Rico, Series Q1 | | | 5.000 | | | | 06/01/2030 | | | | 5,172,347 | |
| | 1,700,000 | | | University of Puerto Rico, Series Q1 | | | 5.000 | | | | 06/01/2036 | | | | 1,457,478 | |
| | 1,000,000 | | | University of V.I. Series A1 | | | 5.375 | | | | 06/01/2034 | | | | 869,280 | |
| | 1,700,000 | | | V.I. Public Finance Authority (Gross Receipts Taxes Loan)1 | | | 5.000 | | | | 10/01/2031 | | | | 1,528,453 | |
| | 1,485,000 | | | V.I. Public Finance Authority, Series A1 | | | 5.500 | | | | 10/01/2022 | | | | 1,401,899 | |
| | 250,000 | | | V.I. Water & Power Authority | | | 5.300 | | | | 07/01/2018 | | | | 239,842 | |
| | | | | | | | | | | | | | | | |
| | | | | | | | | | | | | | | | 474,464,607 | |
| | | | | | | | | | | | | | | | | |
| Total Investments, at Value (Cost $1,764,363,711)–121.4% | | | | | | | | | | | 1,528,432,713 | |
| Liabilities in Excess of Other Assets–(21.4) | | | | | | | | | | | (269,434,083 | ) |
| | | | | | | | | | | | | | | | |
| Net Assets–100.0% | | | | | | | | | | $ | 1,258,998,630 | |
| | | | | | | | | | | | | | | | |
Industry classifications are unaudited.
F13 | OPPENHEIMER AMT-FREE NEW YORK MUNICIPALS
STATEMENT OF INVESTMENTS Continued
Footnotes to Statement of Investments
| | |
| 1. | | All or a portion of the security has been segregated for collateral to cover borrowings. See Note 6 of accompanying Notes. |
| |
| 2. | | When-issued security or delayed delivery to be delivered and settled after September 30, 2008. See Note 1 of accompanying Notes. |
| |
| 3. | | Zero coupon bond reflects effective yield on the date of purchase. |
| |
| 4. | | Represents the current interest rate for a variable or increasing rate security. |
| |
| 5. | | Denotes a step bond: a zero coupon bond that converts to a fixed or variable interest rate at a designated future date. |
| |
| 6. | | Security represents the underlying municipal bond on an inverse floating rate security. The bond was purchased by the Fund and subsequently segregated and transferred to a trust. See Note 1 of accompanying Notes. |
| |
| 7. | | Illiquid security. The aggregate value of illiquid securities as of September 30, 2008 was $23,286,267, which represents 1.85% of the Fund’s net assets. See Note 5 of accompanying Notes. |
| |
| 8. | | Subject to a deferred-interest forebearance agreement. Rate shown is current rate. See Note 1 of accompanying Notes. |
To simplify the listings of securities, abbreviations are used per the table below:
| | | |
| ACDS | | Assoc. for Children with Down Syndrome |
| ACLD | | Adults and Children with Learning and Developmental Disabilities |
| ALIA | | Alliance of Long Island Agencies |
| AP | | Advantage Planning, Inc. |
| ARC | | Assoc. of Retarded Citizens |
| CCRC | | Continuing Care Retirement Community |
| CMA | | Community Mainstreaming Associates, Inc. |
| COP | | Certificates of Participation |
| CSMR | | Community Services for the Mentally Retarded |
| DA | | Dormitory Authority |
| DDI | | Developmental Disabilities Institute |
| DRIVERS | | Derivative Inverse Tax Exempt Receipts |
| EFC | | Environmental Facilities Corp. |
| EFLI | | Epilepsy Foundation of L.I., Inc. |
| ERDA | | Energy Research and Devel. Authority |
| FREE | | Family Residences and Essential Enterprises |
| GO | | General Obligation |
| HAII | | Homes Anew II, Inc. |
| HDC | | Housing Devel. Corp. |
| HFA | | Housing Finance Agency |
| HJDOI | | Hospital for Joint Diseases Orthopedic Institute |
| IDA | | Industrial Devel. Agency |
| IGHL | | Independent Group Home for Living |
| IMEPCF | | Industrial, Medical and Environmental Pollution Control Facilities |
| ITEMECF | | Industrial, Tourist, Educational, Medical and Environmental Community Facilities |
| L.I. | | Long Island |
| LIHIA | | Long Island Head Injury Assoc. |
| LIMC | | Long Island Medical Center |
| MSH/NYU | | Mount Sinai Hospital/New York University |
| MTA | | Metropolitan Transportation Authority |
| NCMRS | | Nassau Community Mental Retardation Services Company |
| NSLIJHS | | North Shore Long Island Jewish Health System |
| NSUHGC | | North Shore University Hospital at Glen Cove |
| NY/NJ | | New York/New Jersey |
| NYC | | New York City |
| NYS | | New York State |
| NYU | | New York University |
| PSCH | | Professional Service Centers for the Handicapped, Inc. |
| RITES | | Residual Interest Tax Exempt Security |
| ROLs | | Residual Option Longs |
| SONYMA | | State of New York Mortgage Agency |
| TASC | | Tobacco Settlement Asset-Backed Bonds |
| TFABs | | Tobacco Flexible Amortization Bonds |
| UCPAGS | | United Cerebral Palsy Assoc. of Greater Suffolk |
| UDC | | Urban Devel. Corp. |
| UVBH | | United Veteran’s Beacon House |
| V.I. | | United States Virgin Islands |
| WORCA | | Working Organization for Retarded Children and Adults |
| YMCA | | Young Men’s Christian Assoc. |
See accompanying Notes to Financial Statements.
F14 | OPPENHEIMER AMT-FREE NEW YORK MUNICIPALS
STATEMENT OF ASSETS AND LIABILITIES September 30, 2008
| | | | | |
Assets | | | | |
| Investments, at value (cost $1,764,363,711)—see accompanying statement of investments | | $ | 1,528,432,713 | |
| Receivables and other assets: | | | | |
| Investments sold (including $68,302,512 sold on a when-issued or delayed delivery basis) | | | 78,715,271 | |
| Interest | | | 22,314,104 | |
| Shares of beneficial interest sold | | | 1,677,678 | |
| Other | | | 132,077 | |
| | | | |
| Total assets | | | 1,631,271,843 | |
| | | | | |
Liabilities | | | | |
| Bank overdraft | | | 3,961,123 | |
| Payables and other liabilities: | | | | |
| Payable for short-term floating rate notes issued (See Note 1) | | | 249,550,000 | |
| Investments purchased (including $93,415,116 purchased on a when-issued or delayed delivery basis) | | | 110,931,353 | |
| Shares of beneficial interest redeemed | | | 3,525,295 | |
| Payable on borrowings (See Note 6) | | | 2,000,000 | |
| Dividends | | | 1,141,996 | |
| Distribution and service plan fees | | | 807,664 | |
| Trustees’ compensation | | | 187,654 | |
| Shareholder communications | | | 44,229 | |
| Transfer and shareholder servicing agent fees | | | 39,208 | |
| Interest expense on borrowings | | | 13,462 | |
| Other | | | 71,229 | |
| | | | |
| Total liabilities | | | 372,273,213 | |
| | | | | |
Net Assets | | $ | 1,258,998,630 | |
| | | | |
| | | | | |
Composition of Net Assets | | | | |
| Par value of shares of beneficial interest | | $ | 118,726 | |
| Additional paid-in capital | | | 1,508,595,898 | |
| Accumulated net investment income | | | 5,782,013 | |
| Accumulated net realized loss on investments | | | (19,567,009 | ) |
| Net unrealized depreciation on investments | | | (235,930,998 | ) |
| | | | |
| |
Net Assets | | $ | 1,258,998,630 | |
| | | | |
F15 | OPPENHEIMER AMT-FREE NEW YORK MUNICIPALS
STATEMENT OF ASSETS AND LIABILITIES Continued
| | | | | |
Net Asset Value Per Share | | | | |
| |
| Class A Shares: | | | | |
| Net asset value and redemption price per share (based on net assets of $1,095,340,999 and 103,297,854 shares of beneficial interest outstanding) | | $ | 10.60 | |
| Maximum offering price per share (net asset value plus sales charge of 4.75% of offering price) | | $ | 11.13 | |
| |
| Class B Shares: | | | | |
| Net asset value, redemption price (excludes applicable contingent deferred sales charge) and offering price per share (based on net assets of $22,079,293 and 2,081,339 shares of beneficial interest outstanding) | | $ | 10.61 | |
| |
| Class C Shares: | | | | |
| Net asset value, redemption price (excludes applicable contingent deferred sales charge) and offering price per share (based on net assets of $141,578,338 and 13,346,631 shares of beneficial interest outstanding) | | $ | 10.61 | |
See accompanying Notes to Financial Statements.
F16 | OPPENHEIMER AMT-FREE NEW YORK MUNICIPALS
STATEMENT OF OPERATIONS For the Year Ended September 30, 2008
| | | | | |
Investment Income | | | | |
| |
| Interest | | $ | 93,937,122 | |
| Other income | | | 2,975 | |
| | | | |
| Total investment income | | | 93,940,097 | |
| | | | | |
Expenses | | | | |
| |
| Management fees | | | 6,396,472 | |
| Distribution and service plan fees: | | | | |
| Class A | | | 2,896,847 | |
| Class B | | | 276,463 | |
| Class C | | | 1,610,843 | |
| Transfer and shareholder servicing agent fees: | | | | |
| Class A | | | 366,119 | |
| Class B | | | 21,864 | |
| Class C | | | 66,902 | |
| Shareholder communications: | | | | |
| Class A | | | 106,273 | |
| Class B | | | 6,447 | |
| Class C | | | 17,083 | |
| Interest expense and fees on short-term floating rate notes issued (See Note 1) | | | 8,642,002 | |
| Interest expense on borrowings | | | 945,613 | |
| Custodian fees and expenses | | | 68,058 | |
| Trustees’ compensation | | | 54,924 | |
| Other | | | 412,458 | |
| | | | |
| Total expenses | | | 21,888,368 | |
| Less reduction to custodian expenses | | | (27,565 | ) |
| | | | |
| Net expenses | | | 21,860,803 | |
| | | | | |
Net Investment Income | | | 72,079,294 | |
| | | | | |
Realized and Unrealized Gain (Loss) | | | | |
| Net realized gain (loss) on: | | | | |
| Investments | | | (11,623,182 | ) |
| Increase from payment by affiliate | | | 60,414 | |
| | | | |
| Net realized loss | | | (11,562,768 | ) |
| Net change in unrealized depreciation on investments | | | (240,934,289 | ) |
| | | | | |
Net Decrease in Net Assets Resulting from Operations | | $ | (180,417,763 | ) |
| | | | |
See accompanying Notes to Financial Statements.
F17 | OPPENHEIMER AMT-FREE NEW YORK MUNICIPALS
STATEMENTS OF CHANGES IN NET ASSETS
| | | | | | | | | |
| Year Ended September 30, | | 2008 | | | 2007 | |
| |
Operations | | | | | | | | |
| |
| Net investment income | | $ | 72,079,294 | | | $ | 57,657,872 | |
| Net realized loss | | | (11,562,768 | ) | | | (6,766,269 | ) |
| Net change in unrealized appreciation (depreciation) | | | (240,934,289 | ) | | | (56,008,516 | ) |
| | | |
| Net decrease in net assets resulting from operations | | | (180,417,763 | ) | | | (5,116,913 | ) |
| | | | | | | | | |
Dividends and/or Distributions to Shareholders | | | | | | | | |
| |
| Dividends from net investment income: | | | | | | | | |
| Class A | | | (58,981,189 | ) | | | (50,787,239 | ) |
| Class B | | | (1,075,501 | ) | | | (1,144,591 | ) |
| Class C | | | (6,361,364 | ) | | | (5,020,664 | ) |
| | | |
| | | | (66,418,054 | ) | | | (56,952,494 | ) |
| Distributions from net realized gain: | | | | | | | | |
| Class A | | | — | | | | (125,198 | ) |
| Class B | | | — | | | | (3,742 | ) |
| Class C | | | — | | | | (14,095 | ) |
| | | |
| | | | — | | | | (143,035 | ) |
| | | | | | | | | |
Beneficial Interest Transactions | | | | | | | | |
| |
| Net increase (decrease) in net assets resulting from beneficial interest transactions: | | | | | | | | |
| Class A | | | 34,304,971 | | | | 323,496,770 | |
| Class B | | | (4,358,755 | ) | | | (466,729 | ) |
| Class C | | | 5,340,254 | | | | 64,362,269 | |
| | | |
| | | | 35,286,470 | | | | 387,392,310 | |
| | | | | | | | | |
Net Assets | | | | | | | | |
| |
| Total increase (decrease) | | | (211,549,347 | ) | | | 325,179,868 | |
| Beginning of period | | | 1,470,547,977 | | | | 1,145,368,109 | |
| | | |
| | | | | | | | | |
| End of period (including accumulated net investment income of $5,782,013 and $120,773, respectively) | | $ | 1,258,998,630 | | | $ | 1,470,547,977 | |
| | | |
See accompanying Notes to Financial Statements.
F18 | OPPENHEIMER AMT-FREE NEW YORK MUNICIPALS
STATEMENT OF CASH FLOWS For the Year Ended September 30, 2008
| | | | | |
Cash Flows from Operating Activities | | | | |
| Net decrease in net assets from operations | | $ | (180,417,763 | ) |
| Adjustments to reconcile net decrease in net assets from operations to net cash provided by operating activities: | | | | |
| Purchase of investment securities | | | (525,313,050 | ) |
| Proceeds from disposition of investment securities | | | 537,570,324 | |
| Short-term investment securities, net | | | (17,558,799 | ) |
| Premium amortization | | | 2,447,134 | |
| Discount accretion | | | (5,932,367 | ) |
| Net realized loss on investments | | | 11,562,768 | |
| Net change in unrealized depreciation on investments | | | 240,934,289 | |
| Increase in interest receivable | | | (822,781 | ) |
| Increase in receivable for securities sold | | | (77,581,251 | ) |
| Increase in other assets | | | (82,007 | ) |
| Increase in payable for securities purchased | | | 104,318,512 | |
| Decrease in payable for accrued expenses | | | (86,823 | ) |
| | | | |
| Net cash provided by operating activities | | | 89,038,186 | |
| | | | | |
Cash Flows from Financing Activities | | | | |
| Proceeds from bank borrowings | | | 362,900,000 | |
| Payments on bank borrowings | | | (387,600,000 | ) |
| Payments on short-term floating rate notes issued | | | (42,115,000 | ) |
| Proceeds from shares sold | | | 407,657,348 | |
| Proceeds from bank overdraft | | | 3,961,123 | |
| Payments on shares redeemed | | | (413,085,534 | ) |
| Cash distributions paid | | | (21,241,742 | ) |
| | | | |
| Net cash used in financing activities | | | (89,523,805 | ) |
| Net decrease in cash | | | (485,619 | ) |
| Cash, beginning balance | | | 485,619 | |
| | | | |
| Cash, ending balance | | $ | — | |
| | | | |
Supplemental disclosure of cash flow information:
Noncash financing activities not included herein consist of reinvestment of dividends and distributions of $44,984,291.
Cash paid for interest on bank borrowings-$997,874.
Cash paid for interest on short-term floating rate notes issued-$8,642,002.
See accompanying Notes to Financial Statements.
F19 | OPPENHEIMER AMT-FREE NEW YORK MUNICIPALS
FINANCIAL HIGHLIGHTS
| | | | | | | | | | | | | | | | | | | | | |
| Class A Year Ended September 30, | | 2008 | | | 2007 | | | 2006 | | | 2005 | | | 2004 | |
| |
Per Share Operating Data | | | | | | | | | | | | | | | | | | | | |
| |
| Net asset value, beginning of period | | $ | 12.68 | | | $ | 13.22 | | | $ | 12.91 | | | $ | 12.45 | | | $ | 12.31 | |
| Income (loss) from investment operations: | | | | | | | | | | | | | | | | | | | | |
| Net investment income | | | .62 | 1 | | | .57 | 1 | | | .61 | 1 | | | .66 | 1 | | | .72 | |
| Net realized and unrealized gain (loss) | | | (2.13 | ) | | | (.55 | ) | | | .34 | | | | .49 | | | | .11 | |
| | | |
| Total from investment operations | | | (1.51 | ) | | | .02 | | | | .95 | | | | 1.15 | | | | .83 | |
| |
| Dividends and/or distributions to shareholders: | | | | | | | | | | | | | | | | | | | | |
| Dividends from net investment income | | | (.57 | ) | | | (.56 | ) | | | (.64 | ) | | | (.69 | ) | | | (.69 | ) |
| Distributions from net realized gain | | | — | | | | — | 2 | | | — | | | | — | | | | — | |
| | | |
| Total dividends and/or distributions to shareholders | | | (.57 | ) | | | (.56 | ) | | | (.64 | ) | | | (.69 | ) | | | (.69 | ) |
| |
| |
| Net asset value, end of period | | $ | 10.60 | | | $ | 12.68 | | | $ | 13.22 | | | $ | 12.91 | | | $ | 12.45 | |
| | | |
| | | | | | | | | | | | | | | | | | | | | |
Total Return, at Net Asset Value3 | | | (12.31 | )% | | | 0.15 | % | | | 7.61 | % | | | 9.41 | % | | | 6.91 | % |
| | | | | | | | | | | | | | | | | | | | | |
Ratios/Supplemental Data | | | | | | | | | | | | | | | | | | | | |
| |
| Net assets, end of period (in thousands) | | $ | 1,095,341 | | | $ | 1,275,590 | | | $ | 1,005,912 | | | $ | 659,975 | | | $ | 539,834 | |
| |
| Average net assets (in thousands) | | $ | 1,244,330 | | | $ | 1,181,757 | | | $ | 824,276 | | | $ | 580,413 | | | $ | 536,613 | |
| |
Ratios to average net assets:4 | | | | | | | | | | | | | | | | | | | | |
| Net investment income | | | 5.13 | % | | | 4.35 | % | | | 4.76 | % | | | 5.17 | % | | | 5.84 | % |
| Expenses excluding interest and fees on short-term floating rate notes issued | | | 0.82 | % | | | 0.82 | % | | | 0.90 | % | | | 0.93 | % | | | 0.91 | % |
Interest and fees on short-term floating rate notes issued5 | | | 0.60 | % | | | 0.69 | % | | | 0.61 | % | | | 0.43 | % | | | 0.26 | % |
| | | |
| Total expenses | | | 1.42 | % | | | 1.51 | % | | | 1.51 | % | | | 1.36 | % | | | 1.17 | % |
| Expenses after payments, waivers and/or reimbursements and reduction to custodian expenses | | | 1.42 | % | | | 1.51 | % | | | 1.51 | % | | | 1.36 | % | | | 1.14 | % |
| |
| Portfolio turnover rate | | | 34 | % | | | 26 | % | | | 36 | % | | | 8 | % | | | 5 | % |
| | |
| 1. | | Per share amounts calculated based on the average shares outstanding during the period. |
| |
| 2. | | Less than $0.005 per share. |
| |
| 3. | | Assumes an investment on the business day before the first day of the fiscal period, with all dividends and distributions reinvested in additional shares on the reinvestment date, and redemption at the net asset value calculated on the last business day of the fiscal period. Sales charges are not reflected in the total returns. Total returns are not annualized for periods less than one full year. Returns do not reflect the deduction of taxes that a shareholder would pay on fund distributions or the redemption of fund shares. |
| |
| 4. | | Annualized for periods less than one full year. |
| |
| 5. | | Interest and fee expense relates to the Fund’s liability for short-term floating rate notes issued in conjuction with inverse floating rate security transactions. See Note 1 of accompanying Notes. |
See accompanying Notes to Financial Statements.
F20 | OPPENHEIMER AMT-FREE NEW YORK MUNICIPALS
| | | | | | | | | | | | | | | | | | | | | |
| Class B Year Ended September 30, | | 2008 | | | 2007 | | | 2006 | | | 2005 | | | 2004 | |
| |
Per Share Operating Data | | | | | | | | | | | | | | | | | | | | |
| |
| Net asset value, beginning of period | | $ | 12.68 | | | $ | 13.22 | | | $ | 12.91 | | | $ | 12.45 | | | $ | 12.32 | |
| |
| Income (loss) from investment operations: | | | | | | | | | | | | | | | | | | | | |
| Net investment income | | | .52 | 1 | | | .47 | 1 | | | .51 | 1 | | | .56 | 1 | | | .62 | |
| Net realized and unrealized gain (loss) | | | (2.12 | ) | | | (.55 | ) | | | .34 | | | | .49 | | | | .10 | |
| | | |
| Total from investment operations | | | (1.60 | ) | | | (.08 | ) | | | .85 | | | | 1.05 | | | | .72 | |
| |
| Dividends and/or distributions to shareholders: | | | | | | | | | | | | | | | | | | | | |
| Dividends from net investment income | | | (.47 | ) | | | (.46 | ) | | | (.54 | ) | | | (.59 | ) | | | (.59 | ) |
| Distributions from net realized gain | | | — | | | | — | 2 | | | — | | | | — | | | | — | |
| | | |
| Total dividends and/or distributions to shareholders | | | (.47 | ) | | | (.46 | ) | | | (.54 | ) | | | (.59 | ) | | | (.59 | ) |
| |
| |
| Net asset value, end of period | | $ | 10.61 | | | $ | 12.68 | | | $ | 13.22 | | | $ | 12.91 | | | $ | 12.45 | |
| | | |
| | | | | | | | | | | | | | | | | | | | | |
Total Return, at Net Asset Value3 | | | (12.96 | )% | | | (0.65 | )% | | | 6.76 | % | | | 8.55 | % | | | 5.99 | % |
| | | | | | | | | | | | | | | | | | | | | |
Ratios/Supplemental Data | | | | | | | | | | | | | | | | | | | | |
| |
| Net assets, end of period (in thousands) | | $ | 22,079 | | | $ | 30,982 | | | $ | 32,793 | | | $ | 26,680 | | | $ | 27,555 | |
| |
| Average net assets (in thousands) | | $ | 27,621 | | | $ | 32,663 | | | $ | 29,544 | | | $ | 26,977 | | | $ | 30,212 | |
| |
Ratios to average net assets:4 | | | | | | | | | | | | | | | | | | | | |
| Net investment income | | | 4.29 | % | | | 3.55 | % | | | 3.99 | % | | | 4.41 | % | | | 5.05 | % |
| Expenses excluding interest and fees on short-term floating rate notes issued | | | 1.65 | % | | | 1.62 | % | | | 1.70 | % | | | 1.71 | % | | | 1.69 | % |
Interest and fees on short-term floating rate notes issued5 | | | 0.60 | % | | | 0.69 | % | | | 0.61 | % | | | 0.43 | % | | | 0.26 | % |
| | | |
| Total expenses | | | 2.25 | % | | | 2.31 | % | | | 2.31 | % | | | 2.14 | % | | | 1.95 | % |
| Expenses after payments, waivers and/or reimbursements and reduction to custodian expenses | | | 2.25 | % | | | 2.31 | % | | | 2.30 | % | | | 2.14 | % | | | 1.92 | % |
| |
| Portfolio turnover rate | | | 34 | % | | | 26 | % | | | 36 | % | | | 8 | % | | | 5 | % |
| | |
| 1. | | Per share amounts calculated based on the average shares outstanding during the period. |
| |
| 2. | | Less than $0.005 per share. |
| |
| 3. | | Assumes an investment on the business day before the first day of the fiscal period, with all dividends and distributions reinvested in additional shares on the reinvestment date, and redemption at the net asset value calculated on the last business day of the fiscal period. Sales charges are not reflected in the total returns. Total returns are not annualized for periods less than one full year. Returns do not reflect the deduction of taxes that a shareholder would pay on fund distributions or the redemption of fund shares. |
| |
| 4. | | Annualized for periods less than one full year. |
| |
| 5. | | Interest and fee expense relates to the Fund’s liability for short-term floating rate notes issued in conjuction with inverse floating rate security transactions. See Note 1 of accompanying Notes. |
See accompanying Notes to Financial Statements.
F21 | OPPENHEIMER AMT-FREE NEW YORK MUNICIPALS
FINANCIAL HIGHLIGHTS Continued
| | | | | | | | | | | | | | | | | | | | | |
| Class C Year Ended September 30, | | 2008 | | | 2007 | | | 2006 | | | 2005 | | | 2004 | |
| |
Per Share Operating Data | | | | | | | | | | | | | | | | | | | | |
| |
| Net asset value, beginning of period | | $ | 12.68 | | | $ | 13.22 | | | $ | 12.91 | | | $ | 12.45 | | | $ | 12.32 | |
| |
| Income (loss) from investment operations: | | | | | | | | | | | | | | | | | | | | |
| Net investment income | | | .53 | 1 | | | .47 | 1 | | | .50 | 1 | | | .55 | 1 | | | .62 | |
| Net realized and unrealized gain (loss) | | | (2.12 | ) | | | (.55 | ) | | | .35 | | | | .50 | | | | .10 | |
| | | |
| Total from investment operations | | | (1.59 | ) | | | (.08 | ) | | | .85 | | | | 1.05 | | | | .72 | |
| |
| Dividends and/or distributions to shareholders: | | | | | | | | | | | | | | | | | | | | |
| Dividends from net investment income | | | (.48 | ) | | | (.46 | ) | | | (.54 | ) | | | (.59 | ) | | | (.59 | ) |
| Distributions from net realized gain | | | — | | | | — | 2 | | | — | | | | — | | | | — | |
| | | |
| Total dividends and/or distributions to shareholders | | | (.48 | ) | | | (.46 | ) | | | (.54 | ) | | | (.59 | ) | | | (.59 | ) |
| |
| |
| Net asset value, end of period | | $ | 10.61 | | | $ | 12.68 | | | $ | 13.22 | | | $ | 12.91 | | | $ | 12.45 | |
| | | |
| | | | | | | | | | | | | | | | | | | | | |
Total Return, at Net Asset Value3 | | | (12.92 | )% | | | (0.62 | )% | | | 6.78 | % | | | 8.55 | % | | | 5.99 | % |
| | | | | | | | | | | | | | | | | | | | | |
Ratios/Supplemental Data | | | | | | | | | | | | | | | | | | | | |
| |
| Net assets, end of period (in thousands) | | $ | 141,579 | | | $ | 163,976 | | | $ | 106,663 | | | $ | 31,119 | | | $ | 15,723 | |
| |
| Average net assets (in thousands) | | $ | 160,910 | | | $ | 142,905 | | | $ | 64,991 | | | $ | 20,347 | | | $ | 14,598 | |
| |
Ratios to average net assets:4 | | | | | | | | | | | | | | | | | | | | |
| Net investment income | | | 4.35 | % | | | 3.58 | % | | | 3.89 | % | | | 4.32 | % | | | 5.04 | % |
| Expenses excluding interest and fees on short-term floating rate notes issued | | | 1.60 | % | | | 1.59 | % | | | 1.66 | % | | | 1.70 | % | | | 1.69 | % |
Interest and fees on short-term floating rate notes issued5 | | | 0.60 | % | | | 0.69 | % | | | 0.61 | % | | | 0.43 | % | | | 0.26 | % |
| | | |
| Total expenses | | | 2.20 | % | | | 2.28 | % | | | 2.27 | % | | | 2.13 | % | | | 1.95 | % |
| Expenses after payments, waivers and/or reimbursements and reduction to custodian expenses | | | 2.20 | % | | | 2.28 | % | | | 2.27 | % | | | 2.13 | % | | | 1.92 | % |
| |
| Portfolio turnover rate | | | 34 | % | | | 26 | % | | | 36 | % | | | 8 | % | | | 5 | % |
| | |
| 1. | | Per share amounts calculated based on the average shares outstanding during the period. |
| |
| 2. | | Less than $0.005 per share. |
| |
| 3. | | Assumes an investment on the business day before the first day of the fiscal period, with all dividends and distributions reinvested in additional shares on the reinvestment date, and redemption at the net asset value calculated on the last business day of the fiscal period. Sales charges are not reflected in the total returns. Total returns are not annualized for periods less than one full year. Returns do not reflect the deduction of taxes that a shareholder would pay on fund distributions or the redemption of fund shares. |
| |
| 4. | | Annualized for periods less than one full year. |
| |
| 5. | | Interest and fee expense relates to the Fund’s liability for short-term floating rate notes issued in conjuction with inverse floating rate security transactions. See Note 1 of accompanying Notes. |
See accompanying Notes to Financial Statements.
F22 | OPPENHEIMER AMT-FREE NEW YORK MUNICIPALS
NOTES TO FINANCIAL STATEMENTS
1. Significant Accounting Policies
Oppenheimer AMT-Free New York Municipals (the “Fund”) is registered under the Investment Company Act of 1940, as amended, as an open-end management investment company. The Fund’s investment objective is to seek the maximum current income exempt from federal, New York State and New York City income taxes for individual investors consistent with preservation of capital. The Fund’s investment adviser is OppenheimerFunds, Inc. (the “Manager”).
The Fund offers Class A, Class B and Class C shares. Class A shares are sold at their offering price, which is normally net asset value plus a front-end sales charge. Class B and Class C shares are sold without a front-end sales charge but may be subject to a contingent deferred sales charge (“CDSC”). All classes of shares have identical rights and voting privileges with respect to the Fund in general and exclusive voting rights on matters that affect that class alone. Earnings, net assets and net asset value per share may differ due to each class having its own expenses, such as transfer and shareholder servicing agent fees and shareholder communications, directly attributable to that class. Class A, B and C have separate distribution and/or service plans. Class B shares will automatically convert to Class A shares 72 months after the date of purchase.
The following is a summary of significant accounting policies consistently followed by the Fund.
Securities Valuation. The Fund calculates the net asset value of its shares as of the close of the New York Stock Exchange (the “Exchange”), normally 4:00 P.M. Eastern time, on each day the Exchange is open for trading. Securities may be valued primarily using dealer-supplied valuations or a portfolio pricing service authorized by the Board of Trustees. Securities traded on a registered U.S. securities exchange are valued based on the last sale price of the security traded on that exchange prior to the time when the Fund’s assets are valued. Securities whose principal exchange is NASDAQ® are valued based on the closing price reported by NASDAQ prior to the time when the Fund’s assets are valued. In the absence of a sale, the security is valued at the last sale price on the prior trading day, if it is within the spread of the closing “bid” and “asked” prices, and if not, at the closing bid price. Securities traded on foreign exchanges are valued based on the last sale price on the principal exchange on which the security is traded, as identified by the portfolio pricing service, prior to the time when the Fund’s assets are valued. In the absence of a sale, the security is valued at the official closing price on the principal exchange. Corporate, government and municipal debt instruments having a remaining maturity in excess of sixty days and all mortgage-backed securities, collateralized mortgage obligations and other asset-backed securities will be valued at the mean between the “bid” and “asked” prices. Securities for which market quotations are not readily available are valued at their fair value. Securities whose values have been materially affected by what the Manager identifies as a significant event occurring before the Fund’s assets are valued but after the close of their respective exchanges will be fair valued. Fair value is determined in good faith using consistently applied procedures under the supervision of
F23 | OPPENHEIMER AMT-FREE NEW YORK MUNICIPALS
NOTES TO FINANCIAL STATEMENTS Continued
1. Significant Accounting Policies Continued
the Board of Trustees. Shares of a registered investment company that are not traded on an exchange are valued at the acquired investment company’s net asset value per share. “Money market-type” debt instruments with remaining maturities of sixty days or less are valued at cost adjusted by the amortization of discount or premium to maturity (amortized cost), which approximates market value.
Securities on a When-Issued or Delayed Delivery Basis. The Fund may purchase securities on a “when-issued” basis, and may purchase or sell securities on a “delayed delivery” basis. “When-issued” or “delayed delivery” refers to securities whose terms and indenture are available and for which a market exists, but which are not available for immediate delivery. Delivery and payment for securities that have been purchased by the Fund on a when-issued basis normally takes place within six months and possibly as long as two years or more after the trade date. During this period, such securities do not earn interest, are subject to market fluctuation and may increase or decrease in value prior to their delivery. The purchase of securities on a when-issued basis may increase the volatility of the Fund’s net asset value to the extent the Fund executes such transactions while remaining substantially fully invested. When the Fund engages in when-issued or delayed delivery transactions, it relies on the buyer or seller, as the case may be, to complete the transaction. Their failure to do so may cause the Fund to lose the opportunity to obtain or dispose of the security at a price and yield it considers advantageous. The Fund maintains internally designated assets with a market value equal to or greater than the amount of its purchase commitments. The Fund may also sell securities that it purchased on a when-issued basis or forward commitment prior to settlement of the original purchase.
As of September 30, 2008, the Fund had purchased securities issued on a when-issued or delayed delivery basis and sold securities issued on a delayed delivery basis as follows:
| | | | | |
| | | When-Issued or Delayed | |
| | | Delivery Basis Transactions | |
| |
| Purchased securities | | $ | 93,415,116 | |
| Sold securities | | | 68,302,512 | |
Inverse Floating Rate Securities. The Fund invests in inverse floating rate securities that pay interest at a rate that varies inversely with short-term interest rates. Certain of these securities may be leveraged, whereby the interest rate varies inversely at a multiple of the change in short-term rates. As interest rates rise, inverse floaters produce less current income. The price of such securities is more volatile than comparable fixed rate securities. The Fund may expose up to 20% of its total assets to the effects of leverage from its investments in inverse floaters. The Fund’s exposure to the effects of leverage from its investments in inverse floaters amount to $213,786,717 as of September 30, 2008, which represents 13.11% of the Fund’s total assets.
Certain inverse floating rate securities are created when the Fund purchases and subsequently transfers a municipal bond security (the “municipal bond”) to a broker dealer. The
F24 | OPPENHEIMER AMT-FREE NEW YORK MUNICIPALS
municipal bond is typically a fixed rate security. The broker dealer (the “sponsor”) creates a trust (the “Trust”) and deposits the municipal bond. The Trust issues short-term floating rate notes available to third parties and a residual interest in the municipal bond (referred to as an “inverse floating rate security”) to the Fund. The terms of these inverse floating rate securities grant the Fund the right to require that the Trust issuing the inverse floating rate security compel a tender of the short-term floating rate notes to facilitate the Fund’s repurchase of the underlying municipal bond. Following such a request, the Fund pays the sponsor the principal amount due to the holders of the short-term floating rate notes issued by the Trust and exchanges the inverse floating rate security for the underlying municipal bond. These transactions are considered secured borrowings for financial reporting purposes. As a result of such accounting treatments, the Fund includes the municipal bond position on its Statement of Investments (but do not separately include the inverse floating rate securities received). The Fund also includes the value of the municipal bond and a payable amount equal to the short-term floating rate notes issued by the Trust on its Statement of Assets and Liabilities. The interest rates on these short-term floating rate notes reset periodically, usually weekly. The holders of these short-term floating rate notes have the option to tender their investment, to the sponsor or the Trust’s liquidity provider, for redemption at par at each reset date. Income from the municipal bond position and the interest expense on the payable for the short-term floating rate notes issued by the Trust are recorded on the Fund’s Statement of Operations. At September 30, 2008, municipal bond holdings with a value of $300,224,087 shown on the Fund’s Statement of Investments are held by such Trusts and serve as collateral for the $249,550,000 in short-term floating rate notes issued and outstanding at that date.
At September 30, 2008, the Fund’s residual exposure to these types of inverse floating rate securities were as follows:
| | | | | | | | | | | | | | | | | |
| Principal | | | | | Coupon | | | Maturity | | | | |
| Amount | | | Inverse Floater1 | | Rate2 | | | Date | | | Value | |
| |
| $ | 3,460,000 | | | NY MTA ROLs3 | | | 2.910 | % | | | 11/15/31 | | | $ | 2,544,761 | |
| | 7,500,000 | | | NY MTA ROLs3 | | | 1.930 | | | | 11/15/31 | | | | 4,890,450 | |
| | 8,115,000 | | | NY Triborough Bridge & Tunnel Authority DRIVERS | | | 0.000 | 4 | | | 11/15/32 | | | | 6,903,512 | |
| | 2,560,000 | | | NY Triborough Bridge & Tunnel Authority DRIVERS | | | 0.320 | | | | 11/15/27 | | | | 2,157,312 | |
| | 10,000,000 | | | NY Triborough Bridge & Tunnel Authority DRIVERS | | | 0.320 | | | | 11/15/32 | | | | 8,009,400 | |
| | 6,070,000 | | | NY Triborough Bridge & Tunnel Authority ROLs3 | | | 0.000 | 4 | | | 11/15/29 | | | | 5,554,171 | |
| | 5,000,000 | | | NYC GO RITES | | | 1.917 | | | | 8/1/21 | | | | 4,477,700 | |
| | 6,670,000 | | | NYC Municipal Water Finance Authority DRIVERS | | | 0.000 | 4 | | | 6/15/35 | | | | 4,452,759 | |
| | 4,160,000 | | | NYC Municipal Water Finance Authority ROLs3 | | | 0.000 | | | | 6/15/37 | | | | 2,723,219 | |
| | 4,400,000 | | | NYS DA (St. Lukes Roosevelt Hospital Center) DRIVERS | | | 0.000 | 4 | | | 8/15/26 | | | | 2,950,728 | |
F25 | OPPENHEIMER AMT-FREE NEW YORK MUNICIPALS
NOTES TO FINANCIAL STATEMENTS Continued
1. Significant Accounting Policies Continued
| | | | | | | | | | | | | | | | | |
| Principal | | | | | Coupon | | | Maturity | | | | |
| Amount | | | Inverse Floater1 | | Rate2 | | | Date | | | Value | |
| |
| $ | 2,195,000 | | | NYS DA ROLs3 | | | 0.039 | % | | | 5/1/33 | | | $ | 198,340 | |
| | 9,570,000 | | | Port Authority NY/NJ, 3095th Series DRIVERS | | | 0.500 | | | | 12/1/34 | | | | 7,389,188 | |
| | 18,500,000 | | | Puerto Rico Electric Power Authority ROLs3 | | | 0.000 | | | | 7/1/31 | | | | (2,012,430 | ) |
| | 7,335,000 | | | Puerto Rico Highway & Transportation Authority ROLs3 | | | (0.870 | ) | | | 7/1/45 | | | | (2,125,023 | ) |
| | 8,000,000 | | | Puerto Rico Sales Tax Financing Corp. ROLs3 | | | (0.220 | ) | | | 8/1/57 | | | | 2,560,000 | |
| | | | | | | | | | | | | | | | |
| | | | | | | | | | | | | | | $ | 50,674,087 | |
| | | | | | | | | | | | | | | | |
| | |
| 1. | | For a list of abbreviations used in the Inverse Floater table see the Portfolio Abbreviations table on page F14 of the Statement of Investments. |
| |
| 2. | | Represents the current interest rate for a variable rate bond known as an “inverse floater”. |
| |
| 3. | | Security is subject to a shortfall and forbearance agreement. |
| |
| 4. | | The underlying bond was purchased on a when-issued or delayed delivery basis. Therefore, the interest rate will be determined upon settlement. |
The Fund enters into shortfall and forbearance agreements with the sponsors of certain inverse floaters held by the Fund. These agreements commit the Fund to reimburse the sponsor of the inverse floater, in certain circumstances, for the amount of the difference between the liquidation value of the underlying security (which is the basis of the inverse floater) and the principal amount due to the holders of the short-term floating rate notes issued by the Trust in conjunction with the inverse floating rate security. Under the standard terms of an inverse floating rate security, absent such a shortfall and forbearance agreement, the Fund would not be required to make such a reimbursement. The Manager monitors the Fund’s potential exposure with respect to these agreements on a daily basis and intends to take action to terminate the Fund’s investment in such inverse floating rate securities, if it deems it appropriate to do so. As of September 30, 2008, in addition to the exposure detailed in the preceding table, the Fund’s maximum exposure under such agreements is estimated at $125,667,547.
Concentration Risk. There are certain risks arising from geographic concentration in any state. Certain economic, regulatory or political developments occurring in the state may impair the ability of certain issuers of municipal securities to pay principal and interest on their obligations.
Credit Risk. The Fund has entered into forbearance agreements with certain obligors under which the Fund has agreed to temporarily forego payment of the original principal or coupon interest rates. As of September 30, 2008, securities with an aggregate market value of $4,025,840, representing 0.32% of the Fund’s net assets, were subject to these forbearance agreements. As of September 30, 2008, no interest was owed to the Fund and no principal payments were deferred under these agreements.
F26 | OPPENHEIMER AMT-FREE NEW YORK MUNICIPALS
Allocation of Income, Expenses, Gains and Losses. Income, expenses (other than those attributable to a specific class), gains and losses are allocated on a daily basis to each class of shares based upon the relative proportion of net assets represented by such class. Operating expenses directly attributable to a specific class are charged against the operations of that class.
Federal Taxes. The Fund intends to comply with provisions of the Internal Revenue Code applicable to regulated investment companies and to distribute substantially all of its investment company taxable income, including any net realized gain on investments not offset by capital loss carryforwards, if any, to shareholders. Therefore, no federal income or excise tax provision is required. The Fund files income tax returns in U.S. federal and applicable state jurisdictions. The statute of limitations on the Fund’s tax return filings generally remain open for the three preceding fiscal reporting period ends.
The tax components of capital shown in the following table represent distribution requirements the Fund must satisfy under the income tax regulations, losses the Fund may be able to offset against income and gains realized in future years and unrealized appreciation or depreciation of securities and other investments for federal income tax purposes.
| | | | | | | | | | | | | |
| | | | | | | | | | | Net Unrealized | |
| | | | | | | | | | | Depreciation | |
| | | | | | | | | | | Based on Cost of | |
| | | | | | | | | | | Securities and | |
| Undistributed | | Undistributed | | | Accumulated | | | Other Investments | |
| Net Investment | | Long-Term | | | Loss | | | for Federal Income | |
| Income | | Gain | | | Carryforward1,2,3,4 | | | Tax Purposes | |
| |
| $7,694,083 | | $ | — | | | $ | 19,758,974 | | | $ | 235,739,039 | |
| | |
| 1. | | As of September 30, 2008, the Fund had $6,750,776 of net capital loss carryforwards available to offset future realized capital gains, if any, and thereby reduce future taxable gain distributions. As of September 30, 2008, details of the capital loss carryforward were as follows: |
| 2. | | As of September 30, 2008, the Fund had $13,008,198 of post-October losses available to offset future realized capital gains, if any. Such losses, if unutilized, will expire in 2017. |
| |
| 3. | | During the fiscal year ended September 30, 2008, the Fund did not utilize any capital loss carryforward. |
| |
| 4. | | During the fiscal year ended September 30, 2007, the Fund did not utilize any capital loss carryforward. |
Net investment income (loss) and net realized gain (loss) may differ for financial statement and tax purposes. The character of dividends and distributions made during the fiscal year from net investment income or net realized gains may differ from their ultimate characterization for federal income tax purposes. Also, due to timing of dividends and distributions, the fiscal year in which amounts are distributed may differ from the fiscal year in which the income or net realized gain was recorded by the Fund.
F27 | OPPENHEIMER AMT-FREE NEW YORK MUNICIPALS
NOTES TO FINANCIAL STATEMENTS Continued
1. Significant Accounting Policies Continued
The tax character of distributions paid during the years ended September 30, 2008 and September 30, 2007 was as follows:
| | | | | | | | | |
| | | Year Ended | | | Year Ended | |
| | | September 30, 2008 | | | September 30, 2007 | |
| |
| Distributions paid from: | | | | | | | | |
| Exempt-interest dividends | | $ | 65,949,696 | | | $ | 56,626,410 | |
| Ordinary income | | | 468,358 | | | | 326,084 | |
| Long-term capital gain | | | — | | | | 143,035 | |
| | | |
| Total | | $ | 66,418,054 | | | $ | 57,095,529 | |
| | | |
The aggregate cost of securities and other investments and the composition of unrealized appreciation and depreciation of securities and other investments for federal income tax purposes as of September 30, 2008 are noted in the following table. The primary difference between book and tax appreciation or depreciation of securities and other investments, if applicable, is attributable to the tax deferral of losses or tax realization of financial statement unrealized gain or loss.
| | | | | |
| Federal tax cost of securities | | $ | 1,522,129,669 | |
| | | | |
| Gross unrealized appreciation | | $ | 17,724,587 | |
| Gross unrealized depreciation | | | (253,463,626 | ) |
| | | | |
| Net unrealized depreciation | | $ | (235,739,039 | ) |
| | | | |
Trustees’ Compensation. The Fund has adopted an unfunded retirement plan (the “Plan”) for the Fund’s independent trustees. Benefits are based on years of service and fees paid to each trustee during their period of service. The Plan was frozen with respect to adding new participants effective December 31, 2006 (the “Freeze Date”) and existing Plan Participants as of the Freeze Date will continue to receive accrued benefits under the Plan. Active independent trustees as of the Freeze Date have each elected a distribution method with respect to their benefits under the Plan. During the year ended September 30, 2008, the Fund’s projected benefit obligations, payments to retired trustees and accumulated liability were as follows:
| | | | | |
| Projected Benefit Obligations Increased | | $ | 24,541 | |
| Payments Made to Retired Trustees | | | 12,036 | |
| Accumulated Liability as of September 30, 2008 | | | 124,861 | |
The Board of Trustees has adopted a compensation deferral plan for independent trustees that enables trustees to elect to defer receipt of all or a portion of the annual compensation they are entitled to receive from the Fund. For purposes of determining the amount owed to the Trustee under the plan, deferred amounts are treated as though equal dollar amounts had been invested in shares of the Fund or in other Oppenheimer funds selected by the Trustee. The Fund purchases shares of the funds selected for deferral by the Trustee in amounts equal to his or her deemed investment, resulting in a Fund asset equal to the
F28 | OPPENHEIMER AMT-FREE NEW YORK MUNICIPALS
deferred compensation liability. Such assets are included as a component of “Other” within the asset section of the Statement of Assets and Liabilities. Deferral of trustees’ fees under the plan will not affect the net assets of the Fund, and will not materially affect the Fund’s assets, liabilities or net investment income per share. Amounts will be deferred until distributed in accordance to the compensation deferral plan.
Dividends and Distributions to Shareholders. Dividends and distributions to shareholders, which are determined in accordance with income tax regulations and may differ from U.S. generally accepted accounting principles, are recorded on the ex-dividend date. Income distributions, if any, are declared daily and paid monthly. Capital gain distributions, if any, are declared and paid annually.
Investment Income. Interest income is recognized on an accrual basis. Discount and premium, which are included in interest income on the Statement of Operations, are amortized or accreted daily.
Custodian Fees. “Custodian fees and expenses” in the Statement of Operations may include interest expense incurred by the Fund on any cash overdrafts of its custodian account during the period. Such cash overdrafts may result from the effects of failed trades in portfolio securities and from cash outflows resulting from unanticipated shareholder redemption activity. The Fund pays interest to its custodian on such cash overdrafts, to the extent they are not offset by positive cash balances maintained by the Fund, at a rate equal to the Federal Funds Rate plus 0.50%. The “Reduction to custodian expenses” line item, if applicable, represents earnings on cash balances maintained by the Fund during the period. Such interest expense and other custodian fees may be paid with these earnings.
Security Transactions. Security transactions are recorded on the trade date. Realized gains and losses on securities sold are determined on the basis of identified cost.
Indemnifications. The Fund’s organizational documents provide current and former trustees and officers with a limited indemnification against liabilities arising in connection with the performance of their duties to the Fund. In the normal course of business, the Fund may also enter into contracts that provide general indemnifications. The Fund’s maximum exposure under these arrangements is unknown as this would be dependent on future claims that may be made against the Fund. The risk of material loss from such claims is considered remote.
Other. The preparation of financial statements in conformity with accounting principles generally accepted in the United States of America requires management to make estimates and assumptions that affect the reported amounts of assets and liabilities and disclosure of contingent assets and liabilities at the date of the financial statements and the reported amounts of increases and decreases in net assets from operations during the reporting period. Actual results could differ from those estimates.
F29 | OPPENHEIMER AMT-FREE NEW YORK MUNICIPALS
NOTES TO FINANCIAL STATEMENTS Continued
2. Shares of Beneficial Interest
The Fund has authorized an unlimited number of $0.001 par value shares of beneficial interest of each class. Transactions in shares of beneficial interest were as follows:
| | | | | | | | | | | | | | | | | |
| | | Year Ended September 30, 2008 | | | Year Ended September 30, 2007 | |
| | | Shares | | | Amount | | | Shares | | | Amount | |
| |
Class A | | | | | | | �� | | | | | | | | | |
| Sold | | | 28,502,373 | | | $ | 348,444,950 | | | | 36,225,517 | | | $ | 475,962,216 | |
| Dividends and/or distributions reinvested | | | 3,335,143 | | | | 40,209,415 | | | | 2,642,399 | | | | 34,533,192 | |
| Redeemed | | | (29,146,349 | ) | | | (354,349,394 | ) | | | (14,369,019 | ) | | | (186,998,638 | ) |
| | | |
| Net increase | | | 2,691,167 | | | $ | 34,304,971 | | | | 24,498,897 | | | $ | 323,496,770 | |
| | | |
| | | | | | | | | | | | | | | | | |
Class B | | | | | | | | | | | | | | | | |
| Sold | | | 367,414 | | | $ | 4,461,731 | | | | 643,385 | | | $ | 8,494,157 | |
| Dividends and/or distributions reinvested | | | 59,300 | | | | 715,789 | | | | 57,320 | | | | 750,483 | |
| Redeemed | | | (787,977 | ) | | | (9,536,275 | ) | | | (738,301 | ) | | | (9,711,369 | ) |
| | | |
| Net decrease | | | (361,263 | ) | | $ | (4,358,755 | ) | | | (37,596 | ) | | $ | (466,729 | ) |
| | | |
| | | | | | | | | | | | | | | | | |
Class C | | | | | | | | | | | | | | | | |
| Sold | | | 4,194,547 | | | $ | 51,197,643 | | | | 6,888,631 | | | $ | 90,679,430 | |
| Dividends and/or distributions reinvested | | | 336,905 | | | | 4,059,087 | | | | 235,413 | | | | 3,073,909 | |
| Redeemed | | | (4,112,864 | ) | | | (49,916,476 | ) | | | (2,263,503 | ) | | | (29,391,070 | ) |
| | | |
| Net increase | | | 418,588 | | | $ | 5,340,254 | | | | 4,860,541 | | | $ | 64,362,269 | |
| | | |
3. Purchases and Sales of Securities
The aggregate cost of purchases and proceeds from sales of securities, other than short-term obligations, for the year ended September 30, 2008, were as follows:
| | | | | | | | | |
| | | Purchases | | | Sales | |
| |
| Investment securities | | $ | 525,313,050 | | | $ | 537,570,324 | |
4. Fees and Other Transactions with Affiliates
Management Fees. Under the investment advisory agreement, the Fund pays the Manager a management fee based on the daily net assets of the Fund at an annual rate as shown in the following table:
| | | | | |
| Fee Schedule | | | | |
| |
| Up to $200 million | | | 0.60 | % |
| Next $100 million | | | 0.55 | |
| Next $200 million | | | 0.50 | |
| Next $250 million | | | 0.45 | |
| Next $250 million | | | 0.40 | |
| Over $1 billion | | | 0.35 | |
Transfer Agent Fees. OppenheimerFunds Services (“OFS”), a division of the Manager, acts as the transfer and shareholder servicing agent for the Fund. The Fund pays OFS a
F30 | OPPENHEIMER AMT-FREE NEW YORK MUNICIPALS
per account fee. For the year ended September 30, 2008, the Fund paid $455,381 to OFS for services to the Fund.
Distribution and Service Plan (12b-1) Fees. Under its General Distributor’s Agreement with the Fund, OppenheimerFunds Distributor, Inc. (the “Distributor”) acts as the Fund’s principal underwriter in the continuous public offering of the Fund’s classes of shares.
Service Plan for Class A Shares. The Fund has adopted a Service Plan (the “Plan”) for Class A shares under Rule 12b-1 of the Investment Company Act of 1940. Under the Plan, the Fund reimburses the Distributor for a portion of its costs incurred for services provided to accounts that hold Class A shares. Reimbursement is made periodically at an annual rate of up to 0.25% of the average annual net assets of Class A shares of the Fund. The Distributor currently uses all of those fees to pay dealers, brokers, banks and other financial institutions periodically for providing personal service and maintenance of accounts of their customers that hold Class A shares. Any unreimbursed expenses the Distributor incurs with respect to Class A shares in any fiscal year cannot be recovered in subsequent periods. Fees incurred by the Fund under the Plan are detailed in the Statement of Operations.
Distribution and Service Plans for Class B and Class C Shares. The Fund has adopted Distribution and Service Plans (the “Plans”) for Class B and Class C shares under Rule 12b-1 of the Investment Company Act of 1940 to compensate the Distributor for its services in connection with the distribution of those shares and servicing accounts. Under the Plans, the Fund pays the Distributor an annual asset-based sales charge of 0.75% on Class B and Class C shares. The Distributor also receives a service fee of 0.25% per year under each plan. If either the Class B or Class C plan is terminated by the Fund or by the shareholders of a class, the Board of Trustees and its independent trustees must determine whether the Distributor shall be entitled to payment from the Fund of all or a portion of the service fee and/or asset-based sales charge in respect to shares sold prior to the effective date of such termination. The Distributor’s aggregate uncompensated expenses under the Plans at September 30, 2008 for Class B and Class C shares were $1,744,051 and $2,010,385, respectively. Fees incurred by the Fund under the Plans are detailed in the Statement of Operations.
Sales Charges. Front-end sales charges and contingent deferred sales charges (“CDSC”) do not represent expenses of the Fund. They are deducted from the proceeds of sales of Fund shares prior to investment or from redemption proceeds prior to remittance, as applicable. The sales charges retained by the Distributor from the sale of shares and the CDSC retained by the Distributor on the redemption of shares is shown in the following table for the period indicated.
| | | | | | | | | | | | | | | | | |
| | | | | | | Class A | | | Class B | | | Class C | |
| | | Class A | | | Contingent | | | Contingent | | | Contingent | |
| | | Front-End | | | Deferred | | | Deferred | | | Deferred | |
| | | Sales Charges | | | Sales Charges | | | Sales Charges | | | Sales Charges | |
| | | Retained by | | | Retained by | | | Retained by | | | Retained by | |
| Year Ended | | Distributor | | | Distributor | | | Distributor | | | Distributor | |
| |
| September 30, 2008 | | $ | 248,345 | | | $ | 106,449 | | | $ | 57,404 | | | $ | 41,786 | |
F31 | OPPENHEIMER AMT-FREE NEW YORK MUNICIPALS
NOTES TO FINANCIAL STATEMENTS Continued
4. Fees and Other Transactions with Affiliates Continued
Waivers and Reimbursements of Expenses. OFS has voluntarily agreed to limit transfer and shareholder servicing agent fees for all classes to 0.35% of average annual net assets per class. This undertaking may be amended or withdrawn at any time.
During the year ended September 30, 2008, the Manager voluntarily reimbursed the Fund $60,414 for certain transactions. The payment increased the Fund’s total return by less than 0.01%.
5. Illiquid Securities
As of September 30, 2008, investments in securities included issues that are illiquid. Investments may be illiquid because they do not have an active trading market, making it difficult to value them or dispose of them promptly at an acceptable price. The Fund will not invest more than 15% of its net assets (determined at the time of purchase and reviewed periodically) in illiquid securities. Securities that are illiquid are marked with an applicable footnote on the Statement of Investments.
6. Borrowings
The Fund can borrow money from banks in amounts up to one third of its total assets (including the amount borrowed) less all liabilities and indebtedness other than borrowings to purchase portfolio securities, to meet redemption obligations or for temporary and emergency purposes. The purchase of securities with borrowed funds creates leverage in the Fund. The use of leverage will subject the Fund to greater costs than funds that do not borrow for leverage, and may also make the Fund’s share price more sensitive to interest changes. The interest on borrowed money is an expense that might reduce the Fund’s yield. Expenses incurred by the Fund with respect to interest on borrowings and commitment fees are disclosed separately or as other expenses on the Statement of Operations.
The Fund entered into a Revolving Credit and Security Agreement (the “Agreement”) with a conduit lender and a bank which enables it to participate with certain other Oppenheimer funds in a committed, secured borrowing facility that permits borrowings of up to $1.25 billion, collectively. To secure the loan, the Fund pledges investment securities in accordance with the terms of the Agreement. Interest is charged to the Fund, based on its borrowings, at current commercial paper issuance rates (2.9074% as of September 30, 2008). The Fund pays additional fees annually to its lender on its outstanding borrowings to manage and administer the facility and is allocated its pro-rata share of an annual commitment fee on the amount of the unused portion of the total facility size. The Fund has the right to prepay such loans and terminate its participation in the conduit loan facility at any time upon prior notice.
F32 | OPPENHEIMER AMT-FREE NEW YORK MUNICIPALS
As of September 30, 2008, the Fund had borrowings outstanding at an interest rate of 2.9074%. Details of the borrowings for the year ended September 30, 2008 are as follows:
| | | | | |
| Average Daily Loan Balance | | $ | 27,495,082 | |
| Average Daily Interest Rate | | | 3.622 | % |
| Fees Paid | | $ | 224,454 | |
| Interest Paid | | $ | 997,874 | |
7. Recent Accounting Pronouncements
In September 2006, the Financial Accounting Standards Board (“FASB”) issued Statement of Financial Accounting Standards (“SFAS”) No. 157, Fair Value Measurements. This standard establishes a single authoritative definition of fair value, sets out a framework for measuring fair value and expands disclosures about fair value measurements. SFAS No. 157 applies to fair value measurements already required or permitted by existing standards. SFAS No. 157 is effective for financial statements issued for fiscal years beginning after November 15, 2007, and interim periods within those fiscal years. As of September 30, 2008, the Manager does not believe the adoption of SFAS No. 157 will materially impact the financial statement amounts; however, additional disclosures may be required about the inputs used to develop the measurements and the effect of certain of the measurements on changes in net assets for the period.
In March 2008, FASB issued SFAS No. 161, Disclosures about Derivative Instruments and Hedging Activities. This standard requires enhanced disclosures about derivative and hedging activities, including qualitative disclosures about how and why the Fund uses derivative instruments, how these activities are accounted for, and their effect on the Fund’s financial position, financial performance and cash flows. SFAS No. 161 is effective for financial statements issued for fiscal years and interim periods beginning after November 15, 2008. At this time, management is evaluating the implications of SFAS No. 161 and its impact on the Fund’s financial statements and related disclosures.
F33 | OPPENHEIMER AMT-FREE NEW YORK MUNICIPALS
REPORT OF INDEPENDENT REGISTERED PUBLIC ACCOUNTING FIRM
The Board of Trustees and Shareholders of
Oppenheimer AMT-Free New York Municipals:
We have audited the accompanying statement of assets and liabilities of Oppenheimer AMT-Free New York Municipals, including the statement of investments, as of September 30, 2008, and the related statements of operations and cash flows for the year then ended, the statements of changes in net assets for each of the years in the two-year period then ended, and the financial highlights for each of the years in the five-year period then ended. These financial statements and financial highlights are the responsibility of the Fund’s management. Our responsibility is to express an opinion on these financial statements and financial highlights based on our audits.
We conducted our audits in accordance with the standards of the Public Company Accounting Oversight Board (United States). Those standards require that we plan and perform the audit to obtain reasonable assurance about whether the financial statements and financial highlights are free of material misstatement. An audit includes examining, on a test basis, evidence supporting the amounts and disclosures in the financial statements. Our procedures included confirmation of securities owned as of September 30, 2008, by correspondence with the custodian and brokers or by other appropriate auditing procedures where replies from brokers were not received. An audit also includes assessing the accounting principles used and significant estimates made by management, as well as evaluating the overall financial statement presentation. We believe that our audits provide a reasonable basis for our opinion.
In our opinion, the financial statements and financial highlights referred to above present fairly, in all material respects, the financial position of Oppenheimer AMT-Free New York Municipals as of September 30, 2008, the results of its operations and its cash flows for the year then ended, the changes in its net assets for each of the years in the two-year period then ended, and the financial highlights for each of the years in the five-year period then ended, in conformity with U.S. generally accepted accounting principles.
KPMG llp
Denver, Colorado
November 13, 2008
F34 | OPPENHEIMER AMT-FREE NEW YORK MUNICIPALS
FEDERAL INCOME TAX INFORMATION Unaudited
In early 2008, if applicable, shareholders of record received information regarding all dividends and distributions paid to them by the Fund during calendar year 2007. Regulations of the U.S. Treasury Department require the Fund to report this information to the Internal Revenue Service.
None of the dividends paid by the Fund during the fiscal year ended September 30, 2008 are eligible for the corporate dividend-received deduction. 99.29% of the dividends were derived from interest on municipal bonds and are not subject to federal income taxes. To the extent a shareholder is subject to any state or local tax laws, some or all of the dividends received may be taxable.
The foregoing information is presented to assist shareholders in reporting distributions received from the Fund to the Internal Revenue Service. Because of the complexity of the federal regulations which may affect your individual tax return and the many variations in state and local tax regulations, we recommend that you consult your tax advisor for specific guidance.
29 | OPPENHEIMER AMT-FREE NEW YORK MUNICIPALS
BOARD APPROVAL OF THE FUND’S INVESTMENT ADVISORY AGREEMENT Unaudited
Each year, the Board of Trustees (the “Board”), including a majority of the independent Trustees, is required to determine whether to renew the Fund’s investment advisory agreement (the “Agreement”). The Investment Company Act of 1940, as amended, requires that the Board request and evaluate, and that the Manager provide, such information as may be reasonably necessary to evaluate the terms of the Agreement. The Board employs an independent consultant to prepare a report that provides information, including comparative information, the Board requests for that purpose. In addition, the Board receives information throughout the year regarding Fund services, fees, expenses and performance.
The Manager and the independent consultant provided information to the Board on the following factors: (i) the nature, quality and extent of the Manager’s services, (ii) the investment performance of the Fund and the Manager, (iii) the fees and expenses of the Fund, including comparative expense information, (iv) the profitability of the Manager and its affiliates, including an analysis of the cost of providing services, (v) whether economies of scale are realized as the Fund grows and whether fee levels reflect these economies of scale for Fund investors and (vi) other benefits to the Manager from its relationship with the Fund. The Board was aware that there are alternatives to retaining the Manager.
Outlined below is a summary of the principal information considered by the Board as well as the Board’s conclusions.
Nature, Quality and Extent of Services. The Board considered information about the nature and extent of the services provided to the Fund and information regarding the Manager’s key personnel who provide such services. The Manager’s duties include providing the Fund with the services of the portfolio managers and the Manager’s investment team, who provide research, analysis and other advisory services in regard to the Fund’s investments; securities trading services; oversight of third party service providers; monitoring compliance with applicable Fund policies and procedures and adherence to the Fund’s investment restrictions. The Manager is responsible for providing certain administrative services to the Fund as well. Those services include providing and supervising all administrative and clerical personnel who are necessary in order to provide effective corporate administration for the Fund; compiling and maintaining records with respect to the Fund’s operations; preparing and filing reports required by the Securities and Exchange Commission; preparing periodic reports regarding the operations of the Fund for its shareholders; preparing proxy materials for shareholder meetings; and preparing the registration statements required by Federal and state securities laws for the sale of the Fund’s shares. The Manager also provides the Fund with office space, facilities and equipment.
The Board also considered the quality of the services provided and the quality of the Manager’s resources that are available to the Fund. The Board took account of the fact
30 | OPPENHEIMER AMT-FREE NEW YORK MUNICIPALS
that the Manager has had over forty years of experience as an investment adviser and that its assets under management rank it among the top mutual fund managers in the United States. The Board evaluated the Manager’s advisory, administrative, accounting, legal and compliance services, and information the Board has received regarding the experience and professional qualifications of the Manager’s key personnel and the size and functions of its staff. In its evaluation of the quality of the portfolio management services provided, the Board considered the experience of Ronald Fielding, Daniel Loughran, Scott Cottier, and Troy Willis, the portfolio managers for the Fund, and the Manager’s investment team and analysts. The Board members also considered the totality of their experiences with the Manager as directors or trustees of the Fund and other funds advised by the Manager. The Board considered information regarding the quality of services provided by affiliates of the Manager, which its members have become knowledgeable about in connection with the renewal of the Fund’s service agreements. The Board concluded, in light of the Manager’s experience, reputation, personnel, operations and resources, the Fund benefits from the services provided under the Agreement.
Investment Performance of the Manager and the Fund. Throughout the year, the Manager provided information on the investment performance of the Fund and the Manager, including comparative performance information. The Board also reviewed information, prepared by the Manager and by the independent consultant, comparing the Fund’s historical performance to relevant market indices and to the performance of other retail front-end load and no-load New York municipal debt funds (including both funds advised by the Manager and funds advised by other investment advisers). The Board noted that the Fund’s three-year, five-year and ten-year performance were better than its peer group median although its one-year performance was below its peer group median.
Costs of Services by the Manager. The Board reviewed the fees paid to the Manager and the other expenses borne by the Fund. The Board also considered the comparability of the fees charged and the services provided to the Fund to the fees and services for other clients or accounts advised by the Manager. The independent consultant provided comparative data in regard to the fees and expenses of the Fund and other New York municipal debt funds with comparable asset levels and distribution features. The Board noted that the Fund’s the contractual and actual management fees and total expenses are lower than its peer group median.
Economies of Scale and Profits Realized by the Manager. The Board considered information regarding the Manager’s costs in serving as the Fund’s investment adviser, including the costs associated with the personnel and systems necessary to manage the Fund, and information regarding the Manager’s profitability from its relationship with the
31 | OPPENHEIMER AMT-FREE NEW YORK MUNICIPALS
BOARD APPROVAL OF THE FUND’S INVESTMENT ADVISORY AGREEMENT Unaudited / Continued
Fund. The Board reviewed whether the Manager may realize economies of scale in managing and supporting the Fund. The Board noted that the Fund currently has management fee breakpoints, which are intended to share with Fund shareholders economies of scale that may exist as the Fund’s assets grow.
Other Benefits to the Manager. In addition to considering the profits realized by the Manager, the Board considered information that was provided regarding the direct and indirect benefits the Manager receives as a result of its relationship with the Fund, including compensation paid to the Manager’s affiliates. The Board also considered that the Manager must be able to pay and retain experienced professional personnel at competitive rates to provide quality services to the Fund and that maintaining the financial viability of the Manager is important in order for the Manager to continue to provide significant services to the Fund and its shareholders.
Conclusions. These factors were also considered by the independent Trustees meeting separately from the full Board, assisted by experienced counsel to the Fund and to the independent Trustees. Fund counsel and the independent Trustees’ counsel are independent of the Manager within the meaning and intent of the Securities and Exchange Commission Rules.
Based on its review of the information it received and its evaluations described above, the Board, including a majority of the independent Trustees, decided to continue the Agreement for another year. In arriving at this decision, the Board did not single out any factor or factors as being more important than others, but considered all of the above information, and considered the terms and conditions of the Agreement, including the management fee, in light of all of the surrounding circumstances.
32 | OPPENHEIMER AMT-FREE NEW YORK MUNICIPALS
PORTFOLIO PROXY VOTING POLICIES AND PROCEDURES; UPDATES TO STATEMENTS OF INVESTMENTS Unaudited
The Fund has adopted Portfolio Proxy Voting Policies and Procedures under which the Fund votes proxies relating to securities (“portfolio proxies”) held by the Fund. A description of the Fund’s Portfolio Proxy Voting Policies and Procedures is available (i) without charge, upon request, by calling the Fund toll-free at 1.800.525.7048, (ii) on the Fund’s website at www.oppenheimerfunds.com, and (iii) on the SEC’s website at www.sec.gov. In addition, the Fund is required to file Form N-PX, with its complete proxy voting record for the 12 months ended June 30th, no later than August 31st of each year. The Fund’s voting record is available (i) without charge, upon request, by calling the Fund toll-free at 1.800.525.7048, and (ii) in the Form N-PX filing on the SEC’s website at www.sec.gov.
The Fund files its complete schedule of portfolio holdings with the SEC for the first quarter and the third quarter of each fiscal year on Form N-Q. The Fund’s Form N-Q filings are available on the SEC’s website at http://www.sec.gov. Those forms may be reviewed and copied at the SEC’s Public Reference Room in Washington, D.C. Information on the operation of the Public Reference Room may be obtained by calling 1-800-SEC-0330.
33 | OPPENHEIMER AMT-FREE NEW YORK MUNICIPALS
TRUSTEES AND OFFICERS Unaudited
| | | |
| Name, Position(s) Held with the | | Principal Occupation(s) During the Past 5 Years; Other Trusteeships / Directorships |
| Fund, Length of Service, Age | | Held; Number of Portfolios in the Fund Complex Currently Overseen |
| | | |
INDEPENDENT TRUSTEES | | The address of each Trustee in the chart below is 6803 S. Tucson Way, Centennial, Colorado 80112-3924. Each Trustee serves for an indefinite term, or until his or her resignation, retirement, death or removal. |
| | | |
Brian F. Wruble,
Chairman of the Board
of Trustees (since 2007),
Trustee (since 2005)
Age: 65 | | General Partner of Odyssey Partners, L.P. (hedge fund) (September 1995- December 2007); Director of Special Value Opportunities Fund, LLC (registered investment company) (affiliate of the Manager’s parent company) (since September 2004); Chairman (since August 2007) and Trustee (since August 1991) of the Board of Trustees of The Jackson Laboratory (non-profit); Treasurer and Trustee of the Institute for Advanced Study (non-profit educational institute) (since May 1992); Member of Zurich Financial Investment Management Advisory Council (insurance) (2004-2007); Special Limited Partner of Odyssey Investment Partners, LLC (private equity investment) (January 1999-September 2004). Oversees 64 portfolios in the OppenheimerFunds complex. |
| | | |
David K. Downes,
Trustee (since 2007)
Age: 68 | | Independent Chairman GSK Employee Benefit Trust (since April 2006); Director of Correctnet (since January 2006); Trustee of Employee Trusts (since January 2006); President, Chief Executive Officer and Board Member of CRAFund Advisors, Inc. (investment management company) (since January 2004); Director of Internet Capital Group (information technology company) (since October 2003); Independent Chairman of the Board of Trustees of Quaker Investment Trust (registered investment company) (2004-2007); President of The Community Reinvestment Act Qualified Investment Fund (investment management company) (2004-2007); Chief Operating Officer and Chief Financial Officer of Lincoln National Investment Companies, Inc. (subsidiary of Lincoln National Corporation, a publicly traded company) and Delaware Investments U.S., Inc. (investment management subsidiary of Lincoln National Corporation) (1993- 2003); President, Chief Executive Officer and Trustee of Delaware Investment Family of Funds (1993-2003); President and Board Member of Lincoln National Convertible Securities Funds, Inc. and the Lincoln National Income Funds, TDC (1993-2003); Chairman and Chief Executive Officer of Retirement Financial Services, Inc. (registered transfer agent and investment adviser and subsidiary of Delaware Investments U.S., Inc.) (1993-2003); President and Chief Executive Officer of Delaware Service Company, Inc. (1995-2003); Chief Administrative Officer, Chief Financial Officer, Vice Chairman and Director of Equitable Capital Management Corporation (investment subsidiary of Equitable Life Assurance Society) (1985-1992); Corporate Controller of Merrill Lynch & Company (financial services holding company) (1977-1985); held the following positions at the Colonial Penn Group, Inc. (insurance company): Corporate Budget Director (1974-1977), Assistant Treasurer (1972-1974) and Director of Corporate Taxes (1969-1972); held the following positions at Price Waterhouse & Company (financial services firm): Tax Manager (1967-1969), Tax Senior (1965-1967) and Staff Accountant (1963-1965); United States Marine Corps (1957-1959). Oversees 64 portfolios in the OppenheimerFunds complex. |
| | | |
Matthew P. Fink,
Trustee (since 2005)
Age: 67 | | Trustee of the Committee for Economic Development (policy research foundation) (since 2005); Director of ICI Education Foundation (education foundation) (October 1991-August 2006); President of the Investment Company Institute (trade association) (October 1991-June 2004); Director of ICI Mutual Insurance Company (insurance company) (October 1991-June 2004). Oversees 54 portfolios in the OppenheimerFunds complex. |
34 | OPPENHEIMER AMT-FREE NEW YORK MUNICIPALS
| | | |
| Name, Position(s) Held with the | | Principal Occupation(s) During the Past 5 Years; Other Trusteeships / Directorships |
| Fund, Length of Service, Age | | Held; Number of Portfolios in the Fund Complex Currently Overseen |
| | | |
Robert G. Galli,
Trustee (since 1993)
Age: 75 | | A director or trustee of other Oppenheimer funds. Oversees 64 portfolios in the OppenheimerFunds complex. |
| | | |
Phillip A. Griffiths,
Trustee (since 1999)
Age: 70 | | Fellow of the Carnegie Corporation (since 2007); Distinguished Presidential Fellow for International Affairs (since 2002) and Member (since 1979) of the National Academy of Sciences; Council on Foreign Relations (since 2002); Director of GSI Lumonics Inc. (precision technology products company) (since 2001); Senior Advisor of The Andrew W. Mellon Foundation (since 2001); Chair of Science Initiative Group (since 1999); Member of the American Philosophical Society (since 1996); Trustee of Woodward Academy (since 1983); Foreign Associate of Third World Academy of Sciences; Director of the Institute for Advanced Study (1991-2004); Director of Bankers Trust New York Corporation (1994-1999); Provost at Duke University (1983-1991). Oversees 54 portfolios in the OppenheimerFunds complex. |
| | | |
Mary F. Miller,
Trustee (since 2004)
Age: 66 | | Trustee of International House (not-for-profit) (since June 2007); Trustee of the American Symphony Orchestra (not-for-profit) (since October 1998); and Senior Vice President and General Auditor of American Express Company (financial services company) (July 1998-February 2003). Oversees 54 portfolios in the OppenheimerFunds complex. |
| | | |
Joel W. Motley,
Trustee (since 2002)
Age: 56 | | Managing Director of Public Capital Advisors, LLC (privately held financial advisor) (since January 2006); Managing Director of Carmona Motley, Inc. (privately-held financial advisor) (since January 2002); Director of Columbia Equity Financial Corp. (privately-held financial advisor) (2002-2007); Managing Director of Carmona Motley Hoffman Inc. (privately-held financial advisor) (January 1998-December 2001); Member of the Finance and Budget Committee of the Council on Foreign Relations, Member of the Investment Committee of the Episcopal Church of America, Member of the Investment Committee and Board of Human Rights Watch and Member of the Investment Committee of Historic Hudson Valley. Oversees 54 portfolios in the OppenheimerFunds complex. |
| | | |
Russell S. Reynolds, Jr.,
Trustee (since 1989)
Age: 76 | | Chairman of RSR Partners (formerly “The Directorship Search Group, Inc.”) (corporate governance consulting and executive recruiting) (since 1993); Retired CEO of Russell Reynolds Associates (executive recruiting) (October 1969 - March 1993); Life Trustee of International House (non-profit educational organization); Former Trustee of The Historical Society of the Town of Greenwich; Former Director of Greenwich Hospital Association. Oversees 54 portfolios in the OppenheimerFunds complex. |
| | | |
Joseph M. Wikler,
Trustee (since 2005)
Age: 67 | | Director of C-TASC (bio-statistics services) (since 2007); Director of the following medical device companies: Medintec (since 1992) and Cathco (since 1996); Director of Lakes Environmental Association (environmental protection organization) (since 1996); Member of the Investment Committee of the Associated Jewish Charities of Baltimore (since 1994); Director of Fortis/Hartford mutual funds (1994- December 2001). Oversees 54 portfolios in the OppenheimerFunds complex. |
| | | |
Peter I. Wold,
Trustee (since 2005)
Age: 60 | | President of Wold Oil Properties, Inc. (oil and gas exploration and production company) (since 1994); Vice President of American Talc Company, Inc. (talc mining and milling) (since 1999); Managing Member of Hole-in-the-Wall Ranch (cattle ranching) (since 1979); Vice President, Secretary and Treasurer of Wold Trona Company, Inc. (soda ash processing and production) (1996-2006); Director and Chairman of the Denver Branch of the Federal Reserve Bank of Kansas City (1993-1999); and Director of PacifiCorp. (electric utility) (1995-1999). Oversees 54 portfolios in the OppenheimerFunds complex. |
35 | OPPENHEIMER AMT-FREE NEW YORK MUNICIPALS
TRUSTEES AND OFFICERS Unaudited / Continued
| | | |
| Name, Position(s) Held with the | | Principal Occupation(s) During the Past 5 Years; Other Trusteeships / Directorships |
| Fund, Length of Service, Age | | Held; Number of Portfolios in the Fund Complex Currently Overseen |
| | | |
INTERESTED TRUSTEE
AND OFFICER | | The address of Mr. Murphy is Two World Financial Center, 225 Liberty Street, 11th Floor, New York, New York 10281-1008. Mr. Murphy serves as a Trustee for an indefinite term, or until his resignation, retirement, death or removal and as an Officer for an indefinite term, or until his resignation, retirement, death or removal. Mr. Murphy is an interested Trustee due to his positions with OppenheimerFunds, Inc. and its affiliates. |
| | | |
John V. Murphy,
Trustee and President and
Principal Executive Officer
(since 2001)
Age: 59 | | Chairman, Chief Executive Officer and Director of the Manager (since June 2001); President of the Manager (September 2000-February 2007); President and director or trustee of other Oppenheimer funds; President and Director of Oppenheimer Acquisition Corp. (“OAC”) (the Manager’s parent holding company) and of Oppenheimer Partnership Holdings, Inc. (holding company subsidiary of the Manager) (since July 2001); Director of OppenheimerFunds Distributor, Inc. (subsidiary of the Manager) (November 2001-December 2006); Chairman and Director of Shareholder Services, Inc. and of Shareholder Financial Services, Inc. (transfer agent subsidiaries of the Manager) (since July 2001); President and Director of OppenheimerFunds Legacy Program (charitable trust program established by the Manager) (since July 2001); Director of the following investment advisory subsidiaries of the Manager: OFI Institutional Asset Management, Inc., Centennial Asset Management Corporation, Trinity Investment Management Corporation and Tremont Capital Management, Inc. (since November 2001), HarbourView Asset Management Corporation and OFI Private Investments, Inc. (since July 2001); President (since November 2001) and Director (since July 2001) of Oppenheimer Real Asset Management, Inc.; Executive Vice President of Massachusetts Mutual Life Insurance Company (OAC’s parent company) (since February 1997); Director of DLB Acquisition Corporation (holding company parent of Babson Capital Management LLC) (since June 1995); Chairman (since October 2007) and Member of the Investment Company Institute’s Board of Governors (since October 2003). Oversees 103 portfolios in the OppenheimerFunds complex. |
| | | |
OTHER OFFICERS
OF THE FUND | | The addresses of the Officers in the chart below are as follows: for Messrs. Zack and Bloomberg, Two World Financial Center, 225 Liberty Street, New York, New York 10281-1008, for Messrs. Petersen, Szilagyi, Vandehey, Wixted and Ms. Ives, 6803 S. Tucson Way, Centennial, Colorado 80112-3924 and for Messrs. Fielding, Loughran, Cottier, Willis and Stein, 350 Linden Oaks, Rochester, New York 14625. Each Officer serves for an indefinite term or until his or her resignation, retirement, death or removal. |
| | | |
Ronald H. Fielding,
Vice President and Senior
Portfolio Manager
(since 2002)
Age: 59 | | Senior Vice President of the Manager (since January 1996). Chief Strategist, a Senior Portfolio Manager, an officer and a trader for the Fund and other Oppenheimer funds. |
| | | |
Daniel G. Loughran,
Vice President (since 2005)
and Senior Portfolio Manager
(since 2006)
Age: 44 | | Senior Vice President of the Manager (since August 2007); Vice President of the Manager (April 2001-July 2007) and a Portfolio Manager with the Manager (since 1999). Team leader, a Senior Portfolio Manager, an officer and a trader for the Fund and other Oppenheimer funds. |
36 | OPPENHEIMER AMT-FREE NEW YORK MUNICIPALS
| | | |
| Name, Position(s) Held with the | | Principal Occupation(s) During the Past 5 Years; Other Trusteeships / Directorships |
| Fund, Length of Service, Age | | Held; Number of Portfolios in the Fund Complex Currently Overseen |
| | | |
Scott S. Cottier,
Vice President (since 2005)
and Senior Portfolio Manager
(since 2006)
Age: 36 | | Vice President of the Manager (since September 2002). Portfolio Manager and trader at Victory Capital Management (from 1999 to 2002). Senior Portfolio Manager, an officer and a trader for the Fund and other Oppenheimer funds. |
| | | |
Troy E. Willis,
Vice President (since 2005)
and Senior Portfolio Manager
(since 2006)
Age: 35 | | Assistant Vice President of the Manager (since July 2005). Portfolio Manager of the Fund (from May 2003 to December 2005). Corporate Attorney for Southern Resource Group (from 1999 to 2003). Senior Portfolio Manager, an officer and a trader for the Fund and other Oppenheimer funds. |
| | | |
Richard Stein
Vice President (since 2007)
Age: 51 | | Director of the Rochester Credit Analysis team (since 2003) and a Vice President of the Manager (since 1997); headed Rochester’s Credit Analysis team (since 1993). |
| | | |
Mark S. Vandehey,
Vice President and Chief
Compliance Officer
(since 2004)
Age: 58 | | Senior Vice President and Chief Compliance Officer of the Manager (since March 2004); Chief Compliance Officer of OppenheimerFunds Distributor, Inc., Centennial Asset Management and Shareholder Services, Inc. (since March 2004); Vice President of OppenheimerFunds Distributor, Inc., Centennial Asset Management Corporation and Shareholder Services, Inc. (since June 1983); Former Vice President and Director of Internal Audit of the Manager (1997- February 2004). An officer of 103 portfolios in the OppenheimerFunds complex. |
| | | |
Brian W. Wixted,
Treasurer and Principal
Financial & Accounting
Officer (since 1999)
Age: 49 | | Senior Vice President and Treasurer of the Manager (since March 1999); Treasurer of the following: HarbourView Asset Management Corporation, Shareholder Financial Services, Inc., Shareholder Services, Inc., Oppenheimer Real Asset Management, Inc. and Oppenheimer Partnership Holdings, Inc. (since March 1999), OFI Private Investments, Inc. (since March 2000), OppenheimerFunds International Ltd. and OppenheimerFunds plc (since May 2000), OFI Institutional Asset Management, Inc. (since November 2000), and OppenheimerFunds Legacy Program (charitable trust program established by the Manager) (since June 2003); Treasurer and Chief Financial Officer of OFI Trust Company (trust company subsidiary of the Manager) (since May 2000); Assistant Treasurer of the following: OAC (since March 1999), Centennial Asset Management Corporation (March 1999-October 2003) and OppenheimerFunds Legacy Program (April 2000-June 2003). An officer of 103 portfolios in the OppenheimerFunds complex. |
| | | |
Brian S. Petersen,
Assistant Treasurer
(since 2004)
Age: 38 | | Vice President of the Manager (since February 2007); Assistant Vice President of the Manager (August 2002-February 2007); Manager/Financial Product Accounting of the Manager (November 1998-July 2002). An officer of 103 portfolios in the OppenheimerFunds complex. |
| | | |
Brian C. Szilagyi,
Assistant Treasurer
(since 2005)
Age: 38 | | Assistant Vice President of the Manager (since July 2004); Director of Financial Reporting and Compliance of First Data Corporation (April 2003-July 2004); Manager of Compliance of Berger Financial Group LLC (May 2001-March 2003). An officer of 103 portfolios in the OppenheimerFunds complex. |
| | | |
Robert G. Zack,
Secretary (since 2001)
Age: 60 | | Executive Vice President (since January 2004) and General Counsel (since March 2002) of the Manager; General Counsel and Director of the Distributor (since December 2001); General Counsel of Centennial Asset Management Corporation (since December 2001); Senior Vice President and General Counsel of HarbourView Asset Management Corporation (since December 2001); Secretary and General Counsel of OAC (since November 2001); Assistant Secretary (since September 1997) and Director (since November 2001) of OppenheimerFunds International Ltd. and OppenheimerFunds plc; Vice |
37 | OPPENHEIMER AMT-FREE NEW YORK MUNICIPALS
TRUSTEES AND OFFICERS Unaudited / Continued
| | | |
| Name, Position(s) Held with the | | Principal Occupation(s) During the Past 5 Years; Other Trusteeships / Directorships |
| Fund, Length of Service, Age | | Held; Number of Portfolios in the Fund Complex Currently Overseen |
| | | |
Robert G. Zack,
Continued | | President and Director of Oppenheimer Partnership Holdings, Inc. (since December 2002); Director of Oppenheimer Real Asset Management, Inc. (since November 2001); Senior Vice President, General Counsel and Director of Shareholder Financial Services, Inc. and Shareholder Services, Inc. (since December 2001); Senior Vice President, General Counsel and Director of OFI Private Investments, Inc. and OFI Trust Company (since November 2001); Vice President of OppenheimerFunds Legacy Program (since June 2003); Senior Vice President and General Counsel of OFI Institutional Asset Management, Inc. (since November 2001); Director of OppenheimerFunds International Distributor Limited (since December 2003); Senior Vice President (May 1985-December 2003). An officer of 103 portfolios in the OppenheimerFunds complex. |
| | | |
Lisa I. Bloomberg,
Assistant Secretary
(since 2004)
Age: 40 | | Vice President (since May 2004) and Deputy General Counsel (since May 2008) of the Manager; Associate Counsel of the Manager (May 2004-May 2008); First Vice President (April 2001-April 2004), Associate General Counsel (December 2000-April 2004) of UBS Financial Services Inc. (formerly, PaineWebber Incorporated). An officer of 103 portfolios in the OppenheimerFunds complex. |
| | | |
Kathleen T. Ives,
Assistant Secretary
(since 2001)
Age: 43 | | Vice President (since June 1998), Deputy General Counsel (since May 2008) and Assistant Secretary (since October 2003) of the Manager; Vice President (since 1999) and Assistant Secretary (since October 2003) of the Distributor; Assistant Secretary of Centennial Asset Management Corporation (since October 2003); Vice President and Assistant Secretary of Shareholder Services, Inc. (since 1999); Assistant Secretary of OppenheimerFunds Legacy Program and Shareholder Financial Services, Inc. (since December 2001); Senior Counsel of the Manager (October 2003-May 2008). An officer of 103 portfolios in the OppenheimerFunds complex. |
The Fund’s Statement of Additional Information contains additional information about the Fund’s Trustees and Officers and is available without charge upon request, by calling 1.800.525.7048.
38 | OPPENHEIMER AMT-FREE NEW YORK MUNICIPALS
Item 2. Code of Ethics.
The registrant has adopted a code of ethics that applies to the registrant’s principal executive officer, principal financial officer, principal accounting officer or controller or persons performing similar functions.
Item 3. Audit Committee Financial Expert.
The Board of Trustees of the registrant has determined that David Downes, the Board’s Audit Committee Chairman, is an audit committee financial expert and that Mr. Downes is “independent” for purposes of this Item 3.
Item 4. Principal Accountant Fees and Services.
The principal accountant for the audit of the registrant’s annual financial statements billed $41,200 in fiscal 2008 and $35,000 in fiscal 2007.
The principal accountant for the audit of the registrant’s annual financial statements billed no such fees during the last two fiscal years.
The principal accountant for the audit of the registrant’s annual financial statements billed $195,000 in fiscal 2008 and $272,786 in fiscal 2007 to the registrant’s investment adviser or any entity controlling, controlled by, or under common control with the adviser that provides ongoing services to the registrant.
Such services include: internal control reviews, audit of capital accumulation plan and professional services relating to FAS 123R.
The principal accountant for the audit of the registrant’s annual financial statements billed no such fees during the last two fiscal years.
The principal accountant for the audit of the registrant’s annual financial statements billed no such fees to the registrant during the last two fiscal years to the registrant’s investment adviser or any entity controlling, controlled by, or under common control with the adviser that provides ongoing services to the registrant.
The principal accountant for the audit of the registrant’s annual financial statements billed $2,369 for fiscal 2008 and $34,675 in fiscal 2007.
The principal accountant for the audit of the registrant’s annual financial statements billed no such fees during the last two fiscal years to the registrant’s investment adviser or any entity controlling, controlled by, or under common control with the adviser that provides ongoing services to the registrant.
| (e) | | (1) During its regularly scheduled periodic meetings, the registrant’s audit committee will pre-approve all audit, audit-related, tax and other services to be provided by the principal accountants of the registrant. |
| | | The audit committee has delegated pre-approval authority to its Chairman for any subsequent new engagements that arise between regularly scheduled meeting dates provided that any fees such pre-approved are presented to the audit committee at its next regularly scheduled meeting. |
| |
| | | Under applicable laws, pre-approval of non-audit services maybe waived provided that: 1) the aggregate amount of all such services provided constitutes no more than five percent of the total amount of fees paid by the registrant to it principal accountant during the fiscal year in which services are provided 2) such services were not recognized by the registrant at the time of engagement as non-audit services and 3) such services are promptly brought to the attention of the audit committee of the registrant and approved prior to the completion of the audit. |
| |
| | | (2) 100% |
| |
| (f) | | Not applicable as less than 50%. |
| (g) | | The principal accountant for the audit of the registrant’s annual financial statements billed $197,369 in fiscal 2008 and $307,461 in fiscal 2007 to the registrant and the registrant’s investment adviser or any entity controlling, controlled by, or under common control with the adviser that provides ongoing services to the registrant related to non-audit fees. Those billings did not include any prohibited non-audit services as defined by the Securities Exchange Act of 1934. |
| (h) | | The registrant’s audit committee of the board of trustees has considered whether the provision of non-audit services that were rendered to the registrant’s investment adviser, and any entity controlling, controlled by, or under common control with the investment adviser that provides ongoing services to the registrant that were not pre-approved pursuant to paragraph (c)(7)(ii) of Rule 2-01 of Regulation S-X is compatible with maintaining the principal accountant’s independence. No such services were rendered. |
Item 5. Audit Committee of Listed Registrants
Not applicable.
Item 6. Schedule of Investments.
a) Not applicable.
Item 7. Disclosure of Proxy Voting Policies and Procedures for Closed-End Management Investment Companies.
Not applicable.
Item 8. Portfolio Managers of Closed-End Management Investment Companies.
Not applicable.
Item 9. Purchases of Equity Securities by Closed-End Management Investment Company and Affiliated Purchasers.
Not applicable.
Item 10. Submission of Matters to a Vote of Security Holders.
The Fund’s Governance Committee Provisions with Respect to Nominations of Directors/Trustees to the Respective Boards
| 1. | | The Fund’s Governance Committee (the “Committee”) will evaluate potential Board candidates to assess their qualifications. The Committee shall have the authority, upon approval of the Board, to retain an executive search firm to assist in this effort. The Committee may consider recommendations by business and personal contacts of current Board members and by executive search firms which the Committee may engage from time to time and may also consider shareholder recommendations. The Committee may consider the advice and recommendation of the Funds’ investment manager and its affiliates in making the selection. |
| 2. | | The Committee shall screen candidates for Board membership. The Committee has not established specific qualifications that it believes must be met by a trustee nominee. In evaluating trustee nominees, the Committee considers, among other things, an individual’s background, skills, and experience; whether the individual is an “interested person” as defined in the Investment Company Act of 1940; and whether the individual would be deemed an “audit committee financial expert” within the meaning of applicable SEC rules. The Committee also considers whether the individual’s background, skills, and experience will complement the background, skills, and experience of other nominees and will contribute to the Board. There are no differences in the manner in which the Committee evaluates nominees for trustees based on whether the nominee is recommended by a shareholder. |
| 3. | | The Committee may consider nominations from shareholders for the Board at such times as the Committee meets to consider new nominees for the Board. The Committee shall have the sole discretion to determine the candidates to present to the |
| | | Board and, in such cases where required, to shareholders. Recommendations for trustee nominees should, at a minimum, be accompanied by the following: |
| | • | | the name, address, and business, educational, and/or other pertinent background of the person being recommended; |
| |
| | • | | a statement concerning whether the person is an “interested person” as defined in the Investment Company Act of 1940; |
| |
| | • | | any other information that the Funds would be required to include in a proxy statement concerning the person if he or she was nominated; and |
| |
| | • | | the name and address of the person submitting the recommendation and, if that person is a shareholder, the period for which that person held Fund shares. |
| | | The recommendation also can include any additional information which the person submitting it believes would assist the Committee in evaluating the recommendation. |
| 4. | | Shareholders should note that a person who owns securities issued by Massachusetts Mutual Life Insurance Company (the parent company of the Funds’ investment adviser) would be deemed an “interested person” under the Investment Company Act of 1940. In addition, certain other relationships with Massachusetts Mutual Life Insurance Company or its subsidiaries, with registered broker-dealers, or with the Funds’ outside legal counsel may cause a person to be deemed an “interested person.” |
| 5. | | Before the Committee decides to nominate an individual as a trustee, Committee members and other directors customarily interview the individual in person. In addition, the individual customarily is asked to complete a detailed questionnaire which is designed to elicit information which must be disclosed under SEC and stock exchange rules and to determine whether the individual is subject to any statutory disqualification from serving as a trustee of a registered investment company. |
Item 11. Controls and Procedures.
Based on their evaluation of the registrant’s disclosure controls and procedures (as defined in rule 30a-3(c) under the Investment Company Act of 1940 (17 CFR 270.30a-3(c)) as of 09/30/2008, the registrant’s principal executive officer and principal financial officer found the registrant’s disclosure controls and procedures to provide reasonable assurances that information required to be disclosed by the registrant in the reports that it files under the Securities Exchange Act of 1934 (a) is accumulated and communicated to registrant’s management, including its principal executive officer and principal financial officer, to allow timely decisions regarding required disclosure, and (b) is recorded, processed, summarized and reported, within the time periods specified in the rules and forms adopted by the U.S. Securities and Exchange Commission.
There have been no changes in the registrant’s internal controls over financial reporting that occurred during the registrant’s second fiscal quarter of the period covered by this report that have materially affected, or are reasonably likely to materially affect, the registrant’s internal control over financial reporting.
Item 12. Exhibits.
| (a) | | (1) Exhibit attached hereto. |
| |
| | | (2) Exhibits attached hereto. |
| |
| | | (3) Not applicable. |
| |
| (b) | | Exhibit attached hereto. |
SIGNATURES
Pursuant to the requirements of the Securities Exchange Act of 1934 and the Investment Company Act of 1940, the registrant has duly caused this report to be signed on its behalf by the undersigned, thereunto duly authorized.
Oppenheimer AMT — Free New York Municipals
| | | | | |
| By: | | /s/ John V. Murphy | | |
| | | John V. Murphy | | |
| | | Principal Executive Officer | | |
Date: 11/11/2008
Pursuant to the requirements of the Securities Exchange Act of 1934 and the Investment Company Act of 1940, this report has been signed below by the following persons on behalf of the registrant and in the capacities and on the dates indicated.
| | | | | |
| By: | | /s/ John V. Murphy | | |
| | | John V. Murphy
Principal Executive Officer | | |
Date: 11/11/2008
| | | | | |
| By: | | /s/ Brian W. Wixted | | |
| | | Brian W. Wixted | | |
| | | Principal Financial Officer | | |
Date: 11/11/2008