

Safe Harbor This presentation contains forward - looking statements which reflect management's current views of future events and operations, including but not limited to statements about our growth plans, product and platform development, new revenue, customer development, improved customer and consumer satisfaction and the number of locations, players and games. These statements are based on current expectations and assumptions that are subject to risks and uncertainties that could cause actual results to differ materially. These risks and uncertainties include the risks of unsuccessful execution or launch of products, platforms or brands, risks associated with customer retention and growth plans, the impact of alternative entertainment options and technologies and competitive products, brands, technologies and pricing, adverse economic conditions, and the regulatory environment, failure of customer and/or player acceptance or demand for new or existing products, lower market acceptance or appeal of both existing and new products and services by particular demographic groups or audiences as a whole, termination of partnership and contractual relationships and technical problems or outages. Please see NTN Buzztime, Inc.'s recent filings with the Securities and Exchange Commission for information about these and other risks that may affect the Company. All forward - looking statements included in this presentation are based on information available to us on the date hereof. These statements speak only as of the date hereof, and except as required by law NTN Buzztime, Inc. does not undertake to publicly update or revise any of its forward - looking statements, even if experience or future changes show that the indicated results or events will not be realized.

31 YEARS IN HOSPITALITY 9 MM REGISTERED PLAYERS 5 5,000 TABLETS DEPLOYED 115 MM GAMES PLAYED/YEAR
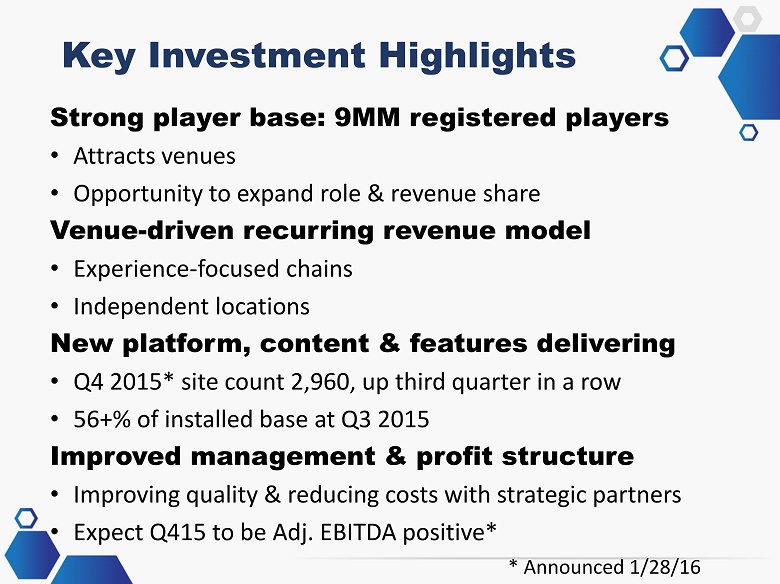
Strong player base: 9MM registered players • Attracts venues • Opportunity to expand role & revenue share Venue - driven recurring revenue model • Experience - focused chains • Independent locations New platform, content & features delivering • Q4 2015* site count 2,960, up third quarter in a row • 56+% of installed base at Q3 2015 Improved management & profit structure • Improving quality & reducing costs with strategic partners • Expect Q415 to be Adj. EBITDA positive* * Announced 1/28/16 Key Investment Highlights

Opportunities to improve service AND deliver better guest experiences Wait for table 5 m in 46 Minute Experience: 30 Minutes of Waste , 16 Minutes of Value Wait to order 5 m in Wait for food 10 - 30 min Wait for check 5 min Wait for receipt 5 min Arrive Sit - 1min Order – 2min Eat – 10min Pay – 2min Leave – 1min waste value Improving the Guest Experience

Providing Network Effect Benefits Venues & Players Customers PLAYERS ~150K restaurants 11B guests/year $4 B Market Potential VENUES Value & Fun +175MM player potential
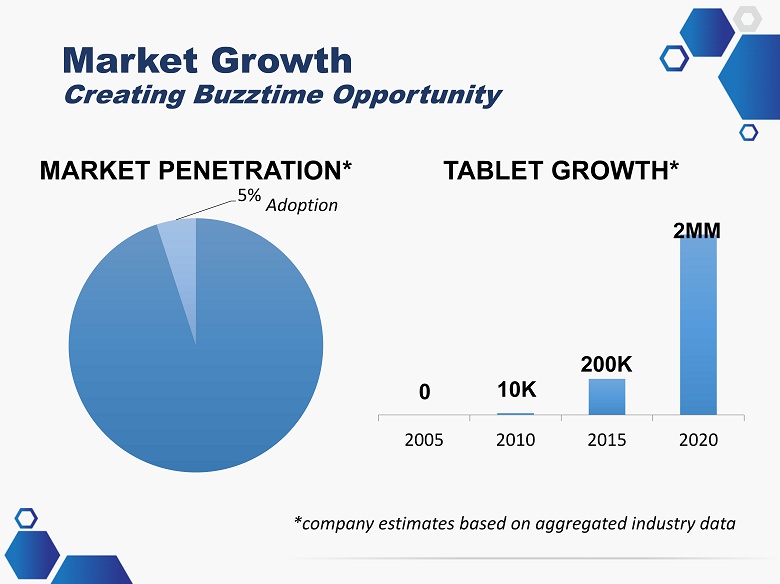
Market Growth Creating Buzztime Opportunity 2005 2010 2015 2020 TABLET GROWTH* * company estimates based on aggregated industry data 0 10K 200K 2 MM 5% MARKET PENETRATION* Adoption
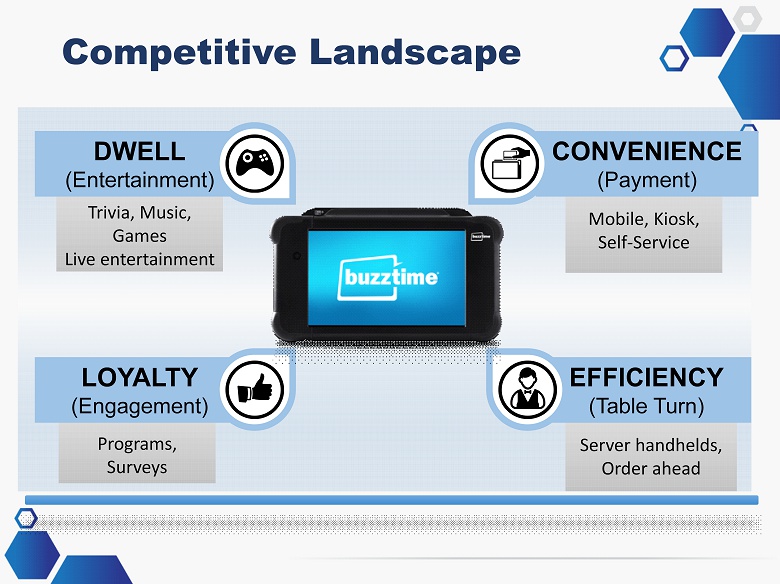
Competitive L andscape Trivia , Music, Games Live entertainment DWELL ( Entertainment) Programs, Surveys LOYALTY (Engagement) Mobile , Kiosk, Self - Service CONVENIENCE (Payment) Server handhelds , Order ahead EFFICIENCY (Table Turn)

SUBSCRIPTION REVENUE PLAYERS DATA ENTERPRISE Chief Need: Order & Pay INDEPENDENT Chief Need: Value & Price Get Profitable Drive Use Deliver Insights PHASE I Profitable g rowth PHASE II Player growth PHASE III Analytics growth Long - term Growth Strategy ADJACENCIES Chief Need: Value & Price

Gaming Experts 2015 Launches Jackpot Trivia • Launched Feb . 2015 • #1 trivia game on network by Q315 Buzztime Sports: Football Edition™ • Attracting new players • Incorporating social & out of venue connection Academy of Football • Sponsored platform with desirable audience • Branded game with Pro Football Hall of Famer Emmett Smith • Sponsors including MillerCoors & Dr Pepper
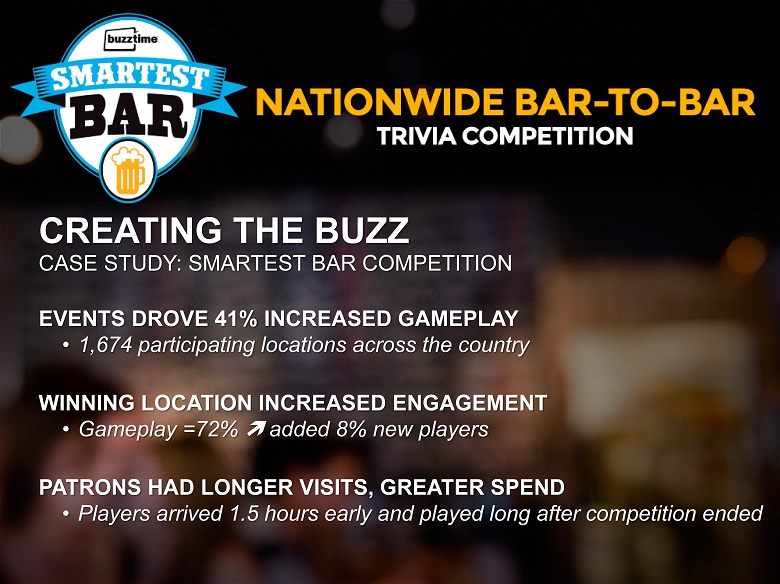
CREATING THE BUZZ CASE STUDY: SMARTEST BAR COMPETITION EVENTS DROVE 41% INCREASED GAMEPLAY • 1,674 participating locations across the country WINNING LOCATION INCREASED ENGAGEMENT • Gameplay =72% added 8% new players PATRONS HAD LONGER VISITS, GREATER SPEND • Players arrived 1.5 hours early and played long after competition ended
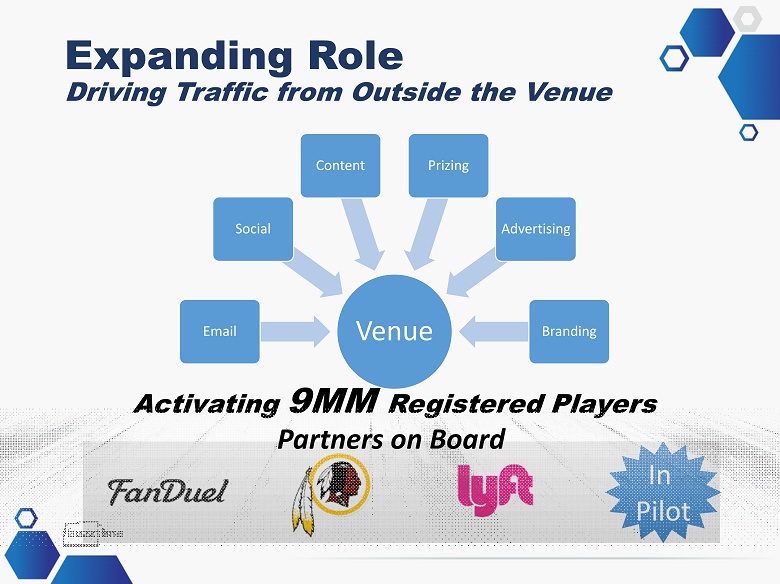
Venue Email Social Content Prizing Advertising Branding Expanding Role Dr iving T raffic from Outside the Venue Activating 9MM Registered Players In Pilot Partners on Board
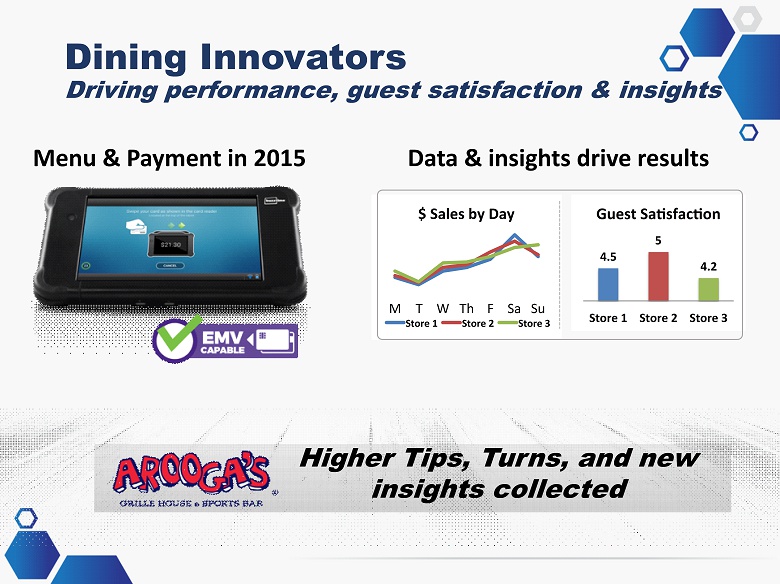
Higher Tips, Turns, and new insights collected Menu & Payment in 2015 Data & insights drive results Dining Innovators Driving performance, guest satisfaction & insights M T W Th F Sa Su $ Sales by Day Store 1 Store 2 Store 3 4.5 5 4.2 Store 1 Store 2 Store 3 Guest Sa sfac on
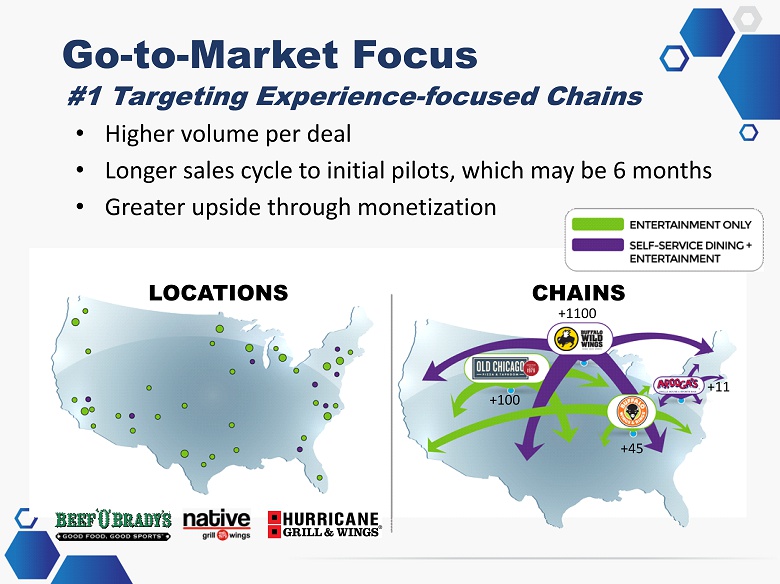
Go - to - Market F ocus #1 Targeting Experience - focused Chains • Higher volume per deal • Longer sales cycle to initial pilots, which may be 6 months • Greater upside through monetization +1100 +11 +45 +100 LOCATIONS CHAINS
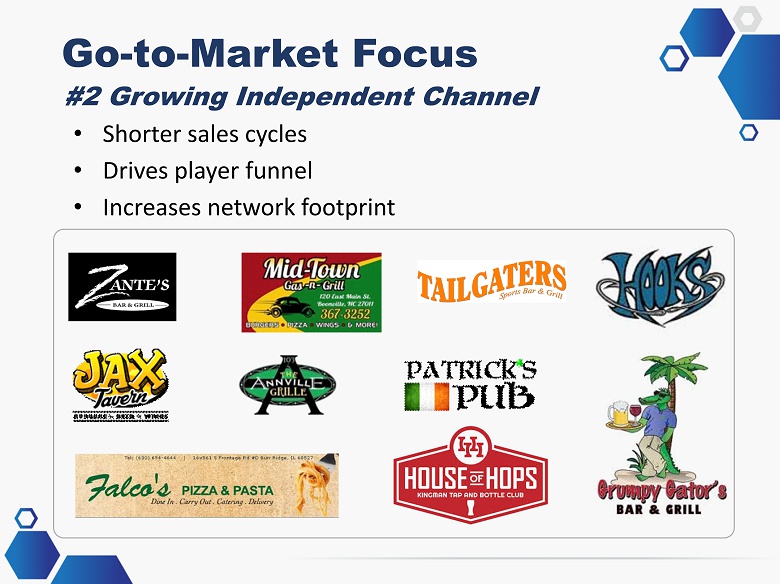
Go - to - Market Focus #2 Growing Independent Channel • Shorter sales cycles • Drives player funnel • Increases network footprint

Subscription & Hardware BASE Scaling Ads + Data Transactional Scaling Premium Content Pay to Play Current Subscription & Hardware NEW Units Current Revenue Beyond Subscription 56% Installed base with new technology at Sept. 30, 2015

2015 Accomplishments FINANCIALS PLAYERS UNITS Improving In - Venue Game Metrics Growing Experience Focused Brands Optimizing growth and cost structure Hardware Self - Service & Payment Premium Games Brands Entertainment
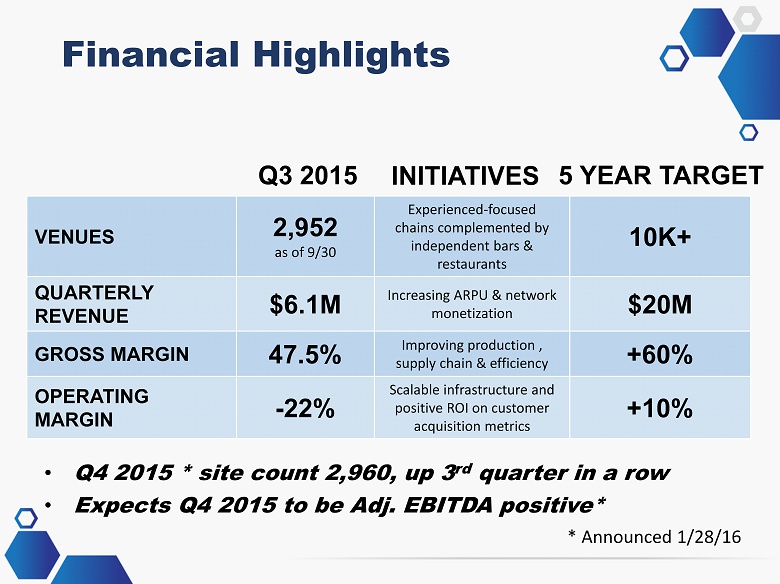
VENUES 2,952 as of 9/30 Experienced - f ocused chains complemented by independent bars & restaurants 10K+ QUARTERLY REVENUE $6.1M Increasing ARPU & network monetization $20M GROSS MARGIN 47.5% Improving production , supply chain & efficiency +60% OPERATING MARGIN - 22% Scalable infrastructure and positive ROI on customer acquisition metrics +10% Financial Highlights 5 YEAR TARGET Q3 2015 INITIATIVES • Q4 2015 * site count 2,960, up 3 rd quarter in a row • Expects Q4 2015 to be Adj. EBITDA positive* * Announced 1/28/16
Thank you
Enable Guests to leave on their time. Wait for table 5 m in Wait to order 5 m in Wait for food 10 - 30 min Wait for check 5 min Wait for receipt 5 min Arrive Sit - 1min Order – 2min Eat – 10min Pay – 2min Leave – 1min waste value • Pay Bill • Email Receipt • Surveys • Loyalty Enrollment • Return Offers Ready to Checkout