UNITED STATES
SECURITIES AND EXCHANGE COMMISSION
Washington, D.C. 20549
FORM N-CSR
CERTIFIED SHAREHOLDER REPORT OF REGISTERED
MANAGEMENT INVESTMENT COMPANIES
Investment Company Act file number 811-04058
The Korea Fund, Inc.
(Exact name of registrant as specified in charter)
60 Victoria Embankment, London, United Kingdom EC4Y 0JP
(Address of principal executive offices)
c/o Carmine Lekstutis
Chief Legal Officer,
JPMorgan, 4 New York Plaza, New York, NY 10004
(Name and address of agent for service)
Registrant’s telephone number, including area code: +44 207 742 3436
Date of fiscal year end: June 30
Date of reporting period: December 31, 2021
Beginning on January 1, 2021, as permitted by regulations adopted by the U.S. Securities and Exchange Commission, paper copies of shareholder reports will no longer be sent by mail, unless you specifically request paper copies of the reports. Instead, the reports will be made available on the Fund’s website (www.thekoreafund.com), and you will be notified by mail each time a report is posted and provided with a website link to access the report.
If you already elected to receive shareholder reports electronically, you will not be affected by this change and you need not take any action. You may elect to receive shareholder reports and other communications from the Fund electronically anytime by contacting your financial intermediary (such as a broker-dealer or bank) or, if you are a direct investor, by calling the Fund’s stockholder servicing agent at (866) 706-0510.
If you prefer to receive paper copies of your shareholder reports after January 1, 2021, direct investors may inform the Fund at any time by calling the Fund’s stockholder servicing agent at (866) 706-0510. If you invest through a financial intermediary, you should contact your financial intermediary directly. Paper copies are provided free of charge and your election to receive reports in paper will apply to all funds held with the fund complex if you invest directly with the Fund or all funds held in your account if you invest through your financial intermediary.

Semi-Annual Report
December 31, 2021
Semi-Annual Report
December 31, 2021
The Korea Fund, Inc. Investment Adviser’s Report
December 31, 2021 (unaudited)
Overview
In the six months to December 31, 2021, the KOSPI index fell 9.70% to finish at 2977.65. In USD terms, the index fell 14.01% as the Won weakened. Korea’s poor stock market performance was due to concerns about a decelerating global economy, rising inflationary pressure and uncertainties about the COVID19 Omicron variant.
During the second half of 2021, retail investors bought W10.8Tn (USD9Bn) of KOSPI listed stocks – continuing their role as the main buyer of the market. Local and foreign institutions sold W2.9Tn and W8.2Tn, respectively.
The Ministry of Economy and Finance released an expansionary 2022 budget proposal of W604.4Tn, a rise of +8.3%. The Moon government cited continued expansionary fiscal policy is required as 1) the economy is far from full recovery; 2) greater need to respond to changing trade environment; and 3) to facilitate transition to a low-carbon and digital economy.
The Bank of Korea (BoK) raised the base policy rate by 25bps each in August and November meetings resulting in the policy rate rising to 1%. The BoK preemptively started policy rate normalization to tackle financial imbalances amid strong economic conditions. Still the BoK expects policy normalization to be measured and dependent on 1) the COVID19 spread, 2) growth and inflation trend, and 3) changes in other major central banks’ policy. Korea is expected to see the policy rate rise above the pre-COVID19 level of 1.25% sometime within 2022.
Korea’s 2021 third quarter gross domestic product (GDP) grew 1.2% quarter on quarter, seasonally adjusted annualized rate (QoQ saar) , reporting growth that was below expectation. Private consumption and business investment contracted vs. the second quarter due to the virus resurgence and supply bottlenecks affected production/shipment. Exports improved to soften the decline. In the fourth quarter GDP growth accelerated to 4.5% QoQ saar on better private consumption thanks to “living with Covid policy” before reinstatement of social distancing measure in December 2021. Domestic construction activity and exports also improved vs. the third quarter.
Korea’s presidential election will be held on March 9, 2022. While leading candidates’ stance on taxation, real estate, social welfare and energy policies differ, a dramatic change in macro policy and economy is unlikely as actual implementation should go through checks-and-balances within the administration and with the current National Assembly.
Fund’s Performance
From July 1, 2021 to December 31, 2021, the total return of The Korea Fund, Inc.’s (the “Fund”) Net Asset Value (NAV) was – 10.74% (net of fees) in U.S. dollar (“USD”) terms, outperforming the Fund’s benchmark, the MSCI Korea 25/50 Net Total Return USD Index by 3.79%.
| | | | | | |
12.31.21 | | | The Korea Fund, Inc. Semi-Annual Report | | | 1 | |
The Korea Fund, Inc. Investment Adviser’s Report
December 31, 2021 (unaudited) (continued)
Performance Attribution Review
Over the six month review period the Portfolio’s outperformance was due to strong stock selection, while sector allocation was marginally negative. An underweight in IT names, whilst being overweight energy stocks detracted, whilst an underweight in the industrials sector was a positive contributor.
At the stock level, the best performing position was SK Bioscience. This vaccine manufacturer outperformed on 1) resurgence of COVID19; 2) strong 2Q results; and 3) positive progression of its own COVID19 vaccine. An underweight in Kakao Corp also contributed, as the stock was hit by policy risk as politicians and regulators questioned online platforms’ business practice and impact on consumers/small-medium size businesses. Dongjin Semichem and Samsung Electro-Mechanics were also contributors and outperformed along as the technology hardware sector rebound. Other notable contributors were Dentium, which outperformed on solid second quarter results, and AfreecaTV, which also outperformed on good results over the same period and constructive guidance on advertising. A position in K Car outperformed on a strong growth outlook. K Car is the leading CPO (certified pre-owned) used car platform.
The worst performing position was in Hugel, which fell on the KFDA’s decision to cancel its license for four toxin products. Hugel filed for an injunction to minimize the near term impact. The stock also lagged on a disappointing exit by Bain Capital and on uncertainties of ownership transition to a new private equity fund. SK Innovation, a global energy and chemical company, underperformed, in part because of a large IPO for LG Energy, but also because the company results fell short of market expectations. A position in Zinus sold off post disappointing second quarter results which were marred by shipping disruptions
Market Outlook
The third quarter earnings season saw misses outpace beats by a significant margin. COVID19 interruptions and higher input cost were the main causes. We expect fourth quarter earnings season to be populated by misses for the same reason as the previous quarter. Still, we think investors will put greater emphasis on 2022 guidance which should continue to feature a gradually improving business environment.
While the near term outlook is clouded by COVID19 and geopolitical uncertainties, we are constructive on the Korean equity market due to 1) above trend growth for 2022, 2) continued supportive fiscal and monetary policies, and 3) continued global demand for Korean manufactured goods.
Main risks to our outlook arise from rising geopolitical threats, bumpiness of recovery from COVID19 and policy risk from the upcoming presidential election.
| | | | |
| 2 | | The Korea Fund, Inc. Semi-Annual Report | | | 12.31.21 |
The Korea Fund, Inc. Performance & Statistics
December 31, 2021 (unaudited)
| | | | | | | | | | | | | | | | |
| Total Return(1) | | 6 Months | | | 1 Year | | | 5 Year | | | 10 Year | |
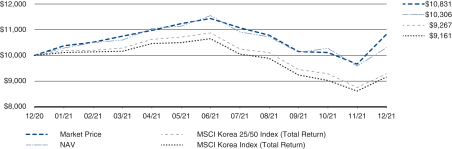
Market Price | | | (5.32 | )% | | | 8.31 | % | | | 12.79 | % | | | 6.42 | % |
Net Asset Value (“NAV”) | | | (10.74 | )% | | | 3.06 | % | | | 11.60 | % | | | 6.15 | % |
MSCI Korea 25/50 Index (Total Return)(2) | | | (14.53 | )% | | | (7.03 | )% | | | 10.47 | % | | | 6.38 | % |
MSCI Korea Index (Total Return)(2) | | | (14.01 | )% | | | (8.39 | )% | | | 11.66 | % | | | 7.03 | % |
Fund Performance Line Graph(3)
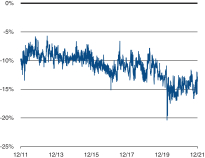
Premium (Discount) to NAV:
December 31, 2011 to December 31, 2021
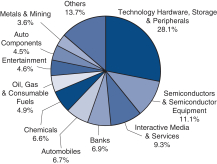
Industry Breakdown (as a % of net assets):
| | | | |
| Market Price/NAV: | | | |
Market Price | | | $34.38 | |
NAV(4) | | | $39.43 | |
Discount to NAV | | | (12.81 | )% |
| | | | | | |
| Ten Largest Holdings (as a % of net assets): | |
| 1. | | Samsung Electronics Co. Ltd. | | | 28.1 | % |
| 2. | | SK Hynix, Inc. | | | 10.7 | |
| 3. | | NAVER Corp. | | | 6.5 | |
| 4. | | LG Chem Ltd. | | | 4.1 | |
| 5. | | Hana Financial Group, Inc. | | | 4.0 | |
| 6. | | Kia Corp. | | | 3.8 | |
| 7. | | SK Innovation Co. Ltd. | | | 3.4 | |
| 8. | | Samsung Biologics Co. Ltd. | | | 2.9 | |
| 9. | | KB Financial Group, Inc. | | | 2.9 | |
| 10. | | Hyundai Motor Co. (Preference) | | | 2.9 | |
| | | | | | |
12.31.21 | | | The Korea Fund, Inc. Semi-Annual Report | | | 3 | |
The Korea Fund, Inc. Performance & Statistics
December 31, 2021 (unaudited) (continued)
Notes to Performance & Statistics:
| (1) | | Past performance is no guarantee of future results. Total return is calculated by determining the percentage change in NAV or market price (as applicable) in the specified period. The calculation assumes that all dividends and distributions, if any, have been reinvested. Total return does not reflect broker commissions or sales charges in connection with the purchase or sale of Fund shares. Total return for a period of more than one year represents the average annual total return. |
| | | Performance at market price will differ from results at NAV. Although market price returns typically reflect investment results over time, during shorter periods returns at market price can also be influenced by factors such as changing views about the Fund, market conditions, supply and demand for the Fund’s shares, or changes in the Fund’s dividends. |
| | | An investment in the Fund involves risk, including the loss of principal. Total return, market price and NAV will fluctuate with changes in market conditions. This data is provided for information purposes only and is not intended for trading purposes. Closed-end funds, unlike open-end funds, are not continuously offered. There is a one-time public offering and once issued, shares of closed-end funds are traded in the open market through a stock exchange. NAV is equal to total assets less total liabilities divided by the number of shares outstanding. Holdings are subject to change daily. |
| (2) | | Morgan Stanley Capital International (“MSCI”) Korea Index is a market capitalization-weighted index of equity securities of companies domiciled in Korea. The index is designed to represent the performance of the Korean stock market and excludes certain market segments unavailable to U.S. based investors. The MSCI Korea Index (Total Return) returns assume reinvestment of dividends (net of foreign withholding taxes) and, unlike Fund returns, do not reflect any fees or expenses. Effective July 1, 2017, the Board approved The MSCI Korea 25/50 Index (Total Return) as the primary benchmark for the Fund. The MSCI Korea 25/50 Index (Total Return) is designed to measure the performance of the large and mid cap segments of the Korean market. It applies certain investment limits that are imposed on regulated investment companies, or RICs, under the current US Internal Revenue Code. One requirement of a RIC is that at the end of each quarter of its tax year no more than 25% of the value of the RIC’s total assets may be invested in a single issuer and the sum of the weights of all issuers representing more than 5% of the fund should not exceed 50% of the fund’s total assets. The index covers approximately 85% of the free float-adjusted market capitalization in Korea. The returns assume reinvestment of dividends (net of foreign withholding taxes) but do not reflect any fees or expenses. It is not possible to invest directly in an index. Total Return for a period of more than one year represents the average annual return. |
| (3) | | Having met the necessary requirements, the period covered by the Fund Performance Line Graph above commences on January 1, 2021, being the date that JPMorgan Asset Management (Asia Pacific) Limited became the Fund’s Investment Adviser. Periods prior to January 1, 2021, when the Fund was advised by Allianz Global Investors U.S. LLC, are not shown. |
| (4) | | The NAV disclosed in the Fund’s financial statements may differ from this NAV due to accounting principles generally accepted in the United States of America. |
| | | | |
| 4 | | The Korea Fund, Inc. Semi-Annual Report | | | 12.31.21 |
The Korea Fund, Inc. Schedule of Portfolio Investments
As of December 31, 2021 (unaudited)
| | | | | | | | |
| Investments | | Shares | | | Value | |
| COMMON STOCKS–119.6% | | | | | |
| Air Freight & Logistics–1.7% | | | | | | | | |
Hyundai Glovis Co. Ltd.* | | | 23,600 | | | | $ 3,327,997 | |
| | | | | | | | |
| Auto Components–4.5% | | | | | | | | |
Hankook Tire & Technology Co. Ltd.* | | | 98,300 | | | | 3,283,934 | |
Hyundai Mobis Co. Ltd. | | | 26,450 | | | | 5,653,874 | |
| | | | | | | | |
| | | | | | | 8,937,808 | |
| | | | | | | | |
| Automobiles–6.7% | | | | | | | | |
Hyundai Motor Co. (Preference) | | | 66,700 | | | | 5,656,978 | |
Kia Corp.* | | | 108,700 | | | | 7,501,724 | |
| | | | | | | | |
| | | | | | | 13,158,702 | |
| | | | | | | | |
| Banks–6.9% | | | | | | | | |
Hana Financial Group, Inc. | | | 225,900 | | | | 7,980,842 | |
KB Financial Group, Inc. | | | 123,000 | | | | 5,688,050 | |
| | | | | | | | |
| | | | | | | 13,668,892 | |
| | | | | | | | |
| Biotechnology–2.1% | | | | | | | | |
Hugel, Inc. | | | 32,852 | | | | 4,238,600 | |
| | | | | | | | |
| Capital Markets–1.8% | | | | | | | | |
Korea Investment Holdings Co. Ltd.* | | | 53,100 | | | | 3,597,554 | |
| | | | | | | | |
| Chemicals–6.6% | | | | | | | | |
Dongjin Semichem Co. Ltd. | | | 37,600 | | | | 1,611,311 | |
LG Chem Ltd.* | | | 15,770 | | | | 8,152,492 | |
SKC Co. Ltd.* | | | 22,100 | | | | 3,230,079 | |
| | | | | | | | |
| | | | | | | 12,993,882 | |
| | | | | | | | |
| Construction & Engineering–2.8% | | | | | | | | |
DL E&C Co. Ltd.* | | | 30,000 | | | | 2,998,358 | |
DL Holdings Co. Ltd.* | | | 26,000 | | | | 1,329,647 | |
Samsung Engineering Co. Ltd.* | | | 66,900 | | | | 1,286,280 | |
| | | | | | | | |
| | | | | | | 5,614,285 | |
| | | | | | | | |
| Electric Utilities–0.9% | | | | | | | | |
Korea Electric Power Corp. | | | 100,700 | | | | 1,869,767 | |
| | | | | | | | |
| Electronic Equipment, Instruments & Components–2.5% | | | | | | | | |
Samsung Electro-Mechanics Co. Ltd.* | | | 29,900 | | | | 4,958,950 | |
| | | | | | | | |
| Entertainment–4.6% | | | | | | | | |
JYP Entertainment Corp.* | | | 86,525 | | | | 3,681,512 | |
Krafton, Inc.* | | | 4,000 | | | | 1,545,976 | |
NCSoft Corp.* | | | 7,250 | | | | 3,915,932 | |
| | | | | | | | |
| | | | | | | 9,143,420 | |
| | | | | | | | |
| Food & Staples Retailing–1.6% | | | | | | | | |
BGF retail Co. Ltd.* | | | 13,000 | | | | 1,588,459 | |
E-MART, Inc. | | | 12,600 | | | | 1,597,321 | |
| | | | | | | | |
| | | | | | | 3,185,780 | |
| | | | | | | | |
| Food Products–1.0% | | | | | | | | |
CJ CheilJedang Corp.* | | | 6,100 | | | | 1,987,213 | |
| | | | | | | | |
| Health Care Equipment & Supplies–1.5% | | | | | | | | |
Dentium Co. Ltd.* | | | 32,100 | | | | 1,882,342 | |
Suheung Co. Ltd.* | | | 29,400 | | | | 1,092,733 | |
| | | | | | | | |
| | | | | | | 2,975,075 | |
| | | | | | | | |
| | | | | | |
12.31.21 | | | The Korea Fund, Inc. Semi-Annual Report | | | 5 | |
The Korea Fund, Inc. Schedule of Portfolio Investments
As of December 31, 2021 (unaudited) (continued)
| | | | | | | | |
| Investments | | Shares | | | Value | |
| Hotels, Restaurants & Leisure–1.6% | | | | | | | | |
Kangwon Land, Inc.* | | | 152,805 | | | | $ 3,086,612 | |
| | | | | | | | |
| Household Durables–1.0% | | | | | | | | |
Zinus, Inc.* | | | 30,200 | | | | 1,956,639 | |
| | | | | | | | |
| Industrial Conglomerates–2.0% | | | | | | | | |
SK, Inc. | | | 18,800 | | | | 3,963,404 | |
| | | | | | | | |
| Insurance–0.7% | | | | | | | | |
Samsung Fire & Marine Insurance Co. Ltd.* | | | 8,000 | | | | 1,359,007 | |
| | | | | | | | |
| Interactive Media & Services–9.3% | | | | | | | | |
AfreecaTV Co. Ltd.* | | | 8,300 | | | | 1,410,233 | |
Kakao Corp. | | | 44,200 | | | | 4,173,907 | |
NAVER Corp.* | | | 40,600 | | | | 12,887,310 | |
| | | | | | | | |
| | | | | | | 18,471,450 | |
| | | | | | | | |
| Life Sciences Tools & Services–2.9% | | | | | | | | |
Samsung Biologics Co. Ltd.* (a) | | | 7,534 | | | | 5,720,616 | |
| | | | | | | | |
| Machinery–0.4% | | | | | | | | |
HSD Engine Co. Ltd.* | | | 123,100 | | | | 862,617 | |
| | | | | | | | |
| Media–0.9% | | | | | | | | |
Innocean Worldwide, Inc. | | | 39,500 | | | | 1,838,688 | |
| | | | | | | | |
| Metals & Mining–3.6% | | | | | | | | |
Korea Zinc Co. Ltd.* | | | 4,300 | | | | 1,850,165 | |
POSCO | | | 23,000 | | | | 5,333,399 | |
| | | | | | | | |
| | | | | | | 7,183,564 | |
| | | | | | | | |
| Multiline Retail–0.5% | | | | | | | | |
Hyundai Department Store Co. Ltd.* | | | 15,500 | | | | 978,002 | |
| | | | | | | | |
| Oil, Gas & Consumable Fuels–4.9% | | | | | | | | |
SK Innovation Co. Ltd.* | | | 34,000 | | | | 6,807,865 | |
S-Oil Corp. | | | 39,600 | | | | 2,846,138 | |
| | | | | | | | |
| | | | | | | 9,654,003 | |
| | | | | | | | |
| Personal Products–2.0% | | | | | | | | |
LG Household & Health Care Ltd.* | | | 4,340 | | | | 4,005,672 | |
| | | | | | | | |
| Pharmaceuticals–1.4% | | | | | | | | |
Yuhan Corp.* | | | 53,550 | | | | 2,797,595 | |
| | | | | | | | |
| Professional Services–0.8% | | | | | | | | |
NICE Information Service Co. Ltd.* | | | 102,740 | | | | 1,553,479 | |
| | | | | | | | |
| Semiconductors & Semiconductor Equipment–11.1% | | | | | | | | |
SK Hynix, Inc. | | | 192,000 | | | | 21,087,860 | |
SK Square Co. Ltd.* | | | 14,036 | | | | 784,009 | |
| | | | | | | | |
| | | | | | | 21,871,869 | |
| | | | | | | | |
| Specialty Retail–1.5% | | | | | | | | |
K Car Co. Ltd. | | | 100,000 | | | | 2,868,559 | |
| | | | | | | | |
| Technology Hardware, Storage & Peripherals–28.1% | | | | | | | | |
Samsung Electronics Co. Ltd. | | | 846,700 | | | | 55,606,998 | |
| | | | | | | | |
| Textiles, Apparel & Luxury Goods–0.8% | | | | | | | | |
Hwaseung Enterprise Co. Ltd.* | | | 107,900 | | | | 1,527,501 | |
| | | | | | | | |
| Tobacco–0.5% | | | | | | | | |
KT&G Corp. | | | 13,400 | | | | 890,267 | |
| | | | | | | | |
| | | | |
| 6 | | The Korea Fund, Inc. Semi-Annual Report | | | 12.31.21 |
The Korea Fund, Inc. Schedule of Portfolio Investments
As of December 31, 2021 (unaudited) (continued)
| | | | | | | | |
| Investments | | Shares | | | Value | |
| Wireless Telecommunication Services–0.4% | | | | | | | | |
SK Telecom Co. Ltd. | | | 17,900 | | | | $ 869,876 | |
| | | | | | | | |
Total Common Stocks (Cost $166,462,627) | | | | | | | 236,724,343 | |
| | | | | | | | |
Total Investments–119.6% (Cost $166,462,627) | | | | | | | 236,724,343 | |
Liabilities in Excess of Other Assets–(19.6)% | | | | | | | (38,750,157 | ) |
| | | | | | | | |
| Net Assets–100.0% | | | | | | | $197,974,186 | |
| | | | | | | | |
Percentages indicated are based on net assets.
Notes to Schedule of Investments:
| | |
| Preference | | A special type of equity investment that shares in the earnings of the company, has limited voting rights, and may have a dividend preference. Preference shares may also have liquidation preference. |
| |
| (a) | | Security exempt from registration pursuant to Regulation S under the Securities Act of 1933, as amended. Regulation S applies to securities offerings that are made outside of the United States and do not involve direct selling efforts in the United States and as such may have restrictions on resale. |
| |
| * | | Non-income producing security. |
| | | | | | | | | | | | | | | | |
| | | Level 1
Quoted prices | | | Level 2
Other significant
observable
inputs | | | Level 3
Significant
unobservable
inputs | | | Total | |
| | | | |
Total Investments in Securities(a) | | $ | — | | | $ | 236,724,343 | | | $ | — | | | $ | 236,724,343 | |
(a) Please refer to the schedule of portfolio investments for specifics of portfolio holdings.
| | | | | | | | |
| See Notes to Financial Statements | | | 12.31.21 | | | The Korea Fund, Inc. Semi-Annual Report | | | 7 | |
The Korea Fund, Inc. Statement of Assets and Liabilities
As of December 31, 2021 (unaudited)
| | | | | | | | |
| |
| Assets: | |
| | |
Investments, at value | | | | | | | $236,724,343 | |
| | |
Cash | | | | | | | 388,737 | |
| | |
Foreign currency, at value | | | | | | | 4,216,754 | |
| | |
Prepaid expenses and other assets | | | | | | | 50,558 | |
| | |
Receivables: | | | | | | | | |
| | |
Investment securities sold | | | | | | | 416,053 | |
| | |
Dividends (net of withholding taxes) | | | | | | | 2,123,412 | |
| | |
Total Assets | | | | | | | 243,919,857 | |
| |
| Liabilities: | |
| | |
Payables: | | | | | | | | |
| | |
Distributions to stockholders | | | | | | | 45,732,032 | |
| | |
Accrued expenses and other liabilities | | | | | | | 213,639 | |
| | |
Total Liabilities | | | | | | | 45,945,671 | |
| | |
| Net Assets | | | | | | | $197,974,186 | |
| |
| Net Assets: | |
| | |
Common Stock: | | | | | | | | |
| | |
Par value ($0.01 per share, applicable to $5,019,976 shares issued and outstanding) | | | | | | | $50,200 | |
| | |
Paid-in-capital in excess of par | | | | | | | 127,230,727 | |
| | |
Total distributable earnings (loss) | | | | | | | 70,693,259 | |
| | |
| Net Assets | | | | | | | $197,974,186 | |
| | |
| Net Asset Value Per Share | | | | | | | $39.44 | |
| | |
Cost of investments | | | | | | | $166,462,627 | |
| | |
Cost of foreign currency | | | | | | | 4,220,643 | |
| | | | | | |
| 8 | | The Korea Fund, Inc. Semi-Annual Report | | | 12.31.21 | | | See Notes to Financial Statements |
The Korea Fund, Inc. Statement of Operations
For The Six Months Ended December 31, 2021 (unaudited)
| | | | | | | | |
| | | |
| Investment Income: | | | | | | | | |
| | |
Interest income | | | | | | | $ 15 | |
| | |
Dividend income | | | | | | | 4,168,268 | |
| | |
Foreign taxes withheld (net) | | | | | | | (535,033) | |
| | |
Total investment income | | | | | | | 3,633,250 | |
| | |
| Expenses: | | | | | | | | |
| | |
Investment management (See Note 3) | | | | | | | 866,339 | |
| | |
Legal | | | | | | | 60,601 | |
| | |
Directors | | | | | | | 108,174 | |
| | |
Custodian and accounting agent | | | | | | | 144,540 | |
| | |
Insurance | | | | | | | 60,014 | |
| | |
Audit and tax services | | | | | | | 44,970 | |
| | |
Stockholder communications | | | | | | | 24,992 | |
| | |
Transfer agent | | | | | | | 19,190 | |
| | |
Other | | | | | | | 23,936 | |
| | |
Total expenses | | | | | | | 1,352,756 | |
| | |
| Net investment income (loss) | | | | | | | 2,280,494 | |
| | |
| Realized/Unrealized Gains (Losses): | | | | | | | | |
| | |
Net realized gain (loss) on transactions from: | | | | | | | | |
| | |
Investments | | | | | | | 13,452,788 | |
| | |
Foreign currency transactions | | | | | | | (102,499) | |
| | |
Net realized gain (loss) | | | | | | | 13,350,289 | |
| | |
Change in net unrealized appreciation/depreciation on: | | | | | | | | |
| | |
Investments | | | | | | | (44,859,749) | |
| | |
Foreign currency translations | | | | | | | (10,519) | |
| | |
Change in net unrealized appreciation/depreciation | | | | | | | (44,870,268) | |
| | |
Net realized/unrealized gains (losses) | | | | | | | (31,519,979) | |
| | |
| Change in net assets resulting from operations | | | | | | | $(29,239,485) | |
| | | | | | | | |
| See Notes to Financial Statements | | | 12.31.21 | | | The Korea Fund, Inc. Semi-Annual Report | | | 9 | |
The Korea Fund, Inc. Statement of Changes in Net Assets
For The Periods Indicated
| | | | | | | | | | | | | | | | |
| | | | | |
| | | | | | Six Months
Ended
December 31, 2021
(Unaudited) | | | | | | Year Ended
June 30, 2021 | |
| | | | |
| Change in Net Assets Resulting from Operations: | | | | | | | | | | | | | | | | |
| | | | |
Net investment income (loss) | | | | | | | $2,280,494 | | | | | | | | $1,034,761 | |
| | | | |
Net realized gain (loss) | | | | | | | 13,350,289 | | | | | | | | 43,392,931 | |
| | | | |
Change in net unrealized appreciation/depreciation | | | | | | | (44,870,268) | | | | | | | | 75,118,621 | |
| | | | |
Change in net assets resulting from operations | | | | | | | (29,239,485) | | | | | | | | 119,546,313 | |
| | | | |
| Distributions to Stockholders: | | | | | | | | | | | | | | | | |
| | | | |
Distributable earnings | | | | | | | (45,732,032) | | | | | | | | (2,637,997) | |
| | | | |
| Common Stock Transactions: | | | | | | | | | | | | | | | | |
| | | | |
Cost of shares repurchased | | | | | | | — | | | | | | | | (707,632) | |
| | | | |
| Net Assets: | | | | | | | | | | | | | | | | |
| | | | |
Change in net assets | | | | | | | (74,971,517) | | | | | | | | 116,200,684 | |
| | | | |
Beginning of period | | | | | | | 272,945,703 | | | | | | | | 156,745,019 | |
| | | | |
End of period | | | | | | | $197,974,186 | | | | | | | | $272,945,703 | |
| | | | |
| Shares Activity: | | | | | | | | | | | | | | | | |
| | | | |
Shares outstanding, beginning of year | | | | | | | 5,019,976 | | | | | | | | 5,040,949 | |
| | | | |
Shares repurchased | | | | | | | — | | | | | | | | (20,973) | |
| | | | |
Shares outstanding, end of year | | | | | | | 5,019,976 | | | | | | | | 5,019,976 | |
| | | | | | |
| 10 | | The Korea Fund, Inc. Semi-Annual Report | | | 12.31.21 | | | See Notes to Financial Statements |
The Korea Fund, Inc. Financial Highlights
For a share of stock outstanding throughout each period^:
| | | | | | | | | | | | | | | | | | | | | | | | | | | | | | | | | | | | | | | | | | | | |
| | | | | |
| | | | | Six Months
Ended
December 31,
2021
(Unaudited) | | | | | Year ended June 30, | |
| | | | | | | 2021 | | | | | | 2020 | | | | | | 2019 | | | | | | 2018 | | | | | | 2017 | |
Net asset value, beginning of period | | | | | $54.37 | | | | | | $31.09 | | | | | | | | $32.78 | | | | | | | | $42.39 | | | | | | | | $44.65 | | | | | | | | $36.68 | |
Investment Operations: | | | | | | | | | | | | | | | | | | | | | | | | | | | | | | | | | | | | | | | | | | | | |
Net investment income (1) | | | | | 0.45 | | | | | | 0.21 | | | | | | | | 0.16 | | | | | | | | 0.22 | | | | | | | | 0.20 | | | | | | | | 0.16 | |
Net realized and change in unrealized gain (loss) | | | | | (6.27 | ) | | | | | 23.58 | | | | | | | | (1.85 | ) | | | | | | | (4.76 | ) | | | | | | | 1.13 | | | | | | | | 7.75 | |
Total from investment operations | | | | | (5.82 | ) | | | | | 23.79 | | | | | | | | (1.69 | ) | | | | | | | (4.54 | ) | | | | | | | 1.33 | | | | | | | | 7.91 | |
Dividends and Distributions to Stockholders from: | | | | | | | | | | | | | | | | | | | | | | | | | | | | | | | | | | | | | | | | | | | | |
Net investment income | | | | | (2.05 | ) | | | | | (0.53 | ) | | | | | | | (0.07 | ) | | | | | | | (0.61 | ) | | | | | | | (0.23 | ) | | | | | | | (0.28 | ) |
Net realized gains | | | | | (7.06 | ) | | | | | — | | | | | | | | — | | | | | | | | (4.62 | ) | | | | | | | (3.80 | ) | | | | | | | (0.05 | ) |
Total dividends and distributions to stockholders | | | | | (9.11 | ) | | | | | (0.53 | ) | | | | | | | (0.07 | ) | | | | | | | (5.23 | ) | | | | | | | (4.03 | ) | | | | | | | (0.33 | ) |
Common Stock Transactions: | | | | | | | | | | | | | | | | | | | | | | | | | | | | | | | | | | | | | | | | | | | | |
Accretion to net asset value resulting from share repurchases and tender offer | | | | | — | | | | | | 0.02 | | | | | | | | 0.07 | | | | | | | | 0.16 | | | | | | | | 0.44 | | | | | | | | 0.39 | |
Net asset value, end of period | | | | | $39.44 | | | | | | $54.37 | | | | | | | | $31.09 | | | | | | | | $32.78 | | | | | | | | $42.39 | | | | | | | | $44.65 | |
Market price, end of period | | | | | $34.38 | | | | | | $46.16 | | | | | | | | $25.85 | | | | | | | | $28.84 | | | | | | | | $38.26 | | | | | | | | $40.04 | |
Total return: (2) | | | | | | | | | | | | | | | | | | | | | | | | | | | | | | | | | | | | | | | | | | | | |
Net asset value | | | | | (10.74 | )% | | | | | 76.93 | % | | | | | | | (4.96 | )% | | | | | | | (9.92 | )% | | | | | | | 3.39 | % | | | | | | | 22.83 | % |
Market price | | | | | (5.32 | )% | | | | | 80.66 | % | | | | | | | (10.15 | )% | | | | | | | (10.97 | )% | | | | | | | 4.41 | % | | | | | | | 25.09 | % |
RATIOS/SUPPLEMENTAL DATA: | | | | | | | | | | | | | | | | | | | | | | | | | | | | | | | | | | | | | | | | | | | | |
Net assets, end of period (000s) | | | | | $197,974 | | | | | | $272,946 | | | | | | | | $156,745 | | | | | | | | $168,093 | | | | | | | | $227,318 | | | | | | | | $259,976 | |
Ratio of expenses to average net assets | | | | | 1.09 | %(3) | | | | | 1.12 | % | | | | | | | 1.22 | % | | | | | | | 1.25 | % | | | | | | | 1.13 | % | | | | | | | 1.18 | %(4) |
Ratio of net investment income to average net assets | | | | | 1.84 | %(3) | | | | | 0.46 | % | | | | | | | 0.52 | % | | | | | | | 0.62 | % | | | | | | | 0.43 | % | | | | | | | 0.40 | %(4) |
Portfolio turnover rate | | | | | 18 | % | | | | | 81 | % | | | | | | | 42 | % | | | | | | | 27 | % | | | | | | | 69 | % | | | | | | | 67 | % |
| ^ | | A “—” may reflect actual amounts rounding to less than $0.01 or 0.01%. | |
| (1) | | Calculated on average common shares outstanding during the period. | |
| (2) | | Total return is calculated by subtracting the value of an investment in the Fund at the beginning of the specified period from the value at the end of the period and dividing the remainder by the value of the investment at the beginning of the period and expressing the result as a percentage. The calculation assumes that all dividends and distributions, if any, have been reinvested. Total return does not reflect broker commissions or sales charges in connection with the purchase or sale of Fund shares. Total return on net asset value may reflect adjustments to conform to U.S. GAAP. Total investment return for a period of less than one year is not annualized. | |
| (4) | | Inclusive of tender offer expenses of 0.05%. | |
| | | | | | | | |
| See Notes to Financial Statements | | | 12.31.21 | | | The Korea Fund, Inc. Semi-Annual Report | | | 11 | |
The Korea Fund, Inc. Notes to Financial Statements
December 31, 2021 (unaudited)
1. Organization and Significant Accounting Policies
The Korea Fund, Inc. (the “Fund”) is registered under the Investment Company Act of 1940 and the rules and regulations thereunder, as amended, as a closed-end, non-diversified management investment company organized as a Maryland corporation, and accordingly, follows the investment company accounting and reporting guidance of the Financial Accounting Standards Board (“FASB”) Accounting Standards Codification Topic 946 Financial Services—Investment Companies. JPMorgan Asset Management (Asia Pacific) Limited (the “Investment Adviser”) serves as the Fund’s investment manager. The Fund has authorized 200 million shares of common stock with $0.01 par value. The Korea Fund has filed a notice under the Commodity Exchange Act under Regulation 4.5 that The Korea Fund is operated by JPMorgan Asset Management (Asia Pacific) Limited, a registered investment adviser that has claimed an exclusion from the definition of the term “commodity pool operator” under the Commodity Exchange Act and, therefore, is not subject to registration or regulation as a commodity pool operator under the Commodity Exchange Act.
The Fund’s investment objective is to seek long-term capital appreciation through investment in securities, primarily equity securities, of Korean companies. There can be no assurance that the Fund will meet its stated objective.
The preparation of the Fund’s financial statements in accordance with accounting principles generally accepted in the United States of America (“U.S. GAAP”) requires the Fund’s management to make estimates and assumptions that affect the reported amounts and disclosures in the Fund’s financial statements. Actual results could differ from those estimates.
Like many other companies, the Fund’s organizational documents provide that its officers (“Officers”) and the Board of Directors of the Fund (the “Board” or the “Directors”) are indemnified against certain liabilities arising out of the performance of their duties to the Fund. In addition, both in some of its principal service contracts and in the normal course of its business, the Fund enters into contracts that provide indemnifications to other parties for certain types of losses or liabilities. The Directors’ maximum exposure under these arrangements is unknown as this could involve future claims against the Fund.
The following is a summary of significant accounting policies consistently followed by the Fund:
(a) Valuation of Investments
Portfolio securities and other financial instruments for which market quotations are readily available are valued at market value. Market values for various types of securities and other instruments are determined on the basis of closing prices or last sales prices on an exchange or other market, or based on quotes or other market information obtained from quotation reporting systems, established market makers or independent pricing services. For foreign equity securities (with certain exceptions, if any), the Fund fair values its securities daily using modeling tools provided by a statistical research service. This service utilizes statistics and programs based on historical performance of markets and other economic data (which may include changes in the value of U.S. securities or security indices). Investments in mutual funds are valued at the net asset value (“NAV”) as reported on each business day.
Portfolio securities and other financial instruments for which market quotations are not readily available (including in cases where available market quotations are deemed to be unreliable), are fair valued, in good faith, pursuant to procedures established by the Board, or persons acting at their discretion (“Valuation Committee”) pursuant to procedures established by the Board. The Fund’s investments are valued daily and the Fund’s NAV is calculated as of the close of regular trading (normally 4:00 p.m. Eastern Time) on the New York Stock Exchange (“NYSE”) on each day the NYSE is open for business using prices supplied by an independent pricing service or broker/dealer quotations, or by using the last sale or settlement price on the exchange that is the primary market for such securities, or the mean between the last bid and ask quotations. In unusual circumstances, the Board or the Valuation Committee may in good faith determine the NAV as of 4:00 p.m., Eastern Time, notwithstanding an earlier, unscheduled close or halt of trading on the NYSE.
Short-term investments having a remaining maturity of 60 days or less are valued at amortized cost unless the Board or its Valuation Committee determines that particular circumstances dictate otherwise.
Investments initially valued in currencies other than the U.S. dollar are converted to the U.S. dollar using exchange rates obtained from pricing services. As a result, the NAV of the Fund’s shares may be affected by changes in the value of currencies in relation to the U.S. dollar. The value of securities traded in markets outside the United States or denominated in currencies other than the U.S. dollar may be affected significantly on a day that the NYSE is closed.
The prices used by the Fund to value securities may differ from the value that would be realized if the securities were sold and these differences could be material to the Fund’s financial statements.
| | | | |
| 12 | | The Korea Fund, Inc. Semi-Annual Report | | | 12.31.21 |
The Korea Fund, Inc. Notes to Financial Statements
December 31, 2021 (unaudited) (continued)
1. Organization and Significant Accounting Policies (continued)
(b) Fair Value Measurements
Fair value is defined as the price that would be received to sell an asset or paid to transfer a liability (i.e., the “exit price”) in an orderly transaction between market participants. The three levels of the fair value hierarchy are described below:
| | • | | Level 1—unadjusted quoted prices in active markets for identical investments that the Fund has the ability to access |
| | • | | Level 2—valuations based on other significant observable inputs, which may include, but are not limited to, quoted prices for similar assets or liabilities, interest rates, yield curves, volatilities, prepayment speeds, loss severities, credit risks and default rates or other market corroborated inputs |
| | • | | Level 3—valuations based on significant unobservable inputs (including the Investment Adviser’s or Valuation Committee’s own assumptions and securities whose price was determined by using a single broker’s quote) |
The valuation techniques used by the Fund to measure fair value during the six months ended December 31, 2021 were intended to maximize the use of observable inputs and to minimize the use of unobservable inputs.
An investment asset’s or liability’s level within the fair value hierarchy is based on the lowest level input, individually or in aggregate, that is significant to the fair value measurement. The objective of fair value measurement remains the same even when there is a significant decrease in the volume and level of activity for an asset or liability and regardless of the valuation techniques used.
The inputs or methodology used for valuing securities are not necessarily an indication of the risk associated with investing in those securities. The following are certain inputs and techniques that the Fund generally uses to evaluate how to classify each major category of assets and liabilities within Level 2 and Level 3, in accordance with U.S. GAAP.
An asset or liability for which market values cannot be measured using the methodologies described above is valued by methods deemed reasonable in good faith by the Valuation Committee, following the procedures established by the Board, to represent fair value. Under these procedures, the Fund generally uses a market-based approach which may use related or comparable assets or liabilities, recent transactions, market multiples, book values and other relevant information. Fair value determinations involve the consideration of a number of subjective factors, an analysis of applicable facts and circumstances and the exercise of judgment. As a result, it is possible that the fair value for a security determined in good faith in accordance with the Fund’s valuation procedures may differ from valuations for the same security determined by other funds using their own valuation procedures. Although the Fund’s valuation procedures are designed to value a security at the price the Fund may reasonably expect to receive upon the security’s sale in an orderly transaction, there can be no assurance that any fair value determination thereunder would, in fact, approximate the amount that the Fund would actually realize upon the sale of the security or the price at which the security would trade if a reliable market price were readily available.
Equity Securities (Common and Preferred Stock)—Equity securities traded in inactive markets and certain foreign equity securities are valued using inputs which include broker-dealer quotes, recently executed transactions adjusted for changes in the benchmark index, or evaluated price quotes received from independent pricing services that take into account the integrity of the market sector and issuer, the individual characteristics of the security, and information received from broker-dealers and other market sources pertaining to the issuer or security. To the extent that these inputs are observable, the values of equity securities are categorized as Level 2. To the extent that these inputs are unobservable, the values are categorized as Level 3.
(c) Investment Transactions and Investment Income
Investment transactions are accounted for on the trade date. Realized gains and losses on investments are determined on an identified cost basis. Interest income on uninvested cash is recorded upon receipt. Dividend income is recorded on the ex-dividend date. Korean-based corporations have generally adopted calendar year-ends, and their interim and final corporate actions are normally approved, finalized and announced by their boards of directors and stockholders in the first and third quarters of each calendar year. Generally, estimates of their dividends are accrued on the ex-dividend date principally in the prior December and/or June period ends. These dividend announcements are recorded by the Fund on such ex-dividend dates. Any subsequent adjustments thereto by Korean corporations are recorded when announced. Presently, dividend income from Korean equity investments is earned primarily in the last calendar quarter of each year, and will be received primarily in the first calendar quarter of the following year. Certain other dividends and related withholding taxes, if applicable, from Korean securities may be recorded subsequent to the ex-dividend date as soon as the Fund is informed of such dividends and taxes. Dividend and interest income on the Statement of Operations are shown net of any foreign taxes withheld on income from foreign securities.
| | | | | | |
12.31.21 | | | The Korea Fund, Inc. Semi-Annual Report | | | 13 | |
The Korea Fund, Inc. Notes to Financial Statements
December 31, 2021 (unaudited) (continued)
1. Organization and Significant Accounting Policies (continued)
(d) Federal Income Taxes
The Fund intends to distribute all of its taxable income and to comply with the other requirements of Subchapter M of the U.S. Internal Revenue Code of 1986, as amended, applicable to regulated investment companies. Accordingly, no provision for U.S. federal income taxes is required. The Fund may be subject to excise tax based on distributions to stockholders.
Accounting for uncertainty in income taxes establishes for all entities, including pass-through entities such as the Fund, a minimum threshold for financial statement recognition of the benefit of positions taken in filing tax returns (including whether an entity is taxable in a particular jurisdiction), and requires certain expanded tax disclosures. In accordance with provisions set forth under U.S. GAAP, the Investment Adviser has reviewed the Fund’s tax positions for all open tax years.
As of December 31, 2021, the Fund has recorded no liability for net unrecognized tax benefits relating to uncertain income tax positions they have taken. The Fund’s U.S. federal income tax returns for the prior three years, as applicable, remain subject to examination by the Internal Revenue Service.
(e) Foreign Investment and Exchange Controls in Korea
The Foreign Exchange Transaction Act, the Presidential Decree relating to such Act and the regulations of the Minister of Strategy and Finance (formerly known as Minister of Finance and Economy) issued thereunder impose certain limitations and controls which generally affect foreign investors in Korea. Through August 18, 2005, the Fund had a license from the Ministry of Finance and Economy to invest in Korean securities and to repatriate income received from dividends and interest earned on, and net realized capital gains from, its investments in Korean securities or to repatriate from investment principal up to 10% of the NAV (taken at current value) of the Fund (except upon termination of the Fund, or for expenses in excess of Fund income, in which case the foregoing restriction shall not apply). Under the Foreign Exchange Transaction Act, the Minister of Strategy and Finance has the power, with prior (posterior in case of urgency) public notice of scope and duration, to suspend all or a part of foreign exchange transactions when emergency measures are deemed necessary in case of radical change in the international or domestic economic situation. The Fund could be adversely affected by delays in, or the refusal to grant, any required governmental approval for such transactions.
The Fund relinquished its license from the Korean Ministry of Finance and Economy effective August 19, 2005. The Fund had engaged in negotiations with the Korean Ministry of Finance and Economy concerning the feasibility of the Fund’s license being amended to allow the Fund to repatriate more than 10% of Fund capital. However, the Ministry of Finance and Economy advised the Fund that the license cannot be amended as a result of a change in the Korean regulations. As a result of the relinquishment of the license, the Fund is subject to the Korean securities transaction tax equal to 0.25% of the fair market value of any portfolio securities transferred by the Fund on the Korea Exchange and 0.45% of the fair market value of any portfolio securities transferred outside of the Korea Exchange. The relinquishment did not otherwise affect the Fund’s operations. For the six month ended December 31, 2021, the Fund incurred $107,617 in transaction taxes in connection with portfolio securities transferred by the Fund on the Korea Exchange. Net realized gain (loss) on investments on the Statement of Operations is shown net of the transaction taxes incurred by the Fund.
Certain securities held by the Fund may be subject to aggregate or individual foreign ownership limits. These holdings are in industries that are deemed to be of national importance.
(f) Dividends and Distributions
The Fund declares dividends from net investment income and distributions of net realized capital gains, if any, at least annually. The Fund records dividends and distributions on the ex-dividend date. The amount of dividends from net investment income and distributions from net realized capital gains is determined in accordance with U.S. federal income tax regulations, which may differ from U.S. GAAP. These “book-tax” differences are considered either temporary or permanent in nature. To the extent these differences are permanent in nature, such amounts are reclassified within the capital accounts based on their federal income tax treatment; temporary differences do not require reclassification. To the extent dividends and/or distributions exceed current and accumulated earnings and profits for federal income tax purposes, they are reported as dividends and/or distributions to stockholders from return of capital.
(g) Foreign Currency Translation
The Fund’s accounting records are maintained in U.S. dollars as follows: (1) the foreign currency market values of investments and other assets and liabilities denominated in foreign currencies are translated at the prevailing exchange rate at the end of the period; and (2) purchases and sales, income and expenses are translated at the prevailing exchange rate on the respective dates of such transactions. The resulting net foreign currency gain (loss) is included in the Fund’s Statement of Operations.
| | | | |
| 14 | | The Korea Fund, Inc. Semi-Annual Report | | | 12.31.21 |
The Korea Fund, Inc. Notes to Financial Statements
December 31, 2021 (unaudited) (continued)
1. Organization and Significant Accounting Policies (continued)
The Fund does not generally isolate that portion of the results of operations arising as a result of changes in foreign currency exchange rates from the fluctuations arising from changes in the market prices of securities. Accordingly, such foreign currency gain (loss) is included in net realized and unrealized gain (loss) on investments. However, the Fund does isolate the effect of fluctuations in foreign currency exchange rates when determining the gain (loss) upon the sale or maturity of foreign currency denominated debt obligations pursuant to U.S. federal income tax regulations; such amount is categorized as foreign currency gain (loss) for both financial reporting and income tax reporting purposes.
At December 31, 2021, the Korean WON (“W”)/U.S. dollar (“$”) exchange rate was W 1,188.90 to $1.
(h) Securities Lending
The Fund may engage in securities lending. The loans are secured by collateral at least equal, at all times, to the market value of the loaned securities. During the term of the loan, the Fund will continue to receive any dividends or amounts equivalent thereto, on the loaned securities while receiving a fee from the borrower and/or earning interest on the investment of the cash collateral. Securities lending income is disclosed as such in the Statement of Operations. Income generated from the investment of cash collateral, less negotiated rebate fees paid to borrowers and transaction costs, is allocated between the Fund and securities lending agent. Cash collateral received for securities on loan is invested in securities identified in the Schedule of Investments and the corresponding liability is recognized as such in the Statement of Assets and Liabilities. Loans are subject to termination at the option of the borrower or the Fund.
Upon termination of the loan, the borrower will return to the lender securities identical to the loaned securities. The Fund may pay reasonable finders’, administration and custodial fees in connection with a loan of its securities and may share the interest earned on the collateral with the borrower. The Fund bears the risk of delay in recovery of, or even loss of rights in, the securities loaned should the borrower of the securities fail financially. The Fund also bears the risk of loss in the event the securities purchased with cash collateral depreciate in value.
The Fund did not lend out any securities during the six months ended December 31, 2021.
2. Principal Risks
In the normal course of business, the Fund trades financial instruments and enters into financial transactions where risk of potential loss exists due to, among other things, changes in the market (market risk) or failure of the other party to a transaction to perform (counterparty risk). The Fund is also exposed to other risks such as, but not limited to, foreign currency risk.
To the extent the Fund directly invests in foreign currencies or in securities that trade in, and receive revenues in, foreign currencies, or in derivatives that provide exposure to foreign currencies, it will be subject to the risk that those currencies will decline in value relative to the U.S. dollar, or, in the case of hedging positions, that the U.S. dollar will decline in value relative to the currency being hedged. Currency rates in foreign countries may fluctuate significantly over short periods of time for a number of reasons, including economic growth, inflation, changes in interest rates, intervention (or the failure to intervene) by U.S. or foreign governments, central banks or supranational entities such as the International Monetary Fund, or the imposition of currency controls or other political developments in the United States or abroad. As a result, the Fund’s investments in foreign currency-denominated securities may reduce the returns of the Fund. The local emerging market currencies in which the Fund may be invested may experience substantially greater volatility against the U.S. dollar than the major convertible currencies in developed countries.
The Fund is subject to elements of risk not typically associated with investments in the U.S., due to concentrated investments in foreign issuers located in a specific country or region. Such concentrations will subject the Fund to additional risks resulting from future political or economic conditions in such country or region and the possible imposition of adverse governmental laws or currency exchange restrictions affecting such country or region, which could cause the securities and their markets to be less liquid and prices more volatile than those of comparable U.S. companies.
The Fund may be subject to increased risk to the extent it allocates assets among investment styles and certain styles under-perform relative to other investment styles.
The market values of securities may decline due to general market conditions (market risk) which are not specifically related to a particular company, such as real or perceived adverse economic conditions, changes in the general outlook for corporate earnings, changes in interest or currency rates, adverse changes to credit markets or adverse investor sentiment. They may also decline due to factors that affect a particular industry or industries, such as labor shortages or increased production costs and competitive conditions within an industry. Equity securities and equity-related investments generally have greater market price volatility than fixed income securities, although under certain market conditions fixed income securities may have comparable or greater price volatility. Credit ratings downgrades may also
| | | | | | |
12.31.21 | | | The Korea Fund, Inc. Semi-Annual Report | | | 15 | |
The Korea Fund, Inc. Notes to Financial Statements
December 31, 2021 (unaudited) (continued)
2. Principal Risks (continued)
negatively affect securities held by the Fund. Even when markets perform well, there is no assurance that the investments held by the Fund will increase in value along with the broader market. In addition, market risk includes the risk that local, regional or global events, including geopolitical and other events may disrupt the economy on a national or global level. For example, events such as war, acts of terrorism, the spread of infectious illness or other public health issues, recessions, or other events could have a significant impact on the economy or the markets for financial instruments and, as a result, could have a significant impact on the Fund and its investments. As a further example, an outbreak of respiratory disease caused by a novel coronavirus designated as COVID-19 was first detected in China in December 2019 and subsequently spread globally, being designated as a pandemic in early 2020. The transmission of COVID-19 and efforts to contain its spread have resulted in, among other things, border closings and other significant travel restrictions and disruptions; mandatory stay-at-home and work-from-home orders in numerous countries, including the United States; significant disruptions to business operations, supply chains and customer activity, as well as mandatory business closures; lower consumer demand for goods and services; event cancellations and restrictions; cancellations, reductions and other changes in services; significant challenges in healthcare service preparation and delivery; public gathering limitations and prolonged quarantines; and general concern and uncertainty. These effects have exacerbated the significant risks inherent in market investments, and the COVID-19 pandemic has meaningfully disrupted the global economy and markets, causing market losses across a range of asset classes, as well as both heightened market volatility and increased illiquidity for trading. Although the long-term economic fallout of COVID-19 is difficult to predict, it has the potential to continue to have ongoing material adverse effects on the global economy, the economies of individual countries, and the financial performance of individual issuers, sectors, industries, asset classes, and markets in significant and unforeseen ways. Health crises caused by the outbreak of COVID-19 may also exacerbate other pre-existing political, social, economic, market and financial risks. The effects of the outbreak in developing or emerging market countries may be greater due to less established health care systems. The COVID-19 pandemic and its effects may last for an extended period of time, result in significant market volatility, exchange trading suspensions and closures, declines in global financial markets, higher default rates, and a substantial economic downturn or recession. Furthermore, the ability of the Investment Adviser or its affiliates to operate effectively, including the ability of personnel to function, communicate and travel to the extent necessary to carry out the Fund’s investment strategies and objectives, may be materially impaired. All of the foregoing could impair Fund’s ability to maintain operational standards (such as with respect to satisfying redemption requests), disrupt the operations of the Fund’s service providers, adversely affect the value and liquidity of the Fund’s investments, and negatively impact the Fund’s performance and your investment in the respective Fund.
The Fund is exposed to counterparty risk, or the risk that an institution or other entity with which the Fund has unsettled or open transactions will default. The potential loss to the Fund could exceed the value of the financial assets recorded in the Fund’s financial statements. Financial assets, which potentially expose the Fund to counterparty risk, consist principally of cash due from counterparties and investments. The Investment Adviser seeks to minimize the Fund’s counterparty risk by performing reviews of each counterparty and by minimizing concentration of counterparty risk by undertaking transactions with multiple customers and counterparties on recognized and reputable exchanges. Delivery of securities sold is only made once the Fund has received payment. Payment is made on a purchase once the securities have been delivered by the counterparty. The trade will fail if either party fails to meet its obligation.
3. Investment Adviser
The Fund has an Investment Advisory Agreement (the “Advisory Agreement”) with the Investment Adviser. Subject to the supervision of the Fund’s Board, the Investment Adviser is responsible for managing, either directly or through others selected by it, the Fund’s investment activities, business affairs, and other administrative matters. Pursuant to the Management Agreement, the investment adviser receives an annual fee, payable monthly, at the annual rate of 0.70% of the value of the Fund’s average daily net assets up to $250 million and 0.65% of average daily net assets in excess of $250 million.
4. Investments in Securities
For the six months ended December 31, 2021, purchases and sales of investments, other than short-term securities were $45,413,126 and $48,708,784, respectively.
5. Income Tax Information
At December 31, 2021, the cost basis of portfolio securities for federal income tax purposes was $166,462,627. Gross unrealized appreciation was $80,148,240; gross unrealized depreciation was $9,886,524; and net unrealized appreciation was $70,261,716.
| | | | |
| 16 | | The Korea Fund, Inc. Semi-Annual Report | | | 12.31.21 |
The Korea Fund, Inc. Notes to Financial Statements
December 31, 2021 (unaudited) (continued)
6. Discount Management Program
The Fund has a share repurchase program under which the Fund will repurchase in each twelve month period ended June 30, up to 10% of its common stock outstanding as of the close of business on June 30 the prior year, but will permit shares to be repurchased at differing discount trigger levels that will not be announced. The Fund will repurchase shares at a discount, in accordance with procedures approved by the Board. Subject to these procedures, the timing and amount of any shares repurchased will be determined by the Board and/or its Discount Management Committee in consultation with the Investment Adviser.
For the six months ended December 31, 2021, the Fund did not repurchase any shares of its common stock. For the year ended June 30, 2021, the Fund repurchased 20,973 shares of its common stock on the open market, which represented approximately 0.4% of the shares outstanding at June 30, 2020 at a total cost, inclusive of commissions ($0.015 per share), of $707,632 at a per-share weighted average discount to NAV of 14.19%.
7. Fund Ownership
At December 31, 2021, the City of London Investment Group PLC, Lazard Asset Management LLC, 1607 Capital Partners and the Gates William Henry held approximately 37%, 17%, 11% and 7%, respectively, of the Fund’s outstanding shares. Investment activities of these stockholders could have a material impact to the Fund.
| | | | | | |
12.31.21 | | | The Korea Fund, Inc. Semi-Annual Report | | | 17 | |
The Korea Fund, Inc. Stockholder Meeting Results/ Changes to the
Board of Directors/ Proxy Voting Policies & Procedures (unaudited)
Stockholder Meeting Results
The Fund held a meeting of stockholders on October 20, 2021. Stockholders voted as indicated below:
| | | | | | | | | | |
| | | Affirmative | | Against | | | Abstain | |
Re-election Richard A. Silver who serves as a Class III Director | | 4,171,074 | | | 243,074 | | | | 6,947 | |
Election Madam Yan Hu who serves as a Class III Director | | 4,151,833 | | | 257,297 | | | | 12,379 | |
Mr. Julian Reid, who serves as a Class I Director and Mr. Matthew J. Sippel, who serves as a Class II Director, continue to serve as Directors of the Fund.
Changes to the Board of Directors:
Madam Yan Hu was appointed as a Director of the Fund, effective October 20, 2021.
Proxy Voting Policies & Procedures:
A description of the policies and procedures that the Fund has adopted to determine how to vote proxies relating to portfolio securities and information about how the Fund voted proxies relating to portfolio securities held during the most recent twelve month period ended June 30 is available (i) without charge, upon request, by calling the Fund’s stockholder servicing agent at (866) 706-0510; (ii) on the Fund’s website at www.thekoreafund.com; and (iii) on the Securities and Exchange Commission website at www.sec.gov.
| | | | |
| 18 | | The Korea Fund, Inc. Semi-Annual Report | | | 12.31.21 |
The Korea Fund, Inc. Privacy Policy (unaudited)
| | |
| | |
| FACTS | | WHAT DOES THE KOREA FUND, INC. DO WITH YOUR PERSONAL INFORMATION? |
| Why? | | Financial companies choose how they share your personal information. Federal law gives consumers the right to limit some but not all sharing. Federal law also requires us to tell you how we collect, share, and protect your personal information. Please read this notice carefully to understand what we do. |
| What? | | The types of personal information we collect and share depend on the product or service you have with us. This information can include: ∎ Social Security number and account balances ∎ transaction history and account transactions ∎ checking account information and wire transfer instructions When you are no longer our customer, we continue to share your information as described in this notice. |
| How? | | All financial companies need to share customers’ personal information to run their everyday business. In the section below, we list the reasons financial companies can share their customers’ personal information; the reasons The Korea Fund, Inc. chooses to share; and whether you can limit this sharing. |
| | | | |
| | | |
| Reasons we can share your personal information | | Does The Korea
Fund, Inc. share? | | Can you limit this
sharing? |
For our everyday business purposes — such as to process your transactions, maintain your account(s), respond to court orders and legal investigations, or report to credit bureaus | | YES | | NO |
For marketing purposes — to offer our products and services to you | | YES | | NO |
| For joint marketing with other financial companies | | NO | | WE DON’T SHARE |
For our affiliates’ everyday business purposes — information about your transactions and experiences | | NO | | WE DON’T SHARE |
For our affiliates’ everyday business purposes — information about your creditworthiness | | NO | | WE DON’T SHARE |
| For nonaffiliates to market to you | | NO | | WE DON’T SHARE |
| | |
| | |
| QUESTIONS? | | Call 1-866-706-0510 or go to www.thekoreafund.com |
| | | | | | |
12.31.21 | | | The Korea Fund, Inc. Semi-Annual Report | | | 19 | |
The Korea Fund, Inc. Privacy Policy (unaudited) (continued)
| | |
| |
| Who we are |
| Who is providing this notice? | | The Korea Fund, Inc. |
| | |
| |
| What we do |
| How does The Korea Fund, Inc. protect my personal information? | | To protect your personal information from unauthorized access and use, we use security measures that comply with federal law. These measures include computer safeguards and secured files and buildings. We authorize our employees to access your information only when they need it to do their work and we require companies that work for us to protect your information. |
| How does The Korea Fund, Inc. collect my personal information? | | We collect your personal information, for example, when you: ∎ open an account or provide account information ∎ give us your contact information or pay us by check ∎ make wire transaction We also collect your personal information from others such as credit bureaus, affiliates, or other companies. |
| Why can’t I limit all sharing? | | Federal law gives you the right to limit only ∎ sharing for affiliates’ everyday business purposes — information about your creditworthiness ∎ affiliates from using your information to market to you ∎ sharing for nonaffiliates to market to you State laws and individual companies may give you additional rights to limit sharing. |
| | |
| |
| Definitions |
| Affiliates | | Companies related by common ownership or control. They can be financial and nonfinancial companies. ∎ The Korea Fund, Inc. does not share with affiliates. |
| Nonaffiliates | | Companies not related by common ownership or control. They can be financial and nonfinancial companies. ∎ The Korea Fund, Inc. does not share with nonaffiliates so that they can market to you. |
| Joint marketing | | A formal agreement between nonaffiliated financial companies that together market financial products or services to you. ∎ The Korea Fund, Inc. does not jointly market. |
| | | | |
| 20 | | The Korea Fund, Inc. Semi-Annual Report | | | 12.31.21 |
| | |
| Directors | | Officers |
Julian M.I. Reid
Chairman of the Board of Directors Richard A. Silver Matthew J. Sippel Madam Yan Hu Chief Legal Officer Carmine Lekstutis | | Simon J. Crinage
President and Chief Executive Officer Neil S. Martin
Treasurer, Principal Financial and Accounting Officer Paul F. Winship
Vice President and Secretary Steve M. Ungerman
Chief Compliance Officer |
Investment Adviser
JPMorgan Asset Management (Asia Pacific) Limited
21st Floor, Charter House, 8 Connaught Road Central
Hong Kong
Fund Services Provider
JPMorgan Funds Limited,
60 Victoria Embankment
London EC4Y 0JP
UK
Custodian & Accounting Agent
JPMorgan Chase Bank N.A,
383 Madison Avenue , 11th Floor
New York, NY 10179
USA
Transfer Agent, Dividend Paying Agent and Registrar
American Stock Transfer & Trust Company, LLC
6201 15th Avenue
Brooklyn, NY 11219
USA
Independent Registered Public Accounting Firm
PricewaterhouseCoopers LLP
300 Madison Avenue
New York, NY 10017
USA
Legal Counsel
Ropes & Gray LLP
Prudential Tower
800 Boylston Street
Boston, MA 02199
USA
This report, including the financial information herein, is transmitted to the stockholders of The Korea Fund, Inc. for their information. It is not a prospectus, circular or representation intended for use in the purchase of shares of the Fund or any securities mentioned in this report.
The financial information included herein is taken from the records of the Fund without examination by an independent registered public accounting firm, who did not express an opinion herein.
Notice is hereby given in accordance with Section 23(c) of the Investment Company Act of 1940, as amended, that from time to time the Fund may purchase shares of its common stock in the open market.
The Fund files its complete schedule of portfolio holdings with the Securities and Exchange Commission (“SEC”) for the first and third quarters of its fiscal year on Form N-PORT. The Fund’s Form N-PORT is available on the SEC’s website at www.sec.gov. The information on Form N-PORT is also available on the Fund’s website at www.thekoreafund.com.
Information on the Fund is available at www.thekoreafund.com or by calling the Fund’s stockholder servicing agent at (866) 706-0510.

AZ612SAR-123121
1228050
ITEM 2. CODE OF ETHICS
Not required in this filing.
ITEM 3. AUDIT COMMITTEE FINANCIAL EXPERT
Not required in this filing.
ITEM 4. PRINCIPAL ACCOUNTANT FEES AND SERVICES
Not required in this filing
ITEM 5. AUDIT COMMITTEE OF LISTED REGISTRANTS
Not required in this filing
ITEM 6. SCHEDULE OF INVESTMENTS
(a) The registrant’s Schedule of Investments is included as part of the report to shareholders filed under Item 1 of this form.
(b) Not applicable.
ITEM 7. DISCLOSURE OF PROXY VOTING POLICIES AND PROCEDURES FOR CLOSED-END MANAGEMENT INVESTMENT COMPANIES
Not required in this filing
ITEM 8. PORTFOLIO MANAGERS OF CLOSED-END MANAGEMENT INVESTMENT COMPANIES
Not required in this filing
ITEM 9. PURCHASE OF EQUITY SECURITIES BY CLOSED-END MANAGEMENT INVESTMENT COMPANY AND AFFILIATED COMPANIES
| | | | | | | | | | | | | | | | |
Period | | (a) Total Number
of Shares
Purchased | | | (b) Average
Price
Paid per
Share | | | (c) Total Number of Shares
Purchased as
Part of Publicly Announced
Plans or Programs | | | (d) Maximum Number
of Shares (or Units) that
May Yet Be Purchased
Under the
Plans or Programs | |
July 1 to December 31 2021 | | | 0 | | | | 0 | | | | 0 | | | | 0 | |
| 2 | The Fund has a share repurchase program under which the Fund will repurchase (subject to fees of up to $0.015 per share repurchased) in each twelve month period ended June 30, up to 10% of its common shares outstanding as of the close of business on June 30 the prior year, but will permit shares to be repurchased at differing discount trigger levels that will not be announced. The Fund will repurchase shares at a discount, in accordance with procedures approved by the Board. Subject to these procedures, the timing and amount of any shares repurchased will be determined by the Board and/or its Discount Management Committee in consultation with the Investment Manager. |
No shares were repurchased in the reporting period.
ITEM 10. SUBMISSION OF MATTERS TO A VOTE OF SECURITY HOLDERS
There have been no material changes to the procedures by which shareholders may recommend nominees to the Fund’s Board of Directors since the Fund last provided disclosure in response to this item.
ITEM 11. CONTROLS AND PROCEDURES
(a) The registrant’s President and Chief Executive Officer and Treasurer, Principal Financial & Accounting Officer have concluded that the registrant’s disclosure controls and procedures (as defined in Rule 30a-3(c) under the Investment Company Act of 1940 (the “1940 Act”) (17 CFR 270.30a-3(c))), as amended, are effective based on their evaluation of these controls and procedures as of a date within 90 days of the filing date of this document.
(b) There were no significant change in the registrant’s internal control over financial reporting (as defined in Rule
30a-3(d) under the 1940 Act (17 CFR 270.30a-3(d))) that occurred during the registrant’s second fiscal quarter of the period covered by this report that has materially affected, affected, or is reasonably likely to materially affect, the registrants internal control over financial reporting.
ITEM 12. Disclosure of Securities Lending Activities for Closed-End Management Investment Companies.
(a)
(1) Gross income from securities lending activities: Nil
(2) All fees and/or compensation for securities lending activities and related services: Nil
(3) Aggregate fees/compensation: Nil
(4) Net income from securities lending activities: Nil
The registrant’s Statement of Operations included as part of the report to shareholders filed under Item 1 of this form shows Securities Lending Income of $0. This includes any true up of a prior years accrual. No income was actually received in the reporting period.
(b) The Fund may lend up to 33 1/3% of the Fund’s total assets via Goldman Sachs Bank USA (“GS Bank USA”) as lending agent to certain qualified brokers, except those securities which the Fund or the Investment Manager specifically identifies as not being available. By lending its investment securities, the Fund attempts to increase its net investment income through the receipt of interest on the loan. Any gain or loss in the market price of the securities loaned that might occur and any interest or dividends declared during the term of the loan would accrue to the account of the Fund. Risks of delay in recovery of the securities may occur should the borrower of the securities fail financially. Risks may also arise to the extent that the value of the collateral decreases below the value of the securities loaned. Upon entering into a securities lending transaction, the Fund receives cash or other securities as collateral in an amount equal to or exceeding 100% of the current market value of the loaned securities with respect to securities of the U.S. government or its agencies, 102% of the current market value of the loaned securities with respect to U.S. securities and 105% of the current market value of the loaned securities with respect to foreign securities. Any cash received as collateral is invested in the Blackrock T-Fund, Institutional Class. Non-cash collateral is not disclosed in the Fund’s Statement of Assets and Liabilities as it is held by the custodian or collateral agent on behalf of the Fund and the Fund does not have the ability to re-hypothecate those securities. A portion of the dividends received on the collateral may be rebated to the borrower of the securities and the remainder is split between GS Bank USA, as the securities lending agent, and the Fund.
ITEM 13. EXHIBITS
(a) (1) Not required in this filing
(a) (2) Exhibit 99_CERT. — Certification pursuant to Section 302 of the Sarbanes-Oxley Act of 2002
(a) (3) Not applicable
(a) (4) Not applicable
(b) Exhibit 99.906_CERT. — Certification pursuant to Section 906 of the Sarbanes-Oxley Act of 2002
Signature
Pursuant to the requirements of the Securities Exchange Act of 1934 and the Investment Company Act of 1940, the registrant has duly caused this report to be signed on its behalf by the undersigned, thereunto duly authorized.
| | |
| (Registrant) The Korea Fund, Inc. |
| |
| By: | | /s/ Simon J Crinage |
| Simon J Crinage |
| President and Chief Executive Officer |
Date: March 2, 2022
| | |
| By: | | /s/ Neil S Martin |
| Neil S Martin |
| Treasurer, Principal Financial and Accounting Officer |
Date: March 2, 2022
Pursuant to the requirements of the Securities Exchange Act of 1934 and the Investment Company Act of 1940, this report has been signed below by the following persons on behalf of the registrant and in the capacities and on the dates indicated.
| | |
| By: | | /s/ Simon J Crinage |
| Simon J Crinage |
| President and Chief Executive Officer |
Date: March 2, 2022
| | |
| By: | | /s/ Neil S Martin |
| Neil S Martin |
| Treasurer, Principal Financial and Accounting Officer |
Date: March 2, 2022