UNITED STATES
SECURITIES AND EXCHANGE COMMISSION
Washington, D.C. 20549
FORM N-CSR
CERTIFIED SHAREHOLDER REPORT OF REGISTERED MANAGEMENT INVESTMENT COMPANIES
Investment Company Act file number 811-4061
Smith Barney Managed Governments Fund Inc.
(Exact name of registrant as specified in charter)
125 Broad Street, New York, NY 10004
(Address of principal executive offices) (Zip code)
Robert I. Frenkel, Esq.
Smith Barney Fund Management LLC
300 First Stamford Place
Stamford, CT 06902
(Name and address of agent for service)
Registrant’s telephone number, including area code: (800) 451-2010
Date of fiscal year end: July 31
Date of reporting period: July 31, 2004
| ITEM 1. | REPORT TO STOCKHOLDERS. |
The Annual Report to Stockholders is filed herewith.
SMITH BARNEY
MANAGED GOVERNMENTS
FUND INC.
CLASSIC SERIES | ANNUAL REPORT | JULY 31, 2004

NOT FDIC INSURED • NOT BANK GUARANTEED • MAY LOSE VALUE
ROGER M. LAVAN, CFA
PORTFOLIO MANAGER | DAVID TORCHIA
PORTFOLIO MANAGER |
Classic Series

Classic Series
Annual Report • July 31, 2004
SMITH BARNEY MANAGED GOVERNMENTS FUND INC.
ROGER M. LAVAN, CFA
Roger M. Lavan, CFA, has more than 18 years of securities business experience. Mr. Lavan holds a BS in Management from the State University of New York and an MBA from Fordham University.
DAVID TORCHIA
David Torchia has more than 19 years of securities business experience. Mr. Torchia holds a BS from the University of Pittsburgh and an MBA in Finance from Lehigh University.
FUND OBJECTIVE
Seeks high current income consistent with liquidity and preservation of capital by investing at least 80% of its assets in debt obligations issued by the U.S. government, its agencies or instrumentalities.
FUND FACTS
FUND INCEPTION
September 4, 1984
MANAGER INVESTMENT
INDUSTRY EXPERIENCE
18 years (Roger M. Lavan, CFA)
19 years (David Torchia)
What’s Inside
LETTER FROM THE CHAIRMAN

R. JAY GERKEN, CFA
Chairman, President and Chief Executive Officer
Dear Shareholder,
Bonds generated favorable returns over the first half of the period, although their prices declined significantly in April before stabilizing in the past few months. The pullback in bond prices, which tend to move opposite anticipated interest rate movements, was triggered by heightened concern about resurgent inflation, rising rates and anticipation that the Federal Reserve Bank (“Fed”) would begin to push key short-term rates higher. Rising interest rates can act as a brake on robust economic growth, helping to maintain a balance between steady growth and the inflation that can generally accompany it.
Given that the economy appeared to be humming along at a healthy pace, as was widely expected, the Fed edged up its federal funds ratei target from a four-decade low of 1% to 1.25% at the end of June. The Fed raised it by an additional quarter-of-a-percentage point on August 10th, after the end of the fund’s reporting period. As the period came to a close, reports suggested that the pace of job growth, inflation and the pace of gross domestic product (“GDP”)ii growth had slowed.
Please read on for a more detailed look at prevailing economic and market conditions during the fund’s fiscal year and to learn how those conditions and changes made to the portfolio during this time may have affected fund performance.
Information About Your Fund
In recent months several issues in the mutual fund industry have come under the scrutiny of federal and state regulators. The fund’s Adviser and some of its affiliates have received requests for information from various government regulators regarding market timing, late trading, fees, and other mutual fund issues in connection with various investigations. The regulators appear to be examining, among other things, the fund’s response to market timing and shareholder exchange activity, including compliance with prospectus disclosure related to these subjects. The fund has been informed that the Adviser and its affiliates are responding to those information requests, but are not in a position to predict the outcome of these requests and investigations.
In November 2003, Citigroup Asset Management (“Citigroup”) disclosed an investigation by the Securities and Exchange Commission (“SEC”) and the U.S. Attorney relating to Citigroup Asset Management’s entry into the transfer agency business during 1997-1999. On July 20, 2004, Citigroup disclosed that it had been notified by the Staff of the SEC that the Staff is considering recommending a civil injunctive action and/or an administrative proceeding against certain advisory and transfer agent entities affiliated with Citigroup relating to the creation and operation of its internal transfer agent unit to primarily serve the Smith Barney family of mutual funds. Citigroup is cooperating with the SEC and will seek to resolve this matter in discussion with the SEC Staff. Although there can be no assurance, Citigroup does not believe that this matter will have a material adverse effect on the fund.
As always, thank you for your confidence in our stewardship of your assets. We look forward to helping you continue to meet your financial goals.
Sincerely,

R. Jay Gerken, CFA
Chairman, President and Chief Executive Officer
August 20, 2004
1 Smith Barney Managed Governments Fund Inc. | 2004 Annual Report
MANAGER OVERVIEW
Special Shareholder Notice
On February 2, 2004, initial sales charges on Class L shares were eliminated. Effective April 29, 2004, Class L shares were renamed Class C shares.
On August 16, 2004, shareholders of the fund met to consider the change in the fund’s investment objective from “high current income consistent with liquidity and safety of capital” to “maximum total return consisting of capital appreciation and income, consistent with the preservation of capital.” While a majority of the fund’s shareholders present at the meeting voted in favor of the proposal, the proposal was not approved by the holders of a “majority of the outstanding voting securities” of the fund, as defined in the Investment Company Act of 1940 (the “1940 Act”), which was the vote required for approval of the proposal.
Since shareholders did not approve the proposal, the fund’s manager will continue to manage the fund according to its current investment objective and policies.
Market Overview
While the markets for U.S. government securities collectively generated positive total returns over the 12 months ended July 31, 2004, they fluctuated during the period due to changing tides of sentiment. Investors spent much of the period dissecting language from the Fed for clues on its assessment of the U.S. economy. Last summer, the Fed, concerned about deflation and looking to lift the economy, set their federal funds rate target at 1%; its lowest level in more than 40 years. This move initially caused short-term rates to fall, but signs of stronger economic growth soon started to boost yields dramatically. Volatility ensued in September when the Fed made it clear that they had little or no intention of raising rates for a “considerable period” due to soft growth and inflation levels that appeared to be fully in check. This caused five-year yields to fall nearly 65 basis points.iii
The next six months were relatively stable as the economy showed signs of a turnaround with a very strong third quarter GDP of 8.2%. Nevertheless, despite the strength of the economy, the Fed held fast to its 1% short-term lending rate, attributing the economic growth more to increases in productivity than to jobs.
Signs of inflation and strong non-farm payroll numbers began to appear in March and April of 2004. Strong job numbers combined with inflation fighting language from the Fed, led to a rise in Treasury yields, with ten-year yields rising over 100 basis points from their early March lows.
PERFORMANCE SNAPSHOT
AS OF JULY 31, 2004
(excluding sales charges)
| | | | | | |
| | | 6 Months | | | 12 Months | |
| | | | | | | |
Class A Shares — Managed Governments Fund | | 0.41 | % | | 3.77 | % |
| | | | | | | |
Lehman Brothers Government Bond Index | | -0.03 | % | | 3.86 | % |
| | | | | | | |
Lipper U.S. Mortgage Funds Category Average | | 0.62 | % | | 4.19 | % |
The performance shown represents past performance. Past performance is no guarantee of future results and current performance may be higher or lower than the performance shown above. Principal value and investment returns will fluctuate and investors’ shares, when redeemed may be worth more or less than their original cost. To obtain performance data current to the most recent month-end, please visit our website at www.smithbarneymutualfunds.com.
Class A share returns assume the reinvestment of income dividends and capital gains distributions at net asset value and the deduction of all fund expenses. Returns have not been adjusted to include sales charges that may apply when shares are purchased or the deduction of taxes that a shareholder would pay on fund distributions. Excluding sales charges, Class B shares returned 0.06%, Class C shares returned 0.08% and Class Y shares returned 0.50% over the six months ended July 31, 2004. Excluding sales charges, Class B shares returned 3.13%, Class C shares returned 3.17% and Class Y shares returned 4.03% over the 12 months ended July 31, 2004.
Lipper, Inc. is a major independent mutual-fund tracking organization. Returns are based on the period ended July 31, 2004, calculated among the 83 funds for the six-month period and among the 78 funds for the 12-month period, in the fund’s Lipper category, including the reinvestment of dividends and capital gains, if any, and excluding sales charges.
2 Smith Barney Managed Governments Fund Inc. | 2004 Annual Report
In June, the Fed finally raised its federal funds rate target to 1.25%. Yields on most fixed-income instruments, particularly those on shorter-maturity issues, began moving up earlier this year and continued their ascent as it became more evident that the improving economy and higher inflation would compel the Fed to act in June. Against this backdrop, the fixed income markets finished on a somewhat more stable note in June and July. The Fed raised its federal funds rate target to 1.50% on August 10th, after the end of the fund’s reporting period.
Performance Review
For the 12 months ended July 31, 2004, Class A shares of the Smith Barney Managed Governments Fund Inc., excluding sales charges, returned 3.77%. These shares slightly underperformed the fund’s unmanaged benchmark, the Lehman Brothers Government Bond Index (“Lehman Index”),iv which returned 3.86% for the same period. The fund’s Lipper U.S. mortgage funds category average returned 4.19%.1
Factors Influencing Fund Performance
During the period, we continued to invest fund assets primarily in mortgage-backed securities with a strategic allocation to U.S. Treasury securities. As opportunities arose, we actively allocated to agencies and collateralized mortgage obligations. Specifically, we benefited from our strategic allocation to mortgage-backed securities and from the defensive positioning of the portfolio. For most of the period, overall duration was kept shorter than that of the Lehman Index. (Duration is a measure of a portfolio’s price sensitivity to interest rate movements. A shorter duration helps cushion price declines in the event of rising rates.) Given the recent rise in rates, we recently shifted to a more neutral duration stance relative to the benchmark index. We plan to maintain our current allocation to mortgage-backed securities in an effort to provide diversification and achieve greater total return.
Thank you for your investment in the Smith Barney Managed Governments Fund Inc. We appreciate that you have entrusted us to manage your money and value our relationship with you.
Sincerely,
| | |

Roger M. Lavan, CFA Vice President and Investment Officer | | 
David Torchia Vice President and Investment Officer |
August 20, 2004
The information provided is not intended to be a forecast of future events, a guarantee of future results or investment advice. Views expressed may differ from those of the firm as a whole.
RISKS: As interest rates rise, bond prices fall, reducing the value of the fund’s share price. Keep in mind, bond and mortgage-related securities are subject to interest rate and market risks. The U.S. Government guarantee of principal and interest payments only applies to underlying securities in the fund’s portfolio, not the fund’s shares. Please note that the fund’s shares are not guaranteed by the U.S. Government or its agencies. The fund may use derivatives, such as options and futures, which can be illiquid, may disproportionately increase losses, and have a potentially large impact on fund performance.
All index performance reflects no deduction for fees, expenses or taxes. Please note an investor cannot invest directly in an index.
| 1 | | Lipper, Inc. is a major independent mutual-fund tracking organization. Average annual returns are based on the 12-month period ended July 31, 2004, calculated among the 78 funds in the fund’s Lipper category, including the reinvestment of dividends and capital gains, if any, and excluding sales charges. |
| i | | The federal funds rate is the interest rate that banks with excess reserves at a Federal Reserve district bank charge other banks that need overnight loans. |
| ii | | Gross domestic product is a market value of goods and services produced by labor and property in a given country. |
| iii | | A basis point is one one-hundredth (1/100 or 0.01) of one percent. |
| iv | | The Lehman Brothers Government Bond Index is a broad-based index of all public debt obligations of the U.S. government and its agencies that have an average maturity of roughly nine years. |
3 Smith Barney Managed Governments Fund Inc. | 2004 Annual Report
Average Annual Total Returns†
| | | | | | | | | | | | |
| | | Without Sales Charges(1)
| |
| | | Class A | | | Class B | | | Class C(2) | | | Class Y | |
Twelve Months Ended 7/31/04 | | 3.77% | | | 3.13 | % | | 3.17 | % | | 4.03 | % |
Five Years Ended 7/31/04 | | 5.60 | | | 5.04 | | | 5.12 | | | 5.94 | |
Ten Years Ended 7/31/04 | | 5.70 | | | 5.14 | | | 5.21 | | | N/A | |
Inception* through 7/31/04 | | 7.55 | | | 5.17 | | | 4.76 | | | 5.56 | |
| | | With Sales Charges(3)
| |
| | | Class A | | | Class B | | | Class C(2) | | | Class Y | |
Twelve Months Ended 7/31/04 | | (0.91 | )% | | (1.37 | )% | | 2.17 | % | | 4.03 | % |
Five Years Ended 7/31/04 | | 4.63 | | | 4.87 | | | 5.12 | | | 5.94 | |
Ten Years Ended 7/31/04 | | 5.22 | | | 5.14 | | | 5.21 | | | N/A | |
Inception* through 7/31/04 | | 7.31 | | | 5.17 | | | 4.76 | | | 5.56 | |
| | |
Cumulative Total Returns†
| | | |
| | | Without Sales Charges(1) | |
Class A (7/31/94 through 7/31/04) | | 74.13 | % |
Class B (7/31/94 through 7/31/04) | | 65.10 | |
Class C (7/31/94 through 7/31/04) | | 66.13 | |
Class Y (Inception* through 7/31/04) | | 58.26 | |
| (1) | | Assumes reinvestment of all dividends and capital gain distributions, if any, at net asset value and does not reflect the deduction of the applicable sales charges with respect to Class A shares or the applicable contingent deferred sales charges (“CDSC”) with respect to Class B and C shares. |
| (2) | | On April 29, 2004, Class L shares were renamed as Class C shares. |
| (3) | | Assumes reinvestment of all dividends and capital gain distributions, if any, at net asset value. In addition, Class A shares reflect the deduction of the maximum initial sales charge of 4.50%; Class B shares reflect the deduction of a 4.50% CDSC, which applies if shares are redeemed within one year from purchase payment. This CDSC declines by 0.50% the first year after purchase payment and thereafter by 1.00% per year until no CDSC is incurred. Class C shares reflect the deduction of a 1.00% CDSC, which applies if shares are redeemed within one year from purchase payment. |
| † | | All figures represent past performance and are not a guarantee of future results. Investment return and principal value of an investment will fluctuate so that an investor’s shares, when redeemed, may be worth more or less than their original cost. The returns shown do not reflect the deduction of taxes that a shareholder would pay on fund distributions or the redemption of fund shares. |
| * | | Inception dates for Class A, B, C and Y shares are September 4, 1984, November 6, 1992, June 29, 1993 and February 7, 1996, respectively. |
4 Smith Barney Managed Governments Fund Inc. | 2004 Annual Report
Historical Performance
Value of $10,000 Invested in Class A Shares of the Smith Barney Managed Governments Fund Inc. vs. Lehman Brothers Government Bond Index and Lipper U.S. Mortgage Funds Average†
July 1994 — July 2004
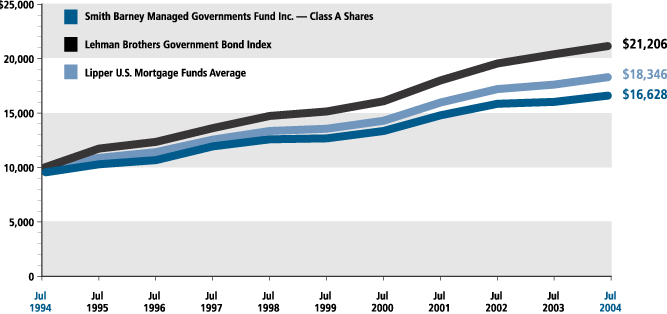
| † | Hypothetical illustration of $10,000 invested in Class A shares on July 31, 1994, assuming deduction of the maximum 4.50% initial sales charge at the time of investment and reinvestment of dividends and capital gains, if any, at net asset value through July 31, 2004. The Lehman Brothers Government Bond Index is a broad-based index of all public debt obligations of the U.S. government and its agencies and has an average maturity of approximately nine years. The Index is unmanaged and is not subject to the same management and trading expenses as a mutual fund. The Lipper U.S. Mortgage Funds Average is composed of the Fund’s peer group of mutual funds (78 funds as of July 31, 2004) investing in U.S. mortgage-backed securities. Lipper Inc. is a widely-recognized mutual fund information service. The performance of the Fund’s other classes may be greater or less than the Class A shares’ performance indicated on this chart, depending on whether greater or lesser sales charges and fees were incurred by shareholders investing in other classes. |
All figures represent past performance and are not a guarantee of future results. Investment return and principal value of an investment will fluctuate so that an investor’s shares, when redeemed, may be worth more or less than their original cost. The returns shown do not reflect the deduction of taxes that a shareholder would pay on fund distributions or the redemption of fund shares.
5 Smith Barney Managed Governments Fund Inc. | 2004 Annual Report
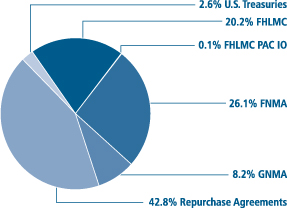
Smith Barney Managed Governments Fund Inc. at a Glance
Investment Breakdown†
January 31, 2004
July 31, 2004
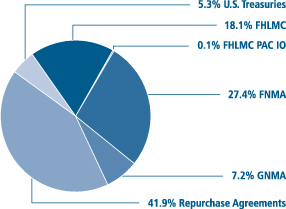
| † | | As a percentage of total investments. Please note that Portfolio holdings are subject to change. |
6 Smith Barney Managed Governments Fund Inc. | 2004 Annual Report
Fund Expenses (unaudited)
Example
As a shareholder of the Fund, you may incur two types of costs: (1) transaction costs, including front-end and back-end sales charges (loads) on purchase payments, reinvested dividends, or other distributions; and (2) ongoing costs, including management fees; distribution and/or service (12b-1) fees; and other Fund expenses. This Example is intended to help you understand your ongoing costs (in dollars) of investing in the Fund and to compare these costs with the ongoing costs of investing in other mutual funds.
This Example is based on an investment of $1,000 invested on February 1, 2004 and held for the six months ended July 31, 2004.
Actual Expenses
The table below titled “Based on Actual Total Return” provides information about actual account values and actual expenses. You may use the information provided in this table, together with the amount you invested, to estimate the expenses that you paid over the period. To estimate the expenses you paid on your account, divide your ending account value by $1,000 (for example, an $8,600 ending account value divided by $1,000 = 8.6), then multiply the result by the number under the heading entitled “Expenses Paid During the Period”.
| | | | | | | | | | | | |
| Based on Actual Total Return(1) | | | | | | | |
| | | | | | | | | | | | | |
| | | Actual
Total Return
Without
Sales Charges(2) | | | Beginning
Account
Value | | Ending
Account
Value | | Expenses
Paid During
the Period(3) |
Class A | | 0.41 | % | | $ | 1,000.00 | | $ | 1,004.10 | | $ | 5.23 |
| |
|
|
Class B | | 0.06 | | | | 1,000.00 | | | 1,000.60 | | | 7.91 |
| |
|
|
Class C(4) | | 0.08 | | | | 1,000.00 | | | 1,000.80 | | | 7.56 |
| |
|
|
Class Y | | 0.50 | | | | 1,000.00 | | | 1,005.00 | | | 3.54 |
| |
|
| |
|
| |
|
| |
|
|
| (1) | | For the six months ended July 31, 2004. |
| (2) | | Assumes reinvestment of all dividends and capital gain distributions, if any, at net asset value and does not reflect the deduction of the applicable sales charges with respect to Class A shares or the applicable CDSC with respect to Class B and C shares. Total return is not annualized, as it may not be representative of the total return for the year. |
| (3) | | Expenses are equal to the annualized expense ratio of 1.05%, 1.59%, 1.52% and 0.71% for the Fund’s Class A, B, C and Y shares, respectively, multiplied by the average account value over the period, multiplied by 182/366 (to reflect the one-half year period). |
| (4) | | On April 29, 2004, Class L shares were renamed as Class C shares. |
7 Smith Barney Managed Governments Fund Inc. | 2004 Annual Report
Fund Expenses (unaudited) (continued)
Hypothetical Example for Comparison Purposes
The table below titled “Based on Hypothetical Total Return” provides information about hypothetical account values and hypothetical expenses based on the actual expense ratio and an assumed rate of return of 5.00% per year before expenses, which is not the Fund’s actual return. The hypothetical account values and expenses may not be used to estimate the actual ending account balance or expenses you paid for the period. You may use the information provided in this table to compare the ongoing costs of investing in the Fund and other funds. To do so, compare the 5.00% hypothetical example relating to the Fund with the 5.00% hypothetical examples that appear in the shareholder reports of the other funds.
Please note that the expenses shown in the table below are meant to highlight your ongoing costs only and do not reflect any transactional costs, such as front-end or back-end sales charges (loads). Therefore, the table is useful in comparing ongoing costs only, and will not help you determine the relative total costs of owning different funds. In addition, if these transaction costs were included, your costs would have been higher.
| | | | | | | | | | | | |
| Based on Hypothetical Total Return(1) | | | | | | | |
| | | | | | | | | | | | | |
| | | Hypothetical
Annualized
Total Return | | | Beginning
Account
Value | | Ending
Account
Value | | Expenses
Paid During
the Period(2) |
Class A | | 5.00 | % | | $ | 1,000.00 | | $ | 1,019.64 | | $ | 5.27 |
| |
|
|
Class B | | 5.00 | | | | 1,000.00 | | | 1,016.96 | | | 7.97 |
| |
|
|
Class C(3) | | 5.00 | | | | 1,000.00 | | | 1,017.30 | | | 7.62 |
| |
|
|
Class Y | | 5.00 | | | | 1,000.00 | | | 1,021.33 | | | 3.57 |
| |
|
| |
|
| |
|
| |
|
|
| (1) | | For the six months ended July 31, 2004. |
| (2) | | Expenses are equal to the annualized expense ratio of 1.05%, 1.59%, 1.52% and 0.71% for the Fund’s Class A, B, C and Y shares, respectively, multiplied by the average account value over the period, multiplied by 182/366 (to reflect the one-half year period). |
| (3) | | On April 29, 2004, Class L shares were renamed as Class C shares. |
8 Smith Barney Managed Governments Fund Inc. | 2004 Annual Report
| | |
Schedule of Investments | | July 31, 2004 |
| | | | | | |
FACE
AMOUNT | | SECURITY | | VALUE |
| | U.S. GOVERNMENT AND AGENCY OBLIGATIONS — 58.0% | | | |
| | | | U.S. Treasury Notes: | | | |
| $ | 20,000,000 | | 1.125% due 6/30/05 | | $ | 19,846,880 |
| | 20,000,000 | | 4.000% due 2/15/14 (a) | | | 19,277,360 |
| | | | Federal Home Loan Mortgage Corp. (FHLMC), Gold: | | | |
| | 544 | | 5.500% due 5/1/13 | | | 561 |
| | 1,710,741 | | 7.000% due 2/1/16 (b) | | | 1,814,042 |
| | 5,540,318 | | 6.000% due 3/1/17 (c) | | | 5,794,171 |
| | 3,534,360 | | 6.500% due 6/1/19 (b) | | | 3,738,180 |
| | 720,336 | | 6.500% due 1/1/32 (b) | | | 753,937 |
| | 4,195,239 | | 5.000% due 9/1/33 (b) | | | 4,100,987 |
| | 5,900,000 | | 5.000% due 8/12/34 (d)(e) | | | 5,748,813 |
| | 40,000,000 | | 5.500% due 8/12/34 (d)(e) | | | 40,137,520 |
| | 20,000,000 | | 6.000% due 8/12/34 (d)(e) | | | 20,512,500 |
| | 49,000,000 | | 6.500% due 8/12/34 (d)(e) | | | 51,220,288 |
| | | | Federal National Mortgage Association (FNMA): | | | |
| | 30,407 | | 7.500% due 4/1/09 | | | 31,452 |
| | 29,757 | | 6.500% due 6/1/15 (b) | | | 31,497 |
| | 2,056,493 | | 5.500% due 12/1/16 (b) | | | 2,118,108 |
| | 1,649,758 | | 6.000% due 5/1/17 (c) | | | 1,724,281 |
| | 5,088,379 | | 7.500% due 3/1/32 (b) | | | 5,449,492 |
| | 15,088,619 | | 6.000% due 6/1/32 (c) | | | 15,501,318 |
| | 10,444,396 | | 6.500% due 3/1/33 (b) | | | 10,916,291 |
| | 10,761,957 | | 7.000% due 1/1/34 (b)(c) | | | 11,421,793 |
| | 24,013,765 | | 5.000% due 3/1/34 (c) | | | 23,491,836 |
| | 9,000,000 | | 4.500% due 8/12/34 (d)(e) | | | 8,499,375 |
| | 72,500,000 | | 5.500% due 8/12/34 (d)(e) | | | 72,703,870 |
| | 25,000,000 | | 6.000% due 8/12/34 (d)(e) | | | 25,648,450 |
| | 3,000,000 | | 6.500% due 8/12/34 (d)(e) | | | 3,131,250 |
| | 21,000,000 | | 7.000% due 8/12/34 (d)(e) | | | 22,187,802 |
| | | | Government National Mortgage Association (GNMA): | | | |
| | 24,587 | | 8.500% due 11/15/27 | | | 26,962 |
| | 11,119,091 | | 6.500% due 3/15/32 (b) | | | 11,652,210 |
| | 7,716,317 | | 7.000% due 3/15/32 (b) | | | 8,204,522 |
| | 2,052,689 | | 7.500% due 5/15/32 (b) | | | 2,210,006 |
| | 20,000,000 | | 5.000% due 8/19/34 (d)(e) | | | 19,587,500 |
| | 12,000,000 | | 5.500% due 8/19/34 (d)(e) | | | 12,071,256 |
| | | | TOTAL U.S. GOVERNMENT AND AGENCY OBLIGATIONS
(Cost — $425,450,047) | | | 429,554,510 |
| | PAC IOs — 0.1% | | | |
| | 6,921,000 | | Federal Home Loan Mortgage Corp., yield to maturity 12.765% due 9/15/22 (Cost — $612,543) | | | 684,237 |
| | | | SUB-TOTAL INVESTMENTS
(Cost — $426,062,590) | | | 430,238,747 |
See Notes to Financial Statements.
9 Smith Barney Managed Governments Fund Inc. | 2004 Annual Report
| | |
Schedule of Investments (continued) | | July 31, 2004 |
| | | | | | |
FACE
AMOUNT | | SECURITY | | VALUE |
| | REPURCHASE AGREEMENTS — 41.9% | | | |
| $ | 75,000,000 | | Deutsche Bank Securities Inc. dated 7/30/04, 1.340% due 8/2/04; Proceeds at maturity — $75,008,375; (Fully collateralized by various U.S. Government Agency Obligations, 0.000% to 7.125% due 8/3/04
to 3/15/31; Market value — $76,500,100) (c) | | $ | 75,000,000 |
| | 75,000,000 | | The Goldman Sachs Group, Inc. dated 7/30/04, 1.360% due 8/2/04; Proceeds at maturity — $75,008,500; (Fully collateralized by U.S. Treasury Notes, Bills and Bonds, 0.000% to 8.750% due 9/2/04 to 1/15/26; Market value — $76,500,096) (c) | | | 75,000,000 |
| | 75,000,000 | | Morgan Stanley dated 7/30/04, 1.350% due 8/2/04; Proceeds at maturity — $75,008,438; (Fully collateralized by various U.S. Government Agency Obligations, 0.000% to 8.440% due 9/15/04 to 8/6/38; Market value — $77,243,991) (c) | | | 75,000,000 |
| | 84,906,000 | | UBS Financial Services, dated 7/30/04, 1.350% due 8/2/04; Proceeds at maturity — $84,915,552; (Fully collateralized by various U.S. Government Agency Obligations, 0.000% to 8.875% due 8/3/04 to 5/15/30; Market value — $86,604,598) (c) | | | 84,906,000 |
| | | | TOTAL REPURCHASE AGREEMENTS
(Cost — $309,906,000) | | | 309,906,000 |
| | | | TOTAL INVESTMENTS — 100.0%
(Cost — $735,968,590*) | | $ | 740,144,747 |
| (a) | | All or a portion of this security is held as collateral for open futures contracts (See Note 5). |
| (b) | | Date shown represents the last in range of maturity dates of mortgage certificates owned. |
| (c) | | All or a portion of this security is segregated for open futures contracts and/or “to-be-announced” (“TBA”) securities. |
| (d) | | Security acquired under mortgage dollar roll agreement (See Note 7). |
| (e) | | Security is traded on a TBA basis (See Note 6). |
| * | | Aggregate cost for Federal income tax purposes is $736,227,555. |
Abbreviation used in this schedule:
PAC IO — Planned Amortization Class — Interest Only
See Notes to Financial Statements.
10 Smith Barney Managed Governments Fund Inc. | 2004 Annual Report
| | |
Statement of Assets and Liabilities | | July 31, 2004 |
| | | | |
| ASSETS: | | | | |
Investments, at value (Cost — $426,062,590) | | $ | 430,238,747 | |
Repurchase agreements, at value (Cost — $309,906,000) | | | 309,906,000 | |
Cash | | | 832 | |
Receivable for securities sold | | | 41,964,550 | |
Interest receivable | | | 1,434,600 | |
Receivable for Fund shares sold | | | 55,617 | |
|
|
Total Assets | | | 783,600,346 | |
|
|
| LIABILITIES: | | | | |
Payable for securities purchased | | | 351,036,485 | |
Dividends payable | | | 842,153 | |
Deferred mortgage dollar roll income | | | 375,646 | |
Payable to broker — variation margin | | | 284,438 | |
Investment advisory fee payable | | | 165,021 | |
Payable for Fund shares reacquired | | | 134,100 | |
Administration fee payable | | | 73,270 | |
Distribution plan fees payable | | | 35,080 | |
Accrued expenses | | | 99,922 | |
|
|
Total Liabilities | | | 353,046,115 | |
|
|
Total Net Assets | | $ | 430,554,231 | |
|
|
| NET ASSETS: | | | | |
Par value of capital shares | | $ | 34,264 | |
Capital paid in excess of par value | | | 444,268,708 | |
Undistributed net investment income | | | 2,001,532 | |
Accumulated net realized loss from investment transactions and futures contracts | | | (19,428,072 | ) |
Net unrealized appreciation of investments and futures contracts | | | 3,677,799 | |
|
|
Total Net Assets | | $ | 430,554,231 | |
|
|
Shares Outstanding: | | | | |
Class A | | | 17,185,329 | |
| |
Class B | | | 1,919,989 | |
| |
Class C | | | 893,591 | |
| |
Class Y | | | 14,265,346 | |
| |
Net Asset Value: | | | | |
Class A (and redemption price) | | | $12.57 | |
| |
Class B * | | | $12.57 | |
| |
Class C * | | | $12.57 | |
| |
Class Y (and redemption price) | | | $12.56 | |
| |
Maximum Public Offering Price Per Share: | | | | |
Class A (net asset value plus 4.71% of net asset value per share) | | | $13.16 | |
|
|
| * | | Redemption price is NAV of Class B and C shares reduced by a 4.50% and 1.00% CDSC, respectively, if shares are redeemed within one year from purchase payment (See Note 2). |
See Notes to Financial Statements.
11 Smith Barney Managed Governments Fund Inc. | 2004 Annual Report
| | |
Statement of Operations | | For the Year Ended July 31, 2004 |
| | | | |
| INVESTMENT INCOME: | | | | |
Interest | | $ | 19,464,140 | |
|
|
| EXPENSES: | | | | |
Investment advisory fee (Note 2) | | | 1,994,850 | |
Distribution plan fees (Note 8) | | | 908,284 | |
Administration fee (Note 2) | | | 886,600 | |
Transfer agency services (Note 8) | | | 229,441 | |
Audit and legal | | | 86,198 | |
Custody | | | 54,656 | |
Registration fees | | | 45,297 | |
Directors’ fees | | | 43,999 | |
Shareholder communications (Note 8) | | | 29,158 | |
Other | | | 10,366 | |
|
|
Total Expenses | | | 4,288,849 | |
|
|
Net Investment Income | | | 15,175,291 | |
|
|
REALIZED AND UNREALIZED GAIN (LOSS) ON INVESTMENTS
AND FUTURES CONTRACTS (NOTES 3 AND 5): | | | | |
Realized Loss From: | | | | |
Investment Transactions | | | (990,156 | ) |
Futures Contracts | | | (1,046,054 | ) |
|
|
Net Realized Loss | | | (2,036,210 | ) |
|
|
Increase in Net Unrealized Appreciation of Investments | | | 3,346,976 | |
|
|
Net Gain on Investments and Futures Contracts | | | 1,310,766 | |
|
|
Increase in Net Assets From Operations | | $ | 16,486,057 | |
|
|
See Notes to Financial Statements.
12 Smith Barney Managed Governments Fund Inc. | 2004 Annual Report
| | |
Statements of Changes in Net Assets | | For the Years Ended July 31, |
| | | | | | | | |
| | | 2004 | | | 2003 | |
| OPERATIONS: | | | | | | | | |
Net investment income | | $ | 15,175,291 | | | $ | 13,480,017 | |
Net realized gain (loss) | | | (2,036,210 | ) | | | 367,269 | |
Increase (decrease) in net unrealized appreciation | | | 3,346,976 | | | | (8,156,361 | ) |
|
|
Increase in Net Assets From Operations | | | 16,486,057 | | | | 5,690,925 | |
|
|
| DISTRIBUTIONS TO SHAREHOLDERS FROM (NOTE 9): | | | | | | | | |
Net investment income | | | (14,193,574 | ) | | | (16,679,006 | ) |
Capital | | | — | | | | (2,432,286 | ) |
|
|
Decrease in Net Assets From Distributions to Shareholders | | | (14,193,574 | ) | | | (19,111,292 | ) |
|
|
| FUND SHARE TRANSACTIONS (NOTE 10): | | | | | | | | |
Net proceeds from sale of shares | | | 50,530,307 | | | | 89,057,904 | |
Net asset value of shares issued for reinvestment of distributions | | | 5,741,360 | | | | 9,029,310 | |
Cost of shares reacquired | | | (81,089,479 | ) | | | (94,368,143 | ) |
|
|
Increase (Decrease) in Net Assets From Fund Share Transactions | | | (24,817,812 | ) | | | 3,719,071 | |
|
|
Decrease in Net Assets | | | (22,525,329 | ) | | | (9,701,296 | ) |
| | |
| NET ASSETS: | | | | | | | | |
Beginning of year | | | 453,079,560 | | | | 462,780,856 | |
|
|
End of year* | | $ | 430,554,231 | | | $ | 453,079,560 | |
|
|
* Includes undistributed (overdistributed) net investment income of: | | | $2,001,532 | | | | $(10,458 | ) |
|
|
See Notes to Financial Statements.
13 Smith Barney Managed Governments Fund Inc. | 2004 Annual Report
Financial Highlights
For a share of each class of capital stock outstanding throughout each year ended July 31, unless otherwise noted:
| | | | | | | | | | | | | | | |
| Class A Shares | | 2004(1) | | | 2003(1) | | | 2002(1) | | | 2001(1) | | | 2000(1) | |
Net Asset Value, Beginning of Year | | $12.50 | | | $12.87 | | | $12.56 | | | $12.03 | | | $12.09 | |
Income (Loss) From Operations: | | | | | | | | | | | | | | | |
Net investment income | | 0.42 | | | 0.37 | | | 0.59 | | | 0.69 | | | 0.73 | |
Net realized and unrealized gain (loss) | | 0.05 | | | (0.22 | ) | | 0.29 | | | 0.56 | | | (0.09 | ) |
Total Income From Operations | | 0.47 | | | 0.15 | | | 0.88 | | | 1.25 | | | 0.64 | |
Less Distributions From: | | | | | | | | | | | | | | | |
Net investment income | | (0.40 | ) | | (0.45 | ) | | (0.57 | ) | | (0.70 | ) | | (0.70 | ) |
Capital | | — | | | (0.07 | ) | | — | | | (0.02 | ) | | — | |
Total Distributions | | (0.40 | ) | | (0.52 | ) | | (0.57 | ) | | (0.72 | ) | | (0.70 | ) |
Net Asset Value, End of Year | | $12.57 | | | $12.50 | | | $12.87 | | | $12.56 | | | $12.03 | |
Total Return | | 3.77 | % | | 1.15 | % | | 7.17 | % | | 10.68 | % | | 5.49 | % |
Net Assets, End of Year (000s) | | $215,950 | | | $252,312 | | | $277,136 | | | $270,884 | | | $270,599 | |
Ratios to Average Net Assets: | | | | | | | | | | | | | | | |
Expenses | | 1.04 | % | | 1.02 | % | | 1.05 | % | | 1.04 | % | | 1.05 | % |
Net investment income | | 3.34 | | | 2.87 | | | 4.67 | | | 5.58 | | | 6.05 | |
Portfolio Turnover Rate | | 40 | %* | | 457 | % | | 335 | % | | 275 | % | | 173 | % |
| | | | | |
| Class B Shares | | 2004(1) | | | 2003(1) | | | 2002(1) | | | 2001(1) | | | 2000(1) | |
Net Asset Value, Beginning of Year | | $12.51 | | | $12.88 | | | $12.57 | | | $12.03 | | | $12.09 | |
Income (Loss) From Operations: | | | | | | | | | | | | | | | |
Net investment income | | 0.35 | | | 0.30 | | | 0.52 | | | 0.62 | | | 0.66 | |
Net realized and unrealized gain (loss) | | 0.04 | | | (0.21 | ) | | 0.29 | | | 0.57 | | | (0.08 | ) |
Total Income From Operations | | 0.39 | | | 0.09 | | | 0.81 | | | 1.19 | | | 0.58 | |
Less Distributions From: | | | | | | | | | | | | | | | |
Net investment income | | (0.33 | ) | | (0.39 | ) | | (0.50 | ) | | (0.63 | ) | | (0.64 | ) |
Capital | | — | | | (0.07 | ) | | — | | | (0.02 | ) | | — | |
Total Distributions | | (0.33 | ) | | (0.46 | ) | | (0.50 | ) | | (0.65 | ) | | (0.64 | ) |
Net Asset Value, End of Year | | $12.57 | | | $12.51 | | | $12.88 | | | $12.57 | | | $12.03 | |
Total Return | | 3.13 | % | | 0.62 | % | | 6.60 | % | | 10.17 | % | | 4.91 | % |
Net Assets, End of Year (000s) | | $24,140 | | | $36,266 | | | $38,431 | | | $30,310 | | | $39,499 | |
Ratios to Average Net Assets: | | | | | | | | | | | | | | | |
Expenses | | 1.57 | % | | 1.53 | % | | 1.56 | % | | 1.54 | % | | 1.58 | % |
Net investment income | | 2.78 | | | 2.35 | | | 4.13 | | | 5.11 | | | 5.52 | |
Portfolio Turnover Rate | | 40 | %* | | 457 | % | | 335 | % | | 275 | % | | 173 | % |
| (1) | | Per share amounts have been calculated using the monthly average shares method. |
| * | | Excluding mortgage dollar roll transactions. If mortgage dollar roll transactions had been included, the portfolio turnover rate would have been 855%. |
See Notes to Financial Statements.
14 Smith Barney Managed Governments Fund Inc. | 2004 Annual Report
Financial Highlights (continued)
For a share of each class of capital stock outstanding throughout each year ended July 31, unless otherwise noted:
| | | | | | | | | | | | | | | |
| Class C Shares(1) | | 2004(2) | | | 2003(2) | | | 2002(2) | | | 2001(2) | | | 2000(2) | |
Net Asset Value, Beginning of Year | | $12.51 | | | $12.88 | | | $12.57 | | | $12.03 | | | $12.09 | |
Income (Loss) From Operations: | | | | | | | | | | | | | | | |
Net investment income | | 0.35 | | | 0.30 | | | 0.53 | | | 0.62 | | | 0.67 | |
Net realized and unrealized gain (loss) | | 0.04 | | | (0.20 | ) | | 0.29 | | | 0.58 | | | (0.08 | ) |
Total Income From Operations | | 0.39 | | | 0.10 | | | 0.82 | | | 1.20 | | | 0.59 | |
Less Distributions From: | | | | | | | | | | | | | | | |
Net investment income | | (0.33 | ) | | (0.40 | ) | | (0.51 | ) | | (0.64 | ) | | (0.65 | ) |
Capital | | — | | | (0.07 | ) | | — | | | (0.02 | ) | | — | |
Total Distributions | | (0.33 | ) | | (0.47 | ) | | (0.51 | ) | | (0.66 | ) | | (0.65 | ) |
Net Asset Value, End of Year | | $12.57 | | | $12.51 | | | $12.88 | | | $12.57 | | | $12.03 | |
Total Return | | 3.17 | % | | 0.71 | % | | 6.69 | % | | 10.26 | % | | 5.00 | % |
Net Assets, End of Year (000s) | | $11,233 | | | $20,796 | | | $21,740 | | | $6,463 | | | $3,879 | |
Ratios to Average Net Assets: | | | | | | | | | | | | | | | |
Expenses | | 1.52 | % | | 1.50 | % | | 1.46 | % | | 1.46 | % | | 1.51 | % |
Net investment income | | 2.80 | | | 2.35 | | | 4.17 | | | 5.08 | | | 5.60 | |
Portfolio Turnover Rate | | 40 | %* | | 457 | % | | 335 | % | | 275 | % | | 173 | % |
| | | | | |
| Class Y Shares | | 2004(2) | | | 2003(2) | | | 2002(2) | | | 2001(2) | | | 2000(2) | |
Net Asset Value, Beginning of Year | | $12.50 | | | $12.87 | | | $12.56 | | | $12.03 | | | $12.10 | |
Income (Loss) From Operations: | | | | | | | | | | | | | | | |
Net investment income | | 0.47 | | | 0.41 | | | 0.63 | | | 0.73 | | | 0.77 | |
Net realized and unrealized gain (loss) | | 0.03 | | | (0.21 | ) | | 0.29 | | | 0.57 | | | (0.09 | ) |
Total Income From Operations | | 0.50 | | | 0.20 | | | 0.92 | | | 1.30 | | | 0.68 | |
Less Distributions From: | | | | | | | | | | | | | | | |
Net investment income | | (0.44 | ) | | (0.50 | ) | | (0.61 | ) | | (0.75 | ) | | (0.75 | ) |
Capital | | — | | | (0.07 | ) | | — | | | (0.02 | ) | | — | |
Total Distributions | | (0.44 | ) | | (0.57 | ) | | (0.61 | ) | | (0.77 | ) | | (0.75 | ) |
Net Asset Value, End of Year | | $12.56 | | | $12.50 | | | $12.87 | | | $12.56 | | | $12.03 | |
Total Return | | 4.03 | % | | 1.49 | % | | 7.55 | % | | 11.08 | % | | 5.79 | % |
Net Assets, End of Year (000s) | | $179,231 | | | $143,706 | | | $125,474 | | | $113,555 | | | $120,270 | |
Ratios to Average Net Assets: | | | | | | | | | | | | | | | |
Expenses | | 0.71 | % | | 0.69 | % | | 0.70 | % | | 0.70 | % | | 0.71 | % |
Net investment income | | 3.72 | | | 3.15 | | | 5.01 | | | 5.91 | | | 6.40 | |
Portfolio Turnover Rate | | 40 | %* | | 457 | % | | 335 | % | | 275 | % | | 173 | % |
| (1) | | On April 29, 2004, Class L shares were renamed as Class C shares. |
| (2) | | Per share amounts have been calculated using the monthly average shares method. |
| * | | Excluding mortgage dollar roll transactions. If mortgage dollar roll transactions had been included, the portfolio turnover rate would have been 855%. |
See Notes to Financial Statements.
15 Smith Barney Managed Governments Fund Inc. | 2004 Annual Report
Notes to Financial Statements
| 1. | Significant Accounting Policies |
Smith Barney Managed Governments Fund Inc. (“Fund”), a Maryland corporation, is registered under the Investment Company Act of 1940, as amended, as a diversified, open-end management investment company.
The following are significant accounting policies consistently followed by the Fund and are in conformity with U.S. generally accepted accounting principles (“GAAP”): (a) security transactions are accounted for on trade date; (b) securities listed on a national securities exchange are valued on the basis of the last sale on the date on which the valuation is made or, in the absence of sales, at the mean between the closing bid and asked prices. Over-the-counter securities are valued at the mean between the closing bid and asked prices on each day; (c) securities for which market quotations are not available will be valued in good faith at fair value by or under the direction of the Board of Directors; (d) securities maturing within 60 days are valued at cost plus accreted discount, or minus amortized premium, which approximates value; (e) other securities that have a maturity of more than 60 days are valued at prices based on market quotations for securities of similar type, yield and maturity; (f ) interest income, adjusted for amortization of premium and accretion of discount is recorded on an accrual basis; (g) gains or losses on the sale of securities are calculated by using the specific identification method; (h) dividends and distributions to shareholders are recorded on the ex-dividend date; the Fund distributes dividends monthly and capital gains, if any, at least annually; (i) class specific expenses are charged to each class; management fees, general fund expenses, income, gains and/or losses are allocated on the basis of relative net assets of each class or on another reasonable basis; (j) the character of income and gains to be distributed is determined in accordance with income tax regulations which may differ from GAAP. At July 31, 2004, reclassifications were made to the Fund’s capital accounts to reflect permanent book/tax differences and income and gains available for distributions under income tax regulations. Accordingly, a portion of accumulated net realized loss amounting to $3,597,706 has been reclassified to paid-in-capital. Net investment income, net realized gains and net assets were not affected by these changes; (k) the Fund intends to comply with the applicable provisions of the Internal Revenue Code of 1986, as amended, pertaining to regulated investment companies and to make distributions of taxable income sufficient to relieve it from substantially all Federal income and excise taxes; and (l) estimates and assumptions are required to be made regarding assets, liabilities and changes in net assets resulting from operations when financial statements are prepared. Changes in the economic environment, financial markets and any other parameters used in determining these estimates could cause actual results to differ.
| 2. | Investment Advisory Agreement, Administration Agreement and Other Transactions |
Smith Barney Fund Management LLC (“SBFM”), an indirect wholly-owned subsidiary of Citigroup Inc. (“Citigroup”), acts as investment adviser to the Fund. The Fund pays SBFM an investment advisory fee calculated at an annual rate of 0.45% of the Fund’s average daily net assets up to $1 billion and 0.415% of the Fund’s average daily net assets in excess of $1 billion. This fee is calculated daily and paid monthly.
SBFM also acts as the Fund’s administrator for which the Fund pays a fee calculated at an annual rate of 0.20% of the Fund’s average daily net assets up to $1 billion and 0.185% of the Fund’s average daily net assets in excess of $1 billion. This fee is calculated daily and paid monthly.
Citicorp Trust Bank, fsb. (“CTB”), another subsidiary of Citigroup, acts as the Fund’s transfer agent. PFPC Inc. (“PFPC”) acts as the Fund’s sub-transfer agent. CTB receives account fees and asset-based fees that vary according to the size and type of account. PFPC is responsible for shareholder recordkeeping and financial processing for all shareholder accounts and is paid by CTB. During the year ended July 31, 2004, the Fund paid transfer agent fees of $189,027 to CTB.
Citigroup Global Markets Inc. (“CGM”), another indirect wholly-owned subsidiary of Citigroup, acts as the Fund’s distributor.
16 Smith Barney Managed Governments Fund Inc. | 2004 Annual Report
Notes to Financial Statements (continued)
On February 2, 2004, initial sales charges on Class L shares were eliminated. On April 29, 2004, the Fund’s Class L shares were renamed as Class C shares.
There is a maximum initial sales charge of 4.50% for Class A shares. There is a contingent deferred sales charge (“CDSC”) of 4.50% on Class B shares, which applies if redemption occurs within one year from purchase payment. This CDSC declines by 0.50% the first year after purchase payment and thereafter by 1.00% per year until no CDSC is incurred. Class C shares also have a 1.00% CDSC, which applies if redemption occurs within one year from purchase payment. In addition, Class A shares have a 1.00% CDSC, which applies if redemption occurs within one year from purchase payment. This CDSC only applies to those purchases of Class A shares which, when combined with current holdings of Class A shares, equal or exceed $500,000 in the aggregate. These purchases do not incur an initial sales charge.
For the year ended July 31, 2004, CGM and its affiliates received sales charges of approximately $64,000 and $7,000 on sales of the Fund’s Class A and C shares, respectively. In addition, for the year ended July 31, 2004, CDSCs paid to CGM and its affiliates were approximately:
| | | | | | |
| | | Class B | | Class C |
CDSCs | | $ | 107,000 | | $ | 6,000 |
|
All officers and one Director of the Fund are employees of Citigroup or its affiliates.
During the year ended July 31, 2004, the aggregate cost of purchases and proceeds from sales of investments (including maturities of long-term investments, but excluding short-term investments and mortgage dollar roll transactions) were as follows:
| | | |
|
Purchases | | $ | 256,232,764 |
|
Sales | | | 174,762,938 |
|
At July 31, 2004, the aggregate gross unrealized appreciation and depreciation of investments for Federal income tax purposes were as follows:
| | | | |
|
|
Gross unrealized appreciation | | $ | 5,691,774 | |
Gross unrealized depreciation | | | (1,774,582 | ) |
|
|
Net unrealized appreciation | | $ | 3,917,192 | |
|
|
When entering into repurchase agreements, it is the Fund’s policy that a custodian takes possession of the underlying collateral securities, the value of which at least equals the principal amount of the repurchase transaction, including accrued interest. To the extent that any repurchase transaction exceeds one business day, the value of the collateral is marked-to-market to ensure the adequacy of the collateral. If the seller defaults and the value of the collateral declines or if bankruptcy proceedings are commenced with respect to the seller of the security, realization of the collateral by the Fund may be delayed or limited.
Securities or cash equal to the initial margin amount are either deposited with the broker or segregated by the custodian upon entering into the futures contract. Additional securities are also segregated up to the current market value of the futures contracts. During the period the futures contract is open, changes in the value of the contract are recognized as
17 Smith Barney Managed Governments Fund Inc. | 2004 Annual Report
Notes to Financial Statements (continued)
unrealized gains or losses by “marking-to market” on a daily basis to reflect the market value of the contract at the end of each day’s trading. Variation margin payments are made or received and recognized as assets due from or liabilities due to broker, depending upon whether unrealized gains or losses are incurred. When the contract is closed, the Fund records a realized gain or loss equal to the difference between the proceeds from (or cost of ) the closing transactions and the Fund’s basis in the contract. The Fund enters into such contracts typically to hedge a portion of its portfolio. The Fund bears the market risk that arises from changes in the value of the financial instruments and securities indices.
At July 31, 2004, the Fund had the following open futures contracts:
| | | | | | | | | | | | | | |
| | | Number of
Contracts | | Expiration
Date | | Basis
Value | | Market
Value | | Unrealized
Gain (Loss) | |
Contracts to Sell: | | | | | | | | | | | | | | |
U.S. Treasury 5 Year Notes | | 285 | | 9/04 | | $ | 30,659,386 | | $ | 31,207,500 | | $ | (548,114 | ) |
U.S. Treasury 10 Year Notes | | 213 | | 9/04 | | | 23,632,850 | | | 23,583,094 | | | 49,756 | |
|
|
Net Unrealized Loss on Open Futures Contracts | | | | | | | | | | | | $ | (498,358 | ) |
|
|
| 6. | Securities Traded on a To-Be-Announced Basis |
The Fund may trade securities on a “to-be-announced” (“TBA”) basis. In a TBA transaction, the Fund commits to purchasing or selling securities for which all specific information is not yet known at the time of the trade, particularly the face amount and maturity date in U.S. Government Agency transactions. Securities purchased on a TBA basis are not settled until they are delivered to the Fund, normally 15 to 45 days later. Beginning on the date the Fund enters into a TBA transaction, cash, U.S. government securities or other liquid high grade debt obligations are segregated in an amount equal in value to the purchase price of the TBA security. These transactions are subject to market fluctuation and their current value is determined in the same manner as for other securities.
At July 31, 2004, the Fund held TBA securities with a total cost of $279,286,275.
| 7. | Mortgage Dollar Roll Transactions |
The Fund may enter into mortgage dollar roll transactions. A mortgage dollar roll transaction involves a sale by the Fund of mortgage related securities that it holds with an agreement by the Fund to repurchase similar securities at an agreed upon price and date. The securities purchased will bear the same interest rate as those sold, but generally will be collateralized by pools of mortgages with different prepayment histories than those securities sold. Proceeds from the sale will be reinvested and the income from these investments, together with any additional income received on the sale, is included in investment income. During the period between the sale and repurchase in a mortgage dollar roll transaction, the Fund will not be entitled to receive interest and principal payments on the securities sold but will invest the proceeds of the sale in other securities which may enhance the yield and total return. In addition, the difference between the sale price and the future purchase price is recorded as an adjustment to investment income. Losses may arise due to changes in the value of the securities or if the counterparty does not perform under the terms of the agreement. If the counterparty files for bankruptcy or becomes insolvent, the Fund’s right to repurchase the securities may be limited.
During the year ended July 31, 2004, the Fund entered into mortgage dollar roll transactions in the aggregate amount of $3,539,769,961. For the year ended July 31, 2004, the Fund recorded interest income of $10,383,049 related to such transactions.
At July 31, 2004, the Fund held securities under outstanding mortgage dollar rolls with a total cost of $279,286,275.
18 Smith Barney Managed Governments Fund Inc. | 2004 Annual Report
Notes to Financial Statements (continued)
| 8. | Class Specific Expenses |
Pursuant to a Rule 12b-1 Distribution Plan, the Fund pays a service fee with respect to Class A, B and C shares calculated at an annual rate of 0.25% of the average daily net assets of each respective class. In addition, the Fund pays a distribution fee with respect to Class B and C shares calculated at an annual rate of 0.50% and 0.45% of the average daily net assets for each class, respectively. For the year ended July 31, 2004, total Rule 12b-1 Distribution Plan fees, which are accrued daily and paid monthly, were as follows:
| | | | | | | | | | | |
| | | | | Class A | | Class B | | Class C |
Rule 12b-1 Distribution Plan Fees | | | | $ | 590,537 | | $ | 220,745 | | $ | 97,002 |
|
For the year ended July 31, 2004, total Transfer Agency Service expenses were as follows:
| | | | | | | | | | | | |
| | | Class A | | Class B | | Class C | | Class Y |
Transfer Agency Service Expenses | | $ | 187,411 | | $ | 29,552 | | $ | 12,318 | | $ | 160 |
|
For the year ended July 31, 2004, total Shareholder Communication expenses were as follows:
| | | | | | | | | | | | |
| | | Class A | | Class B | | Class C | | Class Y |
Shareholder Communication Expenses | | $ | 19,503 | | $ | 5,465 | | $ | 3,635 | | $ | 555 |
|
| 9. | Distributions Paid to Shareholders by Class |
| | | | | | |
| | | Year Ended
July 31, 2004 | | Year Ended
July 31, 2003 |
Class A | | | | | | |
Net investment income | | $ | 7,330,074 | | $ | 9,628,285 |
Capital | | | — | | | 1,413,886 |
|
Total | | $ | 7,330,074 | | $ | 11,042,171 |
|
Class B | | | | | | |
Net investment income | | $ | 744,599 | | $ | 1,220,179 |
Capital | | | — | | | 209,786 |
|
Total | | $ | 744,599 | | $ | 1,429,965 |
|
Class C | | | | | | |
Net investment income | | $ | 350,086 | | $ | 660,422 |
Capital | | | — | | | 112,833 |
|
Total | | $ | 350,086 | | $ | 773,255 |
|
Class Y | | | | | | |
Net investment income | | $ | 5,768,815 | | $ | 5,170,120 |
Capital | | | — | | | 695,781 |
|
Total | | $ | 5,768,815 | | $ | 5,865,901 |
|
At July 31, 2004, the Fund had 500 million shares of capital stock authorized with a par value of $0.001 per share. The Fund has the ability to issue multiple classes of shares. Each share of a class represents an identical interest in the Fund and has the same rights, except that each class bears certain expenses specifically related to the distribution of its shares.
19 Smith Barney Managed Governments Fund Inc. | 2004 Annual Report
Notes to Financial Statements (continued)
Transactions in shares of each class were as follows:
| | | | | | | | | | | | | | |
| | | Year Ended
July 31, 2004
| | | Year Ended July 31, 2003
| |
| | | Shares | | | Amount | | | Shares | | | Amount | |
Class A | | | | | | | | | | | | | | |
Shares sold | | 722,357 | | | $ | 9,139,960 | | | 1,753,101 | | | $ | 22,641,545 | |
Shares issued on reinvestment | | 397,195 | | | | 5,017,936 | | | 583,002 | | | | 7,518,566 | |
Shares reacquired | | (4,113,078 | ) | | | (51,980,805 | ) | | (3,691,238 | ) | | | (47,593,956 | ) |
|
|
Net Decrease | | (2,993,526 | ) | | $ | (37,822,909 | ) | | (1,355,135 | ) | | $ | (17,433,845 | ) |
|
|
Class B | | | | | | | | | | | | | | |
Shares sold | | 155,844 | | | $ | 1,970,890 | | | 997,599 | | | $ | 12,911,999 | |
Shares issued on reinvestment | | 39,002 | | | | 492,977 | | | 73,867 | | | | 953,292 | |
Shares reacquired | | (1,173,774 | ) | | | (14,833,985 | ) | | (1,157,463 | ) | | | (14,939,361 | ) |
|
|
Net Decrease | | (978,928 | ) | | $ | (12,370,118 | ) | | (85,997 | ) | | $ | (1,074,070 | ) |
|
|
Class C† | | | | | | | | | | | | | | |
Shares sold | | 129,155 | | | $ | 1,634,421 | | | 1,306,633 | | | $ | 16,886,750 | |
Shares issued on reinvestment | | 18,235 | | | | 230,447 | | | 43,217 | | | | 557,452 | |
Shares reacquired | | (916,561 | ) | | | (11,588,792 | ) | | (1,375,397 | ) | | | (17,723,938 | ) |
|
|
Net Decrease | | (769,171 | ) | | $ | (9,723,924 | ) | | (25,547 | ) | | $ | (279,736 | ) |
|
|
Class Y | | | | | | | | | | | | | | |
Shares sold | | 2,983,115 | | | $ | 37,785,036 | | | 2,834,601 | | | $ | 36,617,610 | |
Shares reacquired | | (212,497 | ) | | | (2,685,897 | ) | | (1,089,837 | ) | | | (14,110,888 | ) |
|
|
Net Increase | | 2,770,618 | | | $ | 35,099,139 | | | 1,744,764 | | | $ | 22,506,722 | |
|
|
| † | On April 29, 2004, Class L shares were renamed as Class C shares. |
| 11. | | Capital Loss Carryforward |
At July 31, 2004, the Fund had, for Federal income tax purposes, capital loss carryforwards of approximately $17,187,000 available, subject to certain limitations, to offset future capital gains. To the extent that these capital carryforward losses are used to offset capital gains, it is probable that the gains so offset will not be distributed.
The amount and expiration of the carryforwards are indicated below. Expiration occurs on July 31 of the year indicated:
| | | | | | | | | | | | |
| | | 2008 | | 2009 | | 2011 | | 2012 |
Carryforward amounts | | $ | 14,114,000 | | $ | 941,000 | | $ | 718,000 | | $ | 1,414,000 |
|
In addition, the Fund had $2,480,470 of capital losses realized after October 31, 2003, which were deferred for tax purposes to the first day of the following fiscal year.
| 12. | | Income Tax Information and Distributions to Shareholders |
At July 31, 2004, the tax basis components of distributable earnings were:
| | | | |
| | | | |
Undistributed ordinary income | | $ | 2,856,335 | |
|
|
Accumulated capital losses | | | (17,186,994 | ) |
|
|
Unrealized appreciation | | | 3,917,192 | |
|
|
20 Smith Barney Managed Governments Fund Inc. | 2004 Annual Report
Notes to Financial Statements (continued)
At July 31, 2004, the difference between book basis and tax basis unrealized appreciation and depreciation is attributable primarily to wash sale loss deferrals and mark-to-market of derivative securities.
The tax character of distributions paid during the year ended July 31, 2004 and 2003 was:
| | | | | | |
| | | 2004 | | 2003 |
Ordinary income | | $ | 14,193,574 | | $ | 16,679,006 |
Capital | | | — | | | 2,432,286 |
|
Total | | $ | 14,193,574 | | $ | 19,111,292 |
|
| 13. | | Additional Information |
Citigroup has been notified by the Staff of the Securities and Exchange Commission (“SEC”) that the Staff is considering recommending a civil injunctive action and/or an administrative proceeding against Citigroup Asset Management (“CAM”), including its applicable investment advisory companies and Citicorp Trust Bank (“CTB”), an internal transfer agent, relating to the creation and operation of the internal transfer agent unit to serve certain CAM-managed funds, including the Fund. This notification arises out of a previously disclosed investigation by the SEC and the U.S. Attorney and relates to CTB’s entry in 1999 into the transfer agency business, CAM’s retention of, and agreements with an unaffiliated sub transfer agent, the adequacy of the disclosures made to the fund boards that approved the transfer agency arrangements, (including CAM’s failure to disclose a related revenue guarantee agreement benefiting CAM and its affiliates), and CAM’s operation of and compensation for the transfer agency business. The revenue guarantee described above was terminated in 1999 and CAM will be paying the applicable funds, primarily through fee waivers, a total of approximately $17 million (plus interest) that is the amount of the revenue received by Citigroup relating to the revenue guarantee. Citigroup is cooperating fully in the investigation and will seek to resolve the matter in discussions with the SEC Staff. Although there can be no assurance, Citigroup does not believe that this matter will have a material adverse effect on the Fund. On August 12, 2004, CAM paid the Fund $79,698, its allocable share of the amount described above through a waiver of its fees.
Class action lawsuits have been filed against Citigroup Global Markets Inc. (the “Distributor”) and a number of its affiliates, including Smith Barney Fund Management LLC and Salomon Brothers Asset Management Inc (the “Advisers”), substantially all of the mutual funds managed by the Advisers (the “Funds”), and directors or trustees of the Funds. The complaints allege, among other things, that the Distributor created various undisclosed incentives for its brokers to sell Smith Barney and Salomon Brothers funds. In addition, according to the complaints, the Advisers caused the Funds to pay excessive brokerage commissions to the Distributor for steering clients towards proprietary funds. The complaints also allege that the defendants breached their fiduciary duty to the Funds by improperly charging Rule 12b-1 fees and by drawing on Fund assets to make undisclosed payments of soft dollars and excessive brokerage commissions. The complaints seek injunctive relief and compensatory and punitive damages, rescission of the Funds’ contracts with the Advisers, recovery of all fees paid to the Advisers pursuant to such contracts and an award of attorneys’ fees and litigation expenses. Citigroup Asset Management believes that the suits are without merit and intends to defend the cases vigorously.
Additional lawsuits arising out of these circumstances and presenting similar allegations and requests for relief may be filed against the defendants in the future. Neither Citigroup Asset Management nor the Funds believe that any of the pending actions will have a material adverse effect on the Funds or the ability of the Distributor or the Advisers to perform under their respective contracts with the Funds.
21 Smith Barney Managed Governments Fund Inc. | 2004 Annual Report
Report of Independent Registered Public Accounting Firm
The Shareholders and Board of Directors of
Smith Barney Managed Governments Fund Inc.:
We have audited the accompanying statement of assets and liabilities, including the schedule of investments, of Smith Barney Managed Governments Fund Inc. (“Fund”) as of July 31, 2004, and the related statement of operations for the year then ended, the statements of changes in net assets for each of the years in the two-year period then ended, and the financial highlights for each of the years in the five-year period then ended. These financial statements and financial highlights are the responsibility of the Fund’s management. Our responsibility is to express an opinion on these financial statements and financial highlights based on our audits.
We conducted our audits in accordance with the standards of the Public Company Accounting Oversight Board (United States). Those standards require that we plan and perform the audit to obtain reasonable assurance about whether the financial statements and financial highlights are free of material misstatement. An audit includes examining, on a test basis, evidence supporting the amounts and disclosures in the financial statements. Our procedures included confirmation of securities owned as of July 31, 2004, by correspondence with the custodian and brokers. As to securities purchased or sold but not yet received or delivered, we performed other appropriate auditing procedures. An audit also includes assessing the accounting principles used and significant estimates made by management, as well as evaluating the overall financial statement presentation. We believe that our audits provide a reasonable basis for our opinion.
In our opinion, the financial statements and financial highlights referred to above present fairly, in all material respects, the financial position of the Fund as of July 31, 2004, and the results of its operations for the year then ended, the changes in its net assets for each of the years in the two-year period then ended, and the financial highlights for each of the years in the five-year period then ended, in conformity with U.S. generally accepted accounting principles.

New York, New York
September 17, 2004
22 Smith Barney Managed Governments Fund Inc. | 2004 Annual Report
Additional Shareholder Information (unaudited)
Special Shareholder Meeting
On August 16, 2004, a special meeting of the shareholders of the Fund was held for the purpose of voting on the following matter:
| | 1. | To approve a change in the investment objective of the Fund. |
The results of the vote on Proposal 1 were as follows:
| | | | | | | | | | | | | | | | |
Shares Voted
For | | Percentage
of Shares
Voted | | Percentage of
Outstanding
Shares | | Shares
Voted
Against | | Percentage of
Shares Voted | | Percentage of
Outstanding
Shares | | Votes
Abstained | | % of Shares
Voted | | Percentage of
Outstanding
Shares |
14,958,911.938 | | 55.34% | | 42.80% | | 10,663,695.984 | | 39.45% | | 30.51% | | 1,409,153.280 | | 5.21% | | 4.03% |
|
While a majority of the Fund’s shares present at the meeting voted in favor of the proposal, the proposal was not approved by the holders of a “majority of the outstanding voting securities” of the Fund, as defined in the Investment Company Act of 1940, as amended, which was the vote required for approval of the proposal.
23 Smith Barney Managed Governments Fund Inc. | 2004 Annual Report
Additional Information (unaudited)
Information about Directors and Officers
The business and affairs of the Smith Barney Managed Governments Fund Inc. (“Fund”) are managed under the direction of the Board of Directors. Information pertaining to the Directors and Officers of the Fund is set forth below. The Statement of Additional Information includes additional information about the Fund Directors and is available, without charge, upon request by calling the Fund’s transfer agent (Citicorp Trust Bank, fsb. at 1-800-451-2010).
| | | | | | | | | | |
| Name, Address and Age | | Position(s) Held
with Fund | | Term of
Office* and
Length of
Time Served | | Principal Occupation(s) During Past Five Years | | Number of
Investment
Portfolios in
Fund Complex
Overseen by
Director | | Other Board
Memberships Held
by Director |
Non-Interested Directors: | | | | |
| | | | | |
Dwight B. Crane Harvard Business School Soldiers Field Morgan Hall #375 Boston, MA 02163 Age 66 | | Director | | Since 1995 | | Professor — Harvard Business School | | 49 | | None |
| | | | | |
Burt N. Dorsett The Stratford #702 5601 Turtle Bay Drive Naples, FL 34108 Age 73 | | Director | | Since 1984 | | President — Dorsett McCabe Capital Management Inc.; Chief Investment Officer of Leeb Capital Management, Inc. (Since 1999) | | 27 | | None |
| | | | | |
Elliot S. Jaffe The Dress Barn, Inc. Executive Office 30 Dunnigan Drive Suffern, NY 10901 Age 77 | | Director | | Since 1985 | | Chairman of
The Dress Barn, Inc. | | 27 | | The Dress Barn, Inc. |
| | | | | |
Stephen E. Kaufman Stephen E. Kaufman PC 277 Park Avenue 47th Floor New York, NY 10172 Age 72 | | Director | | Since 1995 | | Attorney | | 55 | | None |
| | | | | |
Cornelius C. Rose, Jr. P.O. Box 5388 West Lebanon, NH 03784 Age 71 | | Director | | Since
1984 | | Chief Executive
Officer — Performance Learning Systems | | 27 | | None |
| | |
Interested Director: | | | | |
| | | | | |
R. Jay Gerken, CFA** Citigroup Asset Management (“CAM”) 399 Park Avenue, 4th Floor New York, NY 10022 Age 53 | | Chairman, President and Chief Executive Officer | | Since
2002 | | Managing Director of Citigroup Global Markets Inc. (“CGM”); Chairman, President and Chief Executive Officer of Smith Barney Fund Management LLC (“SBFM”), Travelers Investment Adviser, Inc. (“TIA”) and Citi Fund Management Inc. (“CFM”); President and Chief Executive Officer of certain mutual funds associated with Citigroup Inc. (“Citigroup”); Formerly Portfolio Manager of Smith Barney Allocation Series Inc. (from 1996 to 2001) and Smith Barney Growth and Income Fund (from 1996 to 2000) | | 221 | | None |
24 Smith Barney Managed Governments Fund Inc. | 2004 Annual Report
Additional Information (unaudited) (continued)
| | | | | | | | | | |
| Name, Address and Age | | Position(s) Held
with Fund | | Term of
Office* and
Length of
Time Served | | Principal Occupation(s)
During Past Five Years | | Number of
Investment
Portfolios in
Fund Complex
Overseen by
Director | | Other Board
Memberships Held
by Director |
Officers: | | | | | | | | |
| | | | | |
Andrew B. Shoup CAM 125 Broad Street, 11th Floor New York, NY 10004 Age 47 | | Senior Vice President and Chief Administrative Officer | | Since
2003 | | Director of CAM; Senior Vice President and Chief Administrative Officer of mutual funds associated with Citigroup; Treasurer and Chief Financial Officer of certain mutual funds associated with Citigroup; Head of International Funds Administration of CAM (from 2001 to 2003); Director of Global Funds Administration of CAM (from 2000 to 2001); Head of U.S. Citibank Funds Administration of CAM (from 1998 to 2000) | | N/A | | N/A |
| | | | | |
James M. Giallanza CAM 125 Broad Street, 11th Floor New York, NY 10004 Age 38 | | Chief Financial Officer and Treasurer | | Since
2004 | | Director of CGM; Chief Financial Officer and Treasurer of certain mutual funds associated with Citigroup; Director and Controller of the U.S. wholesale business at UBS Global Asset Management US, Inc. (from September 2001 to July 2004); Director of Global Funds Administration at CAM (from June 2000 to September 2001); Treasurer of the Lazard Funds (from June 1998 to June 2000) | | N/A | | N/A |
| | | | | |
Roger M. Lavan, CFA CAM 399 Park Avenue, 4th Floor New York, NY 10022 Age 39 | | Vice President
and Investment Officer | | Since 2002 | | Managing Director
of CGM; Investment Officer of SBFM | | N/A | | N/A |
| | | | | |
David Torchia CAM 399 Park Avenue, 4th Floor New York, NY 10022 Age 43 | | Vice President
and Investment Officer | | Since 2002 | | Managing Director
of CGM; Investment Officer of SBFM | | N/A | | N/A |
| | | | | |
Andrew Beagley CAM 399 Park Avenue, 4th Floor New York, NY 10022 Age 41 | | Chief Anti-Money Laundering Compliance Officer Chief Compliance Officer | | Since
2002 Since
2004 | | Director of CGM (since 2000); Director of Compliance, North America, CAM (since 2000); Chief Anti-Money Laundering Compliance Officer and Vice President of certain mutual funds associated with Citigroup; Director of Compliance, Europe, the Middle East and Africa, CAM (from 1999 to 2000); Compliance Officer, Salomon Brothers Asset Management Limited, Smith Barney Global Capital Management Inc., Salomon Brothers Asset Management Asia Pacific Limited (from 1997 to 1999) | | N/A | | N/A |
25 Smith Barney Managed Governments Fund Inc. | 2004 Annual Report
Additional Information (unaudited) (continued)
| | | | | | | | | | |
| Name, Address and Age | | Position(s) Held
with Fund | | Term of
Office* and
Length of
Time Served | | Principal Occupation(s)
During Past Five Years | | Number of
Investment
Portfolios in
Fund Complex
Overseen by
Director | | Other Board
Memberships Held
by Director |
Kaprel Ozsolak CAM 125 Broad Street, 11th Floor New York, NY 10004 Age 38 | | Controller | | Since
2002 | | Vice President of CGM; Controller of certain mutual funds associated with Citigroup | | N/A | | N/A |
| | | | | |
Robert I. Frenkel CAM 300 First Stamford Place, 4th Floor Stamford, CT 06902 Age 48 | | Secretary and Chief Legal Officer | | Since
2003 | | Managing Director and General Counsel of Global Mutual Funds for CAM and its predecessor (since 1994); Secretary of CFM; Secretary and Chief Legal Officer of mutual funds associated with Citigroup | | N/A | | N/A |
| * | | Each Director and officer serves until his or her respective successor has been duly elected and qualified. |
| ** | Mr. Gerken is an “interested person” of the Fund as defined in the Investment Company Act of 1940, as amended, because Mr. Gerken is an officer of SBFM and certain of its affiliates. |
Tax Information (unaudited)
For Federal tax purposes the Fund hereby designates for the fiscal year ended July 31, 2004:
| | • | A total of 2.92% of the ordinary dividends paid by the Fund from net investment income are derived from Federal obligations and may be exempt from taxation at the state level. |
26 Smith Barney Managed Governments Fund Inc. | 2004 Annual Report
SMITH BARNEY
MANAGED GOVERNMENTS FUND INC.
| | |
DIRECTORS Dwight B. Crane Burt N. Dorsett R. Jay Gerken, CFA Chairman Elliot S. Jaffe Stephen E. Kaufman Cornelius C. Rose, Jr. OFFICERS R. Jay Gerken, CFA President and Chief Executive Officer Andrew B. Shoup Senior Vice President and
Chief Administrative Officer James M. Giallanza
Chief Financial Officer
and Treasurer Roger M. Lavan, CFA Vice President and
Investment Officer David Torchia Vice President and
Investment Officer Andrew Beagley Chief Anti-Money Laundering Compliance Officer and
Chief Compliance Officer Kaprel Ozsolak Controller Robert I. Frenkel Secretary and Chief Legal Officer | | INVESTMENT ADVISER AND ADMINISTRATOR Smith Barney Fund
Management LLC DISTRIBUTOR Citigroup Global Markets Inc. CUSTODIAN State Street Bank and Trust Company TRANSFER AGENT Citicorp Trust Bank, fsb. 125 Broad Street, 11th Floor New York, New York 10004 SUB-TRANSFER AGENT PFPC Inc. P.O. Box 9699 Providence, Rhode Island 02940-9699 |
Smith Barney Managed Governments Fund Inc.
Information on how the fund voted proxies relating to portfolio securities during the 12 month period ended June 30, 2004 and a description of the policies and procedures that the fund uses to determine how to vote proxies relating to portfolio securities is available (1) without charge, upon request, by calling 1-800-451-2010, (2) on the fund’s website at www.smithbarneymutualfunds.com and (3) on the SEC’s website at www.sec.gov.
This report is submitted for the general information of the shareholders of Smith Barney Managed Governments Fund Inc., but it may also be used as sales literature when preceded or accompanied by the current Prospectus.
SMITH BARNEY MANAGED GOVERNMENTS FUND INC.
Smith Barney Mutual Funds
125 Broad Street
10th Floor, MF-2
New York, New York 10004
This document must be preceded or accompanied by a free prospectus. Investors should consider the fund’s investment objectives, risks, charges and expenses carefully before investing. The prospectus contains this and other important information about the fund. Please read the prospectus carefully before you invest or send money.
www.smithbarneymutualfunds.com
©2004 Citigroup Global Markets Inc.
Member NASD, SIPC
| | | | |
ITEM 2. | | CODE OF ETHICS. |
| |
| | | The registrant has adopted a code of ethics that applies to the registrant’s principal executive officer, principal financial officer, principal accounting officer or controller. |
| |
ITEM 3. | | AUDIT COMMITTEE FINANCIAL EXPERT. |
| |
| | | The Board of Directors of the registrant has determined that Dwight B. Crane, a member of the Board’s Audit Committee, possesses the technical attributes identified in Instruction 2(b) of Item 3 to Form N-CSR to qualify as an “audit committee financial expert,” and has designated Mr. Crane as the Audit Committee’s financial expert. Mr. Crane is an “independent” Director pursuant to paragraph (a)(2) of Item 3 to Form N-CSR. |
| |
ITEM 4. | | PRINCIPAL ACCOUNTANT FEES AND SERVICES. |
| | |
| | | (a) | | Audit Fees for the Smith Barney Managed Governments Fund Inc. were $32,000 and $32,000 for the years ended 7/31/04 and 7/31/03. |
| | |
| | | (b) | | Audit-Related Fees for the Smith Barney Managed Governments Fund Inc. were $2,100 and $2,100 for the years ended 7/31/04 and 7/31/03. |
| | |
| | | (c) | | Tax Fees for Smith Barney Managed Governments Fund Inc. were $19,500 and $19,100 for the years ended 7/31/04 and 7/31/03. These amounts represent aggregate fees paid for tax compliance, tax advice and tax planning services, which include (the filing and amendment of federal, state and local income tax returns, timely RIC qualification review and tax distribution and analysis planning) rendered by the Accountant to Smith Barney Managed Governments Fund Inc. |
| | |
| | | (d) | | All Other Fees for Smith Barney Managed Governments Fund Inc. were $0 and $0 for the years ended 7/31/04 and 7/31/03. |
| | |
| | | (e) | | (1) Audit Committee’s pre–approval policies and procedures described in paragraph (c) (7) of Rule 2-01 of Regulation S-X. |
| | |
| | | | | The Charter for the Audit Committee (the “Committee”) of the Board of each registered investment company (the “Fund”) advised by Smith Barney Fund Management LLC or Salomon Brothers Asset Management Inc or one of their affiliates (each, an “Adviser”) requires that the Committee shall approve (a) all audit and permissible non-audit services to be provided to the Fund and (b) all permissible non-audit services to be provided by the Fund’s independent auditors to the Adviser and any Covered Service Providers if the engagement relates directly to the operations and financial reporting of the Fund. The Committee may implement policies and procedures by which such services are approved other than by the full Committee. |
| | | | |
| | | | | The Committee shall not approve non-audit services that the Committee believes may impair the independence of the auditors. As of the date of the approval of this Audit Committee Charter, permissible non-audit services include any professional services (including tax services), that are not prohibited services as described below, provided to the Fund by the independent auditors, other than those provided to the Fund in connection with an audit or a review of the financial statements of the Fund. Permissible non-audit services may not include: (i) bookkeeping or other services related to the accounting records or financial statements of the Fund; (ii) financial information systems design and implementation; (iii) appraisal or valuation services, fairness opinions or contribution-in-kind reports; (iv) actuarial services; (v) internal audit outsourcing services; (vi) management functions or human resources; (vii) broker or dealer, investment adviser or investment banking services; (viii) legal services and expert services unrelated to the audit; and (ix) any other service the Public Company Accounting Oversight Board determines, by regulation, is impermissible. |
| | |
| | | | | Pre-approval by the Committee of any permissible non-audit services is not required so long as: (i) the aggregate amount of all such permissible non-audit services provided to the Fund, the Adviser and any service providers controlling, controlled by or under common control with the Adviser that provide ongoing services to the Fund (“Covered Service Providers”) constitutes not more than 5% of the total amount of revenues paid to the independent auditors during the fiscal year in which the permissible non-audit services are provided to (a) the Fund, (b) the Adviser and (c) any entity controlling, controlled by or under common control with the Adviser that provides ongoing services to the Fund during the fiscal year in which the services are provided that would have to be approved by the Committee; (ii) the permissible non-audit services were not recognized by the Fund at the time of the engagement to be non-audit services; and (iii) such services are promptly brought to the attention of the Committee and approved by the Committee (or its delegate(s)) prior to the completion of the audit. |
| | |
| | | (f) | | N/A |
| | |
| | | (g) | | Non-audit fees billed by the Accountant for services rendered to Smith Barney Managed Governments Fund Inc. and CAM and any entity controlling, controlled by, or under common control with CAM that provides ongoing services to Smith Barney Managed Governments Fund Inc. were $ 0 and $ 0 for the years ended 7/31/04 and 7/31/03. |
| | |
| | | (h) | | Yes. The Smith Barney Managed Governments Fund Inc.’s Audit Committee has considered whether the provision of non-audit services that were rendered to Service Affiliates which were not pre-approved (not requiring pre-approval) is compatible with maintaining the Accountant’s independence. All services provided by the Accountant to the Smith Barney Managed Governments Fund Inc. or to Service Affiliates which were required to be pre-approved were pre-approved as required. |
| | | | |
ITEM 5. | | AUDIT COMMITTEE OF LISTED REGISTRANTS. |
| |
| | | Not applicable. |
| |
ITEM 6. | | [RESERVED] |
| |
ITEM 7. | | DISCLOSURE OF PROXY VOTING POLICIES AND PROCEDURES FOR CLOSED-END MANAGEMENT INVESTMENT COMPANIES. |
| |
| | | Not applicable. |
| |
ITEM 8. | | [RESERVED] |
| |
ITEM 9. | | SUBMISSION OF MATTERS TO A VOTE OF SECURITY HOLDERS. |
| |
| | | Not applicable. |
| |
ITEM 10. | | CONTROLS AND PROCEDURES. |
| | |
| | | (a) | | The registrant’s principal executive officer and principal financial officer have concluded that the registrant’s disclosure controls and procedures (as defined in Rule 30a- 3(c) under the Investment Company Act of 1940, as amended (the “1940 Act”)) are effective as of a date within 90 days of the filing date of this report that includes the disclosure required by this paragraph, based on their evaluation of the disclosure controls and procedures required by Rule 30a-3(b) under the 1940 Act and 15d-15(b) under the Securities Exchange Act of 1934. |
| | | | |
| | | (b) | | There were no changes in the registrant’s internal control over financial reporting (as defined in Rule 30a-3(d) under the 1940 Act) that occurred during the registrant’s last fiscal half-year (the registrant’s second fiscal half-year in the case of an annual report) that have materially affected, or are likely to materially affect the registrant’s internal control over financial reporting. |
| |
ITEM 11. | | EXHIBITS. |
| | |
| | | (a) | | Code of Ethics attached hereto. |
| |
| | | Exhibit 99.CODE ETH |
| | |
| | | (b) | | Attached hereto. |
| | |
Exhibit 99.CERT | | Certifications pursuant to section 302 of the Sarbanes-Oxley Act of 2002 |
| |
Exhibit 99.906CERT | | Certifications pursuant to Section 906 of the Sarbanes-Oxley Act of 2002 |
SIGNATURES
Pursuant to the requirements of the Securities Exchange Act of 1934 and the Investment Company Act of 1940, the registrant has duly caused this Report to be signed on its behalf by the undersigned, there unto duly authorized.
| | |
Smith Barney Managed Governments Fund Inc. |
| |
By: | | /s/ R. Jay Gerken
|
| | | (R. Jay Gerken) |
| | | Chief Executive Officer of |
| | | Smith Barney Managed Governments Fund Inc. |
| |
Date: | | October 8, 2004 |
Pursuant to the requirements of the Securities Exchange Act of 1934 and the Investment Company Act of 1940, this report has been signed below by the following persons on behalf of the registrant and in the capacities and on the dates indicated.
| | |
By: | | /s/ R. Jay Gerken
|
| | | (R. Jay Gerken) |
| | | Chief Executive Officer of |
| | | Smith Barney Managed Governments Fund Inc. |
| |
Date: | | October 8, 2004 |
| | |
By: | | /s/ James M. Giallanza
|
| | | (James M. Giallanza) |
| | | Chief Financial Officer of |
| | | Smith Barney Managed Governments Fund Inc. |
| |
Date: | | October 8, 2004 |