UNITED STATES
SECURITIES AND EXCHANGE COMMISSION
Washington, D.C. 20549
FORM N-CSR
CERTIFIED SHAREHOLDER REPORT OF REGISTERED
MANAGEMENT INVESTMENT COMPANIES
Investment Company Act file number: 811-4061
Smith Barney Core Plus Bond Fund Inc.
(Exact name of registrant as specified in charter)
| | |
| 125 Broad Street, New York, NY | | 10004 |
| | |
| (Address of principal executive offices) | | (Zip code) |
Robert I. Frenkel, Esq.
Legg Mason & Co., LLC
300 First Stamford Place, 4th Floor
Stamford, CT 06902
(Name and address of agent for service)
Registrant’s telephone number, including area code: (800) 451-2010
Date of fiscal year end: July 31
Date of reporting period: January 31, 2006
ITEM 1. REPORT TO STOCKHOLDERS.
The Semi-Annual Report to Stockholders is filed herewith.
SEMI-ANNUAL
REPORT
JANUARY 31, 2006

Smith Barney
Core Plus Bond Fund Inc.
INVESTMENT PRODUCTS: NOT FDIC INSURED Ÿ NO BANK GUARANTEE Ÿ MAY LOSE VALUE
Smith Barney
Core Plus Bond Fund Inc.
Semi-Annual Report • January 31, 2006
What’s
Inside
Fund Objective
The Fund seeks maximum total return consisting of capital appreciation and income, consistent with the preservation of capital.
Under a licensing agreement between Citigroup and Legg Mason, the names of funds, the names of any classes of shares of funds, and the names of investment managers of funds, as well as all logos, trademarks and service marks related to Citigroup or any of its affiliates (“Citi Marks”) are licensed for use by Legg Mason. Citi Marks include, but are not limited to, “Smith Barney,” “Salomon Brothers,” “Citi” and “Citigroup Asset Management”. Legg Mason and its affiliates, as well as the Fund’s investment manager, are not affiliated with Citigroup.
All Citi Marks are owned by Citigroup, and are licensed for use until no later than one year after the date of the licensing agreement.
Letter from the Chairman

R. JAY GERKEN, CFA
Chairman, President and Chief Executive Officer
Dear Shareholder,
Despite numerous obstacles, including rising short-term interest rates, surging oil prices, a destructive hurricane season, and geopolitical issues, the U.S. economy continued to expand during the reporting period. After a 3.3% advance in the second quarter of 2005, gross domestic product (“GDP”)i growth was 4.1% in the third quarter. However, there were mixed economic signals in the fourth quarter. While the Labor Department announced that the unemployment rate fell to 4.7% in December, its lowest level in four years, fourth quarter GDP growth was 1.6%, lower than expected.
Given the overall strength of the economy and inflationary pressures, the Federal Reserve Board (“Fed”)ii continued to raise interest rates throughout the period. After raising rates nine times from June 2004 through July 2005, the Fed increased its target for the federal funds rateiii in 0.25% increments five additional times over the reporting period. This represents the longest sustained Fed tightening cycle since the 1970s. All told, the Fed’s fourteen rate hikes have brought the target for the federal funds rate from 1.00% to 4.50%.
Given the Fed’s actions and high oil prices fueling inflationary concerns, both short- and long-term yields rose over the reporting period. During the six months ended January 31, 2006, two-year Treasury yields rose from 4.04% to 4.54%. Over the same period, 10-year Treasury yields moved from 4.32% to 4.53%. At the end of the reporting period, the yield curve was slightly inverted, as the yield on two-year Treasuries surpassed that of 10-year Treasuries. This anomaly has historically foreshadowed an economic slowdown or recession. Looking at the six-month period as a whole, the overall bond market, as measured by the Lehman Brothers Aggregate Bond Indexiv returned 0.84%.
The high yield market generated a modest gain during the reporting period. While corporate balance sheets continued
Smith Barney Core Plus Bond Fund Inc. I
to strengthen and corporate profits were strong, these positive developments took a back seat to the highly publicized downgrades of General Motors Corporation and Ford Motor Company. During the six-month period ended January 31, 2006, the Citigroup High Yield Market Indexv returned 1.37%.
Emerging markets debt continued to produce strong results over the reporting period, as the JPMorgan Emerging Markets Bond Index Global (“EMBI Global”)vi returned 6.87%. Many emerging market countries have improved their balance sheets in recent years. In addition, strong domestic demand and high energy and commodity prices supported many emerging market countries. This more than offset the potential negatives associated with rising U.S. interest rates.
Performance Review
For the six months ended January 31, 2006, Class A shares of the Smith Barney Core Plus Bond Fund Inc., excluding sales charges, returned 0.53%. The Fund’s unmanaged benchmark, the Lehman Brothers Aggregate Bond Index, returned 0.84%, while its former benchmark, the Lehman Brothers Government Bond Indexvii returned 0.77% for the same period. These shares underperformed the Lipper
| | | | |
| Performance Snapshot as of January 31, 2006 (excluding sales charges) (unaudited) |
| | |
| | | 6 months | | |
Core Plus Bond Fund — Class A Shares | | 0.53% | | |
|
Lehman Brothers Aggregate Bond Index | | 0.84% | | |
|
Lehman Brothers Government Bond Index | | 0.77% | | |
|
Lipper Intermediate Investment Grade Debt Funds Category Average | | 0.63% | | |
|
| The performance shown represents past performance. Past performance is no guarantee of future results and current performance may be higher or lower than the performance shown above. Principal value and investment returns will fluctuate and investors’ shares, when redeemed, may be worth more or less than their original cost. To obtain performance data current to the most recent month-end, please visit our website at www.citigroupam.com. |
| All share class returns assume the reinvestment of all distributions, including returns of capital, if any, at net asset value and the deduction of all Fund expenses. Returns have not been adjusted to include sales charges that may apply when shares are purchased or the deduction of taxes that a shareholder would pay on Fund distributions. Excluding sales charges, Class B shares returned 0.24%, Class C shares returned 0.28% and Class Y shares returned 0.74% over the six months ended January 31, 2006. |
II Smith Barney Core Plus Bond Fund Inc.
Intermediate Investment Grade Debt Funds Category Average,1 which increased 0.63%.
Special Shareholder Notices
On December 1, 2005, Citigroup Inc. (“Citigroup”) completed the sale of substantially all of its asset management business, Citigroup Asset Management (“CAM”), to Legg Mason, Inc. (“Legg Mason”). As a result, the Fund’s investment adviser (the “Manager”), previously an indirect wholly-owned subsidiary of Citigroup, has become a wholly-owned subsidiary of Legg Mason. Completion of the sale caused the Fund’s existing investment advisory contract and sub-advisory contract to terminate. The Fund’s shareholders previously approved a new investment management contract between the Fund and the Manager and a new sub-advisory contract, which became effective on December 1, 2005.
Effective February 1, 2006, Detlev Schlichter and Andres Sanchez-Balcazar, investment officers of Citigroup Asset Management Limited (the “sub-adviser”), the sub-adviser for investments in non-U.S. dollar-denominated securities of non-U.S. issuers and currency transactions, will assume portfolio management responsibility for the Fund’s investments in these areas.
Mr. Schlichter and Mr. Sanchez-Balcazar are each a portfolio manager of Western Asset Management Company Limited (“Western Asset Limited”), which, like the sub-adviser and Smith Barney Fund Management LLC, the Fund’s investment manager, is a subsidiary of Legg Mason. Mr. Schlichter joined Western Asset Limited in 2001 and has 16 years of investment experience. Mr. Sanchez-Balcazar joined Western Asset Limited in 2005 and has nine years of investment experience.
Effective February 10, 2006, the Manager has appointed the following individuals to assume the day-to-day portfolio management responsibilities for the Fund: S. Kenneth Leech, Stephen A. Walsh, Carl L. Eichstaedt, Edward A. Moody and Mark Lindbloom.
| 1 | | Lipper, Inc. is a major independent mutual-fund tracking organization. Returns are based on the 6-month period ended January 31, 2006, including the reinvestment of distributions, including returns of capital, if any, calculated among the 479 funds in the Fund’s Lipper category, and excluding sales charges. |
Smith Barney Core Plus Bond Fund Inc. III
Each of the new portfolio managers is a portfolio manager of Western Asset Management Company (“Western Asset”), which, like the Manager, is a subsidiary of Legg Mason.
The Fund will be managed by a team of portfolio managers, sector specialists and other investment professionals. The portfolio managers lead the team, and their focus is on portfolio structure, including sector allocation, duration weighting and term structure decisions.
Messers Leech, Walsh, Eichstaedt and Moody have been employed by Western Asset for more than five years. Mr. Lindbloom joined Western Asset in 2006.
Effective April 7, 2006, the Smith Barney Core Plus Bond Fund Inc. will be renamed Legg Mason Partners Core Plus Bond Fund Inc.
Information About Your Fund
As you may be aware, several issues in the mutual fund industry have recently come under the scrutiny of federal and state regulators. The Fund’s Manager and some of its affiliates have received requests for information from various government regulators regarding market timing, late trading, fees, and other mutual fund issues in connection with various investigations. The regulators appear to be examining, among other things, the Fund’s response to market timing and shareholder exchange activity, including compliance with prospectus disclosure related to these subjects. The Fund has been informed that the Manager and its affiliates are responding to those information requests, but are not in a position to predict the outcome of these requests and investigations.
Important information concerning the Fund and its Manager with regard to recent regulatory developments is contained in Notes to Financial Statements included in this report.
IV Smith Barney Core Plus Bond Fund Inc.
As always, thank you for your confidence in our stewardship of your assets. We look forward to helping you continue to meet your financial goals.
Sincerely,

R. Jay Gerken, CFA
President, Chairman and Chief Executive Officer
February 22, 2006
The information provided is not intended to be a forecast of future events, a guarantee of future results or investment advice. Views expressed may differ from those of the firm as a whole.
RISKS: Interest rate increases, causing the prices of fixed income securities to decline, would reduce the value of the Fund’s share price. Investments in high yield securities and in foreign companies and governments, including emerging markets, involve risks beyond those inherent solely in higher-rated and domestic investments. The risks of high yield securities include, but are not limited to, price volatility and the possibility of default in the timely payment of interest and principal. Foreign securities are subject to certain risks of overseas investing including currency fluctuations and changes in political and economic conditions, which could result in significant market fluctuations. These risks are magnified in emerging markets. The Fund may use derivatives, such as options and futures, which can be illiquid, may disproportionately increase losses, and have a potentially large impact on Fund performance. Please see the Fund’s prospectus for more information on these and other risks.
All index performance reflects no deduction for fees, expenses or taxes. Please note an investor cannot invest directly in an index.
| i | | Gross domestic product is a market value of goods and services produced by labor and property in a given country. |
| ii | | The Federal Reserve Board is responsible for the formulation of a policy designed to promote economic growth, full employment, stable prices, and a sustainable pattern of international trade and payments. |
| iii | | The federal funds rate is the interest rate that banks with excess reserves at a Federal Reserve district bank charge other banks that need overnight loans. |
| iv | | The Lehman Brothers Aggregate Bond Index is a broad-based bond index comprised of Government, Corporate, Mortgage and Asset-backed issues, rated investment grade or higher, and having at least one year to maturity. |
| v | | The Citigroup High Yield Market Index is a broad-based unmanaged index of high yield securities. |
| vi | | JPMorgan Emerging Markets Bond Index Global (“EMBI Global”) tracks total returns for U.S. dollar denominated debt instruments issued by emerging market sovereign and quasi-sovereign entities: Brady bonds, loans, Eurobonds, and local market instruments. Countries covered are Algeria, Argentina, Brazil, Bulgaria, Chile, China, Colombia, Cote d’Ivoire, Croatia, Ecuador, Greece, Hungary, Lebanon, Malaysia, Mexico, Morocco, Nigeria, Panama, Peru, the Philippines, Poland, Russia, South Africa, South Korea, Thailand, Turkey and Venezuela. |
| vii | | The Lehman Brothers Government Bond Index is a broad-based index of all public debt obligations of the U.S. government and its agencies that have an average maturity of roughly nine years. |
Smith Barney Core Plus Bond Fund Inc. V
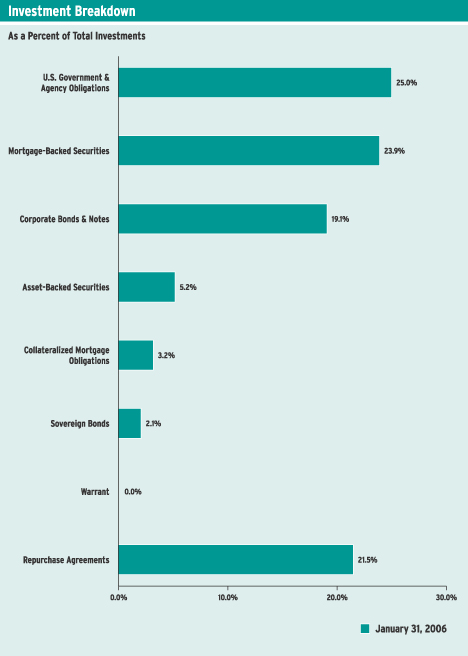
Fund at a Glance (unaudited)
Smith Barney Core Plus Bond Fund Inc. 2006 Semi-Annual Report 1
Fund Expenses (unaudited)
Example
As a shareholder of the Fund, you may incur two types of costs: (1) transaction costs, including front-end and back-end sales charges (loads) on purchase payments and (2) ongoing costs, including management fees; distribution and/or service (12b-1) fees; and other Fund expenses. This example is intended to help you understand your ongoing costs (in dollars) of investing in the Fund and to compare these costs with the ongoing costs of investing in other mutual funds.
This example is based on an investment of $1,000 invested on August 1, 2005 and held for the six months ended January 31, 2006.
Actual Expenses
The table below titled “Based on Actual Total Return” provides information about actual account values and actual expenses. You may use the information provided in this table, together with the amount you invested, to estimate the expenses that you paid over the period. To estimate the expenses you paid on your account, divide your ending account value by $1,000 (for example, an $8,600 ending account value divided by $1,000 = 8.6), then multiply the result by the number under the heading entitled “Expenses Paid During the Period”.
| | | | | | | | | | | | | | | |
| Based on Actual Total Return(1) | | | | | | |
| | | | | |
| | | Actual Total Return Without Sales Charges(2) | | | Beginning
Account
Value | | Ending
Account
Value | | Annualized
Expense
Ratio | | | Expenses Paid During the Period(3) |
Class A | | 0.53 | % | | $ | 1,000.00 | | $ | 1,005.30 | | 1.07 | % | | $ | 5.41 |
|
Class B | | 0.24 | | | | 1,000.00 | | | 1,002.40 | | 1.65 | | | | 8.33 |
|
Class C | | 0.28 | | | | 1,000.00 | | | 1,002.80 | | 1.56 | | | | 7.88 |
|
Class Y | | 0.74 | | | | 1,000.00 | | | 1,007.40 | | 0.66 | | | | 3.34 |
|
| (1) | | For the six months ended January 31, 2006. |
| (2) | | Assumes reinvestment of all distributions, including returns of capital, if any, at net asset value and does not reflect the deduction of the applicable sales charge with respect to Class A shares or the applicable contingent deferred sales charges (“CDSC”) with respect to Class B and C shares. Total return is not annualized, as it may not be representative of the total return for the year. Performance figures may reflect voluntary fee waivers and/or expense reimbursements. Past performance is no guarantee of future results. In the absence of voluntary fee waivers and/or expense reimbursements, the total return would have been lower. |
| (3) | | Expenses are equal to each class’ respective annualized expense ratio multiplied by the average account value over the period, multiplied by the number of days in the most recent fiscal half-year, then divided by 365. |
2 Smith Barney Core Plus Bond Fund Inc. 2006 Semi-Annual Report
Fund Expenses (unaudited) (continued)
Hypothetical Example for Comparison Purposes
The table below titled “Based on Hypothetical Total Return” provides information about hypothetical account values and hypothetical expenses based on the actual expense ratio and an assumed rate of return of 5.00% per year before expenses, which is not the Fund’s actual return. The hypothetical account values and expenses may not be used to estimate the actual ending account balance or expenses you paid for the period. You may use the information provided in this table to compare the ongoing costs of investing in the Fund and other funds. To do so, compare the 5.00% hypothetical example relating to the Fund with the 5.00% hypothetical examples that appear in the shareholder reports of the other funds.
Please note that the expenses shown in the table below are meant to highlight your ongoing costs only and do not reflect any transactional costs, such as front-end or back-end sales charges (loads). Therefore, the table is useful in comparing ongoing costs only, and will not help you determine the relative total costs of owning different funds. In addition, if these transaction costs were included, your costs would have been higher.
| | | | | | | | | | | | | | | |
| Based on Hypothetical Total Return(1) | | | | | | |
| | | | | |
| | | Hypothetical
Annualized
Total Return | | | Beginning
Account
Value | | Ending
Account
Value | | Annualized
Expense
Ratio | | | Expenses Paid During the Period(2) |
Class A | | 5.00 | % | | $ | 1,000.00 | | $ | 1,019.81 | | 1.07 | % | | $ | 5.45 |
|
Class B | | 5.00 | | | | 1,000.00 | | | 1,016.89 | | 1.65 | | | | 8.39 |
|
Class C | | 5.00 | | | | 1,000.00 | | | 1,017.34 | | 1.56 | | | | 7.93 |
|
Class Y | | 5.00 | | | | 1,000.00 | | | 1,021.88 | | 0.66 | | | | 3.36 |
|
| (1) | | For the six months ended January 31, 2006. |
| (2) | | Expenses are equal to each class’ respective annualized expense ratio multiplied by the average account value over the period, multiplied by the number of days in the most recent fiscal half-year, then divided by 365. |
Smith Barney Core Plus Bond Fund Inc. 2006 Semi-Annual Report 3
Schedule of Investments (January 31, 2006) (unaudited)
SMITH BARNEY CORE PLUS BOND FUND INC.
| | | | | | | | |
| | | |
Face
Amount† | | Rating‡ | | Security | | Value | |
| | | | | | | | | |
| CORPORATE BONDS & NOTES — 23.6% | |
| Aerospace & Defense — 0.4% | |
| 250,000 | | B | | DRS Technologies Inc., Senior Subordinated Notes, 6.875% due 11/1/13 | | $ | 249,375 | |
| 2,990,000 | | BBB- | | Goodrich Corp., Notes, 7.500% due 4/15/08 | | | 3,130,198 | |
| | | | | L-3 Communications Corp., Senior Subordinated Notes: | | | | |
| 100,000 | | BB+ | | 7.625% due 6/15/12 | | | 105,250 | |
| 275,000 | | BB+ | | Series B, 6.375% due 10/15/15 | | | 275,000 | |
| 125,000 | | B+ | | Moog Inc., Senior Subordinated Notes, 6.250% due 1/15/15 | | | 123,438 | |
| | | | | Sequa Corp., Senior Notes: | | | | |
| 175,000 | | BB- | | 9.000% due 8/1/09 | | | 190,750 | |
| 175,000 | | BB- | | Series B, 8.875% due 4/1/08 | | | 186,375 | |
|
|
| | | | | Total Aerospace & Defense | | | 4,260,386 | |
|
|
| Auto Components — 0.0% | |
| 121,000 | | B- | | Dura Operating Corp., Senior Unsecured Notes, Series B, 8.625% due 4/15/12 | | | 99,825 | |
| 50,000 | | B- | | Keystone Automotive Operations Inc., Senior Subordinated Notes, 9.750% due 11/1/13 | | | 43,500 | |
| 100,000 | | BB- | | TRW Automotive Inc., Senior Subordinated Notes, 9.375% due 2/15/13 | | | 109,250 | |
|
|
| | | | | Total Auto Components | | | 252,575 | |
|
|
| Automobiles — 0.6% | |
| 4,350,000 | | BBB | | DaimlerChrysler North America Holding Corp., 4.050% due 6/4/08 | | | 4,230,971 | |
| | | | | Ford Motor Co.: | | | | |
| | | | | Debentures: | | | | |
| 25,000 | | BB- | | 6.625% due 10/1/28 | | | 17,375 | |
| 30,000 | | BB- | | 8.900% due 1/15/32 | | | 23,400 | |
| 950,000 | | BB- | | Notes, 7.450% due 7/16/31 | | | 705,375 | |
| 500,000 | | BB- | | Senior Notes, 4.950% due 1/15/08 | | | 461,409 | |
| | | | | General Motors Corp., Senior Debentures: | | | | |
| 50,000 | | B | | 8.250% due 7/15/23 | | | 36,750 | |
| 265,000 | | B | | 8.375% due 7/15/33 | | | 197,425 | |
|
|
| | | | | Total Automobiles | | | 5,672,705 | |
|
|
| Beverages — 0.0% | |
| 100,000 | | B+ | | Constellation Brands Inc., Senior Subordinated Notes, Series B, 8.125% due 1/15/12 | | | 105,250 | |
|
|
| Building Products — 0.0% | |
| 125,000 | | CCC | | Associated Materials Inc., Senior Subordinated Notes, 9.750% due 4/15/12 | | | 121,875 | |
| 125,000 | | CCC+ | | Nortek Inc., Senior Subordinated Notes, 8.500% due 9/1/14 | | | 122,188 | |
|
|
| | | | | Total Building Products | | | 244,063 | |
|
|
See Notes to Financial Statements.
4 Smith Barney Core Plus Bond Fund Inc. 2006 Semi-Annual Report
Schedule of Investments (January 31, 2006) (unaudited) (continued)
| | | | | | | | |
| | | |
Face
Amount† | | Rating‡ | | Security | | Value | |
| | | | | | | | | |
| Capital Markets — 1.3% | |
| 125,000 | | B- | | BCP Crystal U.S. Holdings Corp., Senior Subordinated Notes, 9.625% due 6/15/14 | | $ | 139,375 | |
| 5,225,000 | | A+ | | Lehman Brothers Holdings Inc., Medium-Term Notes, Series H, 4.500% due 7/26/10 | | | 5,102,761 | |
| 6,800,000 | | A | | Morgan Stanley, Subordinated Notes, 4.750% due 4/1/14 | | | 6,481,475 | |
| 250,000 | | BB+ | | Morgan Stanley Bank AG for OAO Gazprom, Notes, 9.625% due 3/1/13 | | | 301,250 | |
|
|
| | | | | Total Capital Markets | | | 12,024,861 | |
|
|
| Chemicals — 0.2% | |
| 100,000 | | BB- | | Arco Chemical Co., Debentures, 9.800% due 2/1/20 | | | 112,250 | |
| 150,000 | | B- | | Borden U.S. Finance Corp./Nova Scotia Finance ULC, Second Priority Senior Secured Notes, 9.000% due 7/15/14 (a) | | | 153,000 | |
| 100,000 | | BB- | | Equistar Chemicals LP, Senior Notes, 10.625% due 5/1/11 | | | 110,500 | |
| 75,000 | | BB- | | Ethyl Corp., Senior Notes, 8.875% due 5/1/10 | | | 79,125 | |
| | | | | Huntsman International LLC: | | | | |
| 50,000 | | B | | Senior Notes, 9.875% due 3/1/09 | | | 52,750 | |
| 75,000 | | B | | Senior Subordinated Notes, 7.875% due 1/1/15 (a) | | | 76,312 | |
| 25,000 | | BB | | IMC Global Inc., Senior Notes, 10.875% due 8/1/13 | | | 28,875 | |
| 105,000 | | B+ | | ISP Chemco Inc., Senior Subordinated Notes, Series B,
10.250% due 7/1/11 | | | 112,875 | |
| 50,000 | | BB- | | Lyondell Chemical Co., Senior Secured Notes, 11.125% due 7/15/12 | | | 56,375 | |
| 50,000 | | B- | | Nalco Co., Senior Subordinated Notes, 8.875% due 11/15/13 | | | 52,500 | |
| 175,000 | | BB+ | | NOVA Chemicals Corp., Senior Notes, 6.500% due 1/15/12 | | | 168,875 | |
| 50,000 | | B- | | OM Group Inc., Senior Subordinated Notes, 9.250% due 12/15/11 | | | 50,250 | |
| 250,000 | | B- | | PQ Corp., 7.500% due 2/15/13 (a) | | | 236,875 | |
| 100,000 | | B- | | Resolution Performance Products LLC, Senior Subordinated Notes, 13.500% due 11/15/10 | | | 107,250 | |
| 125,000 | | CCC+ | | Rhodia SA, Senior Notes, 7.625% due 6/1/10 | | | 126,250 | |
| 200,000 | | BB- | | Westlake Chemical Corp., Senior Notes, 8.750% due 7/15/11 | | | 219,500 | |
|
|
| | | | | Total Chemicals | | | 1,743,562 | |
|
|
| Commercial Banks — 2.0% | | | | |
| 5,500,000 | | A+ | | Bank of America Corp., Subordinated Notes, 7.400% due 1/15/11 | | | 6,038,296 | |
| 6,800,000 | | BBB+ | | HSBC Finance Capital Trust IX, 5.911% due 11/30/35 (b) | | | 6,827,996 | |
| 4,975,000 | | A- | | Standard Chartered Bank PLC, Subordinated Notes, 8.000% due 5/30/31 (a) | | | 6,327,299 | |
|
|
| | | | | Total Commercial Banks | | | 19,193,591 | |
|
|
| Commercial Services & Supplies — 0.1% | | | | |
| | | | | Allied Waste North America Inc., Senior Notes: | | | | |
| 150,000 | | BB- | | 7.875% due 4/15/13 | | | 156,375 | |
| 200,000 | | BB- | | 7.250% due 3/15/15 | | | 203,000 | |
| 100,000 | | B- | | Cardtronics Inc., Senior Subordinated Notes, 9.250% due 8/15/13 (a) | | | 100,750 | |
See Notes to Financial Statements.
Smith Barney Core Plus Bond Fund Inc. 2006 Semi-Annual Report 5
Schedule of Investments (January 31, 2006) (unaudited) (continued)
| | | | | | | | |
| | | |
Face
Amount† | | Rating‡ | | Security | | Value | |
| | | | | | | | | |
| Commercial Services & Supplies — 0.1% (continued) | | | | |
| 125,000 | | B+ | | Cenveo Corp., Senior Notes, 9.625% due 3/15/12 | | $ | 134,688 | |
| 200,000 | | BB- | | Corrections Corporation of America, Senior Subordinated Notes, 6.250% due 3/15/13 | | | 198,000 | |
|
|
| | | | | Total Commercial Services & Supplies | | | 792,813 | |
|
|
| Communications Equipment — 0.1% | | | | |
| 550,000 | | B | | Lucent Technologies Inc., Debentures, 6.450% due 3/15/29 | | | 464,750 | |
|
|
| Computers & Peripherals — 0.0% | | | | |
| 50,000 | | B- | | SunGard Data Systems Inc., Senior Notes, 9.125% due 8/15/13 (a) | | | 52,250 | |
|
|
| Construction Materials — 0.0% | | | | |
| 75,000 | | BB- | | Texas Industries Inc., Senior Notes, 7.250% due 7/15/13 | | | 77,813 | |
|
|
| Consumer Finance — 0.4% | | | | |
| | | | | MBNA Corp.: | | | | |
| 3,150,000 | | AA- | | Medium-Term Notes, 6.250% due 1/17/07 | | | 3,188,968 | |
| 750,000 | | AA- | | Notes, 4.625% due 9/15/08 | | | 744,091 | |
|
|
| | | | | Total Consumer Finance | | | 3,933,059 | |
|
|
| Containers & Packaging — 0.1% | | | | |
| 100,000 | | B- | | Berry Plastics Corp., Senior Subordinated Notes, 10.750% due 7/15/12 | | | 109,000 | |
| | | | | Graphic Packaging International Corp.: | | | | |
| 50,000 | | B- | | Senior Notes, 8.500% due 8/15/11 | | | 50,250 | |
| 175,000 | | B- | | Senior Subordinated Notes, 9.500% due 8/15/13 | | | 165,375 | |
| 401,000 | | CCC+ | | Jefferson Smurfit Corp., Senior Notes, 8.250% due 10/1/12 | | | 382,955 | |
| 125,000 | | B- | | JSG Funding PLC, Senior Notes, 9.625% due 10/1/12 | | | 129,687 | |
| | | | | Owens-Brockway Glass Container Inc., Senior Notes: | | | | |
| 150,000 | | B | | 8.250% due 5/15/13 | | | 158,625 | |
| 50,000 | | B | | 6.750% due 12/1/14 | | | 48,625 | |
| 25,000 | | B | | Owens-Illinois Inc., Debentures, 7.500% due 5/15/10 | | | 25,500 | |
| 100,000 | | CCC+ | | Smurfit-Stone Container Enterprises Inc., Senior Notes, 8.375% due 7/1/12 | | | 96,250 | |
|
|
| | | | | Total Containers & Packaging | | | 1,166,267 | |
|
|
| Diversified Financial Services — 6.0% | |
| 400,000 | | CCC+ | | Alamosa Delaware Inc., Senior Notes, 11.000% due 7/31/10 | | | 450,000 | |
| 3,225,000 | | BBB | | Capital One Bank, Notes, 5.750% due 9/15/10 | | | 3,294,167 | |
| 100,000 | | B- | | CCM Merger Inc., Notes, 8.000% due 8/1/13 (a) | | | 98,000 | |
| 5,725,000 | | A | | CIT Group Inc., Senior Notes, 7.750% due 4/2/12 (c) | | | 6,447,821 | |
| 6,925,000 | | A | | Countrywide Home Loans Inc., Unsubordinated Medium-Term Notes, Series L, 4.000% due 3/22/11 | | | 6,501,792 | |
| 4,175,000 | | A- | | EnCana Holdings Finance Corp., Notes, 5.800% due 5/1/14 | | | 4,317,088 | |
| | | | | Ford Motor Credit Co., Notes: | | | | |
| 50,000 | | BB- | | 6.625% due 6/16/08 | | | 47,074 | |
| 4,875,000 | | BB- | | 7.875% due 6/15/10 | | | 4,591,397 | |
See Notes to Financial Statements.
6 Smith Barney Core Plus Bond Fund Inc. 2006 Semi-Annual Report
Schedule of Investments (January 31, 2006) (unaudited) (continued)
| | | | | | | | |
| | | |
Face
Amount† | | | Rating‡ | | Security | | Value |
| Diversified Financial Services — 6.0% (continued) |
| | | | | | General Motors Acceptance Corp.: | | | |
| 540,000 | | | BB | | Bonds, 8.000% due 11/1/31 | | $ | 552,115 |
| | | | | | Notes: | | | |
| 45,000 | | | BB | | 7.250% due 3/2/11 | | | 43,461 |
| 3,575,000 | | | BB | | 6.875% due 9/15/11 | | | 3,417,049 |
| 210,000 | | | BB | | 6.750% due 12/1/14 | | | 199,349 |
| 162,000 | | | B- | | Global Cash Access LLC/Global Cash Finance Corp., Senior Subordinated Notes, 8.750% due 3/15/12 | | | 174,150 |
| 6,325,000 | | | AA- | | International Lease Finance Corp., Notes, 5.875% due 5/1/13 | | | 6,495,889 |
| 4,350,000 | | | A- | | John Deere Capital Corp., Medium-Term Notes, Series D, 4.125% due 1/15/10 | | | 4,210,148 |
| 6,050,000 | | | A | | JPMorgan Chase & Co., Subordinated Notes, 6.625% due 3/15/12 | | | 6,490,246 |
| 100,000 | | | B- | | Nell AF SARL, Senior Notes, 8.375% due 8/15/15 (a) | | | 100,375 |
| 250,000 | | | BB | | Omega Healthcare Investors Inc., 7.000% due 1/15/16 (a) | | | 252,500 |
| 9,109,755 | | | BB- | | Targeted Return Index Securities (TRAINS), Secured Notes, Series HY-2005-1, 7.562% due 6/15/15 (a)(b) | | | 9,307,091 |
| 150,000 | | | CCC+ | | Vanguard Health Holdings Co. I LLC,
Senior Discount Notes, step bond to yield 9.885% due 10/1/15 | | | 110,250 |
| 75,000 | | | CCC+ | | Vanguard Health Holding Co. II LLC,
Senior Subordinated Notes, 9.000% due 10/1/14 | | | 79,500 |
|
| | | | | | Total Diversified Financial Services | | | 57,179,462 |
|
| Diversified Telecommunication Services — 1.4% |
| 150,000 | | | A | | AT&T Corp., Senior Notes, 9.750% due 11/15/31 | | | 186,028 |
| 350,000 | | | B | | Intelsat Ltd., Senior Discount Notes, step bond to yield 9.232% due 2/1/15 (a) | | | 232,750 |
| 425,000 | | | A | | MCI Inc., Senior Notes, 8.735% due 5/1/14 | | | 480,250 |
| 300,000 | | | B- | | NTL Cable PLC, Senior Notes, 8.750% due 4/15/14 | | | 309,000 |
| 50,000 | | | B+ | | PanAmSat Corp., Senior Notes, 9.000% due 8/15/14 | | | 52,812 |
| | | | | | Qwest Corp.: | | | |
| 200,000 | | | BB | | Debentures, 6.875% due 9/15/33 | | | 185,500 |
| 550,000 | | | BB | | Notes, 8.875% due 3/15/12 | | | 611,875 |
| 4,500,000 | | | BBB+ | | Telecom Italia Capital SA, 5.250% due 10/1/15 | | | 4,323,663 |
| 2,000,000 | MXN | | BBB+ | | Telefonos de Mexico S.A. de C.V., 8.750% due 1/31/16 | | | 189,812 |
| 6,305,000 | | | A | | Verizon Florida Inc., Senior Unsecured Notes, Series F, 6.125% due 1/15/13 | | | 6,365,383 |
|
| | | | | | Total Diversified Telecommunication Services | | | 12,937,073 |
|
| Electric Utilities — 1.0% |
| 100,000 | | | BB- | | Allegheny Energy Supply Co. LLC, 8.250% due 4/15/12 (a) | | | 111,500 |
| 3,625,000 | | | BBB | | Appalachian Power Co., Bonds, Series H, 5.950% due 5/15/33 | | | 3,575,997 |
| 200,000 | | | B+ | | Edison Mission Energy, Senior Notes, 9.875% due 4/15/11 | | | 233,000 |
| 4,679,000 | | | A | | Florida Power & Light Co., First Mortgage Bonds, 5.625% due 4/1/34 | | | 4,655,020 |
| 250,000 | | | B | | Inergy L.P./Inergy Finance Corp., 6.875% due 12/15/14 | | | 236,875 |
| 375,000 | | | B+ | | Reliant Energy Inc., Senior Secured Notes, 9.500% due 7/15/13 | | | 373,125 |
See Notes to Financial Statements.
Smith Barney Core Plus Bond Fund Inc. 2006 Semi-Annual Report 7
Schedule of Investments (January 31, 2006) (unaudited) (continued)
| | | | | | | |
| | | |
Face
Amount† | | Rating‡ | | Security | | Value |
| Electric Utilities — 1.0% (continued) |
| 175,000 | | B | | Texas Genco LLC/Texas Genco Financing Corp., Senior Notes,
6.875% due 12/15/14 (a) | | $ | 190,313 |
|
| | | | | Total Electric Utilities | | | 9,375,830 |
|
| Energy Equipment & Services — 0.1% | | | |
| 88,000 | | B- | | Dresser-Rand Group Inc., Senior Subordinated Notes,
7.625% due 11/1/14 (a) | | | 91,520 |
| 25,000 | | BB | | Grant Prideco Inc., Senior Unsecured Notes, 6.125% due 8/15/15 (a) | | | 25,313 |
| 125,000 | | B | | Hanover Compressor Co., Senior Notes, 8.625% due 12/15/10 | | | 133,437 |
| 125,000 | | B- | | Targa Resources Inc., Senior Notes, 8.500% due 11/1/13 (a) | | | 130,625 |
| 125,000 | | B | | Universal Compression Inc., Senior Notes, 7.250% due 5/15/10 | | | 129,375 |
|
| | | | | Total Energy Equipment & Services | | | 510,270 |
|
| Food & Staples Retailing — 0.4% | | | |
| 175,000 | | B- | | Jean Coutu Group Inc., Senior Subordinated Notes, 8.500% due 8/1/14 | | | 167,562 |
| | | | | Rite Aid Corp.: | | | |
| | | | | Notes: | | | |
| 50,000 | | B- | | 7.125% due 1/15/07 | | | 50,375 |
| 25,000 | | B- | | 6.125% due 12/15/08 (a) | | | 24,000 |
| 50,000 | | B+ | | Senior Secured Notes, 7.500% due 1/15/15 | | | 48,125 |
| 75,000 | | B+ | | Senior Secured Second Lien Notes, 8.125% due 5/1/10 | | | 76,875 |
| 2,825,000 | | BBB- | | Safeway Inc., Senior Debentures, 7.250% due 2/1/31 | | | 3,057,433 |
|
| | | | | Total Food & Staples Retailing | | | 3,424,370 |
|
| Food Products — 0.6% | | | |
| 200,000 | | B | | Del Monte Corp., Senior Subordinated Notes, 8.625% due 12/15/12 | | | 213,000 |
| 125,000 | | B- | | Doane Pet Care Co., Senior Notes, 10.750% due 3/1/10 | | | 135,625 |
| 225,000 | | B+ | | Dole Food Co. Inc., Debentures, 8.750% due 7/15/13 | | | 228,094 |
| 5,475,000 | | BBB+ | | Kraft Foods Inc., Senior Notes, 5.625% due 11/1/11 | | | 5,552,175 |
|
| | | | | Total Food Products | | | 6,128,894 |
|
| Health Care Providers & Services — 1.1% | | | |
| 125,000 | | B | | Community Health Systems Inc., Senior Subordinated Notes,
6.500% due 12/15/12 | | | 123,125 |
| 225,000 | | B | | DaVita Inc., Senior Subordinated Notes, 7.250% due 3/15/15 | | | 227,531 |
| | | | | Extendicare Health Services Inc., Senior Subordinated Notes: | | | |
| 75,000 | | B+ | | 9.500% due 7/1/10 | | | 79,969 |
| 75,000 | | B | | 6.875% due 5/1/14 | | | 73,688 |
| | | | | HCA Inc.: | | | |
| 75,000 | | BB+ | | 7.500% due 12/15/23 | | | 75,467 |
| 225,000 | | BB+ | | Debentures, 7.050% due 12/1/27 | | | 213,324 |
| | | | | Notes: | | | |
| 100,000 | | BB+ | | 6.375% due 1/15/15 | | | 100,334 |
| 25,000 | | BB+ | | 7.690% due 6/15/25 | | | 25,587 |
| 4,125,000 | | BBB | | Humana Inc., Senior Notes, 6.300% due 8/1/18 | | | 4,323,351 |
| 200,000 | | B- | | IASIS Healthcare LLC/IASIS Capital Corp., Senior Subordinated Notes, 8.750% due 6/15/14 | | | 205,750 |
See Notes to Financial Statements.
8 Smith Barney Core Plus Bond Fund Inc. 2006 Semi-Annual Report
Schedule of Investments (January 31, 2006) (unaudited) (continued)
| | | | | | | |
| | | |
Face
Amount† | | Rating‡ | | Security | | Value |
| Health Care Providers & Services — 1.1% (continued) | | | |
| 100,000 | | B | | InSight Health Services Corp., Senior Subordinated Notes,
9.174% due 11/1/11 (b) | | $ | 93,500 |
| 150,000 | | B- | | Psychiatric Solutions Inc., Senior Subordinated Notes,
7.750% due 7/15/15 | | | 156,000 |
| 4,425,000 | | BBB+ | | Quest Diagnostics Inc., 5.450% due 11/1/15 (a) | | | 4,419,632 |
| 175,000 | | B | | Tenet Healthcare Corp., Senior Notes, 9.875% due 7/1/14 | | | 175,875 |
| 300,000 | | B+ | | Triad Hospitals Inc., Senior Subordinated Notes, 7.000% due 11/15/13 | | | 304,125 |
|
| | | | | Total Health Care Providers & Services | | | 10,597,258 |
|
| Hotels, Restaurants & Leisure — 0.4% | | | |
| | | | | Boyd Gaming Corp., Senior Subordinated Notes: | | | |
| 100,000 | | B+ | | 7.750% due 12/15/12 | | | 104,750 |
| 100,000 | | B+ | | 6.750% due 4/15/14 | | | 98,750 |
| 400,000 | | BB+ | | Caesars Entertainment Inc., Senior Subordinated Notes, 8.125% due 5/15/11 | | | 443,000 |
| 100,000 | | B- | | Carrols Corp., Senior Subordinated Notes, 9.000% due 1/15/13 | | | 98,000 |
| 150,000 | | B- | | Cinemark Inc., Senior Discount Notes, step bond to yield 9.031% due 3/15/14 | | | 110,250 |
| 75,000 | | B- | | Equinox Holdings Inc., Senior Notes, 9.000% due 12/15/09 | | | 80,250 |
| | | | | Gaylord Entertainment Co., Senior Notes: | | | |
| 75,000 | | B- | | 8.000% due 11/15/13 | | | 78,375 |
| 100,000 | | B- | | 6.750% due 11/15/14 | | | 98,000 |
| 50,000 | | B- | | Herbst Gaming Inc., Senior Subordinated Notes, 7.000% due 11/15/14 | | | 50,125 |
| 275,000 | | BBB- | | Hilton Hotels Corp., Notes, 7.625% due 12/1/12 | | | 297,623 |
| 190,000 | | B | | Isle of Capri Casinos Inc., Senior Subordinated Notes, 7.000% due 3/1/14 | | | 187,387 |
| 175,000 | | B | | Kerzner International Ltd., Senior Subordinated Notes, 6.750% due 10/1/15 | | | 171,500 |
| 225,000 | | B | | Las Vegas Sands Corp., Senior Notes, 6.375% due 2/15/15 | | | 215,719 |
| | | | | MGM MIRAGE Inc., Senior Notes: | | | |
| 250,000 | | BB | | 6.750% due 9/1/12 | | | 255,625 |
| 125,000 | | BB | | 6.625% due 7/15/15 | | | 126,250 |
| 100,000 | | BB | | Mirage Resorts Inc., Debentures, 7.250% due 8/1/17 | | | 104,750 |
| 125,000 | | B+ | | Mohegan Tribal Gaming Authority, Senior Subordinated Notes, 6.875% due 2/15/15 | | | 127,344 |
| 150,000 | | B+ | | Penn National Gaming Inc., Senior Subordinated Notes, 6.750% due 3/1/15 | | | 150,375 |
| | | | | Pinnacle Entertainment Inc., Senior Subordinated Notes: | | | |
| 75,000 | | B- | | 8.250% due 3/15/12 | | | 78,000 |
| 50,000 | | B- | | 8.750% due 10/1/13 | | | 53,500 |
| 75,000 | | B- | | Riddell Bell Holdings Inc., Senior Subordinated Notes, 8.375% due 10/1/12 | | | 70,688 |
| 125,000 | | B+ | | Scientific Games Corp., Senior Subordinated Notes, 6.250% due 12/15/12 | | | 123,125 |
| 125,000 | | BB- | | Seneca Gaming Corp., Senior Notes, 7.250% due 5/1/12 (a) | | | 127,187 |
| 150,000 | | CCC | | Six Flags Inc., Senior Notes, 9.750% due 4/15/13 | | | 154,312 |
| 225,000 | | BB+ | | Starwood Hotels & Resorts Worldwide Inc., Senior Notes,
7.875% due 5/1/12 | | | 247,500 |
See Notes to Financial Statements.
Smith Barney Core Plus Bond Fund Inc. 2006 Semi-Annual Report 9
Schedule of Investments (January 31, 2006) (unaudited) (continued)
| | | | | | | |
| | | |
Face
Amount† | | Rating‡ | | Security | | Value |
| Hotels, Restaurants & Leisure — 0.4% (continued) | | | |
| 275,000 | | B+ | | Station Casinos Inc., Senior Subordinated Notes, 6.875% due 3/1/16 | | $ | 280,844 |
| 125,000 | | B+ | | Tunica-Biloxi Gaming Authority, Senior Notes, 9.000% due 11/15/15 (a) | | | 127,344 |
| 50,000 | | B+ | | Turning Stone Casino Resort Enterprise, Senior Notes, 9.125% due 12/15/10 (a) | | | 52,250 |
|
| | | | | Total Hotels, Restaurants & Leisure | | | 4,112,823 |
|
| Household Durables — 0.0% |
| 100,000 | | B- | | Norcraft Cos. LP/Norcraft Finance Corp., Senior Subordinated Notes, 9.000% due 11/1/11 | | | 103,625 |
| 75,000 | | B- | | Sealy Mattress Co., Senior Subordinated Notes, 8.250% due 6/15/14 | | | 77,813 |
|
| | | | | Total Household Durables | | | 181,438 |
|
| Household Products — 0.0% |
| 125,000 | | CCC+ | | Spectrum Brands Inc., Senior Subordinated Notes, 8.500% due 10/1/13 | | | 107,813 |
|
| Independent Power Producers & Energy Traders — 0.4% |
| | | | | AES Corp., Senior Notes: | | | |
| 275,000 | | B- | | 8.875% due 2/15/11 | | | 298,375 |
| 125,000 | | B- | | 7.750% due 3/1/14 | | | 132,500 |
| 300,000 | | D | | Calpine Corp., Second Priority Senior Secured Notes, 8.500% due 7/15/10 (a)(d) | | | 269,625 |
| 100,000 | | D | | Calpine Generating Co. LLC, Senior Secured Notes,
13.216% due 4/1/11 (d) | | | 106,750 |
| 1,500,000 | | BBB | | Duke Energy Corp., Senior Notes, 4.200% due 10/1/08 | | | 1,464,457 |
| 450,000 | | CCC+ | | Dynegy Holdings Inc., Senior Debentures, 7.625% due 10/15/26 | | | 436,500 |
| 175,000 | | B- | | Mirant North America LLC, Senior Notes, 7.375% due 12/31/13 (a) | | | 178,938 |
| | | | | NRG Energy Inc.: | | | |
| 315,000 | | B | | Second Priority Senior Secured Notes, 8.000% due 12/15/13 | | | 352,800 |
| | | | | Senior Notes: | | | |
| 85,000 | | B- | | 7.250% due 2/1/14 | | | 86,594 |
| 250,000 | | B- | | 7.375% due 2/1/16 | | | 255,625 |
|
| | | | | Total Independent Power Producers & Energy Traders | | | 3,582,164 |
|
| Industrial Conglomerates — 0.5% | | | |
| 75,000 | | B | | Blount Inc., Senior Subordinated Notes, 8.875% due 8/1/12 | | | 79,125 |
| 100,000 | | B- | | KI Holdings Inc., Senior Discount Notes, step bond to yield
10.284% due 11/15/14 | | | 67,500 |
| 100,000 | | B | | Koppers Inc., Senior Notes, 9.875% due 10/15/13 | | | 109,000 |
| 4,200,000 | | BBB+ | | Tyco International Group SA, 6.125% due 11/1/08 | | | 4,290,800 |
|
| | | | | Total Industrial Conglomerates | | | 4,546,425 |
|
| Internet & Catalog Retail — 0.0% | | | |
| 100,000 | | B- | | FTD Inc., Senior Unsecured Notes, 7.750% due 2/15/14 | | | 100,250 |
|
| IT Services — 0.0% | | | |
| 250,000 | | B | | Iron Mountain Inc., Senior Subordinated Notes, 8.625% due 4/1/13 | | | 261,875 |
| | | | | Unisys Corp., Senior Notes: | | | |
| 100,000 | | BB- | | 6.875% due 3/15/10 | | | 95,750 |
| 50,000 | | BB- | | 8.000% due 10/15/12 | | | 47,875 |
|
| | | | | Total IT Services | | | 405,500 |
|
See Notes to Financial Statements.
10 Smith Barney Core Plus Bond Fund Inc. 2006 Semi-Annual Report
Schedule of Investments (January 31, 2006) (unaudited) (continued)
| | | | | | | |
| | | |
Face
Amount† | | Rating‡ | | Security | | Value |
| Machinery — 0.0% | | | |
| 75,000 | | B- | | Mueller Group Inc., Senior Subordinated Notes, 10.000% due 5/1/12 | | $ | 79,875 |
| 296,000 | | B | | Terex Corp., Senior Subordinated Notes, 7.375% due 1/15/14 | | | 298,960 |
|
| | | | | Total Machinery | | | 378,835 |
|
| Media — 1.6% | | | |
| 75,000 | | CCC+ | | AMC Entertainment Inc., Senior Subordinated Notes,
11.000% due 2/1/16 (a) | | | 75,375 |
| 100,000 | | B | | Cadmus Communications Corp., Senior Subordinated Notes,
8.375% due 6/15/14 | | | 101,500 |
| 214,000 | | CCC- | | CCH I Holdings LLC, Senior Secured Notes, 11.000% due 10/1/15 (a) | | | 177,085 |
| 375,000 | | CCC- | | CCO Holdings LLC/CCO Holdings Capital Corp., Senior Notes,
8.750% due 11/15/13 (a) | | | 361,875 |
| 200,000 | | CCC- | | Charter Communications Holdings II LLC/Charter Communications Holdings II Capital Corp., Senior Notes, 10.250% due 9/15/10 | | | 197,750 |
| 175,000 | | B- | | Charter Communications Operating LLC, Second Lien Senior Notes,
8.375% due 4/30/14 (a) | | | 175,656 |
| 50,000 | | BB- | | Chukchansi Economic Development Authority, Senior Notes,
8.000% due 11/15/13 (a) | | | 51,750 |
| 3,725,000 | | BBB+ | | Comcast Cable Communications Holdings Inc., Notes, 8.375% due 3/15/13 | | | 4,269,487 |
| | | | | CSC Holdings Inc.: | | | |
| 125,000 | | B+ | | Senior Debentures, 7.625% due 7/15/18 | | | 120,000 |
| | | | | Senior Notes: | | | |
| 100,000 | | B+ | | 7.000% due 4/15/12 (a) | | | 96,000 |
| | | | | Series B: | | | |
| 125,000 | | B+ | | 8.125% due 7/15/09 | | | 127,500 |
| 250,000 | | B+ | | 7.625% due 4/1/11 | | | 251,562 |
| 350,000 | | B | | Dex Media Inc., Discount Notes, step bond to yield 7.913% due 11/15/13 | | | 290,500 |
| 81,000 | | BB- | | DIRECTV Holdings LLC/DIRECTV Financing Co. Inc., Senior Notes,
8.375% due 3/15/13 | | | 87,278 |
| 270,000 | | BB- | | DIRECTV Holdings LLC Finance, Senior Notes, 6.375% due 6/15/15 | | | 265,950 |
| | | | | EchoStar DBS Corp., Senior Notes: | | | |
| 475,000 | | BB- | | 6.625% due 10/1/14 | | | 463,125 |
| 15,000 | | BB- | | 7.125% due 2/1/16 (a) | | | 14,869 |
| 51,429 | | B- | | Emmis Communications Corp., Senior Notes, 10.366% due 6/15/12 (b) | | | 51,750 |
| 200,000 | | B | | Lamar Media Corp., Senior Subordinated Nates, 6.625% due 8/15/15 | | | 202,000 |
| 125,000 | | B- | | LIN Television Corp., Series B, 6.500% due 5/15/13 | | | 118,750 |
| 50,000 | | B | | LodgeNet Entertainment Corp., Senior Subordinated Debentures,
9.500% due 6/15/13 | | | 54,250 |
| | | | | Mediacom Broadband LLC: | | | |
| 125,000 | | B | | 8.500% due 10/15/15 (a) | | | 118,750 |
| 100,000 | | B | | Senior Notes, 11.000% due 7/15/13 | | | 108,000 |
| 3,325,000 | | BBB | | News America, Inc., Notes, 5.300% due 12/15/14 | | | 3,273,250 |
| 50,000 | | CCC+ | | Nexstar Finance Inc., Senior Subordinated Notes, 7.000% due 1/15/14 | | | 46,563 |
| | | | | R.H. Donnelley Corp.: | | | |
| | | | | Senior Discount Notes: | | | |
| 125,000 | | B+ | | Series A-1, 6.875% due 1/15/13 (a) | | | 115,000 |
| 200,000 | | B+ | | Series A-2, 6.875% due 1/15/13 (a) | | | 184,500 |
| 300,000 | | B+ | | Senior Notes, Series A-3, 8.875% due 1/15/16 (a) | | | 304,875 |
See Notes to Financial Statements.
Smith Barney Core Plus Bond Fund Inc. 2006 Semi-Annual Report 11
Schedule of Investments (January 31, 2006) (unaudited) (continued)
| | | | | | | |
| | | |
Face
Amount† | | Rating‡ | | Security | | Value |
| Media — 1.6% (continued) | | | |
| 50,000 | | BB+ | | Rogers Cable Inc., Senior Secured Notes, 6.250% due 6/15/13 | | $ | 49,625 |
| 125,000 | | B- | | Salem Communications Holding Corp., Series B, 9.000% due 7/1/11 | | | 132,656 |
| | | | | Sinclair Broadcast Group Inc., Senior Subordinated Notes: | | | |
| 125,000 | | B | | 8.750% due 12/15/11 | | | 130,781 |
| 125,000 | | B | | 8.000% due 3/15/12 | | | 127,187 |
| 2,875,000 | | BBB+ | | Time Warner Inc., Senior Notes, 7.625% due 4/15/31 | | | 3,203,253 |
| 50,000 | | CCC | | Vertis Inc., Senior Second Lien Secured Notes, 9.750% due 4/1/09 | | | 52,000 |
| 150,000 | | B+ | | Videotron Ltd., Senior Notes, 6.375% due 12/15/15 (a) | | | 149,250 |
| 100,000 | | B+ | | Yell Finance BV, Senior Notes, 10.750% due 8/1/11 | | | 108,125 |
|
| | | | | Total Media | | | 15,657,827 |
|
| Metals & Mining — 0.0% | | | |
| 50,000 | | B+ | | Aleris International Inc., Senior Secured Notes, 10.375% due 10/15/10 | | | 55,250 |
| 250,000 | | B | | Novelis Inc., Senior Notes, 7.500% due 2/15/15 (a) | | | 237,500 |
|
| | | | | Total Metals & Mining | | | 292,750 |
|
| Multiline Retail — 0.0% | | | |
| 100,000 | | B- | | Harry & David Operations, Senior Notes, 9.000% due 3/1/13 | | | 102,000 |
| 75,000 | | B- | | Neiman Marcus Group Inc., Senior Subordinated Notes,
10.375% due 10/15/15 (a) | | | 77,719 |
|
| | | | | Total Multiline Retail | | | 179,719 |
|
| Office Electronics — 0.0% | | | |
| 75,000 | | BB | | IKON Office Solutions Inc., Senior Notes, 7.750% due 9/15/15 (a) | | | 76,125 |
| 225,000 | | B- | | Xerox Capital Trust I, 8.000% due 2/1/27 | | | 233,156 |
|
| | | | | Total Office Electronics | | | 309,281 |
|
| Oil, Gas & Consumable Fuels — 1.7% | | | |
| 4,250,000 | | BBB+ | | Burlington Resources Finance Corp., Senior Notes, 5.600% due 12/1/06 | | | 4,270,621 |
| | | | | Chesapeake Energy Corp., Senior Notes: | | | |
| 125,000 | | BB | | 6.375% due 6/15/15 | | | 125,313 |
| 225,000 | | BB | | 6.625% due 1/15/16 | | | 228,375 |
| 100,000 | | BB | | 6.250% due 1/15/18 | | | 99,250 |
| 25,000 | | BB | | 6.875% due 11/15/20 (a) | | | 25,625 |
| 3,950,000 | | BBB | | Devon Financing Corp. ULC, 6.875% due 9/30/11 | | | 4,288,187 |
| | | | | El Paso Corp., Medium-Term Notes: | | | |
| 200,000 | | B- | | 7.800% due 8/1/31 | | | 211,000 |
| 225,000 | | B- | | 7.750% due 1/15/32 | | | 239,063 |
| 200,000 | | B | | EXCO Resources Inc., Senior Notes, 7.250% due 1/15/11 | | | 204,000 |
| 550,000 | | BB | | Gaz Capital SA, 8.625% due 4/28/34 | | | 697,840 |
| 150,000 | | B+ | | Holly Energy Partners, L.P., Senior Notes, 6.250% due 3/1/15 | | | 145,500 |
| 275,000 | | BB+ | | Kerr-McGee Corp., Senior Secured Notes, 7.000% due 11/1/11 | | | 275,687 |
| 100,000 | | BB- | | Massey Energy Co., Senior Notes, 6.625% due 11/15/10 | | | 102,000 |
| | | | | Pemex Project Funding Master Trust, Notes: | | | |
| 225,000 | | BBB | | 5.750% due 12/15/15 (a) | | | 222,694 |
| 100,000 | | BBB | | 6.625% due 6/15/35 (a) | | | 100,225 |
| 100,000 | | B+ | | Pogo Producing Co., Senior Subordinated Notes, 6.875% due 10/1/17 (a) | | | 100,500 |
See Notes to Financial Statements.
12 Smith Barney Core Plus Bond Fund Inc. 2006 Semi-Annual Report
Schedule of Investments (January 31, 2006) (unaudited) (continued)
| | | | | | | |
| | | |
Face
Amount† | | Rating‡ | | Security | | Value |
| Oil, Gas & Consumable Fuels — 1.7% (continued) | | | |
| | | | | Stone Energy Corp., Senior Subordinated Notes: | | | |
| 50,000 | | B- | | 8.250% due 12/15/11 | | $ | 51,750 |
| 50,000 | | B- | | 6.750% due 12/15/14 | | | 48,500 |
| 200,000 | | BB- | | Swift Energy Co., Senior Notes, 7.625% due 7/15/11 | | | 208,000 |
| 4,225,000 | | BBB- | | Valero Energy Corp., Notes, 4.750% due 6/15/13 | | | 4,075,245 |
| 100,000 | | B | | Vintage Petroleum Inc., Senior Subordinated Notes, 7.875% due 5/15/11 | | | 105,000 |
| | | | | Whiting Petroleum Corp.: | | | |
| 125,000 | | B- | | 7.250% due 5/1/13 | | | 127,656 |
| 100,000 | | B- | | Senior Subordinated Notes, 7.000% due 2/1/14 (a) | | | 101,000 |
| 350,000 | | B+ | | Williams Cos. Inc., Notes, 8.750% due 3/15/32 | | | 418,250 |
|
| | | | | Total Oil, Gas & Consumable Fuels | | | 16,471,281 |
|
| Paper & Forest Products — 0.1% |
| | | | | Abitibi-Consolidated Inc.: | | | |
| 125,000 | | B+ | | Debentures, 8.850% due 8/1/30 | | | 107,500 |
| 100,000 | | B+ | | Notes, 7.750% due 6/15/11 | | | 94,250 |
| 50,000 | | B+ | | Senior Notes, 8.375% due 4/1/15 | | | 47,250 |
| 125,000 | | BB- | | Appleton Papers Inc., Senior Notes, 8.125% due 6/15/11 | | | 124,062 |
| 300,000 | | B+ | | Boise Cascade, LLC, Senior Subordinated Notes, Series B, 7.125% due 10/15/14 | | | 278,250 |
| | | | | Buckeye Technologies Inc.: | | | |
| 150,000 | | B+ | | Senior Notes, 8.500% due 10/1/13 | | | 151,500 |
| 50,000 | | B | | Senior Subordinated Notes, 8.000% due 10/15/10 | | | 48,500 |
| 100,000 | | B+ | | Catalyst Paper Corp., Senior Notes, Series D, 8.625% due 6/15/11 | | | 96,500 |
|
| | | | | Total Paper & Forest Products | | | 947,812 |
|
| Personal Products — 0.0% |
| 125,000 | | B | | DEL Laboratories Inc., 9.230% due 11/1/11 (a)(b) | | | 128,125 |
| 175,000 | | CCC+ | | Playtex Products Inc., Senior Subordinated Notes, 9.375% due 6/1/11 | | | 184,844 |
|
| | | | | Total Personal Products | | | 312,969 |
|
| Pharmaceuticals — 0.5% |
| 180,000 | | BB- | | Valeant Pharmaceuticals International, Senior Notes, 7.000% due 12/15/11 | | | 177,300 |
| 75,000 | | CCC+ | | Warner Chilcott Corp., 8.750% due 2/1/15 (a) | | | 73,875 |
| 4,650,000 | | A | | Wyeth, Unsubordinated Notes, 5.500% due 3/15/13 | | | 4,686,428 |
|
| | | | | Total Pharmaceuticals | | | 4,937,603 |
|
| Real Estate — 0.9% |
| 625,000 | | BBB | | Boston Properties LP, Senior Notes, 6.250% due 1/15/13 | | | 652,217 |
| 3,500,000 | | A- | | ERP Operating LP, Notes, 5.250% due 9/15/14 | | | 3,467,292 |
| 200,000 | | B | | Felcor Lodging LP, Senior Notes, 9.000% due 6/1/11 | | | 221,250 |
| | | | | Host Marriott LP, Senior Notes: | | | |
| 325,000 | | BB- | | 7.125% due 11/1/13 | | | 335,969 |
| 125,000 | | BB- | | Series O, 6.375% due 3/15/15 | | | 124,063 |
| 3,300,000 | | BBB- | | iStar Financial Inc., Senior Notes, 5.150% due 3/1/12 | | | 3,202,109 |
| 175,000 | | CCC+ | | MeriStar Hospitality Corp., Senior Notes, 9.125% due 1/15/11 | | | 190,313 |
|
| | | | | Total Real Estate | | | 8,193,213 |
|
See Notes to Financial Statements.
Smith Barney Core Plus Bond Fund Inc. 2006 Semi-Annual Report 13
Schedule of Investments (January 31, 2006) (unaudited) (continued)
| | | | | | | |
| | | |
Face
Amount† | | Rating‡ | | Security | | Value |
| Road & Rail — 0.5% |
| 4,600,000 | | BBB | | Union Pacific Corp., Notes, 3.625% due 6/1/10 | | $ | 4,331,539 |
|
| Semiconductors & Semiconductor Equipment — 0.0% |
| | | | | Amkor Technology Inc.: | | | |
| | | | | Senior Notes: | | | |
| 175,000 | | CCC+ | | 9.250% due 2/15/08 | | | 172,375 |
| 121,000 | | CCC+ | | 7.750% due 5/15/13 | | | 107,085 |
| 50,000 | | CCC | | Senior Subordinated Notes, 10.500% due 5/1/09 | | | 47,250 |
|
| | | | | Total Semiconductors & Semiconductor Equipment | | | 326,710 |
|
| Specialty Retail — 0.4% |
| 125,000 | | B- | | CSK Auto Inc., Senior Notes, 7.000% due 1/15/14 | | | 114,687 |
| 125,000 | | B- | | Jafra Cosmetics International Inc., Senior Subordinated Notes, 10.750% due 5/15/11 | | | 136,875 |
| 3,200,000 | | BBB | | Limited Brands Inc., Debentures, 6.950% due 3/1/33 | | | 3,193,936 |
|
| | | | | Total Specialty Retail | | | 3,445,498 |
|
| Textiles, Apparel & Luxury Goods — 0.1% |
| 125,000 | | B- | | Collins & Aikman Floor Covering Inc., Senior Subordinated Notes, Series B, 9.750% due 2/15/10 | | | 115,625 |
| 300,000 | | B- | | Levi Strauss & Co., Senior Notes, 9.750% due 1/15/15 | | | 317,625 |
| 75,000 | | BB- | | Quiksilver Inc., Senior Notes, 6.875% due 4/15/15 | | | 72,375 |
| 75,000 | | B- | | Simmons Bedding Co., Senior Subordinated Notes, 7.875% due 1/15/14 | | | 70,875 |
|
| | | | | Total Textiles, Apparel & Luxury Goods | | | 576,500 |
|
| Wireless Telecommunication Services — 0.7% |
| 100,000 | | BB- | | American Tower Corp., Senior Notes, 7.125% due 10/15/12 | | | 104,250 |
| | | | | Centennial Communications Corp., Senior Notes: | | | |
| 100,000 | | CCC | | 10.250% due 1/1/13 (a)(b) | | | 102,750 |
| 175,000 | | CCC | | 10.125% due 6/15/13 | | | 192,500 |
| 125,000 | | CCC | | 8.125% due 2/1/14 | | | 127,812 |
| 50,000 | | CCC | | iPCS Inc., Senior Notes, 11.500% due 5/1/12 | | | 57,875 |
| 2,850,000 | | A | | New Cingular Wireless Services Inc., Unsubordinated Senior Notes, 8.750% due 3/1/31 | | | 3,745,732 |
| 675,000 | | A- | | Nextel Communications Inc., Senior Notes, Series D, 7.375% due 8/1/15 | | | 713,904 |
| | | | | SBA Communications Corp.: | | | |
| 49,000 | | B- | | Senior Discount Notes, step bond to yield 7.843% due 12/15/11 | | | 46,305 |
| 32,000 | | B- | | Senior Notes, 8.500% due 12/1/12 | | | 35,520 |
| 1,250,000 | | A- | | Sprint Capital Corp., Notes, 8.375% due 3/15/12 | | | 1,443,949 |
| 100,000 | | BBB- | | US Unwired Inc., Second Priority Secured Notes, Series B, 10.000% due 6/15/12 | | | 113,750 |
|
| | | | | Total Wireless Telecommunication Services | | | 6,684,347 |
|
| | | | | TOTAL CORPORATE BONDS & NOTES
(Cost — $228,969,655) | | | 226,219,399 |
|
See Notes to Financial Statements.
14 Smith Barney Core Plus Bond Fund Inc. 2006 Semi-Annual Report
Schedule of Investments (January 31, 2006) (unaudited) (continued)
| | | | | | | |
| | | |
Face
Amount† | | Rating‡ | | Security | | Value |
| ASSET-BACKED SECURITIES — 6.4% |
| Automobiles — 2.0% |
| 6,500,000 | | AAA | | AmeriCredit Automobile Receivables Trust, Series 2004-AF, Class A4, 2.870% due 2/7/11 | | $ | 6,380,226 |
| 6,500,000 | | AAA | | Ford Credit Auto Owner Trust, Series 2005-B, Class A4, 4.380% due 1/15/10 | | | 6,430,473 |
| 2,750,000 | | AAA | | Franklin Auto Trust, Series 2004-1, Class A2, 3.570% due 3/16/09 | | | 2,723,326 |
| 3,950,000 | | AAA | | Susquehanna Auto Lease Trust, Series 2005-1, Class A3, 4.430% due 6/16/08 (a) | | | 3,917,906 |
|
| | | | | Total Automobiles | | | 19,451,931 |
|
| Automotive — 1.5% |
| 6,000,000 | | AAA | | E-Trade RV and Marine Trust, Series 2004-1, Class A3,
3.620% due 10/8/18 | | | 5,755,939 |
| 8,800,000 | | AAA | | Long Beach Auto Receivables Trust, Series 2005-A, Class A4, 4.250% due 4/15/12 | | | 8,646,985 |
|
| | | | | Total Automotive | | | 14,402,924 |
|
| Credit Card — 0.6% |
| 5,800,000 | | AAA | | Nordstrom Private Label Credit Card Master Note Trust, Series 2001-A, 4.820% due 4/15/10 (a) | | | 5,796,803 |
|
| Home Equity — 2.3% |
| 2,345,437 | | AAA | | Centex Home Equity Loan Trust, Series 2003-B, Class AF4, 3.235% due 2/25/32 | | | 2,317,757 |
| 4,475,241 | | AAA | | CIT Group Home Equity Loan Trust, 3.930% due 3/20/32 | | | 4,402,048 |
| 8,350,000 | | Aaa(e) | | Irwin Home Equity, Series 2005-1, Class 2A2, 4.720% due 6/25/35 | | | 8,210,776 |
| 6,675,000 | | AAA | | Structured Asset Securities Corp., Series 2005-7XS, Class 1A2B, 5.270% due 4/25/35 | | | 6,650,455 |
|
| | | | | Total Home Equity | | | 21,581,036 |
|
| | | | | TOTAL ASSET-BACKED SECURITIES
(Cost — $61,669,912) | | | 61,232,694 |
|
| MORTGAGE-BACKED SECURITIES — 29.5% |
| FHLMC — 7.9% |
| | | | | FHLMC: | | | |
| | | | | Gold: | | | |
| 462 | | | | 5.500% due 5/1/13 | | | 466 |
| 2,538,729 | | | | 6.500% due 9/1/14-1/1/32 | | | 2,608,333 |
| 3,615,286 | | | | 6.000% due 3/1/17 | | | 3,685,785 |
| 17,500,000 | | | | 4.500% due 2/1/21 (f)(g) | | | 16,975,000 |
| 3,496,305 | | | | 5.000% due 8/1/33-9/1/33 | | | 3,389,684 |
| 20,900,000 | | | | 5.000% due 2/1/36 (f)(g) | | | 20,181,562 |
| 29,000,000 | | | | 5.500% due 2/1/36-3/1/36 (f)(g) | | | 28,830,000 |
|
| | | | | Total FHLMC | | | 75,670,830 |
|
See Notes to Financial Statements.
Smith Barney Core Plus Bond Fund Inc. 2006 Semi-Annual Report 15
Schedule of Investments (January 31, 2006) (unaudited) (continued)
| | | | | | | |
| | | |
Face
Amount† | | Rating‡ | | Security | | Value |
| FNMA — 21.0% |
| | | | | FNMA: | | | |
| 3,487,844 | | | | 6.500% due 2/1/14-1/1/33 | | $ | 3,583,616 |
| 22,134,206 | | | | 5.500% due 11/1/16-4/1/35 | | | 21,933,775 |
| 10,621,835 | | | | 6.000% due 5/1/17-6/1/32 | | | 10,759,645 |
| 70,600,000 | | | | 5.000% due 2/1/21-2/1/36 (f)(g) | | | 68,648,490 |
| 55,010,000 | | | | 5.500% due 2/1/21-2/1/36 (f)(g) | | | 54,543,812 |
| 7,000,000 | | | | 4.500% due 2/1/36 (f)(g) | | | 6,564,684 |
| 32,000,000 | | | | 6.000% due 2/1/36 (f)(g) | | | 32,403,125 |
| 3,000,000 | | | | 6.500% due 2/1/36 (f)(g) | | | 3,075,936 |
|
| | | | | Total FNMA | | | 201,513,083 |
|
| GNMA — 0.6% |
| | | | | GNMA: | | | |
| 19,438 | | | | 8.500% due 11/15/27 | | | 21,037 |
| 5,994,040 | | | | 6.500% due 8/15/31-3/15/32 | | | 6,276,043 |
|
| | | | | Total GNMA | | | 6,297,080 |
|
| | | | | TOTAL MORTGAGE-BACKED SECURITIES
(Cost — $287,624,482) | | | 283,480,993 |
|
| COLLATERALIZED MORTGAGE OBLIGATIONS — 4.0% |
| 8,586,850 | | AAA | | Countrywide Alternative Loan Trust, Series 2004-14T2, Class A6, 5.500% due 8/25/34 (c) | | | 8,537,148 |
| 4,019,464 | | AAA | | FHLMC, Series 2687, Class IA, PAC IO, 5.500% due 9/15/22 | | | 191,153 |
| 2,982,886 | | AAA | | FNMA, Series 2003-111, Class HR, PAC, 3.750% due 5/25/30 | | | 2,893,895 |
| 2,487,584 | | AAA | | MASTR Adjustable Rate Mortgages Trust, Series 2004-6, Class 5A1, 4.743% due 7/25/34 (b) | | | 2,458,972 |
| 2,843,770 | | AAA | | Merrill Lynch Mortgage Investors Inc., Series 2005-A2, Class A4, 4.497% due 2/25/35 (b) | | | 2,794,322 |
| 5,965,806 | | AAA | | Residential Accredit Loans, Inc., Series 2005-QA7, Class A21,
4.854% due 7/25/35 (b) | | | 5,882,868 |
| 7,660,000 | | AAA | | Structured Adjustable Rate Mortgage Loan, Series 2005-20, Class 3A2, 5.250% due 10/25/35 (b) | | | 7,488,143 |
| | | | | Wells Fargo Mortgage Backed Securities Trust: | | | |
| 5,635,115 | | AAA | | Series 2004-N, Class A2, 3.599% due 8/25/34 (b) | | | 5,620,395 |
| 2,777,551 | | Aaa(e) | | Series 2005-AR4, Class 2A2, 4.531% due 4/25/35 (b) | | | 2,721,719 |
|
| | | | | TOTAL COLLATERALIZED MORTGAGE OBLIGATIONS
(Cost — $38,835,166) | | | 38,588,615 |
|
| U.S. GOVERNMENT & AGENCY OBLIGATIONS — 30.9% | | | |
| U.S. Government Agencies — 6.0% | | | |
| | | | | FHLMC: | | | |
| 10,000,000 | | | | 6.875% due 9/15/10 | | | 10,849,800 |
| 10,000,000 | | | | 5.125% due 7/15/12 | | | 10,156,420 |
| | | | | FNMA: | | | |
| 1,500,000 | | | | 3.625% due 3/15/07 | | | 1,480,494 |
| 10,000,000 | | | | 6.625% due 9/15/09 | | | 10,608,840 |
| 15,000,000 | | | | 6.000% due 5/15/11 | | | 15,833,340 |
| 8,000,000 | | | | 6.125% due 3/15/12 | | | 8,544,592 |
|
| | | | | Total U.S. Government Agencies | | | 57,473,486 |
|
See Notes to Financial Statements.
16 Smith Barney Core Plus Bond Fund Inc. 2006 Semi-Annual Report
Schedule of Investments (January 31, 2006) (unaudited) (continued)
| | | | | | | |
| | | |
Face
Amount† | | Rating‡ | | Security | | Value |
| U.S. Government Obligations — 24.9% | | | |
| | | | | U.S. Treasury Bonds: | | | |
| 17,000,000 | | | | 8.750% due 5/15/17 | | $ | 23,082,158 |
| 13,200,000 | | | | 5.375% due 2/15/31 | | | 14,535,470 |
| | | | | U.S. Treasury Notes: | | | |
| 36,000,000 | | | | 3.500% due 5/31/07 (h) | | | 35,520,480 |
| 18,000,000 | | | | 4.375% due 12/31/07 | | | 17,953,596 |
| 43,300,000 | | | | 6.500% due 2/15/10 | | | 46,449,425 |
| 8,420,000 | | | | 4.000% due 3/15/10 | | | 8,261,797 |
| 18,800,000 | | | | 4.000% due 4/15/10 | | | 18,439,435 |
| 8,000,000 | | | | 5.000% due 2/15/11 | | | 8,185,008 |
| 40,000,000 | | | | 4.000% due 2/15/15 | | | 38,412,520 |
| 20,000,000 | | | | 4.125% due 5/15/15 | | | 19,377,360 |
| 9,000,000 | | | | 4.500% due 11/15/15 | | | 8,982,072 |
|
| | | | | Total U.S. Government Obligations | | | 239,199,321 |
|
| | | | | TOTAL U.S. GOVERNMENT & AGENCY OBLIGATIONS
(Cost — $302,556,313) | | | 296,672,807 |
|
| SOVEREIGN BONDS — 2.6% | | | |
| Argentina — 0.1% | | | |
| | | | | Republic of Argentina: | | | |
| 849,761ARS | | B- | | 5.830% due 12/31/33 (b) | | | 327,616 |
| 381,159 | | B- | | Discount Notes, 8.280% due 12/31/33 | | | 340,566 |
| 2,373,887ARS | | NR | | Series PGDP, zero coupon due 12/15/35 (b) | | | 42,616 |
|
| | | | | Total Argentina | | | 710,798 |
|
| Brazil — 0.4% | | | | | |
| | | | | Federative Republic of Brazil: | | | |
| 525,000 | | BB- | | 7.875% due 3/7/15 | | | 568,575 |
| 250,000 | | BB- | | 8.750% due 2/4/25 | | | 286,250 |
| 1,626,000 | | BB- | | Collective Action Securities, 8.000% due 1/15/18 | | | 1,777,624 |
| 1,185,316 | | BB- | | DCB, Series L, 5.250% due 4/15/12 (b) | | | 1,182,353 |
|
| | | | | Total Brazil | | | 3,814,802 |
|
| Bulgaria — 0.0% | | | | | |
| 100,000 | | BBB | | Republic of Bulgaria, 8.250% due 1/15/15 | | | 120,000 |
|
| Canada — 0.5% | | | | | |
| 4,825,000 | | A+ | | Province of Quebec, 4.600% due 5/26/15 | | | 4,680,964 |
|
| Chile — 0.0% | | | | | |
| 225,000 | | A | | Republic of Chile, 5.500% due 1/15/13 | | | 229,847 |
|
| Colombia —0.1% | | | |
| | | | | Republic of Colombia: | | | |
| 300,000 | | BB | | 10.000% due 1/23/12 | | | 359,625 |
| 325,000 | | BB | | 11.750% due 2/25/20 | | | 464,750 |
| 175,000 | | BB | | 10.375% due 1/28/33 | | | 239,487 |
|
| | | | | Total Colombia | | | 1,063,862 |
|
See Notes to Financial Statements.
Smith Barney Core Plus Bond Fund Inc. 2006 Semi-Annual Report 17
Schedule of Investments (January 31, 2006) (unaudited) (continued)
| | | | | | | |
| | | |
Face
Amount† | | Rating‡ | | Security | | Value |
| Dominican Republic — 0.0% | | | |
| 235,288 | | B | | Dominican Republic, 9.040% due 1/23/18 (a) | | $ | 254,699 |
|
| Ecuador — 0.0% | | | | | |
| 350,000 | | CCC+ | | Republic of Ecuador, step bond to yield 10.486% due 8/15/30 | | | 341,250 |
|
| Malaysia — 0.1% | | | | | |
| 350,000 | | A- | | Federation of Malaysia, 7.500% due 7/15/11 | | | 390,106 |
|
| Mexico — 0.6% | | | | | |
| 2,500,000 | | A | | Corporacion Andina de Fomento, Notes, 6.875% due 3/15/12 | | | 2,700,657 |
| | | | | United Mexican States: | | | |
| 475,000 | | BBB | | 8.125% due 12/30/19 | | | 581,875 |
| 650,000 | | BBB | | Medium-Term Notes, Series A, 8.000% due 9/24/22 | | | 793,975 |
| | | | | Series A, Notes: | | | |
| 1,150,000 | | BBB | | 6.375% due 1/16/13 | | | 1,219,575 |
| 630,000 | | BBB | | 5.875% due 1/15/14 | | | 649,688 |
|
| | | | | Total Mexico | | | 5,945,770 |
|
| Panama — 0.1% | | | | | |
| | | | | Republic of Panama: | | | |
| 350,000 | | BB | | 9.375% due 7/23/12 | | | 414,750 |
| 275,000 | | BB | | 8.875% due 9/30/27 | | | 341,000 |
| 163,000 | | BB | | 6.700% due 1/26/36 | | | 162,633 |
|
| | | | | Total Panama | | | 918,383 |
|
| Peru — 0.1% | | | | | |
| | | | | Republic of Peru: | | | |
| 175,000 | | BB | | 9.125% due 2/21/12 | | | 203,000 |
| 150,000 | | BB | | 9.875% due 2/6/15 | | | 186,375 |
| 75,000 | | BB | | 8.750% due 11/21/33 | | | 88,500 |
| 451,000 | | BB | | PDI, 5.000% due 3/7/17 (b) | | | 438,598 |
|
| | | | | Total Peru | | | 916,473 |
|
| Philippines — 0.1% | | | |
| | | | | Republic of the Philippines: | | | |
| 400,000 | | BB- | | 9.000% due 2/15/13 | | | 446,740 |
| 200,000 | | BB- | | 8.250% due 1/15/14 | | | 214,370 |
| 100,000 | | BB- | | 8.875% due 3/17/15 | | | 111,313 |
| 125,000 | | BB- | | 9.875% due 1/15/19 | | | 149,059 |
| 300,000 | | BB- | | 9.500% due 2/2/30 | | | 351,735 |
|
| | | | | Total Philippines | | | 1,273,217 |
|
| Russia — 0.1% | | | |
| | | | | Russian Federation: | | | |
| 350,000 | | BBB | | 8.250% due 3/31/10 | | | 372,750 |
| 200,000 | | BBB | | 11.000% due 7/24/18 | | | 294,000 |
|
| | | | | Total Russia | | | 666,750 |
|
See Notes to Financial Statements.
18 Smith Barney Core Plus Bond Fund Inc. 2006 Semi-Annual Report
Schedule of Investments (January 31, 2006) (unaudited) (continued)
| | | | | | | |
| | | |
Face
Amount† | | Rating‡ | | Security | | Value |
| South Africa — 0.0% | | | |
| 200,000 | | BBB+ | | Republic of South Africa, 6.500% due 6/2/14 | | $ | 216,000 |
|
| Turkey — 0.2% | | | |
| | | | | Republic of Turkey: | | | |
| 300,000 | | BB- | | 11.500% due 1/23/12 | | | 380,625 |
| 150,000 | | BB- | | 11.000% due 1/14/13 | | | 190,688 |
| 175,000 | | BB- | | 7.250% due 3/15/15 | | | 183,750 |
| 200,000 | | BB- | | 7.000% due 6/5/20 | | | 202,750 |
| 450,000 | | BB- | | 7.375% due 2/5/25 | | | 465,187 |
|
| | | | | Total Turkey | | | 1,423,000 |
|
| Ukraine — 0.0% | | | |
| | | | | Republic of Ukraine: | | | |
| 100,000 | | BB- | | 6.875% due 3/4/11 | | | 102,125 |
| 200,000 | | BB- | | 7.650% due 6/11/13 | | | 212,500 |
|
| | | | | Total Ukraine | | | 314,625 |
|
| Uruguay — 0.1% | | | |
| | | | | Republic of Uruguay, Benchmark Bonds: | | | |
| 200,000 | | B | | 7.500% due 3/15/15 | | | 211,000 |
| 128,144 | | B | | 7.875% due 1/15/33 (i) | | | 134,071 |
|
| | | | | Total Uruguay | | | 345,071 |
|
| Venezuela — 0.1% | | | |
| | | | | Bolivarian Republic of Venezuela: | | | |
| 425,000 | | B+ | | 8.500% due 10/8/14 | | | 477,487 |
| | | | | Collective Action Security: | | | |
| 275,000 | | B+ | | 10.750% due 9/19/13 | | | 343,750 |
| 275,000 | | B+ | | 9.375% due 1/13/34 | | | 343,750 |
|
| | | | | Total Venezuela | | | 1,164,987 |
|
| | | | | TOTAL SOVEREIGN BONDS
(Cost — $24,532,769) | | | 24,790,604 |
|
| | | |
| Warrant | | | | | | |
| WARRANT — 0.0% | | | |
| 4,250 | | | | United Mexican States, Series XW10, Expires 10/10/06*
(Cost — $10,625) | | | 18,063 |
|
| | | | | TOTAL INVESTMENTS BEFORE SHORT-TERM INVESTMENTS
(Cost — $944,198,922) | | | 931,003,175 |
|
See Notes to Financial Statements.
Smith Barney Core Plus Bond Fund Inc. 2006 Semi-Annual Report 19
Schedule of Investments (January 31, 2006) (unaudited) (continued)
| | | | | | | | | |
| | | |
Face
Amount | | | | Security | | Value | |
| | SHORT-TERM INVESTMENTS(c) — 26.7% | |
| | Repurchase Agreements — 26.7% | |
| $ | 100,000,000 | | | | Interest in $588,238,000 joint tri-party repurchase agreement dated 1/31/06 with Deutsche Bank Securities Inc., 4.450% due 2/1/06; Proceeds at maturity — $100,012,361; (Fully collateralized by various U.S. government agency obligations, 0.000% to 5.365% due 2/13/06 to 9/9/24; Market value —$102,000,409) | �� | $ | 100,000,000 | |
| | 55,568,000 | | | | Interest in $930,833,000 joint tri-party repurchase agreement dated 1/31/06 with Goldman, Sachs & Co., 4.440% due 2/1/06; Proceeds at maturity — $55,574,853; (Fully collateralized by various U.S. Treasury obligations, 0.875% to 4.250%, due 1/15/07 to 4/15/32; Market value — $56,688,684) | | | 55,568,000 | |
| | 100,000,000 | | | | Interest in $479,208,000 joint tri-party repurchase agreement dated 1/31/06 with Morgan Stanley, 4.450% due 2/1/06; Proceeds at maturity — $100,012,361; (Fully collateralized by various U.S. government agency obligations, 0.000% to 6.300% due 8/17/07 to 9/19/25; Market value —$103,217,088) | | | 100,000,000 | |
|
|
|
| | | | | | TOTAL SHORT-TERM INVESTMENTS
(Cost — $255,568,000) | | | 255,568,000 | |
|
|
|
| | | | | | TOTAL INVESTMENTS — 123.7% (Cost — $1,199,766,922#) | | | 1,186,571,175 | |
| | | | | | Liabilities in Excess of Other Assets — (23.7)% | | | (227,108,822 | ) |
|
|
|
| | | | | | TOTAL NET ASSETS — 100.0% | | $ | 959,462,353 | |
|
|
|
| * | | Non-income producing security. |
| † | | Face amount denominated in U.S. dollars, unless otherwise indicated. |
| ‡ | | All ratings are by Standard & Poor’s Ratings Service, unless otherwise noted. |
| (a) | | Security is exempt from registration under Rule 144A of the Securities Act of 1933. This security may be resold in transactions that are exempt from registration, normally to qualified institutional buyers. This security has been deemed liquid pursuant to guidelines approved by the Board of Directors, unless otherwise noted. |
| (b) | | Variable rate security. Interest rate disclosed is that which is in effect at January 31, 2006. |
| (c) | | All or a portion of this security is segregated for open futures contracts, extended settlements, TBA’s and mortgage dollar rolls. |
| (d) | | Security is currently in default. |
| (e) | | Rating by Moody’s Investors Service. |
| (f) | | This security is traded on a “to-be-announced” basis (See Note 1). |
| (g) | | All or a portion of this security is acquired under mortgage dollar roll agreement (See Notes 1 and 3). |
| (h) | | All or a portion of this security is held at the broker as collateral for open futures contracts. |
| (i) | | Payment-in-kind security for which part of the income earned may be paid as additional principal. |
| # | | Aggregate cost for federal income tax purposes is substantially the same. |
See page 21 for definitions of ratings.
| | |
Abbreviations used in this schedule:
|
| ARS | | — Argentine Peso |
| DCB | | — Debt Conversion Bond |
| FHLMC | | — Federal Home Loan Mortgage Corp. |
| FNMA | | — Federal National Mortgage Association |
| GNMA | | — Government National Mortgage Association |
| IO | | — Interest Only |
| MASTR | | — Mortgage Asset Securitization Transactions Inc. |
| MXN | | — Mexican Peso |
| PAC | | — Planned Amortization Cost |
| PDI | | — Past Due Interest |
See Notes to Financial Statements.
20 Smith Barney Core Plus Bond Fund Inc. 2006 Semi-Annual Report
Bond Ratings (unaudited)
The definitions of the applicable rating symbols are set forth below:
Standard & Poor’s Ratings Service (“Standard & Poor’s”) — Ratings from “AA” to “CCC” may be modified by the addition of a plus (+) or minus (–) sign to show relative standings within the major rating categories.
AAA | — Bonds rated “AAA” have the highest rating assigned by Standard & Poor’s. Capacity to pay interest and repay principal is extremely strong. |
AA | — Bonds rated “AA” have a very strong capacity to pay interest and repay principal and differ from the highest rated issues only in a small degree. |
A | — Bonds rated “A” have a strong capacity to pay interest and repay principal although they are somewhat more susceptible to the adverse effects of changes in circumstances and economic conditions than debt in higher rated categories. |
BBB | — Bonds rated “BBB” are regarded as having an adequate capacity to pay interest and repay principal. Whereas they normally exhibit adequate protection parameters, adverse economic conditions or changing circumstances are more likely to lead to a weakened capacity to pay interest and repay principal for bonds in this category than in higher rated categories. |
BB, B, CCC, CC and C | — Bonds rated “BB”, “B”, “CCC”, “CC” and “C” are regarded, on balance, as predominantly speculative with respect to capacity to pay interest and repay principal in accordance with the terms of the obligation. “BB” represents a lower degree of speculation than “B”, and “C” the highest degree of speculation. While such bonds will likely have some quality and protective characteristics, these are outweighed by large uncertainties or major risk exposures to adverse conditions. |
D | — Bonds rated “D” are in default and payment of interest and/or repayment of principal is in arrears. |
Moody’s Investors Service (“Moody’s”) — Numerical modifiers 1, 2 and 3 may be applied to each generic rating from “Aa” to “Caa,” where 1 is the highest and 3 the lowest ranking within its generic category.
Aaa | — Bonds rated “Aaa” are judged to be of the best quality. They carry the smallest degree of investment risk and are generally referred to as “gilt edge.” Interest payments are protected by a large or by an exceptionally stable margin and principal is secure. While the various protective elements are likely to change, such changes as can be visualized are most unlikely to impair the fundamentally strong position of such issues. |
Aa | — Bonds rated “Aa” are judged to be of high quality by all standards. Together with the “Aaa” group they comprise what are generally known as high grade bonds. They are rated lower than the best bonds because margins of protection may not be as large as in “Aaa” securities or fluctuation of protective elements may be of greater amplitude or there may be other elements present which make the long-term risks appear somewhat larger than in “Aaa” securities. |
A | — Bonds rated “A” possess many favorable investment attributes and are to be considered as upper medium grade obligations. Factors giving security to principal and interest are considered adequate but elements may be present which suggest a susceptibility to impairment some time in the future. |
Baa | — Bonds rated “Baa” are considered as medium grade obligations, i.e., they are neither highly protected nor poorly secured. Interest payments and principal security appear adequate for the present but certain protective elements may be lacking or may be characteristically unreliable over any great length of time. Such bonds lack outstanding investment characteristics and in fact have speculative characteristics as well. |
Ba | — Bonds rated “Ba” are judged to have speculative elements; their future cannot be considered as well assured. Often the protection of interest and principal payments may be very moderate and therefore not well safeguarded during both good and bad times over the future. Uncertainty of position characterizes bonds in this class. |
B | — Bonds rated “B” are generally lack characteristics of desirable investments. Assurance of interest and principal payments or of maintenance of other terms of the contract over any long period of time may be small. |
Caa | — Bonds rated “Caa” are of poor standing. These may be in default, or present elements of danger may exist with respect to principal or interest. |
Ca | — Bonds rated “Ca” represent obligations which are speculative in a high degree. Such issues are often in default or have other marked short-comings. |
C | — Bonds rated “C” are the lowest class of bonds and issues so rated can be rated as having externally poor prospect of even attaining any real investment standing. |
NR | — Indicates that the bond is not rated by Standard & Poor’s or Moody’s. |
Smith Barney Core Plus Bond Fund Inc. 2006 Semi-Annual Report 21
Statement of Assets and Liabilities (January 31, 2006) (unaudited)
| | | | |
| ASSETS: | | | | |
Investments, at value (Cost — $944,198,922) | | $ | 931,003,175 | |
Repurchase agreements, at value (Cost — $255,568,000) | | | 255,568,000 | |
Cash | | | 300 | |
Interest receivable | | | 9,810,046 | |
Receivable for securities sold | | | 1,034,475 | |
Receivable for Fund shares sold | | | 197,942 | |
Receivable from broker — variation margin on open futures contracts | | | 45,609 | |
Prepaid expenses | | | 32,008 | |
|
|
Total Assets | | | 1,197,691,555 | |
|
|
| LIABILITIES: | | | | |
Payable for securities purchased | | | 233,944,905 | |
Distributions payable | | | 3,290,778 | |
Investment management fee payable | | | 517,249 | |
Payable for Fund shares repurchased | | | 274,873 | |
Transfer agent fees payable | | | 75,520 | |
Deferred dollar roll income | | | 68,317 | |
Deferred compensation payable | | | 23,222 | |
Distribution fees payable (Notes 2 and 4) | | | 19,357 | |
Accrued expenses | | | 14,981 | |
|
|
Total Liabilities | | | 238,229,202 | |
|
|
Total Net Assets | | $ | 959,462,353 | |
|
|
| NET ASSETS: | | | | |
Par value (Note 6) | | $ | 77,905 | |
Paid-in capital in excess of par value | | | 990,593,341 | |
Overdistributed net investment income | | | (437,857 | ) |
Accumulated net realized loss on investments, futures contracts and foreign currency transactions | | | (17,727,012 | ) |
Net unrealized depreciation on investments, futures contracts and foreign currencies | | | (13,044,024 | ) |
|
|
Total Net Assets | | $ | 959,462,353 | |
|
|
Shares Outstanding: | | | | |
Class A | | | 13,639,490 | |
| |
Class B | | | 1,218,161 | |
| |
Class C | | | 614,742 | |
| |
Class Y | | | 62,432,882 | |
| |
Net Asset Value: | | | | |
Class A (and redemption price) | | | $12.31 | |
| |
Class B * | | | $12.32 | |
| |
Class C * | | | $12.32 | |
| |
Class Y (and redemption price) | | | $12.32 | |
| |
Maximum Public Offering Price Per Share: | | | | |
Class A (based on maximum sales charge of 4.50%) | | | $12.89 | |
|
|
| * | | Redemption price is NAV of Class B and C shares reduced by a 4.50% and 1.00% CDSC, respectively, if shares are redeemed within one year from purchase payment (See Note 2). |
See Notes to Financial Statements.
22 Smith Barney Core Plus Bond Fund Inc. 2006 Semi-Annual Report
Statement of Operations (For the six months ended January 31, 2006) (unaudited)
| | | | |
| INVESTMENT INCOME: | | | | |
Interest | | $ | 21,742,747 | |
|
|
| EXPENSES: | | | | |
Investment management fee (Note 2) | | | 2,313,375 | |
Administration fee (Note 2) | | | 560,772 | |
Distribution fees (Notes 2 and 4) | | | 315,589 | |
Transfer agent fees (Notes 2 and 4) | | | 119,188 | |
Custody fees | | | 57,807 | |
Shareholder reports (Note 4) | | | 52,617 | |
Legal fees | | | 40,799 | |
Registration fees | | | 20,819 | |
Audit and tax | | | 17,134 | |
Insurance | | | 9,576 | |
Directors’ fees (Note 2) | | | 8,024 | |
Miscellaneous expenses | | | 7,035 | |
|
|
Total Expenses | | | 3,522,735 | |
|
|
Net Investment Income | | | 18,220,012 | |
|
|
REALIZED AND UNREALIZED GAIN (LOSS) ON INVESTMENTS,
FUTURES CONTRACTS AND FOREIGN CURRENCY TRANSACTIONS
(NOTES 1 AND 3): | | | | |
Net Realized Gain (Loss) From: | | | | |
Investments | | | (313,929 | ) |
Futures contracts | | | 277,729 | |
Foreign currency transactions | | | (5,081 | ) |
|
|
Net Realized Loss | | | (41,281 | ) |
|
|
Change in Net Unrealized Appreciation/Depreciation From: | | | | |
Investments | | | (12,043,494 | ) |
Futures contracts | | | (61,410 | ) |
Foreign currencies | | | (8 | ) |
|
|
Change in Net Unrealized Appreciation/Depreciation | | | (12,104,912 | ) |
|
|
Net Loss on Investments, Futures Contracts and Foreign Currency Transactions | | | (12,146,193 | ) |
|
|
Increase in Net Assets From Operations | | $ | 6,073,819 | |
|
|
See Notes to Financial Statements.
Smith Barney Core Plus Bond Fund Inc. 2006 Semi-Annual Report 23
Statements of Changes in Net Assets
| | | | | | | | |
For the six months ended January 31, 2006 (unaudited)
and the year ended July 31, 2005 | | | | | | | | |
| | |
| | | 2006 | | | 2005 | |
| OPERATIONS: | | | | | | | | |
Net investment income | | $ | 18,220,012 | | | $ | 17,267,520 | |
Net realized gain (loss) | | | (41,281 | ) | | | 2,529,558 | |
Change in net unrealized appreciation/depreciation | | | (12,104,912 | ) | | | (4,616,911 | ) |
|
|
Increase in Net Assets From Operations | | | 6,073,819 | | | | 15,180,167 | |
|
|
| DISTRIBUTIONS TO SHAREHOLDERS FROM (NOTES 1 AND 5): | | | | | | | | |
Net investment income | | | (19,758,358 | ) | | | (18,955,780 | ) |
|
|
Decrease in Net Assets From Distributions to Shareholders | | | (19,758,358 | ) | | | (18,955,780 | ) |
|
|
| FUND SHARE TRANSACTIONS (NOTE 6): | | | | | | | | |
Net proceeds from sale of shares | | | 251,656,671 | | | | 456,043,104 | |
Reinvestment of distributions | | | 2,679,908 | | | | 6,103,458 | |
Cost of shares repurchased | | | (44,216,133 | ) | | | (125,898,734 | ) |
|
|
Increase in Net Assets From Fund Share Transactions | | | 210,120,446 | | | | 336,247,828 | |
|
|
Increase in Net Assets | | | 196,435,907 | | | | 332,472,215 | |
| NET ASSETS: | | | | | | | | |
Beginning of period | | | 763,026,446 | | | | 430,554,231 | |
|
|
End of period* | | $ | 959,462,353 | | | $ | 763,026,446 | |
|
|
*Includes undistributed (overdistributed) net investment income of: | | | $(437,857 | ) | | | $1,100,489 | |
|
|
See Notes to Financial Statements.
24 Smith Barney Core Plus Bond Fund Inc. 2006 Semi-Annual Report
Financial Highlights
For a share of each class of capital stock outstanding throughout each year ended July 31, unless otherwise noted:
| | | | | | | | | | | | | | | | | | | | | | | | |
| | | | | | |
| Class A Shares(1) | | 2006(2) | | | 2005 | | | 2004 | | | 2003 | | | 2002 | | | 2001 | |
Net Asset Value, Beginning of Period | | $ | 12.49 | | | $ | 12.57 | | | $ | 12.50 | | | $ | 12.87 | | | $ | 12.56 | | | $ | 12.03 | |
|
|
Income (Loss) From Operations: | | | | | | | | | | | | | | | | | | | | | | | | |
Net investment income | | | 0.23 | | | | 0.45 | | | | 0.42 | | | | 0.37 | | | | 0.59 | | | | 0.69 | |
Net realized and unrealized gain (loss) | | | (0.16 | ) | | | (0.05 | ) | | | 0.05 | | | | (0.22 | ) | | | 0.29 | | | | 0.56 | |
|
|
Total Income From Operations | | | 0.07 | | | | 0.40 | | | | 0.47 | | | | 0.15 | | | | 0.88 | | | | 1.25 | |
|
|
Less Distributions From: | | | | | | | | | | | | | | | | | | | | | | | | |
Net investment income | | | (0.25 | ) | | | (0.48 | ) | | | (0.40 | ) | | | (0.45 | ) | | | (0.57 | ) | | | (0.70 | ) |
Return of capital | | | — | | | | — | | | | — | | | | (0.07 | ) | | | — | | | | (0.02 | ) |
|
|
Total Distributions | | | (0.25 | ) | | | (0.48 | ) | | | (0.40 | ) | | | (0.52 | ) | | | (0.57 | ) | | | (0.72 | ) |
|
|
Net Asset Value, End of Period | | $ | 12.31 | | | $ | 12.49 | | | $ | 12.57 | | | $ | 12.50 | | | $ | 12.87 | | | $ | 12.56 | |
|
|
Total Return(3) | | | 0.53 | % | | | 3.22 | % | | | 3.77 | % | | | 1.15 | % | | | 7.17 | % | | | 10.68 | % |
|
|
Net Assets, End of Period (000s) | | | $167,936 | | | | $186,585 | | | | $215,950 | | | | $252,312 | | | | $277,136 | | | | $270,884 | |
|
|
Ratios to Average Net Assets: | | | | | | | | | | | | | | | | | | | | | | | | |
Gross expenses | | | 1.07 | %(4) | | | 1.07 | % | | | 1.04 | % | | | 1.02 | % | | | 1.05 | % | | | 1.04 | % |
Net expenses | | | 1.07 | (4) | | | 1.05 | (5) | | | 1.04 | | | | 1.02 | | | | 1.05 | | | | 1.04 | |
Net investment income | | | 3.66 | (4) | | | 3.58 | | | | 3.34 | | | | 2.87 | | | | 4.67 | | | | 5.58 | |
|
|
Portfolio Turnover Rate | | | 17 | %(6) | | | 169 | %(6) | | | 40 | %(6) | | | 457 | % | | | 335 | % | | | 275 | % |
|
|
| (1) | | Per share amounts have been calculated using the average shares method. |
| (2) | | For the six months ended January 31, 2006 (unaudited). |
| (3) | | Performance figures may reflect voluntary fee waivers and/or expense reimbursements. Past performance is no guarantee of future results. In the absence of voluntary fee waivers and/or expense reimbursements, the total return would have been lower. Total returns for periods of less than one year are not annualized. |
| (5) | | The investment manager voluntarily waived a portion of its fees. |
| (6) | | Excluding mortgage dollar roll transactions. If mortgage dollar roll transactions had been included, the portfolio turnover rate would have been 162%, 660% and 855% for the six months ended January 31, 2006 and the years ended July 31, 2005 and 2004, respectively. |
See Notes to Financial Statements.
Smith Barney Core Plus Bond Fund Inc. 2006 Semi-Annual Report 25
Financial Highlights (continued)
For a share of each class of capital stock outstanding throughout each year ended July 31, unless otherwise noted:
| | | | | | | | | | | | | | | | | | | | | | | | |
| | | | | | |
| Class B Shares(1) | | 2006(2) | | | 2005 | | | 2004 | | | 2003 | | | 2002 | | | 2001 | |
Net Asset Value, Beginning of Period | | $ | 12.50 | | | $ | 12.57 | | | $ | 12.51 | | | $ | 12.88 | | | $ | 12.57 | | | $ | 12.03 | |
|
|
Income (Loss) From Operations: | | | | | | | | | | | | | | | | | | | | | | | | |
Net investment income | | | 0.19 | | | | 0.38 | | | | 0.35 | | | | 0.30 | | | | 0.52 | | | | 0.62 | |
Net realized and unrealized gain (loss) | | | (0.16 | ) | | | (0.04 | ) | | | 0.04 | | | | (0.21 | ) | | | 0.29 | | | | 0.57 | |
|
|
Total Income From Operations | | | 0.03 | | | | 0.34 | | | | 0.39 | | | | 0.09 | | | | 0.81 | | | | 1.19 | |
|
|
Less Distributions From: | | | | | | | | | | | | | | | | | | | | | | | | |
Net investment income | | | (0.21 | ) | | | (0.41 | ) | | | (0.33 | ) | | | (0.39 | ) | | | (0.50 | ) | | | (0.63 | ) |
Return of capital | | | — | | | | — | | | | — | | | | (0.07 | ) | | | — | | | | (0.02 | ) |
|
|
Total Distributions | | | (0.21 | ) | | | (0.41 | ) | | | (0.33 | ) | | | (0.46 | ) | | | (0.50 | ) | | | (0.65 | ) |
|
|
Net Asset Value, End of Period | | $ | 12.32 | | | $ | 12.50 | | | $ | 12.57 | | | $ | 12.51 | | | $ | 12.88 | | | $ | 12.57 | |
|
|
Total Return(3) | | | 0.24 | % | | | 2.73 | % | | | 3.13 | % | | | 0.62 | % | | | 6.60 | % | | | 10.17 | % |
|
|
Net Assets, End of Period (000s) | | | $15,005 | | | | $18,163 | | | | $24,140 | | | | $36,266 | | | | $38,431 | | | | $30,310 | |
|
|
Ratios to Average Net Assets: | | | | | | | | | | | | | | | | | | | | | | | | |
Gross expenses | | | 1.65 | %(4) | | | 1.64 | % | | | 1.57 | % | | | 1.53 | % | | | 1.56 | % | | | 1.54 | % |
Net expenses | | | 1.65 | (4) | | | 1.62 | (5) | | | 1.57 | | | | 1.53 | | | | 1.56 | | | | 1.54 | |
Net investment income | | | 3.08 | (4) | | | 3.02 | | | | 2.78 | | | | 2.35 | | | | 4.13 | | | | 5.11 | |
|
|
Portfolio Turnover Rate | | | 17 | %(6) | | | 169 | %(6) | | | 40 | %(6) | | | 457 | % | | | 335 | % | | | 275 | % |
|
|
| (1) | | Per share amounts have been calculated using the average shares method. |
| (2) | | For the six months ended January 31, 2006 (unaudited). |
| (3) | | Performance figures may reflect voluntary fee waivers and/or expense reimbursements. Past performance is no guarantee of future results. In the absence of voluntary fee waivers and/or expense reimbursements, the total return would have been lower. Total returns for periods of less than one year are not annualized. |
| (5) | | The investment manager voluntarily waived a portion of its fees. |
| (6) | | Excluding mortgage dollar roll transactions. If mortgage dollar roll transactions had been included, the portfolio turnover rate would have been 162%, 660% and 855% for the six months ended January 31, 2006 and the years ended July 31, 2005 and 2004, respectively. |
See Notes to Financial Statements.
26 Smith Barney Core Plus Bond Fund Inc. 2006 Semi-Annual Report
Financial Highlights (continued)
For a share of each class of capital stock outstanding throughout each year ended July 31, unless otherwise noted:
| | | | | | | | | | | | | | | | | | | | | | | | |
| | | | | | |
| Class C Shares(1) | | 2006(2) | | | 2005 | | | 2004 | | | 2003 | | | 2002 | | | 2001 | |
Net Asset Value, Beginning of Period | | $ | 12.50 | | | $ | 12.57 | | | $ | 12.51 | | | $ | 12.88 | | | $ | 12.57 | | | $ | 12.03 | |
|
|
Income (Loss) From Operations: | | | | | | | | | | | | | | | | | | | | | | | | |
Net investment income | | | 0.20 | | | | 0.39 | | | | 0.35 | | | | 0.30 | | | | 0.53 | | | | 0.62 | |
Net realized and unrealized gain (loss) | | | (0.17 | ) | | | (0.04 | ) | | | 0.04 | | | | (0.20 | ) | | | 0.29 | | | | 0.58 | |
|
|
Total Income From Operations | | | 0.03 | | | | 0.35 | | | | 0.39 | | | | 0.10 | | | | 0.82 | | | | 1.20 | |
|
|
Less Distributions From: | | | | | | | | | | | | | | | | | | | | | | | | |
Net investment income | | | (0.21 | ) | | | (0.42 | ) | | | (0.33 | ) | | | (0.40 | ) | | | (0.51 | ) | | | (0.64 | ) |
Return of capital | | | — | | | | — | | | | — | | | | (0.07 | ) | | | — | | | | (0.02 | ) |
|
|
Total Distributions | | | (0.21 | ) | | | (0.42 | ) | | | (0.33 | ) | | | (0.47 | ) | | | (0.51 | ) | | | (0.66 | ) |
|
|
Net Asset Value, End of Period | | $ | 12.32 | | | $ | 12.50 | | | $ | 12.57 | | | $ | 12.51 | | | $ | 12.88 | | | $ | 12.57 | |
|
|
Total Return(3) | | | 0.28 | % | | | 2.79 | % | | | 3.17 | % | | | 0.71 | % | | | 6.69 | % | | | 10.26 | % |
|
|
Net Assets, End of Period (000s) | | | $7,572 | | | | $9,238 | | | | $11,233 | | | | $20,796 | | | | $21,740 | | | | $6,463 | |
|
|
Ratios to Average Net Assets: | | | | | | | | | | | | | | | | | | | | | | | | |
Gross expenses | | | 1.56 | %(4) | | | 1.56 | % | | | 1.52 | % | | | 1.50 | % | | | 1.46 | % | | | 1.46 | % |
Net expenses | | | 1.56 | (4) | | | 1.54 | (5) | | | 1.52 | | | | 1.50 | | | | 1.46 | | | | 1.46 | |
Net investment income | | | 3.16 | (4) | | | 3.09 | | | | 2.80 | | | | 2.35 | | | | 4.17 | | | | 5.08 | |
|
|
Portfolio Turnover Rate | | | 17 | %(6) | | | 169 | %(6) | | | 40 | %(6) | | | 457 | % | | | 335 | % | | | 275 | % |
|
|
| (1) | | Per share amounts have been calculated using the average shares method. |
| (2) | | For the six months ended January 31, 2006 (unaudited). |
| (3) | | Performance figures may reflect voluntary fee waivers and/or expense reimbursements. Past performance is no guarantee of future results. In the absence of voluntary fee waivers and/or expense reimbursements, the total return would have been lower. Total returns for periods of less than one year are not annualized. |
| (5) | | The investment manager voluntarily waived a portion of its fees. |
| (6) | | Excluding mortgage dollar roll transactions. If mortgage dollar roll transactions had been included, the portfolio turnover rate would have been 162%, 660% and 855% for the six months ended January 31, 2006 and the years ended July 31, 2005 and 2004, respectively. |
See Notes to Financial Statements.
Smith Barney Core Plus Bond Fund Inc. 2006 Semi-Annual Report 27
Financial Highlights (continued)
For a share of each class of capital stock outstanding throughout each year ended July 31, unless otherwise noted:
| | | | | | | | | | | | | | | | | | | | | | | | |
| | | | | | |
| Class Y Shares(1) | | 2006(2) | | | 2005 | | | 2004 | | | 2003 | | | 2002 | | | 2001 | |
Net Asset Value, Beginning of Period | | $ | 12.50 | | | $ | 12.56 | | | $ | 12.50 | | | $ | 12.87 | | | $ | 12.56 | | | $ | 12.03 | |
|
|
Income (Loss) From Operations: | | | | | | | | | | | | | | | | | | | | | | | | |
Net investment income | | | 0.26 | | | | 0.49 | | | | 0.47 | | | | 0.41 | | | | 0.63 | | | | 0.73 | |
Net realized and unrealized gain (loss) | | | (0.17 | ) | | | (0.03 | ) | | | 0.03 | | | | (0.21 | ) | | | 0.29 | | | | 0.57 | |
|
|
Total Income From Operations | | | 0.09 | | | | 0.46 | | | | 0.50 | | | | 0.20 | | | | 0.92 | | | | 1.30 | |
|
|
Less Distributions From: | | | | | | | | | | | | | | | | | | | | | | | | |
Net investment income | | | (0.27 | ) | | | (0.52 | ) | | | (0.44 | ) | | | (0.50 | ) | | | (0.61 | ) | | | (0.75 | ) |
Return of capital | | | — | | | | — | | | | — | | | | (0.07 | ) | | | — | | | | (0.02 | ) |
|
|
Total Distributions | | | (0.27 | ) | | | (0.52 | ) | | | (0.44 | ) | | | (0.57 | ) | | | (0.61 | ) | | | (0.77 | ) |
|
|
Net Asset Value, End of Period | | $ | 12.32 | | | $ | 12.50 | | | $ | 12.56 | | | $ | 12.50 | | | $ | 12.87 | | | $ | 12.56 | |
|
|
Total Return(3) | | | 0.74 | % | | | 3.74 | % | | | 4.03 | % | | | 1.49 | % | | | 7.55 | % | | | 11.08 | % |
|
|
Net Assets, End of Period (000s) | | | $768,949 | | | | $549,040 | | | | $179,231 | | | | $143,706 | | | | $125,474 | | | | $113,555 | |
|
|
Ratios to Average Net Assets: | | | | | | | | | | | | | | | | | | | | | | | | |
Gross expenses | | | 0.66 | %(4) | | | 0.70 | % | | | 0.71 | % | | | 0.69 | % | | | 0.70 | % | | | 0.70 | % |
Net expenses | | | 0.66 | (4) | | | 0.69 | (5) | | | 0.71 | | | | 0.69 | | | | 0.70 | | | | 0.70 | |
Net investment income | | | 4.09 | (4) | | | 3.94 | | | | 3.72 | | | | 3.15 | | | | 5.01 | | | | 5.91 | |
|
|
Portfolio Turnover Rate | | | 17 | %(6) | | | 169 | %(6) | | | 40 | %(6) | | | 457 | % | | | 335 | % | | | 275 | % |
|
|
| (1) | | Per share amounts have been calculated using the average shares method. |
| (2) | | For the six months ended January 31, 2006 (unaudited). |
| (3) | | Performance figures may reflect voluntary fee waivers and/or expense reimbursements. Past performance is no guarantee of future results. In the absence of voluntary fee waivers and/or expense reimbursements, the total return would have been lower. Total returns for periods of less than one year are not annualized. |
| (5) | | The investment manager voluntarily waived a portion of its fees. |
| (6) | | Excluding mortgage dollar roll transactions. If mortgage dollar roll transactions had been included, the portfolio turnover rate would have been 162%, 660% and 855% for the six months ended January 31, 2006 and the years ended July 31, 2005 and 2004, respectively. |
See Notes to Financial Statements.
28 Smith Barney Core Plus Bond Fund Inc. 2006 Semi-Annual Report
Notes to Financial Statements (unaudited)
| 1. | Organization and Significant Accounting Policies |
The Smith Barney Core Plus Bond Fund Inc. (the “Fund”), a Maryland corporation, registered under the Investment Company Act of 1940, as amended (the “1940 Act”), as a diversified, open-end management investment company.
The following are significant accounting policies consistently followed by the Fund and are in conformity with U.S. generally accepted accounting principles (“GAAP”). Estimates and assumptions are required to be made regarding assets, liabilities and changes in net assets resulting from operations when financial statements are prepared. Changes in the economic environment, financial markets and any other parameters used in determining these estimates could cause actual results to differ.
(a) Investment Valuation. Debt securities are valued at the mean between the bid and asked prices provided by an independent pricing service that are based on transactions in debt obligations, quotations from bond dealers, market transactions in comparable securities and various relationships between securities. Equity securities for which market quotations are available are valued at the last sale price or official closing price on the primary market or exchange on which they trade. When prices are not readily available, or are determined not to reflect fair value, such as when the value of a security has been significantly affected by events after the close of the exchange or market on which the security is principally traded, but before the Fund calculates its net asset value, the Fund may value these investments at fair value as determined in accordance with the procedures approved by the Fund’s Board of Directors. Short-term obligations with maturities of 60 days or less are valued at amortized cost, which approximates market value.
(b) Repurchase Agreements. When entering into repurchase agreements, it is the Fund’s policy that its custodian or a third party custodian take possession of the underlying collateral securities, the market value of which at least equals the principal amount of the repurchase transaction, including accrued interest. To the extent that any repurchase transaction exceeds one business day, the value of the collateral is marked-to-market to ensure the adequacy of the collateral. If the seller defaults, and the market value of the collateral declines or if bankruptcy proceedings are commenced with respect to the seller of the security, realization of the collateral by the Fund may be delayed or limited.
(c) Financial Futures Contracts. The Fund may enter into financial futures contracts typically to hedge a portion of the portfolio. Upon entering into a financial futures contract, the Fund is required to deposit cash or securities as initial margin. Additional securities are also segregated up to the current market value of the financial futures contracts. Subsequent payments, known as variation margin, are made or received by the Fund each day, depending on the daily fluctuation in the value of the underlying financial instruments. The Fund recognizes an unrealized gain or loss equal to the daily variation margin. When the financial futures contracts are closed, a realized gain or loss is recognized equal to the difference between the proceeds from (or cost of) the closing transactions and the Fund’s basis in the contracts.
The risks associated with entering into financial futures contracts include the possibility that a change in the value of the contract may not correlate with the changes in the value of the underlying instruments. In addition, investing in financial futures contracts involves
Smith Barney Core Plus Bond Fund Inc. 2006 Semi-Annual Report 29
Notes to Financial Statements (unaudited) (continued)
the risk that the Fund could lose more than the original margin deposit and subsequent payments required for a futures transaction. Risks may also arise upon entering into these contracts from the potential inability of the counterparties to meet the terms of their contracts.
(d) Securities Traded on a To-Be-Announced Basis. The Fund may trade securities on a to-be-announced (“TBA”) basis. In a TBA transaction, the Fund commits to purchasing or selling securities which have not yet been issued by the issuer and for which specific information is not known, such as the face amount and maturity date and the underlying pool of investments in U.S. government agency mortgage pass-through transactions. Securities purchased on a TBA basis are not settled until they are delivered to the Fund, normally 15 to 45 days later. Beginning on the date the Fund enters into a TBA transaction, cash, U.S. government securities or other liquid high-grade debt obligations are segregated in an amount equal in value to the purchase price of the TBA security. These transactions are subject to market fluctuations and their current value is determined in the same manner as for other securities.
(e) Mortgage Dollar Rolls. The Fund enters into dollar rolls in which the Fund sells mortgage-backed securities for delivery in the current month and simultaneously contracts to repurchase substantially similar (same type, coupon and maturity) securities to settle on a specified future date. During the roll period, the Fund forgoes principal and interest paid on the securities. The Fund is compensated by a fee paid by the counterparty, often in the form of a drop in the repurchase price of the securities. Dollar rolls are accounted for as financing arrangements; the fee is accrued into interest income ratably over the term of the dollar roll and any gain or loss on the roll is deferred and realized upon disposition of the rolled security.
The risk of entering into a mortgage dollar roll is that the market value of the securities the Fund is obligated to repurchase under the agreement may decline below the repurchase price. In the event the buyer of securities under a mortgage dollar roll files for bankruptcy or becomes insolvent, the Fund’s use of proceeds of the dollar roll may be restricted pending a determination by the other party, or its trustee or receiver, whether to enforce the Fund’s obligation to repurchase the securities.
(f) Security Transactions and Investment Income. Security transactions are accounted for on a trade date basis. Interest income, adjusted for amortization of premium and accretion of discount, is recorded on the accrual basis. Dividend income is recorded on the ex-dividend date. The cost of investments sold is determined by use of the specific identification method. To the extent any issuer defaults on an expected interest payment, the Fund’s policy is to generally halt any additional interest income accruals and consider the realizability of interest accrued up to the date of default.
(g) Distributions to Shareholders. Distributions from net investment income for the Fund, if any, are declared and paid on a monthly basis. Distributions of net realized gains, if any, are declared at least annually. Distributions are recorded on the ex-dividend date and are determined in accordance with income tax regulations, which may differ from GAAP.
(h) Foreign Currency Translation. Investment securities and other assets and liabilities denominated in foreign currencies are translated into U.S. dollar amounts based upon
30 Smith Barney Core Plus Bond Fund Inc. 2006 Semi-Annual Report
Notes to Financial Statements (unaudited) (continued)
prevailing exchange rates on the date of valuation. Purchases and sales of investment securities and income and expense items denominated in foreign currencies are translated into U.S. dollar amounts based upon prevailing exchange rates on the respective dates of such transactions.
The Fund does not isolate that portion of the results of operations resulting from changes in foreign exchange rates on investments from the fluctuations arising from changes in market prices of securities held. Such fluctuations are included with the net realized and unrealized gain or loss on investments.
Net realized foreign exchange gains or losses arise from sales of foreign currencies, including gains and losses on forward foreign currency contracts, currency gains or losses realized between the trade and settlement dates on securities transactions and the difference between the amounts of dividends, interest and foreign withholding taxes recorded on the Fund’s books and the U.S. dollar equivalent of the amounts actually received or paid. Net unrealized foreign exchange gains and losses arise from changes in the fair values of assets and liabilities, other than investments in securities, at the date of valuation, resulting from changes in exchange rates.
Foreign security and currency transactions may involve certain considerations and risks not typically associated with those of U.S. dollar denominated transactions as a result of, among other factors, the possibility of lower levels of governmental supervision and regulation of foreign securities markets and the possibility of political or economic instability.
(i) Credit and Market Risk. The Fund invests in high yield and emerging market instruments that are subject to certain credit and market risks. The yields of high yield and emerging market debt obligations reflect, among other things, perceived credit risk. The Fund’s investment in securities rated below investment grade typically involves risks not associated with higher rated securities including, among others, greater risk related to timely and ultimate payment of interest and principal, greater market price volatility and less liquid secondary market trading. The consequences of political, social, economic or diplomatic changes may have disruptive effects on the market prices of investments held by the Fund. The Fund’s investment in non-U.S. dollar denominated securities may also result in foreign currency losses caused by devaluations and exchange rate fluctuations.
(j) Class Accounting. Investment income, common expenses and realized/unrealized gain (loss) on investments are allocated to the various classes of the Fund on the basis of daily net assets of each class. Fees relating to a specific class are charged directly to that class.
(k) Federal and Other Taxes. It is the Fund’s policy to comply with the federal income and excise tax requirements of the Internal Revenue Code of 1986, as amended, applicable to regulated investment companies. Accordingly, the Fund intends to distribute substantially all of its income and net realized gains on investments, if any, to shareholders each year. Therefore, no federal income tax provision is required in the Fund’s financial statements.
(l) Reclassification. GAAP requires that certain components of net assets be adjusted to reflect permanent differences between financial and tax reporting. These reclassifications have no effect on net assets or net asset values per share.
Smith Barney Core Plus Bond Fund Inc. 2006 Semi-Annual Report 31
Notes to Financial Statements (unaudited) (continued)
| 2. | Investment Management Agreement and Other Transactions with Affiliates |
On December 1, 2005, Citigroup Inc. (“Citigroup”) completed the sale of substantially all of its asset management business, Citigroup Asset Management (“CAM”), to Legg Mason, Inc. (“Legg Mason”). As a result, the Fund’s investment adviser, Smith Barney Fund Management LLC (the “Manager”) and the Fund’s sub-adviser, Citigroup Asset Management Ltd (“Sub-adviser”), previously indirect wholly-owned subsidiaries of Citigroup, have become wholly-owned subsidiaries of Legg Mason. Completion of the sale caused the Fund’s existing investment advisory, sub-advisory and administration contracts to terminate. The Fund’s shareholders approved a new investment management contract between the Fund and the Manager, and a new sub-advisory agreement between the Manager and the Sub-adviser which became effective on December 1, 2005.
Prior to the transaction, the Fund paid the Manager an advisory fee calculated at an annual rate of 0.45% of the Fund’s average daily net assets up to $500 million and 0.42% in excess of $500 million and an administration fee calculated at the annual rate of 0.20% of the Fund’s average daily net assets up to $500 million and 0.18% in excess of $500 million. The Manager pays the Sub-adviser a subadvisory fee for its services at an annual rate of 0.45% of the Subadviser’s managed assets up to $500 million and 0.415% of the Subadviser’s managed assets in excess of $500 million.
Under the new Management Agreement, the Fund pays the Manager a management fee for advisory and administrative services which is calculated daily and payable monthly at an annual rate of 0.65% of the Fund’s average daily net assets up to $500 million and 0.60% in excess of $500 million.
The Fund’s Board has approved PFPC Inc. (“PFPC”) to serve as transfer agent for the Fund, effective January 1, 2006. The principal business office of PFPC is located at 4400 Computer Drive, Westborough, MA 01581. During the period covered by this report, Citicorp Trust Bank, fsb. (“CTB”), a subsidiary of Citigroup, acted as the Fund’s transfer agent. PFPC acted as the Fund’s sub-transfer agent. CTB received account fees and asset-based fees that varied according to the size and type of account. PFPC was responsible for shareholder recordkeeping and financial processing for all shareholder accounts and was paid by CTB. For the period ended January 31, 2006, the Fund paid transfer agent fees of $59,736 to CTB. In addition, for the six months ended January 31, 2006, the Fund also paid $5,206 to other Citigroup affiliates for shareholder recordkeeping services.
The Fund’s Board has appointed the Fund’s current distributor, Citigroup Global Markets Inc. (“CGM”) and Legg Mason Investor Services, LLC (“LMIS”), a wholly-owned broker-dealer subsidiary of Legg Mason, as co-distributors of the Fund. The Fund’s Board has also approved amended and restated Rule 12b-1 Plans. CGM and other broker-dealers, financial intermediaries and financial institutions (each called a “Service Agent”) that currently offer Fund shares will continue to make the Fund’s shares available to their clients. Additional Service Agents may offer Fund shares in the future.
There is a maximum initial sales charge of 4.50% for Class A shares. There is a contingent deferred sales charge (“CDSC”) of 4.50% on Class B shares, which applies if redemption occurs within one year from purchase payment. This CDSC declines by 0.50% the first year after purchase and thereafter by 1.00% per year until no CDSC is
32 Smith Barney Core Plus Bond Fund Inc. 2006 Semi-Annual Report
Notes to Financial Statements (unaudited) (continued)
incurred. Class C shares have a 1.00% CDSC, which applies if redemption occurs within one year from purchase payment. In certain cases, Class A shares have a 1.00% CDSC, which applies if redemption occurs within one year from purchase payment. This CDSC only applies to those purchases of Class A shares, which, when combined with current holdings of Class A shares, equal or exceed $500,000 in the aggregate. These purchases do not incur an initial sales charge.
For the six months ended January 31, 2006, CGM and its affiliates received sales charges of approximately $2,309 on sales of the Fund’s Class A shares. In addition, for the six months ended January 31, 2006, CDSCs paid to CGM and its affiliates were approximately:
| | | | | | | | | |
| | | |
| | | Class A | | Class B | | Class C |
CDSCs | | $ | 2,000 | | $ | 12,000 | | $ | 1,000 |
|
The Fund has adopted an unfunded, non-qualified deferred compensation plan (the “Plan”) which allows non-interested directors (“Independent Directors’”) to defer the receipt of all or a portion of the directors’ fees earned until a later date specified by the Independent Directors. The deferred fees earn a return based on notional investments selected by the Independent Directors. The balance of the deferred fees payable may change depending upon the investment performance. Any gains or losses incurred in the deferred balances are reported in the statement of operations under Directors’ fees. Under the Plan, deferred fees are considered a general obligation of the Fund and any payments made pursuant to the Plan will be made from the Fund’s general assets.
As of January 31, 2006, the Fund has accrued $23,222 as deferred compensation.
Certain officers and one Director of the Fund are employees of Legg Mason or its affiliates and do not receive compensation from the Fund.
During the six months ended January 31, 2006, the aggregate cost of purchases and proceeds from sales of investments (excluding short-term investments and mortgage dollar rolls) and U.S. Government & Agency Obligations were as follows:
| | | | | | |
| | |
| | | Investments | | U.S. Government &
Agency Obligations |
Purchases | | $ | 162,007,446 | | $ | 203,734,745 |
|
Sales | | | 64,373,031 | | | 77,465,076 |
|
At January 31, 2006, the aggregate gross unrealized appreciation and depreciation of investments for federal income tax purposes were substantially as follows:
| | | | |
Gross unrealized appreciation | | $ | 2,034,794 | |
Gross unrealized depreciation | | | (15,230,541 | ) |
|
|
Net unrealized depreciation | | $ | (13,195,747 | ) |
|
|
Smith Barney Core Plus Bond Fund Inc. 2006 Semi-Annual Report 33
Notes to Financial Statements (unaudited) (continued)
At January 31, 2006, the Fund had the following open futures contracts:
| | | | | | | | | | | | | | |
| | | | | |
| | | Number of
Contracts | | Expiration
Date | | Basis
Value | | Market
Value | | Unrealized
Gain (Loss) | |
Contracts to Buy: | | | | | | | | | | | | | | |
U.S. Treasury Bonds | | 143 | | 03/06 | | $ | 16,013,187 | | $ | 16,136,656 | | $ | 123,469 | |
|
|
Contracts to Sell: | | | | | | | | | | | | | | |
U.S. Treasury 2 Year Notes | | 110 | | 03/06 | | $ | 22,542,710 | | $ | 22,532,812 | | $ | 9,898 | |
U.S. Treasury 5 Year Notes | | 215 | | 03/06 | | | 22,753,917 | | | 22,732,891 | | | 21,026 | |
U.S. Treasury 10 Year Notes | | 76 | | 03/06 | | | 8,238,588 | | | 8,241,250 | | | (2,662 | ) |
|
|
| | | | | | | | | | | | | | 28,262 | |
|
|
Net Unrealized Gain on Open Futures Contracts | | | | | | | | $ | 151,731 | |
|
|
During the six months ended January 31, 2006, the Fund entered into mortgage dollar roll transactions in the aggregate amount of $1,203,752,828. For the six months ended January 31, 2006, the Fund recorded interest income of $1,275,740 related to such mortgage dollar rolls. At January 31, 2006, the Fund had outstanding mortgage dollar rolls with a total cost of $231,549,698.
| 4. | Class Specific Expenses |
The Fund has adopted a Rule 12b-1 distribution plan and under that plan the Fund pays a service fee with respect to its Class A, B and C shares calculated at the annual rate of 0.25% of the average daily net assets of each respective class. The Fund also pays a distribution fee with respect to its Class B and C shares calculated at the annual rate of 0.50% and 0.45% of the average daily net assets of each class, respectively. Distribution fees are accrued daily and paid monthly.
For the six months ended January 31, 2006, class specific expenses were as follows:
| | | | | | | | | |
| | | |
| | | Distribution Fees | | Transfer Agent Fees | | Shareholder Reports
Expenses |
Class A | | $ | 223,264 | | $ | 100,170 | | $ | 42,514 |
Class B | | | 62,918 | | | 13,434 | | | 6,236 |
Class C | | | 29,407 | | | 5,471 | | | 3,027 |
Class Y | | | — | | | 113 | | | 840 |
|
Total | | $ | 315,589 | | $ | 119,188 | | $ | 52,617 |
|
| 5. | Distributions to Shareholders by Class |
| | | | | | |
| | |
| | | Six Months Ended
January 31, 2006 | | Year Ended
July 31, 2005 |
Net Investment Income | | | | | | |
Class A | | $ | 3,486,408 | | $ | 7,743,863 |
Class B | | | 278,407 | | | 677,809 |
Class C | | | 141,518 | | | 340,845 |
Class Y | | | 15,852,025 | | | 10,193,263 |
|
Total | | $ | 19,758,358 | | $ | 18,955,780 |
|
34 Smith Barney Core Plus Bond Fund Inc. 2006 Semi-Annual Report
Notes to Financial Statements (unaudited) (continued)
At January 31, 2006, the Fund had 500 million shares of capital stock authorized with a par value of $.001 per share. The Fund has the ability to issue multiple classes of shares. Each share of a class represents an identical interest in the Fund and has the same rights, except that each class bears certain direct expenses specifically related to the distribution of its shares.
Transactions in shares of each class were as follows:
| | | | | | | | | | | | | | |
| | |
| | | Six Months Ended January 31, 2006
| | | Year Ended July 31, 2005
| |
| | | Shares | | | Amount | | | Shares | | | Amount | |
Class A | | | | | | | | | | | | | | |
Shares sold | | 151,701 | | | $ | 1,875,684 | | | 423,805 | | | $ | 5,357,846 | |
Shares issued on reinvestment | | 194,705 | | | | 2,408,461 | | | 420,696 | | | | 5,305,762 | |
Shares repurchased | | (1,641,920 | ) | | | (20,344,676 | ) | | (3,094,826 | ) | | | (39,028,222 | ) |
|
|
Net Decrease | | (1,295,514 | ) | | $ | (16,060,531 | ) | | (2,250,325 | ) | | $ | (28,364,614 | ) |
|
|
Class B | | | | | | | | | | | | | | |
Shares sold | | 12,749 | | | $ | 158,126 | | | 74,768 | | | $ | 944,764 | |
Shares issued on reinvestment | | 14,905 | | | | 184,473 | | | 36,318 | | | | 458,399 | |
Shares repurchased | | (262,769 | ) | | | (3,254,209 | ) | | (577,799 | ) | | | (7,292,856 | ) |
|
|
Net Decrease | | (235,115 | ) | | $ | (2,911,610 | ) | | (466,713 | ) | | $ | (5,889,693 | ) |
|
|
Class C | | | | | | | | | | | | | | |
Shares sold | | 12,160 | | | $ | 150,386 | | | 90,744 | | | $ | 1,143,416 | |
Shares issued on reinvestment | | 7,026 | | | | 86,974 | | | 17,394 | | | | 219,524 | |
Shares repurchased | | (143,630 | ) | | | (1,783,667 | ) | | (262,543 | ) | | | (3,313,669 | ) |
|
|
Net Decrease | | (124,444 | ) | | $ | (1,546,307 | ) | | (154,405 | ) | | $ | (1,950,729 | ) |
|
|
Class Y | | | | | | | | | | | | | | |
Shares sold | | 20,018,680 | | | $ | 249,472,475 | | | 35,673,107 | | | $ | 448,597,078 | |
Shares issued on reinvestment | | — | | | | — | | | 9,535 | | | | 119,773 | |
Shares repurchased | | (1,523,595 | ) | | | (18,833,581 | ) | | (6,010,191 | ) | | | (76,263,987 | ) |
|
|
Net Increase | | 18,495,085 | | | $ | 230,638,894 | | | 29,672,451 | | | $ | 372,452,864 | |
|
|
| 7. | Capital Loss Carryforward |
As of July 31, 2005, the Fund had net capital loss carryforwards of approximately $17,449,682 of which $14,113,843 will expire in 2008, $940,878 expires in 2009, $717,985 expires in 2011, $1,414,288 expires in 2012 and $262,688 expires in 2013. These amounts will be available to offset any future taxable capital gains.
On May 31, 2005, the U.S. Securities and Exchange Commission (“SEC”) issued an order in connection with the settlement of an administrative proceeding against the Manager and CGM relating to the appointment of an affiliated transfer agent for the Smith Barney family of mutual funds (the “Funds”).
Smith Barney Core Plus Bond Fund Inc. 2006 Semi-Annual Report 35
Notes to Financial Statements (unaudited) (continued)
The SEC order finds that SBFM and CGM willfully violated Section 206(1) of the Investment Advisers Act of 1940 (“Advisers Act”). Specifically, the order finds that SBFM and CGM knowingly or recklessly failed to disclose to the boards of the Funds in 1999 when proposing a new transfer agent arrangement with an affiliated transfer agent that: First Data Investors Services Group (“First Data”), the Funds’ then-existing transfer agent, had offered to continue as transfer agent and do the same work for substantially less money than before; and that CAM, the Citigroup business unit that, at the time, included SBFM and other investment advisory companies, had entered into a side letter with First Data under which CAM agreed to recommend the appointment of First Data as sub-transfer agent to the affiliated transfer agent in exchange for, among other things, a guarantee by First Data of specified amounts of asset management and investment banking fees to CAM and CGM. The order also finds that SBFM and CGM willfully violated Section 206(2) of the Advisers Act by virtue of the omissions discussed above and other misrepresentations and omissions in the materials provided to the Funds’ boards, including the failure to make clear that the affiliated transfer agent would earn a high profit for performing limited functions while First Data continued to perform almost all of the transfer agent functions, and the suggestion that the proposed arrangement was in the Funds’ best interests and that no viable alternatives existed. SBFM and CGM do not admit or deny any wrongdoing or liability. The settlement does not establish wrongdoing or liability for purposes of any other proceeding.
The SEC censured SBFM and CGM and ordered them to cease and desist from violations of Sections 206(1) and 206(2) of the Advisers Act. The order requires Citigroup to pay $208.1 million, including $109 million in disgorgement of profits, $19.1 million in interest, and a civil money penalty of $80 million. Approximately $24.4 million has already been paid to the Funds, primarily through fee waivers. The remaining $183.7 million, including the penalty, has been paid to the U.S. Treasury and will be distributed pursuant to a plan prepared and submitted for approval by the SEC. The order also requires that transfer agency fees received from the Funds since December 1, 2004 less certain expenses be placed in escrow and provides that a portion of such fees may be subsequently distributed in accordance with the terms of the order.
The order required SBFM to recommend a new transfer agent contract to the Fund boards within 180 days of the entry of the order; if a Citigroup affiliate submitted a proposal to serve as transfer agent or sub-transfer agent, SBFM and CGM would have been required, at their expense, to engage an independent monitor to oversee a competitive bidding process. On November 21, 2005, and within the specified timeframe, the Fund’s Board selected a new transfer agent for the Fund. No Citigroup affiliate submitted a proposal to serve as transfer agent. Under the order, the Funds’ investment manager also must comply with an amended version of a vendor policy that Citigroup instituted in August 2004.
At this time, there is no certainty as to how the proceeds of the settlement will be distributed, to whom such distributions will be made, the methodology by which such distributions will be allocated, and when such distributions will be made. Although there can be no assurance, the Funds’ investment manager does not believe that this matter will have a material adverse effect on the Funds.
On December 1, 2005, Citigroup completed the sale of substantially all of its global asset management business, including SBFM, to Legg Mason Inc.
36 Smith Barney Core Plus Bond Fund Inc. 2006 Semi-Annual Report
Notes to Financial Statements (unaudited) (continued)
Beginning in August 2005, five class action lawsuits alleging violations of federal securities laws and state law were filed against CGM and SBFM, (collectively, the “Defendants”) based on the May 31, 2005 settlement order issued against the Defendants by the SEC described in Note 8. The complaints seek injunctive relief and compensatory and punitive damages, removal of SBFM as the investment manager for the Smith Barney family of funds, rescission of the Funds’ management and other contracts with SBFM, recovery of all fees paid to SBFM pursuant to such contracts, and an award of attorneys’ fees and litigation expenses.
On October 5, 2005, a motion to consolidate the five actions and any subsequently filed, related action was filed. That motion contemplates that a consolidated amended complaint alleging substantially similar causes of action will be filed in the future.
As of the date of this report, SBFM believes that resolution of the pending lawsuit will not have a material effect on the financial position or results of operations of the Funds or the ability of the Fund’s investment manager and its affiliates to continue to render services to the Funds under their respective contracts.
* * *
Beginning in June 2004, class action lawsuits alleging violations of the federal securities laws were filed against CGM and a number of its affiliates, including SBFM and Salomon Brothers Asset Management Inc. (“SBAM”) (the “Advisers”), substantially all of the mutual funds managed by the Advisers, including the Fund (the “Funds”), and directors or trustees of the Funds (collectively, the “Defendants”). The complaints alleged, among other things, that CGM created various undisclosed incentives for its brokers to sell Smith Barney and Salomon Brothers funds. In addition, according to the complaints, the Advisers caused the Funds to pay excessive brokerage commissions to CGM for steering clients towards proprietary funds. The complaints also alleged that the Defendants breached their fiduciary duty to the Funds by improperly charging Rule 12b-1 fees and by drawing on fund assets to make undisclosed payments of soft dollars and excessive brokerage commissions. The complaints also alleged that the Funds failed to adequately disclose certain aspects of the allegedly wrongful conduct. The complaints sought injunctive relief and compensatory and punitive damages, rescission of the Funds’ contracts with the Advisers, recovery of all fees paid to the Advisers pursuant to such contracts and an award of attorneys’ fees and litigation expenses.
On December 15, 2004, a consolidated amended complaint (the “Complaint”) was filed alleging substantially similar causes of action. While the lawsuit is in its earliest stages, to the extent that the Complaint purports to state causes of action against the Funds, the Fund’s investment manager believes the Funds have significant defenses to such allegations, which the Funds intend to vigorously assert in responding to the Complaint.
Additional lawsuits arising out of these circumstances and presenting similar allegations and requests for relief may be filed against the Defendants in the future.
As of the date of this report, the Fund’s investment manager and the Funds believe that the resolution of the pending lawsuit will not have a material effect on the financial position
Smith Barney Core Plus Bond Fund Inc. 2006 Semi-Annual Report 37
Notes to Financial Statements (unaudited) (continued)
or results of operations of the Funds or the ability of the Fund’s investment manager and its affiliates to continue to render services to the Funds under their respective contracts.
The Defendants have moved to dismiss the Complaint. Those motions are pending before the court.
On September 16, 2005, the staff of the SEC informed SBFM and SBAM that the staff is considering recommending that the Commission institute administrative proceedings against SBFM and SBAM for alleged violations of Section 19(a) and 34(b) of the Investment Company Act (and related Rule 19a-1). The notification is a result of an industry wide inspection by the SEC and is based upon alleged deficiencies in disclosures regarding dividends and distributions paid to shareholders of certain funds. Section 19(a) and related Rule 19a-1 of the Investment Company Act generally require funds that are making dividend and distribution payments to provide shareholders with a written statement disclosing the source of the dividends and distributions, and, in particular, the portion of the payments made from each of net investment income, undistributed net profits and/or paid-in capital. In connection with the contemplated proceedings, the staff may seek a cease and desist order and/or monetary damages from SBFM or SBAM.
Although there can be no assurance, SBFM and SBAM believe that this matter is not likely to have a material adverse effect on the Fund or SBFM’s and SBAM’s ability to perform investment management services relating to the Funds.
38 Smith Barney Core Plus Bond Fund Inc. 2006 Semi-Annual Report
Board Approval of Management Agreement (unaudited)
Background
At separate meetings of the Fund’s Board of Directors, the Board considered the re-approval for an annual period of the Fund’s Investment Advisory Agreement and Administration Agreement, pursuant to which Smith Barney Fund Management LLC (the “Manager”) provides the Fund with investment advisory and administrative services. The Board noted that earlier in the year the Fund’s shareholders had approved the Sub-Advisory Agreement between the Manager and Citigroup Asset Management Limited (the “Sub-Adviser”), pursuant to which the Sub-Adviser provides day-to-day management of the Fund’s assets invested in non-U.S. dollar-denominated debt securities of non-U.S. issuers and currency transactions. (The Advisory Agreement, Administration Agreement and Sub-Advisory Agreement are collectively referred to herein as the “Agreements”.) The Board members who are not “interested persons” (as defined in the 1940 Act, as amended (the “Independent Directors”)) of the Fund were assisted in their review by Fund counsel and independent legal counsel and met with independent legal counsel in executive sessions separate from representatives of the Manager and Sub-Adviser. The Independent Directors requested and received information from the Manager and Sub-Adviser they deemed reasonably necessary for their review of the Agreements and the performance of the Manager and Sub-Adviser. This information was initially reviewed by a special committee of the Independent Directors and then by the full Board. Prior to the Board’s deliberations, Citigroup Inc. had announced an agreement to sell Citigroup Asset Management (“CAM”), which includes the Manager, to Legg Mason, which, subject to certain approvals, was expected to be effective later in the year. Consequently, representatives of Legg Mason discussed with the Board Legg Mason’s intentions regarding the preservation and strengthening of the Manager’s business. The Independent Directors also requested certain assurances from senior management of Legg Mason regarding the continuation of the level of services provided to the Fund and its shareholders should the sale of CAM be consummated. At subsequent Board meetings, representatives of CAM and Legg Mason made additional presentations to and responded to further questions from the Board regarding Legg Mason’s acquisition of CAM. After considering these presentations and reviewing additional written materials provided by CAM and Legg Mason, the Board, including the Independent Directors, approved, subject to shareholder approval, new Agreements permitting the Manager and Sub-Adviser to continue to provide their services to the Fund after consummation of the sale of CAM to Legg Mason. (Shareholders approved the new Agreements and the sale of CAM to Legg Mason was consummated as of December 1, 2005.)
Board Approval of Management Agreement
In voting to approve the Agreements with the Manager, the Independent Directors considered whether the approval of the Agreements would be in the best interests of the Fund and its shareholders, an evaluation based on several factors including those discussed below.
Smith Barney Core Plus Bond Fund Inc. 39
Board Approval of Management Agreement (unaudited) (continued)
Nature, Extent and Quality of the Services provided to the Fund
The Board received a presentation from representatives of the Manager regarding the nature, extent and quality of the services provided to the Fund and other funds in the CAM fund complex. In addition, the Independent Directors received and considered other information regarding the services provided to the Fund by the Manager and Sub-Adviser under the respective Agreements during the past year. The Board also received a description of the administrative and other services rendered to the Fund and its shareholders by the Manager. The Board members also considered the Manager’s supervisory activities over the Sub-Adviser. The Board noted information received at regular meetings throughout the year related to the services rendered by the Manager and Sub-Adviser about the management of the Fund’s affairs and the Manager’s role in coordinating the activities of the Sub-Adviser and the Fund’s other service providers. The Board’s evaluation of the services provided by the Manager and Sub-Adviser took into account the Board’s knowledge and familiarity gained as Board members of funds in the CAM fund complex, including the scope and quality of the Manager’s investment management and other capabilities and the quality of its administrative and other services. The Board observed that the scope of services provided by the Manager and Sub-Adviser had expanded over time as a result of regulatory and other developments, including maintaining and monitoring their own and the Fund’s expanded compliance programs. The Board also considered the Manager’s response to recent regulatory compliance issues affecting the Manager and the CAM fund complex. The Board reviewed information received from the Manager and the Fund’s Chief Compliance Officer regarding the implementation to date of the Fund’s compliance policies and procedures established pursuant to Rule 38a-1 under the Investment Company Act of 1940, as amended.
The Board reviewed the qualifications, backgrounds and responsibilities of the Fund’s senior personnel and the portfolio management team primarily responsible for the day-to-day portfolio management of the Fund. The Board also considered the willingness of the Manager to consider and implement organizational changes to improve investment results and the services provided to the CAM fund complex. The Board noted that the Manager’s Office of the Chief Investment Officer, comprised of the senior officers of the investment teams managing the funds in the CAM complex, participates in reporting to the Board on investment matters. The Board also considered, based on its knowledge of the Manager and its affiliates, the financial resources available to CAM and its parent organization, Citigroup Inc.
The Board also considered the Manager’s brokerage policies and practices, the standards applied in seeking best execution, the Manager’s policies and practices regarding soft dollars, the use of a broker affiliated with the Manager and the existence of quality controls applicable to brokerage allocation procedures. In addition, management also reported to the Board on, among other things, its business plans, recent organizational changes and portfolio manager compensation plan.
The Board concluded that, overall, it was satisfied with the nature, extent and quality of services provided (and expected to be provided) under the Agreements by the Manager.
40 Smith Barney Core Plus Bond Fund Inc.
Board Approval of Management Agreement (unaudited) (continued)
Fund Performance
The Board received and reviewed performance information for the Fund and for a group of comparable funds (the “Performance Universe”) selected by Lipper Inc., an independent provider of investment company data. The Board was provided with a description of the methodology Lipper used to determine the similarity of the Fund with the funds included in the Performance Universe. The information comparing the Fund’s performance to that of its Performance Universe, consisting of the Fund and all retail and institutional funds classified as “U.S. Mortgage funds” by Lipper, showed that the Fund’s performance for all time periods presented was lower than the median. The Board noted that effective March 18, 2005, the Board approved changes to the Fund’s name, investment objective and benchmark and restructured its investment strategy from a U.S. Mortgage only fund to an intermediate investment grade bond fund. The Board recognized that the Fund was in a period of transition, making reliance on past performance less significant. Management discussed with the Board its expectation that the changes would provide Fund shareholders with the potential for higher returns over time. The Board also received data comparing the Fund’s performance since the change to its investment objective and policies was implemented to its new benchmark index. The Board noted that the Fund generally performed in line with its benchmark, including its new benchmark during the brief period during which the Fund’s new policies were implemented. Based on its review, the Board generally was satisfied with the Fund’s recent performance as compared to its new benchmark and with the changes to the Fund’s investment objective and policies.
Management Fees and Expense Ratios
The Board reviewed and considered the contractual management fee (the “Contractual Management Fee”) payable by the Fund to the Manager for investment advisory and administrative services in light of the nature, extent and quality of the management services provided by the Manager. In addition, the Board noted that the compensation paid to the Sub-Adviser is paid by the Manager, not the Fund.
Additionally, the Board received and considered information comparing the Fund’s Contractual Management Fee and the Fund’s overall expense ratio with those of funds in both the relevant expense group (the “Expense Group”) and a broader group of funds, each selected and provided by Lipper. The Board also reviewed information regarding the fees the Manager charged its other U.S. clients investing primarily in an asset class similar to that of the Fund including, where applicable, separate accounts. The Manager reviewed with the Board the significant differences in the scope of services provided to the Fund and to these other clients, noting that the Fund is provided with regulatory compliance and administrative services, office facilities and fund officers (including the Fund’s chief executive, chief financial and chief compliance officers), and that the Manager coordinates and oversees the provision of services to the Fund by other fund providers, including the Sub-Adviser. The Board considered the fee comparisons in light of the scope of services required to manage these different types of accounts. The Board received an analysis of
Smith Barney Core Plus Bond Fund Inc. 41
Board Approval of Management Agreement (unaudited) (continued)
complex-wide management fees provided by the Manager, which, among other things, set out a proposed framework of fees based on asset classes.
Management also discussed with the Board the Fund’s distribution arrangements. The Board was provided with information concerning revenues received by and certain expenses incurred by the Fund’s affiliated distributors and how the amounts received by the distributors are expended.
The information comparing the Fund’s Contractual Management Fees as well as its actual total expense ratio to its Expense Group, consisting of ten retail front-end load funds (including Core Plus Bond Fund) classified as “U.S. Mortgage funds” by Lipper, showed that the Fund’s Contractual Management Fee was within the range of management fees paid by the other funds in the Expense Group but was higher than the median. The Board noted that the Fund’s actual total expense ratio was within the range of fees paid by the other funds in the Expense Group but was higher than the median.
Taking all of the above into consideration, the Board determined that the Management Fee was reasonable in light of the comparative performance and expense information and the nature, extent and quality of the services provided to the Fund under the Agreements.
Manager Profitability
The Board received and considered a profitability analysis of the Manager and its affiliates in providing services to the Fund. The Board also received profitability information with respect to the CAM fund complex as a whole. In addition, the Board received information with respect to the Manager’s allocation methodologies used in preparing this profitability data as well as a report from an outside consultant that had reviewed the Manager’s methodology. It was noted that the profitability percentage for managing the Fund was within ranges determined by appropriate court cases to be reasonable given the services rendered and, given the Fund’s overall performance and generally superior service levels provided. The Board determined that the Manager’s profitability was not excessive in light of the nature, extent and quality of the services provided to the Fund.
Economies of Scale
The Board received and considered information regarding whether there have been economies of scale with respect to the management of the Fund, whether the Fund has appropriately benefited from any economies of scale, and whether there is potential for realization of any further economies of scale. The Board considered whether economies of scale in the provision of services to the Fund were being passed along to the shareholders. The Board also considered whether alternative fee structures (such as with additional breakpoints at lower asset levels) would be more appropriate or reasonable taking into consideration economies of scale or other efficiencies.
The Board noted that at the time of the review the Fund had not yet reached the specified asset level at which a breakpoint to its Contractual Management Fee rate would be triggered. The Board noted that the Contractual Management Fee with breakpoints increases the potential for sharing economies of scale with shareholders as the Fund’s assets
42 Smith Barney Core Plus Bond Fund Inc.
Board Approval of Management Agreement (unaudited) (continued)
grow than if no breakpoints were in place. The Board considered whether the breakpoint fee structure was a reasonable means of sharing economies of scale or other efficiencies that might accrue from increases in the Fund’s asset levels. The Board also noted that as the Fund’s assets increase over time, other economies of scale may be realized as certain expenses, such as fixed Fund fees, become a smaller percentage of overall assets.
The Board determined that, given the current size and characteristics of the Fund, it was difficult to specifically identify any economies of scale that might be realized merely through an increase in the assets of the Fund other than through the Contractual Management Fee breakpoint. The Board noted that it appeared that the benefits of any economies of scale also would be appropriately shared with shareholders through increased investment in fund management and administration resources.
Other Benefits to the Manager
The Board considered other benefits received by the Manager and its affiliates as a result of the Manager’s relationship with the Fund, including any soft dollar arrangements, receipt of brokerage commissions and the opportunity to offer additional products and services to the Fund’s shareholders.
In light of the costs of providing investment management and other services to the Fund and the Manager’s ongoing commitment to the Fund, the profits and other ancillary benefits that the Manager and its affiliates received were considered reasonable.
Based on their discussions and considerations, including those described above, the Board members approved the Investment Advisory Agreement and the Administration Agreement to continue for another year.
No single factor reviewed by the Board was identified by the Board as the principal factor in determining whether to approve the Investment Advisory Agreement and Administration Agreement.
Additional Information
On June 23, 2005, Citigroup Inc. entered into a definitive agreement (the “Transaction Agreement”) with Legg Mason under which Citigroup agreed to sell substantially all of its asset management business, CAM, which includes the Manager, to Legg Mason in exchange for the broker-dealer and investment banking businesses of Legg Mason and certain other considerations (the “Transaction”). The Transaction closed on December 1, 2005.
The consummation of the Transaction resulted in the automatic termination of the Fund’s current advisory agreement and subadvisory agreement in accordance with the Investment Company Act of 1940, as amended (the “1940 Act”). Prior to the closing of the Transaction, the Fund’s Board approved a new management agreement between the Fund and the Manager (the “New Management Agreement”) and a new subadvisory agreement between the Manager and CAM Ltd., the Fund’s subadviser (the “Subadviser”) (the “New Subadvisory Agreement”) and authorized the Fund’s officers to submit the New Management Agreement and the New Subadvisory Agreement to shareholders for their approval.
Smith Barney Core Plus Bond Fund Inc. 43
Board Approval of Management Agreement (unaudited) (continued)
On July 11, 2005, members of the Board discussed with CAM management and certain Legg Mason representatives the Transaction and Legg Mason’s general plans and intentions regarding CAM’s business and its combination with Legg Mason’s business. The Board Members also inquired about the plans for and anticipated roles and responsibilities of certain CAM employees and officers after the Transaction.
At a meeting held on August 1, 2005, the Fund’s Board, including a majority of the Independent Directors, approved the New Management Agreement and the New Subadvisory Agreement. To assist the Board in its consideration of the New Management Agreement, Legg Mason provided materials and information about Legg Mason, including its financial condition, asset management capabilities and organization, and CAM provided materials and information about the Transaction between Legg Mason and Citigroup. To assist the Board in its consideration of the New Subadvisory Agreement, the Board received in advance of their meeting certain materials and information. Representatives of CAM and Legg Mason also made presentations to and responded to questions from the Board. The Independent Directors, through their independent legal counsel, also requested and received additional information from CAM and Legg Mason in connection with their consideration of the New Management Agreement and the New Subadvisory Agreement. The additional information was provided in advance of and at the August meeting. After the presentations and after reviewing the written materials provided, the Independent Directors met in an executive session with their counsel to consider the New Management Agreement and the New Subadvisory Agreement. The Independent Directors also conferred separately and with their counsel about the Transaction on a number of occasions, including in connection with the July and August meetings.
In their deliberations concerning the New Management Agreement, among other things, the Independent Directors considered:
(i) the reputation, financial strength and resources of Legg Mason and its investment advisory subsidiaries;
(ii) that, following the Transaction, CAM will be part of an organization focused on the asset management business;
(iii) that Legg Mason and its wholly-owned subsidiary, Western Asset Management Company and its affiliates (“Western Asset”), are experienced and respected asset management firms, and that Legg Mason has advised the Board Members that (a) it intends to combine the fixed income investment operations (including money market fund operations) of CAM with those of Western Asset and may also wish to combine other CAM operations with those of other Legg Mason subsidiaries; (b) after the closing of the Transaction, it will take steps to combine the investment management operations of Western Asset with the fixed income operations of the Manager, which, among other things, may involve Western Asset and the Manager sharing common systems and procedures, employees (including portfolio managers), investment and trading platforms, and other resources; (c) it is expected that these combination processes will result in changes to portfolio managers or portfolio management teams for a number of the CAM funds, subject to Board oversight and appropriate notice to shareholders, and that, in other cases, the current
44 Smith Barney Core Plus Bond Fund Inc.
Board Approval of Management Agreement (unaudited) (continued)
portfolio managers or portfolio management teams will remain in place; and (d) in the future, it may recommend that Western Asset or other Legg Mason subsidiaries be appointed as the adviser or subadviser to some or all of the CAM funds, subject to applicable regulatory requirements;
(iv) that CAM management had advised the Board that a number of portfolio managers and other key CAM personnel would be retained after the closing of the Transaction;
(v) that CAM management and Legg Mason have advised the Board that following the Transaction, there is not expected to be any diminution in the nature, quality and extent of services provided to the Fund and its shareholders by the Manager, including compliance services;
(vi) that under the Transaction Agreement, Citigroup and Legg Mason have agreed not to take any action that is not contemplated by the Transaction or fail to take any action that to their respective knowledge would cause any “undue burden” on Fund shareholders under applicable provisions of the 1940 Act;
(vii) the assurances from Citigroup and Legg Mason that, for a three year period following the closing of the Transaction, Citigroup-affiliated broker-dealers will continue to offer the Fund as an investment product, and the potential benefits to Fund shareholders from this and other third-party distribution access;
(viii) the division of responsibilities between the Manager and the Subadviser and the services provided by each of them, and the cost to the Manager of obtaining those services;
(ix) the potential benefits to Fund shareholders from being part of a combined fund family with Legg Mason-sponsored funds;
(x) that Citigroup and Legg Mason would derive benefits from the Transaction and that, as a result, they have a financial interest in the matters that were being considered;
(xi) the potential effects of regulatory restrictions on the Fund if Citigroup-affiliated broker-dealers remain principal underwriters of the Fund after the closing of the Transaction;
(xii) the fact that the Fund’s total advisory and administrative fees will not increase by virtue of the New Management Agreement, but will remain the same;
(xiii) the terms and conditions of the New Management Agreement, including the differences from the current advisory agreement, and the benefits of a single, uniform form of agreement covering these services;
(xiv) that the Fund would not bear the costs of obtaining shareholder approval of the New Management Agreement;
(xv) that the Fund would avail itself of permissions granted under certain licensing arrangements between Citigroup and Legg Mason that would permit the Fund (including any share classes thereof) to maintain its current name, as well as all logos, trademarks and service marks, related to Citigroup or any of its affiliates for some agreed upon time period after the closing of the Transaction ; and
(xvi) that, as discussed in detail above, within the past year the Board had performed a full annual review of the current advisory agreements as required by the
Smith Barney Core Plus Bond Fund Inc. 45
Board Approval of Management Agreement (unaudited) (continued)
1940 Act. In that regard, the Board, in its deliberations concerning the New Management Agreement, considered the same factors regarding the nature, quality and extent of services provided, costs of services provided, profitability, fall-out benefits, fees and economies of scale and investment performance as it did when it renewed the current advisory agreement, and reached substantially the same conclusions.
In their deliberations concerning the New Subadvisory Agreement, among other things, the Board Members considered:
(i) the current responsibilities of the Subadviser and the services currently provided by it;
(ii) Legg Mason’s combination plans, as described above;
(iii) that CAM management and Legg Mason have advised the Board that following the Transaction, there is not expected to be any diminution in the nature, quality and extent of services provided to the Fund and its shareholders by the Subadviser, including compliance services;
(iv) the fact that the fees paid to the Subadviser (which are paid by the Manager and not the Fund) will not increase by virtue of the New Subadvisory Agreement, but will remain the same;
(v) the terms and conditions of the New Subadvisory Agreement and the benefits of a single, uniform form of agreement covering these services;
(vi) that, as discussed in greater detail above, within the past year the Board had initially approved the current subadvisory agreement as required by the 1940 Act. In that regard, the Board, in its deliberations concerning the New Subadvisory Agreement, considered the same factors regarding the nature, quality and extent of services provided, costs of services provided, fees and economies of scale and investment performance as it did when it approved the current subadvisory agreement, and reached substantially the same conclusions.
(vii) that the Fund would not bear the costs of obtaining shareholder approval of the New Subadvisory Agreement; and
(viii) the factors enumerated and/or discussed above in connection with the approval of the New Management Agreement, to the extent relevant.
46 Smith Barney Core Plus Bond Fund Inc.
Additional Shareholder Information (unaudited)
Results of a Special Meeting of Shareholders
On October 21, 2005, a Special Meeting of Shareholders was held for the following purposes: 1) to approve a new management agreement and sub-advisory agreement and 2) to elect Directors. The following table provides the number of votes cast for, against or withheld, as well as the number of abstentions and broker non-votes as to each matter voted on at the Special Meeting of Shareholders.
1. Approval of New Management Agreement and Sub-Advisory Agreement
| | | | | | | | |
| Item Voted On | | Votes For | | Votes
Against | | Abstentions | | Broker
Non-Votes |
New Management Agreement | | 48,749,369.695 | | 319,219.378 | | 362,818.317 | | 266,524.000 |
New Sub-Advisory Agreement | | 48,830,008.739 | | 229,816.980 | | 371,581.671 | | 266,524.000 |
|
2. Election of Directors1
| | | | | | |
| Nominees: | | Votes For | | Authority
Withheld | | Abstentions |
Dwight B. Crane | | 49,354,337.967 | | 343,593.423 | | — |
Burt N. Dorsett | | 49,352,741.461 | | 345,189.929 | | — |
Elliot S. Jaffe | | 49,349,647.216 | | 348,284.174 | | — |
Stephen E. Kaufman | | 49,350,653.437 | | 347,277.953 | | — |
Cornelius C. Rose, Jr. | | 49,350,809.709 | | 347,121.681 | | — |
R. Jay Gerken | | 49,326,844.665 | | 371,086.725 | | — |
|
| 1 | | Directors are elected by the shareholders of all series of the Company. |
Smith Barney Core Plus Bond Fund Inc. 47
Smith Barney Core Plus Bond Fund Inc.
| | |
DIRECTORS Dwight B. Crane Burt N. Dorsett R. Jay Gerken, CFA Chairman Elliot S. Jaffe Stephen E. Kaufman Cornelius C. Rose, Jr. OFFICERS R. Jay Gerken, CFA President and Chief Executive Officer Andrew B. Shoup Senior Vice President and
Chief Administrative Officer Kaprel Ozsolak Chief Financial Officer
and Treasurer Ted P. Becker Chief Compliance Officer John Chiota Chief Anti-Money Laundering Compliance Officer Steven Frank Controller Robert I. Frenkel Secretary and
Chief Legal Officer | | INVESTMENT MANAGER Smith Barney Fund
Management LLC SUB-ADVISER Citigroup Asset
Management Ltd. DISTRIBUTORS Citigroup Global Markets Inc. Legg Mason Investor
Services, LLC CUSTODIAN State Street Bank and Trust Company TRANSFER AGENT PFPC Inc. 4400 Computer Drive Westborough, Massachusetts 01581 INDEPENDENT REGISTERED PUBLIC ACCOUNTING FIRM KPMG LLP 345 Park Avenue New York, New York 10154 |
This report is submitted for the general information of the shareholders of Smith Barney Core Plus Bond Fund, but it may also be used as sales literature when preceded or accompanied by the current prospectus.
This report must be preceded or accompanied by a free prospectus. Investors should consider the Fund’s investment objectives, risks, charges and expenses carefully before investing. The prospectus contains this and other important information about the Fund. Please read the prospectus carefully before investing.
www.citigroupam.com
©2006 Legg Mason Investor Services, LLC
Member NASD, SIPC
Smith Barney Core Plus Bond Fund Inc.
SMITH BARNEY CORE PLUS BOND FUND INC.
Smith Barney Mutual Funds
125 Broad Street
10th Floor, MF-2
New York, New York 10004
The Fund files its complete schedule of portfolio holdings with Securities and Exchange Commission for the first and third quarters of each fiscal year on Form N-Q. The Fund’s Forms N-Q are available on the Commission’s website at www.sec.gov. The Fund’s Forms N-Q may be reviewed and copied at the Commission’s Public Reference Room in Washington, D.C., and information on the operation of the Public Reference Room may be obtained by calling 1-800-SEC-0330. To obtain information on Form N-Q from the Fund, shareholders can call 1-800-451-2010.
Information on how the Fund voted proxies relating to portfolio securities during the most recent 12-month period ended June 30, and a description of the policies and procedures that the Fund uses to determine how to vote proxies relating to portfolio securities is available (1) without charge, upon request, by calling 1-800-451-2010, (2) on the Fund’s website at www.citigroupam.com and (3) on the SEC’s website at www.sec.gov.
ITEM 2. CODE OF ETHICS.
Not applicable.
ITEM 3. AUDIT COMMITTEE FINANCIAL EXPERT.
Not applicable.
ITEM 4. PRINCIPAL ACCOUNTANT FEES AND SERVICES.
Not applicable.
ITEM 5. AUDIT COMMITTEE OF LISTED REGISTRANTS.
Not applicable.
ITEM 6. SCHEDULE OF INVESTMENTS
Included herein under Item 1.
ITEM 7. DISCLOSURE OF PROXY VOTING POLICIES AND PROCEDURES FOR CLOSED-END MANAGEMENT INVESTMENT COMPANIES.
Not applicable.
ITEM 8. PORTFOLIO MANAGERS OF CLOSED-END MANAGEMENT INVESTMENT COMPANIES.
Not applicable.
ITEM 9. PURCHASES OF EQUITY SECURITIES BY CLOSED-END MANAGEMENT INVESTMENT COMPANY AND AFFILIATED PURCHASERS
Not applicable.
ITEM 10. SUBMISSION OF MATTERS TO A VOTE OF SECURITY HOLDERS
Not applicable.
ITEM 11. CONTROLS AND PROCEDURES.
| | (a) | The registrant’s principal executive officer and principal financial officer have concluded that the registrant’s disclosure controls and procedures (as defined in Rule 30a-3(c) under the Investment Company Act of 1940, as amended (the “1940 Act”)) are effective as of a date within 90 days of the filing date of this report that includes the disclosure required by this paragraph, based on their evaluation of the disclosure controls and procedures required by Rule 30a-3(b) under the 1940 Act and 15d-15(b) under the Securities Exchange Act of 1934. |
| | (b) | There were no changes in the registrant’s internal control over financial reporting (as defined in Rule 30a-3(d) under the 1940 Act) that occurred during the registrant’s last fiscal half-year (the registrant’s second fiscal half-year in the case of an annual report) that have materially affected, or are likely to materially affect the registrant’s internal control over financial reporting. |
ITEM 12. EXHIBITS.
| | |
| Exhibit 99.CERT | | Certifications pursuant to section 302 of the Sarbanes-Oxley Act of 2002 |
| |
| Exhibit 99.906CERT | | Certifications pursuant to Section 906 of the Sarbanes-Oxley Act of 2002 |
SIGNATURES
Pursuant to the requirements of the Securities Exchange Act of 1934 and the Investment Company Act of 1940, the registrant has duly caused this Report to be signed on its behalf by the undersigned, there unto duly authorized.
Smith Barney Core Plus Bond Fund Inc.
| | |
| By: | | /s/ R. Jay Gerken |
| | R. Jay Gerken |
| | Chief Executive Officer of |
| | Smith Barney Core Plus Bond Fund Inc. |
|
| Date: April 10, 2006 |
Pursuant to the requirements of the Securities Exchange Act of 1934 and the Investment Company Act of 1940, this report has been signed below by the following persons on behalf of the registrant and in the capacities and on the dates indicated.
| | |
| By: | | /s/ R. Jay Gerken |
| | R. Jay Gerken |
| | Chief Executive Officer of |
| | Smith Barney Core Plus Bond Fund Inc. |
|
| Date: April 10, 2006 |
| |
| By: | | /s/ Kaprel Ozsolak |
| | Kaprel Ozsolak |
| | Chief Financial Officer of |
| | Smith Barney Core Plus Bond Fund Inc. |
|
| Date: April 10, 2006 |