Exhibit 99.2

FY 2017 Q1 EARNINGS CALL PRESENTATION November 9, 2016

FORWARD LOOKING STATEMENTS Certain statements made or incorporated by reference in this presentation may constitute “forward- looking statements” within the meaning of the federal securities laws. These statements are made pursuant to the safe harbor provision of the Private Securities Litigation Reform Act of 1995. Statements regarding future events and developments and our future performance, as well as our expectations, beliefs, plans, estimates, or projections relating to the future, are forward-looking statements within the meaning of these laws. All forward-looking statements are subject to certain risks and uncertainties that could cause actual events to differ materially from those projected. Important risk factors related to our business are discussed in our Form 10-K filed with the Securities and Exchange Commission (“SEC”) on August 30, 2016, and may be discussed in subsequent filings with the SEC. The risk factors discussed in such Form 10-K under the heading “Risk Factors” are specifically incorporated by reference in this presentation.Our forward-looking statements are based on current expectations and speak only as of the date of this presentation. We undertake no obligation to publicly update or revise any forward-looking statement, whether as a result of future events, new information, or otherwise. 2
CONCURRENT HIGHLIGHTS Q1 Revenue of $13.1 Million FY’17 Revenue Flat to Slightly Higher over FY’16
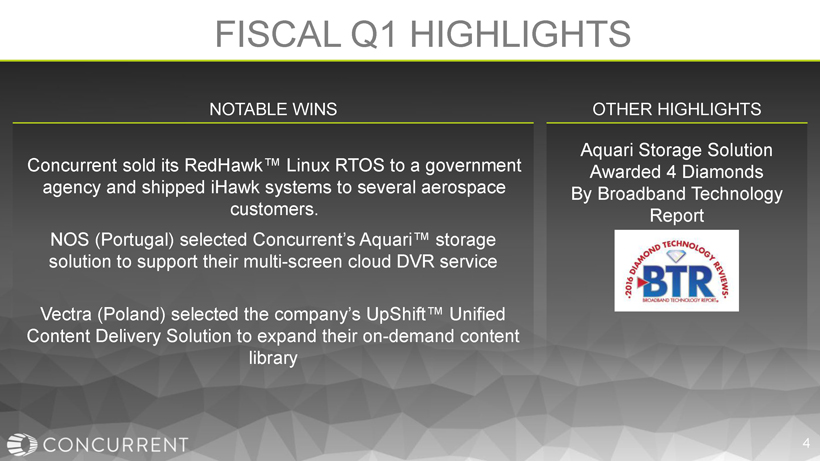
FISCAL Q1 HIGHLIGHTS NOS (Portugal) selected Concurrent’sAquari™ storage solution to support their multi-screen cloud DVR service NOTABLE WINS OTHER HIGHLIGHTS AquariStorage Solution Awarded 4 Diamonds By Broadband Technology Report Concurrent sold its RedHawk™Linux RTOS to the U.S. Navy and shipped iHawksystems to several aerospace customers. Vectra (Poland) selected the company’s UpShift™ Unified Content Delivery Solution to expand their on-demand content library 4
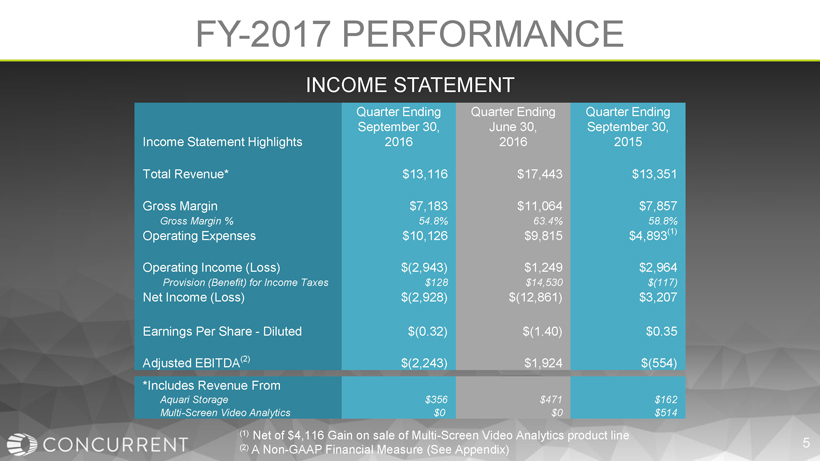
Income Statement Highlights Quarter Ending September30, 2016 Quarter Ending June 30, 2016 Quarter Ending September 30, 2015 Total Revenue* $13,116 $17,443 $13,351 Gross Margin $7,183 $11,064 $7,857 GrossMargin % 54.8% 63.4% 58.8% Operating Expenses $10,126 $9,815 $4,893 (1) Operating Income (Loss) $(2,943) $1,249 $2,964 Provision(Benefit) for Income Taxes $128 $14,530 $(117) Net Income (Loss) $(2,928) $(12,861) $3,207 Earnings Per Share -Diluted $(0.32) $(1.40) $0.35 Adjusted EBITDA (2) $(2,243) $1,924 $(554) INCOME STATEMENT FY-2017 PERFORMANCE 5 *Includes Revenue From AquariStorage $356 $471 $162 Multi-Screen Video Analytics $0 $0 $514 (1) Net of $4,116 Gain on sale of Multi-Screen Video Analytics product line (2) A Non-GAAP Financial Measure (See Appendix)
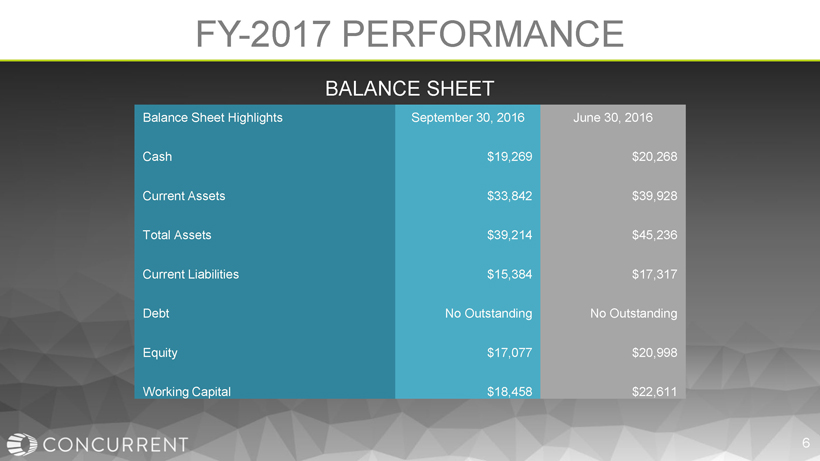
Balance Sheet Highlights September 30, 2016 June 30, 2016 Cash $19,269 $20,268 Current Assets $33,842 $39,928 Total Assets $39,214 $45,236 Current Liabilities $15,384 $17,317 Debt No Outstanding No Outstanding Equity $17,077 $20,998 Working Capital $18,458 $22,611 BALANCE SHEET FY-2017 PERFORMANCE 6
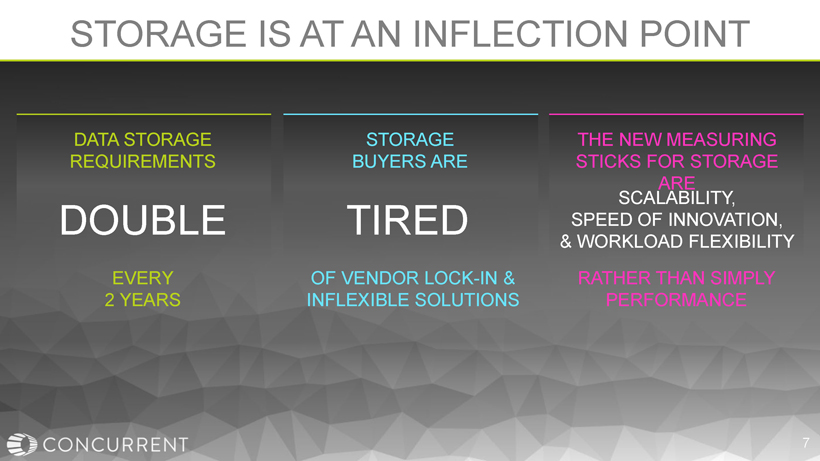
STORAGE IS AT AN INFLECTION POINT 7 DATA STORAGE REQUIREMENTS STORAGE BUYERS ARE THE NEW MEASURING STICKS FOR STORAGE ARE EVERY 2 YEARS OF VENDOR LOCK-IN & INFLEXIBLE SOLUTIONS RATHER THAN SIMPLY PERFORMANCE DOUBLE TIRED SCALABILITY, SPEED OF INNOVATION, & WORKLOAD FLEXIBILITY

UPCOMING EVENTS November 8-10 London Storage & Content Delivery November 15-16 Chicago Storage Nov 28 -Dec 2 Orlando Real-Time Solutions 8 I/ITSEC
To supplement the company’s condensed consolidated financial statements prepared in accordance with U.S. generally accepted accounting principles (“GAAP”), this presentation provides information concerning the company’s Adjusted EBITDA, a non-GAAP financial measure. Reconciliations of Adjusted EBITDA to net income, the most comparable GAAP financial measure, can be found in tables immediately following this slide. For purposes of this presentation, Adjusted EBITDA is defined as GAAP net income, less interest income and other income (expense), net, provision for income taxes, depreciation and amortization expenses, share-based compensation expense and gain on the sale of assets. The company considers Adjusted EBITDA important to understanding its historical results and identifying current and future trends impacting its business. Management uses Adjusted EBITDA to compare the company’s performance to that of prior periods and evaluate the company’s financial and operating results on a consistent basis from period to period. The company also believes this measure, when viewed in combination with the company’s financial results prepared in accordance with GAAP, provides useful information to investors to evaluate ongoing operating results and trends. The adjustments to the company’s GAAP results are made with the intent of providing both management and investors a more complete understanding of the company’s underlying operational results, trends and performance. Additionally, adjusted EBITDA is not intended to be a measure of cash flow for management’s discretionary use. We believe that the inclusion of Adjusted EBITDA is appropriate to provide additional information to investors because securities analysts, noteholdersand other investors use these non-GAAP financial measures to assess our operating performance across periods on a consistent basis and to evaluate the relative risk of an investment in our securities. Adjusted EBITDA has limitations as an analytical tool, however, including the following: • Although depreciation and amortization are non-cash charges, the assets being depreciated and amortized will often have to be replaced in the future and adjusted EBITDA does not reflect any cash requirements for such replacements; • Adjusted EBITDA does not reflect our cash expenditures, or future requirements for capital expenditures or contractual commitments; • Adjusted EBITDA does not reflect changes in, or cash requirements for, our working capital needs; • Adjusted EBITDA does not reflect our tax expense or any cash requirements to pay income taxes; and • Adjusted EBITDA does not reflect the impact of earnings or charges resulting from matters we do not consider to be indicativeofour ongoing operations, but may nonetheless have a material impact on our results of operations. The presentation of Adjusted EBITDA is not meant to be considered in isolation or as a substitute for or superior to the company’s financial results determined in accordance with GAAP. In addition, the company’s presentation of Adjusted EBITDA may not be computed in the same manner as similarly titled measures used by other companies, including other companies in our industry. APPENDIX NON-GAAP FINANCIAL MEASURES
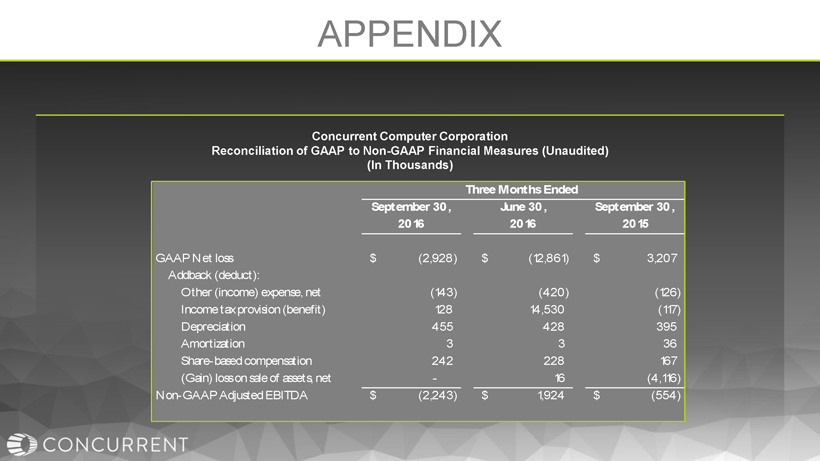
APPENDIX Concurrent Computer Corporation Reconciliation of GAAP to Non-GAAP Financial Measures (Unaudited) (In Thousands) September 30, June 30, September 30, 2016 2016 2015 GAAP Net loss (2,928)$ (12,861)$ 3,207$ Addback (deduct): Other (income) expense, net (143) (420) (126) Income tax provision (benefit) 128 14,530 (117) Depreciation 455 428 395 Amortization 3 3 36 Share-based compensation 242 228 167 (Gain) loss on sale of assets, net - 16 (4,116) Non-GAAP Adjusted EBITDA (2,243)$ 1,924$ (554)$ Three Months Ended

THANK YOU