Exhibit 99.1
| 2013 Annual Report |
| Vision Financial Highlights 2013 BODY & CHASSIS VEHICLE ENGINEERING & CONTRACT MANUFACTURING POWERTRAIN We aim to be our customers' preferred global supplier partner for the automotive industry, by delivering the best value built on innovative products and processes and World Class Manufacturing. We strive to be the employer of choice, an ethical and responsible corporate citizen, and a superior long-term investment for our shareholders. |

| EXTERIORS CLOSURES ELECTRONICS SEATING |

| Our Three Priorities provide a consistent focus across hundreds of facilities located on five continents. We believe the roadmap for our continued success lies at the axis of these priorities, harnessing and guiding our energies in the right direction. INTERIORS VISION SYSTEMS ROOF SYSTEMS |

Global Operating Principles
Magna’s entrepreneurial corporate culture, highlighted in the principles shown below, is one of the main reasons for Magna’s success and our greatest competitive advantage.
Decentralized Operating Structure
Magna’s manufacturing divisions operate as independent profit centres aligned by geographic region in each of our product areas. This decentralized structure prevents bureaucracy and makes Magna more responsive to customer needs and changes within the global automotive industry, as well as within specific regions.
Employee Involvement
By keeping operating units relatively small and flexible, Magna fosters greater employee involvement and initiative. This environment also allows Magna to recognize and reward individuals’ contributions and maintain open communication.
Entrepreneurial Managers
Entrepreneurial, hands-on managers with strong tooling, engineering and manufacturing backgrounds run Magna’s divisions. Division managers are responsible for ensuring profitability, achieving customer satisfaction and upholding the principles of the Magna Employee’s Charter.
Employee Profit Sharing and Ownership
Through the Employee Equity and Profit Participation Program, eligible employees share ten percent of Magna’s qualifying annual profits before tax. As part-owners working in an environment where productivity is rewarded, Magna employees are motivated to produce quality products at competitive prices.

Management’s Message to Shareholders
2013 was another record breaking year for Magna. Sales, net income, earnings per share and cash flow from operations all surpassed last year’s record levels. Magna’s share price rose 64% in 2013, once again outperforming the Dow Jones Industrial Average as well as the average increase of our closest peers. This follows the 50% increase in our share price in 2012.
During 2013, we again made significant investments in our business totalling $1.4 billion, including fixed assets, investments and other assets. Consistent with recent years, our investment in fixed assets took place in our traditional markets as well as in growing regions to support our continued sales growth.
We also distributed more cash to shareholders — a total of $1.3 billion for the year. In 2013, aggregate dividends paid to shareholders amounted to $284 million. For the fourth quarter of 2013, our Board further increased our quarterly dividend by 19% to a record $0.38 per share. This marks the fourth consecutive year of annual fourth quarter dividend increases. In addition, during 2013, we repurchased 14.1 million shares, returning $1.0 billion to shareholders. Despite the significant investments in our business and return of capital to shareholders, our balance sheet ended 2013 in a strong position, with $1.6 billion of cash and under $400 million of debt.
In January of this year, we communicated our intention to accelerate the use of our balance sheet, which would entail reducing cash balances and adding to our debt levels by the end of 2015. The actions already taken and proposed to put our balance sheet to work are a reflection of the confidence the Board has in our future and our continued drive to enhance value for our shareholders. At the same time, we intend to maintain balance sheet strength in order to have the liquidity and flexibility to invest in our business and capitalize on opportunities.
Other key operating highlights from 2013:
· Our operations in North America continued to generate strong results. Our sales outpaced the increase in North American light vehicle production and Adjusted EBIT growth remained strong.
· Our Europe segment once again showed significant year-over-year improvement. Adjusted EBIT increased 127% to $375 million. Our plan to improve operating results in Europe is ongoing and on track, and we are satisfied with our progress to date.
· We also improved Adjusted EBIT in Asia this past year. This was achieved despite the continued significant investments we are making to support future growth in the region.
· Magna’s efforts in World Class Manufacturing continue to be recognized by our customers, in part highlighted through supplier awards won in 2013:
· We received the Volkswagen Group Award 2013 in the Global Champion Category for outstanding achievements in entrepreneurial performance and swift support for Volkswagen in emerging markets.
· General Motors awarded 13 of our manufacturing divisions across five countries the Supplier Quality Excellence Award.
· Our Seating operating unit received the General Motors Supplier of the Year Award for delivering innovative technology, superior quality, timely crisis management, and competitive total enterprise cost solutions.
· Magna received the BMW Supplier Innovation Award for outstanding achievement in innovation and development. Our Cosma operating unit was recognized in the area of lightweight construction for a high-voltage battery housing made of die-cast aluminum.
· A Magna division supplying electronic components received a Quality Excellence Award from Volvo.
· Other supplier awards were received from customers such as Changan Ford, Shanghai-GM, and Honda.
· Magna was also recognized through industry awards. Our Exteriors operating unit received the SPE Innovation Award for the Nissan Rogue thermoplastic liftgate. Magna Seating received the J.D. Power 2013 Seat Quality Award for the highest ranking seat quality in the Mass Market Compact CUV and MPV vehicle segment.
· Consistent with our continued growth in new regions, in China we announced the opening of a Magna Steyr engineering facility in Shenyang, a powertrain plant in Tianjin, and an electronics production line in Zhangjiagang. In addition, we announced the opening of new Magna plants in Serbia and Turkey.
Despite our record results, certain of our facilities continue to underperform relative to our expectations. We have action plans in place at these facilities, which we expect will result in improvements to their operating results over time.
Going Forward
We anticipate continued growth in global light vehicle production in the coming years. Markets in Asia and Europe are expected to be the largest drivers of this growth. We intend to further invest to capitalize on vehicle production growth, and, to this end, we expect fixed asset spending to be at record levels this year. Our continued investment, combined with our global presence, our customer relationships, and our financial strength, leave us well positioned to benefit from this ongoing global industry growth.
We remain focused on:
· Accelerating innovation of new and enhanced products, processes and materials;
· Further implementation of our World Class Manufacturing initiative throughout our facilities globally;
· Identifying and developing our future leaders globally at all levels of the organization, through our Leadership Development System;
· Executing our product strategy to ensure we can maintain or strengthen our leadership position in our product areas;
· Living by the principles outlined in our Employee’s Charter and ensuring that our operations globally are conducted ethically and in accordance with the standards of integrity and respect embodied in Magna’s Operational Principles and our Code of Conduct and Ethics; and
· Taking steps to utilize our balance sheet to continue to deliver value to shareholders.
In closing, we would like to thank our shareholders and customers for their ongoing trust in Magna. And we would especially like to thank our dedicated employees and managers worldwide for their hard work and commitment to making Magna stronger each year. Strong businesses are built with great people, and we believe we have an abundance of great people here at Magna.
Sincerely,
/s/ Donald J. Walker |
| /s/ Vincent J. Galifi |
|
|
|
Donald J. Walker |
| Vincent J. Galifi |
Chief Executive Officer |
| Executive Vice-President and Chief Financial Officer |
Magna Employee’s Charter
Magna is committed to an operating philosophy which is based on fairness and concern for people. This philosophy is part of Magna’s Fair Enterprise culture in which employees and management share in the responsibility to ensure the success of the company. It includes these principles:

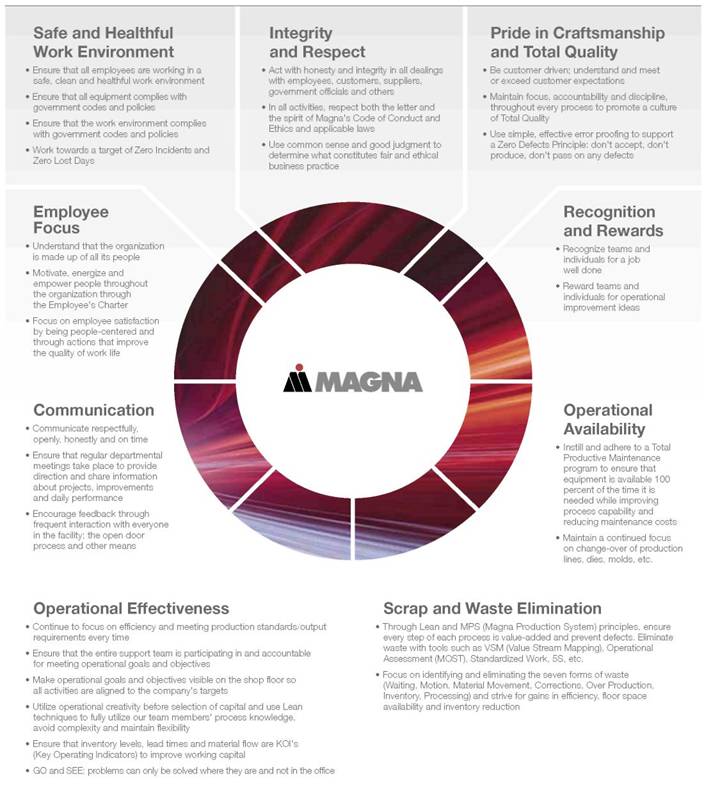
Magna Operational Principles
We seek to be recognized by our customers as the leader in World Class Manufacturing. We believe we can achieve this goal by engaging our employees to apply the following Operational Principles in all of our facilities around the world:
Our Commitment
Innovation
Led by some of the best and brightest people who believe in challenging the status quo, innovation is the engine that drives our business forward.
As a company, we are committed to delivering game-changers that are — Smarter, Cleaner, Safer, and Lighter — providing a framework for continuous improvement in products, processes, raw materials and business practices. These focused efforts help ensure alignment with market needs, consumer trends and government regulations, resulting in value to all of our stakeholders.

In addition, we are committed to being a good corporate citizen through concrete actions in five core areas:
Society & Community Development — positively impacting the communities in which we operate by supporting social and charitable causes and contributing in areas of extreme need.
Occupational Health & Safety — providing a safe and healthful work environment for our employees and visitors to our facilities.
Environmental Responsibility & Stewardship — minimizing the impact of our practices, processes and products through environmental initiatives and sustainability efforts.
Respect for Human Rights & Global Working Conditions — ensuring ethical, dignified and respectful treatment of our employees and those throughout our supply base.
Supply Chain Responsibility — actively participating in industry efforts to develop common standards addressing important social issues such as business ethics, environmental standards, global working conditions and conflict minerals.
We are committed to making a difference while delivering value to our shareholders, customers and employees. After all, the future is ours to make.
1 |
| Management’s Discussion and Analysis of Results of Operations and Financial Position |
|
|
|
33 |
| Management’s Responsibility for Financial Reporting |
|
|
|
34 |
| Reports of Independent Registered Public Accounting Firm |
|
|
|
36 |
| Consolidated Statements of Income and Consolidated Statements of Comprehensive Income |
|
|
|
37 |
| Consolidated Statements of Cash Flows |
|
|
|
38 |
| Consolidated Balance Sheets |
|
|
|
39 |
| Consolidated Statements of Changes in Equity |
|
|
|
40 |
| Notes to the Consolidated Financial Statements |
|
|
|
74 |
| Supplementary Financial and Share Information |
|
|
|
|
| Corporate Directory (inside back cover) |
MAGNA INTERNATIONAL INC.
Management’s Discussion and Analysis of Results of Operations and Financial Position
Unless otherwise noted, all amounts in this Management’s Discussion and Analysis of Results of Operations and Financial Position (“MD&A”) are in U.S. dollars and all tabular amounts are in millions of U.S. dollars, except per share figures, which are in U.S. dollars. When we use the terms “we”, “us”, “our” or “Magna”, we are referring to Magna International Inc. and its subsidiaries and jointly controlled entities, unless the context otherwise requires.
This MD&A should be read in conjunction with the audited consolidated financial statements for the year ended December 31, 2013, as well as the “Forward-Looking Statements” on page 32.
This MD&A has been prepared as at March 7, 2014.
OVERVIEW
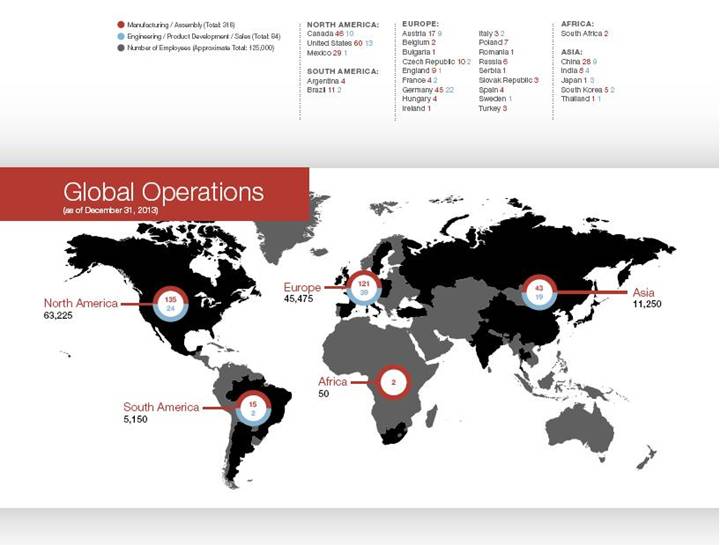
We are a leading global automotive supplier with 316 manufacturing operations and 84 product development, engineering and sales centres in 29 countries. We have over 125,000 employees focused on delivering superior value to our customers through innovative processes and World Class Manufacturing. Our product capabilities include producing body, chassis, interior, exterior, seating, powertrain, electronic, vision, closure and roof systems and modules, as well as complete vehicle engineering and contract manufacturing. Our Common Shares trade on the Toronto Stock Exchange (MG) and the New York Stock Exchange (MGA). We follow a corporate policy of functional and operational decentralization, pursuant to which we conduct our operations through divisions, each of which is an autonomous business unit operating within pre-determined guidelines.
HIGHLIGHTS
Operations
Global light vehicle production increased once again in 2013, representing the fourth straight year of production growth. In our two primary markets, North American light vehicle production increased 5% to 16.2 million units, while European light vehicle production declined 1% to 19.3 million units.
Our 2013 total sales were a record $34.84 billion, an increase of 13% over 2012. North American, European, Asian and Rest of World production sales, as well as tooling and other sales all increased to record levels in 2013, and complete vehicle assembly sales increased 20% in 2013, compared to 2012.
Adjusted EBIT1 for 2013 was a record $2.07 billion, compared to $1.66 billion for 2012, representing an increase of 25%. Margin earned on the higher sales as well as a higher Adjusted EBIT percentage of sales drove the $407 million increase over 2012.
In our North America segment, our strong performance continued in 2013. Total sales increased 10% over 2012 to $17.95 billion, driven by the launch of new programs and higher North American light vehicle production, and Adjusted EBIT increased 8% as compared to 2012 to $1.65 billion. Adjusted EBIT for 2013 included $158 million of amortization related to the August 2012 acquisition of Magna E-Car Systems Partnership (“E-Car”), while Adjusted EBIT for 2012 included $52 million of amortization related to the E-Car acquisition.
In our Europe segment, total sales increased by $2.01 billion or 16% to $14.72 billion in 2013, despite the 1% decline in European light vehicle production. This largely reflects the higher average euro relative to the U.S. dollar, acquisitions previously completed and the launch of new business during 2013 compared to 2012. We reported a 127% increase in Adjusted EBIT in our Europe segment to $375 million for 2013, compared to $165 million for 2012. Margins earned on higher sales, including sales related to new launches, improved results at certain underperforming operations and the benefits of restructuring and downsizing activities were the primary drivers of improved earnings in Europe.
In our Asia segment, total sales increased $395 million or 31% in 2013 compared to 2012, driven by higher light vehicle production as well as the launch of new business, particularly in China. Adjusted EBIT was $85 million for 2013, a 73% increase over $49 million in 2012. The improvement mainly reflects margins earned on the higher sales level in 2013 compared to 2012.
In our Rest of World segment, total sales increased $67 million or 8% during 2013, while our Adjusted EBIT loss was $76 million for 2013, compared to an Adjusted EBIT loss of $77 million for 2012. Our South American operations continued to be hampered in 2013 by higher production costs, particularly inflationary increases that we have been unable to pass on to our customers.
1 Adjusted EBIT represents income from operations before income taxes; interest expense (income), net; and other expense (income), net
Investments
In 2013, we once again made significant investments in our business, totalling $1.37 billion, including fixed assets, investments, and other assets.
Our fixed asset spending in 2013 was $1.17 billion, as we continued to invest both in our traditional markets and to further expand our footprint in growing regions. Furthermore, we spent $192 million for investments and other assets.
Return of Capital to Shareholders
In 2013, aggregate dividends paid to shareholders amounted to $284 million. On February 28, 2014 our Board of Directors declared a dividend of U.S. $0.38 per share, a new record, representing an increase of 19% over the third quarter of 2013 dividend.
In 2013, we also repurchased 14.1 million shares, returning an additional $1.02 billion to shareholders.
In November 2013, our Board of Directors approved a normal course issuer bid to purchase up to 12 million of our issued and outstanding Common Shares, representing 5.4% of our public float of Common Shares. Approximately 9.49 million shares remain available under the normal course issuer bid, which will terminate in November 2014.
Going Forward
We are forecasting another year of light vehicle production growth in North America, driven by the ongoing strengthening of North American auto sales. In addition, we anticipate continued strong operating performance in our North America segment.
We are forecasting European light vehicle production in 2014 to be approximately in line with 2013. We have made improvements to our European operations and have been increasing our footprint in Eastern Europe. In addition, we have been taking, and will continue to take, restructuring actions, predominantly in Western Europe, reflecting both our ongoing strategic assessment of our business and our response to OEM facility actions. During 2014, we expect to record additional restructuring charges of approximately $75 million in Europe. We expect our restructuring and continued operational improvement plans to yield further increased earnings in Europe over time.
We expect to generate improved results in our Asia segment, driven by lower new facility costs and higher sales, as new facilities ramp-up. Lastly, in our Rest of World segment we expect to benefit from actions we are taking to address commercial challenges and improve on operational inefficiencies in South America.
FINANCIAL RESULTS SUMMARY
During 2013, we posted sales of $34.84 billion, an increase of 13% from 2012. This higher sales level was a result of increases in our North American, European, Asian and Rest of World production sales, our complete vehicle assembly sales and tooling, engineering and other sales. Comparing 2013 to 2012:
· North American vehicle production increased 5% and our North American production sales increased 9% to $16.74 billion;
· European vehicle production decreased 1% while our European production sales increased 13% to $9.96 billion;
· Asia production sales increased 35% to $1.39 billion;
· Rest of World production sales increased 7% to $858 million;
· Complete vehicle assembly volumes increased 19% and sales increased 20% to $3.06 billion; and
· Tooling, engineering and other sales increased 22% to $2.82 billion.
During 2013, we earned income from operations before income taxes of $1.91 billion compared to $1.75 billion for 2012. Excluding other expense (income), net (“Other Expense” or “Other Income”) recorded in 2013 and 2012, as discussed in the “Other Expense” section, the $407 million increase in income from operations before income taxes was primarily as a result of:
· margins earned on higher production sales;
· incremental margin earned on new programs that launched during or subsequent to 2012;
· the benefit of restructuring and downsizing activities recently undertaken in Europe;
· productivity and efficiency improvements at certain facilities;
· higher equity income;
· acquisitions completed during or subsequent to 2012, including ixetic Verwaltungs GmbH (“ixetic”);
· improved pricing on certain unprofitable contracts, primarily in Europe;
· lower restructuring and downsizing costs;
· $10 million of cash received related to the settlement of asset-backed commercial paper (“ABCP”) between the Investment Industry Regulatory Organization of Canada and financial institutions;
· a loss on disposal of an investment in the second quarter of 2012;
· net favourable settlement of certain commercial items, primarily in Europe;
· favourable earn-out settlement in Rest of World;
· lower commodity costs;
· lower stock-based compensation; and
· lower warranty costs of $3 million.
These factors were partially offset by:
· incremental intangible asset amortization of $106 million related to the acquisition and re-measurement of E-Car;
· programs that ended production during or subsequent to 2012;
· a larger amount of employee profit sharing;
· higher costs incurred in preparation for upcoming launches;
· higher incentive compensation;
· the recovery of due diligence costs in the second quarter of 2012;
· a $7 million net decrease in revaluation gain in respect of ABCP;
· increased pre-operating costs incurred at new facilities; and
· operational inefficiencies and other costs at certain facilities.
During 2013, net income attributable to Magna International Inc. was $1.56 billion, an increase of $128 million compared to 2012 and diluted earnings per share increased $0.67 to $6.76 for 2013 compared to $6.09 for 2012. Other Expense and Other Income, after tax and the Deferred Tax Adjustments impacted net income attributable to Magna International Inc. and diluted earnings per share as follows:
|
| 2013 |
| 2012 |
| ||||||||
|
| Net Income |
| Diluted |
| Net Income |
| Diluted |
| ||||
|
| Attributable |
| Earnings |
| Attributable |
| Earnings |
| ||||
|
| to Magna |
| per Share |
| to Magna |
| per Share |
| ||||
Other expense (income) |
| $ | 144 |
| $ | 0.63 |
| $ | (108 | ) | $ | (0.45 | ) |
Income tax effect: |
|
|
|
|
|
|
|
|
| ||||
Other expense (income) |
| (28 | ) | (0.12 | ) | 24 |
| 0.10 |
| ||||
Deferred tax adjustments |
| (57 | ) | (0.25 | ) | (89 | ) | (0.38 | ) | ||||
Net income impact |
| 59 |
| 0.26 |
| (173 | ) | (0.73 | ) | ||||
Non-controlling interests |
| (9 | ) | (0.04 | ) | — |
| — |
| ||||
|
| $ | 50 |
| $ | 0.22 |
| $ | (173 | ) | $ | (0.73 | ) |
Other Expense and Other Income, and the Deferred Tax Adjustments are discussed in the “Other Expense” and “Income Taxes” sections, respectively.
Excluding the $50 million negative impact for 2013 and the $173 million positive impact for 2012, net income attributable to Magna International Inc. for 2013 increased $351 million compared to 2012.
Excluding the $0.22 per share negative impact for 2013 and the $0.73 per share positive impact for 2012, diluted earnings per share increased $1.62, as a result of the increase in net income attributable to Magna International Inc. and a decrease in the weighted average number of diluted shares outstanding during 2013. The decrease in the weighted average number of diluted shares outstanding was due to the purchase and cancellation of Common Shares, during or subsequent to 2012, pursuant to our normal course issuer bids and the cashless exercise of options, partially offset by the issue of Common Shares related to the exercise of stock options, an increase in the number of diluted options outstanding as a result of an increase in the trading price of our common stock and stock options issued subsequent to 2012.
INDUSTRY TRENDS AND RISKS
A number of general trends which have been impacting the automotive industry and our business in recent years are expected to continue, including the following:
· the consolidation of vehicle platforms and proliferation of high-volume platforms supporting multiple vehicles and produced in multiple locations;
· the long-term growth of the automotive industry in China, India and other high-growth/low cost markets, including accelerated movement of component and vehicle design, development, engineering and manufacturing to certain of these markets;
· the growth of the A to C vehicle segments (micro to compact cars), particularly in developing markets;
· the extent to which innovation in the automotive industry is being driven by governmental regulation of fuel economy and carbon dioxide/greenhouse gas emissions, vehicle safety and vehicle recyclability;
· the growth of cooperative alliances and arrangements among competing automotive OEMs, including shared purchasing of components; joint engine, powertrain and/or platform development; engine, powertrain and platform sharing; and joint vehicle hybridization and electrification initiatives and other forms of cooperation;
· the growing importance of electronics in the automotive value chain;
· �� the consolidation of automotive suppliers; and
· the ongoing exertion of pricing pressure by OEMs.
The following are some of the more significant risks that could affect our ability to achieve our desired results:
· The global automotive industry is cyclical. A worsening of economic and political conditions, including through rising interest rates or inflation, high unemployment, increasing energy prices, declining real estate values, increased volatility in global capital markets, international conflicts, sovereign debt concerns, an increase in protectionist measures and/or other factors, may result in lower consumer confidence, which has a significant impact on consumer demand for vehicles. Vehicle production is closely related to consumer demand. A significant decline in production volumes from current levels could have a material adverse effect on our profitability.
· The European automotive industry continues to experience significant overcapacity, elevated levels of vehicle inventory, reduced consumer demand for vehicles and depressed production volumes and sales levels. In response to these conditions, some OEMs are restructuring their European operations, including through plant closures, and other OEMs may take similar actions. In addition to planned actions, we may take additional restructuring or downsizing actions. In such an event, we may incur restructuring, downsizing and/or other significant non-recurring costs in our European operations, which could have a material adverse effect on our profitability.
· The automotive industry has in recent years been the subject of increased government enforcement of antitrust and competition laws, particularly by the United States Department of Justice and the European Commission. Currently, investigations are being conducted in several product areas. We understand that investigations of this nature can continue for several years, and regulators in other jurisdictions could choose to initiate investigations in existing or other product areas. Where wrongful conduct is found, antitrust regulators have the authority to impose significant civil or criminal penalties.
On September 24, 2013, representatives of the Bundeskartellamt, the German Federal Cartel Office (the “Cartel Office”), attended at one of the Company’s operating Divisions in Germany to obtain information in connection with an ongoing antitrust investigation relating to suppliers of automobile textile coverings and components, particularly trunk linings. In light of the early stage of the Cartel Office investigation, we are unable to predict its duration or outcome, including whether any operating Division of the Company could be found liable for any violation of law or the extent of any fine, if found to be liable. The Cartel Office has the authority to impose administrative fines which it calculates in accordance with formula-based guidelines tied to the level of affected sales. The formula also takes into account the gravity of the infringement, as well as other mitigating and aggravating factors. Absent aggravating factors, the maximum fine is typically 10% of the affected sales for the infringement period multiplied by a factor based on the consolidated sales of the group of companies to which the offending entity belongs. If applied to a company with Magna’s level of consolidated sales, this factor is approximately five, which could result in a maximum fine of approximately 50% of the affected sales. Additional information regarding these guidelines is publicly available on the Cartel Office’s website.
Our policy is to comply with all applicable laws, including antitrust and competition laws. In the event of any violation of such laws, any fines imposed by a regulatory authority, including by the Cartel Office under the guidelines referred to above, could have a material adverse effect on our profitability in the year such fine is imposed.
· In light of the amount of business we currently have with our largest customers in North America and Europe, our opportunities for incremental growth with these customers may be limited. The amount of business we have with Asian-based OEMs, including Toyota, Nissan, Hyundai/Kia and Honda, generally lags that of our largest customers, due in part to the existing relationships between such Asian-based OEMs and their preferred suppliers. There is no certainty that we can achieve growth with Asian-based OEMs, nor that any such growth will offset slower growth we may experience with our largest customers in North America and Europe. Our inability to sustain or grow our business with OEMs could have a material adverse effect on our profitability.
· We may sell some product lines and/or downsize, close or sell some of our operating divisions. By taking such actions, we may incur restructuring, downsizing and/or other significant non-recurring costs. These costs may be higher in some countries than others and could have a material adverse effect on our profitability.
· Although we are working to turn around financially underperforming operating divisions, there is no guarantee that we will be successful in doing so in the short to medium term. The continued underperformance of one or more operating divisions could have a material adverse effect on our profitability and operations.
· We face ongoing pricing pressure from OEMs, including through: long-term supply agreements with mutually agreed price reductions over the life of the agreement; incremental annual price concession demands; and pressure to absorb costs related to product design, engineering and tooling and other items previously paid for directly by OEMs. OEMs possess significant leverage over their suppliers as a result of their purchasing power and the highly competitive nature of the automotive supply industry. We attempt to offset price concessions and costs in a number of ways, including through negotiations with our customers, improved operating efficiencies and cost reduction efforts. Our inability to fully offset price concessions or costs previously paid for by OEMs could have an adverse effect on our profitability.
· The launch of new business is a complex process, the success of which depends on a wide range of factors, including the production readiness of our and our suppliers’ manufacturing facilities and manufacturing processes, as well as factors related to tooling, equipment, employees, initial product quality and other factors. Our failure to successfully launch material new or takeover business could have an adverse effect on our profitability.
· Although we supply parts to all of the leading OEMs, a significant majority of our sales are to six customers: General Motors, Fiat-Chrysler, BMW, Ford, Volkswagen and Daimler. While we have diversified our customer base somewhat in recent years and continue to attempt to further diversify, there is no assurance we will be successful. Shifts in market share away from our top customers could have a material adverse effect on our profitability.
· While we supply parts for a wide variety of vehicles produced globally, we do not supply parts for all vehicles produced, nor is the number or value of parts evenly distributed among the vehicles for which we do supply parts. Shifts in market shares among vehicles or vehicle segments, particularly shifts away from vehicles on which we have significant content and shifts away from vehicle segments in which our sales may be more heavily concentrated, could have a material adverse effect on our profitability.
· While we continue to expand our manufacturing footprint with a view to taking advantage of opportunities in markets such as China, Russia, India and Brazil and other non-traditional markets for us, we cannot guarantee that we will be able to fully realize such opportunities. Additionally, the establishment of manufacturing operations in new markets carries its own risks, including those relating to political, civil and economic instability and uncertainty; corruption risks; high inflation and our ability to recover inflation-related cost increases; trade, customs and tax risks; expropriation risks; currency exchange rates; currency controls; limitations on the repatriation of funds; insufficient infrastructure; and other risks associated with conducting business internationally. Expansion of our business in non-traditional markets is an important element of our strategy and, as a result, our exposure to the risks described above may be greater in the future. The likelihood of such occurrences and their potential effect on us vary from country to country and are unpredictable, however, the occurrence of any such risks could have an adverse effect on our operations, financial condition and profitability.
· A disruption in the supply of components to us from our suppliers could cause the temporary shut-down of our or our customers’ production lines. Any prolonged supply disruption, including due to the inability to re-source or in-source production, could have a material adverse effect on our profitability.
· Some of our manufacturing facilities are unionized, as are many manufacturing facilities of our customers and suppliers. Unionized facilities are subject to the risk of labour disruptions from time to time, including as a result of restructuring actions taken by us, our customers and other suppliers. We cannot predict whether or when any labour disruption may arise, or how long it lasts if it does arise. A significant labour disruption could lead to a lengthy shutdown of our or our customers’ and/or our suppliers’ production lines, which could have a material adverse effect on our operations and profitability.
· The automotive supply industry is highly competitive. As a result of our diversified automotive business, some competitors in each of our product capabilities have greater market share than we do. Failure to successfully compete with existing or new competitors could have an adverse effect on our operations and profitability.
· We depend on the outsourcing of components, modules and assemblies, as well as complete vehicles, by OEMs. The extent of OEM outsourcing is influenced by a number of factors, including: relative cost, quality and timeliness of production by suppliers as compared to OEMs; capacity utilization; OEMs’ perceptions regarding the strategic importance of certain components/modules to them; labour relations among OEMs, their employees and unions; and other considerations. A reduction in outsourcing by OEMs, or the loss of any material production or assembly programs combined with the failure to secure alternative programs with sufficient volumes and margins, could have a material adverse effect on our profitability.
· Contracts from our customers consist of blanket purchase orders which generally provide for the supply of components for a customer’s annual requirements for a particular vehicle, instead of a specific quantity of products. These blanket purchase orders can be terminated by a customer at any time and, if terminated, could result in our incurring various pre-production, engineering and other costs which we may not recover from our customer and which could have an adverse effect on our profitability.
· We continue to invest in technology and innovation which we believe will be critical to our long-term growth. Our ability to anticipate changes in technology and to successfully develop and introduce new and enhanced products and/or manufacturing processes on a timely basis will be a significant factor in our ability to remain competitive. If we are unsuccessful or are less successful than our competitors in consistently developing innovative products and/or processes, we may be placed at a competitive disadvantage, which could have a material adverse effect on our profitability and financial condition.
· We recorded significant impairment charges related to goodwill and long-lived assets in recent years and may continue to do so in the future. The early termination, loss, renegotiation of the terms of, or delay in the implementation of, any significant production contract could be indicators of impairment. In addition, to the extent that forward-looking assumptions regarding: the impact of turnaround plans on underperforming operations; new business opportunities; program price and cost assumptions on current and future business; the timing and success of new program launches; and forecast production volumes; are not met, any resulting impairment loss could have a material adverse effect on our profitability.
· Prices for certain key raw materials and commodities used in our parts, including steel and resin, continue to be volatile. To the extent we are unable to offset commodity price increases by passing such increases to our customers, by engineering products with reduced commodity content, through hedging strategies, or otherwise, such additional commodity costs could have a material adverse effect on our profitability.
· Although our financial results are reported in U.S. dollars, a significant portion of our sales and operating costs are realized in Canadian dollars, euros, British pounds and other currencies. Our profitability is affected by movements of the U.S. dollar against the Canadian dollar, the euro, the British pound and other currencies in which we generate revenues and incur expenses. Significant long-term fluctuations in relative currency values, in particular a significant change in the relative values of the U.S. dollar, Canadian dollar, euro or British pound, could have an adverse effect on our profitability and financial condition and any sustained change in such relative currency values could adversely impact our competitiveness in certain geographic regions.
· We intend to continue to pursue acquisitions in those product areas which we have identified as key to our business strategy. However, we may not be able to identify suitable acquisition targets or successfully acquire any suitable targets which we identify. Additionally, we may not be able to successfully integrate or achieve anticipated synergies from those acquisitions which we do complete, which could have a material adverse effect on our profitability.
· Although we seek to conduct appropriate levels of due diligence of our acquisition targets, these efforts may not always prove to be sufficient in identifying all risks and liabilities related to the acquisition, including as a result of limited access to information, time constraints for conducting due diligence, inability to access target company plants and/or personnel or other limitations on the due diligence process. As a result, we may become subject to liabilities or risks not discovered through our due diligence efforts, which could have a material adverse effect on our profitability.
· Our customers continue to demand that we bear the cost of the repair and replacement of defective products which are either covered under their warranty or are the subject of a recall by them. Warranty provisions are established based on our best estimate of the amounts necessary to settle existing or probable claims on product defect issues. Recall costs are costs incurred when government regulators and/or our customers decide to recall a product due to a known or suspected performance issue and we are required to participate either voluntarily or involuntarily. Currently, under most customer agreements, we only account for existing or probable warranty claims. Under certain complete vehicle engineering and assembly contracts, we record an estimate of future warranty-related costs based on the terms of the specific customer agreements and the specific customer’s warranty experience. While we possess considerable historical warranty and recall data and experience with respect to the products we currently produce, we have little or no warranty and recall data which allows us to establish accurate estimates of, or provisions for, future warranty or recall costs relating to new products, assembly programs or technologies being brought into production. The obligation to repair or replace such products could have a material adverse effect on our profitability and financial condition.
· Our manufacturing facilities are subject to risks associated with natural disasters, including fires, floods, hurricanes and earthquakes. The occurrence of any of these disasters could cause the total or partial destruction of a manufacturing facility, thus preventing us from supplying products to our customers and disrupting production at their facilities for an indeterminate period of time. The inability to promptly resume the supply of products following a natural disaster at a manufacturing facility could have a material adverse effect on our operations and profitability.
· Some of our current and former employees in Canada and the United States participate in defined benefit pension plans. Although these plans have been closed to new participants, existing participants in Canada continue to accrue benefits. Our defined benefit pension plans are not fully funded and our pension funding obligations could increase significantly due to a reduction in the funding status caused by a variety of factors, including: weak performance of capital markets; declining interest rates; failure to achieve sufficient investment returns; investment risks inherent in the investment portfolios of the plans; and other factors. A significant increase in our pension funding obligations could have a material adverse effect on our profitability and financial condition.
· From time to time, we may become involved in regulatory proceedings, or become liable for legal, contractual and other claims by various parties, including customers, suppliers, former employees, class action plaintiffs and others. Depending on the nature or duration of any potential proceedings or claims, we may incur substantial costs and expenses and may be required to devote significant management time and resources to the matters. On an ongoing basis, we attempt to assess the likelihood of any adverse judgments or outcomes to these proceedings or claims, although it is difficult to predict final outcomes with any degree of certainty. Except as disclosed from time to time in our consolidated financial statements, we do not believe that any of the proceedings or claims to which we are party will have a material adverse effect on our profitability; however, we cannot provide any assurance to this effect.
· We have incurred losses in some countries which we may not be able to fully or partially offset against income we have earned in those countries. In some cases, we may not be able to utilize these losses at all if we cannot generate profits in those countries and/or if we have ceased conducting business in those countries altogether. Our inability to utilize tax losses could materially adversely affect our profitability. At any given time, we may face other tax exposures arising out of changes in tax or transfer pricing laws, tax reassessments or otherwise. To the extent we cannot implement measures to offset these exposures, they may have a material adverse effect on our profitability.
· In recent years, we have invested significant amounts of money in our business through capital expenditures to support new facilities, expansion of existing facilities, purchases of production equipment and acquisitions. Returns achieved on such investments in the past are not necessarily indicative of the returns we may achieve on future investments and our inability to achieve returns on future investments which equal or exceed returns on past investments could have a material adverse effect on our level of profitability.
· We believe we will have sufficient available cash to successfully execute our business plan and balance sheet strategy, even in the event of another global recession similar to that of 2008-2009. However, uncertain economic conditions create significant planning risks for us. The occurrence of an economic shock not contemplated in our business plan, a rapid deterioration of economic conditions or a more prolonged recession than that experienced in 2008-2009 could result in the depletion of our cash resources, which could have a material adverse effect on our operations and financial condition.
· Trading prices of our Common Shares cannot be predicted and may fluctuate significantly due to a variety of factors, many of which are outside our control, including: general economic and stock market conditions; variations in our operating results and financial condition; differences between our actual operating and financial results and those expected by investors and stock analysts; changes in recommendations made by stock analysts, whether due to factors relating to us, our customers, the automotive industry or otherwise; significant news or events relating to our primary customers, including the release of vehicle production and sales data; investor and stock analyst perceptions about the prospects for our or our primary customers’ respective businesses or the automotive industry; and other factors.
RESULTS OF OPERATIONS
Average Foreign Exchange
|
| For the three months |
| For the year |
| ||||||||||
|
| ended December 31, |
| ended December 31, |
| ||||||||||
|
| 2013 |
| 2012 |
| Change |
| 2013 |
| 2012 |
| Change |
| ||
1 Canadian dollar equals U.S. dollars |
| 0.953 |
| 1.010 |
| - | 6 | % | 0.971 |
| 1.001 |
| - | 3 | % |
1 euro equals U.S. dollars |
| 1.361 |
| 1.298 |
| + | 5 | % | 1.328 |
| 1.286 |
| + | 3 | % |
1 British pound equals U.S. dollars |
| 1.619 |
| 1.607 |
| + | 1 | % | 1.564 |
| 1.585 |
| - | 1 | % |
The preceding table reflects the average foreign exchange rates between the most common currencies in which we conduct business and our U.S. dollar reporting currency. The changes in these foreign exchange rates for the three months and year ended December 31, 2013 impacted the reported U.S. dollar amounts of our sales, expenses and income.
The results of operations whose functional currency is not the U.S. dollar are translated into U.S. dollars using the average exchange rates in the table above for the relevant period. Throughout this MD&A, reference is made to the impact of translation of foreign operations on reported U.S. dollar amounts where relevant.
Our results can also be affected by the impact of movements in exchange rates on foreign currency transactions (such as raw material purchases or sales denominated in foreign currencies). However, as a result of hedging programs employed by us, foreign currency transactions in the current period have not been fully impacted by movements in exchange rates. We record foreign currency transactions at the hedged rate where applicable.
Finally, foreign exchange gains and losses on revaluation and/or settlement of monetary items denominated in a currency other than an operation’s functional currency impact reported results. These gains and losses are recorded in selling, general and administrative expense.
RESULTS OF OPERATIONS — FOR THE YEAR ENDED DECEMBER 31, 2013
Sales
|
| 2013 |
| 2012 |
| Change |
| |||
Vehicle Production Volumes (millions of units) |
|
|
|
|
|
|
| |||
North America |
| 16.188 |
| 15.450 |
| + | 5 | % | ||
Europe |
| 19.313 |
| 19.432 |
| - | 1 | % | ||
Sales |
|
|
|
|
|
|
|
| ||
External Production |
|
|
|
|
|
|
|
| ||
North America |
| $ | 16,744 |
| $ | 15,336 |
| + | 9 | % |
Europe |
| 9,957 |
| 8,786 |
| + | 13 | % | ||
Asia |
| 1,391 |
| 1,034 |
| + | 35 | % | ||
Rest of World |
| 858 |
| 803 |
| + | 7 | % | ||
Complete Vehicle Assembly |
| 3,062 |
| 2,561 |
| + | 20 | % | ||
Tooling, Engineering and Other |
| 2,823 |
| 2,317 |
| + | 22 | % | ||
Total Sales |
| $ | 34,835 |
| $ | 30,837 |
| + | 13 | % |
External Production Sales - North America
External production sales in North America increased 9% or $1.40 billion to $16.74 billion for 2013 compared to $15.34 billion for 2012, primarily as a result of:
· the launch of new programs during or subsequent to 2012, including the:
· Ford Fusion and Lincoln MKZ;
· Jeep Cherokee;
· GM full-size pickups;
· Honda Accord;
· Chevrolet Impala; and
· Tesla Model S;
· higher production volumes on certain existing programs;
· acquisitions completed during or subsequent to 2012 which positively impacted sales by $155 million, including STT Technologies (“STT”); and
· an increase in content on certain programs, including the:
· Buick Enclave, GMC Acadia and Chevrolet Traverse; and
· Jeep Grand Cherokee.
These factors were partially offset by:
· programs that ended production during or subsequent to 2012, including the Jeep Liberty;
· a decrease in reported U.S. dollar sales primarily as a result of the weakening of the Canadian dollar against the U.S. dollar;
· a decrease in content on certain programs, including the Jeep Patriot and Compass; and
· net customer price concessions subsequent to 2012.
External Production Sales - Europe
External production sales in Europe increased 13% or $1.17 billion to $9.96 billion for 2013 compared to $8.79 billion for 2012, primarily as a result of:
· the launch of new programs during or subsequent to 2012, including the:
· Mercedes-Benz A-Class;
· MINI Paceman;
· Mercedes-Benz CLA-Class;
· Ford Kuga; and
· Skoda Rapid and SEAT Toledo;
· acquisitions completed during or subsequent to 2012, which positively impacted sales by $466 million, including ixetic and BDW technologies group (“BDW”) and the re-acquisition of an interior systems operation; and
· a $233 million increase in reported U.S. dollar sales primarily as a result of the strengthening of the euro against the U.S. dollar.
These factors were partially offset by:
· lower production volumes on certain existing programs;
· programs that ended production during or subsequent to 2012; and
· net customer price concessions subsequent to 2012.
External Production Sales - Asia
External production sales in Asia increased 35% or $357 million to $1.39 billion for 2013 compared to $1.03 billion for 2012, primarily as a result of:
· higher production volumes on certain existing programs;
· the launch of new programs during or subsequent to 2012, primarily in China;
· a $25 million increase in reported U.S. dollar sales as a result of the net strengthening of foreign currencies against the U.S. dollar, including the Chinese Renminbi; and
· acquisitions completed during or subsequent to 2012, which positively impacted sales by $18 million, including ixetic.
These factors were partially offset by net customer price concessions subsequent to 2012.
External Production Sales - Rest of World
External production sales in Rest of World increased 7% or $55 million to $858 million for 2013 compared to $803 million for 2012, primarily as a result of:
· the launch of new programs during or subsequent to 2012, primarily in Argentina and Brazil;
· higher production volumes on certain existing programs; and
· net customer price increases subsequent to 2012.
These factors were partially offset by:
· a $106 million decrease in reported U.S. dollar sales as a result of the net weakening of foreign currencies against the U.S. dollar, including the Brazilian real and Argentine peso; and
· programs that ended production during or subsequent to 2012.
Complete Vehicle Assembly Sales
|
| 2013 |
| 2012 |
| Change |
| |||
Complete Vehicle Assembly Sales |
| $ | 3,062 |
| $ | 2,561 |
| + | 20 | % |
Complete Vehicle Assembly Volumes (Units) |
| 146,566 |
| 123,602 |
| + | 19 | % | ||
Complete vehicle assembly sales increased 20%, or $501 million, to $3.06 billion for 2013 compared to $2.56 billion for 2012 and assembly volumes increased 19% or 22,964 units.
The increase in complete vehicle assembly sales is primarily as a result of:
· the launch of the MINI Paceman during the fourth quarter of 2012;
· an increase in assembly volumes for the Mercedes-Benz G-Class; and
· a $93 million increase in reported U.S. dollar sales as a result of the strengthening of the euro against the U.S. dollar.
These factors were partially offset by:
· the end of production of the Aston Martin Rapide at our Magna Steyr facility during the second quarter of 2012; and
· a decrease in assembly volumes for the Peugeot RCZ.
Tooling, Engineering and Other Sales
Tooling, engineering and other sales increased 22% or $506 million to $2.82 billion for 2013 compared to $2.32 billion for 2012.
In 2013, the major programs for which we recorded tooling, engineering and other sales were the:
· GM full-size pickups and SUVs;
· Ford Transit;
· QOROS 3;
· Ford Fusion;
· Mercedes-Benz M-Class;
· MINI Countryman;
· Skoda Octavia;
· MINI Cooper;
· MINI Paceman; and
· Jeep Grand Cherokee;
In 2012, the major programs for which we recorded tooling, engineering and other sales were the:
· Ford Fusion;
· MINI Countryman;
· Mercedes-Benz M-Class;
· Chevrolet Trax;
· QOROS 3;
· Opel Cascada Convertible;
· Chevrolet Spin;
· Ford Escape;
· Infiniti hatchback program;
· Dodge Dart; and
· Ford Transit.
In addition, tooling, engineering and other sales increased as a result of the net strengthening of foreign currencies against the U.S. dollar, including the strengthening of the euro partially offset by the weakening of the Canadian dollar.
Cost of Goods Sold and Gross Margin
|
| 2013 |
| 2012 |
| ||
Sales |
| $ | 34,835 |
| $ | 30,837 |
|
Cost of goods sold |
|
|
|
|
| ||
Material |
| 22,293 |
| 19,706 |
| ||
Direct labour |
| 2,272 |
| 2,038 |
| ||
Overhead |
| 5,722 |
| 5,275 |
| ||
|
| 30,287 |
| 27,019 |
| ||
Gross margin |
| $ | 4,548 |
| $ | 3,818 |
|
|
|
|
|
|
| ||
Gross margin as a percentage of sales |
| 13.1 | % | 12.4 | % | ||
Cost of goods sold increased $3.27 billion to $30.29 billion for 2013 compared to $27.02 billion for 2012 primarily as a result of:
· higher material, overhead and labour costs associated with the increase in sales, including wage increases at certain operations;
· $684 million related to acquisitions completed during or subsequent to 2012, including ixetic, STT, E-Car and the re-acquisition of an interior systems operation;
· increased pre-operating costs incurred at new facilities;
· a net increase in reported U.S. dollar cost of goods sold primarily due to the strengthening of the euro against the U.S. dollar partially offset by the weakening of the Canadian dollar, Brazilian real and Argentine peso, each against the U.S. dollar; and
· a larger amount of employee profit sharing.
Gross margin increased $730 million to $4.55 billion for 2013 compared to $3.82 billion for 2012 and gross margin as a percentage of sales increased to 13.1% for 2013 compared to 12.4% for 2012. The increase in gross margin as a percentage of sales was primarily due to:
· margins earned on higher production sales;
· incremental margin earned on new programs that launched during or subsequent to 2012;
· improved pricing on certain unprofitable contracts;
· lower commodity costs;
· the closure of certain facilities;
· lower warranty costs; and
· productivity and efficiency improvements at certain facilities.
These factors were partially offset by:
· an increase in complete vehicle assembly sales which have a higher material content than our consolidated average;
· a larger amount of employee profit sharing;
· an increase in tooling, engineering and other sales that have low or no margins;
· the re-acquisition, during 2012, of an interior systems operation;
· higher costs incurred in preparation for upcoming launches;
· increased pre-operating costs incurred at new facilities;
· programs that ended production during or subsequent to 2012; and
· operational inefficiencies and other costs at certain facilities.
Depreciation and Amortization
Depreciation and amortization costs increased $262 million to $1.06 billion for 2013 compared to $0.80 billion for 2012. The higher depreciation and amortization was primarily as a result of:
· incremental intangible asset amortization of $106 million related to the acquisition and re-measurement of E-Car;
· $80 million related to acquisitions completed during or subsequent to 2012, including ixetic, E-Car and STT;
· depreciation related to new facilities; and
· other capital spending during or subsequent to 2012.
Selling, General and Administrative (“SG&A”)
SG&A expense as a percentage of sales was 4.6% for 2013 compared to 4.9% for 2012. SG&A expense increased $106 million to $1.62 billion for 2013 compared to $1.51 billion for 2012 primarily as a result of:
· higher labour and other costs to support the growth in sales, including wage increases at certain operations;
· increased costs incurred at new facilities;
· $25 million related to acquisitions completed during or subsequent to 2012, including ixetic, E-Car, and STT;
· higher incentive compensation;
· a $7 million net decrease in revaluation gains in respect of ABCP; and
· higher employee profit sharing.
These factors were partially offset by:
· lower restructuring and downsizing costs;
· $10 million of cash received related to the settlement of ABCP between the Investment Industry Regulatory Organization of Canada and financial institutions;
· a loss on disposal of an investment in 2012; and
· lower stock-based compensation.
Equity Income
Equity income increased $45 million to $196 million for 2013 compared to $151 million for 2012. Equity income for 2012 included $35 million of equity loss related to our investment in E-Car and $5 million of equity income related to our investment in STT. Excluding this $30 million net equity loss, the $15 million increase in equity income is primarily as a result of higher income from most of our equity accounted investments.
Other Expense (Income), net
During 2013 and 2012, we recorded Other Expense and Other Income items as follows:
|
| 2013 |
| 2012 |
| ||||||||||||||
|
|
|
| Net Income |
| Diluted |
|
|
| Net Income |
| Diluted |
| ||||||
|
| Operating |
| Attributable |
| Earnings |
| Operating |
| Attributable |
| Earnings |
| ||||||
|
| Income |
| to Magna |
| per Share |
| Income |
| to Magna |
| per Share |
| ||||||
Fourth Quarter |
|
|
|
|
|
|
|
|
|
|
|
|
| ||||||
Restructuring charges (1) |
| $ | 35 |
| $ | 25 |
| $ | 0.11 |
| $ | 55 |
| $ | 53 |
| $ | 0.23 |
|
Impairment of long-lived assets (1) |
| 33 |
| 21 |
| 0.09 |
| 25 |
| 23 |
| 0.10 |
| ||||||
Impairment of goodwill (1) |
| 22 |
| 22 |
| 0.10 |
| — |
| — |
| — |
| ||||||
Re-measurement gain of STT (2) |
| — |
| — |
| — |
| (35 | ) | (35 | ) | (0.15 | ) | ||||||
|
| 90 |
| 68 |
| 0.30 |
| 45 |
| 41 |
| 0.18 |
| ||||||
Third Quarter |
|
|
|
|
|
|
|
|
|
|
|
|
| ||||||
Restructuring charges (1) |
| 48 |
| 33 |
| 0.14 |
| — |
| — |
| — |
| ||||||
Re-measurement gain of E-Car (2) |
| — |
| — |
| — |
| (153 | ) | (125 | ) | (0.53 | ) | ||||||
|
| 48 |
| 33 |
| 0.14 |
| (153 | ) | (125 | ) | (0.53 | ) | ||||||
First Quarter |
|
|
|
|
|
|
|
|
|
|
|
|
| ||||||
Restructuring charges (1) |
| 6 |
| 6 |
| 0.02 |
| — |
| — |
| — |
| ||||||
Full year other expense (income), net |
| $ | 144 |
| $ | 107 |
| $ | 0.47 |
| $ | (108 | ) | $ | (84 | ) | $ | (0.35 | ) |
(1) Restructuring and Impairment Charges
[a] For the year ended December 31, 2013
(i) Restructuring Costs
As a result of recent customer announcements related to plant closures, the profitability of certain facilities and the level of future booked business, we determined that restructuring would have to be completed in our traditional European markets in order to remain cost competitive over the long-term. As a result, during the fourth, third and first quarters of 2013, we recorded net restructuring charges of $35 million ($25 million after tax), $48 million ($33 million after tax) and $6 million ($6 million after tax), respectively, in Europe at our exterior and interior systems operations related primarily to the closure of a facility in Belgium.
Substantially all of these restructuring costs remain to be paid subsequent to 2013.
During 2014, we expect to record additional restructuring charges of approximately $75 million.
(ii) Impairments of Long-lived Assets
In conjunction with our annual business planning cycle, during the fourth quarter of 2013 we recorded long-lived asset impairment charges of $33 million ($21 million after tax and non-controlling interests) consisting of $23 million in North America and $10 million in Rest of World. The impairment charges related to battery research equipment in North America and fixed assets at our Seating operations in South America.
(iii) Impairment of Goodwill
In conjunction with our annual business planning cycle, during the fourth quarter of 2013 we recorded goodwill impairment charges of $22 million ($22 million after tax) in Rest of World related to our metal stamping operations.
[b] For the year ended December 31, 2012
(i) Restructuring Costs
During the fourth quarter of 2012, we recorded restructuring charges of $55 million ($53 million after tax) in Europe primarily at our exterior and interior systems and complete vehicle and engineering services operations.
(ii) Impairments of Long-lived Assets
During the fourth quarter of 2012 we recorded long-lived asset impairment charges of $23 million ($22 million after tax) in Europe and $2 million ($1 million after tax) in North America. In Europe, the impairment charges related primarily to fixed assets at our exterior and interior systems operations.
(2) Re-measurement gains
(i) STT Technologies Inc.
On October 26, 2012, we acquired the remaining 50% interest in STT for cash consideration of $55 million. STT is a manufacturer of automotive pumps with operations in Canada and Mexico. Prior to the acquisition, we accounted for this investment using the equity method of accounting.
The incremental investment in STT was accounted for under the business acquisition method of accounting as a step acquisition which requires that we re-measure our pre-existing investment in STT at fair value and recognize any gains or losses in income. The estimated fair value of our investment immediately before the closing date was $55 million, which resulted in the recognition of a non-cash gain of $35 million ($35 million after tax).
(ii) Magna E-Car Systems LP
On August 31, 2012, we acquired the controlling 27% interest in E-Car from a company affiliated with the Stronach Group for cash consideration of $75 million.
Prior to the acquisition, we held the 73% non-controlling interest in E-Car and accounted for this investment using the equity method of accounting. The incremental investment in E-Car was accounted for under the business acquisition method of accounting as a step acquisition which requires that we re-measure our pre-existing investment in E-Car at fair value and recognize any gains or losses in income. The estimated fair value of our partnership interest immediately before the closing date was $205 million, which resulted in the recognition of a non-cash gain of $153 million ($125 million after tax).
Segment Analysis
Given the differences between the regions in which we operate, our operations are segmented on a geographic basis. Beginning in the fourth quarter of 2013, our segments consist of North America, Europe, Asia and Rest of World. Consistent with the above, our internal financial reporting segments key internal operating performance measures between North America, Europe, Asia and Rest of World for purposes of presentation to the chief operating decision maker to assist in the assessment of operating performance, the allocation of resources, and our long-term strategic direction and future global growth.
Our chief operating decision maker uses Adjusted EBIT as the measure of segment profit or loss, since we believe Adjusted EBIT is the most appropriate measure of operational profitability or loss for our reporting segments. Adjusted EBIT represents income from operations before income taxes; interest expense, net; and other expense (income), net.
|
| External Sales |
| Adjusted EBIT |
| ||||||||||||||
|
| 2013 |
| 2012 |
| Change |
| 2013 |
| 2012 |
| Change |
| ||||||
North America |
| $ | 17,859 |
| $ | 16,241 |
| $ | 1,618 |
| $ | 1,645 |
| $ | 1,521 |
| $ | 124 |
|
Europe |
| 14,525 |
| 12,563 |
| 1,962 |
| 375 |
| 165 |
| 210 |
| ||||||
Asia |
| 1,539 |
| 1,188 |
| 351 |
| 85 |
| 49 |
| 36 |
| ||||||
Rest of World |
| 889 |
| 822 |
| 67 |
| (76 | ) | (77 | ) | 1 |
| ||||||
Corporate and Other |
| 23 |
| 23 |
| — |
| 36 |
| — |
| 36 |
| ||||||
Total reportable segments |
| $ | 34,835 |
| $ | 30,837 |
| $ | 3,998 |
| $ | 2,065 |
| $ | 1,658 |
| $ | 407 |
|
Excluded from Adjusted EBIT for 2013 and 2012 were the following Other Expense and Other Income items, which have been discussed in the “Other Expense” section.
|
| 2013 |
| 2012 |
| ||
North America |
|
|
|
|
| ||
Impairment charges |
| $ | 23 |
| $ | 2 |
|
Re-measurement gain of STT |
| — |
| (35 | ) | ||
|
| 23 |
| (33 | ) | ||
Europe |
|
|
|
|
| ||
Restructuring charges |
| 89 |
| 55 |
| ||
Impairment charges |
| — |
| 23 |
| ||
|
| 89 |
| 78 |
| ||
Rest of World |
|
|
|
|
| ||
Impairment charges |
| 32 |
| — |
| ||
Corporate and Other |
|
|
|
|
| ||
Re-measurement gain of E-Car |
| — |
| (153 | ) | ||
|
| $ | 144 |
| $ | (108 | ) |
North America
Adjusted EBIT in North America increased $124 million to $1.65 billion for 2013 compared to $1.52 million for 2012 primarily as a result of:
· margins earned on higher production sales;
· incremental margin earned on new programs that launched during or subsequent to 2012;
· lower restructuring and downsizing costs;
· decreased pre-operating costs incurred at new facilities;
· the benefit of restructuring and downsizing activities recently undertaken; and
· productivity and efficiency improvements at certain facilities.
These factors were partially offset by:
· incremental intangible asset amortization of $106 million related to the acquisition and re-measurement of E-Car;
· programs that ended production during or subsequent to 2012;
· operational inefficiencies and other costs at certain facilities;
· higher costs incurred in preparation for upcoming launches;
· a larger amount of employee profit sharing;
· higher affiliation fees paid to Corporate; and
· increased commodity costs.
Europe
Adjusted EBIT in Europe increased $210 million to $375 million for 2013 compared to $165 million for 2012 primarily as a result of:
· margins earned on higher production sales;
· incremental margin earned on new programs that launched during or subsequent to 2012;
· improved pricing on certain unprofitable contracts;
· acquisitions completed during or subsequent to 2012, including ixetic;
· the benefit of restructuring and downsizing activities recently undertaken;
· lower costs incurred in preparation for upcoming launches;
· decreased commodity costs;
· net favourable settlement of certain commercial items;
· higher equity income;
· decreased pre-operating costs incurred at new facilities; and
· productivity and efficiency improvements at certain facilities.
These factors were partially offset by:
· a larger amount of employee profit sharing;
· higher affiliation fees paid to Corporate;
· higher restructuring and downsizing costs;
· higher incentive compensation; and
· operational inefficiencies and other costs at certain facilities.
Asia
Asia Adjusted EBIT increased $36 million to $85 million for 2013 compared to $49 million for 2012 primarily as a result of:
· margins earned on higher production sales, including margins earned on the launch of new facilities and new programs;
· productivity and efficiency improvements at certain facilities;
· higher equity income; and
· lower warranty costs of $2 million.
These factors were partially offset by:
· increased costs related to new facilities;
· a larger amount of employee profit sharing;
· higher costs incurred in preparation for upcoming launches;
· higher affiliation fees paid to Corporate; and
· higher incentive compensation.
Rest of World
Rest of World Adjusted EBIT increased $1 million to a loss of $76 million for 2013 compared to a loss of $77 million for 2012 primarily as a result of:
· margins earned on higher production sales, including margins earned on the launch of new facilities and new programs;
· productivity and efficiency improvements at certain facilities;
· favourable earn-out settlement;
· lower restructuring and downsizing costs; and
· net customer price increases subsequent to 2012.
These factors were partially offset by:
· higher production costs, including inflationary increases, that we have not been fully successful in passing through to our customers;
· increased costs related to new facilities;
· higher affiliation fees paid to Corporate;
· higher costs incurred in preparation for upcoming launches; and
· higher incentive compensation.
Corporate and Other
Corporate and Other Adjusted EBIT increased $36 million to $36 million for 2013 compared to $nil for 2012. The loss related to our equity accounted investment in E-Car included in Corporate and Other was $35 million for 2012. Excluding E-Car, Corporate and Other Adjusted EBIT increased $1 million to $36 million for 2013 compared to $35 million for 2012 primarily as a result of:
· an increase in affiliation fees earned from our divisions;
· $10 million of cash received related to the settlement of ABCP between the Investment Industry Regulatory Organization of Canada and financial institutions;
· a loss on disposal of an investment in the second quarter of 2012; and
· lower stock-based compensation.
These factors were partially offset by:
· costs incurred to evaluate the effectiveness of our supply base;
· higher incentive compensation;
· the recovery of due diligence costs in the second quarter of 2012; and
· a $7 million net decrease in revaluation gains in respect of ABCP.
Interest Expense, net
During 2013 and 2012, we recorded net interest expense of $16 million.
Income from Operations before Income Taxes
Income from operations before income taxes increased $155 million to $1.91 billion for 2013 compared to $1.75 billion for 2012. Excluding Other Expense and Other Income, discussed in the “Other Expense” section, income from operations before income taxes for 2013 increased $407 million. The increase in income from operations before income taxes is the result of the increase in EBIT, as discussed above.
Income Taxes
|
| 2013 |
| 2012 |
| ||||||
|
| $ |
| % |
| $ |
| % |
| ||
Income taxes as reported |
| $ | 360 |
| 18.9 |
| $ | 324 |
| 18.5 |
|
Valuation allowances |
| 21 |
| 1.0 |
| 89 |
| 5.4 |
| ||
Mexican flat tax |
| 36 |
| 1.8 |
| — |
| — |
| ||
Tax effect on Other expense (income), net |
| 28 |
| — |
| (24 | ) | (0.2 | ) | ||
|
| $ | 445 |
| 21.7 |
| $ | 389 |
| 23.7 |
|
For the year ended December 31, 2013, we had a valuation allowance against our deferred tax assets in certain European countries. These valuation allowances were required because of historical losses and uncertainty as to the timing of when we would be able to generate the necessary level of earnings to recover these deferred tax assets. Over the past few years, some of our European operations have delivered sustained profits which, together with forecasted profits have allowed us to release a portion of the valuation allowances set up against our European deferred tax assets. Additionally, during 2013, we released a portion of our valuation allowance in China. The effect of these valuation allowance releases in 2013 is $21 million. Finally, we recorded a $36 million deferred tax benefit as a result of the elimination of the Mexican flat tax.
For the year ended December 31, 2012, we had valuation allowances against our deferred tax assets in the United Kingdom and Germany. Based on financial forecasts and continued anticipated growth, we released a portion of the valuation allowance set up against our deferred tax assets in the United Kingdom; and in Germany, the BDW and ixetic acquisitions allowed us to release a portion of the valuation allowance set up against our German deferred tax assets. Additionally, during 2012 we released a portion of our valuation allowances in Mexico and China, which were partially offset by a new valuation allowance against all of our deferred tax assets in Brazil. The net effect of all these valuation allowance releases in 2012 is $89 million.
The valuation allowances and elimination of the Mexican flat tax (the “Deferred Tax Adjustments”) totaled $57 million and $89 million in 2013 and 2012, respectively.
Excluding Other Expense and Other Income, after tax, and the Deferred Tax Adjustments, the effective income tax rate decreased to 21.7% for 2013 compared to 23.7% for 2012 primarily as a result of favourable audit settlements of prior taxation years and a reduction in losses not benefitted in Europe partially offset by non-creditable withholding tax on the repatriation of funds to Canada.
Net Income
Net income of $1.55 billion for 2013 increased $119 million compared to 2012. Excluding Other Expense and Other Income, after tax, as discussed in the “Other Expense” section and the Deferred Tax Adjustments as discussed in the “Income Taxes” section, net income increased $351 million. The increase in net income is the result of the increase in income from operations before income taxes partially offset by higher income taxes.
Net Loss Attributable to Non-controlling Interests
Net loss attributable to non-controlling interests increased $9 million to $16 million for 2013 compared to $7 million for 2012 as a result of impairments of long-lived assets discussed in the “Other Expense” section.
Net Income Attributable to Magna International Inc.
Net income attributable to Magna International Inc. of $1.56 billion for 2013 increased $128 million compared to 2012. Excluding Other Expense and Other Income, after tax and net loss attributable to non-controlling interests, as discussed in the “Other Expense” section and the Deferred Tax Adjustments as discussed in the “Income Taxes” section, net income attributable to Magna International Inc. increased $351 million as a result of the increase in net income, as discussed above.
Earnings per Share
|
| 2013 |
| 2012 |
| Change |
| |||
Earnings per Common Share |
|
|
|
|
|
|
| |||
Basic |
| $ | 6.85 |
| $ | 6.17 |
| + | 11 | % |
Diluted |
| $ | 6.76 |
| $ | 6.09 |
| + | 11 | % |
Average number of Common Shares outstanding (millions) |
|
|
|
|
|
|
| |||
Basic |
| 227.9 |
| 232.4 |
| - | 2 | % | ||
Diluted |
| 230.8 |
| 235.2 |
| - | 2 | % | ||
Diluted earnings per share increased $0.67 to $6.76 for 2013 compared to $6.09 for 2012. Other Expense and Other Income, after tax and net loss attributable to non-controlling interests and the Deferred Tax Adjustments, negatively impacted diluted earnings per share in 2013 by $0.22 and positively impacted diluted earnings per share in 2012 by $0.73. Other Expense and Other Income and the Deferred Tax Adjustments are discussed in the “Other Expense” and “Income Taxes” sections, respectively. Excluding the $0.22 per share negative impact for 2013 and the $0.73 per share positive impact for 2012, diluted earnings per share increased $1.62, as a result of the increase in net income attributable to Magna International Inc. and a decrease in the weighted average number of diluted shares outstanding during 2013.
The decrease in the weighted average number of diluted shares outstanding was due to the purchase and cancellation of Common Shares, during or subsequent to 2012, pursuant to our normal course issuer bids and the cashless exercise of options, partially offset by the issue of Common Shares related to the exercise of stock options, an increase in the number of diluted options outstanding as a result of an increase in the trading price of our common stock and stock options issued subsequent to 2012.
FINANCIAL CONDITION, LIQUIDITY AND CAPITAL RESOURCES
Cash Flow from Operations
|
| 2013 |
| 2012 |
| Change |
| |||
Net income |
| $ | 1,545 |
| $ | 1,426 |
|
|
| |
Items not involving current cash flows |
| 1,149 |
| 708 |
|
|
| |||
|
| 2,694 |
| 2,134 |
| $ | 560 |
| ||
Changes in non-cash operating assets and liabilities |
| (127 | ) | 72 |
|
|
| |||
Cash provided from operating activities |
| $ | 2,567 |
| $ | 2,206 |
| $ | 361 |
|
Cash flow from operations before changes in non-cash operating assets and liabilities increased $560 million to $2.69 million for 2013 compared to $2.13 billion for 2012. The increase in cash flow from operations was due to a $441 million increase in items not involving current cash flows and a $119 million increase in net income, as discussed above. Items not involving current cash flows are comprised of the following:
|
| 2013 |
| 2012 |
| ||
Depreciation and amortization |
| $ | 1,063 |
| $ | 801 |
|
Other non-cash charges |
| 189 |
| 154 |
| ||
Amortization of other assets included in cost of goods sold |
| 138 |
| 113 |
| ||
Impairment charges |
| 55 |
| 25 |
| ||
Non-cash portion of Other expense (income), net |
| — |
| (188 | ) | ||
Deferred income taxes |
| (100 | ) | (46 | ) | ||
Equity income |
| (196 | ) | (151 | ) | ||
Items not involving current cash flows |
| $ | 1,149 |
| $ | 708 |
|
Cash invested in non-cash operating assets and liabilities amounted to $127 million for 2013 compared to cash provided from operations of $72 million for 2012. The change in non-cash operating assets and liabilities is comprised of the following sources (and uses) of cash:
|
| 2013 |
| 2012 |
| ||
Accounts receivable |
| $ | (584 | ) | $ | (46 | ) |
Inventories |
| (141 | ) | (315 | ) | ||
Prepaid expenses and other |
| (56 | ) | 36 |
| ||
Accounts payable |
| 329 |
| 249 |
| ||
Accrued salaries and wages |
| 87 |
| 37 |
| ||
Other accrued liabilities |
| 298 |
| 97 |
| ||
Income taxes payable |
| (56 | ) | 16 |
| ||
Deferred revenue |
| (4 | ) | (2 | ) | ||
Changes in non-cash operating assets and liabilities |
| $ | (127 | ) | $ | 72 |
|
Higher accounts receivable relate primarily to the increase in production sales during 2013, particularly in December 2013 compared to December 2012. The increase in inventories was primarily due to increased production inventory to support higher sales activities and for upcoming launches. The increase in accounts payable was primarily due to timing of payments. The increase in accrued salaries and wages was primarily due to restructuring, employee profit sharing and vacation accruals. Higher other accrued liabilities relate to the increase in sales and restructuring costs.
Capital and Investment Spending
|
| 2013 |
| 2012 |
| Change |
| |||
Fixed asset additions |
| $ | (1,169 | ) | $ | (1,274 | ) |
|
| |
Investments and other assets |
| (192 | ) | (122 | ) |
|
| |||
Fixed assets, investments and other assets additions |
| (1,361 | ) | (1,396 | ) |
|
| |||
Purchase of subsidiaries |
| (9 | ) | (525 | ) |
|
| |||
Proceeds from disposition |
| 163 |
| 106 |
|
|
| |||
Cash used for investment activities |
| $ | (1,207 | ) | $ | (1,815 | ) | $ | 608 |
|
Fixed assets, investments and other assets additions
In 2013, we invested $1.17 billion in fixed assets. While investments were made to refurbish or replace assets consumed in the normal course of business and for productivity improvements, a large portion of the investment in 2013 was for manufacturing equipment for programs that will be launching subsequent to 2013.
In 2013, we invested $188 million in other assets related primarily to fully reimbursable tooling and engineering costs for programs that launched during 2013 or will be launching subsequent to 2013.
Purchase of subsidiaries
During November 2013, we acquired the remaining 49% interest of Textile Competence Centre Kft, a textile plant in Germany; along with certain fixed assets and licenses employed in the business that were owned by the non-controlling shareholder, for cash consideration of $9 million. Prior to the acquisition, we were fully consolidating this entity with non-controlling interest equal to the 49% interest not owned by us.
During 2012, we invested $525 million to purchase subsidiaries, including the acquisitions of:
· ixetic, a manufacturer of automotive vacuum, engine and transmission pumps, which has operations in Germany, Bulgaria and China as well as representation in Brazil, India, Japan and the United States. The acquired business has sales primarily to BMW, Daimler, Volkswagen, Schaeffler, ZF, Ford, Chrysler, Renault-Nissan and Toyota;
· the controlling 27% interest in the E-Car partnership;
· the remaining 50% interest in STT; and
· BDW, a structural casting supplier of aluminium components, which has operations in Germany, Poland and Hungary with sales primarily to Volkswagen, Audi, Porsche, Mercedes-Benz, Ferrari and ZF.
Proceeds from disposition
In 2013, the $163 million of proceeds include normal course fixed and other asset disposals.
Financing
|
| 2013 |
| 2012 |
| Change |
| |||
(Decrease) increase in bank indebtedness |
| $ | (18 | ) | $ | 42 |
|
|
| |
Repayments of debt |
| (173 | ) | (309 | ) |
|
| |||
Issues of debt |
| 151 |
| 348 |
|
|
| |||
Issues of Common Shares on exercise of stock options |
| 63 |
| 14 |
|
|
| |||
Repurchase of Common Shares |
| (1,020 | ) | (40 | ) |
|
| |||
Settlement of stock options |
| (23 | ) | (19 | ) |
|
| |||
Contribution to subsidiaries by non-controlling interests |
| 4 |
| — |
|
|
| |||
Dividends paid |
| (284 | ) | (252 | ) |
|
| |||
Cash used for financing activities |
| $ | (1,300 | ) | $ | (216 | ) | $ | (1,084 | ) |
During 2013, we purchased for cancellation 14.1 million Common Shares for an aggregate purchase price of $1.02 billion under our normal course issuer bids.
During 2013, 849,999 options were exercised on a cashless basis in accordance with the applicable stock option plans. On exercise, cash payments totalling $23 million were made to the stock option holders which represented the difference between the aggregate fair market value of the Option Shares based on the closing price of our Common Shares on the Toronto Stock Exchange (“TSX”) on the date of exercise and the aggregate Exercise Price of all such options surrendered.
Cash dividends paid per Common Share were $1.28 for 2013, for a total of $284 million.
Financing Resources
|
| As at |
| As at |
|
|
| |||
|
| December 31, |
| December 31, |
|
|
| |||
|
| 2013 |
| 2012 |
| Change |
| |||
Liabilities |
|
|
|
|
|
|
| |||
Bank indebtedness |
| $ | 41 |
| $ | 71 |
|
|
| |
Long-term debt due within one year |
| 230 |
| 249 |
|
|
| |||
Long-term debt |
| 102 |
| 112 |
|
|
| |||
|
| 373 |
| 432 |
|
|
| |||
Non-controlling interest |
| 16 |
| 29 |
|
|
| |||
Shareholders’ equity |
| 9,623 |
| 9,429 |
|
|
| |||
Total capitalization |
| $ | 10,012 |
| $ | 9,890 |
| $ | 122 |
|
Total capitalization increased by $122 million to $10.01 billion at December 31, 2013 compared to $9.89 billion at December 31, 2012, primarily as a result of a $194 million increase in shareholders’ equity partially offset by a $59 million decrease in liabilities.
The increase in shareholders’ equity was primarily as a result of net income earned in 2013 partially offset by:
· the repurchase of Common Shares in connection with our normal course issuer bids;
· dividends paid during 2013; and
· the $134 million net unrealized loss on translation of net investment in foreign operations.
The decrease in liabilities relates primarily to reduced bank indebtedness and lower bank term debt in our Asia and Rest of World segments.
Cash Resources
During 2013, our cash resources increased by $32 million to $1.55 billion as a result of the cash provided from operating activities partially offset by cash used for investing and financing activities, as discussed above. In addition to our cash resources at December 31, 2013, we had term and operating lines of credit totalling $2.56 billion of which $2.20 billion was unused and available.
On June 20, 2013, we amended our previous $2.25 billion revolving credit facility to become a five year facility with a maturity of June 20, 2018. The facility now includes a $200 million Asian tranche, a $50 million Mexican tranche and a tranche for Canada, U.S. and Europe, which is fully transferable between jurisdictions and can be drawn in U.S. dollars, Canadian dollars or euros.
Maximum Number of Shares Issuable
The following table presents the maximum number of shares that would be outstanding if all of the outstanding options at March 6, 2014 were exercised:
Common Shares |
| 221,187,872 |
|
Stock options (i) |
| 5,455,690 |
|
|
| 226,643,562 |
|
(i) Options to purchase Common Shares are exercisable by the holder in accordance with the vesting provisions and upon payment of the exercise price as may be determined from time to time pursuant to our stock option plans.
Contractual Obligations and Off-Balance Sheet Financing
A purchase obligation is defined as an agreement to purchase goods or services that is enforceable and legally binding on us and that specifies all significant terms, including: fixed or minimum quantities to be purchased; fixed, minimum or variable price provisions; and the approximate timing of the transaction. Consistent with our customer obligations, substantially all of our purchases are made under purchase orders with our suppliers which are requirements based and accordingly do not specify minimum quantities. Other long-term liabilities are defined as long-term liabilities that are recorded on our consolidated balance sheet. Based on this definition, the following table includes only those contracts which include fixed or minimum obligations.
At December 31, 2013, we had contractual obligations requiring annual payments as follows:
|
|
|
| 2015- |
| 2017- |
|
|
|
|
| |||||
|
| 2014 |
| 2016 |
| 2018 |
| Thereafter |
| Total |
| |||||
Operating leases |
| $ | 343 |
| $ | 576 |
| $ | 397 |
| $ | 402 |
| $ | 1,718 |
|
Long-term debt |
| 230 |
| 61 |
| 33 |
| 8 |
| 332 |
| |||||
Unconditional Purchase Obligations: |
|
|
|
|
|
|
|
|
|
|
| |||||
Materials and Services |
| 1,621 |
| 113 |
| 7 |
| 3 |
| 1,744 |
| |||||
Capital |
| 240 |
| 27 |
| 15 |
| — |
| 282 |
| |||||
Total contractual obligations |
| $ | 2,434 |
| $ | 777 |
| $ | 452 |
| $ | 413 |
| $ | 4,076 |
|
Our unfunded obligations with respect to employee future benefit plans, which have been actuarially determined, were $516 million at December 31, 2013. These obligations are as follows:
|
|
|
|
|
| Termination and |
|
|
| ||||
|
| Pension |
| Retirement |
| Long Service |
|
|
| ||||
|
| Liability |
| Liability |
| Arrangements |
| Total |
| ||||
Projected benefit obligation |
| $ | 454 |
| $ | 36 |
| $ | 354 |
| $ | 844 |
|
Less plan assets |
| (328 | ) | — |
| — |
| (328 | ) | ||||
Unfunded amount |
| $ | 126 |
| $ | 36 |
| $ | 354 |
| $ | 516 |
|
Our off-balance sheet financing arrangements are limited to operating lease contracts.
The majority of our facilities are subject to operating leases. Operating lease payments in 2013 for facilities were $304 million. Operating lease commitments in 2014 for facilities are expected to be $293 million. A majority of our existing lease agreements generally provide for periodic rent escalations based either on fixed-rate step increases, or on the basis of a consumer price index adjustment (subject to certain caps).
We also have operating lease commitments for equipment. These leases are generally of shorter duration. Operating lease payments for equipment were $59 million for 2013, and are expected to be $50 million in 2014.
Although our consolidated contractual annual lease commitments decline year by year, we expect that existing leases will either be renewed or replaced, or alternatively, we will incur capital expenditures to acquire equivalent capacity.
Foreign Currency Activities
Our North American operations negotiate sales contracts with OEMs for payment in both U.S. and Canadian dollars. Materials and equipment are purchased in various currencies depending upon competitive factors, including relative currency values. Our North American operations use labour and materials which are paid for in both U.S. and Canadian dollars. Our Mexican operations generally use the U.S. dollar as the functional currency.
Our European operations negotiate sales contracts with OEMs for payment principally in euros and British pounds. The European operations’ material, equipment and labour are paid for principally in euros and British pounds.
We employ hedging programs, primarily through the use of foreign exchange forward contracts, in an effort to manage our foreign exchange exposure, which arises when manufacturing facilities have committed to the delivery of products for which the selling price has been quoted in foreign currencies. These commitments represent our contractual obligations to deliver products over the duration of the product programs, which can last a number of years. The amount and timing of the forward contracts will be dependent upon a number of factors, including anticipated production delivery schedules and anticipated production costs, which may be paid in the foreign currency. In addition, we enter into foreign exchange contracts to manage foreign exchange exposure with respect to internal funding arrangements. Despite these measures, significant long-term fluctuations in relative currency values, in particular a significant change in the relative values of the U.S. dollar, Canadian dollar, euro or British pound, could have an adverse effect on our profitability and financial condition (as discussed throughout this MD&A).
CRITICAL ACCOUNTING POLICIES
Our discussion and analysis of our results of operations and financial position is based upon our 2013 audited consolidated financial statements, which have been prepared in accordance with United States GAAP. The preparation of the audited consolidated financial statements requires management to make estimates and judgments that affect the reported amounts of assets, liabilities, revenues and expenses, and the related disclosure of contingent assets and liabilities. We base our estimates on historical experience and various other assumptions that we believe to be reasonable in the circumstances, the results of which form the basis for making judgments about the carrying value of assets and liabilities. We evaluate our estimates on an ongoing basis, however, actual results may differ from these estimates under different assumptions or conditions.
We believe the following critical accounting policies affect the more significant judgments and estimates used in the preparation of our audited consolidated financial statements. Management has discussed the development and selection of the following critical accounting policies with the Audit Committee of the Board of Directors and the Audit Committee has reviewed our disclosure relating to critical accounting policies in this MD&A.
Revenue Recognition
[a] Separately Priced Tooling and Engineering Service Contracts
With respect to our contracts with OEMs for particular vehicle programs, we perform multiple revenue-generating activities. The most common arrangement is where, in addition to contracting for the production and sale of parts, we also have a contract with the OEM for related tooling. Under these arrangements, we either construct the tools at our in-house tool shops or contract with third party tooling vendors to construct and supply tooling to be used by us in the production of parts for the OEM. On completion of the tooling build, and upon acceptance of the tooling by the OEM, we sell the tooling to the OEM pursuant to a separate tooling purchase order.
In certain cases, such multiple element arrangements also include providing engineering services in addition to tooling and subsequent assembly or production activities. On completion, and upon acceptance by the OEM, we generally sell the engineering services to the OEM prior to the commencement of subsequent assembly or production activities.
Tooling and engineering services are accounted for as a separate revenue element only in circumstances where the tooling and engineering has value to the customer on a standalone basis. Based on the typical terms and process for the negotiation of tooling contracts, substantially all such tooling contracts are accounted for as separate revenue elements. However, because of the unique contracts related to multiple element arrangements involving engineering and subsequent assembly or production activities, all significant arrangements are evaluated in order to determine whether the engineering component of the arrangement qualifies as a separate revenue element. If the engineering component is not considered to be a separate revenue element, revenues and costs of sales on such activities are deferred and amortized on a gross basis over the subsequent assembly or production program.
Revenues from significant engineering services and tooling contracts that qualify as separate revenue elements are recognized on a percentage of completion basis. The percentage of completion method recognizes revenue and cost of sales over the term of the contract based on estimates of the state of completion, total contract revenue and total contract costs. Under such contracts, the related receivables could be paid in full upon completion of the contract, in instalments or in fixed amounts per vehicle based on forecasted production volumes. In the event that actual production volumes are less than those forecasted, a reimbursement for any shortfall will be made either annually or at the end of the program life.
Tooling and engineering contract prices are generally fixed; however, price changes, change orders and program cancellations may affect the ultimate amount of revenue recorded with respect to a contract. Contract costs are estimated at the time of signing the contract and are reviewed at each reporting date. Adjustments to the original estimates of total contract costs are often required as work progresses under the contract and as experience is gained, even though the scope of the work under the contract may not change. When the current estimates of total contract revenue and total contract costs indicate a loss, a provision for the entire loss on the contract is made. Factors that are considered in arriving at the forecasted loss on a contract include, amongst others, cost over-runs, non-reimbursable costs, change orders and potential price changes.
[b] Contracts with Purchased Components
(i) Tooling and Engineering Services
Revenues and cost of sales from tooling and engineering services contracts are presented on a gross basis in the consolidated statements of income when we are acting as principal and are subject to significant risks and rewards of the business. Otherwise, components of revenue and related costs are presented on a net basis. To date, substantially all engineering services and tooling contracts have been recorded on a gross basis.
(ii) Assembly Contracts
The terms of our various vehicle assembly contracts differ with respect to the ownership of components and supplies related to the assembly process and the method of determining the selling price to the OEM customer. Under certain contracts we are acting as principal, and purchased components and systems in assembled vehicles are included in our inventory and cost of sales. These costs are reflected on a full-cost basis in the selling price of the final assembled vehicle to the OEM customer. Other contracts provide that third-party components and systems are held on consignment by us, and the selling price to the OEM customer reflects a value added assembly fee only. All current programs are accounted for on a full-cost basis.
(iii) Modular Systems
In addition to our assembly business, we also enter into production contracts where we are required to coordinate the design, manufacture, integration and assembly of a large number of individual parts and components into a modular system for delivery to the OEM’s vehicle assembly plant. Under these contracts, we manufacture a portion of the products included in the module but also purchase components from various sub-suppliers and assemble such components into the completed module. We recognize module revenues and cost of sales on a gross basis when we have a combination of:
· primary responsibility for providing the module to the OEM;
· responsibility for styling and/or product design specifications;
· latitude in establishing sub-supplier pricing;
· responsibility for validation of sub-supplier part quality;
· inventory risk on sub-supplier parts;
· exposure to warranty; and
· exposure to credit risk on the sale of the module to the OEM.
To date, revenues and cost of sales on our module contracts have been reported on a gross basis.
Amortized Engineering and Customer-Owned Tooling Arrangements
We incur pre-production engineering research and development (“ER&D”) costs related to the products we produce for OEMs under long-term supply agreements. We expense ER&D costs, which are paid for as part of the subsequent related production and assembly program, as incurred unless a contractual guarantee for reimbursement exists.
In addition, we expense all costs as incurred related to the design and development of moulds, dies and other tools that we will not own and that will be used in, and reimbursed as part of the piece price amount for, subsequent related production or assembly program unless the supply agreement provides us with a contractual guarantee for reimbursement of costs or the non-cancellable right to use the moulds, dies and other tools during the supply agreement, in which case the costs are capitalized.
ER&D and customer-owned tooling costs capitalized in “Other assets” are amortized on a units-of-production basis over the related long-term supply agreement.
Impairment of Goodwill and Other Long-lived Assets
Goodwill is subject to an annual impairment test or more frequently when an event occurs that more likely than not reduces the fair value of a reporting unit below its carrying value.
We evaluate fixed assets and other long-lived assets for impairment whenever indicators of impairment exist. Indicators of impairment include the bankruptcy of a significant customer or the early termination, loss, renegotiation of the terms of, or delay in the implementation of, any significant production contract. If the sum of the future cash flows expected to result from the asset, undiscounted and without interest charges, is less than the reported value of the asset, an asset impairment would be recognized in the consolidated financial statements. The amount of impairment to be recognized is calculated by subtracting the fair value of the asset from the reported value of the asset.
We believe that accounting estimates related to goodwill and long-lived asset impairment assessments are “critical accounting estimates” because: (i) they are subject to significant measurement uncertainty and are susceptible to change as management is required to make forward-looking assumptions regarding the impact of improvement plans on current operations, in-sourcing and other new business opportunities, program pricing and cost assumptions on current and future business, the timing of new program launches and future forecasted production volumes; and (ii) any resulting impairment loss could have a material impact on our consolidated net income and on the amount of assets reported in our consolidated balance sheet.
Warranty
We record product warranty liabilities based on individual customer agreements. Under most customer agreements, we only account for existing or probable claims on product default issues when amounts related to such issues are probable and reasonably estimable. Under certain complete vehicle engineering and assembly contracts, we record an estimate of future warranty-related costs based on the terms of the specific customer agreements and the specific customers’ warranty experience.
Product liability provisions are established based on our best estimate of the amounts necessary to settle existing claims on product default issues. Recall costs are costs incurred when government regulators and/or our customers decide to recall a product due to a known or suspected performance issue, and we are required to participate either voluntarily or involuntarily. Costs typically include the cost of the product being replaced, the customer’s cost of the recall and labour to remove and replace the defective part. When a decision to recall a product has been made or is probable, our estimated cost of the recall is recorded as a charge to income in that period. In making this estimate, judgment is required as to the number of units that may be returned as a result of the recall, the total cost of the recall campaign, the ultimate negotiated sharing of the cost between us, the customer and, in some cases a supplier.
Deferred Tax Assets
At December 31, 2013, we had recorded deferred tax assets (net of related valuation allowances) in respect of loss carryforwards and other deductible temporary differences of $82 million and $310 million, respectively. The deferred tax assets in respect of loss carryforwards relate primarily to Canadian, Mexican and United Kingdom subsidiaries.
On a quarterly basis, we evaluate the realizability of deferred tax assets by assessing our valuation allowances and by adjusting the amount of such allowances as necessary. We use tax planning strategies to realize deferred tax assets to avoid the potential loss of benefits.
Accounting standards require that we assess whether valuation allowances should be established or maintained against our deferred income tax assets, based on consideration of all available evidence, using a “more-likely-than-not” standard. The factors used to assess the likelihood of realization are: history of losses, forecasts of future pre-tax income and tax planning strategies that could be implemented to realize the deferred tax assets.
At December 31, 2013, we had domestic and foreign operating loss carryforwards of $2.00 billion and tax credit carryforwards of $34 million, which relate primarily to operations in Germany, United States, Spain, United Kingdom, Brazil and China. Approximately $1.07 billion of the operating losses can be carried forward indefinitely. The remaining operating losses and tax credit carryforwards expire between 2014 and 2033.
For the year ended December 31, 2013, based on financial forecasts and continued anticipated growth, we released a portion of the valuation allowances set up against our deferred tax assets in certain European countries. Additionally, during 2013, we released a portion of our valuation allowance in China. The effect of these valuation allowance releases in 2013 is $21 million. Finally, we recorded a $36 million deferred tax benefit as a result of the elimination of the Mexican flat tax.
For the year ended December 31, 2012, we had valuation allowances against our deferred tax assets in the United Kingdom and Germany. Based on financial forecasts and continued anticipated growth, we released a portion of the valuation allowance set up against our deferred tax assets in the United Kingdom; and in Germany, the BDW and ixetic acquisitions allowed us to release a portion of the valuation allowance set up against our German deferred tax assets. Additionally, during 2012, we released a portion of our valuation allowances in Mexico and China, which were partially offset by a new valuation allowance against all of our deferred tax assets in Brazil. The net effect of all of these valuation allowance releases in 2012 is $89 million.
Employee Future Benefit Plans
The determination of the obligation and expense for defined benefit pension, termination and long service arrangements and other post retirement benefits, such as retiree healthcare and medical benefits, is dependent on the selection of certain assumptions used by actuaries in calculating such amounts. Those assumptions include, among others, the discount rate, expected long-term rate of return on plan assets and rates of increase in compensation costs. Actual results that differ from the assumptions used are accumulated and amortized over future periods and therefore impact the recognized expense in future periods. Significant changes in assumptions or significant plan amendments could materially affect our future employee benefit obligations and future expense.
At December 31, 2013, we had past service costs and actuarial experience losses of $131 million included in accumulated other comprehensive income that will be amortized to future employee benefit expense over the expected average remaining service life of employees or over the expected average life expectancy of retired employees, depending on the status of the plan.
Restructuring Costs
We record accruals in conjunction with our restructuring actions. These accruals include estimates primarily related to workforce reduction costs such as employee termination costs, contract termination costs and other costs related to the consolidation and/or rationalization of facilities. Actual costs may vary from these estimates. These accruals are reviewed on a quarterly basis and with changes to restructuring actions being appropriately recognized when identified.
FUTURE CHANGES IN ACCOUNTING POLICIES
Unrecognized Tax Benefits
In July 2013, the FASB issued ASU 2013-11, “Presentation of an Unrecognized Tax Benefit When a Net Operating Loss Carryforward, a Similar Tax Loss, or a Tax Credit Carryforward Exists”. ASU 2013-11 clarifies guidance and eliminates diversity in practice on the presentation of unrecognized tax benefits when a net operating loss carryforward, a similar tax loss, or a tax credit carryforward exists at the reporting date. The guidance is effective for annual reporting periods beginning on or after December 15, 2013 and subsequent interim periods. We currently present our unrecognized tax benefits in accordance with ASU 2013-11 and therefore this pronouncement will not result in a change to our consolidated financial statements.
Joint and Several Liability Arrangements
In February 2013, the FASB issued ASU 2013-04, “Obligations Resulting from Joint and Several Liability Arrangements for Which the Total Amount of the Obligation is Fixed at the Reporting Date”. ASU 2013-04 requires reporting and disclosure about obligations resulting from joint and several liability arrangements within the scope of Subtopic 405-40 for which the total amount of the obligation is fixed at the reporting date. ASU 2013-04 is effective for fiscal years and interim periods beginning after December 15, 2013. The impact, if any, on our consolidated financial statements is currently being assessed.
SUBSEQUENT EVENTS
Under Austria’s current group taxation system, an Austrian entity may utilize the tax losses of all direct foreign subsidiaries. On February 28, 2014, the Austrian government enacted legislation abolishing the utilization of foreign losses, where the direct foreign subsidiary is not a member of the European Union. Furthermore, any foreign losses previously used by Austrian entities arising in those direct non European Union subsidiaries will be subject to recapture in Austria. In light of this legislation, we anticipate taking a charge to tax expense of approximately $25 million to $30 million during the first quarter of 2014. The tax is payable over three years, commencing in 2015.
COMMITMENTS AND CONTINGENCIES
From time to time, we may be contingently liable for litigation, legal and/or regulatory actions and proceedings and other claims. Refer to note 22 of our 2013 audited consolidated financial statements, which describes these claims.
For a discussion of risk factors relating to legal and other claims/actions against us, refer to “Item 3. Description of the Business — Risk Factors” in our Annual Information Form and Annual Report on Form 40-F, each in respect of the year ended December 31, 2013.
CONTROLS AND PROCEDURES
Disclosure Controls and Procedures
Disclosure controls and procedures are designed to provide reasonable, but not absolute, assurance that material information required to be publicly disclosed by a public company is communicated in a timely manner to senior management to enable them to make timely decisions regarding public disclosure of such information. We have conducted an evaluation of our disclosure controls and procedures as of December 31, 2013 under the supervision, and with the participation of, our Chief Executive Officer and our Chief Financial Officer. Based on this evaluation, our Chief Executive Officer and our Chief Financial Officer have concluded that our disclosure controls and procedures (as this term is defined in the rules adopted by Canadian securities regulatory authorities and the United States Securities and Exchange Commission) are effective in providing reasonable assurance that material information relating to Magna is made known to them and information required to be disclosed by us is recorded, processed, summarized and reported within the time periods specified under applicable law.
Management’s Annual Report on Internal Control over Financial Reporting
Internal control over financial reporting is a process designed to provide reasonable, but not absolute, assurance regarding the reliability of financial reporting and preparation of financial statements for external purposes in accordance with generally accepted accounting principles. Our management is responsible for establishing and maintaining adequate internal control over financial reporting. Due to its inherent limitations, internal control over financial reporting may not prevent or detect misstatements on a timely basis. Additionally, projections of any evaluation of the effectiveness of internal control over financial reporting to future periods are subject to the risk that the controls may become inadequate because of changes in conditions, or that the degree of compliance with the policies or procedures may deteriorate. Our management used the Committee of Sponsoring Organizations of the Treadway Commission (COSO) (1992) framework to evaluate the effectiveness of internal control over financial reporting. Our Chief Executive Officer and our Chief Financial Officer have assessed the effectiveness of our internal control over financial reporting and concluded that, as at December 31, 2013, such internal control over financial reporting is effective and that there were no material weaknesses. Our independent auditor, Ernst & Young LLP, has also issued a report on our internal controls. This report precedes our audited consolidated financial statements for the year ended December 31, 2013.
Changes in Internal Controls over Financial Reporting
There have been no changes in our internal controls over financial reporting that occurred during 2013 that have materially affected, or are reasonably likely to materially affect, our internal control over financial reporting.
SELECTED ANNUAL CONSOLIDATED FINANCIAL DATA
The following selected consolidated financial data has been derived from, and should be read in conjunction with the accompanying audited consolidated financial statements for the year ended December 31, 2013.
|
| 2013 |
| 2012 |
| 2011 |
| |||
Income Statement Data |
|
|
|
|
|
|
| |||
|
|
|
|
|
|
|
| |||
Vehicle Production Volumes (millions of units) |
|
|
|
|
|
|
| |||
North America |
| 16.188 |
| 15.450 |
| 13.153 |
| |||
Europe |
| 19.313 |
| 19.432 |
| 20.248 |
| |||
Sales |
|
|
|
|
|
|
| |||
External Production |
|
|
|
|
|
|
| |||
North America |
| $ | 16,744 |
| $ | 15,336 |
| $ | 13,940 |
|
Europe |
| 9,957 |
| 8,786 |
| 8,651 |
| |||
Asia |
| 1,391 |
| 1,034 |
| 954 |
| |||
Rest of World |
| 858 |
| 803 |
| 448 |
| |||
Complete Vehicle Assembly |
| 3,062 |
| 2,561 |
| 2,690 |
| |||
Tooling, Engineering and Other |
| 2,823 |
| 2,317 |
| 2,065 |
| |||
Total sales |
| $ | 34,835 |
| $ | 30,837 |
| $ | 28,748 |
|
|
|
|
|
|
|
|
| |||
Net income |
| $ | 1,545 |
| $ | 1,426 |
| $ | 1,015 |
|
|
|
|
|
|
|
|
| |||
Earnings per Common Share |
|
|
|
|
|
|
| |||
Basic |
| $ | 6.85 |
| $ | 6.17 |
| $ | 4.26 |
|
Diluted |
| $ | 6.76 |
| $ | 6.09 |
| $ | 4.20 |
|
|
|
|
|
|
|
|
| |||
Cash dividends paid per Common Share |
| $ | 1.28 |
| $ | 1.10 |
| $ | 1.00 |
|
|
|
|
|
|
|
|
| |||
Financial Position Data |
|
|
|
|
|
|
| |||
|
|
|
|
|
|
|
| |||
Cash and cash equivalents |
| $ | 1,554 |
| $ | 1,522 |
| $ | 1,325 |
|
Working capital (1) |
| $ | 2,614 |
| $ | 2,451 |
| $ | 2,422 |
|
Total assets |
| $ | 17,990 |
| $ | 17,109 |
| $ | 14,679 |
|
|
|
|
|
|
|
|
| |||
Financing Resources |
|
|
|
|
|
|
| |||
Liabilities |
|
|
|
|
|
|
| |||
Bank indebtedness |
| $ | 41 |
| $ | 71 |
| $ | 36 |
|
Long-term debt due within one year |
| 230 |
| 249 |
| 151 |
| |||
Long-term debt |
| 102 |
| 112 |
| 46 |
| |||
|
| 373 |
| 432 |
| 233 |
| |||
Non-controlling interest |
| 16 |
| 29 |
| 27 |
| |||
Shareholders’ equity |
| 9,623 |
| 9,429 |
| 8,175 |
| |||
Total capitalization |
| $ | 10,012 |
| $ | 9,890 |
| $ | 8,435 |
|
Changes from 2012 to 2013 are explained in “Results of Operations — For the Year Ended December 31, 2013” section above.
1 Working capital represents current assets less current liabilities as presented in our consolidated balance sheet
2012 COMPARED TO 2011
SALES
External Production Sales - North America
External production sales in North America increased 10% or $1.40 billion to $15.34 billion for 2012 compared to $13.94 billion for 2011, primarily as a result of:
· higher production volumes on certain existing programs;
· the launch of new programs during or subsequent to 2011, including the:
· Volkswagen Passat;
· Mercedes-Benz M-Class and GL-Class;
· Chevrolet Sonic; and
· Dodge Dart;
· acquisitions completed during or subsequent to 2011, which positively impacted sales by $69 million; and
· an increase in content on certain programs.
These factors were partially offset by:
· a decrease in content on certain programs, including the:
· Ford Escape; and
· Ram Pickup;
· programs that ended production during or subsequent to 2011, including the:
· Ford Crown Victoria and Mercury Grand Marquis;
· Chevrolet HHR;
· Ford Ranger; and
· Dodge Caliber;
· a decrease in reported U.S. dollar sales due to the weakening of the Canadian dollar against the U.S. dollar; and
· net customer price concessions subsequent to 2011.
External Production Sales - Europe
External production sales in Europe increased $135 million to $8.79 billion for 2012 compared to $8.65 billion for 2011, primarily as a result of:
· the launch of new programs during or subsequent to 2011, including the:
· Range Rover Evoque;
· Kia Rio;
· Volkswagen up!, SEAT Mii and Skoda Citigo;
· Hyundai Solaris;
· Audi Q3; and
· Mercedes-Benz B-Class;
· acquisitions completed during or subsequent to 2011, which positively impacted sales by $245 million, including BDW and ixetic; and
· an increase in content on certain programs.
These factors were partially offset by:
· a decrease in reported U.S. dollar sales primarily as a result of the weakening of the euro against the U.S. dollar;
· lower production volumes on certain existing programs;
· a decrease in content on certain programs;
· programs that ended production during or subsequent to 2011; and
· net customer price concessions subsequent to 2011.
External Production Sales - Asia
External production sales in Asia increased 8% or $80 million to $1.03 billion for 2012 compared to $954 million for 2011, primarily as a result of:
· the launch of new programs during or subsequent to 2011, primarily in China; and
· higher production volumes on certain existing programs.
These factors were partially offset by a decrease in content on certain programs.
External Production Sales - Rest of World
External production sales in Rest of World increased 79% or $355 million to $803 million for 2012 compared to $448 million for 2011, primarily as a result of:
· acquisitions completed during or subsequent to 2011, which positively impacted sales by $238 million, including ThyssenKrupp Automotive Systems Industrial do Brasil Ltda (“TKASB”);
· an increase in content on certain programs; and
· the launch of new programs during or subsequent to 2011, primarily in Brazil.
These factors were partially offset by a $113 million decrease in reported U.S. dollar sales as a result of the weakening of foreign currencies against the U.S. dollar, including the Brazilian real.
Complete Vehicle Assembly Sales
Complete vehicle assembly sales decreased 5% or $129 million to $2.56 billion for 2012 compared to $2.69 billion for 2011 while assembly volumes decreased 5% or 6,741 units.
The decrease in complete vehicle assembly sales is primarily as a result of:
· a $202 million decrease in reported U.S. dollar sales as a result of the weakening of the euro against the U.S. dollar;
· a decrease in assembly volumes for the Peugeot RCZ; and
· the end of production of the Aston Martin Rapide at our Magna Steyr facility during the second quarter of 2012.
These factors were partially offset by:
· an increase in assembly volumes for the:
· Mercedes-Benz G-Class; and
· MINI Countryman; and
· the launch of the MINI Paceman during the fourth quarter of 2012.
Tooling, Engineering and Other
Tooling, engineering and other sales increased 12% or $252 million to $2.32 billion for 2012 compared to $2.07 billion for 2011.
In 2012, the major programs for which we recorded tooling, engineering and other sales were the:
· Ford Fusion;
· MINI Countryman;
· Mercedes-Benz M-Class;
· Chevrolet Trax;
· OROS C/Sedan/Hatch;
· Opel Cascada Convertible;
· Chevrolet Spin;
· Ford Escape;
· Infiniti hatchback program;
· Dodge Dart; and
· Ford Transit.
In addition, tooling, engineering and other sales were negatively impacted by the weakening of the euro against the U.S. dollar.
Cost of Goods Sold and Gross Margin
|
| 2012 |
| 2011 |
| ||
Sales |
| $ | 30,837 |
| $ | 28,748 |
|
Cost of goods sold |
|
|
|
|
| ||
Material |
| 19,706 |
| 18,533 |
| ||
Direct labour |
| 2,038 |
| 1,912 |
| ||
Overhead |
| 5,275 |
| 4,989 |
| ||
|
| 27,019 |
| 25,434 |
| ||
Gross margin |
| $ | 3,818 |
| $ | 3,314 |
|
Gross margin as a percentage of sales |
| 12.4 | % | 11.5 | % | ||
Cost of goods sold increased $1.59 billion to $27.02 billion for 2012 compared to $25.43 billion for 2011 primarily as a result of:
· higher material, overhead and labour costs associated with the increase in sales, including wage increases at certain operations;
· $552 million related to acquisitions completed during or subsequent to 2011, including TKASB and BDW;
· a larger amount of employee profit sharing; and
· rising commodity costs.
These factors were partially offset by:
· a decrease in reported U.S. dollar cost of goods sold primarily due to the weakening of the euro, Brazilian real, Canadian dollar and Czech koruna, each against the U.S. dollar; and
· lower warranty costs of $3 million.
Gross margin increased $513 million to $3.83 billion for 2012 compared to $3.31 billion for 2011 and gross margin as a percentage of sales increased to 12.4% for 2012 compared to 11.5% for 2011. The increase in gross margin as a percentage of sales was substantially due to:
· lower costs incurred in preparation for upcoming launches;
· favourable settlement of certain commercial items;
· lower warranty costs; and
· productivity and efficiency improvements at certain facilities.
These factors were partially offset by:
· increased pre-operating costs incurred at new facilities;
· an increase in tooling, engineering and other sales that have low or no margins;
· rising commodity costs;
· a larger amount of employee profit sharing;
· operational inefficiencies and other costs at certain facilities; and
· net customer price concessions subsequent to 2011.
Depreciation and Amortization
Depreciation and amortization costs increased $115 million to $801 million for 2012 compared to $686 million for 2011. The higher depreciation and amortization was primarily as a result of:
· intangible asset amortization of $52 million related to the acquisition and re-measurement of E-Car;
· $48 million related to acquisitions completed during or subsequent to 2011, including BDW, TKASB and E-Car;
· capital spending during or subsequent to 2011; and
· depreciation related to new facilities.
These factors were partially offset by a decrease in reported U.S. dollar depreciation and amortization due to the weakening of the euro, Brazilian real and Canadian dollar, each against the U.S. dollar.
Selling, General and Administrative
SG&A expense as a percentage of sales was 4.9% for 2012 compared to 4.8% for 2011. SG&A expense increased $128 million to $1.51 billion for 2012 compared to $1.38 billion for 2011 primarily as a result of:
· $78 million related to acquisitions completed during or subsequent to 2011, including TKASB, BDW, E-Car and ixetic;
· higher labour, including wage increases at certain operations, and other costs to support the growth in sales;
· higher incentive compensation;
· increased costs incurred at new facilities;
· a loss on disposal of an investment; and
· higher employee profit sharing.
These factors were partially offset by:
· a decrease in reported U.S. dollar SG&A due to the weakening of the euro, Brazilian real, Czech koruna and Polish zloty, each against the U.S. dollar;
· a $15 million revaluation gain in respect of ABCP; and
· the recovery of due diligence costs.
Equity Income
Equity income increased $30 million to $151 million for 2012 compared to $121 million for 2011. Excluding the $31 million reduction in the equity loss related to E-Car, the $1 million decrease in equity income is primarily as a result of the disposal of an equity accounted investment during 2011 partially offset by higher income from most of our equity accounted investments.
Other (Income) Expense, net
Other (income) expense, net consist of significant non-operational items such as: restructuring charges generally related to plant closures; impairment charges; gains or losses on disposal of facilities; and other items not reflective of on-going operating profit or loss.
During 2012 and 2011, we recorded other (income) expense as follows:
|
| 2012 |
| 2011 |
| ||||||||||||||
|
|
|
|
|
| Diluted |
|
|
|
|
| Diluted |
| ||||||
|
| Operating |
| Net |
| Earnings |
| Operating |
| Net |
| Earnings |
| ||||||
|
| Income |
| Income |
| per Share |
| Income |
| Income |
| per Share |
| ||||||
Restructuring charges |
| $ | 55 |
| $ | 53 |
| $ | 0.23 |
| $ | — |
| $ | — |
| $ | — |
|
Impairment charges (1) |
| 25 |
| 23 |
| 0.10 |
| 21 |
| 20 |
| 0.08 |
| ||||||
Re-measurement gain of STT |
| (35 | ) | (35 | ) | (0.15 | ) | — |
| — |
| — |
| ||||||
Re-measurement gain of E-Car |
| (153 | ) | (125 | ) | (0.53 | ) | — |
| — |
| — |
| ||||||
Loss on disposal of facility (2) |
| — |
| — |
| — |
| 129 |
| 129 |
| 0.54 |
| ||||||
Customer bankruptcy (3) |
| — |
| — |
| — |
| 11 |
| 11 |
| 0.05 |
| ||||||
Settlement agreement (4) |
| — |
| — |
| — |
| 11 |
| 11 |
| 0.05 |
| ||||||
Write down of real estate (5) |
| — |
| — |
| — |
| 9 |
| 9 |
| 0.04 |
| ||||||
Insurance proceeds (6) |
| — |
| — |
| — |
| (15 | ) | (15 | ) | (0.06 | ) | ||||||
Gain on disposal of investment (7) |
| — |
| — |
| — |
| (10 | ) | (10 | ) | (0.04 | ) | ||||||
Total other (income) expense, net |
| $ | (108 | ) | $ | (84 | ) | $ | (0.35 | ) | $ | 156 |
| $ | 155 |
| $ | 0.65 |
|
The other expense, net items for 2012 have been discussed in the “Other Expense, net” section above. During 2011, other expense, net items were as follows:
(1) Impairment Charges - Long-lived Assets
In North America, we recorded impairment charges of $7 million ($7 million after tax) related to a roof systems facility in the United States. In Europe, we recorded long-lived asset impairment charges of $14 million ($13 million after tax) related to various facilities.
(2) Loss on disposal of facility
During the third quarter of 2011, we sold an interior systems operation located in Germany and recorded a loss on disposal of $113 million. This operation, whose long-lived assets were substantially impaired in 2010, had a history of losses which were projected to continue throughout the business planning period. Under the terms of the 2011 sale arrangements (the “SPA”), we agreed to fund the buyer $67 million, to be satisfied with certain working capital items, cash and the assumption of certain liabilities. Final settlement of the SPA did not occur during 2011 and in the fourth quarter of 2011 an additional $16 million was accrued in relation to the ongoing disputes with the purchaser bringing the total loss on disposal to $129 million.
(3) Customer bankruptcy
During 2011, we recorded an $11 million charge related to the insolvency of Saab.
(4) Settlement agreement
During 2011, a settlement agreement was finalized in connection with the settlement of certain patent infringement and other claims. We recorded an $11 million expense in the third quarter of 2011 in relation to these arrangements.
(5) Write down of real estate
During 2011, five excess corporate real estate assets were sold to entities associated with our Founder and Chairman, Mr. Stronach and/or our former Co-Chief Executive Officer, Siegfried Wolf. The sales were approved by the independent members of our Board of Directors based on independent fair market appraisals. The appraised fair value range for the properties was less than their carrying value and, accordingly, we recorded a $9 million impairment charge in 2011.
(6) Insurance proceeds
During 2011, we received proceeds pursuant to an insurance claim for fire damages related to an interior systems facility in the United States. The proceeds received were $15 million in excess of the damaged assets net book value and the losses previously recognized and was recorded in income.
(7) Gain on disposal
During 2011, we sold our 40% non-controlling interest in an equity accounted investment for $151 million and realized a $10 million gain on the disposition.
Net Income
Net income of $1.43 billion for 2012 increased $411 million compared to 2011. Excluding Other Income and Expense, after tax, discussed in the “Other Income” section, net income increased $161 million. The increase in net income is the result of the increase in income from operations before income taxes partially offset by higher income taxes.
Earnings per Share
Diluted earnings per share increased $1.89 to $6.09 for 2012 compared to $4.20 for 2011. Other Income and Other Expense, after tax, positively impacted diluted earnings per share in 2012 by $0.35 and negatively impacted diluted earnings per share in 2011 by $0.65, both as discussed in the “Other Income” section, while the valuation allowances as discussed in the “Income Taxes” section positively impacted diluted earnings per share in 2012 and 2011 by $0.38 and $0.32, respectively. Excluding Other Income and Expense, after tax, and the valuation allowances as discussed in the “Income Taxes” section, the $0.83 increase in diluted earnings per share is a result of the increase in net income attributable to Magna International Inc. and a decrease in the weighted average number of diluted shares outstanding during 2012.
The decrease in the weighted average number of diluted shares outstanding was primarily due to the repurchase and cancellation of Common Shares, during or subsequent to 2011, pursuant to our normal course issuer bids and the cashless exercise of options.
Financing Resources
Total capitalization increased by $1.45 billion to $9.89 billion at December 31, 2012 compared to $8.44 billion at December 31, 2011, primarily as a result of a $1.25 billion increase in shareholders’ equity and a $199 million increase in liabilities.
The increase in shareholders’ equity was primarily as a result of net income earned in 2012 partially offset by dividends paid.
The increase in liabilities relates primarily to an increase in debt in our Rest of World segment and debt assumed in connection with the BDW acquisition.
Cash Resources
During 2012, our cash resources increased by $197 million to $1.52 billion as a result of the cash provided from operating activities and the favourable effect of foreign exchange partially offset by cash used for investing and financing activities. In addition to our cash resources at December 31, 2012, we had term and operating lines of credit totalling $2.48 billion of which $2.05 billion was unused and available.
RESULTS OF OPERATIONS — FOR THE THREE MONTHS ENDED DECEMBER 31, 2013
The discussion of our results of operations for the three months ended December 31, 2013 contained in the MD&A attached to our press release dated March 3, 2014, as filed via the Canadian Securities Administrators’ System for Electronic Document Analysis and Retrieval (SEDAR) (www.sedar.com), is incorporated by reference herein.
SELECTED QUARTERLY CONSOLIDATED FINANCIAL DATA
The following selected consolidated financial data has been prepared in accordance with U.S. GAAP.
|
| For the three month periods ended |
| ||||||||||
|
| Mar 31, |
| Jun 30, |
| Sep 30, |
| Dec 31, |
| ||||
|
| 2013 |
| 2013 |
| 2013 |
| 2013 |
| ||||
Sales |
| $ | 8,361 |
| $ | 8,962 |
| $ | 8,338 |
| $ | 9,174 |
|
|
|
|
|
|
|
|
|
|
| ||||
Net income |
| $ | 367 |
| $ | 412 |
| $ | 318 |
| $ | 448 |
|
|
|
|
|
|
|
|
|
|
| ||||
Earnings per Common Share |
|
|
|
|
|
|
|
|
| ||||
Basic |
| $ | 1.59 |
| $ | 1.80 |
| $ | 1.41 |
| $ | 2.06 |
|
Diluted |
| $ | 1.57 |
| $ | 1.78 |
| $ | 1.39 |
| $ | 2.03 |
|
|
| For the three month periods ended |
| ||||||||||
|
| Mar 31, |
| Jun 30, |
| Sep 30, |
| Dec 31, |
| ||||
|
| 2012 |
| 2012 |
| 2012 |
| 2012 |
| ||||
Sales |
| $ | 7,666 |
| $ | 7,727 |
| $ | 7,411 |
| $ | 8,033 |
|
|
|
|
|
|
|
|
|
|
| ||||
Net income |
| $ | 341 |
| $ | 349 |
| $ | 386 |
| $ | 350 |
|
|
|
|
|
|
|
|
|
|
| ||||
Earnings per Common Share |
|
|
|
|
|
|
|
|
| ||||
Basic |
| $ | 1.47 |
| $ | 1.50 |
| $ | 1.68 |
| $ | 1.51 |
|
Diluted |
| $ | 1.46 |
| $ | 1.48 |
| $ | 1.66 |
| $ | 1.49 |
|
In general, sales increased from 2012 to 2013 as a result of product launches and acquisitions, including ixetic in December 2012. The third quarter of the year is generally affected by the normal seasonal effects of lower vehicle production volumes as a result of OEM summer shutdowns.
Included in the quarterly net income attributable to Magna International Inc. are the following other expense (income), net items that have been discussed above:
|
| For the three month periods ended |
| ||||||||||
|
| Mar 31, |
| Jun 30, |
| Sep 30, |
| Dec 31, |
| ||||
|
| 2013 |
| 2013 |
| 2013 |
| 2013 |
| ||||
Restructuring charges |
| $ | 6 |
| $ | — |
| $ | 33 |
| $ | 25 |
|
Impairment charges |
| — |
| — |
| — |
| 43 |
| ||||
|
| $ | 6 |
| $ | — |
| $ | 33 |
| $ | 68 |
|
|
| For the three month periods ended |
| ||||||||||
|
| Mar 31, |
| Jun 30, |
| Sep 30, |
| Dec 31, |
| ||||
|
| 2012 |
| 2012 |
| 2012 |
| 2012 |
| ||||
Impairment charges |
| $ | — |
| $ | — |
| $ | — |
| $ | 23 |
|
Restructuring charges |
| — |
| — |
| — |
| 53 |
| ||||
Re-measurement gain |
| — |
| — |
| (125 | ) | (35 | ) | ||||
|
| $ | — |
| $ | — |
| $ | (125 | ) | $ | 41 |
|
For more information regarding our quarter over quarter results, please refer to our first, second and third quarter 2013 quarterly reports which are available through the internet on the Canadian Securities Administrators’ System for Electronic Document Analysis and Retrieval (SEDAR) which can be accessed at www.sedar.com.
FORWARD-LOOKING STATEMENTS
The previous discussion contains statements that constitute “forward-looking information” or “forward-looking statements” within the meaning of applicable securities legislation, including, but not limited to, statements relating to: light vehicle production and operating performance in our reporting segments; implementation of improvement plans in our underperforming operations, and/or restructuring actions, including but not limited to, Western Europe and South America; the expected amount of restructuring charges; continued strong operating performance in North America; improved future earnings in Europe; expected results improvements and higher sales in Asia; and future repurchases of Common Shares under our Normal Course Issuer Bid. The forward-looking information in this MD&A is presented for the purpose of providing information about management’s current expectations and plans and such information may not be appropriate for other purposes. Forward-looking statements may include financial and other projections, as well as statements regarding our future plans, objectives or economic performance, or the assumptions underlying any of the foregoing, and other statements that are not recitations of historical fact. We use words such as “may”, “would”, “could”, “should”, “will”, “likely”, “expect”, “anticipate”, “believe”, “intend”, “plan”, “forecast”, “outlook”, “project”, “estimate” and similar expressions suggesting future outcomes or events to identify forward-looking statements. Any such forward-looking statements are based on information currently available to us, and are based on assumptions and analyses made by us in light of our experience and our perception of historical trends, current conditions and expected future developments, as well as other factors we believe are appropriate in the circumstances. However, whether actual results and developments will conform with our expectations and predictions is subject to a number of risks, assumptions and uncertainties, many of which are beyond our control, and the effects of which can be difficult to predict, including, without limitation: the potential for a deterioration of economic conditions or an extended period of economic uncertainty; declines in consumer confidence and the impact on production volume levels; continuing economic uncertainty in various geographic regions, including Western Europe; our ability to sustain or grow our business with OEMs; restructuring actions by OEMs, including plant closures; restructuring, downsizing and/or other significant non-recurring costs; continued underperformance of one or more of our operating divisions; ongoing pricing pressures, including our ability to offset price concessions demanded by our customers; our ability to successfully launch material new or takeover business; shifts in market share away from our top customers; shifts in market shares among vehicles or vehicle segments, or shifts away from vehicles on which we have significant content; risks of conducting business in foreign markets, including China, Russia, India, Argentina and Brazil and other non-traditional markets for us; a prolonged disruption in the supply of components to us from our suppliers; scheduled shutdowns of our customers’ production facilities (typically in the third and fourth quarters of each calendar year); shutdown of our or our customers’ or sub-suppliers’ production facilities due to a labour disruption; our ability to successfully compete with other automotive suppliers; a reduction in outsourcing by our customers or the loss of a material production or assembly program; the termination or non-renewal by our customers of any material production purchase order; our ability to consistently develop innovative products or processes; impairment charges related to goodwill and long-lived assets; exposure to, and ability to offset, volatile commodities prices; fluctuations in relative currency values; our ability to successfully identify, complete and integrate acquisitions or achieve anticipated synergies; our ability to conduct appropriate due diligence on acquisition targets; warranty and recall costs; risk of production disruptions due to natural disasters; pension liabilities; legal claims and/or regulatory actions against us, including the ongoing antitrust investigation being conducted by the German Federal Cartel Office; changes in our mix of earnings between jurisdictions with lower tax rates and those with higher tax rates, as well as our ability to fully benefit tax losses; other potential tax exposures; inability to achieve future investment returns that equal or exceed past returns; the unpredictability of, and fluctuation in, the trading price of our Common Shares; work stoppages and labour relations disputes; changes in credit ratings assigned to us; changes in laws and governmental regulations; costs associated with compliance with environmental laws and regulations; and other factors set out in our Annual Information Form filed with securities commissions in Canada and our annual report on Form 40-F filed with the United States Securities and Exchange Commission, and subsequent filings. In evaluating forward-looking statements, we caution readers not to place undue reliance on any forward-looking statements and readers should specifically consider the various factors which could cause actual events or results to differ materially from those indicated by such forward-looking statements. Unless otherwise required by applicable securities laws, we do not intend, nor do we undertake any obligation, to update or revise any forward-looking statements to reflect subsequent information, events, results or circumstances or otherwise.
MAGNA INTERNATIONAL INC.
Management’s Responsibility for Financial Reporting
Magna’s management is responsible for the preparation and presentation of the consolidated financial statements and all the information in the accompanying Management’s Discussion and Analysis of Results of Operations and Financial Position (“MD&A”). The consolidated financial statements were prepared by management in accordance with United States generally accepted accounting principles.
Where alternative accounting methods exist, management has selected those it considered to be most appropriate in the circumstances. Financial statements include certain amounts based on estimates and judgments. Management has determined such amounts on a reasonable basis designed to ensure that the consolidated financial statements are presented fairly, in all material respects. Financial information presented in the accompanying MD&A has been prepared by management to ensure consistency with that in the consolidated financial statements. The consolidated financial statements have been reviewed by the Audit Committee, audited by the independent auditors and approved by the Board of Directors of the Company.
Management is responsible for the development and maintenance of systems of internal accounting and administrative cost controls of high quality, consistent with reasonable cost. Such systems are designed to provide reasonable assurance that financial information is accurate, relevant and reliable, and that the Company’s activities are appropriately accounted for and assets are adequately safeguarded. In compliance with U.S. Securities and Exchange Commission (“SEC”) requirements and Section 404 of the U.S. Sarbanes-Oxley Act (“SOX”), management has determined that as at December 31, 2013 internal control over financial reporting is, in all material respects, effective. The Company’s Chief Executive Officer and Chief Financial Officer, in compliance with Section 302 of SOX, provide a certification related to the Company’s annual disclosure document in the U.S. (Form 40-F) to the SEC. According to National Instrument 52-109, the same certification is provided to the Canadian Securities Administrators.
The Company’s Audit Committee is appointed by its Board of Directors annually and is comprised solely of independent directors. The Audit Committee meets regularly with management, as well as with the independent auditors, to satisfy itself that each is properly discharging its responsibilities, to review the consolidated financial statements and the independent auditors’ report and to discuss significant financial reporting issues and auditing matters. The Audit Committee reports its findings to the Board of Directors for consideration when approving the consolidated financial statements for issuance to the shareholders.
The consolidated financial statements and the effectiveness of internal control over financial reporting have been audited by Ernst & Young LLP, the independent auditors, in accordance with the standards of the Public Company Accounting Oversight Board (United States) on behalf of the shareholders. The Independent Auditors’ Reports on the consolidated financial statements and internal controls outline the nature of their examinations and their opinions. The independent auditors have full and unrestricted access to the Audit Committee.
/s/ Donald J. Walker |
| /s/ Vincent J. Galifi |
|
|
|
Donald J. Walker |
| Vincent J. Galifi |
Chief Executive Officer |
| Executive Vice-President |
|
| and Chief Financial Officer |
|
|
|
Toronto, Canada, |
|
|
March 7, 2014 |
|
|
Report of Independent Registered Public Accounting Firm
To the Board of Directors and Shareholders of
Magna International Inc.
We have audited the accompanying consolidated balance sheets of Magna International Inc. (the “Company”) as of December 31, 2013 and 2012, and the related consolidated statements of income, comprehensive income, changes in equity, and cash flows for each of the three years in the period ended December 31, 2013. These financial statements are the responsibility of the Company’s management. Our responsibility is to express an opinion on these financial statements based on our audits.
We conducted our audits in accordance with the standards of the Public Company Accounting Oversight Board (United States). Those standards require that we plan and perform the audit to obtain reasonable assurance about whether the financial statements are free of material misstatement. An audit includes examining, on a test basis, evidence supporting the amounts and disclosures in the financial statements. An audit also includes assessing the accounting principles used and significant estimates made by management, as well as evaluating the overall financial statement presentation. We believe that our audits provide a reasonable basis for our opinion.
In our opinion, the financial statements referred to above present fairly, in all material respects, the consolidated financial position of Magna International Inc. at December 31, 2013 and 2012, and the consolidated results of its operations and its cash flows for each of the three years in the period ended December 31, 2013, in conformity with U.S. generally accepted accounting principles.
We also have audited, in accordance with the standards of the Public Company Accounting Oversight Board (United States), the Company’s internal control over financial reporting as of December 31, 2013, based on criteria established in Internal Control-Integrated Framework issued by the Committee of Sponsoring Organizations of the Treadway Commission (1992 framework) and our report dated March 7, 2014 expressed an unqualified opinion thereon.
/s/ Ernst & Young LLP
Chartered Accountants
Licensed Public Accountants
March 7, 2014
Toronto, Canada
Report of Independent Registered Public Accounting Firm
To the Board of Directors and Shareholders of
Magna International Inc.
We have audited Magna International Inc.’s (the “Company”) internal control over financial reporting as of December 31, 2013, based on criteria established in Internal Control - Integrated Framework issued by the Committee of Sponsoring Organizations of the Treadway Commission (1992 framework) (the “COSO” criteria). The Company’s management is responsible for maintaining effective internal control over financial reporting, and for its assessment of the effectiveness of internal control over financial reporting included in the accompanying Management’s Responsibility for Financial Reporting. Our responsibility is to express an opinion on the effectiveness of the Company’s internal control over financial reporting based on our audit.
We conducted our audit in accordance with the standards of the Public Company Accounting Oversight Board (United States). Those standards require that we plan and perform the audit to obtain reasonable assurance about whether effective internal control over financial reporting was maintained in all material respects. Our audit included obtaining an understanding of internal control over financial reporting, assessing the risk that a material weakness exists, testing and evaluating the design and operating effectiveness of internal control based on the assessed risk, and performing such other procedures as we considered necessary in the circumstances. We believe that our audit provides a reasonable basis for our opinion.
A company’s internal control over financial reporting is a process designed to provide reasonable assurance regarding the reliability of financial reporting and the preparation of financial statements for external purposes in accordance with generally accepted accounting principles. A company’s internal control over financial reporting includes those policies and procedures that (1) pertain to the maintenance of records that, in reasonable detail, accurately and fairly reflect the transactions and dispositions of the assets of the company; (2) provide reasonable assurance that transactions are recorded as necessary to permit preparation of financial statements in accordance with generally accepted accounting principles, and that receipts and expenditures of the company are being made only in accordance with authorizations of management and directors of the company; and (3) provide reasonable assurance regarding prevention or timely detection of unauthorized acquisition, use, or disposition of the company’s assets that could have a material effect on the financial statements.
Because of its inherent limitations, internal control over financial reporting may not prevent or detect misstatements. Also, projections of any evaluation of effectiveness to future periods are subject to the risk that controls may become inadequate because of changes in conditions, or that the degree of compliance with the policies or procedures may deteriorate.
In our opinion, the Company maintained, in all material respects, effective internal control over financial reporting as of December 31, 2013, based on the COSO criteria.
We also have audited, in accordance with the standards of the Public Company Accounting Oversight Board (United States), the consolidated balance sheets of the Company as of December 31, 2013 and 2012, and the related consolidated statements of income, comprehensive income, changes in equity and cash flows for each of the three years in the period ended December 31, 2013 and our report dated March 7, 2014 expressed an unqualified opinion thereon.
/s/ Ernst & Young LLP
Chartered Accountants
Licensed Public Accountants
March 7, 2014
Toronto, Canada
MAGNA INTERNATIONAL INC.
Consolidated Statements of Income
[U.S. dollars in millions, except per share figures]
Years ended December 31,
|
| Note |
| 2013 |
| 2012 |
| 2011 |
| |||
Sales |
|
|
| $ | 34,835 |
| $ | 30,837 |
| $ | 28,748 |
|
Costs and expenses |
|
|
|
|
|
|
|
|
| |||
Cost of goods sold |
| 16 |
| 30,287 |
| 27,019 |
| 25,434 |
| |||
Depreciation and amortization |
|
|
| 1,063 |
| 801 |
| 686 |
| |||
Selling, general and administrative |
| 8, 18 |
| 1,616 |
| 1,510 |
| 1,382 |
| |||
Interest expense (income), net |
| 15 |
| 16 |
| 16 |
| (6 | ) | |||
Equity income |
|
|
| (196 | ) | (151 | ) | (121 | ) | |||
Other expense (income), net |
| 3 |
| 144 |
| (108 | ) | 156 |
| |||
Income from operations before income taxes |
|
|
| 1,905 |
| 1,750 |
| 1,217 |
| |||
Income taxes |
| 11 |
| 360 |
| 324 |
| 202 |
| |||
Net income |
|
|
| 1,545 |
| 1,426 |
| 1,015 |
| |||
Net loss attributable to non-controlling interests |
|
|
| 16 |
| 7 |
| 3 |
| |||
Net income attributable to Magna International Inc. |
|
|
| $ | 1,561 |
| $ | 1,433 |
| $ | 1,018 |
|
Earnings per Common Share: |
| 4 |
|
|
|
|
|
|
| |||
Basic |
|
|
| $ | 6.85 |
| $ | 6.17 |
| $ | 4.26 |
|
Diluted |
|
|
| $ | 6.76 |
| $ | 6.09 |
| $ | 4.20 |
|
Cash dividends paid per Common Share |
|
|
| $ | 1.28 |
| $ | 1.10 |
| $ | 1.00 |
|
Average number of Common Shares outstanding during the year [in millions]: |
| 4 |
|
|
|
|
|
|
| |||
Basic |
|
|
| 227.9 |
| 232.4 |
| 239.3 |
| |||
Diluted |
|
|
| 230.8 |
| 235.2 |
| 242.8 |
| |||
See accompanying notes
MAGNA INTERNATIONAL INC.
Consolidated Statements of Comprehensive Income
[U.S. dollars in millions]
Years ended December 31,
|
| Note |
| 2013 |
| 2012 |
| 2011 |
| |||
Net income |
|
|
| $ | 1,545 |
| $ | 1,426 |
| $ | 1,015 |
|
Other comprehensive income (loss), net of tax: |
| 20 |
|
|
|
|
|
|
| |||
Net unrealized (loss) gain on translation of net investment in foreign operations |
|
|
| (134 | ) | 88 |
| (171 | ) | |||
Net unrealized (loss) gain on cash flow hedges |
|
|
| (39 | ) | 75 |
| (41 | ) | |||
Reclassification of net gain on cash flow hedges to net income |
|
|
| (15 | ) | (18 | ) | (22 | ) | |||
Reclassification of net loss on pensions to net income |
|
|
| 7 |
| 11 |
| 3 |
| |||
Pension and post-retirement benefits |
|
|
| 44 |
| (72 | ) | (52 | ) | |||
Net unrealized loss on available-for-sale investments |
|
|
| (5 | ) | (4 | ) | (6 | ) | |||
Other comprehensive (loss) income |
|
|
| (142 | ) | 80 |
| (289 | ) | |||
|
|
|
|
|
|
|
|
|
| |||
Comprehensive income |
|
|
| 1,403 |
| 1,506 |
| 726 |
| |||
Comprehensive loss attributable to non-controlling interests |
|
|
| 17 |
| 5 |
| 3 |
| |||
Comprehensive income attributable to Magna International Inc. |
|
|
| $ | 1,420 |
| $ | 1,511 |
| $ | 729 |
|
See accompanying notes
MAGNA INTERNATIONAL INC.
Consolidated Statements of Cash Flows
[U.S. dollars in millions]
Years ended December 31,
|
| Note |
| 2013 |
| 2012 |
| 2011 |
| |||
|
|
|
|
|
|
|
|
|
| |||
OPERATING ACTIVITIES |
|
|
|
|
|
|
|
|
| |||
Net income |
|
|
| $ | 1,545 |
| $ | 1,426 |
| $ | 1,015 |
|
Items not involving current cash flows |
| 5 |
| 1,149 |
| 708 |
| 826 |
| |||
|
|
|
| 2,694 |
| 2,134 |
| 1,841 |
| |||
Changes in non-cash operating assets and liabilities |
| 5 |
| (127 | ) | 72 |
| (631 | ) | |||
Cash provided from operating activities |
|
|
| 2,567 |
| 2,206 |
| 1,210 |
| |||
|
|
|
|
|
|
|
|
|
| |||
INVESTMENT ACTIVITIES |
|
|
|
|
|
|
|
|
| |||
Fixed asset additions |
|
|
| (1,169 | ) | (1,274 | ) | (1,236 | ) | |||
Purchase of subsidiaries |
| 6 |
| (9 | ) | (525 | ) | (120 | ) | |||
Increase in investments and other assets |
|
|
| (192 | ) | (122 | ) | (196 | ) | |||
Disposal of facilities |
| 3 |
| — |
| — |
| 112 |
| |||
Proceeds from disposition |
|
|
| 163 |
| 106 |
| 168 |
| |||
Cash used for investment activities |
|
|
| (1,207 | ) | (1,815 | ) | (1,272 | ) | |||
|
|
|
|
|
|
|
|
|
| |||
FINANCING ACTIVITIES |
|
|
|
|
|
|
|
|
| |||
(Decrease) increase in bank indebtedness |
|
|
| (18 | ) | 42 |
| 38 |
| |||
Repayments of debt |
| 15 |
| (173 | ) | (309 | ) | (47 | ) | |||
Issues of debt |
| 15 |
| 151 |
| 348 |
| 146 |
| |||
Issues of Common Shares |
|
|
| 63 |
| 14 |
| 59 |
| |||
Settlement of stock options |
| 18 |
| (23 | ) | (19 | ) | (30 | ) | |||
Repurchase of Common Shares |
| 19 |
| (1,020 | ) | (40 | ) | (407 | ) | |||
Contribution to subsidiaries by non-controlling interests |
|
|
| 4 |
| — |
| 20 |
| |||
Dividends paid |
|
|
| (284 | ) | (252 | ) | (236 | ) | |||
Cash used for financing activities |
|
|
| (1,300 | ) | (216 | ) | (457 | ) | |||
|
|
|
|
|
|
|
|
|
| |||
Effect of exchange rate changes on cash and cash equivalents |
|
|
| (28 | ) | 22 |
| (37 | ) | |||
|
|
|
|
|
|
|
|
|
| |||
Net increase (decrease) in cash and cash equivalents during the year |
|
|
| 32 |
| 197 |
| (556 | ) | |||
Cash and cash equivalents, beginning of year |
|
|
| 1,522 |
| 1,325 |
| 1,881 |
| |||
Cash and cash equivalents, end of year |
|
|
| $ | 1,554 |
| $ | 1,522 |
| $ | 1,325 |
|
See accompanying notes
MAGNA INTERNATIONAL INC.
Consolidated Balance Sheets
[U.S. dollars in millions]
As at December 31,
|
| Note |
| 2013 |
| 2012 |
| ||
|
|
|
|
|
|
|
| ||
ASSETS |
|
|
|
|
|
|
| ||
Current assets |
|
|
|
|
|
|
| ||
Cash and cash equivalents |
| 5 |
| $ | 1,554 |
| $ | 1,522 |
|
Accounts receivable |
|
|
| 5,246 |
| 4,774 |
| ||
Inventories |
| 7 |
| 2,637 |
| 2,512 |
| ||
Deferred tax assets |
| 11 |
| 275 |
| 170 |
| ||
Prepaid expenses and other |
|
|
| 211 |
| 157 |
| ||
|
|
|
| 9,923 |
| 9,135 |
| ||
|
|
|
|
|
|
|
| ||
Investments |
| 3, 8, 16, 21 |
| 391 |
| 385 |
| ||
Fixed assets, net |
| 3, 9 |
| 5,441 |
| 5,273 |
| ||
Goodwill |
| 3, 10 |
| 1,440 |
| 1,473 |
| ||
Deferred tax assets |
| 11 |
| 120 |
| 90 |
| ||
Other assets |
| 3, 12, 16 |
| 675 |
| 753 |
| ||
|
|
|
| $ | 17,990 |
| $ | 17,109 |
|
|
|
|
|
|
|
|
| ||
LIABILITIES AND SHAREHOLDERS’ EQUITY |
|
|
|
|
|
|
| ||
Current liabilities |
|
|
|
|
|
|
| ||
Bank indebtedness |
| 15 |
| $ | 41 |
| $ | 71 |
|
Accounts payable |
|
|
| 4,781 |
| 4,450 |
| ||
Accrued salaries and wages |
| 13 |
| 704 |
| 617 |
| ||
Other accrued liabilities |
| 14 |
| 1,538 |
| 1,185 |
| ||
Income taxes payable |
|
|
| 6 |
| 93 |
| ||
Deferred tax liabilities |
| 11 |
| 9 |
| 19 |
| ||
Long-term debt due within one year |
| 15 |
| 230 |
| 249 |
| ||
|
|
|
| 7,309 |
| 6,684 |
| ||
|
|
|
|
|
|
|
| ||
Long-term employee benefit liabilities |
| 16 |
| 532 |
| 560 |
| ||
Long-term debt |
| 15 |
| 102 |
| 112 |
| ||
Other long-term liabilities |
| 17 |
| 208 |
| 154 |
| ||
Deferred tax liabilities |
| 11 |
| 200 |
| 141 |
| ||
|
|
|
| 8,351 |
| 7,651 |
| ||
Shareholders’ equity |
|
|
|
|
|
|
| ||
Common Shares [issued: 221,151,704; 2012 - 233,115,783] |
| 19 |
| 4,230 |
| 4,391 |
| ||
Contributed surplus |
|
|
| 69 |
| 80 |
| ||
Retained earnings |
| 19 |
| 5,011 |
| 4,462 |
| ||
Accumulated other comprehensive income |
| 20 |
| 313 |
| 496 |
| ||
|
|
|
| 9,623 |
| 9,429 |
| ||
|
|
|
|
|
|
|
| ||
Non-controlling interest |
|
|
| 16 |
| 29 |
| ||
|
|
|
| 9,639 |
| 9,458 |
| ||
|
|
|
| $ | 17,990 |
| $ | 17,109 |
|
Commitments and contingencies [notes 15, 21 and 22]
See accompanying notes
On behalf of the Board:
/s/ Lawrence D. Worrall |
| /s/ William L. Young |
|
|
|
Lawrence D. Worrall |
| William L. Young |
Director |
| Chairman of the Board |
MAGNA INTERNATIONAL INC.
Consolidated Statements of Changes in Equity
[U.S. dollars in millions]
|
| Common Shares |
|
|
|
|
|
|
| Non- |
|
|
| ||||||||
|
|
|
| Stated |
| Contributed |
| Retained |
|
|
| controlling |
| Total |
| ||||||
|
| Number |
| Value |
| Surplus |
| Earnings |
| AOCI [i] |
| Interest |
| Equity |
| ||||||
|
| [in millions] |
|
|
|
|
|
|
|
|
|
|
|
|
| ||||||
Balance, December 31, 2010 |
| 242.6 |
| $ | 4,500 |
| $ | 56 |
| $ | 2,715 |
| $ | 752 |
| $ | 3 |
| $ | 8,026 |
|
Net income |
|
|
|
|
|
|
| 1,018 |
|
|
| (3 | ) | 1,015 |
| ||||||
Other comprehensive loss |
|
|
|
|
|
|
|
|
| (289 | ) |
|
| (289 | ) | ||||||
Contribution to subsidiaries by non-controlling interests |
|
|
|
|
|
|
|
|
|
|
| 20 |
| 20 |
| ||||||
Acquisition of subsidiaries |
|
|
|
|
|
|
|
|
|
|
| 7 |
| 7 |
| ||||||
Shares issued on exercise of stock options |
| 1.4 |
| 69 |
| (10 | ) |
|
|
|
|
|
| 59 |
| ||||||
Release of restricted stock |
|
|
| 6 |
| (6 | ) |
|
|
|
|
|
| — |
| ||||||
Repurchase and cancellation under normal course issuer bid [note 19] |
| (10.7 | ) | (204 | ) |
|
| (162 | ) | (41 | ) |
|
| (407 | ) | ||||||
Stock-based compensation expense [note 18] |
|
|
|
|
| 31 |
|
|
|
|
|
|
| 31 |
| ||||||
Settlement of stock options [note 18] |
|
|
|
|
| (8 | ) | (16 | ) |
|
|
|
| (24 | ) | ||||||
Dividends paid |
|
|
| 2 |
|
|
| (238 | ) |
|
|
|
| (236 | ) | ||||||
Balance, December 31, 2011 |
| 233.3 |
| 4,373 |
| 63 |
| 3,317 |
| 422 |
| 27 |
| 8,202 |
| ||||||
Net income |
|
|
|
|
|
|
| 1,433 |
|
|
| (7 | ) | 1,426 |
| ||||||
Other comprehensive income |
|
|
|
|
|
|
|
|
| 78 |
| 2 |
| 80 |
| ||||||
Acquisition of subsidiaries |
|
|
|
|
|
|
|
|
|
|
| 7 |
| 7 |
| ||||||
Shares issued on exercise of stock options |
| 0.4 |
| 19 |
| (5 | ) |
|
|
|
|
|
| 14 |
| ||||||
Release of restricted stock |
|
|
| 5 |
| (5 | ) |
|
|
|
|
|
| — |
| ||||||
Release of restricted stock units |
|
|
| 5 |
| (5 | ) |
|
|
|
|
|
| — |
| ||||||
Repurchase and cancellation under normal course issuer bid [note 19] |
| (0.8 | ) | (18 | ) |
|
| (20 | ) | (4 | ) |
|
| (42 | ) | ||||||
Stock-based compensation expense [note 18] |
|
|
|
|
| 39 |
|
|
|
|
|
|
| 39 |
| ||||||
Settlement of stock options [note 18] |
|
|
|
|
| (7 | ) | (9 | ) |
|
|
|
| (16 | ) | ||||||
Dividends paid |
| 0.2 |
| 7 |
|
|
| (259 | ) |
|
|
|
| (252 | ) | ||||||
Balance, December 31, 2012 |
| 233.1 |
| 4,391 |
| 80 |
| 4,462 |
| 496 |
| 29 |
| 9,458 |
| ||||||
Net income |
|
|
|
|
|
|
| 1,561 |
|
|
| (16 | ) | 1,545 |
| ||||||
Other comprehensive loss |
|
|
|
|
|
|
|
|
| (141 | ) | (1 | ) | (142 | ) | ||||||
Issues of shares by subsidiaries |
|
|
|
|
|
|
|
|
|
|
| 4 |
| 4 |
| ||||||
Shares issued on exercise of stock options |
| 2.0 |
| 84 |
| (21 | ) |
|
|
|
|
|
| 63 |
| ||||||
Release of restricted stock |
|
|
| 6 |
| (6 | ) |
|
|
|
|
|
| — |
| ||||||
Release of restricted stock units |
|
|
| 9 |
| (9 | ) |
|
|
|
|
|
| — |
| ||||||
Repurchase and cancellation under normal course issuer bids [note 19] |
| (14.1 | ) | (271 | ) |
|
| (707 | ) | (42 | ) |
|
| (1,020 | ) | ||||||
Stock-based compensation expense [note 18] |
|
|
|
|
| 34 |
|
|
|
|
|
|
| 34 |
| ||||||
Settlement of stock options [note 18] |
|
|
|
|
| (9 | ) | (10 | ) |
|
|
|
| (19 | ) | ||||||
Dividends paid |
| 0.2 |
| 11 |
|
|
| (295 | ) |
|
|
|
| (284 | ) | ||||||
Balance, December 31, 2013 |
| 221.2 |
| $ | 4,230 |
| $ | 69 |
| $ | 5,011 |
| $ | 313 |
| $ | 16 |
| $ | 9,639 |
|
[i] AOCI is Accumulated Other Comprehensive Income.
See accompanying notes
MAGNA INTERNATIONAL INC.
Notes to the Consolidated Financial Statements
[All amounts in U.S. dollars and all tabular amounts in millions, except per share figures, unless otherwise noted]
1. SIGNIFICANT ACCOUNTING POLICIES
Magna International Inc. [collectively “Magna” or the “Company”] is a leading global automotive supplier with 316 manufacturing operations and 84 product development, engineering and sales centres in 29 countries. Magna has over 125,000 employees focused on delivering superior value to customers through innovative processes and World Class Manufacturing. The Company’s product capabilities include body, chassis, interior, exterior, seating, powertrain, electronic, vision, closure and roof systems and modules, as well as complete vehicle engineering and contract manufacturing.
The consolidated financial statements have been prepared in U.S. dollars following U.S. generally accepted accounting principles [“GAAP”].
Principles of consolidation
The consolidated financial statements include the accounts of Magna and its subsidiaries, some of which have a non-controlling interest.
Financial instruments
The Company classifies all of its financial assets and financial liabilities as held-for-trading, held-to-maturity investments, loans and receivables, available-for-sale financial assets, or other financial liabilities. Held-for-trading financial instruments, which include cash and cash equivalents and the Company’s investment in asset-backed commercial paper [“ABCP”] are measured at fair value and all gains and losses are included in net income in the period in which they arise. Held-to-maturity investments, which include long-term interest bearing government securities held to partially fund certain Austrian lump sum termination and long service payment arrangements, are recorded at amortized cost using the effective interest method. Loans and receivables, which include accounts receivable, long-term receivables and accounts payable, are recorded at amortized cost using the effective interest method. Available-for-sale financial assets are recorded at cost and are subsequently measured at fair value with all revaluation gains and losses included in other comprehensive income.
Foreign currency translation
The Company operates globally, which gives rise to a risk that its earnings and cash flows may be adversely impacted by fluctuations in foreign exchange rates.
Assets and liabilities of the Company’s operations having a functional currency other than the U.S. dollar are translated into U.S. dollars using the exchange rate in effect at year end, and revenues and expenses are translated at the average rate during the year. Exchange gains or losses on translation of the Company’s net investment in these operations are included in comprehensive income and are deferred in accumulated other comprehensive income. Foreign exchange gains or losses on debt that was designated as a hedge of the Company’s net investment in these operations are also recorded in accumulated other comprehensive income.
Foreign exchange gains and losses on transactions occurring in a currency other than an operation’s functional currency are reflected in income, except for gains and losses on foreign exchange contracts used to hedge specific future commitments in foreign currencies and on intercompany balances which are designated as long-term investments. In particular, the Company uses foreign exchange forward contracts for the sole purpose of hedging certain of the Company’s future committed foreign currency based outflows and inflows. Most of the Company’s foreign exchange contracts are subject to master netting arrangements that provide for the net settlement of contracts, by counterparty, in the event of default or termination. All derivative instruments, including foreign exchange contracts, are recorded on the consolidated balance sheet at fair value. The fair values of derivatives are recorded on a gross basis in prepaid expenses, other assets, other accrued liabilities or other long-term liabilities. To the extent that cash flow hedges are effective, the change in their fair value is recorded in other comprehensive income; any ineffective portion is recorded in net income. Amounts accumulated in other comprehensive income are reclassified to net income in the period in which the hedged item affects net income.
If the Company’s foreign exchange forward contracts cease to be effective as hedges, for example, if projected foreign cash inflows or outflows declined significantly, gains or losses pertaining to the portion of the hedging transactions in excess of projected foreign currency denominated cash flows would be recognized in income at the time this condition was identified.
Cash and cash equivalents
Cash and cash equivalents include cash on account, demand deposits and short-term investments with remaining maturities of less than three months at acquisition.
Inventories
Production inventories and tooling inventories manufactured in-house are valued at the lower of cost and market, with cost being determined substantially on a first-in, first-out basis. Cost includes the cost of materials plus direct labour applied to the product and the applicable share of manufacturing overhead.
Outsourced tooling inventories are valued at the lower of subcontracted costs and market.
Investments
The Company accounts for its investments in which it has significant influence on the equity basis. Investments also include the Company’s investment in ABCP, public company shares and long-term interest bearing government securities held to partially fund certain Austrian lump sum termination and long service payment arrangements pursuant to local tax laws.
Long-lived assets
Fixed assets are recorded at historical cost. Depreciation is provided on a straight-line basis over the estimated useful lives of fixed assets at annual rates of 2½% to 5% for buildings, 7% to 10% for general purpose equipment and 10% to 33% for special purpose equipment.
Definite-lived intangible assets, which have arisen principally through acquisitions, are recorded in other assets and are amortized on a straight-line basis over their estimated useful lives, typically over periods not exceeding five years.
The Company assesses fixed and other long-lived assets [excluding goodwill] for recoverability whenever indicators of impairment exist. If the carrying value of the asset exceeds the estimated undiscounted cash flows from the use of the asset, then an impairment loss is recognized to write the asset down to fair value. The fair value of the long-lived assets is generally determined using estimated discounted future cash flows.
Goodwill
Goodwill represents the excess of the cost of an acquired enterprise over the fair value of the identifiable assets acquired and liabilities assumed less any subsequent writedowns for impairment. Goodwill is reviewed for impairment on an annual basis. Goodwill impairment is evaluated between annual tests upon the occurrence of certain events or circumstances. Goodwill impairment is assessed based on a comparison of the fair value of a reporting unit to the underlying carrying value of the reporting unit’s net assets, including goodwill. When the carrying amount of the reporting unit exceeds its fair value, the fair value of the reporting unit’s goodwill is compared with its carrying amount to measure the amount of impairment, if any. The fair value of a reporting unit is generally determined using the estimated discounted future cash flows of the reporting unit.
Other assets
Other assets include the long-term portion of certain receivables, which represent the recognized sales value of tooling and design and engineering services provided to customers under certain long-term contracts. The receivables will be paid in full upon completion of the contracts or in instalments based on forecasted production volumes. In the event that actual production volumes are less than those forecasted, a reimbursement for any shortfall will be made.
Preproduction costs related to long-term supply agreements
Pre-operating costs incurred in establishing new facilities that require substantial time to reach commercial production capability are expensed as incurred.
Costs incurred [net of customer subsidies] related to design and engineering, which are paid for as part of subsequent production piece price amounts, are expensed as incurred unless a contractual guarantee for reimbursement exists.
Costs incurred [net of customer subsidies] related to design and development costs for moulds, dies and other tools that the Company does not own [and that will be used in, and paid for as part of the piece price amount for, subsequent production] are expensed as incurred unless the supply agreement provides a contractual guarantee for reimbursement or the non cancellable right to use the moulds, dies and other tools during the supply agreement.
Where these preproduction costs are deemed to be a single unit of account combined with a subsequent parts production, the costs deferred in the above circumstances are included in other assets and amortized on a units-of-production basis to cost of goods sold over the anticipated term of the supply agreement.
Warranty
The Company records product warranty liabilities based on its individual customer agreements. Under most customer agreements, the Company only accounts for existing or probable claims on product default issues when amounts related to such issues are probable and reasonably estimable. Under certain complete vehicle engineering and assembly contracts, the Company records an estimate of future warranty-related costs based on the terms of the specific customer agreements and the specific customer’s warranty experience.
Product liability provisions are established based on the Company’s best estimate of the amounts necessary to settle existing claims on product default issues. Recall costs are costs incurred when government regulators and/or the customer decides to recall a product due to a known or suspected performance issue, and the Company is required to participate, either voluntarily or involuntarily. Costs typically include the cost of the product being replaced, the customer’s cost of the recall and labour to remove and replace the defective part. When a decision to recall a product has been made or is probable, the Company’s portion of the estimated cost of the recall is recorded as a charge to income in that period. In making this estimate, judgment is required as to the number of units that may be returned as a result of the recall, the total cost of the recall campaign and the ultimate negotiated sharing of the cost between the Company, the customer and, in some cases, a supplier to the Company.
Employee future benefit plans
The cost of providing benefits through defined benefit pensions, lump sum termination and long service payment arrangements, and post-retirement benefits other than pensions is actuarially determined and recognized in income using the projected benefit method pro-rated on service and management’s best estimate of expected plan investment performance, salary escalation, retirement ages of employees and, with respect to medical benefits, expected health care costs. Differences arising from plan amendments, changes in assumptions and experience gains and losses that are greater than 10% of the greater of the accrued benefit obligation at the beginning of the year and the fair value, or market related value, of plan assets at the beginning of the year, are recognized in income over the expected average remaining service life of employees. Gains related to plan curtailments are recognized when the event giving rise to the curtailment has occurred. Plan assets are valued at fair value. The cost of providing benefits through defined contribution pension plans is charged to income in the period in respect of which contributions become payable.
The funded status of the plans is measured as the difference between the plan assets at fair value and the projected benefit obligation [PBO]. The aggregate of all overfunded plans is recorded in other assets, and the aggregate of all underfunded plans in long-term employee benefit liabilities. The portion of the amount by which the actuarial present value of benefits included in the PBO exceeds the fair value of plan assets, payable in the next twelve months, is reflected in accrued liabilities. This is determined on a plan by plan basis.
Asset retirement obligation
The Company recognizes its obligation to restore leased premises at the end of the lease by recording at lease inception the estimated fair value of this obligation as other long-term liabilities with a corresponding amount recognized as fixed assets. The fixed asset amount is amortized over the period from lease inception to the time the Company expects to vacate the premises, resulting in both depreciation and interest charges. The estimated fair value of the obligation is assessed for changes in the expected timing and extent of expenditures with changes related to the time value of money recorded as interest expense.
Revenue recognition
Revenue from the sale of manufactured products is recognized when the price is fixed or determinable, collectability is reasonably assured and upon shipment to [or receipt by customers, depending on contractual terms], and acceptance by customers.
For revenue arrangements entered into prior to January 1, 2011, tooling and engineering services are accounted for as a separate revenue element only in circumstances where the tooling and engineering has value to the customer on a standalone basis and there is objective and reliable evidence of the fair value of the subsequent parts production or vehicle assembly. For revenue arrangements entered into or materially modified on or after January 1, 2011, tooling and engineering services are accounted for as a separate revenue element only in circumstances where the tooling and engineering has value to the customer on a standalone basis. Revenues from significant engineering services and tooling contracts that qualify as separate revenue elements are recognized on a percentage of completion basis. Percentage-of-completion is generally determined based on the proportion of accumulated expenditures to date as compared to total anticipated expenditures.
Revenue and cost of goods sold, including amounts from engineering and tooling contracts, are presented on a gross basis in the consolidated statements of income and comprehensive income when the Company is acting as principal and is subject to significant risks and rewards in connection with the process of bringing the product to its final state and in the post-sale dealings with its customers. Otherwise, components of revenues and related costs are presented on a net basis. With respect to vehicle assembly sales, where Magna is acting as principal with respect to purchased components and systems, the selling price to the customer includes the costs of such inputs. These programs are accounted for on a full-cost basis under which sales and cost of goods sold include these input costs.
Government assistance
The Company makes periodic applications for financial assistance under available government assistance programs in the various jurisdictions that the Company operates. Grants relating to capital expenditures are reflected as a reduction of the cost of the related assets. Grants relating to current operating expenditures are generally recorded as a reduction of the related expense at the time the eligible expenses are incurred. The Company also receives tax credits and tax super allowances, the benefits of which are recorded as a reduction of income tax expense. In addition, the Company receives loans which are recorded as liabilities in amounts equal to the cash received. When a government loan is issued to the Company at a below-market rate of interest, the loan is initially recorded at its net present value, and accreted to its face value over the period of the loan. The benefit of the below-market rate of interest is accounted for like a government grant. It is measured as the difference between the initial carrying value of the loan and the cash proceeds received.
Income taxes
The Company uses the liability method of tax allocation to account for income taxes. Under the liability method of tax allocation, deferred tax assets and liabilities are determined based on differences between the financial reporting and tax bases of assets and liabilities and are measured using the enacted tax rates and laws that will be in effect when the differences are expected to reverse.
No deferred tax liability is recorded for taxes on undistributed earnings and translation adjustments of foreign subsidiaries if these items are either considered to be reinvested for the foreseeable future or if they are available for repatriation and are not subject to further tax on remittance. Taxes will be recorded on such foreign undistributed earnings and translation adjustments when it becomes apparent that such earnings will be distributed in the foreseeable future and the Company will incur further significant tax on remittance.
Recognition of uncertain tax positions is dependent on whether it is more-likely-than-not that a tax position taken or expected to be taken in a tax return will be sustained upon examination, including resolution of any related appeals or litigation processes, based on the technical merits of the position. If a tax position meets the more-likely-than-not recognition threshold, it is measured to determine the amount of benefit to recognize in the financial statements. The Company recognizes interest and penalties related to uncertain tax positions in income tax expense.
Stock-based compensation
Compensation expense is recognized for stock options based upon the fair value of the options at the grant or modification date. The fair value of the options is recognized over the vesting period of the options as compensation expense in selling, general and administrative expense with a corresponding increase to contributed surplus.
The fair value of stock options is estimated at the grant or modification date using the Black-Scholes option pricing model. This model requires the input of a number of assumptions, including expected dividend yields, expected stock price volatility, expected time until exercise and risk-free interest rates. Although the assumptions used reflect management’s best estimates, they involve inherent uncertainties based on market conditions generally outside the Company’s control. If other assumptions are used, stock-based compensation expense could be significantly impacted.
As stock options are exercised, the proceeds received on exercise, in addition to the portion of the contributed surplus balance related to those stock options, is credited to Common Shares and contributed surplus is reduced accordingly.
The Company’s restricted stock plans and certain restricted share unit plans are measured at fair value at the date of grant or modification and amortized to compensation expense from the effective date of the grant to the final vesting date in selling, general and administrative expense with a corresponding increase to contributed surplus. As restricted stock or restricted share units are released under the plans, the portion of the contributed surplus balance relating to the restricted stock or restricted share units is credited to Common Shares and released from contributed surplus. Certain other restricted share unit plans are recorded as liabilities at the date of grant and are marked to market in selling, general and administrative expenses each period until settled.
Comprehensive income
Other comprehensive income includes unrealized gains and losses on translation of the Company’s net investment in self-sustaining foreign operations, the change in fair value of available-for-sale investments, net of taxes, change in unamortized actuarial amounts, net of taxes and to the extent that cash flow hedges are effective, the change in their fair value, net of income taxes.
Accumulated other comprehensive income is a separate component of shareholders’ equity which includes the accumulated balances of all components of other comprehensive income which are recognized in comprehensive income but excluded from net income.
Earnings per Common Share
Basic earnings per Common Share are calculated on net income attributable to Magna International Inc. using the weighted average number of Common Shares outstanding during the year.
Diluted earnings per Common Share are calculated on the weighted average number of Common Shares outstanding, including an adjustment for stock options outstanding using the treasury stock method.
Common Shares that have not been released under the Company’s restricted stock plan or are being held in trust for purposes of the Company’s restricted stock unit program have been excluded from the calculation of basic earnings per share but have been included in the calculation of diluted earnings per share.
Use of estimates
The preparation of the consolidated financial statements in conformity with U.S. GAAP requires management to make estimates and assumptions that affect the amounts reported and disclosed in the consolidated financial statements and accompanying notes. Actual results could differ from those estimates.
2. ACCOUNTING STANDARDS
Intangibles
During 2012, the Financial Accounting Standards Board [“FASB”] issued Accounting Standards Update [“ASU”] 2012-02, “Intangibles — Goodwill and Other (Topic 350): Testing Indefinite-Lived Intangible Assets for Impairment”. ASU 2012-02 provides an option to first perform a qualitative assessment to determine whether it is more-likely-than-not that an indefinite-lived intangible asset is impaired. The adoption of this ASU did not have a material impact on the Company’s consolidated financial statements.
Accumulated Other Comprehensive Income [“AOCI”]
In February 2013, the FASB issued ASU 2013-02, “Comprehensive Income (Topic 220): Reporting of Amounts Reclassified Out of Accumulated Other Comprehensive Income”, which is effective prospectively for public companies for reporting periods beginning after December 15, 2012. ASU 2013-02 requires an entity to report the effect of significant reclassifications out of AOCI on the respective line items in net income if the amount being reclassified is required under GAAP to be reclassified in its entirety to net income. For other amounts that are not required under GAAP to be reclassified in their entirety to net income in the same reporting period, an entity is required to cross-reference other disclosures required under GAAP that provide additional detail about those amounts. The ASU was adopted effective January 1, 2013 and did not have a material impact on the Company’s consolidated financial statements. The required disclosures were added to note 20[a].
Balance sheet offsetting
In December 2011, the FASB issued ASU 2011-11, “Disclosure about Offsetting Assets and Liabilities,” which requires additional disclosures regarding offsetting and related arrangements. In January 2013, the FASB issued ASU 2013-01, “Clarifying the Scope of Disclosures about Offsetting Assets and Liabilities,” which clarifies that ordinary trade receivables and receivables in general are not within the scope of ASU 2011-11. The balance sheet offsetting disclosures would apply to derivatives that are subject to enforceable master netting arrangements or similar agreements. The ASU was adopted effective January 1, 2013 and did not have a material impact on the Company’s consolidated financial statements. The required disclosures were added to note 21[d].
Future Accounting Standards
Unrecognized tax benefits
In July 2013, the FASB issued ASU 2013-11, “Presentation of an Unrecognized Tax Benefit When a Net Operating Loss Carryforward, a Similar Tax Loss, or a Tax Credit Carryforward Exists”. ASU 2013-11 clarifies guidance and eliminates diversity in practice on the presentation of unrecognized tax benefits when a net operating loss carryforward, a similar tax loss, or a tax credit carryforward exists at the reporting date. The guidance is effective for annual reporting periods beginning on or after December 15, 2013 and subsequent interim periods. The Company currently presents its unrecognized tax benefits in accordance with ASU 2013-11 and therefore this pronouncement will not result in a change to the Company’s consolidated financial statements.
Joint and several liability arrangements
In February 2013, the FASB issued ASU 2013-04, “Obligations Resulting from Joint and Several Liability Arrangements for Which the Total Amount of the Obligation is Fixed at the Reporting Date”. ASU 2013-04 requires reporting and disclosure about obligations resulting from joint and several liability arrangements within the scope of Subtopic 405-40 for which the total amount of the obligation is fixed at the reporting date. ASU 2013-04 is effective for fiscal years and interim periods beginning after December 15, 2013. The impact, if any, on the Company’s consolidated financial statements is currently being assessed.
3. OTHER EXPENSE (INCOME), NET
Other expense (income), net consists of significant items such as: restructuring charges generally related to plant closures; impairment charges; gains or losses on disposal of facilities; re-measurement gains on acquisitions; and other items not reflective of on-going operating profit or loss. Other expense (income), net consists of:
|
| 2013 |
| 2012 |
| 2011 |
| |||
North America [a] |
|
|
|
|
|
|
| |||
Impairment of long-lived assets |
| $ | 23 |
| $ | 2 |
| $ | 7 |
|
Re-measurement gain of STT |
| — |
| (35 | ) | — |
| |||
Settlement agreement |
| — |
| — |
| 11 |
| |||
Insurance proceeds |
| — |
| — |
| (15 | ) | |||
|
| 23 |
| (33 | ) | 3 |
| |||
Europe [b] |
|
|
|
|
|
|
| |||
Restructuring charges |
| 89 |
| 55 |
| — |
| |||
Impairment of long-lived assets |
| — |
| 23 |
| 14 |
| |||
Loss on disposal of facility |
| — |
| — |
| 129 |
| |||
Customer bankruptcy |
| — |
| — |
| 11 |
| |||
|
| 89 |
| 78 |
| 154 |
| |||
Rest of World [c] |
|
|
|
|
|
|
| |||
Impairment of long-lived assets |
| 10 |
| — |
| — |
| |||
Impairment of goodwill |
| 22 |
| — |
| — |
| |||
|
| 32 |
| — |
| — |
| |||
Corporate [d] |
|
|
|
|
|
|
| |||
Re-measurement gain of E-Car |
| — |
| (153 | ) | — |
| |||
Write down of real estate |
| — |
| — |
| 9 |
| |||
Gain on sale of investment |
| — |
| — |
| (10 | ) | |||
|
| — |
| (153 | ) | (1 | ) | |||
|
| $ | 144 |
| $ | (108 | ) | $ | 156 |
|
[a] North America
For the year ended December 31, 2013
In conjunction with its annual business planning cycle, during the fourth quarter of 2013 the Company recorded long-lived asset impairment charges of $23 million [$11 million after tax and non-controlling interests] in North America related to battery research equipment in Canada.
For the year ended December 31, 2012
During 2012, the Company recorded long-lived asset impairment charges of $2 million [$1 million after tax] in North America related to specific fixed assets at a metal fabricating facility in the United States.
On October 26, 2012, the Company acquired the remaining 50% interest in STT Technologies Inc. [“STT”] for cash consideration of $55 million. STT is a manufacturer of automotive pumps with operations in Canada and Mexico. Prior to the acquisition, the Company accounted for this investment using the equity method of accounting.
The incremental investment in STT was accounted for under the business acquisition method of accounting as a step acquisition which requires that Magna re-measures its pre-existing investment in STT at fair value and recognize any gains or losses in income. The estimated fair value of Magna’s investment immediately before the closing date was $55 million, which resulted in the recognition of a non-cash gain of $35 million [$35 million after tax].
For the year ended December 31, 2011
During 2011, a settlement agreement was finalized in connection with the settlement of certain patent infringement and other claims. The Company recorded an $11 million expense in the third quarter of 2011 in relation to these arrangements.
During 2011, the Company recorded long-lived asset impairment charges of $7 million [$7 million after tax] related to a roof systems facility in the United States.
During 2011, the Company received proceeds pursuant to an insurance claim for fire damages related to an interior systems facility in the United States. The proceeds received were $15 million in excess of the damaged assets’ net book value and the losses previously recognized, and was recorded in income.
[b] Europe
For the year ended December 31, 2013
As a result of recent customer announcements related to plant closures, the profitability of certain facilities and the level of future booked business, management determined that restructuring would have to be completed in its traditional European markets in order to remain cost competitive over the long-term. As a result, during 2013, the Company recorded net restructuring charges of $89 million [$64 million after tax] in Europe at its exterior and interior systems operations related primarily to the closure of a facility in Belgium.
Substantially all of these restructuring costs will be paid subsequent to 2013.
For the year ended December 31, 2012
During the fourth quarter of 2012, the Company recorded restructuring charges of $55 million [$53 million after tax] in Europe primarily at its exterior and interior systems and complete vehicle and engineering services operations.
During the fourth quarter of 2012, the Company recorded long-lived asset impairment charges of $23 million [$22 million after tax] primarily related to exterior and interior systems facilities.
For the year ended December 31, 2011
During the third quarter of 2011, the Company sold an interior systems operation located in Germany and recorded a loss on disposal of $113 million. This operation, whose long-lived assets were substantially impaired in 2010, had a history of losses which were projected to continue throughout the business planning period. Under the terms of the 2011 sale arrangements [the “SPA”], the Company agreed to fund the buyer $67 million, to be satisfied with certain working capital items, cash and the assumption of certain liabilities. Final settlement of the SPA did not occur during 2011 and in the fourth quarter of 2011 an additional $16 million was accrued in relation to the ongoing disputes with the purchaser bringing the total loss on disposal to $129 million. As more fully described in note 6, on June 4, 2012, the Company re-acquired the above operation.
During 2011, the Company recorded long-lived asset impairment charges of $14 million [$13 million after tax] related to various facilities in Europe.
During 2011, the Company recorded an $11 million charge related to the insolvency of Saab.
[c] Rest of World
For the year ended December 31, 2013
In conjunction with its annual business planning cycle, during 2013 the Company recorded long-lived asset impairment charges of $10 million [$10 million after tax], related primarily to fixed assets at the Company’s Seating operations in South America.
In addition, during 2013 the Company recorded goodwill impairment charges of $22 million [$22 million after tax] related to the Company’s metal stamping operations.
[d] Corporate
For the year ended December 31, 2012
On August 31, 2012, the Company acquired the controlling 27% interest in the Magna E-Car Systems L.P. [“E-Car”] partnership from a company affiliated with the Stronach Group for cash consideration of $75 million.
Prior to the acquisition, the Company held the remaining 73% non-controlling interest in E-Car and accounted for this investment using the equity method of accounting. The incremental investment in E-Car was accounted for under the business acquisition method of accounting as a step acquisition which requires that Magna re-measure its pre-existing investment in E-Car at fair value and recognize any gains or losses in income. The estimated fair value of Magna’s partnership interest immediately before the closing date was $205 million, which resulted in the recognition of a non-cash gain of $153 million [$125 million after tax].
For the year ended December 31, 2011
During 2011, five excess corporate real estate assets were sold to entities associated with the Company’s Founder and Chairman, Mr. Stronach and/or the Company’s former Co-Chief Executive Officer, Siegfried Wolf. The sales were approved by the independent members of Magna’s Board of Directors based on independent fair market appraisals. The appraised fair value range for the properties was less than their carrying value and, accordingly, the Company recorded a $9 million impairment charge in 2011.
During 2011, the Company sold its 40% non-controlling interest in an equity accounted investment for proceeds of $151 million [Cdn$147 million] and recognized a $10 million gain on disposal.
4. EARNINGS PER SHARE
Earnings per share are computed as follows:
|
| 2013 |
| 2012 |
| 2011 |
| |||
Basic earnings per Common Share: |
|
|
|
|
|
|
| |||
Net income attributable to Magna International Inc. |
| $ | 1,561 |
| $ | 1,433 |
| $ | 1,018 |
|
Average number of Common Shares outstanding during the year |
| 227.9 |
| 232.4 |
| 239.3 |
| |||
Basic earnings per Common Share |
| $ | 6.85 |
| $ | 6.17 |
| $ | 4.26 |
|
Diluted earnings per Common Share: |
|
|
|
|
|
|
| |||
Net income attributable to Magna International Inc. |
| $ | 1,561 |
| $ | 1,433 |
| $ | 1,018 |
|
Average number of Common Shares outstanding during the year |
| 227.9 |
| 232.4 |
| 239.3 |
| |||
Adjustments |
|
|
|
|
|
|
| |||
Stock options and restricted stock [a] |
| 2.9 |
| 2.8 |
| 3.5 |
| |||
|
| 230.8 |
| 235.2 |
| 242.8 |
| |||
Diluted earnings per Common Share |
| $ | 6.76 |
| $ | 6.09 |
| $ | 4.20 |
|
[a] Diluted earnings per Common Share exclude 0.1 million [2012 — 2.3 million; 2011 — 2.1 million] Common Shares issuable under the Company’s Incentive Stock Option Plan because these options were not “in-the-money”.
5. DETAILS OF CONSOLIDATED STATEMENTS OF CASH FLOWS
[a] Cash and cash equivalents consist of:
|
| 2013 |
| 2012 |
| ||
Bank term deposits, bankers’ acceptances and government paper |
| $ | 1,331 |
| $ | 1,220 |
|
Cash |
| 223 |
| 302 |
| ||
|
| $ | 1,554 |
| $ | 1,522 |
|
[b] Items not involving current cash flows:
|
| 2013 |
| 2012 |
| 2011 |
| |||
Depreciation and amortization |
| $ | 1,063 |
| $ | 801 |
| $ | 686 |
|
Other non-cash charges |
| 189 |
| 154 |
| 110 |
| |||
Amortization of other assets included in cost of goods sold |
| 138 |
| 113 |
| 80 |
| |||
Non-cash portion of Other expense (income), net [note 3] |
| — |
| (188 | ) | 147 |
| |||
Impairment charges [note 3] |
| 55 |
| 25 |
| — |
| |||
Deferred income taxes [note 11] |
| (100 | ) | (46 | ) | (76 | ) | |||
Equity income |
| (196 | ) | (151 | ) | (121 | ) | |||
|
| $ | 1,149 |
| $ | 708 |
| $ | 826 |
|
[c] Changes in non-cash operating assets and liabilities:
|
| 2013 |
| 2012 |
| 2011 |
| |||
Accounts receivable |
| $ | (584 | ) | $ | (46 | ) | $ | (909 | ) |
Inventories |
| (141 | ) | (315 | ) | (282 | ) | |||
Prepaid expenses and other |
| (56 | ) | 36 |
| (49 | ) | |||
Accounts payable |
| 329 |
| 249 |
| 475 |
| |||
Accrued salaries and wages |
| 87 |
| 37 |
| 80 |
| |||
Other accrued liabilities |
| 298 |
| 97 |
| 87 |
| |||
Income taxes payable |
| (56 | ) | 16 |
| (29 | ) | |||
Deferred revenue |
| (4 | ) | (2 | ) | (4 | ) | |||
|
| $ | (127 | ) | $ | 72 |
| $ | (631 | ) |
6. BUSINESS ACQUISITIONS
Acquisitions in the year ended December 31, 2013
In November 2013, the Company acquired the remaining 49% interest of Textile Competence Centre Kft, a textile plant in Germany; along with certain fixed assets and licenses employed in the business that were owned by the non-controlling shareholder, for cash consideration of $9 million. Prior to the acquisition, the Company was fully consolidating this entity and recording a non-controlling interest equal to the 49% interest not owned by the Company.
The net effect of this and other small acquisitions on the Company’s 2013 consolidated balance sheet were increases in fixed assets of $5 million, goodwill of $3 million, other assets of $2 million, and other long-term liabilities of $2 million and a reduction of non-controlling interest of $1 million.
Acquisitions in the year ended December 31, 2012
In January 2012, the Company acquired BDW technologies group, a structural casting supplier of aluminium components, which has operations in Germany, Poland and Hungary. The acquired business has sales primarily to Volkswagen, Audi, Porsche, Mercedes-Benz, Ferrari and ZF.
As described in note 3, during the third quarter of 2011 the Company sold an interior systems operation [the “Business”] located in Germany. Subsequent to disposal, the Business continued to incur significant financial losses. By the end of the first quarter of 2012, the Business was experiencing severe liquidity issues. Although the Company had no legal obligation to do so, in light of customer relationship issues and other relevant considerations, on June 4, 2012, the Company re-acquired the Business.
As more fully described in note 3, on August 31, 2012 the Company acquired the controlling 27% interest in the E-Car partnership for cash consideration of $56 million [net of $19 million cash acquired]. The incremental investment in E-Car was accounted for under the business acquisition method of accounting as a step acquisition which requires that all assets acquired and liabilities of E-Car be measured at fair value. The purchase equation allocated $210 million to intangible assets which are primarily technology based intangibles. Given the continuing uncertainties regarding the timing and magnitude of a viable electric vehicle industry, competing electric vehicle technologies, significantly larger competitors, and other factors, the Company determined that the intangible assets would be amortized on a straight-line basis over the period ended December 31, 2013. At December 31, 2013, these intangible assets have been fully amortized [note 12].
As more fully described in note 3, on October 26, 2012 the Company acquired the remaining 50% interest in STT. The incremental investment in STT required that all assets acquired and liabilities of STT be measured at fair value.
In December 2012, the Company acquired ixetic Verwaltungs GmbH [“ixetic”], a manufacturer of automotive vacuum, engine and transmission pumps, which has operations in Germany, Bulgaria and China as well as representation in Brazil, India, Japan and the United States. The acquired business has sales primarily to BMW, Daimler, Volkswagen, Schaeffler, ZF, Ford, Chrysler, Renault-Nissan and Toyota.
The total consideration for these acquisitions was $525 million paid in cash [net of cash acquired].
The net effect of the acquisitions on the Company’s 2012 consolidated balance sheet and as well as certain adjustments recorded during 2013 to the preliminary purchase price allocations are as follows:
|
| 2012 |
|
|
|
|
| |||
|
| Preliminary |
| 2013 |
| Final |
| |||
|
| Allocation |
| Adjustments |
| Allocation |
| |||
Non-cash working capital |
| $ | (129 | ) | $ | (47 | ) | $ | (176 | ) |
Investments |
| 3 |
| (3 | ) | — |
| |||
Fixed assets |
| 501 |
| (36 | ) | 465 |
| |||
Goodwill |
| 289 |
| (2 | ) | 287 |
| |||
Other assets |
| 94 |
| 99 |
| 193 |
| |||
Deferred tax assets |
| — |
| 5 |
| 5 |
| |||
Purchase intangibles |
| 215 |
| — |
| 215 |
| |||
Long-term employee benefit liabilities |
| (49 | ) | 1 |
| (48 | ) | |||
Long-term debt |
| (25 | ) | (2 | ) | (27 | ) | |||
Other long-term liabilities |
| (35 | ) | — |
| (35 | ) | |||
Deferred tax liabilities |
| (68 | ) | (15 | ) | (83 | ) | |||
Non-controlling interests |
| (11 | ) | — |
| (11 | ) | |||
Fair value of net assets (excluding cash) |
| $ | 785 |
| $ | — |
| $ | 785 |
|
The above adjustments had an insignificant impact on the 2013 consolidated statement of income since the adjustments related primarily to the acquisitions that were completed in the fourth quarter of 2012.
Acquisitions in the year ended December 31, 2011
In December 2011, the Company acquired ThyssenKrupp Automotive Systems Industrial do Brasil Ltda, which consists of four manufacturing facilities in Brazil that assemble chassis structural components and modules. The acquired business has sales to Ford, Fiat, Renault-Nissan, Honda and PSA.
In August 2011, the Company acquired Grenville Castings Ltd., a structural casting supplier of aluminum components located in Canada. The acquired business has sales primarily to Ford and General Motors.
In June 2011, the Company acquired Continental Plastics Co., a supplier of interior products, mainly door panel and seat back assemblies. The acquired business is located in the United States with sales primarily to General Motors.
In May 2011, the Company acquired a 51% interest in Wuhu Youth Tongyang Auto Plastic Parts Co., Ltd., a supplier of exterior products, mainly front and rear bumpers. The acquired business is located in China with sales primarily to Chery Automobile Co. Ltd.
In January 2011, the Company acquired Automobiltechnik Dürbheim, a manufacturer of tapping plates which assist in the fastening of bolts. The acquired business is located in Germany and has sales to various OEMs.
The total consideration for these acquisitions was $157 million, consisting of $120 million paid in cash [net of cash acquired] and $37 million of assumed debt.
The net effect of the acquisitions on the Company’s 2011 consolidated balance sheet were increases in non-cash working capital of $35 million, fixed assets of $95 million, goodwill of $29 million, deferred tax assets of $6 million, other long-term liabilities of $28 million, and non-controlling interest of $7 million.
Pro forma impact [unaudited]
If the acquisitions completed during 2013 and 2012 occurred on January 1, 2012, the Company’s unaudited pro forma consolidated sales and net income for the year ended December 31, 2013 would have been unchanged [2012 - $31.5 billion and $1.4 billion, respectively].
7. INVENTORIES
Inventories consist of:
|
| 2013 |
| 2012 |
| ||
Raw materials and supplies |
| $ | 947 |
| $ | 911 |
|
Work-in-process |
| 273 |
| 260 |
| ||
Finished goods |
| 339 |
| 283 |
| ||
Tooling and engineering |
| 1,078 |
| 1,058 |
| ||
|
| $ | 2,637 |
| $ | 2,512 |
|
Tooling and engineering inventory represents costs incurred on tooling and engineering services contracts in excess of billed and unbilled amounts included in accounts receivable.
8. INVESTMENTS
[a] At December 31, 2013, the Company held Canadian third party ABCP with a face value of Cdn$107 million [2012 -Cdn$107 million]. These investments did not settle at the scheduled maturity during the third quarter of 2007 due to ABCP market liquidity issues, and as a result the Company reclassified its ABCP to long-term investments from cash and cash equivalents.
On January 16, 2009, a restructuring plan was finalized and restructuring Notes [the “Notes”] were issued in exchange for existing investments. The Notes issued included: [i] notes in a Master Trust (MAV2 - A Notes), which were rated A by DBRS with a face amount value of Cdn$102 million; [ii] subordinate notes (MAV2 - B and C Notes) which were unrated with a face amount value of Cdn$9 million; and [iii] various tracking notes which were issued in exchange for assets deemed ineligible for inclusion in the Master Trust with a face amount value of Cdn$23 million. The criteria for eligibility into the Master Trust included credit quality, an expected return of the assets and arrangements with individual asset providers. The performance of the tracking notes is tied directly to actual performance of the specific assets.
The following is a continuity of the Company’s investment in ABCP:
|
| 2013 |
| 2012 |
| 2011 |
| |||
|
|
|
|
|
|
|
|
|
|
|
Balance, beginning of year |
| $ | 90 |
| $ | 82 |
| $ | 84 |
|
Valuation adjustment [i] |
| 8 |
| 15 |
| — |
| |||
Cash receipts |
| — |
| (9 | ) | — |
| |||
Foreign exchange and other |
| (6 | ) | 2 |
| (2 | ) | |||
|
| $ | 92 |
| $ | 90 |
| $ | 82 |
|
[i] The carrying value of this investment was based on a valuation technique estimating the fair value from the perspective of a market participant. During the year ended December 31, 2013, the Company recorded an $8 million [2012 - $15 million] increase in the carrying value of its investment in ABCP in selling, general and administrative expense, due to a reduction of the spread between the anticipated return on the restructured notes and current market indices.
[b] The Company’s net income includes the proportionate share of net income or loss of its equity method investees. When a proportionate share of net income is recorded, it increases equity income in the consolidated statements of income and the carrying value of those investments. Conversely, when a proportionate share of a net loss is recorded, it decreases equity income in the consolidated statements of income and the carrying value of those investments. The following is the Company’s combined proportionate share of the major components of the financial statements of the entities in which the Company accounts for using the equity method:
Balance Sheets
|
| 2013 |
| 2012 |
| ||
|
|
|
|
|
|
|
|
Current assets |
| $ | 373 |
| $ | 344 |
|
Long-term assets |
| $ | 82 |
| $ | 74 | �� |
Current liabilities |
| $ | 167 |
| $ | 150 |
|
Long-term liabilities |
| $ | 76 |
| $ | 60 |
|
Statements of Income
|
| 2013 |
| 2012 |
| 2011 |
| |||
|
|
|
|
|
|
|
|
|
|
|
Sales |
| $ | 1,013 |
| $ | 967 |
| $ | 881 |
|
Cost of goods sold, expenses and income taxes |
| 839 |
| 814 |
| 805 |
| |||
Net income |
| $ | 174 |
| $ | 153 |
| $ | 76 |
|
Sales to equity method investees were approximately $144 million, $171 million and $76 million in 2013, 2012 and 2011, respectively.
9. FIXED ASSETS
Fixed assets consist of:
|
| 2013 |
| 2012 |
| ||
|
|
|
|
|
| ||
Cost |
|
|
|
|
| ||
Land |
| $ | 236 |
| $ | 238 |
|
Buildings |
| 1,592 |
| 1,513 |
| ||
Machinery and equipment |
| 11,510 |
| 11,047 |
| ||
|
| 13,338 |
| 12,798 |
| ||
Accumulated depreciation |
|
|
|
|
| ||
Buildings |
| (579 | ) | (541 | ) | ||
Machinery and equipment |
| (7,318 | ) | (6,984 | ) | ||
|
| $ | 5,441 |
| $ | 5,273 |
|
Included in the cost of fixed assets are construction in progress expenditures of $762 million [2012 - $939 million] that have not been depreciated.
10. GOODWILL
The following is a continuity of the Company’s goodwill by segment:
|
| North |
|
|
|
|
| Rest of |
|
|
| |||||
|
| America |
| Europe |
| Asia |
| World |
| Total |
| |||||
|
|
|
|
|
|
|
|
|
|
|
|
|
|
|
|
|
Balance, December 31, 2011 |
| $ | 644 |
| $ | 392 |
| $ | 74 |
| $ | 86 |
| $ | 1,196 |
|
Acquisitions [note 6] |
| 75 |
| 206 |
| — |
| 8 |
| 289 |
| |||||
Foreign exchange and other |
| (18 | ) | 13 |
| — |
| (7 | ) | (12 | ) | |||||
Balance, December 31, 2012 |
| 701 |
| 611 |
| 74 |
| 87 |
| 1,473 |
| |||||
Acquisitions [note 6] |
| (24 | ) | 22 |
| 3 |
| — |
| 1 |
| |||||
Impairments [note 3] |
| — |
| — |
| — |
| (22 | ) | (22 | ) | |||||
Reallocation between reporting segments [i] |
| — |
| — |
| 51 |
| (51 | ) | — |
| |||||
Foreign exchange and other |
| (21 | ) | 22 |
| 1 |
| (14 | ) | (12 | ) | |||||
Balance, December 31, 2013 |
| $ | 656 |
| $ | 655 |
| $ | 129 |
| $ | — |
| $ | 1,440 |
|
[i] During the fourth quarter of 2013, the Company began reporting Asia and Rest of World as separate reporting segments [note 23]. As a result, goodwill was assigned to the reporting segments using a relative fair value allocation.
11. INCOME TAXES
[a] The provision for income taxes differs from the expense that would be obtained by applying the Canadian statutory income tax rate as a result of the following:
|
| 2013 |
| 2012 |
| 2011 |
|
|
|
|
|
|
|
|
|
Canadian statutory income tax rate |
| 26.5 | % | 26.5 | % | 28.3 | % |
Manufacturing and processing profits deduction |
| (0.4 | ) | (0.7 | ) | (0.8 | ) |
Foreign rate differentials |
| (1.5 | ) | (1.5 | ) | (2.0 | ) |
Losses not benefited |
| 5.3 |
| 5.8 |
| 11.4 |
|
Utilization of losses previously not benefited |
| (1.0 | ) | (0.3 | ) | (10.2 | ) |
Earnings of equity accounted investees |
| (1.1 | ) | (1.2 | ) | (1.6 | ) |
Withholding tax |
| 1.4 |
| — |
| — |
|
Valuation allowance on deferred tax assets [i] |
| (1.1 | ) | (5.0 | ) | (6.5 | ) |
Mexican flat tax [ii] |
| (1.9 | ) | — |
| — |
|
Research and development tax credits [iii] |
| (4.3 | ) | (2.3 | ) | (1.6 | ) |
Reserve for uncertain tax positions |
| (2.3 | ) | (1.0 | ) | (0.4 | ) |
Re-measurement gains |
| — |
| (1.1 | ) | — |
|
Other |
| (0.7 | ) | (0.7 | ) | — |
|
Effective income tax rate |
| 18.9 | % | 18.5 | % | 16.6 | % |
[i] GAAP requires that the Company assess whether valuation allowances should be established or maintained against its deferred tax assets, based on consideration of all available evidence, using a “more-likely-than-not” standard. The factors the Company uses to assess the likelihood of realization are its history of losses, forecasts of future pre-tax income and tax planning strategies that could be implemented to realize the deferred tax assets.
For the year ended December 31, 2013
The Company had valuation allowances against its deferred tax assets in certain European countries. These valuation allowances were required because of historical losses and uncertainty as to the timing of when the Company would be able to generate the necessary level of earnings to recover these deferred tax assets. Over the past few years some of the Company’s European operations have delivered sustained profits which together with forecasted profits have allowed the Company to release a portion of the valuation allowances set up against its European deferred tax assets. Additionally, during 2013, the Company released a portion of its valuation allowance in China. The effect of these valuation allowance releases in 2013 is $21 million.
For the year ended December 31, 2012
The Company had valuation allowances against its deferred tax assets in the United Kingdom and Germany. Based on financial forecasts and continued anticipated growth, the Company released a portion of the valuation allowance set up against its deferred tax assets in the United Kingdom; and in Germany, the BDW and ixetic acquisitions allowed the Company to release a portion of the valuation allowance set up against its German deferred tax assets. Additionally, during 2012 the Company released a portion of its valuation allowances in Mexico and China, which were partially offset by a new valuation allowance against all of its deferred tax assets in Brazil. The net effect of all these valuation allowance releases in 2012 was $89 million.
For the year ended December 31, 2011
The Company had valuation allowances against all of its deferred tax assets in the United States. During 2010 and 2011, the Company’s United States operations delivered sustained profits. Based on financial forecasts and the continued anticipated growth for the U.S. market, the Company released $78 million of the U.S. valuation allowance in the fourth quarter of 2011.
[ii] During the fourth quarter of 2013, the Company recorded a tax benefit of $36 million as a result of the elimination of the Mexican flat tax, which became effective on January 1, 2014. Previously, there were two taxes in Mexico; a flat tax and an income tax and taxpayers were required to pay tax based on the greater of the two. Deferred taxes were also maintained by the Company based on calculations under one or the other of these taxes. The elimination of the flat tax allowed the Company to reverse its net deferred tax liabilities for its entities under that tax and establish a deferred tax asset under the income tax.
[iii] For the year ended December 31, 2013, the amount includes a tax benefit of $36 million in connection with a settlement with the United States Internal Revenue Service, of claims for research and development tax credits covering years 2008 and 2009 and a resulting change in the Company’s estimate of the amount of similar claims for subsequent periods.
[b] The details of income before income taxes by jurisdiction are as follows:
|
| 2013 |
| 2012 |
| 2011 |
| |||
|
|
|
|
|
|
|
| |||
Canadian |
| $ | 653 |
| $ | 944 |
| $ | 710 |
|
Foreign |
| 1,252 |
| 806 |
| 507 |
| |||
|
| $ | 1,905 |
| $ | 1,750 |
| $ | 1,217 |
|
[c] The details of the income tax provision (recovery) are as follows:
|
| 2013 |
| 2012 |
| 2011 |
| |||
|
|
|
|
|
|
|
| |||
Current |
|
|
|
|
|
|
| |||
Canadian |
| $ | 159 |
| $ | 170 |
| $ | 115 |
|
Foreign |
| 301 |
| 200 |
| 163 |
| |||
|
| 460 |
| 370 |
| 278 |
| |||
|
|
|
|
|
|
|
| |||
Deferred |
|
|
|
|
|
|
| |||
Canadian |
| (29 | ) | (6 | ) | 7 |
| |||
Foreign |
| (71 | ) | (40 | ) | (83 | ) | |||
|
| (100 | ) | (46 | ) | (76 | ) | |||
|
| $ | 360 |
| $ | 324 |
| $ | 202 |
|
[d] Deferred income taxes have been provided on temporary differences, which consist of the following:
|
| 2013 |
| 2012 |
| 2011 |
| |||
|
|
|
|
|
|
|
|
|
|
|
Tax depreciation greater (less) than book depreciation |
| $ | (23 | ) | $ | 13 |
| $ | 51 |
|
Book amortization less than (in excess of) tax amortization |
| (57 | ) | 16 |
| — |
| |||
Liabilities currently not deductible for tax |
| (48 | ) | (29 | ) | (28 | ) | |||
Net tax losses (benefited) utilized |
| 50 |
| (11 | ) | (37 | ) | |||
Change in valuation allowance on deferred tax assets |
| (21 | ) | (89 | ) | (78 | ) | |||
Net tax credits utilized |
| 2 |
| 53 |
| 24 |
| |||
Other |
| (3 | ) | 1 |
| (8 | ) | |||
|
| $ | (100 | ) | $ | (46 | ) | $ | (76 | ) |
[e] Deferred tax assets and liabilities consist of the following temporary differences:
|
| 2013 |
| 2012 |
| ||
|
|
|
|
|
| ||
Assets |
|
|
|
|
| ||
Tax benefit of loss carryforwards |
| $ | 610 |
| $ | 628 |
|
Liabilities currently not deductible for tax |
| 337 |
| 263 |
| ||
Tax credit carryforwards |
| 34 |
| 35 |
| ||
Unrealized loss on cash flow hedges and retirement liabilities |
| 39 |
| 48 |
| ||
Other |
| 11 |
| — |
| ||
|
| 1,031 |
| 974 |
| ||
Valuation allowance against tax benefit of loss carryforwards |
| (528 | ) | (504 | ) | ||
Other valuation allowance |
| (111 | ) | (45 | ) | ||
|
| 392 |
| 425 |
| ||
|
|
|
|
|
| ||
Liabilities |
|
|
|
|
| ||
Tax depreciation in excess of book depreciation |
| 170 |
| 199 |
| ||
Other assets book value in excess of tax value |
| 15 |
| 77 |
| ||
Unrealized gain on cash flow hedges and retirement liabilities |
| 21 |
| 19 |
| ||
Other |
| — |
| 30 |
| ||
|
| 206 |
| 325 |
| ||
|
|
|
|
|
| ||
Net deferred tax assets |
| $ | 186 |
| $ | 100 |
|
The net deferred tax assets are presented on the consolidated balance sheet in the following categories:
|
| 2013 |
| 2012 |
| ||
|
|
|
|
|
|
|
|
Current deferred tax assets |
| $ | 275 |
| $ | 170 |
|
Current deferred tax liabilities |
| (9 | ) | (19 | ) | ||
Long-term deferred tax assets |
| 120 |
| 90 |
| ||
Long-term deferred tax liabilities |
| (200 | ) | (141 | ) | ||
|
| $ | 186 |
| $ | 100 |
|
[f] Income taxes paid in cash [net of refunds] were $507 million for the year ended December 31, 2013 [2012 - $347 million; 2011 - $304 million].
[g] As of December 31, 2013, the Company had domestic and foreign operating loss carryforwards of $2.00 billion and tax credit carryforwards of $34 million. Approximately $1.07 billion of the operating losses can be carried forward indefinitely. The remaining operating losses and tax credit carryforwards expire between 2014 and 2033.
[h] As at December 31, 2013, 2012 and 2011, the Company’s gross unrecognized tax benefits were $238 million, $279 million and $252 million, respectively [excluding interest and penalties], of which $219 million, $240 million and $222 million, respectively, if recognized, would affect the Company’s effective tax rate. The gross unrecognized tax benefits differ from the amount that would affect the Company’s effective tax rate due primarily to the impact of the valuation allowance on deferred tax assets. A summary of the changes in gross unrecognized tax benefits is as follows:
|
| 2013 |
| 2012 |
| 2011 |
| |||
|
|
|
|
|
|
|
|
|
|
|
Balance, beginning of year |
| $ | 279 |
| $ | 252 |
| $ | 257 |
|
Additions based on tax positions related to current year |
| 35 |
| 68 |
| 14 |
| |||
(Reductions)/additions based on tax positions of prior years |
| (44 | ) | (31 | ) | 13 |
| |||
Settlements |
| (24 | ) | (10 | ) | (12 | ) | |||
Statute expirations |
| (7 | ) | (5 | ) | (16 | ) | |||
Foreign currency translation |
| (1 | ) | 5 |
| (4 | ) | |||
|
| $ | 238 |
| $ | 279 |
| $ | 252 |
|
The Company recognizes interest and penalties with respect to unrecognized tax benefits as income tax expense. As at December 31, 2013, 2012 and 2011 the Company had recorded interest and penalties on the unrecognized tax benefits of $42 million, $49 million and $42 million, respectively, which reflects recoveries/(expenses) related to changes in its reserves for interest and penalties of $7 million, ($7 million) and $3 million, respectively.
The Company operates in multiple jurisdictions throughout the world, and its tax returns are periodically audited or subject to review by both domestic and foreign tax authorities. During the next twelve months, it is reasonably possible that, as a result of audit settlements, the conclusion of current examinations and the expiration of the statute of limitations in several jurisdictions, the Company may decrease the amount of its gross unrecognized tax benefits [including interest and penalties] by approximately $66 million, of which $62 million, if recognized, would affect its effective tax rate.
The Company considers its significant tax jurisdictions to include Canada, the United States, Austria, Germany and Mexico. The Company remains subject to income tax examination in Austria for years after 2005, Germany for years after 2007, Mexico for years after 2007, U.S. federal jurisdiction for years after 2007, and in Canada for years after 2008.
12. OTHER ASSETS
Other assets consist of:
|
| 2013 |
| 2012 |
| ||
|
|
|
|
|
| ||
Preproduction costs related to long-term supply agreements with contractual guarantee for reimbursement |
| $ | 291 |
| $ | 297 |
|
Long-term receivables [note 21[c]] |
| 111 |
| 95 |
| ||
Patents and licenses, net |
| 44 |
| 40 |
| ||
Unrealized gain on cash flow hedges [note 21] |
| 20 |
| 32 |
| ||
E-Car intangible [note 6] |
| — |
| 158 |
| ||
Customer relationship intangibles [note 6] |
| 143 |
| 93 |
| ||
Pension overfunded status [note 16[a]] |
| 26 |
| — |
| ||
Other, net |
| 40 |
| 38 |
| ||
|
| $ | 675 |
| $ | 753 |
|
13. EMPLOYEE EQUITY AND PROFIT PARTICIPATION PROGRAM
During the year ended December 31, 2013, a trust, which exists to make orderly purchases of the Company’s shares for employees for transfer to the Employee Equity and Profit Participation Program [“EEPPP”], borrowed up to $39 million [2012 - $18 million; 2011 - $35 million] from the Company to facilitate the purchase of Common Shares. At December 31, 2013, the trust’s indebtedness to Magna was $39 million [2012 - $17 million]. The Company nets the receivable from the trust with the Company’s accrued EEPPP payable in accrued wages and salaries.
14. WARRANTY
The following is a continuity of the Company’s warranty accruals:
|
| 2013 |
| 2012 |
| 2011 |
| |||
|
|
|
|
|
|
|
| |||
Balance, beginning of year |
| $ | 94 |
| $ | 76 |
| $ | 68 |
|
Expense, net |
| 40 |
| 43 |
| 46 |
| |||
Settlements |
| (46 | ) | (46 | ) | (38 | ) | |||
Acquisitions [note 6] |
| 1 |
| 17 |
| — |
| |||
Foreign exchange and other |
| 2 |
| 4 |
| — |
| |||
|
| $ | 91 |
| $ | 94 |
| $ | 76 |
|
15. DEBT AND COMMITMENTS
[a] The Company’s long-term debt, which is substantially uncollateralized, consists of the following:
|
| 2013 |
| 2012 |
| ||
|
|
|
|
|
|
|
|
Bank term debt at a weighted average interest rate of approximately 6.3% [2012 — 8.0%], denominated primarily in Chinese renminbi and Brazilian real |
| $ | 239 |
| $ | 268 |
|
Government loans at a weighted average interest rate of approximately 5.9% [2012 — 5.4%], denominated primarily in Brazilian real and euros |
| 26 |
| 15 |
| ||
Other |
| 67 |
| 78 |
| ||
|
| 332 |
| 361 |
| ||
Less due within one year |
| 230 |
| 249 |
| ||
|
| $ | 102 |
| $ | 112 |
|
[b] Future principal repayments on long-term debt are estimated to be as follows:
2014 |
| $ | 230 |
|
2015 |
| 39 |
| |
2016 |
| 22 |
| |
2017 |
| 15 |
| |
2018 |
| 18 |
| |
Thereafter |
| 8 |
| |
|
| $ | 332 |
|
[c] On June 20, 2013, the Company amended its previous $2.25 billion revolving credit facility to become a five year facility with a maturity of June 20, 2018. The facility now includes a $200 million Asian tranche, a $50 million Mexican tranche and a tranche for Canada, U.S. and Europe, which is fully transferable between jurisdictions and can be drawn in U.S. dollars, Canadian dollars or euros.
[d] Interest expense (income), net includes:
|
| 2013 |
| 2012 |
| 2011 |
| |||
|
|
|
|
|
|
|
| |||
Interest expense |
|
|
|
|
|
|
| |||
Current |
| $ | 26 |
| $ | 27 |
| $ | 16 |
|
Long-term |
| 8 |
| 7 |
| 3 |
| |||
|
| 34 |
| 34 |
| 19 |
| |||
Interest income |
| (18 | ) | (18 | ) | (25 | ) | |||
Interest expense (income), net |
| $ | 16 |
| $ | 16 |
| $ | (6 | ) |
[e] Interest paid in cash was $32 million for the year ended December 31, 2013 [2012 - $32 million; 2011 - $19 million].
[f] At December 31, 2013, the Company had commitments under operating leases requiring annual rental payments as follows:
|
| Total |
| |
|
|
|
| |
2014 |
| $ | 343 |
|
2015 |
| 303 |
| |
2016 |
| 273 |
| |
2017 |
| 240 |
| |
2018 |
| 157 |
| |
Thereafter |
| 402 |
| |
|
| $ | 1,718 |
|
Prior to June 30, 2011, MI Developments Inc. [“MID”] was considered a related party. In the normal course of business, Magna leases various land and buildings from MID under operating lease agreements, which were effected on normal commercial terms. The leases were measured at the exchange amount, which is the amount of consideration established and agreed to by the related parties. Lease expense related to MID for 2011 was $166 million.
[g] The Company has agreements with Mr. Stronach and certain affiliated entities for the provision of business development, consulting and other business services. The cost of these agreements is measured at the exchange amount. The court-approved plan of arrangement in which the Company’s dual-class share structure was collapsed, set a termination date of December 31, 2014 with a declining fee schedule for the consulting, business development and business services agreements. The aggregate amount expensed under these agreements with respect to the year ended December 31, 2013 was $52 million [2012 - $47 million; 2011 - $38 million].
16. LONG-TERM EMPLOYEE BENEFIT LIABILITIES
Long-term employee benefit liabilities consist of:
|
| 2013 |
| 2012 |
| 2011 |
| |||
|
|
|
|
|
|
|
|
|
|
|
Defined benefit pension plans and other [a] |
| $ | 149 |
| $ | 212 |
| $ | 128 |
|
Termination and long service arrangements [b] |
| 343 |
| 304 |
| 244 |
| |||
Retirement medical benefits plans [c] |
| 34 |
| 39 |
| 37 |
| |||
Other long-term employee benefits |
| 6 |
| 5 |
| 10 |
| |||
Long-term employee benefit obligations |
| $ | 532 |
| $ | 560 |
| $ | 419 |
|
[a] Defined benefit pension plans
The Company sponsors a number of defined benefit pension plans and similar arrangements for its employees. All pension plans are funded to at least the minimum legal funding requirements, while European defined benefit pension plans are unfunded.
The weighted average significant actuarial assumptions adopted in measuring the Company’s obligations and costs are as follows:
|
| 2013 |
| 2012 |
| 2011 |
|
Projected benefit obligation |
|
|
|
|
|
|
|
Discount rate |
| 4.7 | % | 4.1 | % | 4.7 | % |
Rate of compensation increase |
| 2.9 | % | 2.8 | % | 2.8 | % |
|
|
|
|
|
|
|
|
Net periodic benefit cost |
|
|
|
|
|
|
|
Discount rate |
| 4.1 | % | 4.7 | % | 5.2 | % |
Rate of compensation increase |
| 2.8 | % | 2.8 | % | 2.7 | % |
Expected return on plan assets |
| 6.5 | % | 7.0 | % | 7.1 | % |
Information about the Company’s defined benefit pension plans is as follows:
|
| 2013 |
| 2012 |
| 2011 |
| |||
|
|
|
|
|
|
|
| |||
Projected benefit obligation |
|
|
|
|
|
|
| |||
Beginning of year |
| $ | 502 |
| $ | 388 |
| $ | 337 |
|
Current service cost |
| 13 |
| 11 |
| 10 |
| |||
Interest cost |
| 19 |
| 18 |
| 19 |
| |||
Actuarial (gains) losses and changes in actuarial assumptions |
| (56 | ) | 50 |
| 42 |
| |||
Benefits paid |
| (18 | ) | (18 | ) | (13 | ) | |||
Special termination benefit |
| — |
| — |
| 1 |
| |||
Acquisition |
| — |
| 47 |
| — |
| |||
Divestitures |
| — |
| — |
| (3 | ) | |||
Foreign exchange |
| (6 | ) | 6 |
| (5 | ) | |||
End of year |
| 454 |
| 502 |
| 388 |
| |||
|
|
|
|
|
|
|
| |||
Plan assets at fair value |
|
|
|
|
|
|
| |||
Beginning of year |
| 288 |
| 259 |
| 253 |
| |||
Return on plan assets |
| 38 |
| 26 |
| — |
| |||
Employer contributions |
| 30 |
| 19 |
| 24 |
| |||
Benefits paid |
| (18 | ) | (19 | ) | (14 | ) | |||
Foreign exchange |
| (10 | ) | 3 |
| (4 | ) | |||
End of year |
| 328 |
| 288 |
| 259 |
| |||
|
|
|
|
|
|
|
| |||
Ending funded status |
| $ | 126 |
| $ | 214 |
| $ | 129 |
|
|
|
|
|
|
|
|
| |||
Amounts recorded in the consolidated balance sheet |
|
|
|
|
|
|
| |||
Non-current asset [note 12] |
| $ | (26 | ) | $ | — |
| $ | (1 | ) |
Current liability |
| 3 |
| 2 |
| 2 |
| |||
Non-current liability |
| 149 |
| 212 |
| 128 |
| |||
Net amount |
| $ | 126 |
| $ | 214 |
| $ | 129 |
|
|
|
|
|
|
|
|
| |||
Amounts recorded in accumulated other comprehensive income |
|
|
|
|
|
|
|
|
|
|
Unrecognized actuarial losses |
| $ | (61 | ) | $ | (141 | ) | $ | (101 | ) |
|
|
|
|
|
|
|
| |||
Net periodic benefit cost |
|
|
|
|
|
|
| |||
Current service cost |
| $ | 13 |
| $ | 11 |
| $ | 10 |
|
Interest cost |
| 19 |
| 18 |
| 19 |
| |||
Return on plan assets |
| (19 | ) | (19 | ) | (19 | ) | |||
Actuarial losses |
| 5 |
| 3 |
| 1 |
| |||
Special termination benefit |
| — |
| — |
| 1 |
| |||
Net periodic benefit cost |
| $ | 18 |
| $ | 13 |
| $ | 12 |
|
[b] Termination and long service arrangements
Pursuant to labour laws and national labour agreements in certain European countries and Mexico, the Company is obligated to provide lump sum termination payments to employees on retirement or involuntary termination, and long service payments contingent upon persons reaching a predefined number of years of service.
The weighted average significant actuarial assumptions adopted in measuring the Company’s projected termination and long service benefit obligations and net periodic benefit cost are as follows:
|
| 2013 |
| 2012 |
| 2011 |
|
|
|
|
|
|
|
|
|
Discount rate |
| 3.9 | % | 4.2 | % | 5.4 | % |
Rate of compensation increase |
| 3.9 | % | 3.9 | % | 4.0 | % |
Information about the Company’s termination and long service arrangements is as follows:
|
| 2013 |
| 2012 |
| 2011 |
| |||
|
|
|
|
|
|
|
| |||
Projected benefit obligation |
|
|
|
|
|
|
| |||
Beginning of year |
| $ | 314 |
| $ | 252 |
| $ | 235 |
|
Current service cost |
| 24 |
| 16 |
| 15 |
| |||
Interest cost |
| 13 |
| 13 |
| 10 |
| |||
Actuarial losses and changes in actuarial assumptions |
| 12 |
| 41 |
| 14 |
| |||
Benefits paid |
| (21 | ) | (13 | ) | (12 | ) | |||
Acquisition |
| — |
| 2 |
| — |
| |||
Curtailment |
| — |
| (4 | ) | — |
| |||
Foreign exchange |
| 12 |
| 7 |
| (10 | ) | |||
Ending funded status |
| $ | 354 |
| $ | 314 |
| $ | 252 |
|
|
|
|
|
|
|
|
| |||
Amounts recorded in the consolidated balance sheet |
|
|
|
|
|
|
| |||
Current liability |
| $ | 11 |
| $ | 10 |
| $ | 8 |
|
Non-current liability |
| 343 |
| 304 |
| 244 |
| |||
Net amount |
| $ | 354 |
| $ | 314 |
| $ | 252 |
|
|
|
|
|
|
|
|
| |||
Amounts recorded in accumulated other comprehensive income |
|
|
|
|
|
|
| |||
Unrecognized actuarial losses |
| $ | (82 | ) | $ | (74 | ) | $ | (45 | ) |
|
|
|
|
|
|
|
| |||
Net periodic benefit cost |
|
|
|
|
|
|
| |||
Current service cost |
| $ | 24 |
| $ | 16 |
| $ | 15 |
|
Interest cost |
| 13 |
| 13 |
| 10 |
| |||
Actuarial losses |
| 4 |
| 12 |
| 6 |
| |||
Net periodic benefit cost |
| $ | 41 |
| $ | 41 |
| $ | 31 |
|
[c] Retirement medical benefits plans
The Company sponsors a number of retirement medical plans which were assumed on certain acquisitions in prior years. These plans are frozen to new employees and incur no current service costs.
In addition, the Company sponsors a retirement medical benefits plan that was amended during 2009 such that substantially all employees retiring on or after August 1, 2009 no longer participate in the plan.
The weighted average discount rates used in measuring the Company’s projected retirement medical benefit obligations and net periodic benefit cost are as follows:
|
| 2013 |
| 2012 |
| 2011 |
|
|
|
|
|
|
|
|
|
Retirement medical benefit obligations |
| 4.5 | % | 3.6 | % | 4.2 | % |
Net periodic benefit cost |
| 3.6 | % | 4.2 | % | 5.4 | % |
Health care cost inflation |
| 7.7 | % | 8.0 | % | 9.2 | % |
Information about the Company’s retirement medical benefits plans are as follows:
|
| 2013 |
| 2012 |
| 2011 |
| |||
|
|
|
|
|
|
|
| |||
Projected benefit obligation |
|
|
|
|
|
|
| |||
Beginning of year |
| $ | 41 |
| $ | 39 |
| $ | 36 |
|
Interest cost |
| 2 |
| 2 |
| 2 |
| |||
Actuarial (gains) losses and changes in actuarial assumptions |
| (4 | ) | 3 |
| 4 |
| |||
Benefits paid |
| (2 | ) | (3 | ) | (3 | ) | |||
Foreign exchange |
| (1 | ) | — |
| — |
| |||
Ending funded status |
| $ | 36 |
| $ | 41 |
| $ | 39 |
|
|
|
|
|
|
|
|
| |||
Amounts recorded in the consolidated balance sheet |
|
|
|
|
|
|
| |||
Current liability |
| $ | 2 |
| $ | 2 |
| $ | 2 |
|
Non-current liability |
| 34 |
| 39 |
| 37 |
| |||
Net amount |
| $ | 36 |
| $ | 41 |
| $ | 39 |
|
|
|
|
|
|
|
|
| |||
Amounts recorded in accumulated other comprehensive income |
|
|
|
|
|
|
| |||
Unrecognized past service costs |
| $ | 2 |
| $ | 3 |
| $ | 3 |
|
Unrecognized actuarial gains |
| 10 |
| 8 |
| 12 |
| |||
Total accumulated other comprehensive income |
| $ | 12 |
| $ | 11 |
| $ | 15 |
|
|
|
|
|
|
|
|
| |||
Net periodic benefit cost |
|
|
|
|
|
|
| |||
Interest cost |
| $ | 2 |
| $ | 2 |
| $ | 2 |
|
Actuarial gains |
| (2 | ) | (1 | ) | (1 | ) | |||
Past service cost amortization |
| (1 | ) | — |
| (1 | ) | |||
Net periodic benefit cost |
| $ | (1 | ) | $ | 1 |
| $ | — |
|
The effect of a one-percentage point increase or decrease in health care trend rates would not have a significant impact on the Company’s income.
[d] Future benefit payments
|
|
|
| Termination |
|
|
|
|
| ||||
|
| Defined |
| and long |
| Retirement |
|
|
| ||||
|
| benefit |
| service |
| medical |
|
|
| ||||
|
| pension plans |
| arrangements |
| benefits plans |
| Total |
| ||||
|
|
|
|
|
|
|
|
|
| ||||
Expected employer contributions - 2014 |
| $ | 33 |
| $ | 11 |
| $ | 2 |
| $ | 46 |
|
|
|
|
|
|
|
|
|
|
| ||||
Expected benefit payments: |
|
|
|
|
|
|
|
|
| ||||
2014 |
| $ | 17 |
| $ | 11 |
| $ | 2 |
| $ | 30 |
|
2015 |
| 17 |
| 10 |
| 2 |
| 29 |
| ||||
2016 |
| 17 |
| 10 |
| 2 |
| 29 |
| ||||
2017 |
| 18 |
| 11 |
| 3 |
| 32 |
| ||||
2018 |
| 18 |
| 14 |
| 2 |
| 34 |
| ||||
Thereafter |
| 104 |
| 104 |
| 12 |
| 220 |
| ||||
|
| $ | 191 |
| $ | 160 |
| $ | 23 |
| $ | 374 |
|
[e] Plan assets
The asset allocation of the Company’s defined benefit pension plans at December 31, 2013 and 2012, and the target allocation for 2014 is as follows:
|
| 2014 |
| 2013 |
| 2012 |
|
|
|
|
|
|
|
|
|
Equity securities |
| 55-75% |
| 58 | % | 57 | % |
Fixed income securities |
| 25-45% |
| 41 | % | 42 | % |
Cash and cash equivalents |
| 0-15% |
| 1 | % | 1 | % |
|
| 100% |
| 100 | % | 100 | % |
The expected rate of return on plan assets was determined by considering the Company’s current investment mix, the historic performance of these investment categories and expected future performance of these investment categories.
17. OTHER LONG-TERM LIABILITIES
Other long-term liabilities consist of:
|
| 2013 |
| 2012 |
| ||
|
|
|
|
|
| ||
Long-term portion of income taxes payable |
| $ | 133 |
| $ | 94 |
|
Asset retirement obligation |
| 40 |
| 39 |
| ||
Long-term portion of fair value of hedges [note 21] |
| 28 |
| 10 |
| ||
Deferred revenue |
| 7 |
| 11 |
| ||
|
| $ | 208 |
| $ | 154 |
|
18. STOCK-BASED COMPENSATION
[a] Incentive Stock Option Plan
The Company currently has two incentive stock option plans in effect: the 2009 Stock Option Plan, which was adopted by the Company’s shareholders on May 6, 2010; and the Amended and Restated Incentive Stock Option Plan [the “1987 Stock Option Plan”], which was adopted by shareholders on December 10, 1987, and subsequently amended on May 18, 2000 and May 10, 2007.
Upon adoption of the 2009 Plan, new grants under the 1987 Plan were frozen, but all outstanding options were permitted to continue to vest and be exercisable in accordance with their terms.
2009 Stock Option Plan
Under the 2009 Stock Option Plan, the Company may grant options to purchase Common Shares to full-time employees and consultants of the Company and its subsidiaries. The maximum number of shares that can be reserved for issuance under the option plan is 16,000,000 shares. The number of shares available to be granted at December 31, 2013 was 7,516,831 [2012 — 8,457,666]. All options granted are for terms of up to seven years from the grant date. Options issued under the 2009 Option Plan to employees and consultants generally vest as to one-third on each of the first three anniversaries of the date of grant. All options allow the holder to purchase Common Shares at a price equal to or greater than the closing market price of such shares on the date prior to the date of the grant.
1987 Stock Option Plan
The Company previously granted options to purchase Common Shares to full-time employees, outside directors or consultants of the Company under the 1987 Stock Option Plan. Upon shareholder approval of the Company’s 2009 Stock Option Plan, the 1987 Stock Option Plan was terminated such that no future grants could be made, but previously granted options would continue to vest and be exercisable in accordance with their original terms of grant. All options granted under the 1987 Stock Option Plan are for terms of up to seven years from the grant date. All options allow the holder to purchase Common Shares at a price equal to or greater than the closing market price of such shares on the date prior to the date of the grant or modification.
The following is a continuity schedule of all options outstanding [number of options in the table below are expressed in whole numbers]:
|
| Options outstanding |
| |||||
|
|
|
| Weighted |
|
|
| |
|
|
|
| average |
| Number |
| |
|
| Number |
| exercise |
| of options |
| |
|
| of options |
| price |
| exercisable |
| |
|
|
|
|
|
|
|
| |
Outstanding at December 31, 2010 |
| 11,142,450 |
| Cdn$ | 34.22 |
| 3,362,116 |
|
Exercised [i] |
| (2,737,253 | ) |
| 33.28 |
| (2,737,253 | ) |
Cancelled |
| (1,537,830 | ) |
| 48.86 |
| (1,426,164 | ) |
Vested |
| — |
|
| — |
| 2,868,001 |
|
Outstanding at December 31, 2011 |
| 6,867,367 |
| Cdn$ | 31.54 |
| 2,066,700 |
|
Granted |
| 1,389,000 |
|
| 48.22 |
| — |
|
Exercised [ii] |
| (1,525,159 | ) |
| 28.46 |
| (1,525,159 | ) |
Cancelled |
| (107,966 | ) |
| 53.14 |
| (58,967 | ) |
Vested |
| — |
|
| — |
| 2,745,000 |
|
Outstanding at December 31, 2012 |
| 6,623,242 |
| Cdn$ | 35.39 |
| 3,227,574 |
|
Granted |
| 1,060,000 |
|
| 57.02 |
| — |
|
Exercised [iii] |
| (2,805,969 | ) |
| 31.99 |
| (2,805,969 | ) |
Cancelled |
| (119,165 | ) |
| 51.46 |
| (31,667 | ) |
Vested |
| — |
|
| — |
| 2,457,171 |
|
Outstanding at December 31, 2013 |
| 4,758,108 |
| Cdn$ | 41.82 |
| 2,847,109 |
|
The total intrinsic value of options exercised during 2013 was $56 million [2012 - $6 million; 2011 - $19 million].
[i] During 2011, 1,283,334 options were exercised on a cashless basis in accordance with applicable stock option plans. On exercise, cash payments totalling $30 million were made to the stock option holders.
[ii] During 2012, 1,100,001 options were exercised on a cashless basis in accordance with applicable stock option plans. On exercise, cash payments totalling $19 million were made to the stock option holders.
[iii] During 2013, 849,999 options were exercised on a cashless basis in accordance with the applicable stock option plans. On exercise, cash payments totalling $23 million were made to the stock option holders.
All cash payments were calculated using the difference between the aggregate fair market value of the Option Shares based on the closing price of the Company’s Common Shares on the Toronto Stock Exchange [“TSX”] on the date of exercise and the aggregate Exercise Price of all such options surrendered.
At December 31, 2013, the outstanding options consist of [number of options in the table below are expressed in whole numbers]:
|
| Options outstanding |
| ||||||||
|
|
|
| Remaining |
| Number |
| ||||
|
| Number |
| contractual |
| of options |
| ||||
|
| of options |
| life [years] |
| exercisable |
| ||||
|
|
|
|
|
|
|
| ||||
$15 to $20 |
| 487,008 |
| 2.2 |
| 487,008 |
| ||||
$25 to $30 |
| 1,398,853 |
| 3.2 |
| 1,398,853 |
| ||||
$35 to $40 |
| 20,000 |
| 3.4 |
| 20,000 |
| ||||
$45 to $50 |
| 1,156,324 |
| 4.3 |
| 275,325 |
| ||||
$50 to $55 |
| 665,923 |
| 4.0 |
| 665,923 |
| ||||
Over $55 |
| 1,030,000 |
| 6.2 |
| — |
| ||||
|
| 4,758,108 |
|
|
| 2,847,109 |
| ||||
Weighted average exercise price |
| Cdn$ | 41.82 |
|
|
| Cdn$ | 34.33 |
| ||
Weighted average life remaining [years] |
| 4.31 |
|
|
| 3.38 |
| ||||
Aggregate intrinsic value at December 31, 2013 |
| $ | 198 |
|
|
| $ | 139 |
| ||
The weighted average assumptions used in measuring the fair value of stock options granted are as follows:
|
| 2013 |
| 2012 |
| 2011 |
| |||
|
|
|
|
|
|
|
| |||
Risk-free interest rate |
| 1.32 | % | 2.23 | % | — |
| |||
Expected dividend yield |
| 2.00 | % | 2.00 | % | — |
| |||
Expected volatility |
| 34 | % | 43 | % | — |
| |||
Expected time until exercise |
| 4.5 years |
| 4.5 years |
| — |
| |||
Weighted average fair value of options granted in year [Cdn$] |
| $ | 14.02 |
| $ | 15.37 |
| $ | — |
|
[b] Long-term retention program
The Company awarded certain executives an entitlement to Common Shares in the form of restricted stock. Such shares become available to the executives, subject to acceleration on death or disability, after an approximate four-year holding period, provided certain conditions are met, and are to be released in equal amounts over a 10-year period, subject to forfeiture under certain circumstances. The stock that has not been released to the executives is reflected as a reduction in the stated value of the Company’s Common Shares.
The following is a continuity of the stock that has not been released to the executives and is reflected as a reduction in the stated value of the Company’s Common Shares [number of Common Shares in the table below are expressed in whole numbers]:
|
| Number |
| Stated |
| |
|
| of shares |
| value |
| |
|
|
|
|
|
| |
Awarded and not released, December 31, 2010 |
| 1,182,736 |
| $ | 40 |
|
Release of restricted stock |
| (156,432 | ) | (5 | ) | |
Awarded and not released, December 31, 2011 |
| 1,026,304 |
| 35 |
| |
Release of restricted stock |
| (143,316 | ) | (5 | ) | |
Awarded and not released, December 31, 2012 |
| 882,988 |
| 30 |
| |
Release of restricted stock |
| (152,512 | ) | (5 | ) | |
Awarded and not released, December 31, 2013 |
| 730,476 |
| $ | 25 |
|
[c] Restricted stock unit program
In a number of different circumstances, the Company awards restricted stock units [“RSUs”] to certain executives and other employees as part of the Company’s compensation program. These RSUs are notional units, each of which is equivalent to one Magna Common Share. In most cases, the RSUs are redeemable solely at the Company’s option, either by delivery of the specified number of Common Shares or the cash value on the redemption date [based on the 20-day weighted average trading price]. Redemption of the RSUs generally occurs on December 15 of the second year after the date of grant, subject to earlier redemption or cancellation in specified circumstances. In some cases, RSUs are subject to vesting and other conditions and quarterly dividend equivalents are paid to the grantees.
The Company maintains a Non-Employee Director Share-Based Compensation Plan [“DSU Plan”] which governs the 60% portion of the annual retainer payable to Independent Directors which is mandatorily deferred in the form of Deferred Share Units [“DSUs”]. Additionally, each Independent Director may annually elect to defer up to 100% of his or her total annual cash compensation from Magna [including committee retainers, meeting and other fees]. The amounts deferred in the DSU Plan are reflected in DSUs, which are notional units, the value of which increases or decreases in direct relation to, the New York Stock Exchange [“NYSE”] market price of Magna Common Shares. Dividend equivalents are credited on DSUs at the times and in the amounts of dividends that are declared and paid on Magna’s Common Shares. All DSUs are fully vested on the date allocated to an Independent Director under the DSU Plan and are settled in cash only upon an Independent Director’s retirement from the Board.
The following is a continuity schedule of restricted stock unit programs outstanding [number of stock units in the table below are expressed in whole numbers]:
|
| Equity |
| Liability |
| Liability |
|
|
|
|
| classified |
| classified |
| classified |
|
|
|
|
| RSUs |
| RSUs |
| DSUs |
| Total |
|
|
|
|
|
|
|
|
|
|
|
Outstanding at December 31, 2010 |
| 181,732 |
| 34,242 |
| 186,348 |
| 402,322 |
|
Granted |
| 208,458 |
| 4,150 |
| 22,669 |
| 235,277 |
|
Dividend equivalents |
| 2,022 |
| 946 |
| 4,696 |
| 7,664 |
|
Redeemed |
| (24,486 | ) | (9,532 | ) | (15,267 | ) | (49,285 | ) |
Outstanding at December 31, 2011 |
| 367,726 |
| 29,806 |
| 198,446 |
| 595,978 |
|
Granted |
| 320,131 |
| 15,364 |
| 37,456 |
| 372,951 |
|
Dividend equivalents |
| 1,895 |
| 1,133 |
| 5,145 |
| 8,173 |
|
Redeemed |
| (84,322 | ) | (26,204 | ) | (34,124 | ) | (144,650 | ) |
Outstanding at December 31, 2012 |
| 605,430 |
| 20,099 |
| 206,923 |
| 832,452 |
|
Granted |
| 224,841 |
| 13,825 |
| 30,716 |
| 269,382 |
|
Dividend equivalents |
| 1,262 |
| 624 |
| 2,815 |
| 4,701 |
|
Redeemed |
| (199,679 | ) | (4,429 | ) | (113,007 | ) | (317,115 | ) |
Outstanding at December 31, 2013 |
| 631,854 |
| 30,119 |
| 127,447 |
| 789,420 |
|
[d] Compensation expense related to stock-based compensation
Stock-based compensation expense recorded in selling, general and administrative expenses related to the above programs is as follows:
|
| 2013 |
| 2012 |
| 2011 |
| |||
|
|
|
|
|
|
|
| |||
Incentive Stock Option Plan |
| $ | 15 |
| $ | 19 |
| $ | 21 |
|
Long-term retention |
| 4 |
| 5 |
| 7 |
| |||
Restricted stock unit |
| 16 |
| 14 |
| 6 |
| |||
|
| 35 |
| 38 |
| 34 |
| |||
Fair value adjustment for liability classified DSUs |
| 5 |
| 4 |
| (3 | ) | |||
Incentive Stock Option Plan |
| $ | 40 |
| $ | 42 |
| $ | 31 |
|
19. CAPITAL STOCK
[a] At December 31, 2013, the Company’s authorized, issued and outstanding capital stock are as follows:
Preference shares - issuable in series -
The Company’s authorized capital stock includes 99,760,000 preference shares, issuable in series. None of these shares are currently issued or outstanding.
Common Shares -
Common Shares without par value [unlimited amount authorized] have the following attributes:
[i] Each share is entitled to one vote per share at all meetings of shareholders.
[ii] Each share shall participate equally as to dividends.
[b] On November 8, 2013, the TSX accepted the Company’s Notice of Intention to Make a Normal Course Issuer Bid relating to the purchase for cancellation, as well as purchases to fund the Company’s stock-based compensation awards or programs and/or the Company’s obligations to its deferred profit sharing plans, of up to 12,000,000 Magna Common Shares [the “2013 Bid”], representing 5.4% of the Company’s public float of Common Shares. The Bid commenced on November 13, 2013 and will terminate no later than November 12, 2014.
Previously, the Company had Normal Course Issuer Bids in place for the 12 month periods beginning in November 2012, 2011 and 2010.
The following is a summary of the Normal Course Issuer Bids [number of shares in the table below are expressed in whole numbers]:
|
| Maximum |
| 2013 |
| 2012 |
| 2011 |
| |||||||||
|
| number |
| Shares |
| Cash |
| Shares |
| Cash |
| Shares |
| Cash |
| |||
|
| of shares |
| purchased |
| amount |
| purchased |
| amount |
| purchased |
| amount |
| |||
2010 Bid |
| 8,000,000 |
| — |
| $ | — |
| — |
| $ | — |
| 7,546,500 |
| $ | 296 |
|
2011 Bid |
| 12,000,000 |
| — |
| — |
| 467,630 |
| 21 |
| 3,200,800 |
| 111 |
| |||
2012 Bid |
| 12,000,000 |
| 11,572,598 |
| 814 |
| 427,402 |
| 19 |
| — |
| — |
| |||
2013 Bid |
| 12,000,000 |
| 2,509,723 |
| 199 |
| — |
| — |
| — |
| — |
| |||
|
|
|
| 14,082,321 |
| $ | 1,013 |
| 895,032 |
| $ | 40 |
| 10,747,300 |
| $ | 407 |
|
Certain purchases under each of our 2013 Bid and 2012 Bid were made by way of private agreements entered into with arm’s length, third party sellers. Such private agreement purchases were made at a discount to the prevailing market price for the Company’s Common Shares and pursuant to issuer bid exemption orders issued by the Ontario Securities Commission. All other purchases of Common Shares are made at the market price at the time of purchase in accordance with the rules and policies of the TSX. Purchases may also be made on the NYSE in compliance with Rule 10b-18 under the U.S. Securities Exchange Act of 1934.
[c] The following table presents the maximum number of shares that would be outstanding if all the dilutive instruments outstanding at March 6, 2014 were exercised or converted:
Common Shares |
| 221,187,872 |
|
Stock options [note 18] |
| 5,455,690 |
|
|
| 226,643,562 |
|
20. ACCUMULATED OTHER COMPREHENSIVE INCOME
The following is a continuity schedule of accumulated other comprehensive income:
|
| 2013 |
| 2012 |
| 2011 |
| |||
|
|
|
|
|
|
|
| |||
Accumulated net unrealized gain on translation of net investment in foreign operations |
|
|
|
|
|
|
| |||
Balance, beginning of year |
| $ | 629 |
| $ | 547 |
| $ | 759 |
|
Net unrealized (loss) gain |
| (133 | ) | 86 |
| (171 | ) | |||
Repurchase of shares under normal course issuer bids [note 19] |
| (42 | ) | (4 | ) | (41 | ) | |||
Balance, end of year |
| 454 |
| 629 |
| 547 |
| |||
|
|
|
|
|
|
|
| |||
Accumulated net unrealized (loss) gain on cash flow hedges [b] |
|
|
|
|
|
|
| |||
Balance, beginning of year |
| 34 |
| (23 | ) | 40 |
| |||
Net unrealized (loss) gain |
| (39 | ) | 75 |
| (41 | ) | |||
Reclassification of net gain to net income [a] |
| (15 | ) | (18 | ) | (22 | ) | |||
Balance, end of year |
| (20 | ) | 34 |
| (23 | ) | |||
|
|
|
|
|
|
|
| |||
Accumulated net unrealized loss on other long-term liabilities [b] |
|
|
|
|
|
|
| |||
Balance, beginning of year |
| (168 | ) | (107 | ) | (58 | ) | |||
Net unrealized gain (loss) |
| 44 |
| (72 | ) | (52 | ) | |||
Reclassification of net loss to net income [a] |
| 7 |
| 11 |
| 3 |
| |||
Balance, end of year |
| (117 | ) | (168 | ) | (107 | ) | |||
|
|
|
|
|
|
|
| |||
Accumulated net unrealized (loss) gain on available-for-sale investments |
|
|
|
|
|
|
| |||
Balance, beginning of year |
| 1 |
| 5 |
| 11 |
| |||
Net unrealized loss |
| (5 | ) | (4 | ) | (6 | ) | |||
Balance, end of year |
| (4 | ) | 1 |
| 5 |
| |||
Total accumulated other comprehensive income [c] |
| $ | 313 |
| $ | 496 |
| $ | 422 |
|
[a] The effects on net income of amounts reclassified from AOCI, with presentation location, were as follows:
|
| 2013 |
| 2012 |
| 2011 |
| |||
|
|
|
|
|
|
|
| |||
Cash flow hedges |
|
|
|
|
|
|
| |||
Sales |
| $ | 3 |
| $ | 24 |
| $ | 16 |
|
Cost of sales |
| 18 |
| (1 | ) | 15 |
| |||
Income tax |
| (6 | ) | (5 | ) | (9 | ) | |||
Net of tax |
| 15 |
| 18 |
| 22 |
| |||
|
|
|
|
|
|
|
| |||
Other long-term liabilities |
|
|
|
|
|
|
| |||
Cost of sales |
| (8 | ) | (14 | ) | (5 | ) | |||
Income tax |
| 1 |
| 3 |
| 2 |
| |||
Net of tax |
| (7 | ) | (11 | ) | (3 | ) | |||
|
|
|
|
|
|
|
| |||
Total gains reclassified to net income |
| $ | 8 |
| $ | 7 |
| $ | 19 |
|
[b] The amount of income tax benefit (obligation) that has been allocated to each component of other comprehensive income is as follows:
|
| 2013 |
| 2012 |
| 2011 |
| |||
|
|
|
|
|
|
|
| |||
Accumulated net unrealized (loss) gain on cash flow hedges |
|
|
|
|
|
|
| |||
Balance, beginning of year |
| $ | (13 | ) | $ | 12 |
| $ | (15 | ) |
Net unrealized loss (gain) |
| 11 |
| (30 | ) | 18 |
| |||
Reclassification of net gain to net income |
| 6 |
| 5 |
| 9 |
| |||
Balance, end of year |
| 4 |
| (13 | ) | 12 |
| |||
|
|
|
|
|
|
|
| |||
Accumulated net unrealized loss on other long-term liabilities |
|
|
|
|
|
|
| |||
Balance, beginning of year |
| 36 |
| 24 |
| 1 |
| |||
Net unrealized (gain) loss |
| (21 | ) | 15 |
| 25 |
| |||
Reclassification of net loss to net income |
| (1 | ) | (3 | ) | (2 | ) | |||
Balance, end of year |
| 14 |
| 36 |
| 24 |
| |||
|
|
|
|
|
|
|
| |||
Total income tax benefit |
| $ | 18 |
| $ | 23 |
| $ | 36 |
|
[c] The amount of other comprehensive loss that is expected to be reclassified to net income during 2014 is $1 million [net of income tax of $1 million].
21. FINANCIAL INSTRUMENTS
[a] Foreign exchange contracts
At December 31, 2013, the Company had outstanding foreign exchange forward contracts representing commitments to buy and sell various foreign currencies. Significant commitments are as follows:
|
| For Canadian dollars |
| For U.S. dollars |
| ||||||||
|
| U.S. |
| Weighted |
|
|
| Weighted |
|
|
| Weighted |
|
Buy |
| dollar |
| average |
| Euro |
| average |
| Peso |
| average |
|
(Sell) |
| amount |
| rate |
| amount |
| rate |
| amount |
| rate |
|
2014 |
| 206 |
| 1.05974 |
| 47 |
| 1.34745 |
| 3,509 |
| 0.07128 |
|
2014 |
| (656 | ) | 1.03832 |
| (12 | ) | 1.40577 |
| (2 | ) | 0.07678 |
|
2015 |
| 54 |
| 1.04289 |
| 12 |
| 1.44078 |
| 2,174 |
| 0.07170 |
|
2015 |
| (332 | ) | 1.04592 |
| (1 | ) | 1.42922 |
| — |
| — |
|
2016 |
| 17 |
| 1.03766 |
| — |
| — |
| 510 |
| 0.07166 |
|
2016 |
| (185 | ) | 1.06735 |
| — |
| — |
| — |
| — |
|
2017 |
| (85 | ) | 1.07747 |
| — |
| — |
| — |
| — |
|
2018 |
| (2 | ) | 1.08040 |
| — |
| — |
| — |
| — |
|
|
| (983 | ) |
|
| 46 |
|
|
| 6,191 |
|
|
|
|
| For euros |
| ||||||||||
|
| U.S. |
| Weighted |
|
|
| Weighted |
| Czech |
| Weighted |
|
Buy |
| dollar |
| average |
| GBP |
| average |
| koruna |
| average |
|
(Sell) |
| amount |
| rate |
| amount |
| rate |
| amount |
| rate |
|
2014 |
| 37 |
| 0.74048 |
| 31 |
| 1.14482 |
| 2,142 |
| 0.03956 |
|
2014 |
| (123 | ) | 0.75973 |
| (42 | ) | 1.16896 |
| (8 | ) | 0.03890 |
|
2015 |
| 6 |
| 0.74375 |
| 13 |
| 1.19170 |
| 1,303 |
| 0.03945 |
|
2015 |
| (80 | ) | 0.75549 |
| (15 | ) | 1.16338 |
| — |
| — |
|
2016 |
| 2 |
| 0.73702 |
| — |
| — |
| 187 |
| 0.03904 |
|
2016 |
| (34 | ) | 0.75060 |
| (1 | ) | 1.17217 |
| — |
| — |
|
2017 |
| (16 | ) | 0.73141 |
| — |
| — |
| — |
| — |
|
|
| (208 | ) |
|
| (14 | ) |
|
| 3,624 |
|
|
|
Based on forward foreign exchange rates as at December 31, 2013 for contracts with similar remaining terms to maturity, the gains and losses relating to the Company’s foreign exchange forward contracts recognized in other comprehensive income are approximately $62 million and $65 million, respectively [note 20].
The Company does not enter into foreign exchange forward contracts for speculative purposes.
[b] Natural gas swap contracts
The Company uses natural gas swap contracts to manage the cash flow risk of a portion of its forecasted natural gas swap contracts purchases in Canada and the United States. The Company does not enter into natural gas swap contracts for speculative purposes.
The natural gas swap contracts outstanding at December 31, 2013 have a total volume of 0.2 million Gigajoule [“GJ”] and a fixed price of $6.50 per GJ for Canada and a total volume of 0.2 million MMBTU [“Million British Thermal Units”] and a fixed price of $7.06 per MMBTU for the United States. These natural gas swap contracts extend through to December 2014.
The unrealized losses on these natural gas swap contracts at December 31, 2013 were $1 million [2012 - $4 million] and are recognized in other comprehensive income [note 20].
[c] Financial assets and liabilities
The Company’s financial assets and liabilities consist of the following:
|
| 2013 |
| 2012 |
| ||
|
|
|
|
|
| ||
Held-for-trading |
|
|
|
|
| ||
Cash and cash equivalents |
| $ | 1,554 |
| $ | 1,522 |
|
Investment in ABCP [note 8] |
| 92 |
| 90 |
| ||
|
| $ | 1,646 |
| $ | 1,612 |
|
|
|
|
|
|
| ||
Held-to-maturity investments |
|
|
|
|
| ||
Severance investments |
| $ | 5 |
| $ | 8 |
|
|
|
|
|
|
| ||
Available-for-sale investments |
|
|
|
|
| ||
Equity investments |
| $ | 4 |
| $ | 9 |
|
|
|
|
|
|
| ||
Loans and receivables |
|
|
|
|
| ||
Accounts receivable |
| $ | 5,246 |
| $ | 4,774 |
|
Long-term receivables included in other assets [note 12] |
| 111 |
| 95 |
| ||
|
| $ | 5,357 |
| $ | 4,869 |
|
Other financial liabilities |
|
|
|
|
| ||
Bank indebtedness |
| $ | 41 |
| $ | 71 |
|
Long-term debt (including portion due within one year) |
| 332 |
| 361 |
| ||
Accounts payable |
| 4,781 |
| 4,450 |
| ||
|
| $ | 5,154 |
| $ | 4,882 |
|
|
|
|
|
|
| ||
Derivatives designated as effective hedges, measured at fair value |
|
|
|
|
| ||
Foreign currency contracts |
|
|
|
|
| ||
Prepaid expenses |
| $ | 42 |
| $ | 37 |
|
Other assets |
| 20 |
| 32 |
| ||
Other accrued liabilities |
| (37 | ) | (11 | ) | ||
Other long-term liabilities |
| (28 | ) | (9 | ) | ||
|
| (3 | ) | 49 |
| ||
Natural gas contracts |
|
|
|
|
| ||
Prepaid expenses |
| — |
| 2 |
| ||
Other accrued liabilities |
| (1 | ) | (3 | ) | ||
Other long-term liabilities |
| — |
| (1 | ) | ||
|
| (1 | ) | (2 | ) | ||
|
| $ | (4 | ) | $ | 47 |
|
[d] Derivatives designated as effective hedges, measured at fair value
The Company presents derivatives that are designated as effective hedges at gross fair values in the Consolidated Balance Sheets. However, master netting and other similar arrangements allow net settlements under certain conditions. The following table shows the Company’s derivative foreign currency contracts at gross fair value as reflected in the Consolidated Balance Sheets and the unrecognized impacts of master netting arrangements:
|
| Gross |
| Gross |
|
|
| |||
|
| amounts |
| amounts |
|
|
| |||
|
| presented |
| not offset |
|
|
| |||
|
| in Consolidated |
| in Consolidated |
| Net |
| |||
|
| Balance Sheets |
| Balance Sheets |
| amounts |
| |||
December 31, 2013 |
|
|
|
|
|
|
| |||
Assets |
| $ | 62 |
| $ | 42 |
| $ | 20 |
|
Liabilities |
| $ | (65 | ) | $ | (42 | ) | $ | (23 | ) |
|
|
|
|
|
|
|
| |||
December 31, 2012 |
|
|
|
|
|
|
| |||
Assets |
| $ | 69 |
| $ | 20 |
| $ | 49 |
|
Liabilities |
| $ | (20 | ) | $ | (20 | ) | $ | — |
|
[e] Fair value
The Company determined the estimated fair values of its financial instruments based on valuation methodologies it believes are appropriate; however, considerable judgment is required to develop these estimates. Accordingly, these estimated fair values are not necessarily indicative of the amounts the Company could realize in a current market exchange. The estimated fair value amounts can be materially affected by the use of different assumptions or methodologies. The methods and assumptions used to estimate the fair value of financial instruments are described below:
Cash and cash equivalents, accounts receivable, bank indebtedness and accounts payable.
Due to the short period to maturity of the instruments, the carrying values as presented in the consolidated balance sheets are reasonable estimates of fair values.
Investments
At December 31, 2013, the Company held Canadian third party ABCP with a face value of Cdn$107 million [2012 -Cdn$107 million]. The carrying value and estimated fair value of this investment was Cdn$99 million [2012 - Cdn$90 million]. As fair value information is not readily determinable for the Company’s investment in ABCP, the fair value was based on a valuation technique estimating the fair value from the perspective of a market participant [note 8].
At December 31, 2013, the Company held available-for-sale investments in publicly traded companies. At December 31, 2013, the carrying value and fair value of these investments was $4 million [2012 - $9 million], which was based on the closing share prices of these investments.
Term debt
The Company’s term debt includes $230 million due within one year. Due to the short period to maturity of this debt, the carrying value as presented in the consolidated balance sheet is a reasonable estimate of its fair value.
[f] Credit risk
The Company’s financial assets that are exposed to credit risk consist primarily of cash and cash equivalents, accounts receivable, held-to-maturity investments and foreign exchange and commodity forward contracts with positive fair values.
Cash and cash equivalents, which consist of short-term investments, are only invested in governments, bank term deposits and bank commercial paper with an investment grade credit rating. Credit risk is further reduced by limiting the amount which is invested in certain governments or any major financial institution.
The Company’s held-for-trading investments include an investment in ABCP [note 8]. Given the continuing uncertainties regarding the value of the underlying assets, the amount and timing of cash flows and the risk of collateral calls in the event that spreads widened considerably, the Company could be exposed to further losses on its investment.
The Company is also exposed to credit risk from the potential default by any of its counterparties on its foreign exchange forward contracts. The Company mitigates this credit risk by dealing with counterparties who are major financial institutions that the Company anticipates will satisfy their obligations under the contracts.
In the normal course of business, the Company is exposed to credit risk from its customers, substantially all of which are in the automotive industry and are subject to credit risks associated with the automotive industry. For the year ended December 31, 2013, sales to the Company’s six largest customers represented 83% of the Company’s total sales; and substantially all of its sales are to customers in which the Company has ongoing contractual relationships.
[g] Currency risk
The Company is exposed to fluctuations in foreign exchange rates when manufacturing facilities have committed to the delivery of products for which the selling price has been quoted in currencies other than the facilities’ functional currency, and when materials and equipment are purchased in currencies other than the facilities’ functional currency. In an effort to manage this net foreign exchange exposure, the Company employs hedging programs, primarily through the use of foreign exchange forward contracts [note 21[a]].
As at December 31, 2013, the net foreign exchange exposure, after considering the impact of foreign exchange contracts, was not material.
[h] Interest rate risk
The Company is not exposed to significant interest rate risk due to the short-term maturity of its monetary current assets and current liabilities. In particular, the amount of interest income earned on cash and cash equivalents is impacted more by investment decisions made and the demands to have available cash on hand, than by movements in interest rates over a given period.
In addition, the Company is not exposed to interest rate risk on its long-term debt instruments as the interest rates on these instruments are fixed.
22. CONTINGENCIES
[a] In the ordinary course of business activities, the Company may be contingently liable for litigation and claims with customers, suppliers, former employees and other parties. In addition, the Company may be, or could become, liable to incur environmental remediation costs to bring environmental contamination levels back within acceptable legal limits. On an ongoing basis, the Company assesses the likelihood of any adverse judgments or outcomes to these matters as well as potential ranges of probable costs and losses.
A determination of the provision required, if any, for these contingencies is made after analysis of each individual issue. The required provision may change in the future due to new developments in each matter or changes in approach such as a change in settlement strategy in dealing with these matters.
In November 1997, the Company and two of its subsidiaries were sued by KS Centoco Ltd., an Ontario-based steering wheel manufacturer in which the Company has a 23% equity interest, and by Centoco Holdings Limited, the owner of the remaining 77% equity interest in KS Centoco Ltd. In March 1999, the plaintiffs were granted leave to make substantial amendments to the original statement of claim in order to add several new defendants and claim additional remedies, and in February 2006, the plaintiffs further amended their claim to add an additional remedy. The amended statement of claim alleges, among other things:
· breach of fiduciary duty by the Company and two of its subsidiaries;
· breach by the Company of its binding letter of intent with KS Centoco Ltd., including its covenant not to have any interest, directly or indirectly, in any entity that carries on the airbag business in North America, other than through MST Automotive Inc., a company to be 77% owned by Magna and 23% owned by Centoco Holdings Limited;
· the plaintiff’s exclusive entitlement to certain airbag technologies in North America pursuant to an exclusive licence agreement, together with an accounting of all revenues and profits resulting from the alleged use by the Company, TRW Inc. [“TRW”] and other unrelated third party automotive supplier defendants of such technology in North America;
· a conspiracy by the Company, TRW and others to deprive KS Centoco Ltd. of the benefits of such airbag technology in North America and to cause Centoco Holdings Limited to sell to TRW its interest in KS Centoco Ltd. in conjunction with the Company’s sale to TRW of its interest in MST Automotive GmbH and TEMIC Bayern-Chemie Airbag GmbH; and
· oppression by the defendants.
The plaintiffs are seeking, amongst other things, damages of approximately Cdn$3.5 billion. Document production, completion of undertakings and examinations for discovery are substantially complete, although limited additional examinations for discovery may occur. A trial is not expected to commence until late 2014, at the earliest. The Company believes it has valid defences to the plaintiffs’ claims and therefore intends to continue to vigorously defend this case. Notwithstanding the amount of time which has transpired since the claim was filed, these legal proceedings remain at an early stage and, accordingly, it is not possible to predict their outcome.
[b] A putative class action lawsuit alleging violations of the United States Securities Exchange Act of 1934 was filed in May 2012 in the United States District Court, Southern District of New York, against the Company, its Chief Executive Officer and its Chief Financial Officer, as well as its founder. Boilermaker-Blacksmith National Pension Trust [“BBNPT”] was appointed the lead plaintiff on an uncontested motion in July 2012. BBNPT subsequently filed an amended complaint in October 2012, following which the defendants filed a motion seeking dismissal of the lawsuit. On August 23, 2013, the Court granted the Company’s motion and dismissed the lawsuit “with prejudice”. BBNPT appealed to the United States Court of Appeals for the Second Circuit and filed an appellant brief on December 18, 2013. Following discussions between the parties, on January 16, 2014, the United States District Court entered a Stipulation and Order regarding dismissal of the Appeal, as agreed by the parties. In accordance with that Stipulation and Order, BBNPT filed a motion to voluntarily dismiss the appeal, which the Court of Appeal granted on January 30, 2014, ending the action.
[c] On September 24, 2013, representatives of the Bundeskartellamt, the German Federal Cartel Office [the “Cartel Office”], attended at one of the Company’s operating divisions in Germany to obtain information in connection with an ongoing antitrust investigation relating to suppliers of automobile textile coverings and components, particularly trunk linings. Investigations of this nature can continue for several years. Where wrongful conduct is found, the Cartel Office has the authority to impose administrative fines that are calculated in accordance with formula-based guidelines tied to the level of affected sales, the gravity of the infringement, the consolidated sales of the group of companies to which the offending entity belongs, as well as other mitigating and aggravating factors.
The Company’s policy is to comply with all applicable laws, including antitrust and competition laws. In light of the early stage of the investigation, management is unable to predict its duration or outcome, including whether any operating division of the Company could be found liable for any violation of law or the extent of any fine, if found to be liable. In the event of any such violation, any fines imposed under the Cartel Office guidelines referred to above could have a material adverse effect on Magna’s profitability in the year such fine is imposed.
[d] In certain circumstances, the Company is at risk for warranty costs including product liability and recall costs. Due to the nature of the costs, the Company makes its best estimate of the expected future costs [note 14]; however, the ultimate amount of such costs could be materially different. The Company continues to experience increased customer pressure to assume greater warranty responsibility. Currently, under most customer agreements, the Company only accounts for existing or probable claims. Under certain complete vehicle engineering and assembly contracts, the Company records an estimate of future warranty-related costs based on the terms of the specific customer agreements, and the specific customer’s warranty experience.
23. SEGMENTED INFORMATION
[a] Magna is a leading global automotive supplier with 316 manufacturing operations and 84 product development, engineering and sales centres in 29 countries. Magna has over 125,000 employees focused on delivering superior value to customers through innovative processes and World Class Manufacturing. The Company’s product capabilities include body, chassis, interior, exterior, seating, powertrain, electronic, vision, closure and roof systems and modules, as well as complete vehicle engineering and contract manufacturing.
Magna’s success is directly dependent upon the levels of North American and European [and currently to a lesser extent on Asia and Rest of World] car and light truck production by its customers. OEM production volumes in each of North America and Europe may be impacted by a number of geographic factors, including general economic conditions, interest rates, consumer credit availability, fuel prices and availability, infrastructure, legislative changes, environmental emission and safety issues, and labour and/or trade relations.
Given the differences between the regions in which the Company operates, Magna’s operations are segmented on a geographic basis. Beginning in the fourth quarter of 2013, the Company’s segments consist of North America, Europe, Asia and Rest of World. The Company maintains management teams in each of the Company’s two primary markets, North America and Europe. The role of the North American and European management teams is to manage Magna’s interests to ensure a coordinated effort across the Company’s different product capabilities. In addition to maintaining key customer, supplier and government contacts in their respective markets, the regional management teams centrally manage key aspects of the Company’s operations while permitting the divisions enough flexibility through Magna’s decentralized structure to foster an entrepreneurial environment.
Consistent with the above, the Company’s internal financial reporting separately segments key internal operating performance measures between North America, Europe, Asia and Rest of World for purposes of presentation to the chief operating decision maker to assist in the assessment of operating performance, the allocation of resources, and the long-term strategic direction and future global growth in the Company.
The Company’s chief operating decision maker uses Adjusted EBIT as the measure of segment profit or loss, since management believes Adjusted EBIT is the most appropriate measure of operational profitability or loss for its reporting segments. Adjusted EBIT represents income from operations before income taxes; interest expense (income), net; and other expense (income), net.
The accounting policies of each segment are the same as those set out under “Significant Accounting Policies” [note 1] and intersegment sales and transfers are accounted for at fair market value.
As more fully described in notes 3 and 6, on August 31, 2012 the Company acquired the controlling 27% interest in the E-Car partnership. From August 31, 2010 to August 31, 2012, the Company held a 73% non-controlling interest in E-Car and accounted for this investment using the equity method of accounting.
For segment reporting purposes, prior to August 31, 2012 the Company recorded its proportionate share of the losses of E-Car in the Corporate and Other segment. Beginning on August 31, 2012, the consolidated results of E-Car are recorded in the Company’s North America and Europe segments.
The following tables show certain information with respect to segment disclosures:
|
| 2013 |
| |||||||||||||||||||
|
|
|
|
|
| Depreciation |
|
|
|
|
| Fixed |
| Fixed |
| |||||||
|
| Total |
| External |
| and |
| Adjusted |
|
|
| asset |
| assets, |
| |||||||
|
| sales |
| sales |
| amortization |
| EBIT |
| Goodwill |
| additions |
| net |
| |||||||
North America |
|
|
|
|
|
|
|
|
|
|
|
|
|
|
| |||||||
Canada |
| $ | 6,734 |
| $ | 6,223 |
|
|
|
|
|
|
| $ | 167 |
| $ | 601 |
| |||
United States |
| 8,409 |
| 7,938 |
|
|
|
|
|
|
| 349 |
| 1,135 |
| |||||||
Mexico |
| 3,993 |
| 3,698 |
|
|
|
|
|
|
| 129 |
| 611 |
| |||||||
Eliminations |
| (1,182 | ) | — |
|
|
|
|
|
|
| — |
| — |
| |||||||
North America |
| 17,954 |
| 17,859 |
| $ | 598 |
| $ | 1,645 |
| $ | 656 |
| 645 |
| 2,347 |
| ||||
Europe |
|
|
|
|
|
|
|
|
|
|
|
|
|
|
| |||||||
Western Europe (excluding Great Britain) |
| 11,813 |
| 11,544 |
|
|
|
|
|
|
| 225 |
| 1,463 |
| |||||||
Great Britain |
| 975 |
| 968 |
|
|
|
|
|
|
| 24 |
| 70 |
| |||||||
Eastern Europe |
| 2,317 |
| 2,013 |
|
|
|
|
|
|
| 112 |
| 636 |
| |||||||
Eliminations |
| (387 | ) | — |
|
|
|
|
|
|
| — |
| — |
| |||||||
Europe |
| 14,718 |
| 14,525 |
| 355 |
| 375 |
| 655 |
| 361 |
| 2,169 |
| |||||||
Asia |
| 1,684 |
| 1,539 |
| 64 |
| 85 |
| 129 |
| 114 |
| 597 |
| |||||||
Rest of World |
| 889 |
| 889 |
| 20 |
| (76 | ) | — |
| 20 |
| 102 |
| |||||||
Corporate and Other [i] |
| (410 | ) | 23 |
| 26 |
| 36 |
| — |
| 30 |
| 226 |
| |||||||
Total reportable segments |
| 34,835 |
| 34,835 |
| 1,063 |
| 2,065 |
| 1,440 |
| 1,170 |
| 5,441 |
| |||||||
Other expense, net |
|
|
|
|
|
|
| (144 | ) |
|
|
|
|
|
| |||||||
Interest expense, net |
|
|
|
|
|
|
| (16 | ) |
|
|
|
|
|
| |||||||
|
| $ | 34,835 |
| $ | 34,835 |
| $ | 1,063 |
| $ | 1,905 |
| $ | 1,440 |
| $ | 1,170 |
| 5,441 |
| |
Current assets |
|
|
|
|
|
|
|
|
|
|
|
|
| 9,923 |
| |||||||
Investments, goodwill, deferred tax assets and other assets |
|
|
|
|
|
|
|
|
|
|
|
|
| 2,626 |
| |||||||
Consolidated total assets |
|
|
|
|
|
|
|
|
|
|
|
|
| $ | 17,990 |
| ||||||
|
| 2012 |
| |||||||||||||||||||
|
|
|
|
|
| Depreciation |
|
|
|
|
| Fixed |
| Fixed |
| |||||||
|
| Total |
| External |
| and |
| Adjusted |
|
|
| asset |
| assets, |
| |||||||
|
| sales |
| sales |
| amortization |
| EBIT |
| Goodwill |
| additions |
| net |
| |||||||
North America |
|
|
|
|
|
|
|
|
|
|
|
|
|
|
| |||||||
Canada |
| $ | 6,343 |
| $ | 5,907 |
|
|
|
|
|
|
| $ | 158 |
| $ | 660 |
| |||
United States |
| 7,518 |
| 7,053 |
|
|
|
|
|
|
| 294 |
| 973 |
| |||||||
Mexico |
| 3,520 |
| 3,281 |
|
|
|
|
|
|
| 163 |
| 573 |
| |||||||
Eliminations |
| (1,046 | ) | — |
|
|
|
|
|
|
| — |
| — |
| |||||||
North America |
| 16,335 |
| 16,241 |
| $ | 432 |
| $ | 1,521 |
| $ | 701 |
| 615 |
| 2,206 |
| ||||
Europe |
|
|
|
|
|
|
|
|
|
|
|
|
|
|
| |||||||
Western Europe (excluding Great Britain) |
| 10,089 |
| 9,927 |
|
|
|
|
|
|
| 246 |
| 1,490 |
| |||||||
Great Britain |
| 961 |
| 952 |
|
|
|
|
|
|
| 15 |
| 58 |
| |||||||
Eastern Europe |
| 1,847 |
| 1,684 |
|
|
|
|
|
|
| 117 |
| 584 |
| |||||||
Eliminations |
| (188 | ) | — |
|
|
|
|
|
|
| — |
| — |
| |||||||
Europe |
| 12,709 |
| 12,563 |
| 283 |
| 165 |
| 611 |
| 378 |
| 2,132 |
| |||||||
Asia |
| 1,289 |
| 1,188 |
| 42 |
| 49 |
| 74 |
| 214 |
| 558 |
| |||||||
Rest of World |
| 822 |
| 822 |
| 17 |
| (77 | ) | 87 |
| 56 |
| 128 |
| |||||||
Corporate and Other [i],[ii] |
| (318 | ) | 23 |
| 27 |
| — |
| — |
| 11 |
| 249 |
| |||||||
Total reportable segments |
| 30,837 |
| 30,837 |
| 801 |
| 1,658 |
| 1,473 |
| 1,274 |
| 5,273 |
| |||||||
Other income, net |
|
|
|
|
|
|
| 108 |
|
|
|
|
|
|
| |||||||
Interest expense, net |
|
|
|
|
|
|
| (16 | ) |
|
|
|
|
|
| |||||||
|
| $ | 30,837 |
| $ | 30,837 |
| $ | 801 |
| $ | 1,750 |
| $ | 1,473 |
| $ | 1,274 |
| 5,273 |
| |
Current assets |
|
|
|
|
|
|
|
|
|
|
|
|
| 9,135 |
| |||||||
Investments, goodwill, deferred tax assets and other assets |
|
|
|
|
|
|
|
|
|
|
|
|
| 2,701 |
| |||||||
Consolidated total assets |
|
|
|
|
|
|
|
|
|
|
|
|
| $ | 17,109 |
| ||||||
|
| 2011 |
| |||||||||||||||||||
|
|
|
|
|
| Depreciation |
|
|
|
|
| Fixed |
| Fixed |
| |||||||
|
| Total |
| External |
| and |
| Adjusted |
|
|
| asset |
| assets, |
| |||||||
|
| sales |
| sales |
| amortization |
| EBIT |
| Goodwill |
| additions |
| net |
| |||||||
North America |
|
|
|
|
|
|
|
|
|
|
|
|
|
|
| |||||||
Canada |
| $ | 5,951 |
| $ | 5,552 |
|
|
|
|
|
|
| $ | 115 |
| $ | 586 |
| |||
United States |
| 7,025 |
| 6,514 |
|
|
|
|
|
|
| 281 |
| 804 |
| |||||||
Mexico |
| 2,902 |
| 2,698 |
|
|
|
|
|
|
| 162 |
| 477 |
| |||||||
Eliminations |
| (1,023 | ) | — |
|
|
|
|
|
|
| — |
| — |
| |||||||
North America |
| 14,855 |
| 14,764 |
| $ | 358 |
| $ | 1,373 |
| $ | 644 |
| 558 |
| 1,867 |
| ||||
Europe |
|
|
|
|
|
|
|
|
|
|
|
|
|
|
| |||||||
Western Europe (excluding Great Britain) |
| 10,124 |
| 9,963 |
|
|
|
|
|
|
| 284 |
| 1,111 |
| |||||||
Great Britain |
| 913 |
| 909 |
|
|
|
|
|
|
| 7 |
| 53 |
| |||||||
Eastern Europe |
| 1,708 |
| 1,557 |
|
|
|
|
|
|
| 132 |
| 438 |
| |||||||
Eliminations |
| (189 | ) | — |
|
|
|
|
|
|
| — |
| — |
| |||||||
Europe |
| 12,556 |
| 12,429 |
| 259 |
| (22 | ) | 392 |
| 423 |
| 1,602 |
| |||||||
Asia |
| 1,074 |
| 982 |
| 31 |
| 68 |
| 74 |
| 204 |
| 378 |
| |||||||
Rest of World |
| 525 |
| 524 |
| 7 |
| (12 | ) | 86 |
| 32 |
| 107 |
| |||||||
Corporate and Other [i, ii] |
| (262 | ) | 49 |
| 31 |
| (40 | ) | — |
| 19 |
| 282 |
| |||||||
Total reportable segments |
| 28,748 |
| 28,748 |
| 686 |
| 1,367 |
| 1,196 |
| 1,236 |
| 4,236 |
| |||||||
Other expense, net |
|
|
|
|
|
|
| (156 | ) |
|
|
|
|
|
| |||||||
Interest income, net |
|
|
|
|
|
|
| 6 |
|
|
|
|
|
|
| |||||||
|
| $ | 28,748 |
| $ | 28,748 |
| $ | 686 |
| $ | 1,217 |
| $ | 1,196 |
| $ | 1,236 |
| 4,236 |
| |
Current assets |
|
|
|
|
|
|
|
|
|
|
|
|
| 8,146 |
| |||||||
Investments, goodwill, deferred tax assets and other assets |
|
|
|
|
|
|
|
|
|
|
|
|
| 2,297 |
| |||||||
Consolidated total assets |
|
|
|
|
|
|
|
|
|
|
|
|
| $ | 14,679 |
| ||||||
[i] Included in Corporate and Other Adjusted EBIT are intercompany fees charged to the automotive segments.
[ii] For the year ended December 31, 2012, Corporate and Other includes $35 million equity loss related to the Company’s investment in E-Car.
For the year ended December 31, 2011, Corporate and Other includes $66 million equity loss related to the Company’s investment in E-Car.
[b] The following table aggregates external revenues by customer as follows:
|
| 2013 |
| 2012 |
| 2011 |
| |||
|
|
|
|
|
|
|
| |||
General Motors |
| $ | 6,394 |
| $ | 5,704 |
| $ | 6,202 |
|
Fiat / Chrysler Group |
| 5,137 |
| 4,637 |
| 3,864 |
| |||
BMW |
| 4,882 |
| 4,100 |
| 4,191 |
| |||
Ford Motor Company |
| 4,450 |
| 3,848 |
| 3,549 |
| |||
Volkswagen |
| 4,047 |
| 3,835 |
| 3,187 |
| |||
Daimler AG |
| 3,949 |
| 3,367 |
| 2,793 |
| |||
Other |
| 5,976 |
| 5,346 |
| 4,962 |
| |||
|
| $ | 34,835 |
| $ | 30,837 |
| $ | 28,748 |
|
[c] The following table summarizes external revenues generated by automotive products and services:
|
| 2013 |
| 2012 |
| 2011 |
| |||
|
|
|
|
|
|
|
| |||
Exterior and interior systems |
| $ | 12,308 |
| $ | 11,673 |
| $ | 11,020 |
|
Body systems and chassis systems |
| 7,874 |
| 7,123 |
| 6,056 |
| |||
Powertrain systems |
| 4,634 |
| 3,825 |
| 3,667 |
| |||
Complete vehicle assembly |
| 3,062 |
| 2,561 |
| 2,690 |
| |||
Tooling, engineering and other |
| 2,823 |
| 2,317 |
| 2,065 |
| |||
Vision and electronic systems |
| 2,193 |
| 2,132 |
| 2,066 |
| |||
Closure systems |
| 1,941 |
| 1,206 |
| 1,184 |
| |||
|
| $ | 34,835 |
| $ | 30,837 |
| $ | 28,748 |
|
24. SUBSEQUENT EVENTS
Under Austria’s current group taxation system, an Austrian entity may utilize the tax losses of all direct foreign subsidiaries. On February 28, 2014, the Austrian government enacted legislation abolishing the utilization of foreign losses, where the direct foreign subsidiary is not a member of the European Union. Furthermore, any foreign losses previously used by Austrian entities arising in those direct non European Union subsidiaries will be subject to recapture in Austria. In light of this legislation, the Company anticipates taking a charge to tax expense of approximately $25 million to $30 million during the first quarter of 2014. The tax is payable over three years, commencing in 2015.
25. COMPARATIVE FIGURES
Certain of the comparative figures have been reclassified to conform to the current year’s method of presentation.
MAGNA INTERNATIONAL INC.
Supplementary Financial and Share Information
FINANCIAL SUMMARY
(U.S. dollars in millions, except per share figures)
(unaudited)
Years ended December 31, |
| 2013* |
| 2012* |
| 2011* |
| 2010* |
| 2009* |
| 2008** |
| 2007** |
| 2006** |
| 2005** |
| 2004** |
|
Total sales |
| 34,835 |
| 30,837 |
| 28,748 |
| 23,465 |
| 16,876 |
| 23,704 |
| 26,067 |
| 24,180 |
| 22,811 |
| 20,653 |
|
Depreciation |
| 1,063 |
| 801 |
| 686 |
| 656 |
| 725 |
| 873 |
| 872 |
| 790 |
| 711 |
| 598 |
|
Net income (loss) attributable to |
|
|
|
|
|
|
|
|
|
|
|
|
|
|
|
|
|
|
|
|
|
Magna International Inc. |
| 1,561 |
| 1,433 |
| 1,018 |
| 1,003 |
| (453 | ) | 71 |
| 663 |
| 528 |
| 639 |
| 676 |
|
|
|
|
|
|
|
|
|
|
|
|
|
|
|
|
|
|
|
|
|
|
|
Diluted EPS |
| 6.76 |
| 6.09 |
| 4.20 |
| 4.30 |
| (2.03 | ) | 0.31 |
| 2.93 |
| 2.39 |
| 2.95 |
| 3.48 |
|
Average number of shares outstanding |
| 227.9 |
| 232.4 |
| 239.3 |
| 230.0 |
| 223.6 |
| 225.6 |
| 222.8 |
| 217.2 |
| 213.4 |
| 193.4 |
|
|
|
|
|
|
|
|
|
|
|
|
|
|
|
|
|
|
|
|
|
|
|
Cash dividends paid per share |
| 1.28 |
| 1.10 |
| 1.00 |
| 0.42 |
| 0.09 |
| 0.63 |
| 0.58 |
| 0.76 |
| 0.76 |
| 0.74 |
|
Cash flow from operations |
| 2,567 |
| 2,206 |
| 1,210 |
| 1,878 |
| 519 |
| 1,054 |
| 1,593 |
| 1,596 |
| 1,698 |
| 1,381 |
|
Capital expenditures |
| 1,169 |
| 1,274 |
| 1,236 |
| 746 |
| 616 |
| 739 |
| 741 |
| 793 |
| 848 |
| 859 |
|
|
|
|
|
|
|
|
|
|
|
|
|
|
|
|
|
|
|
|
|
|
|
Working capital |
| 2,614 |
| 2,451 |
| 2,422 |
| 2,517 |
| 2,001 |
| 2,258 |
| 3,112 |
| 2,277 |
| 2,215 |
| 2,183 |
|
Fixed assets, net |
| 5,441 |
| 5,273 |
| 4,236 |
| 3,742 |
| 3,471 |
| 3,701 |
| 4,307 |
| 4,114 |
| 4,124 |
| 3,967 |
|
Total assets |
| 17,990 |
| 17,109 |
| 14,679 |
| 13,674 |
| 12,138 |
| 13,189 |
| 15,343 |
| 13,154 |
| 12,321 |
| 11,615 |
|
|
|
|
|
|
|
|
|
|
|
|
|
|
|
|
|
|
|
|
|
|
|
Long-term debt |
| 102 |
| 112 |
| 46 |
| 47 |
| 117 |
| 143 |
| 337 |
| 605 |
| 700 |
| 984 |
|
Shareholders’ equity |
| 9,639 |
| 9,458 |
| 8,202 |
| 8,026 |
| 7,299 |
| 7,363 |
| 8,642 |
| 7,157 |
| 6,565 |
| 5,335 |
|
Long-term debt to equity ratio |
| 0.01:1 |
| 0.01:1 |
| 0.01:1 |
| 0.01:1 |
| 0.02:1 |
| 0.02:1 |
| 0.04:1 |
| 0.08:1 |
| 0.11:1 |
| 0.18:1 |
|
* Reported under United States generally accepted accounting principles
** Reported under Canadian generally accepted accounting principles
Share Information
The Common Shares are listed and traded in Canada on the Toronto Stock Exchange (“TSX”) under the stock symbol “MG” and in the United States on the New York Stock Exchange (“NYSE”) under the stock symbol “MGA”. As of February 28, 2014, there were 1,588 registered holders of Common Shares.
Distribution of Shares held by Registered Shareholders
|
| Common Shares |
|
Canada |
| 83.45 | % |
United States |
| 16.42 | % |
Other |
| 0.13 | % |
Dividends
Dividends for 2013 on Magna’s Common Shares were paid on each of March 27, June 17, September 16 and December 13 at a rate of U.S.$0.32. Magna’s dividends have been designated as “eligible dividends” as defined in subsection 89(1) of the Income Tax Act (Canada) and, accordingly, are eligible for an enhanced tax credit. Additional details are found on Magna’s website (www.magna.com), under “Investors - Shareholder Information — Dividends & Interest”.
Price Range of Shares
The following table sets forth, for the years indicated, the high and low sale prices and volumes of Common Shares traded in each case as reported by the TSX and NYSE, respectively.
Common Shares (TSX) (Cdn$)
|
| Year ended December 31, 2013 |
| Year ended December 31, 2012 |
| ||||||||
Quarter |
| Volume |
| High |
| Low |
| Volume |
| High |
| Low |
|
1st |
| 40,479,443 |
| 59.75 |
| 50.05 |
| 56,178,078 |
| 48.99 |
| 34.02 |
|
2nd |
| 46,171,660 |
| 75.72 |
| 55.84 |
| 42,771,419 |
| 48.65 |
| 38.10 |
|
3rd |
| 34,745,219 |
| 87.68 |
| 74.33 |
| 34,970,549 |
| 45.99 |
| 37.68 |
|
4th |
| 31,616,445 |
| 92.75 |
| 80.52 |
| 31,132,750 |
| 49.88 |
| 42.30 |
|
Common Shares (NYSE) (U.S.$)
|
| Year ended December 31, 2013 |
| Year ended December 31, 2012 |
| ||||||||
Quarter |
| Volume |
| High |
| Low |
| Volume |
| High |
| Low |
|
1st |
| 43,850,786 |
| 54.31 |
| 53.42 |
| 75,396,399 |
| 49.60 |
| 33.32 |
|
2nd |
| 47,427,362 |
| 63.87 |
| 62.74 |
| 65,640,328 |
| 49.13 |
| 36.54 |
|
3rd |
| 35,508,159 |
| 79.01 |
| 77.74 |
| 47,382,974 |
| 47.27 |
| 36.96 |
|
4th |
| 37,984,231 |
| 83.38 |
| 82.07 |
| 31,933,425 |
| 46.20 |
| 42.60 |
|
Corporate Directory
Directors | Executive Officers |
|
|
|
|
|
|
William L. Young (Chairman) | Donald J. Walker | Guenther Apfalter | James J. Tobin, Sr. |
Scott B. Bonham | Chief Executive Officer | President, Magna Europe | Chief Marketing Officer |
Peter G. Bowie |
|
| and President, Magna Asia |
Hon. J. Trevor Eyton | Vincent J. Galifi | Seetarama Kotagiri |
|
V. Peter Harder | Executive Vice-President | Executive Vice-President and | Tommy J. Skudutis |
Lady Barbara Judge | and Chief Financial Officer | Chief Technology Officer | Chief Operating Officer, Exteriors, |
Dr. Kurt J. Lauk |
|
| Interiors, Seating, Mirrors, |
Donald J. Walker | Jeffrey O. Palmer | Marc J. Neeb | Closures and Cosma |
Lawrence D. Worrall | Executive Vice-President | Executive Vice-President and |
|
| and Chief Legal Officer | Chief Human Resources Officer |
|
|
|
|
|
Corporate Office | Other Officers |
|
|
|
|
|
|
Magna International Inc. | Paul H. Brock | Robert D. Merkley | Michael G.R. Sinnaeve |
337 Magna Drive | Vice-President and Treasurer | Vice-President, Internal Audit | Vice-President, Operational |
Aurora, Ontario |
|
| Improvement and Quality |
Canada L4G 7K1 | Gary M. Cohn | Scott E. Paradise |
|
Telephone: (905) 726-2462 | Vice-President, | Vice-President, Marketing | Doug R. Tatters |
www.magna.com | Mergers and Acquisitions | and New Business Development | Vice-President, Business |
|
| — The Americas | Improvement and IT Transformation |
| Joanne N. Horibe |
|
|
| Vice-President, Ethics and | Thomas A. Schultheiss | Louis B. Tonelli |
| Legal Compliance | Vice-President and | Vice-President, |
|
| General Counsel — Europe | Investor Relations |
| Patrick W.D. McCann |
|
|
| Vice-President, Finance | Bassem A. Shakeel | Riccardo C. Trecroce |
|
| Vice-President and | Vice-President and General |
| Atul K. Mehta | Corporate Secretary | Counsel — North America |
| Vice-President, Taxation |
|
|
|
|
| Robert G. Cecutti |
|
|
| Controller |
|
|
|
|
Transfer Agent and Registrar |
|
| Exchange Listings |
|
|
|
|
Computershare Trust Company of Canada | Computershare Trust Company N.A. |
| Common Shares |
100 University Avenue, 8th Floor | 250 Royall Street |
| Toronto Stock Exchange MG |
Toronto, Ontario, Canada M5J 2Y1 | Canton, MA, USA 02021 |
| New York Stock Exchange MGA |
Telephone: 1 (800) 564-6253 | Telephone: (781) 575-3120 |
|
|
| Toll Free: 1-800-962-4284 |
|
|
| www.computershare.com |
|
|
As a “foreign private issuer” listed on the New York Stock Exchange (NYSE), Magna is required to disclose the significant ways in which our corporate governance practices differ from those to be followed by U.S. domestic issuers under the NYSE listing standards. Please see the corporate governance section of our website (www.magna.com) for our Statement of Significant Corporate Governance Differences (NYSE). Additionally, please refer to the Management Information Circular/Proxy Statement for our 2014 Annual Meeting of Shareholders for a description of our corporate governance practices in comparison with the requirements and guidelines of the Canadian securities administrators.
Shareholders wishing to communicate with the non-management members of the Magna Board of Directors may do so by contacting the Chairman of the Board through the office of Magna’s Corporate Secretary at 337 Magna Drive, Aurora, Ontario, Canada L4G 7K1 (905) 726-7070.
Shareholders wishing to obtain a copy of Magna’s Notice of Intention to Make a Normal Course Issuer Bid, referred to in Note 19 to the consolidated financial statements contained in this Annual Report may also do so by contacting Magna’s Corporate Secretary.
The 2014 Annual Meeting of Shareholders
The 2014 Annual Meeting of Shareholders will be held at The Westin Prince, 900 York Mills Road, Toronto, Ontario, Canada on Thursday, May 8, 2014 commencing at 10:00 a.m. (Eastern Daylight Time).
2013 Annual Report
Additional copies of this 2013 Annual Report or copies of our quarterly reports may be obtained from: The Corporate Secretary, Magna International Inc., 337 Magna Drive, Aurora, Ontario, Canada L4G 7K1 or www.magna.com. Copies of financial data and other publicly filed documents are available through the internet on the Canadian Securities Administrators’ System for Electronic Document Analysis and Retrieval (SEDAR) which can be accessed at www.sedar.com and on the United States Securities and Exchange Commission’s Electronic Data Gathering, Analysis and Retrieval System (EDGAR) which can be accessed at www.sec.gov.
©Magna International Inc. 2014. Magna and the ![]() MAGNA logo are registered trademarks of Magna International Inc.
MAGNA logo are registered trademarks of Magna International Inc.
Magna International Inc.
337 Magna Drive, Aurora, Ontario
Canada L4G 7K1
Telephone: (905) 726-2462
Fax: (905) 726-7164
magna.com

2013 Annual Report
Printed in Canada