
Magna International Inc.
Management’s Discussion and Analysis of Results of Operations and Financial Position
December 31, 2018
MAGNA INTERNATIONAL INC.
Management’s Discussion and Analysis of Results of Operations and Financial Position
Unless otherwise noted, all amounts in this Management’s Discussion and Analysis of Results of Operations and Financial Position [“MD&A”] are in U.S. dollars and all tabular amounts are in millions of U.S. dollars, except per share figures, which are in U.S. dollars. When we use the terms “we”, “us”, “our” or “Magna”, we are referring to Magna International Inc. and its subsidiaries and jointly controlled entities, unless the context otherwise requires.
This MD&A should be read in conjunction with the audited consolidated financial statements for the year ended December 31, 2018. The most recent updates to our accounting policies, including the impact of the adoption of Accounting Standards Codification 606 — Revenue from Contracts with Customers, can be found in Note 2 of our audited consolidated financial statements for the year ended December 31, 2018.
We announced a realignment of our management structure along product lines in December 2017. As a result, effective January 1, 2018, our results are reported through the following business segments: Body Exteriors & Structures, Power & Vision, Seating Systems and Complete Vehicles. Prior period amounts contained in this MD&A have been adjusted to conform to the new segment presentation. Refer to Note 24 of our audited consolidated financial statements for the year ended December 31, 2018 for additional information.
This MD&A contains statements that are forward looking. Refer to the “Forward-Looking Statements” section in this MD&A for a more detailed discussion of our use of forward-looking statements.
This MD&A has been prepared as at March 7, 2019.
USE OF NON-GAAP FINANCIAL MEASURES
In addition to results presented in accordance with accounting principles generally accepted in the United States of America [“U.S. GAAP”], this report includes the use of Adjusted EBIT, Adjusted EBIT as a percentage of sales, Adjusted diluted earnings per share, Return on Invested Capital and Return on Equity [collectively, the “Non-GAAP Measures”]. We believe these non-GAAP financial measures provide additional information that is useful to investors in understanding our underlying performance and trends. Readers should be aware that Non-GAAP Measures have no standardized meaning under U.S. GAAP and accordingly may not be comparable to the calculation of similar measures by other companies. We believe that Return on Invested Capital and Return on Equity are useful to both management and investors in their analysis of our results of operations and reflect our ability to generate returns. Similarly, we believe that Adjusted EBIT, Adjusted EBIT as a percentage of sales and Adjusted diluted earnings per share provide useful information to our investors for measuring our operational performance as they exclude certain items that are not reflective of ongoing operating profit or loss and facilitate a comparison of our performance with prior periods. The presentation of any Non-GAAP Measures should not be considered in isolation or as a substitute for our related financial results prepared in accordance with U.S. GAAP. Non-GAAP financial measures are presented together with the most directly comparable GAAP financial measure, and a reconciliation to the most directly comparable GAAP financial measure, can be found in the “Non-GAAP Financial Measures Reconciliation” section of this MD&A.
HIGHLIGHTS
· We posted record sales, net income attributable to Magna, equity income, diluted earnings per share, and cash from operating activities in 2018.
· Total sales increased 12% to $40.8 billion in 2018, compared to $36.6 billion in 2017. Our sales growth largely reflects the launch of new programs and the strengthening of a number of foreign currencies against the U.S. dollar. Our 12% increase in sales substantially outperformed global vehicle production, which was essentially level in 2018 as compared to 2017. All of our operating segments reported record sales and outgrew global vehicle production.
· Body Exteriors & Structures sales increased 6% to $17.5 billion.
· Power & Vision sales increased 6% to $12.3 billion.
· Seating Systems sales rose 6% to $5.5 billion.
· Complete Vehicles sales grew 70% to $6.0 billion.
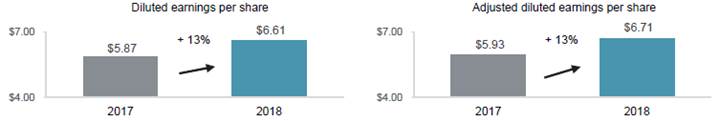
· Diluted earnings per share and adjusted diluted earnings per share were $6.61 and $6.71, respectively, and both increased 13% compared to 2017. The increases largely reflect an increase in net income and a reduced share count primarily as a result of share repurchases.
· Included in Other expense, net in 2018 is an impairment charge of $60 million ($59 million after tax) related to our investment in a transmission joint venture in Europe with Ford Motor Company. The impairment reflects the expected further industry volume decline in manual transmissions, which make up substantially all of the volume production in the joint venture.
· Cash from operating activities was $3.7 billion, higher than our previous record from 2017 of $3.3 billion.
· We further invested for our future, including:
· $1.7 billion for fixed assets;
· $481 million in investment and other asset spending;
· $220 million in Lyft, with whom we have entered a multi-year collaboration to fund, develop and manufacture self-driving systems; and
· $152 million to acquire OLSA, which will expand our lighting capabilities to enable us to design, engineer and manufacture headlamps, tail lamps and other lighting products in every key region of the world.
· We announced our intention to form two new joint ventures with Beijing Electric Vehicle Co. Ltd, a subsidiary of BAIC Group, for complete vehicle manufacturing as well as engineering of electric vehicles. The engineering joint venture was formed before the end of 2018. The manufacturing joint venture is expected to take over an existing BAIC manufacturing facility in Zhenjiang, China with capacity to build up to 180,000 vehicles per year.
· We announced that we had signed an agreement to sell our Fluid Pressure & Controls business for $1.2 billion, before the assumption of net debt and pension liabilities at closing, and subject to customary closing adjustments for net working capital. The transaction is expected to close at the end of the first quarter of 2019.
· We returned $2.3 billion to shareholders in 2018 through $1.8 billion in share repurchases and $448 million in dividends.
· Our Board of Directors increased our quarterly dividend by 11% to $0.365 per share reflecting continued confidence in Magna’s future.
Magna International Inc. Annual Report 2018
FORWARD-LOOKING STATEMENTS
Certain statements in this MD&A constitute “forward-looking information” or “forward-looking statements” (collectively, “forward-looking statements”) and are intended to provide information about management’s current expectations and plans. Such forward-looking statements may not be appropriate for other purposes. Forward-looking statements may include financial and other projections, as well as statements regarding our future plans, objectives or economic performance, or the assumptions underlying any of the foregoing, and other statements that are not recitations of historical fact. We use words such as “may”, “would”, “could”, “should”, “will”, “likely”, “expect”, “anticipate”, “believe”, “intend”, “plan”, “aim”, “forecast”, “outlook”, “project”, “estimate”, “target” and similar expressions suggesting future outcomes or events to identify forward-looking statements. Our forward-looking statements are based on information currently available to us, and are based on assumptions and analyses made by us in light of our experience and our perception of historical trends, current conditions and expected future developments, as well as other factors we believe are appropriate in the circumstances. Forward-looking statements in this MD&A include, but are not limited to discussions related to the implementation of our business strategy.
While we believe we have a reasonable basis for making such forward-looking statements, they are not a guarantee of future performance or outcomes. Whether actual results and developments conform to our expectations and predictions is subject to a number of risks, assumptions and uncertainties, many of which are beyond our control, and the effects of which can be difficult to predict, including the risk factors which are described later in this MD&A.
OVERVIEW
OUR BUSINESS(1)
We are a mobility technology company that is helping pave the way to the future with innovative products and processes. We have more than 174,000 entrepreneurial-minded employees and 348 manufacturing operations and 91 product development, engineering and sales centres in 28 countries. Our competitive capabilities include body exteriors and structures, power and vision technologies, seating systems and complete vehicle solutions. Our common shares trade on the Toronto Stock Exchange (MG) and the New York Stock Exchange (MGA).
INDUSTRY TRENDS
Our operating results are primarily dependent on the levels of North American, European and Chinese car and light truck production by our customers. While we supply systems and components to every major original equipment manufacturer [“OEM”], we do not supply systems and components for every vehicle, nor is the value of our content consistent from one vehicle to the next. As a result, customer and program mix relative to market trends, as well as the value of our content on specific vehicle production programs, are important drivers of our results.
OEM production volumes are generally aligned with vehicle sales levels. Overall vehicle sales levels are significantly affected by changes in consumer confidence levels, which may in turn be impacted by consumer perceptions and general trends related to the job, housing and stock markets. Other factors impacting vehicle sales levels, and thus production volumes in North America, Europe and China, include: interest rates and/or availability of credit; fuel and energy prices; relative currency values; and other factors.
In addition to vehicle sales levels, production volumes in different regions may be impacted by a range of factors which vary from one region to the next, including: general economic and political conditions; free trade arrangements; tariffs; relative currency values; commodities prices; supply chains and infrastructure; availability and relative cost of skilled labour; and regulatory considerations, including those related to environmental emissions and safety standards; and other factors.
While the foregoing economic, political and other factors are part of the general context in which the global automotive industry operates, there have been a number of significant industry trends that are shaping the future of the industry and creating opportunities and risks for automotive suppliers. These trends include:
· industry-wide focus on solutions aimed at reducing vehicle fuel consumption and carbon dioxide/greenhouse gas emissions, which is being driven in large part by governmental regulation;
· accelerating demand for hybrid and fully-electric vehicles;
· continued growth in demand for vehicle safety features and products;
· increased investment and expenditure on autonomous driving technologies and vehicle electrification;
· the growth of new OEMs, particularly in China;
· growth of potential industry disruptors offering “mobility-as-a-service” [“MaaS”] business models, including in areas such as ride-hailing and ride sharing;
· expansion of cooperative alliances among OEMs and, increasingly, between OEMs and MaaS market entrants;
· efforts by the Chinese government to increase engineering, development and manufacturing of high-value, high-tech products in China, as reflected in the Chinese central government’s “Made in China 2025” initiative; and
· emergence of “new” low-cost automotive manufacturing markets, such as Vietnam and Morocco.
1 Manufacturing operations, product development, engineering and sales centres and employee figures include certain operations accounted for under the equity method
We continue to implement a business strategy which is rooted in our best assessment as to the rate and direction of change in the automotive industry, including with respect to trends related to vehicle electrification and autonomy, as well as MaaS. For example, to support our customers’ needs for solutions which improve the fuel efficiency and reduce CO2 emissions of their vehicles, we are focused on delivering lightweight products and materials, efficient transmissions and active aerodynamics, as well as hybrid/electric drive systems. Additionally, we are building on our market leadership in camera-based advanced driver assistance systems [“ADAS”], to provide driving solutions incorporating cameras, radar, LiDAR (for advanced applications) and domain controllers, which can be scaled to offer greater levels of automated driving functionality. We are also working with traditional OEMs and MaaS market entrants on potential new mobility solutions which leverage our complete vehicle know-how, potentially including our complete vehicle assembly expertise.
Our short- and medium-term operational success, as well as our ability to create long-term value through our business strategy, are subject to a number of risks and uncertainties which are discussed later in this MD&A.
RESULTS OF OPERATIONS
AVERAGE FOREIGN EXCHANGE
|
| For the year |
| |||||
|
| ended December 31, |
| |||||
|
| 2018 |
| 2017 |
| Change |
| |
|
|
|
|
|
|
|
|
|
1 Canadian dollar equals U.S. dollars |
| 0.771 |
| 0.771 |
|
| — |
|
1 euro equals U.S. dollars |
| 1.181 |
| 1.130 |
| + | 5 | % |
1 Chinese renminbi equals U.S. dollars |
| 0.151 |
| 0.148 |
| + | 2 | % |
The preceding table reflects the average foreign exchange rates between the most common currencies in which we conduct business and our U.S. dollar reporting currency. The changes in these foreign exchange rates for the year ended December 31, 2018 impacted the reported U.S. dollar amounts of our sales, expenses and income.
The results of operations for which the functional currency is not the U.S. dollar are translated into U.S. dollars using the average exchange rates in the table above for the relevant period. Throughout this MD&A, reference is made to the impact of translation of foreign operations on reported U.S. dollar amounts where relevant.
LIGHT VEHICLE PRODUCTION VOLUMES
Our operating results are mostly dependent on light vehicle production in the regions reflected in the table below:
Light Vehicle Production Volumes (thousands of units)
|
| 2018 |
| 2017 |
| Change |
| |
|
|
|
|
|
|
|
| |
North America |
| 17,022 |
| 17,115 |
| - | 1 | % |
|
|
|
|
|
|
|
|
|
Europe |
| 22,572 |
| 22,383 |
| + | 1 | % |
|
|
|
|
|
|
|
|
|
China |
| 26,555 |
| 27,722 |
| - | 4 | % |
RESULTS OF OPERATIONS — FOR THE YEAR ENDED DECEMBER 31, 2018
SALES
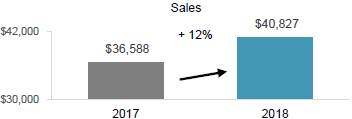
Sales increased 12% or $4.2 billion to $40.8 billion for 2018 compared to $36.6 billion for 2017, primarily as a result of the launch of new programs during or subsequent to 2017, in particular in our Complete Vehicles, Body Exteriors & Structures, and Seating Systems businesses and a $601 million increase in reported U.S. dollar sales as a result of the strengthening of the euro against the U.S. dollar, partially offset by the weakening of certain foreign currencies against the U.S. dollar, including the Turkish lira and Brazil real.
These factors were partially offset by the impact of a change in production volumes on various other programs.
The changes in sales are discussed further in the “Segment Analysis” section of this MD&A.
COST OF GOODS SOLD
|
| 2018 |
| 2017 |
| Change |
| |||
|
|
|
|
|
|
|
| |||
Material |
| $ | 25,355 |
| $ | 22,034 |
| $ | 3,321 |
|
Direct labour |
| 2,953 |
| 2,711 |
| 242 |
| |||
Overhead |
| 6,747 |
| 6,150 |
| 597 |
| |||
Cost of goods sold |
| $ | 35,055 |
| $ | 30,895 |
| $ | 4,160 |
|
Cost of goods sold increased $4.2 billion to $35.1 billion for 2018 compared to $30.9 billion for 2017 primarily as a result of higher material, overhead and direct labour costs associated with the increase in sales. In addition, cost of goods sold increased due to:
· a $545 million net increase in reported U.S. dollar cost of goods sold primarily due to the strengthening of the Canadian dollar and Chinese renminbi each against the U.S. dollar partially offset by the weakening of the Turkish lira, Brazilian real, and Russian ruble, each against the U.S. dollar;
· higher launch costs;
· higher spending associated with electrification and autonomy;
· higher warranty costs of $47 million; and
· higher pre-operating costs incurred at new facilities.
DEPRECIATION AND AMORTIZATION
Depreciation and amortization costs increased $94 million to $1.28 billion for 2018 compared to $1.18 billion for 2017. The higher depreciation and amortization was primarily a result of increased capital deployed mainly to support the launch of new programs during or subsequent to 2017 and a $20 million net increase in reported U.S. dollar depreciation and amortization mainly due to the strengthening of the euro against the U.S. dollar. These factors were partially offset by lower depreciation on assets classified as held for sale which, as of September 2018, are no longer being amortized.
SELLING, GENERAL AND ADMINISTRATIVE [“SG&A”]
SG&A expense as a percentage of sales was 4.1% for 2018 compared to 4.6% for 2017. SG&A expense decreased $4 million to $1,664 million for 2018 compared to $1,668 million for 2017. The 0.5% decrease in SG&A expense as a percentage of sales was primarily due to an increase in sales in our Complete Vehicles segment which has a lower SG&A expense as a percentage of sales than our consolidated average. The $4 million decrease in SG&A expense was primarily due to:
· foreign exchange gains in 2018 compared to foreign exchange losses in 2017;
· a favourable settlement reached during 2018 relating to the acquisition of Getrag; and
· lower costs to support our global compliance programs as a result of the substantial completion of our global review focused on antitrust risk.
These factors were partially offset by:
· higher labour and benefit costs;
· increased costs incurred at new facilities;
· spending associated with research & development;
· a $16 million net increase in the reported U.S. dollar SG&A expense primarily due to the strengthening of the euro against the U.S. dollar partially offset by the weakening of the Turkish lira and Brazilian real each against the U.S. dollar; and
· a reduction in an indemnity receivable related to the acquisition of Getrag as a result of the favourable change in the reserve for uncertain tax provisions at a certain equity accounted Power & Vision facility.
INTEREST EXPENSE, NET
During 2018, we recorded net interest expense of $93 million compared to $70 million for 2017. The $23 million increase is primarily as a result of higher interest expense due to the increase in borrowings and higher average interest rates partially offset by higher interest income.
EQUITY INCOME
Equity income increased $24 million to $277 million for 2018 compared to $253 million for 2017, primarily due to:
· net favourable commercial settlements during 2018 at certain Power & Vision facilities;
· lower warranty costs at certain Power & Vision facilities;
· a $6 million increase due to an acquisition in the fourth quarter of 2017; and
· a $4 million net increase in reported U.S. dollar equity income mainly due to the strengthening of the Chinese renminbi and euro, both against the U.S. dollar.
These factors were partially offset by reduced earnings due to lower sales at our Power & Vision facilities and by higher pre-operating costs incurred at a new Power & Vision facility, which is accounted for under the equity method.
OTHER EXPENSE, NET
During the years ended December 31, 2018 and 2017, we recorded other expense, net items as follows:
|
| 2018 |
| 2017 |
| ||||||||||||||
|
|
|
| Net Income |
| Diluted |
|
|
| Net Income |
| Diluted |
| ||||||
|
| Operating |
| Attributable |
| Earnings |
| Operating |
| Attributable |
| Earnings |
| ||||||
|
| Income |
| to Magna |
| per Share |
| Income |
| to Magna |
| per Share |
| ||||||
|
|
|
|
|
|
|
|
|
|
|
|
|
| ||||||
Impairment of investment (1) |
| $ | 60 |
| $ | 59 |
| $ | 0.17 |
| $ | 17 |
| $ | 17 |
| $ | 0.05 |
|
Restructuring (2) |
| 45 |
| 43 |
| 0.12 |
| 29 |
| 25 |
| 0.06 |
| ||||||
Impairment of long-lived assets (3) |
| 14 |
| 12 |
| 0.04 |
| 64 |
| 64 |
| 0.17 |
| ||||||
Unrealized gain on investment revaluation (4) |
| (56 | ) | (53 | ) | (0.15 | ) | — |
| — |
| — |
| ||||||
Gain on formation of a new venture (5) |
| — |
| — |
| — |
| (45 | ) | (34 | ) | (0.09 | ) | ||||||
Gain on sale of investment (6) |
| — |
| — |
| — |
| (26 | ) | (26 | ) | (0.07 | ) | ||||||
Other expense, net |
| $ | 63 |
| $ | 61 |
| $ | 0.18 |
| $ | 39 |
| $ | 46 |
| $ | 0.12 |
|
(1) Impairment of investment
During 2018, we recorded an impairment charge of $60 million [$59 million after tax] on our investment in Getrag Ford Transmission GmbH. The impairment reflects the expected further industry volume decline in manual transmissions, which make up substantially all of the volume production in the joint venture.
During 2017, we recorded an impairment charge of $17 million [$17 million after tax] on one of our equity method investments.
(2) Restructuring
During 2018, we recorded net restructuring charges of $25 million [$23 million after tax] related to certain Body Exteriors & Structures facilities and $20 million [$20 million after tax] related to certain Power & Vision facilities.
We recorded net restructuring charges during 2017 of $14 million [$14 million after tax] related to certain Power & Vision facilities and $15 million [$11 million after tax] for a certain Body Exteriors & Structures facility.
(3) Impairment of long-lived assets
During 2018, we recorded fixed asset impairment charges of $14 million [$12 million after tax] related to a certain Body Exteriors & Structures facility.
We recorded fixed asset impairment charges during 2017 of $64 million [$64 million after tax] related to two Body Exteriors & Structures facilities.
(4) Unrealized gain on investment revaluation
During 2018, we recorded an unrealized gain of $56 million [$53 million after tax] on the revaluation of our private equity investments.
(5) Gain on formation of a new venture
We formed a new venture in China with Hubei Aviation Precision Machinery Co., Ltd. during 2017. The transaction resulted in a gain of $45 million [$34 million after tax].
(6) Gain on sale of investment
Our investment in Argus Cyber Security Ltd. was sold during 2017 for proceeds of $33 million. A gain of $26 million [$26 million after tax] was recognized on the sale of the investment, which was accounted for under the cost method.
INCOME FROM OPERATIONS BEFORE INCOME TAXES
Income from operations before income taxes decreased $34 million to $2.95 billion for 2018 compared to $2.99 billion for 2017. This decrease is the result of a $4.2 billion increase in cost of sales, a $94 million increase in depreciation and amortization, a $24 million increase in other expense, net and a $23 million increase in interest expense, net partially offset by a $4.2 billion increase in sales, a $24 million increase in equity income and a $4 million decrease in SG&A, each as discussed above.
INCOME TAXES
|
| 2018 |
| 2017 |
| ||||||
|
|
|
|
|
|
|
|
|
| ||
Income Taxes as reported |
| $ | 619 |
| 21.0 | % | $ | 741 |
| 24.8 | % |
Reassessment of Deferred Tax Balances |
| 21 |
| 0.7 |
| — |
| — |
| ||
Adjustments to Valuation Allowance |
| 17 |
| 0.6 |
| — |
| — |
| ||
Tax effect on Other expense, net |
| 2 |
| (0.4 | ) | (7 | ) | (0.6 | ) | ||
US Tax Reform |
| (11 | ) | (0.4 | ) | 23 |
| 0.8 |
| ||
|
| $ | 648 |
| 21.5 | % | $ | 757 |
| 25.0 | % |
In the third quarter of 2018, we entered into an agreement to sell our global Fluid Pressure & Controls [“FP&C”] business to Hanon Systems. We reassessed our positions in deferred taxes in anticipation of closing the FP&C transaction in 2019, recognizing a $21 million net reduction in deferred tax expense [“Reassessment of Deferred Tax Balances”].
During 2018 we released a portion of our valuation allowance against our deferred tax assets in India. The valuation allowance was required due to historical losses and uncertainty as to the timing of when we would be able to generate the necessary level of earnings to recover these deferred tax assets. Over the past few years, some of our operations in India have delivered sustained profits which, together with forecasted profits have allowed us to release the valuation allowance set up against the India deferred tax assets. The effect of the valuation allowance release is a reduction in income tax expense of $17 million [“Adjustments to Valuation Allowance”].
The Reassessment of Deferred Tax Balances and the Adjustments to Valuation Allowance [the “Deferred Tax Adjustments”] totalled $38 million in 2018.
On December 22, 2017, the United States enacted the Tax Cuts and Jobs Act [the “US Tax Reform”], which reduced the U.S. federal corporate tax rate from 35% to 21% beginning in 2018, required companies to pay a one-time transition tax on earnings of certain foreign subsidiaries that were previously tax deferred and created new taxes on certain foreign-sourced earnings. At December 31, 2017, we made a reasonable estimate of its effects on our deferred tax balances and the one-time transition tax, recognizing a provisional $23 million net reduction in income tax expense. At December 31, 2018, we have completed our analysis of the impact of the US Tax Reform and recorded a net increase in income tax expense of $11 million.
Excluding Other expense, net, after tax, the Deferred Tax Adjustments and the effects of US Tax Reform, the effective income tax rate decreased to 21.5% for 2018 compared to 25.0% for 2017 primarily due to a reduction in the U.S. federal statutory rate beginning in 2018 as a result of the tax reform in the U.S. Other items lowering the effective tax rate include a change in our reserves for uncertain tax positions and a decrease in losses not benefited in Europe. These factors were partially offset by higher accrued tax on undistributed foreign earnings.
INCOME ATTRIBUTABLE TO NON-CONTROLLING INTERESTS
Income attributable to non-controlling interests decreased $12 million to $36 million for 2018 compared to $48 million for 2017 primarily due to deceased profits at certain Body Exteriors & Structures operations partially offset by increased profits at a Power & Vision operation.
NET INCOME ATTRIBUTABLE TO MAGNA INTERNATIONAL INC.
Net income attributable to Magna International Inc. increased $100 million to $2.3 billion for 2018 compared to $2.2 billion for 2017, as a result of a decrease in income taxes of $122 million and a decrease in income attributable to non-controlling interests of $12 million partially offset by a decrease in income from operations before income taxes of $34 million, each as discussed above.
EARNINGS PER SHARE
|
| 2018 |
| 2017 |
| Change |
| |||
|
|
|
|
|
|
|
| |||
Earnings per Common Share |
|
|
|
|
|
|
| |||
Basic |
| $ | 6.65 |
| $ | 5.91 |
| + | 13 | % |
Diluted |
| $ | 6.61 |
| $ | 5.87 |
| + | 13 | % |
|
|
|
|
|
|
|
|
| ||
Weighted average number of Common Shares outstanding (millions) |
|
|
|
|
|
|
|
| ||
Basic |
| 345.4 |
| 371.8 |
| - | 7 | % | ||
Diluted |
| 347.5 |
| 373.9 |
| - | 7 | % | ||
|
|
|
|
|
|
|
|
| ||
Adjusted diluted earnings per share |
| $ | 6.71 |
| $ | 5.93 |
| + | 13 | % |
Diluted earnings per share increased $0.74 to $6.61 for 2018 compared to $5.87 for 2017 as a result of a decrease in the weighted average number of diluted shares outstanding during 2018 and the increase in net income attributable to Magna International Inc. as discussed above. The decrease in the weighted average number of diluted shares outstanding was primarily due to the purchase and cancellation of Common Shares, during or subsequent to 2017, pursuant to our normal course issuer bids.
Other expense, net, after tax, Deferred Tax Adjustments and US Tax Reform together negatively impacted diluted earnings per share by $0.10 in 2018 and negatively impacted diluted earnings per share by $0.06 in 2017, as discussed in the “Other expense, net” and “Income Taxes” sections.
Adjusted diluted earnings per share, as reconciled in the “Non-GAAP Financial Measures Reconciliation” section, increased $0.78 to $6.71 for 2018 compared to $5.93 for 2017.
NON-GAAP PERFORMANCE MEASURES - FOR THE YEAR ENDED DECEMBER 31, 2018
ADJUSTED EBIT AS A PERCENTAGE OF SALES
The table below shows the change in Magna’s Sales and Adjusted EBIT by segment and the impact each segment’s changes have on Magna’s Adjusted EBIT as a percentage of sales for 2018 compared to 2017:
|
|
|
|
|
| Adjusted EBIT |
| |||
|
|
|
| Adjusted |
| as a percentage |
| |||
|
| Sales |
| EBIT |
| of sales |
| |||
|
|
|
|
|
|
|
| |||
2017 |
| $ | 36,588 |
| $ | 3,094 |
| 8.5 | % | |
Increase (Decrease) related to: |
|
|
|
|
|
|
| |||
Body Exteriors & Structures |
| 914 |
| 52 |
| - | 0.1 | % | ||
Power & Vision |
| 692 |
| (15 | ) | - | 0.2 | % | ||
Seating Systems |
| 324 |
| (9 | ) | - | 0.1 | % | ||
Complete Vehicles |
| 2,471 |
| 2 |
| - | 0.5 | % | ||
Corporate and Other |
| (162 | ) | (17 | ) | — |
| |||
2018 |
| $ | 40,827 |
| $ | 3,107 |
| 7.6 | % | |
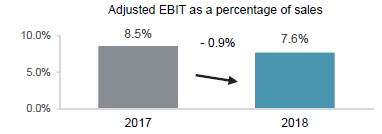
Adjusted EBIT as a percentage of sales decreased 0.9% to 7.6% for 2018 compared to 8.5% for 2017 primarily as a result of an increase in the proportion of sales generated in our Complete Vehicles segment relative to total sales, which have a lower margin than our consolidated average. The remaining 0.4% decrease in Adjusted EBIT as a percentage of sales was primarily due to:
· higher launch costs;
· higher spending associated with electrification, autonomy and research & development;
· higher pre-operating costs incurred at new facilities; and
· higher warranty costs.
These factors were partially offset by productivity and efficiency improvements at certain Body Exteriors & Structures facilities, foreign exchange gains in 2018 compared to foreign exchange losses in 2017 and generally higher margins on higher sales.
RETURN ON INVESTED CAPITAL
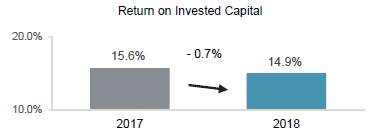
Return on Invested Capital decreased 0.7% to 14.9% for 2018 compared to 15.6% for 2017, primarily as a result of higher Average Invested Capital partially offset by an increase in After-tax operating profits.
Average Invested Capital increased $1.4 billion to $16.1 billion for 2018 compared to $14.7 billion for 2017 primarily due to:
· an increase in our investment in fixed assets to refurbish or replace assets consumed in the normal course of business and for manufacturing equipment for programs that will be launching subsequent to 2018;
· an increase in working capital;
· an increase in investments, including our investment in Lyft, Inc. [“Lyft”] equity during 2018; and
· the net strengthening of foreign currencies against the U.S. dollar.
After-tax operating profits increased primarily as a result of higher sales, lower income taxes, higher equity income and lower SG&A, partially offset by higher cost of goods sold, depreciation and amortization and an increase in Other expense, net.
RETURN ON EQUITY
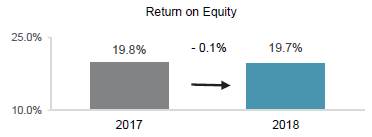
Return on Equity decreased 0.1% to 19.7% for 2018 compared to 19.8% for 2017. Return on Equity declined modestly as Average Shareholders’ Equity increased at a higher rate than the increase in net income attributable to Magna.
SEGMENT ANALYSIS
We are a global automotive supplier which has complete vehicle engineering and contract manufacturing expertise, as well as product capabilities including body, chassis, exterior, seating, powertrain, advanced driver assistance, electronics, vision, mechatronics and roof systems. Magna also has electronic and software capabilities across many of these areas.
Our business is managed under operating segments which have been determined on the basis of technological opportunities, product similarities, as well as market and operating factors. Our internal financial reporting is aligned with the way our business is managed. Accordingly, we report key internal operating performance measures for Body Exteriors & Structures, Power & Vision, Seating Systems, and Complete Vehicles for presentation to the chief operating decision maker to use in the assessment of operating performance, allocation of resources, and to help plan our long-term strategic direction and future global growth.
Our chief operating decision maker uses Adjusted EBIT as the measure of segment profit or loss, since we believe Adjusted EBIT is the most appropriate measure of operational profitability or loss for our reportable segments. Adjusted EBIT has been reconciled in the “Non-GAAP Financial Measures Reconciliation” section included in this MD&A.
|
| Sales |
| Adjusted EBIT |
| ||||||||||||||
|
| 2018 |
| 2017 |
| Change |
| 2018 |
| 2017 |
| Change |
| ||||||
|
|
|
|
|
|
|
|
|
|
|
|
|
| ||||||
Body Exteriors & |
|
|
|
|
|
|
|
|
|
|
|
|
| ||||||
Structures |
| $ | 17,527 |
| $ | 16,613 |
| $ | 914 |
| $ | 1,398 |
| $ | 1,346 |
| $ | 52 |
|
Power & Vision |
| 12,321 |
| 11,629 |
| 692 |
| 1,168 |
| 1,183 |
| (15 | ) | ||||||
Seating Systems |
| 5,548 |
| 5,224 |
| 324 |
| 425 |
| 434 |
| (9 | ) | ||||||
Complete Vehicles |
| 6,018 |
| 3,547 |
| 2,471 |
| 68 |
| 66 |
| 2 |
| ||||||
Corporate and Other |
| (587 | ) | (425 | ) | (162 | ) | 48 |
| 65 |
| (17 | ) | ||||||
Total reportable segments |
| $ | 40,827 |
| $ | 36,588 |
| $ | 4,239 |
| $ | 3,107 |
| $ | 3,094 |
| $ | 13 |
|
BODY EXTERIORS & STRUCTURES
|
| 2018 |
| 2017 |
| Change |
| ||||||
|
|
|
|
|
|
|
| ||||||
Sales |
| $ | 17,527 |
| $ | 16,613 |
| $ | 914 |
| + | 6 | % |
Adjusted EBIT |
| $ | 1,398 |
| $ | 1,346 |
| $ | 52 |
| + | 4 | % |
Adjusted EBIT as a percentage of sales |
| 8.0 | % | 8.1 | % |
|
| - | 0.1 | % | |||
Sales — Body Exteriors & Structures
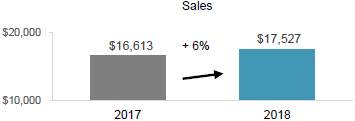
Sales for Body Exteriors & Structures increased 6% or $914 million to $17.5 billion for 2018 compared to $16.6 billion for 2017, primarily as a result of:
· the launch of new programs during or subsequent to 2017, including the:
· Jeep Cherokee;
· Chevrolet Equinox and GMC Terrain;
· Jeep Wrangler; and
· Ford Expedition and Lincoln Navigator; and
· a $157 million increase in reported U.S. dollar sales primarily as a result of the strengthening of the euro against the U.S. dollar partially offset by the weakening of the Brazilian real and Russian ruble, each against the U.S. dollar.
These factors were partially offset by:
· the impact of a change in production volumes on various other programs; and
· net customer price concessions subsequent to 2017.
Adjusted EBIT — Body Exteriors & Structures
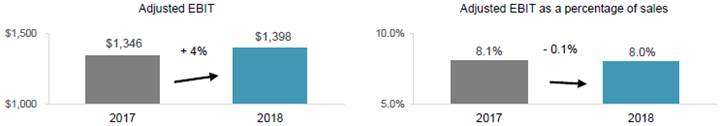
Adjusted EBIT for Body Exteriors & Structures increased $52 million to $1.40 billion for 2018 compared to $1.35 billion for 2017 primarily as a result of:
· earnings on higher sales;
· productivity and efficiency improvements, including at certain previously underperforming facilities;
· favourable customer pricing resolutions in 2018;
· foreign exchange gains in 2018 compared to foreign exchange losses in 2017;
· higher scrap steel recoveries in excess of higher net commodity costs; and
· a $4 million increase in reported U.S. dollar Adjusted EBIT as a result of the strengthening of certain foreign currencies against the U.S. dollar including the euro, Canadian dollar and Chinese renminbi partially offset by the weakening of the Russian ruble against the U.S. dollar.
These factors were partially offset by:
· higher launch costs;
· inefficiencies at a plant we are closing;
· higher depreciation and amortization; and
· net customer price concessions subsequent to 2017.
Adjusted EBIT as a percentage of sales for Body Exteriors & Structures decreased 0.1% to 8.0% for 2018 compared to 8.1% for 2017 primarily as a result of:
· higher launch costs;
· inefficiencies at a plant we are closing; and
· higher depreciation and amortization.
These factors were partially offset by:
· productivity and efficiency improvements at certain facilities;
· favourable customer pricing resolutions in 2018;
· foreign exchange gains in 2018 compared to foreign exchange losses in 2017; and
· higher scrap steel recoveries in excess of higher net commodity costs.
POWER & VISION
|
| 2018 |
| 2017 |
| Change |
| ||||||
|
|
|
|
|
|
|
| ||||||
Sales |
| $ | 12,321 |
| $ | 11,629 |
| $ | 692 |
| + | 6 | % |
Adjusted EBIT |
| $ | 1,168 |
| $ | 1,183 |
| $ | (15 | ) | - | 1 | % |
Adjusted EBIT as a percentage of sales |
| 9.5 | % | 10.2 | % |
|
| - | 0.7 | % | |||
Sales – Power & Vision
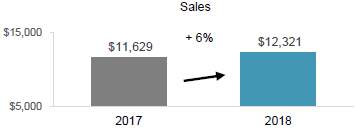
Sales for Power & Vision increased 6% or $692 million to $12.3 billion for 2018 compared to $11.6 billion for 2017, primarily as a result of:
· the launch of new programs during or subsequent to 2017, including the;
· GMC Sierra and Chevrolet Silverado;
· Chevrolet Traverse and Buick Enclave;
· BMW X3;
· Porsche Cayenne;
· Jeep Wrangler; and
· dual-clutch transmissions on various BMW and Daimler vehicles;
· a $249 million increase in reported U.S. dollar sales primarily as a result of the strengthening of the euro against the U.S. dollar; and
· net facility acquisitions subsequent to 2017 which positively impacted sales by $23 million.
These factors were partially offset by the impact of a change in production volumes on various other programs and net customer concessions subsequent to 2017.
Adjusted EBIT — Power & Vision
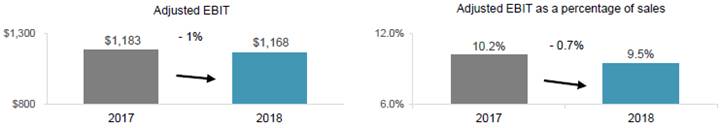
Adjusted EBIT for Power & Vision decreased $15 million to $1.17 billion for 2018 compared to $1.18 billion for 2017 primarily as a result of:
· higher spending associated with electrification and autonomy;
· higher warranty costs of $59 million;
· higher commodity costs;
· net favourable commercial settlements during 2017;
· higher launch costs; and
· net customer price concessions subsequent to 2017.
These factors were partially offset by:
· earnings on higher sales;
· foreign exchange gains in 2018 compared to losses in 2017;
· a favourable settlement reached during the first quarter of 2018 relating to the acquisition of Getrag;
· a $21 million increase in reported U.S. dollar Adjusted EBIT primarily due to the strengthening of the euro and Chinese renminbi, each against the U.S. dollar;
· lower employee profit sharing;
· higher equity income, excluding the impact of foreign exchange, of $13 million; and
· productivity and efficiency improvements.
Equity income, excluding the impact of foreign exchange, was $13 million higher due to net favourable commercial settlements during 2018 at a certain facility, lower warranty costs at certain facilities and a $4 million net increase in reported U.S. dollar equity income mainly due to the strengthening of the Chinese renminbi and euro, both against the U.S. dollar. These factors were partially offset by reduced earnings due to lower sales at certain facilities, higher pre-operating costs incurred at a new facility which is accounted for under the equity method, and a write-down of inventory and receivables relating to one customer at a certain facility.
Adjusted EBIT as a percentage of sales for Power & Vision decreased 0.7% to 9.5% for 2018 compared to 10.2% for 2017 primarily as a result of:
· higher spending associated with electrification and autonomy;
· higher warranty costs;
· higher commodity costs;
· net favourable commercial settlements during 2017; and
· higher launch costs.
These factors were partially offset by:
· foreign exchange gains in 2018 compared to losses in 2017;
· a favourable settlement reached during the first quarter of 2018 relating to the acquisition of Getrag;
· lower employee profit sharing; and
· higher equity income.
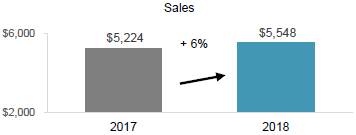
SEATING SYSTEMS
|
| 2018 |
| 2017 |
| Change |
| ||||||
|
|
|
|
|
|
|
|
|
|
|
|
|
|
Sales |
| $ | 5,548 |
| $ | 5,224 |
| $ | 324 |
| + | 6 | % |
Adjusted EBIT |
| $ | 425 |
| $ | 434 |
| $ | (9 | ) | - | 2 | % |
Adjusted EBIT as a percentage of sales |
| 7.7 | % | 8.3 | % |
|
| - | 0.6 | % | |||
Sales — Seating Systems
Sales in Seating Systems increased 6% or $324 million to $5.5 billion for 2018 compared to $5.2 billion for 2017, primarily as a result of:
· the launch of new programs during or subsequent to 2017, including the;
· Ford Expedition and Lincoln Navigator;
· BMW X5;
· Lynk & Co. 01 and 02; and
· Chevrolet Traverse and Buick Enclave.
These factors were partially offset by:
· the end of production on certain programs;
· a facility divestiture subsequent to 2017 which negatively impacted sales by $49 million;
· the impact of a change in production volumes on various other programs;
· a $34 million decrease in reported U.S. dollar sales as a result of the weakening of certain foreign currencies against the U.S. dollar, including the Turkish lira and Brazil real partially offset by the strengthening of the euro against the U.S. dollar; and
· net customer price concessions subsequent to 2017.
Adjusted EBIT — Seating Systems
Adjusted EBIT for Seating Systems decreased $9 million to $425 million for 2018 compared to $434 million for 2017 primarily as a result of higher pre-operating costs incurred at new facilities, higher commodity costs and net customer price concessions subsequent to 2017.
These factors were partially offset by higher foreign exchange gains in 2018 compared to losses in 2017, earnings on higher sales, lower launch costs, higher equity income of $5 million primarily due to an acquisition in the fourth quarter of 2017 and productivity and efficiency improvements.
Adjusted EBIT as a percentage of sales for Seating Systems decreased 0.6% to 7.7% for 2018 compared to 8.3% for 2017 primarily as a result of higher pre-operating costs incurred at new facilities partially offset by higher foreign exchange gains in 2018 compared to losses in 2017.
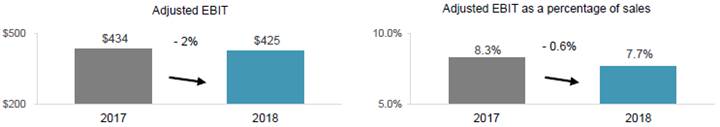
COMPLETE VEHICLES
|
| 2018 |
| 2017 |
| Change |
| ||||||
|
|
|
|
|
|
|
| ||||||
Complete Vehicle Assembly Volumes (thousands of units)(i) |
| 144.6 |
| 77.9 |
| 66.7 |
| + | 86 | % | |||
Sales |
| $ | 6,018 |
| $ | 3,547 |
| $ | 2,471 |
| + | 70 | % |
Adjusted EBIT |
| $ | 68 |
| $ | 66 |
| $ | 2 |
| + | 3 | % |
Adjusted EBIT as a percentage of sales |
| 1.1 | % | 1.9 | % |
|
| - | 0.8 | % | |||
(i) Vehicles produced at our Complete Vehicle operations are included in Europe Light Vehicle Production volumes.
Sales — Complete Vehicles
Sales increased 70% or $2.5 billion to $6.0 billion for 2018 compared to $3.5 billion for 2017 and assembly volumes increased 86% or 66.7 thousand units.
The increase in Complete Vehicle sales is primarily due to:
· the launch of the Jaguar E-Pace program which started production during the third quarter of 2017;
· the launch of the Jaguar I-Pace program which started production during the first quarter of 2018;
· the launch of the BMW 5-Series which started production during the first quarter of 2017; and
· a $250 million increase in reported U.S. dollar sales as a result of the strengthening of the euro against the U.S. dollar.
Adjusted EBIT — Complete Vehicles
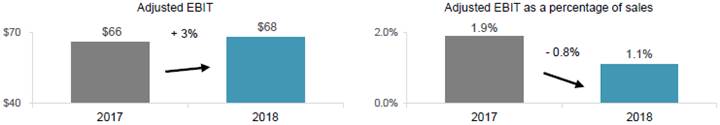
Adjusted EBIT for Complete Vehicles increased $2 million to $68 million for 2018 compared to $66 million for 2017 primarily as a result of:
· earnings on higher sales of the Jaguar E-Pace and I-Pace;
· earnings on higher sales of the BMW 5-Series; and
· a lower amount of employee profit sharing.
These factors were partially offset by:
· higher launch and other costs relating to the Mercedes-Benz G-Class and Jaguar I-Pace partially offset by lower launch costs relating to the Jaguar E-Pace;
· reduced earnings from higher depreciation and amortization and lower sales as a result of the launch of the new Mercedes-Benz G-Class;
· a favourable customer pricing resolution in 2017;
· higher pre-operating costs incurred at a new facility; and
· spending associated with research & development.
Adjusted EBIT as a percentage of sales for Complete Vehicles decreased 0.8% to 1.1% for 2018 compared to 1.9% for 2017 primarily as a result of higher launch and other costs relating to the Mercedes-Benz G-Class and Jaguar I-Pace partially offset by lower launch cost relating to the Jaguar E-Pace and reduced earnings from higher depreciation and amortization and lower sales as a result of the launch of the new Mercedes-Benz G-Class.
CORPORATE AND OTHER
Adjusted EBIT in Corporate and Other decreased $17 million to $48 million for 2018 compared to $65 million for 2017, primarily due to spending associated with corporate research & development, higher incentive compensation and a $4 million unfavourable impact of foreign exchange gains in 2017 related to the re-measurement of net deferred tax assets that are maintained in a currency other than their functional currency partially offset by lower costs to support our global compliance programs as a result of the substantial completion of our global review focused on antitrust risk.
FINANCIAL CONDITION, LIQUIDITY AND CAPITAL RESOURCES
CASH FLOW FROM OPERATIONS
|
| 2018 |
| 2017 |
| Change |
| |||
|
|
|
|
|
|
|
| |||
Net income |
| $ | 2,332 |
| $ | 2,244 |
|
|
| |
Items not involving current cash flows |
| 1,539 |
| 1,315 |
|
|
| |||
|
| 3,871 |
| 3,559 |
| $ | 312 |
| ||
Changes in operating assets and liabilities |
| (153 | ) | (213 | ) | 60 |
| |||
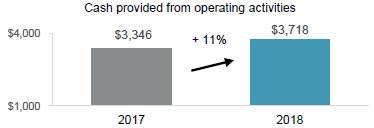
Cash provided from operating activities |
| $ | 3,718 |
| $ | 3,346 |
| $ | 372 |
|
Cash provided from operating activities
Cash provided from operating activities increased $372 million for 2018 compared to 2017 primarily as a result of:
· a $4.2 billion increase in cash received from customers;
· a $127 million decrease in cash paid for taxes; and
· higher dividends received from equity method investments of $55 million.
These factors were partially offset by:
· a $3.4 billion increase in cash paid for material and overhead;
· a $520 million increase in cash paid for labour; and
· higher net interest expense of $22 million as discussed in the Interest Expense, net section above.
Changes in operating assets and liabilities
Cash used in operating assets and liabilities amounted to $153 million in 2018. The net use of cash was primarily as a result of:
· a $351 million increase in accounts receivable mainly due to higher sales related to the launch of new programs during or subsequent to 2017;
· a $92 million increase in inventories mainly due to higher production and engineering inventory to support launch activities partially offset by lower tooling inventory; and
· an $86 million decrease in income taxes payable relating to payments in excess of taxes provided for.
These factors were partially offset by a $265 million increase in accounts payable primarily relating to higher sales and a $105 million increase in other accrued liabilities mainly related to higher tooling and engineering deferred revenue.
CAPITAL AND INVESTING SPENDING

|
| 2018 |
| 2017 |
| Change |
| |||
|
|
|
|
|
|
|
| |||
Fixed asset additions |
| $ | (1,650 | ) | $ | (1,875 | ) |
|
| |
Investments, other assets and intangible assets |
| (481 | ) | (651 | ) |
|
| |||
Fixed assets, investments, other assets and intangible assets additions |
| (2,131 | ) | (2,526 | ) |
|
| |||
Investment in Lyft |
| (220 | ) | — |
|
|
| |||
Acquisitions |
| (148 | ) | — |
|
|
| |||
Proceeds from disposition |
| 223 |
| 332 |
|
|
| |||
Proceeds on disposal of facilities |
| — |
| 49 |
|
|
| |||
Cash used for investing activities |
| $ | (2,276 | ) | $ | (2,145 | ) | $ | (131 | ) |
Fixed assets, investments, other assets and intangible assets additions
In 2018, we invested $1.7 billion in fixed assets. While investments were made to refurbish or replace assets consumed in the normal course of business and for productivity improvements, a large portion of the investment in 2018 was for manufacturing equipment and buildings for programs that launched during 2018 or will be launching subsequent to 2018. In addition, we invested $412 million in other assets related primarily to fully reimbursable tooling, planning, and engineering costs for programs that launched during 2018 or will be launching subsequent to 2018, and we invested a further $69 million in investments, primarily related to equity method investments.
Investment in Lyft
During 2018, we invested $200 million in Lyft as part of a multi-year collaboration with Lyft to jointly develop and manufacture self-driving systems. In addition, we purchased $20 million in Lyft shares for an equity compensation program for certain employees working on the development of self-driving systems.
Acquisitions
During 2018, we acquired 100% of the equity interest in OLSA S.p.A. [“OLSA”], a global company which designs, engineers and manufactures tail lamps and other lighting products for cash consideration of $152 million.
Proceeds from disposition
In 2018, the $223 million of proceeds related to normal course fixed and other asset disposals.
FINANCING
|
| 2018 |
| 2017 |
| Change |
| |||
|
|
|
|
|
|
|
| |||
Issues of debt |
| $ | 172 |
| $ | 752 |
|
|
| |
Increase (Decrease) in short-term borrowings |
| 866 |
| (530 | ) |
|
| |||
Repayments of debt |
| (171 | ) | (110 | ) |
|
| |||
Issue of Common Shares on exercise of stock options |
| 50 |
| 44 |
|
|
| |||
Repurchase of Common Shares |
| (1,831 | ) | (1,271 | ) |
|
| |||
Shares repurchased for tax withholdings on vesting of equity awards |
| (16 | ) | (11 | ) |
|
| |||
Contributions to subsidiaries by non-controlling interests |
| 4 |
| 10 |
|
|
| |||
Dividends paid to non-controlling interest |
| (69 | ) | (38 | ) |
|
| |||
Dividends paid |
| (448 | ) | (400 | ) |
|
| |||
Cash used for financing activities |
| $ | (1,443 | ) | $ | (1,554 | ) | $ | 111 |
|
The increase in short-term borrowings relates primarily to a $833 million increase in the U.S. Program during 2018.
Repurchases of Common Shares during 2018 are related to 32.6 million Common Shares repurchased for aggregate cash consideration of $1.8 billion.
Cash dividends paid per Common Share were $1.32 for 2018, for a total of $448 million compared to cash dividends paid per Common Share of $1.10 for 2017, for a total of $400 million.
FINANCING RESOURCES
|
| As at |
| As at |
|
|
| |||
|
| December 31, |
| December 31, |
|
|
| |||
|
| 2018 |
| 2017 |
| Change |
| |||
|
|
|
|
|
|
|
| |||
Liabilities |
|
|
|
|
|
|
| |||
Short-term borrowings |
| $ | 1,098 |
| $ | 259 |
|
|
| |
Long-term debt due within one year |
| 201 |
| 108 |
|
|
| |||
Long-term debt |
| 3,084 |
| 3,195 |
|
|
| |||
|
| 4,383 |
| 3,562 |
| $ | 821 |
| ||
Non-controlling interests |
| 458 |
| 502 |
| (44 | ) | |||
Shareholders’ equity |
| 10,701 |
| 11,210 |
| (509 | ) | |||
Total capitalization |
| $ | 15,542 |
| $ | 15,274 |
| $ | 268 |
|
Total capitalization increased by $268 million to $15.54 billion as at December 31, 2018 compared to $15.27 billion at December 31, 2017, primarily as a result of a $821 million increase in liabilities partially offset by a $509 million decrease in shareholders’ equity and a $44 million decrease in non-controlling interests.
The increase in liabilities relates primarily to a $833 million increase in the U.S. Program during 2018.
The decrease in non-controlling interest was primarily as a result of dividends paid during 2018 partially offset by income attributable to non-controlling interests in 2018.
The decrease in shareholders’ equity was primarily as a result of:
· the $1.8 billion repurchase and cancellation of 32.6 million Common Shares during 2018;
· a $490 million net unrealized loss on translation of our net investment in foreign operations whose functional currency is not U.S. dollars;
· the $448 million of dividends paid during 2018; and
· a $106 million net unrealized loss on cash flow hedges.
These factors were partially offset by $2.3 billion of net income earned in 2018.
CASH RESOURCES
During 2018, our cash resources including restricted cash equivalents decreased by $37 million to $802 million primarily as a result of the cash used for investing and financing activities partially offset by the cash provided from operating activities, as discussed above. In addition to our cash resources at December 31, 2018, we had term and operating lines of credit totalling $3.3 billion, of which $2.0 billion was unused and available.
The Company maintains a revolving credit facility of $2.75 billion with a maturity date of June 22, 2023. The facility includes a $200 million Asian tranche, a $100 million Mexican tranche and a tranche for Canada, U.S. and Europe, which is fully transferable between jurisdictions and can be drawn in U.S. dollars, Canadian dollars or euros.
MAXIMUM NUMBER OF SHARES ISSUABLE
The following table presents the maximum number of shares that would be outstanding if all of the outstanding options at March 7, 2019 were exercised:
Common Shares |
| 324,634,866 |
|
Stock options (i) |
| 9,410,640 |
|
|
| 334,045,506 |
|
(i) Options to purchase Common Shares are exercisable by the holder in accordance with the vesting provisions and upon payment of the exercise price as may be determined from time to time pursuant to our stock option plans.
CONTRACTUAL OBLIGATIONS AND OFF-BALANCE SHEET FINANCING
A purchase obligation is defined as an agreement to purchase goods or services that is enforceable and legally binding on us and that specifies all significant terms, including: fixed or minimum quantities to be purchased; fixed, minimum or variable price provisions; and the approximate timing of the transaction. Consistent with our customer obligations, substantially all of our purchases are made under purchase orders with our suppliers which are requirements based and accordingly do not specify minimum quantities. Other long-term liabilities are defined as long-term liabilities that are recorded on our consolidated balance sheet. Based on this definition, the following table includes only those contracts which include fixed or minimum obligations.
At December 31, 2018, we had contractual obligations requiring annual payments as follows:
|
|
|
| 2020- |
| 2022- |
|
|
|
|
| |||||
|
| 2019 |
| 2021 |
| 2023 |
| Thereafter |
| Total |
| |||||
|
|
|
|
|
|
|
|
|
|
|
| |||||
Operating leases |
| $ | 310 |
| $ | 537 |
| $ | 429 |
| $ | 714 |
| $ | 1,990 |
|
Long-term debt |
| 201 |
| 59 |
| 946 |
| 2,079 |
| 3,285 |
| |||||
Unconditional purchase obligations: |
|
|
|
|
|
|
|
|
|
|
| |||||
Materials and services |
| 2,985 |
| 1,269 |
| 791 |
| 324 |
| 5,369 |
| |||||
Capital |
| 1,019 |
| 174 |
| 44 |
| 6 |
| 1,243 |
| |||||
Total contractual obligations |
| $ | 4,515 |
| $ | 2,039 |
| $ | 2,210 |
| $ | 3,123 |
| $ | 11,887 |
|
Our unfunded obligations with respect to employee future benefit plans, which have been actuarially determined, were $650 million at December 31, 2018. These obligations are as follows:
|
|
|
|
|
| Termination and |
|
|
| ||||
|
| Pension |
| Retirement |
| Long Service |
|
|
| ||||
|
| Liability |
| Liability |
| Arrangements |
| Total |
| ||||
|
|
|
|
|
|
|
|
|
| ||||
Projected benefit obligation |
| $ | 633 |
| $ | 29 |
| $ | 394 |
| $ | 1,056 |
|
Less plan assets |
| (406 | ) | — |
| — |
| (406 | ) | ||||
Unfunded amount |
| $ | 227 |
| $ | 29 |
| $ | 394 |
| $ | 650 |
|
Our off-balance sheet financing arrangements are limited to operating lease contracts.
We have facilities that are subject to operating leases. Operating lease payments in 2018 for facilities were $286 million. Operating lease commitments in 2019 for facilities are expected to be $262 million. A majority of our existing lease agreements generally provide for periodic rent escalations based either on fixed-rate step increases, or on the basis of a consumer price index adjustment (subject to certain caps).
We also have operating lease commitments for equipment. These leases are generally of shorter duration. Operating lease payments for equipment were $75 million for 2018 and are expected to be $48 million in 2019.
Although our consolidated contractual annual lease commitments decline year by year, we expect that existing leases will either be renewed or replaced, or alternatively, we will incur capital expenditures to acquire equivalent capacity.
Foreign Currency Activities
Our North American operations negotiate sales contracts with OEMs for payment in both U.S. and Canadian dollars. Materials and equipment are purchased in various currencies depending upon competitive factors, including relative currency values. Our North American operations use labour and materials which are paid for in both U.S. and Canadian dollars. Our Mexican operations generally use the U.S. dollar as the functional currency.
Our European operations negotiate sales contracts with OEMs for payment principally in euros and British pounds. The European operations’ material, equipment and labour are paid for principally in euros and British pounds.
We employ hedging programs, primarily through the use of foreign exchange forward contracts, in an effort to manage our foreign exchange exposure, which arises when manufacturing facilities have committed to the delivery of products for which the selling price has been quoted in foreign currencies. These commitments represent our contractual obligations to deliver products over the duration of the product programs, which can last a number of years. The amount and timing of the forward contracts will be dependent upon a number of factors, including anticipated production delivery schedules and anticipated production costs, which may be paid in the foreign currency. In addition, we enter into foreign exchange contracts to manage foreign exchange exposure with respect to internal funding arrangements. Despite these measures, significant long-term fluctuations in relative currency values, in particular a significant change in the relative values of the U.S. dollar, Canadian dollar, euro or Chinese renminbi, could have an adverse effect on our profitability and financial condition (as discussed throughout this MD&A).
NON-GAAP FINANCIAL MEASURES RECONCILIATION
ADJUSTED EBIT
Adjusted EBIT is discussed in the “Segment Analysis” section. The following table reconciles net income to Adjusted EBIT:
|
| 2018 |
| 2017 |
| ||
|
|
|
|
|
| ||
Net Income |
| $ | 2,332 |
| $ | 2,244 |
|
Add: |
|
|
|
|
| ||
Interest Expense, net |
| 93 |
| 70 |
| ||
Other expense, net |
| 63 |
| 39 |
| ||
Income Taxes |
| 619 |
| 741 |
| ||
Adjusted EBIT |
| $ | 3,107 |
| $ | 3,094 |
|
ADJUSTED EBIT AS A PERCENTAGE OF SALES
Adjusted EBIT as a percentage of sales is discussed in the “Non-GAAP Performance Measures” section and is calculated in the table below:
|
| 2018 |
| 2017 |
| ||
|
|
|
|
|
| ||
Sales |
| $ | 40,827 |
| $ | 36,588 |
|
Adjusted EBIT |
| $ | 3,107 |
| $ | 3,094 |
|
Adjusted EBIT as a percentage of sales |
| 7.6 | % | 8.5 | % | ||
ADJUSTED DILUTED EARNINGS PER SHARE
Adjusted diluted earnings per share has been discussed in the “Earnings per Share” section. The following table reconciles net income attributable to Magna International Inc. to Adjusted diluted earnings per share:
|
| 2018 |
| 2017 |
| ||
|
|
|
|
|
| ||
Net income attributable to Magna International Inc. |
| $ | 2,296 |
| $ | 2,196 |
|
Add: |
|
|
|
|
| ||
Other expense, net |
| 63 |
| 39 |
| ||
Tax effect on Other expense, net |
| (2 | ) | 7 |
| ||
Deferred Tax Adjustments |
| (38 | ) | — |
| ||
US Tax Reform |
| 11 |
| (23 | ) | ||
Adjusted net income attributable to Magna International Inc. |
| 2,330 |
| 2,219 |
| ||
Diluted weighted average number of Common Shares outstanding during the period (millions) |
| 347.5 |
| 373.9 |
| ||
Adjusted diluted earnings per share |
| $ | 6.71 |
| $ | 5.93 |
|
RETURN ON INVESTED CAPITAL
Return on Invested Capital is discussed in the “Non-GAAP Performance Measures” section. Return on Invested Capital is calculated as After-tax operating profits divided by Average Invested Capital (Invested Capital is averaged on a five-fiscal quarter basis) for the period.
After-tax operating profits is calculated in the table below:
|
| 2018 |
| 2017 |
| ||
|
|
|
|
|
| ||
Net Income |
| $ | 2,332 |
| $ | 2,244 |
|
Add: |
|
|
|
|
| ||
Interest Expense, net |
| 93 |
| 70 |
| ||
Income taxes on Interest Expense, net at Magna’s effective income tax rate: |
| (20 | ) | (17 | ) | ||
After-tax operating profits |
| $ | 2,405 |
| $ | 2,297 |
|
Invested Capital is calculated in the table below:
|
| 2018 |
| 2017 |
| ||
|
|
|
|
|
| ||
Total Assets |
| $ | 25,945 |
| $ | 25,468 |
|
Excluding: |
|
|
|
|
| ||
Cash and cash equivalents |
| (684 | ) | (726 | ) | ||
Deferred tax assets |
| (300 | ) | (238 | ) | ||
Less Current Liabilities |
| (10,304 | ) | (9,243 | ) | ||
Excluding: |
|
|
|
|
| ||
Short-term borrowings |
| 1,098 |
| 259 |
| ||
Long-term debt due within one year |
| 201 |
| 108 |
| ||
Invested Capital |
| $ | 15,956 |
| $ | 15,628 |
|
Return on Invested Capital is calculated in the table below:
|
| As at December 31, |
| ||||
|
| 2018 |
| 2017 |
| ||
|
|
|
|
|
| ||
After-tax operating profits |
| $ | 2,405 |
| $ | 2,297 |
|
Average Invested Capital |
| $ | 16,095 |
| $ | 14,687 |
|
Return on Invested Capital |
| 14.9 | % | 15.6 | % | ||
RETURN ON EQUITY
Return on Equity is discussed in the “Non-GAAP Performance Measures” section and is calculated in the table below:
|
| 2018 |
| 2017 |
| ||
|
|
|
|
|
| ||
Net income attributable to Magna International Inc. |
| $ | 2,296 |
| $ | 2,196 |
|
Average Shareholders’ Equity |
| $ | 11,663 |
| $ | 11,078 |
|
Return on Equity |
| 19.7 | % | 19.8 | % | ||
SIGNIFICANT ACCOUNTING POLICIES AND CRITICAL ACCOUNTING ESTIMATES
Our significant accounting policies are more fully described in Note 1, “Significant Accounting Policies”, to the consolidated financial statements included in this Report. The preparation of the audited consolidated financial statements requires management to make estimates and assumptions that affect the reported amounts of assets, liabilities, revenues and expenses and the related disclosure of contingent assets and liabilities, as of the date of the consolidated financial statements. These estimates and assumptions are based on our historical experience, and various other assumptions we believe to be reasonable in the circumstances. Since these estimates and assumptions are subject to an inherent degree of uncertainty, actual results in these areas may differ significantly from our estimates.
We believe the following critical accounting policies and estimates affect the more subjective or complex judgements and estimates used in the preparation of our consolidated financial statements and accompanying notes. Management has discussed the development and selection of the following critical accounting policies with the Audit Committee of the Board of Directors, and the Audit Committee has reviewed our disclosure relating to critical accounting policies in this MD&A.
GOODWILL AND OTHER LONG-LIVED ASSETS - IMPAIRMENT ASSESSMENTS
We review goodwill at the reporting unit level for impairment in the fourth quarter of each year or more frequently if events or changes in circumstances indicate that goodwill might be impaired. Goodwill impairment is assessed based on a comparison of the fair value of a reporting unit to the underlying carrying value of the reporting unit’s net assets, including goodwill. If a reporting unit’s carrying amount exceeds its fair value, an impairment is recognized based on that difference. The fair value of a reporting unit is determined using the estimated discounted future cash flows of the reporting unit.
In addition to our review of goodwill, we evaluate fixed assets and other long-lived assets for impairment whenever indicators of impairment exist. Indicators of impairment include the bankruptcy of a significant customer or the early termination, loss, renegotiation of the terms of, or delay in the implementation of, any significant production contract. If the sum of the future cash flows expected to result from the asset, undiscounted and without interest charges, is less than the reported value of the asset, an asset impairment would be recognized in the consolidated financial statements. The amount of impairment to be recognized is calculated by subtracting the fair value of the asset from the reported value of the asset.
We believe that accounting estimates related to goodwill and long-lived asset impairment assessments are “critical accounting estimates” because: (i) they are subject to significant measurement uncertainty and are susceptible to change as management is required to make forward-looking assumptions regarding the impact of improvement plans on current operations, in-sourcing and other new business opportunities, program pricing and cost assumptions on current and future business, the timing of new program launches and future forecasted production volumes; and (ii) any resulting impairment loss could have a material impact on our consolidated net income and on the amount of assets reported in our consolidated balance sheet.
EQUITY METHOD INVESTMENTS — IMPAIRMENT ASSESSMENT
As of December 31, 2018, and 2017, we had equity method investments of $1.9 billion and $2.02 billion, respectively. We monitor our investments for indicators of other-than-temporary declines in value on an ongoing basis in accordance with U.S. GAAP. If we determine that an other-than-temporary decline in value has occurred, we recognize an impairment loss, which is measured as the difference between the recorded book value and the fair value of the investment. Fair value is generally determined using an income approach based on discounted cash flows. A deterioration in the operating results of our non-consolidated affiliates could result in the impairment of our investments.
REVENUE RECOGNITION — COMPLETE VEHICLE ASSEMBLY ARRANGEMENTS
Our complete vehicle assembly contracts with customers are complex and often include promises to transfer multiple products and services to a customer, some of which may be implicitly contracted for. As a result, significant interpretation and judgment is sometimes required to determine the appropriate accounting for these transactions including: (i) whether products and services are considered distinct performance obligations that should be accounted for separately or combined; (ii) developing an estimate of the stand-alone selling price of each distinct performance obligation; and (iii) whether the arrangement would be characterized as revenue or reimbursement of costs incurred. Changes in judgments with respect to these assumptions and estimates could impact the timing or amount of revenue recognition.
INCOME TAXES
We are subject to income taxes in Canada and other non-Canadian jurisdictions. Significant judgement and estimates are required in determining our provision for income taxes, deferred tax assets and liabilities, and liabilities for unrecognized tax benefits.
The determination of our tax liabilities involves dealing with uncertainties in the application of complex tax laws. We recognize tax benefits from uncertain tax positions only if it is more likely than not that the tax position will be sustained on examination by the taxing authorities, based on the technical merits of the position. The tax benefits recognized in the financial statements from such positions are then measured based on the largest benefit that has a greater than 50% likelihood of being realized upon ultimate settlement.
At December 31, 2018, we had gross unrecognized tax benefits of $198 million excluding interest and penalties, of which $183 million, if recognized, would affect our effective tax rate. The gross unrecognized tax benefits differ from the amount that would affect our effective tax rate due primarily to the impact of the valuation allowance on deferred tax assets.
Deferred tax assets and liabilities are recognized for the estimated future tax effects attributable to temporary differences between financial statement carrying value of existing assets and liabilities and their respective tax bases and tax loss and credit carryforwards. Deferred tax assets and liabilities are measured using the enacted tax rates and laws that will be in effect when the differences are expected to reverse. Accounting standards require that we assess whether valuation allowances should be established or maintained against our deferred income tax assets, based on consideration of all available evidence, using a “more-likely-than-not” standard. The factors used to assess the likelihood of realization are: history of losses, forecasts of future pre-tax income and tax planning strategies that could be implemented to realize the deferred tax assets. On a quarterly basis, we evaluate the realizability of deferred tax assets by assessing our valuation allowances and by adjusting the amount of such allowances as necessary. We use tax planning strategies to realize deferred tax assets to avoid the potential loss of benefits.
At December 31, 2018, we had recorded deferred tax assets (net of related valuation allowances) in respect of loss carryforwards and other deductible temporary differences of $154 million and $173 million, respectively. The deferred tax assets in respect of loss carryforwards relate primarily to operations in Canada, India, the United Kingdom and Germany. We had domestic and foreign operating loss carryforwards of $2.3 billion and tax credit carryforwards of $57 million, which relate primarily to Germany, Austria, the United States, Brazil, the United Kingdom, Spain and China. Approximately $1.7 billion of the operating losses can be carried forward indefinitely. The remaining operating losses and tax credit carryforwards expire between 2019 and 2038.
WARRANTY
We record product warranty liabilities based on individual customer agreements. Under most customer agreements, we only account for existing or probable claims on product default issues when amounts related to such issues are probable and reasonably estimable. Under certain complete vehicle engineering and assembly contracts, we record an estimate of future warranty-related costs based on the terms of the specific customer agreements and the specific customers’ warranty experience.
Product liability provisions are established based on our best estimate of the amounts necessary to settle existing claims on product default issues. Recall costs are costs incurred when government regulators and/or our customers decide to recall a product due to a known or suspected performance issue, and we either agree or are required to participate. Costs typically include the cost of the product being replaced, the customer’s cost of the recall and labour to remove and replace the defective part. When a decision to recall a product has been made or is probable, our estimated cost of the recall is recorded as a charge to income in that period. In making this estimate, judgement is required as to the number of units that may be returned as a result of the recall, the total cost of the recall campaign, the ultimate negotiated sharing of the cost between us, the customer and, in some cases a supplier.
We monitor our warranty activity on an ongoing basis and adjust our reserve estimates when it is probable that future warranty costs will be different than those estimates.
EMPLOYEE FUTURE BENEFIT PLANS
The determination of the obligation and expense for defined benefit pension, termination and long service arrangements and other post-retirement benefits, such as retiree healthcare and medical benefits, is dependent on the selection of certain assumptions used by actuaries in calculating such amounts. Those assumptions include, among others, the discount rate, expected long-term rate of return on plan assets and rates of increase in compensation costs. Actual results that differ from the assumptions used are accumulated and amortized over future periods and therefore impact the recognized expense in future periods. Significant changes in assumptions or significant plan amendments could materially affect our future employee benefit obligations and future expense.
At December 31, 2018, we had past service costs and actuarial experience losses of $211 million included in accumulated other comprehensive income that will be amortized to future employee benefit expense over the expected average remaining service life of employees or over the expected average life expectancy of retired employees, depending on the status of the plan.
FUTURE CHANGES IN ACCOUNTING POLICIES
Refer to Note 2. Accounting Standards to the audited consolidated financial statements included in this report for the impact of recently issued accounting pronouncements.
SUBSEQUENT EVENT
NORMAL COURSE ISSUER BID
Subsequent to December 31, 2018, we purchased 3,216,363 Common Shares for cancellation and 76,119 Common Shares to satisfy stock-based compensation awards, each under our existing normal course issuer bid for cash consideration of $168 million.
COMMITMENTS AND CONTINGENCIES
From time to time, we may be contingently liable for litigation, legal and/or regulatory actions and proceedings and other claims. Refer to note 23 of our audited consolidated financial statements for the year ended December 31, 2018, which describes these claims.
For a discussion of risk factors relating to legal and other claims/actions against us, refer to “Item 5. Risk Factors” in our Annual Information Form and Annual Report on Form 40-F, each in respect of the year ended December 31, 2017.
CONTROLS AND PROCEDURES
DISCLOSURE CONTROLS AND PROCEDURES
Disclosure controls and procedures (as defined in Rules 13a-15(e) and 15d-15(e) under the Securities Exchange Act of 1934, as amended [the “Exchange Act”] are designed to ensure that material information required to be disclosed in reports filed or submitted under the Exchange Act is recorded, processed, summarized and reported on a timely basis, and that such information is accumulated and communicated to senior management, including the Company’s Chief Executive Officer and Chief Financial Officer, as appropriate, to enable them to make timely decisions regarding required disclosure of such information. We have conducted an evaluation of our disclosure controls and procedures as of December 31, 2018 under the supervision, and with the participation of, our Chief Executive Officer and our Chief Financial Officer. Based on this evaluation, our Chief Executive Officer and our Chief Financial Officer have concluded that our disclosure controls and procedures (as this term is defined in the rules adopted by Canadian securities regulatory authorities and the United States Securities and Exchange Commission [“SEC”]) are effective as of December 31, 2018.
MANAGEMENT’S ANNUAL REPORT ON INTERNAL CONTROL OVER FINANCIAL REPORTING
Internal control over financial reporting is a process designed to provide reasonable, but not absolute, assurance regarding the reliability of financial reporting and preparation of financial statements for external purposes in accordance with accounting principles generally accepted in the United States. Our management is responsible for establishing and maintaining adequate internal control over financial reporting. Due to its inherent limitations, internal control over financial reporting may not prevent or detect misstatements on a timely basis. Additionally, projections of any evaluation of the effectiveness of internal control over financial reporting to future periods are subject to the risk that the controls may become inadequate because of changes in conditions, or that the degree of compliance with the policies or procedures may deteriorate. Our management used the Committee of Sponsoring Organizations of the Treadway Commission [“COSO”] Internal Control-Integrated Framework (2013) to evaluate the effectiveness of internal control over financial reporting. Based on this evaluation, our Chief Executive Officer and our Chief Financial Officer have assessed the effectiveness of our internal control over financial reporting and concluded that, as at December 31, 2018, such internal control over financial reporting is effective. The Company’s internal control over financial reporting as of December 31, 2018 has been audited by Deloitte LLP, Independent Registered Public Accounting Firm who also audited the Company’s consolidated financial statements for the year ended December 31, 2018. Deloitte LLP expressed an unqualified opinion on the effectiveness of the Company’s internal control over financial reporting. This report precedes our audited consolidated financial statements for the year ended December 31, 2018.
CHANGES IN INTERNAL CONTROLS OVER FINANCIAL REPORTING
There have been no changes in our internal controls over financial reporting that occurred during 2018 that have materially affected, or are reasonably likely to materially affect, our internal control over financial reporting.
RISK FACTORS
Our short and medium-term operational success, as well as our ability to create long-term value through our business strategy, are subject to risks and uncertainties. The following are the more significant such risks:
RISKS RELATED TO THE AUTOMOTIVE INDUSTRY
· Economic Cyclicality: The global automotive industry is cyclical, with the potential for regional differences in timing of expansion and contraction of economic cycles. A worsening of economic or political conditions in North America, Europe or Asia, may result in lower consumer confidence, which typically translates into lower vehicle sales and production levels. A significant decline in vehicle production volumes from current levels could have a material adverse effect on our profitability and financial condition.
· Regional Volumes Declines: North America, Europe and China are key automotive producing regions for us, and our operating results are primarily dependent on car and light truck production by our customers in these regions. A significant or sustained decline in vehicle production volumes in these geographic regions could have a material adverse effect on our operations, sales and profitability.
· Intense Competition: The automotive supply industry is highly competitive and becoming more so. Some of our competitors have higher or more rapidly growing market share than we do in certain product or geographic areas. Additionally, a number of established electronics and semiconductor companies have entered or expanded their presence in the automotive industry, while disruptive technology innovators have been introducing novel product and service solutions which traditional automotive suppliers may not be able to match. Failure to successfully compete with existing or new competitors, including failure to grow sales of our electronics products or services at or above the rate of growth of electronics content, could have a material adverse effect on our operations, profitability and ability to fully implement our business strategy.
· Trade Agreements: The global growth of the automotive industry has been aided by the free movement of goods, services, people and capital through bilateral and regional trade agreements, particularly in North America and Europe. Introduction of measures which impede free trade could have a material adverse effect on our operations and profitability.
· Trade Disputes/Tariffs: Current international trade disputes could, among other things, reduce demand for and production of vehicles, disrupt global supply chains, distort commodity pricing, impair the ability of automotive suppliers and vehicle manufacturers to make efficient long-term investment decisions, create volatility in relative foreign exchange rates, and contribute to stock market volatility. Tariffs on steel and aluminum introduced by the United States against Canada and Mexico in 2018, together with retaliatory tariffs by Canada and Mexico, remain in place despite an agreement in principle regarding the new United States-Mexico-Canada Agreement [“USMCA”]. An ongoing trade dispute between the United States and China has led to the imposition by the United States of tariffs on a broad range of Chinese-origin imports into the U.S., and retaliatory tariffs by China on certain U.S.-origin imports into China, including automobiles. The continuation of these or other tariffs and/or escalation of trade disputes which interfere with automotive supply chains could have an adverse effect on our operations and profitability.
CUSTOMER AND SUPPLIER RELATED RISKS
· Customer Concentration: Although we supply parts to all of the leading OEMs, a significant majority of our sales are to six customers: General Motors, Ford, Fiat Chrysler, BMW, Daimler and Volkswagen. In light of the amount of business we currently have with these six customers, our opportunities for incremental growth with them in North America, Europe and China may be limited. While we continue to diversify our business, there is no assurance we will be successful. Shifts in market share away from our top customers could have a material adverse effect on our profitability.
· Market Shifts: While we supply parts for a wide variety of vehicles produced globally, we do not supply parts for all vehicles produced, nor is the number or value of parts evenly distributed among the vehicles for which we do supply parts. Shifts in market shares away from vehicles on which we have significant content, as well as vehicle segments in which our sales may be more heavily concentrated, could have a material adverse effect on our profitability.
· Consumer Take Rate Shifts: Shifts in consumer preferences may impact “take rates” for certain types of products we sell. Examples of such products include: manual and dual-clutch transmissions; all-wheel drive systems; power liftgates; active aerodynamics systems; advanced driver assistance systems; and complete vehicles with certain option packages or option choices. Where shifts in consumer preferences result in higher “take rates” for products that we do not sell, such as planetary or continuously variable transmissions, or for products we sell at a lower price and margin, such as cloth seats instead of leather seats, our profitability may be adversely affected.
MANUFACTURING / OPERATIONAL RISKS
· Product Launch: The launch of production is a complex process, the success of which depends on a wide range of factors, including: the timing of design changes by our customers relative to start of production; production readiness of our and our suppliers’ manufacturing facilities; robustness of manufacturing processes; launch volumes; quality and production readiness of tooling and equipment; employees; and initial product quality. Our failure to successfully launch material new or takeover business could have a material adverse effect on our profitability and reputation.
· Operational Underperformance: From time to time, we may have some operating divisions which are not performing at expected levels of profitability. The complexity of automotive manufacturing operations often makes it difficult to achieve a quick turnaround of underperforming divisions. Significant underperformance of one or more operating divisions could have a material adverse effect on our profitability and operations.
· Restructuring Costs: We may sell some product lines and/or downsize, close or sell some of our operating divisions. By taking such actions, we may incur restructuring, downsizing and/or other significant non-recurring costs. These costs may be higher in some countries than others and could have a material adverse effect on our profitability.
· Impairments: From time to time, we record significant impairment charges related to goodwill and/or long-lived assets. The early termination, loss, renegotiation of the terms of, or delay in the implementation of, any significant production contract could be indicators of impairment, as may the technological obsolescence of any of our products or production assets. In conducting our impairment analysis, we make forward-looking assumptions regarding: the impact of turnaround plans on underperforming operations; new business opportunities; program price and cost assumptions on current and future business; the timing and success of new program launches; and forecast production volumes. To the extent such forward-looking assumptions are not met, any resulting impairment loss could have a material adverse effect on our profitability.
· Supply Disruptions: Events attributable to us or our suppliers which prevent us from supplying products to our customers could result in a range of adverse consequences, including penalties or business interruption claims by our customers, loss of business and reputational damage. The inability to promptly resume the supply of products could have a material adverse effect on our operations and profitability.
· Skilled Labour Attraction/Retention: Our business depends on our ability to attract, develop and retain experienced and highly skilled personnel. Such personnel are in high demand in some of the areas in which we compete, and competition for employees with certain types of skills may be intense. For example, due to the rapid changes in the automotive industry, particularly in response to electrification, autonomous driving and MaaS trends, we have a growing need for personnel with software and other technical skills, and we may face substantial competition for such personnel, including from traditional software industry companies. The inability to attract and retain highly-skilled personnel could have an adverse effect on our operations and our ability to fully implement our business strategy.
IT SECURITY
· IT / Cybersecurity Breach: Although we have established and continue to enhance security controls intended to protect our IT systems and infrastructure, there is no guarantee that such security measures will be effective in preventing unauthorized physical access or cyber-attacks. A significant breach of our IT systems could: result in theft of funds; cause disruptions in our manufacturing operations; lead to the loss, destruction or inappropriate use of sensitive data; or result in theft of our, our customers’ or our suppliers’ intellectual property or confidential information. The occurrence of any of the foregoing could adversely affect our operations and/or reputation, and could lead to claims against us that could have a material adverse effect on our profitability.
PRICING RISKS
· Quote / Pricing Assumptions: The time between award of new production business and start of production typically ranges between two and four years. Since product pricing is typically determined at the time of award, we are subject to significant pricing risk due to changes in input costs and quote assumptions between the time of award and start of production. The inability to quote effectively, or the occurrence of a material change in input cost or other quote assumptions between program award and production, could have an adverse effect on our profitability.
· Customer Pricing Pressure: We face ongoing pricing pressure from OEMs, including through: quoting pre-requirements; long-term supply agreements with mutually agreed price reductions over the life of the agreement; incremental annual price concession demands; pressure to absorb costs related to product design, engineering and tooling; and OEM refusal to fully offset inflationary price increases. OEMs possess significant leverage over their suppliers due to their purchasing power and the highly competitive nature of the automotive supply industry. As a result of the broad portfolio of parts we supply to our six largest OEM customers, such customers may be able to exert greater leverage over us as compared to our competitors. We attempt to offset price concessions and costs in a number of ways, including through negotiations with our customers, improved operating efficiencies and cost reduction efforts. Our inability to fully offset price concessions and/or absorb design, engineering and tooling costs, could have a material adverse effect on our profitability.
· Commodity Price Volatility: Prices for certain key raw materials and commodities used in our parts, including steel and resin, can be volatile. To the extent we are unable to offset commodity price increases by: passing such increases to our customers, by engineering products with reduced commodity content, implementing hedging strategies, or otherwise, such additional commodity costs could have an adverse effect on our profitability.
· Scrap Steel Price Volatility: Some of our manufacturing facilities generate a significant amount of scrap steel in their manufacturing processes, but recover some of the value through the sale of such scrap steel. Scrap steel prices can also be volatile and don’t necessarily move in the same direction as steel prices. Declines in scrap steel prices from time to time could have an adverse effect on our profitability.
WARRANTY RISK
· Repair / Replacement Costs: We are responsible for repair and replacement costs of defective products we supply to our customers. The obligation to repair or replace defective products could have a material adverse effect on our operations and profitability.
· Warranty Provisions: Warranty provisions for our powertrain systems and complete vehicle programs are established on the basis of the terms in the applicable award agreements and our or our customers’ warranty experience with the applicable type of product. Warranty provisions for our other products are based on our best estimate of the amounts necessary to settle existing or probable claims related to product defects. Actual warranty experience which results in costs that exceed our warranty provisions, could have an adverse effect on our profitability.
ACQUISITION RISKS
· Inherent Merger and Acquisition Risks: Acquisitions are subject to a range of inherent risks, including the assumption of incremental regulatory/compliance, pricing, supply chain, commodities, labour relations, litigation, environmental, pensions, warranty, recall, IT, tax or other risks. Although we seek to conduct appropriate levels of due diligence on our acquisition targets, these efforts may not always prove to be sufficient in identifying all risks and liabilities related to the acquisition, including as a result of: limited access to information; time constraints for conducting due diligence; inability to access target company facilities and/or personnel; or other limitations in the due diligence process. Additionally, we may identify risks and liabilities that we are not able to sufficiently mitigate through appropriate contractual or other protections. The realization of any such risks could have a material adverse effect on our profitability.
OTHER BUSINESS RISKS
· Joint Ventures: We conduct certain of our operations through joint ventures under contractual arrangements under which we share management responsibilities with one or more partners. Joint venture operations carry a range of risks, including those relating to: failure of our joint venture partner(s) to satisfy contractual obligations; potential conflicts between us and our joint venture partner(s); strategic objectives of joint venture partner(s) that may differ from our own; potential delays in decision-making; a more limited ability to implement some or all of our policies, practices and controls, or control legal and regulatory compliance, within the joint venture(s); and other risks inherent to non-wholly-owned operations. The likelihood of such occurrences and their potential effect on us vary depending on the joint venture arrangement, however, the occurrence of any such risks could have an adverse effect on our operations, profitability and reputation.
· Technology and Innovation: While we continue to invest in technology and innovation which we believe will be critical to our long-term growth, the automotive industry is experiencing rapid technological change and significant disruption. Our ability to anticipate changes in technology and to successfully develop and introduce new and enhanced products and/or manufacturing processes on a timely basis will be a significant factor in our ability to remain competitive. If we are unsuccessful or are less successful than our competitors in consistently developing innovative products and/or processes, we may be placed at a competitive disadvantage and may not be able to recover some or all of our investments and costs, which could have a material adverse effect on our profitability and financial condition and ability to fully implement our business strategy.
· Private Equity Investments in Technology Companies: In addition to our development activities, we have invested approximately $323 million in Lyft and other technology companies. Such investments are an important element of our long-term strategy and we may make further private equity investments in such companies. Investing in such companies involves a high degree of risk, including the potential loss of some or all of our investment value. In addition, there is currently no public market for Lyft’s shares, nor for the shares of our other investments in start-ups, and we may be unable to monetize our private equity investments in the future. The materialization of such investment-related risks could have an adverse effect on our profitability and financial condition.
· Evolving Business Risk Profile: The risk profile of our business continues to evolve with the increasing importance to us of product areas such as powertrain and electronics. As our business evolves, we may face new or heightened risks, including: challenges in quoting for profitable returns on products with leading-edge technologies for which we may not have significant quoting experience; increased warranty and recall risks on new products and leading-edge technologies; increased product liability risks on safety-related products or systems; heightened risk of technological obsolescence of some of our products, processes and/or assets; and difficulties in attracting or retaining employees with critical skills in high-demand areas. Realization of one or more such risks could have a material adverse effect on our operations, profitability or financial condition.
· Risks of Doing Business in Foreign Markets: The establishment of manufacturing operations in new markets carries a number of risks, including those relating to: political, civil and economic instability and uncertainty; corruption risks; high inflation and our ability to recover inflation-related cost increases; trade, customs and tax risks; expropriation risks; currency exchange rates; currency controls; limitations on the repatriation of funds; insufficient infrastructure; competition to attract and retain qualified employees; and other risks associated with conducting business internationally. Expansion of our business in non-traditional markets is an important element of our long-term strategy and, as a result, our exposure to the risks described above may be greater in the future. The likelihood of such occurrences and their potential effect on us vary from country to country and are unpredictable, however, the occurrence of any such risks could have an adverse effect on our operations, profitability and financial condition.
· Relative Foreign Exchange Rates: Our profitability is affected by movements of our U.S. dollar reporting currency against the Canadian dollar, the euro, the British pound and other currencies in which we generate revenues and incur expenses. Significant long-term fluctuations in relative currency values, in particular a significant change in the relative values of the U.S. dollar, Canadian dollar or euro, could have an adverse effect on our profitability and financial condition and any sustained change in such relative currency values could adversely impact our competitiveness in certain geographic regions.
· Financial Flexibility: The occurrence of an economic shock not contemplated in our business plan, a rapid deterioration of conditions or a prolonged recession could result in the depletion of our cash resources, which could have a material adverse effect on our operations and financial condition.
· Credit Ratings Changes: There is no assurance that any credit rating currently assigned to us will remain in effect for any period of time or that any rating will not be revised or withdrawn entirely by a rating agency in the future. A downgrade in the credit ratings assigned to us by one or more agencies could increase our cost of borrowing or impact our ability to negotiate loans, which could have an adverse effect on our profitability, financial condition and the trading price of our Common Shares.
LEGAL, REGULATORY AND OTHER RISKS
· Legal and Regulatory Proceedings: From time to time, we may become involved in regulatory proceedings, or become liable for legal, contractual and other claims by various parties, including customers, suppliers, former employees, class action plaintiffs and others. Depending on the nature or duration of any potential proceedings or claims, we may incur substantial costs and expenses may be required to devote significant management time and resources to the matters and may suffer reputational damage as a result of regulatory proceedings. On an ongoing basis, we attempt to assess the likelihood of any adverse judgements or outcomes to these proceedings or claims, although it is difficult to predict final outcomes with any degree of certainty. Except as disclosed from time to time in our consolidated financial statements and/or our MD&A, we do not believe that any of the proceedings or claims to which we are currently a party will have a material adverse effect on our profitability; however, we cannot provide any assurance to this effect.
· Changes in Laws: A significant change in the current regulatory environment in our principal markets, including changes in tax and other laws which impose additional costs on automotive manufacturers or consumers, could have an adverse effect on our profitability.
SELECTED QUARTERLY CONSOLIDATED FINANCIAL DATA
The following selected consolidated financial data has been prepared in accordance with U.S. GAAP.
|
| For the three month periods ended |
| ||||||||||
|
| Mar 31, |
| Jun 30, |
| Sep 30, |
| Dec 31, |
| ||||
|
| 2018 |
| 2018 |
| 2018 |
| 2018 |
| ||||
|
|
|
|
|
|
|
|
|
| ||||
Sales |
| $ | 10,792 |
| $ | 10,280 |
| $ | 9,618 |
| $ | 10,137 |
|
|
|
|
|
|
|
|
|
|
| ||||
Net income |
| $ | 669 |
| $ | 636 |
| $ | 560 |
| $ | 467 |
|
|
|
|
|
|
|
|
|
|
| ||||
Earnings per Common Share |
|
|
|
|
|
|
|
|
| ||||
Basic |
| $ | 1.84 |
| $ | 1.78 |
| $ | 1.63 |
| $ | 1.37 |
|
Diluted |
| $ | 1.83 |
| $ | 1.77 |
| $ | 1.62 |
| $ | 1.37 |
|
|
| For the three month periods ended |
| ||||||||||
|
| Mar 31, |
| Jun 30, |
| Sep 30, |
| Dec 31, |
| ||||
|
| 2017 |
| 2017 |
| 2017 |
| 2017 |
| ||||
|
|
|
|
|
|
|
|
|
| ||||
Sales |
| $ | 8,900 |
| $ | 9,140 |
| $ | 8,864 |
| $ | 9,684 |
|
|
|
|
|
|
|
|
|
|
| ||||
Net income |
| $ | 587 |
| $ | 561 |
| $ | 521 |
| $ | 575 |
|
|
|
|
|
|
|
|
|
|
| ||||
Earnings per Common Share |
|
|
|
|
|
|
|
|
| ||||
Basic |
| $ | 1.51 |
| $ | 1.45 |
| $ | 1.39 |
| $ | 1.55 |
|
Diluted |
| $ | 1.51 |
| $ | 1.44 |
| $ | 1.38 |
| $ | 1.54 |
|
The third quarter of the year is generally affected by the normal seasonal effects of lower vehicle production volumes as a result of OEM summer shutdowns.
Included in the quarterly net income attributable to Magna International Inc. are the following Other Expense, net items that have been discussed above:
|
| For the three month periods ended |
| ||||||||||
|
| Mar 31, |
| Jun 30, |
| Sep 30, |
| Dec 31, |
| ||||
|
| 2018 |
| 2018 |
| 2018 |
| 2018 |
| ||||
|
|
|
|
|
|
|
|
|
| ||||
Restructuring |
| $ | 3 |
| $ | 17 |
| $ | 2 |
| $ | 23 |
|
Impairment of investment |
| — |
| — |
| — |
| 60 |
| ||||
Impairment of long-lived assets |
| — |
| — |
| — |
| 14 |
| ||||
Unrealized gain on investment revaluation |
| — |
| (56 | ) | — |
| — |
| ||||
|
| $ | 3 |
| $ | (39 | ) | $ | 2 |
| $ | 97 |
|
|
| For the three month periods ended |
| ||||||||||
|
| Mar 31, |
| Jun 30, |
| Sep 30, |
| Dec 31, |
| ||||
|
| 2017 |
| 2017 |
| 2017 |
| 2017 |
| ||||
|
|
|
|
|
|
|
|
|
| ||||
Restructuring |
| $ | 6 |
| $ | 3 |
| $ | 2 |
| $ | 18 |
|
Impairment of long-lived asset |
| — |
| — |
| — |
| 64 |
| ||||
Impairment of investment |
| — |
| — |
| — |
| 17 |
| ||||
Gain on formation of a new venture |
| — |
| — |
| — |
| (45 | ) | ||||
Gain on sale of investment |
| — |
| — |
| — |
| (26 | ) | ||||
|
| $ | 6 |
| $ | 3 |
| $ | 2 |
| $ | 28 |
|
For more information regarding our quarter over quarter results, please refer to our first, second and third quarter 2018 quarterly reports which are available through the internet on the Canadian Securities Administrators’ System for Electronic Document Analysis and Retrieval [“SEDAR”] which can be accessed at www.sedar.com.