Exhibit 99.2

Magna International Inc.
Second Quarter Report
2022
MAGNA INTERNATIONAL INC.
Management’s Discussion and Analysis of Results of Operations and Financial Position
Unless otherwise noted, all amounts in this Management’s Discussion and Analysis of Results of Operations and Financial Position [“MD&A”] are in U.S. dollars and all tabular amounts are in millions of U.S. dollars, except per share figures, which are in U.S. dollars. When we use the terms “we”, “us”, “our” or “Magna”, we are referring to Magna International Inc. and its subsidiaries and jointly controlled entities, unless the context otherwise requires.
This MD&A should be read in conjunction with the unaudited interim consolidated financial statements for the three and six months ended June 30, 2022 included in this Quarterly Report, and the audited consolidated financial statements and MD&A for the year ended December 31, 2021 included in our 2021 Annual Report to Shareholders.
This MD&A may contain statements that are forward looking. Refer to the “Forward-Looking Statements” section in this MD&A for a more detailed discussion of our use of forward-looking statements.
This MD&A has been prepared as at July 28, 2022.
USE OF NON-GAAP FINANCIAL MEASURES
In addition to results presented in accordance with accounting principles generally accepted in the United States of America [“U.S. GAAP”], this report includes the use of Adjusted earnings before interest and taxes [“Adjusted EBIT”], Adjusted EBIT as a percentage of sales, Adjusted diluted earnings per share, Return on Invested Capital, Adjusted Return on Invested Capital and Return on Equity [collectively, the “Non-GAAP Measures”]. We believe these non-GAAP financial measures provide additional information that is useful to investors in understanding our underlying performance and trends through the same financial measures employed by our management for this purpose. Readers should be aware that Non-GAAP Measures have no standardized meaning under U.S. GAAP and accordingly may not be comparable to the calculation of similar measures by other companies. We believe that Return on Invested Capital and Return on Equity are useful to both management and investors in their analysis of our results of operations and reflect our ability to generate returns. Similarly, we believe that Adjusted EBIT, Adjusted EBIT as a percentage of sales, Adjusted diluted earnings per share and Adjusted Return on Invested Capital provide useful information to our investors for measuring our operational performance as they exclude certain items that are not reflective of ongoing operating profit or loss and facilitate a comparison with prior periods. The presentation of any Non-GAAP Measures should not be considered in isolation or as a substitute for our related financial results prepared in accordance with U.S. GAAP. Non-GAAP financial measures are presented together with the most directly comparable U.S. GAAP financial measure, and a reconciliation to the most directly comparable U.S. GAAP financial measure, can be found in the “Non-GAAP Financial Measures Reconciliation” section of this MD&A.
HIGHLIGHTS
In the second quarter of 2022:
| • | Global light vehicle production increased 2% from the second quarter of 2021, including a 14% increase in North America and a 1% decrease in Europe, our two largest markets. |
| • | Total sales increased 4% to $9.4 billion, compared to $9.0 billion in the second quarter of 2021. The increase largely reflects higher global light vehicle production, the launch of new programs and customer price increases to recover certain higher input costs. These were partially offset by the net weakening of foreign currencies against the U.S. dollar. |
| • | Excluding foreign currency translation and divestitures, net of acquisitions, total sales increased 12%. |
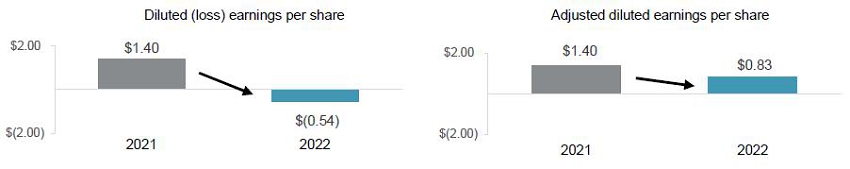
| • | Diluted loss per share was $0.54. Adjusted diluted earnings per share were $0.83, a decrease of $0.57 compared to the second quarter of 2021, primarily as a result of higher net production input costs, and operating inefficiencies and other costs at a facility in Europe. |
| • | We recorded non-cash impairment charges of $376 million [$361 million after tax] related to our investment in Russia. |
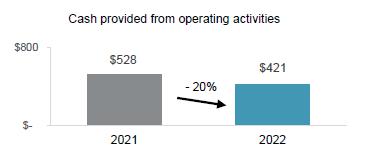
| • | Cash from operating activities was $421 million, a decrease of $107 million from the second quarter of 2021. |
| • | We returned $342 million to shareholders by way of share repurchases and dividends. |
OVERVIEW
OUR BUSINESS(1)
Magna is more than one of the world’s largest suppliers in the automotive space. We are a mobility technology company with a global, entrepreneurial-minded team of over 161,000(2) employees and an organizational structure designed to innovate like a startup. With 65+ years of expertise, and a systems approach to design, engineering and manufacturing that touches nearly every aspect of the vehicle, we are positioned to support advancing mobility in a transforming industry. Our global network includes 341 manufacturing operations and 89 product development, engineering and sales centres spanning 28 countries. Our common shares trade on the Toronto Stock Exchange (MG) and the New York Stock Exchange (MGA).
1 Manufacturing operations, product development, engineering and sales centres include certain operations accounted for under the equity method.
2 Number of employees includes over 152,000 employees at our wholly owned or controlled entities and over 9,000 employees at certain operations accounted for under the equity method.
| Magna International Inc. Second Quarter Report 2022 | 1 |
INDUSTRY TRENDS & RISKS
Our operating results are primarily dependent on the levels of North American, European and Chinese car and light truck production by our customers. While we supply systems and components to every major original equipment manufacturer [“OEM”], we do not supply systems and components for every vehicle, nor is the value of our content consistent from one vehicle to the next. As a result, customer and program mix relative to market trends, as well as the value of our content on specific vehicle production programs, are also important drivers of our results.
OEM production volumes are generally aligned with vehicle sales levels and thus affected by changes in such levels. Aside from vehicle sales levels, production volumes are typically impacted by a range of factors, including: general macroeconomic and political conditions; supply chains and infrastructure; availability and relative cost of skilled labour; energy supply; labour disruptions; free trade arrangements; tariffs; relative currency values; commodities prices; regulatory considerations, including those related to environmental emissions and safety standards; and other factors. Additionally, COVID-19 has and may continue to impact vehicle production volumes, including through: mandatory lockdowns/stay-at-home orders which restrict production; elevated employee absenteeism; and supply chain disruptions.
Overall vehicle sales levels are significantly affected by changes in consumer confidence levels, which may in turn be impacted by consumer perceptions and general trends related to the job, housing and stock markets, as well as inflation, and other macroeconomic and political factors. Other factors which typically impact vehicle sales levels and thus production volumes include: interest rates and/or availability of credit; fuel and energy prices; relative currency values; and other factors. Additionally, COVID-19 has and may continue to impact vehicle sales, including through mandatory lockdowns/stay-at-home orders which restrict consumers’ ability to purchase vehicles, as well as through a deterioration in consumer confidence.
While the foregoing economic, political and other factors are part of the general context in which the global automotive industry operates, there have been a number of significant industry trends that are shaping the future of the industry and creating opportunities and risks for automotive suppliers. We continue to implement a business strategy which is rooted in our best assessment as to the rate and direction of change in the automotive industry, including with respect to trends related to vehicle electrification and advanced driver assistance systems, as well as “mobility-as-a-service” [“MaaS”]. Our short- and medium-term operational success, as well as our ability to create long-term value through our business strategy, are subject to a number of risks and uncertainties. Significant industry trends, our business strategy and the major risks we face, are discussed in our Annual Information Form [“AIF”] and Annual Report on Form 40-F [“Form 40-F”] in respect of the year ended December 31, 2021, together with subsequent filings. Those industry trends and risk factors remain substantially unchanged in respect of the second quarter ended June 30, 2022, except as follows:
| • | Russian Invasion of Ukraine: Magna’s operations in Russia remain substantially idled. As required under U.S. GAAP, we have recorded a $376 million impairment charge against the value of our balance sheet investments, including deferred cumulative translation losses. |
The ongoing conflict continues to create or exacerbate a broad range of risks, including with respect to:
| • | global economic growth; |
| • | global vehicle production volumes; |
| • | inflationary pressures, including in energy, commodities and transportation/logistics; |
| • | energy security in Western Europe, particularly in Germany and Austria where we have significant operations; and |
| • | supply chain fragility. |
A material deterioration in any of the foregoing could have a material adverse effect on our business and results of operations.
On July 20, 2022, the E.U. introduced an emergency natural gas rationing plan to curtail the use of natural gas by businesses and in public buildings in member states through the summer, in order to allow gas reserves to be replenished for the winter. The EU has developed a plan to reduce natural gas imports from Russia significantly by the end of 2022, and phase them out entirely by 2027; it previously announced measures to eliminate imports of Russian coal and oil. The inability of European countries to timely establish stable and secure energy supplies to offset Russian energy sources could cause significant economic disruption across Europe, including at our manufacturing facilities.
| • | Inflation and Interest Rates: We continue to experience higher commodity, freight and energy costs (including as discussed above), as well as wage pressures in some markets, which are expected to continue throughout 2022. Additionally, we may continue to experience price increases or surcharges from sub-suppliers in connection with the inflationary pressures they face. The inability to offset inflationary price increases through continuous improvement actions, price increases to our customers or modifications to our own products or otherwise, could have an adverse effect on our earnings. |
Increasing global inflation rates have spurred a cycle of monetary policy tightening through aggressive interest rate increases by central banks. Both the availability and cost of credit are factors affecting consumer confidence, which is a critical driver of vehicle sales and thus automotive production.
| 2 | Magna International Inc. Second Quarter Report 2022 |
RESULTS OF OPERATIONS
AVERAGE FOREIGN EXCHANGE
| For the three months | For the six months | |||||||||||||||||||||||
| ended June 30, | ended June 30, | |||||||||||||||||||||||
| 2022 | 2021 | Change | 2022 | 2021 | Change | |||||||||||||||||||
| 1 Canadian dollar equals U.S. dollars | 0.783 | 0.814 | - | 4 | % | 0.786 | 0.802 | - | 2 | % | ||||||||||||||
| 1 euro equals U.S. dollars | 1.064 | 1.206 | - | 12 | % | 1.094 | 1.205 | - | 9 | % | ||||||||||||||
| 1 Chinese renminbi equals U.S. dollars | 0.151 | 0.155 | - | 3 | % | 0.154 | 0.155 | - | 1 | % | ||||||||||||||
The preceding table reflects the average foreign exchange rates between the most common currencies in which we conduct business and our U.S. dollar reporting currency.
The results of operations for which the functional currency is not the U.S. dollar are translated into U.S. dollars using the average exchange rates for the relevant period. Throughout this MD&A, reference is made to the impact of translation of foreign operations on reported U.S. dollar amounts where relevant.
LIGHT VEHICLE PRODUCTION VOLUMES
Our operating results are mostly dependent on light vehicle production in the regions reflected in the table below:
Light Vehicle Production Volumes (thousands of units)
| For the three months | For the six months | |||||||||||||||||||||||
| ended June 30, | ended June 30, | |||||||||||||||||||||||
| 2022 | 2021 | Change | 2022 | 2021 | Change | |||||||||||||||||||
| North America | 3,677 | 3,213 | + | 14 | % | 7,318 | 6,965 | - | 5 | % | ||||||||||||||
| Europe | 4,055 | 4,086 | - | 1 | % | 8,048 | 8,975 | - | 10 | % | ||||||||||||||
| China | 5,397 | 5,703 | - | 5 | % | 11,807 | 11,737 | + | 1 | % | ||||||||||||||
| Magna International Inc. Second Quarter Report 2022 | 3 |
RESULTS OF OPERATIONS – FOR THE THREE MONTHS ENDED JUNE 30, 2022
SALES
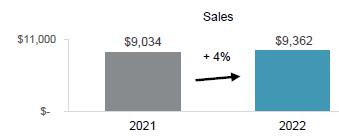
Sales increased 4% or $328 million to $9.36 billion for the second quarter of 2022 compared to $9.03 billion for the second quarter of 2021 primarily due to:
| • | higher global light vehicle production and assembly volumes; |
| • | the launch of new programs during or subsequent to the second quarter of 2021; and |
| • | customer price increases to recover certain higher production input costs. |
These factors were partially offset by:
| • | the net weakening of foreign currencies against the U.S. dollar, which decreased reported U.S. sales by $629 million; |
| • | lower sales at facilities in Russia; |
| • | divestitures, net of acquisitions during and subsequent to the second quarter of 2021, which decreased sales by $83 million; and |
| • | customer price concessions subsequent to the second quarter of 2021. |
COST OF GOODS SOLD
| For the three months | ||||||||||||
| ended June 30, | ||||||||||||
| 2022 | 2021 | Change | ||||||||||
| Material | $ | 5,829 | $ | 5,365 | $ | 464 | ||||||
| Direct labour | 698 | 718 | (20 | ) | ||||||||
| Overhead | 1,732 | 1,645 | 87 | |||||||||
| Cost of goods sold | $ | 8,259 | $ | 7,728 | $ | 531 | ||||||
Cost of goods sold increased $531 million to $8.26 billion for the second quarter of 2022 compared to $7.73 billion for the second quarter of 2021, primarily due to:
| • | higher materials, direct labour and overhead associated with higher sales; |
| • | higher net production input costs, including commodity, labour, energy and freight costs; and |
| • | operating inefficiencies and other costs at a facility in Europe. |
These factors were partially offset by:
| • | the net weakening of foreign currencies against the U.S. dollar, which decreased reported U.S. dollar cost of goods sold by $564 million; and |
| • | divestitures, net of acquisitions during and subsequent to the second quarter of 2021, which decreased cost of goods sold by $89 million. |
DEPRECIATION AND AMORTIZATION
Depreciation and amortization decreased $14 million to $360 million for the second quarter of 2022 compared to $374 million for the second quarter of 2021 primarily due to the net weakening of foreign currencies against the U.S. dollar, which decreased reported U.S. dollar depreciation and amortization by $21 million, partially offset by increased capital deployed at new and existing facilities to support the launch of programs subsequent to the second quarter of 2021.
| 4 | Magna International Inc. Second Quarter Report 2022 |
SELLING, GENERAL AND ADMINISTRATIVE [“SG&A”]
SG&A expense decreased $9 million to $410 million for the second quarter of 2022 compared to $419 million for the second quarter of 2021, primarily as a result of:
| • | the net weakening of foreign currencies against the U.S. dollar, which decreased reported U.S. dollar SG&A expense by $24 million; |
| • | divestitures, net of acquisitions during and subsequent to the second quarter of 2021, which decreased SG&A by $9 million; and |
| • | lower incentive compensation and employee profit sharing. |
These factors were partially offset by:
| • | a favourable value-added tax settlement in Brazil during the second quarter of 2021; and |
| • | higher labour and benefit costs. |
INTEREST EXPENSE, NET
During the second quarter of 2022, we recorded net interest expense of $20 million compared to $11 million for the second quarter of 2021. The $9 million increase is primarily a result of interest income recognized on a favourable value-added tax settlement in Brazil during the second quarter of 2021 partially offset by interest savings due to the redemption of the Cdn$425 million 3.1000% Senior Notes during the first quarter of 2022.
EQUITY INCOME
Equity income decreased $19 million to $25 million for the second quarter of 2022 compared to $44 million for the second quarter of 2021, primarily as a result of reduced earnings on lower sales and higher net production input costs at certain equity-accounted entities, and electrification spending by our LG Magna e-Powertrain Co., Ltd. joint venture, which was formed in July 2021.
OTHER EXPENSE, NET
| For the three months | ||||||||
| ended June 30, | ||||||||
| 2022 | 2021 | |||||||
| Restructuring and impairments (1) | $ | 376 | $ | 44 | ||||
| Losses (gains) on investments (2) | 50 | (38 | ) | |||||
| $ | 426 | $ | 6 | |||||
| (1) | Restructuring and impairments |
Our operations in Russia remain substantially idled and production is not expected to resume before 2024. In accordance with U.S. GAAP, as a result of the expected lack of future cashflows and the continuing uncertainties connected with the Russian economy, we recorded a $376 million [$361 million after tax] impairment charge related to our investment in Russia. This included net asset impairments of $173 million and a $203 million reserve against the related foreign currency translation losses that are included in accumulated other comprehensive loss. The net asset impairments consisted of $163 million and $10 million in our Body Exteriors & Structures segment and our Seating Systems segment, respectively.
During the second quarter of 2021 we recorded net restructuring charges of $44 million [$31 million after tax] in our Power & Vision segment.
| (2) | Losses (gains) on investments |
| For the three months | ||||||||
| ended June 30, | ||||||||
| 2022 | 2021 | |||||||
| Gain on sale of public equity investments | $ | (3 | ) | $ | — | |||
| Revaluation of public company warrants | 51 | (29 | ) | |||||
| Revaluation of public and private equity investments | 2 | (9 | ) | |||||
| Other Expense, net | 50 | (38 | ) | |||||
| Tax effect | (12 | ) | 9 | |||||
| Net loss (gain) attributable to Magna | $ | 38 | $ | (29 | ) | |||
| Magna International Inc. Second Quarter Report 2022 | 5 |
(LOSS) INCOME FROM OPERATIONS BEFORE INCOME TAXES
(Loss) income from operations before income taxes was a loss of $88 million for the second quarter of 2022 compared to income of $540 million for the second quarter of 2021. This $628 million decrease is a result of the following changes, each as discussed above:
| For the three months | ||||||||||||
| ended June 30, | ||||||||||||
| 2022 | 2021 | Change | ||||||||||
| Sales | $ | 9,362 | $ | 9,034 | $ | 328 | ||||||
| Costs and expenses | ||||||||||||
| Cost of goods sold | 8,259 | 7,728 | 531 | |||||||||
| Depreciation and amortization | 360 | 374 | (14 | ) | ||||||||
| Selling, general and administrative | 410 | 419 | (9 | ) | ||||||||
| Interest expense, net | 20 | 11 | 9 | |||||||||
| Equity income | (25 | ) | (44 | ) | 19 | |||||||
| Other expense, net | 426 | 6 | 420 | |||||||||
| (Loss) income from operations before income taxes | $ | (88 | ) | $ | 540 | $ | (628 | ) | ||||
INCOME TAXES
| For the three months ended June 30, | ||||||||||||||||
| 2022 | 2021 | |||||||||||||||
| Income Taxes as reported | $ | 57 | (64.8 | )% | $ | 104 | 19.3 | % | ||||||||
| Tax effect on Other expense, net | 27 | 89.7 | 4 | 0.5 | ||||||||||||
| $ | 84 | 24.9 | % | $ | 108 | 19.8 | % | |||||||||
Excluding the tax effect on Other expense, net, our effective income tax rate increased to 24.9% for the second quarter of 2022 compared to 19.8% for the second quarter of 2021 primarily due to lower favourable changes in our reserves for uncertain tax positions and higher losses not benefitted in Europe. These factors were partially offset by a change in mix of earnings.
| 6 | Magna International Inc. Second Quarter Report 2022 |
INCOME ATTRIBUTABLE TO NON-CONTROLLING INTERESTS
Income attributable to non-controlling interests was $11 million for the second quarter of 2022 compared to $12 million for the second quarter of 2021. This $1 million change was primarily due to lower net income at our non-wholly owned operations in China.
NET (LOSS) INCOME ATTRIBUTABLE TO MAGNA INTERNATIONAL INC.
Net (loss) income attributable to Magna International Inc. was a loss of $156 million for the second quarter of 2022 compared to income of $424 million for the second quarter of 2021. This $580 million decrease was as a result of: a decrease in income from operations before income taxes of $628 million; partially offset by a decease in income taxes of $47 million; and a decrease of $1 million in income attributable to non-controlling interests.
(LOSS) EARNINGS PER SHARE
| For the three months | ||||||||||||
| ended June 30, | ||||||||||||
| 2022 | 2021 | Change | ||||||||||
| (Loss) earnings per Common Share | ||||||||||||
| Basic | $ | (0.54 | ) | $ | 1.41 | — | ||||||
| Diluted | $ | (0.54 | ) | $ | 1.40 | — | ||||||
| Weighted average number of Common Shares outstanding (millions) | ||||||||||||
| Basic | 291.1 | 301.1 | - | 3 | % | |||||||
| Diluted | 291.1 | 303.6 | - | 4 | % | |||||||
| Adjusted diluted earnings per share | $ | 0.83 | $ | 1.40 | - | 41 | % | |||||
Diluted loss per share was $0.54 for the second quarter of 2022 compared to diluted earnings per share of $1.40 for the second quarter of 2021. The $1.94 decrease was as a result of lower net income attributable to Magna International Inc., as discussed above and a decrease in the weighted average number of diluted shares outstanding during the second quarter of 2022. The decrease in the weighted average number of diluted shares outstanding was primarily due to the purchase and cancellation of Common Shares, during or subsequent to the second quarter of 2021, pursuant to our normal course issuer bids.
Other expense, net, after tax, negatively impacted diluted earnings per share by $1.37 in the second quarter of 2022 as discussed in the "Other expense, net" and "Income Taxes" sections above.
Adjusted diluted earnings per share, as reconciled in the "Non-GAAP Financial Measures Reconciliation" section, was $0.83 for the second quarter of 2022 compared to $1.40 in the second quarter of 2021, a decrease of $0.57.
| Magna International Inc. Second Quarter Report 2022 | 7 |
NON-GAAP PERFORMANCE MEASURES – FOR THE THREE MONTHS ENDED JUNE 30, 2022
ADJUSTED EBIT AS A PERCENTAGE OF SALES
The table below shows the change in Magna's Sales and Adjusted EBIT by segment and the impact each segment's changes had on Magna's Adjusted EBIT as a percentage of sales for the second quarter of 2022 compared to the second quarter of 2021:
| Adjusted EBIT | ||||||||||||
| Adjusted | as a percentage | |||||||||||
| Sales | EBIT | of sales | ||||||||||
| Second quarter of 2021 | $ | 9,034 | $ | 557 | + | 6.2 | % | |||||
| Increase (decrease) related to: | ||||||||||||
| Body Exteriors & Structures | 300 | (36 | ) | - | 0.6 | % | ||||||
| Power & Vision | 7 | (112 | ) | - | 1.2 | % | ||||||
| Seating Systems | 87 | (24 | ) | - | 0.3 | % | ||||||
| Complete Vehicles | (87 | ) | (16 | ) | - | 0.1 | % | |||||
| Corporate and Other | 21 | (11 | ) | - | 0.2 | % | ||||||
| Second quarter of 2022 | $ | 9,362 | $ | 358 | + | 3.8 | % | |||||
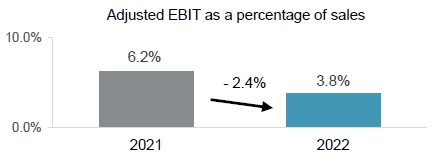
Adjusted EBIT as a percentage of sales decreased to 3.8% for the second quarter of 2022 compared to 6.2% for the second quarter of 2021 primarily due to:
| • | higher net production input costs, including commodity, energy, labour and freight costs; | |
| • | operating inefficiencies and other costs at a facility in Europe; | |
| • | reduced earnings on lower sales at facilities in Russia; | |
| • | a favourable value-added tax settlement in Brazil during the second quarter of 2021; | |
| • | lower tooling contribution in the second quarter of 2022 compared to the second quarter of 2021; and | |
| • | lower equity income. |
These factors were partially offset by:
| • | higher favourable commercial settlements; | |
| • | lower net warranty costs; and | |
| • | divestitures, net of acquisitions subsequent to the second quarter of 2021. |
| 8 | Magna International Inc. Second Quarter Report 2022 |
ADJUSTED RETURN ON INVESTED CAPITAL AND RETURN ON INVESTED CAPITAL
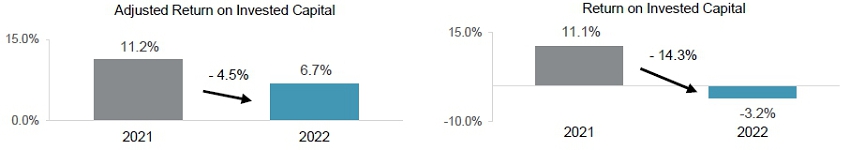
Adjusted Return on Invested Capital decreased to 6.7% for the second quarter of 2022 compared to 11.2% for the second quarter of 2021 as a result of a decrease in Adjusted After-tax operating profits partially offset by lower Average Invested Capital. Other expense, net, after tax negatively impacted Return on Invested Capital by 9.9% in the second quarter of 2022 and by 0.1% in the second quarter of 2021.
Average Invested Capital decreased $9 million to $16.01 billion for the second quarter of 2022 compared to $16.02 billion for the second quarter of 2021. Factors decreasing Average Invested Capital were:
| • | the net weakening of foreign currencies against the U.S. dollar; and | |
| • | the impairment of assets recorded during the second quarter of 2022. |
These factors were partially offset by:
| • | acquisitions, net of divestitures during and subsequent to the second quarter of 2021; and | |
| • | an increase in average changes in operating assets and liabilities. |
RETURN ON EQUITY
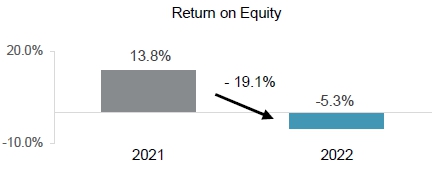
Return on Equity was -5.3% for the second quarter of 2022 compared to 13.8% for the second quarter of 2021. This decrease was due to lower net income attributable to Magna partially offset by lower average shareholders' equity. Other expense, net, after tax negatively impacted Return on Equity by 13.6% in the second quarter of 2022 and by 0.1% in the second quarter of 2021.
| Magna International Inc. Second Quarter Report 2022 | 9 |
SEGMENT ANALYSIS
We are a global automotive supplier that has complete vehicle engineering and contract manufacturing expertise, as well as product capabilities which include body, chassis, exterior, seating, powertrain, active driver assistance, electronics, mechatronics, mirrors, lighting and roof systems. We also have electronic and software capabilities across many of these areas.
Our reporting segments are: Body Exteriors & Structures; Power & Vision; Seating Systems; and Complete Vehicles.
| For the three months ended June 30, | ||||||||||||||||||||||||
| Sales | Adjusted EBIT | |||||||||||||||||||||||
| 2022 | 2021 | Change | 2022 | 2021 | Change | |||||||||||||||||||
| Body Exteriors & Structures | $ | 3,947 | $ | 3,647 | $ | 300 | $ | 191 | $ | 227 | $ | (36 | ) | |||||||||||
| Power & Vision | 2,888 | 2,881 | 7 | 91 | 203 | (112 | ) | |||||||||||||||||
| Seating Systems | 1,253 | 1,166 | 87 | 2 | 26 | (24 | ) | |||||||||||||||||
| Complete Vehicles | 1,403 | 1,490 | (87 | ) | 63 | 79 | (16 | ) | ||||||||||||||||
| Corporate and Other | (129 | ) | (150 | ) | 21 | 11 | 22 | (11 | ) | |||||||||||||||
| Total reportable segments | $ | 9,362 | $ | 9,034 | $ | 328 | $ | 358 | $ | 557 | $ | (199 | ) | |||||||||||
BODY EXTERIORS & STRUCTURES
| For the three months | ||||||||||||||||
| ended June 30, | ||||||||||||||||
| 2022 | 2021 | Change | ||||||||||||||
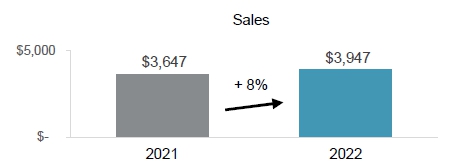
| Sales | $ | 3,947 | $ | 3,647 | $ | 300 | + | 8 | % | |||||||
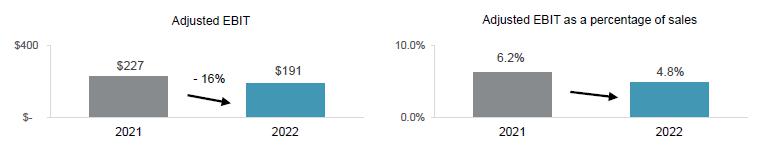
| Adjusted EBIT | $ | 191 | $ | 227 | $ | (36 | ) | - | 16 | % | ||||||
| Adjusted EBIT as a percentage of sales | 4.8 | % | 6.2 | % | - | 1.4 | % | |||||||||
Sales – Body Exteriors & Structures
Sales increased 8% or $300 million to $3.95 billion for the second quarter of 2022 compared to $3.65 billion for the second quarter of 2021 primarily due to:
| • | higher global light vehicle production; | |
| • | the launch of programs during or subsequent to the second quarter of 2021, including the: |
| • | Jeep Wagoneer and Grand Wagoneer; | |
| • | Ford Maverick; | |
| • | Ford Bronco; and | |
| • | Nissan Qashqai; and |
| • | customer price increases to recover certain higher production input costs. |
These factors were partially offset by:
| • | the net weakening of foreign currencies against the U.S. dollar, which decreased reported U.S. dollar sales by $180 million; | |
| • | lower sales at facilities in Russia; | |
| • | divestitures, net of acquisitions subsequent to the second quarter of 2021, which decreased sales by $73 million; and | |
| • | customer price concessions subsequent to the second quarter of 2021. |
| 10 | Magna International Inc. Second Quarter Report 2022 |
Adjusted EBIT and Adjusted EBIT as a percentage of sales – Body Exteriors & Structures
Adjusted EBIT decreased $36 million to $191 million for the second quarter of 2022 compared to $227 million for the second quarter of 2021 and Adjusted EBIT as a percentage of sales decreased to 4.8% from 6.2%. These decreases were primarily due to:
| • | higher net production input costs, including commodity, energy, labour and freight costs; | |
| • | operating inefficiencies and other costs at a facility in Europe; | |
| • | reduced earnings on lower sales at facilities in Russia; | |
| • | lower tooling contribution in the second quarter of 2022 compared to the second quarter of 2021; and | |
| • | a favourable value-added tax settlement in Brazil during the second quarter of 2021. |
These factors were partially offset by:
| • | earnings on higher sales; | |
| • | higher favourable commercial settlements; | |
| • | divestitures, net of acquisitions subsequent to the second quarter of 2021; and | |
| • | lower launch costs. |
POWER & VISION
| For the three months ended June 30, | ||||||||||||||||
| 2022 | 2021 | Change | ||||||||||||||
| Sales | $ | 2,888 | $ | 2,881 | $ | 7 | — | |||||||||
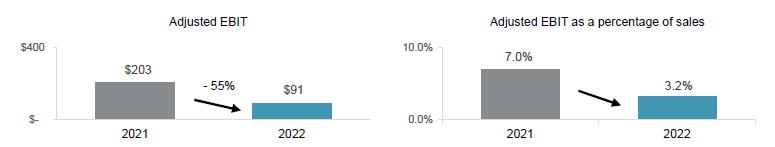
| Adjusted EBIT | $ | 91 | $ | 203 | $ | (112 | ) | - | 55 | % | ||||||
| Adjusted EBIT as a percentage of sales | 3.2 | % | 7.0 | % | - | 3.8 | % | |||||||||

Sales – Power & Vision
Sales increased $7 million to $2.89 billion for the second quarter of 2022 compared to $2.88 billion for the second quarter of 2021 primarily due to:
| • | the launch of programs during or subsequent to the second quarter of 2021, including the: |
| • | Ford Bronco; | |
| • | Jeep Wagoneer and Grand Wagoneer; | |
| • | Toyota Tundra; and | |
| • | Maserati Grecale; |
| • | higher global light vehicle production; and | |
| • | customer price increases to recover certain higher production input costs. |
These factors were partially offset by:
| • | the net weakening of foreign currencies against the U.S. dollar, which decreased reported U.S. dollar sales by $195 million; and | |
| • | net customer price concessions subsequent to the second quarter of 2021. |
| Magna International Inc. Second Quarter Report 2022 | 11 |
Adjusted EBIT and Adjusted EBIT as a percentage of sales – Power & Vision
Adjusted EBIT decreased $112 million to $91 million for the second quarter of 2022 compared to $203 million for the second quarter of 2021 and Adjusted EBIT as a percentage of sales decreased to 3.2% from 7.0%. These decreases were primarily due to:
| • | higher net production input costs, including commodity, freight, energy and labour costs; | |
| • | lower equity income; | |
| • | higher launch costs; and | |
| • | a favourable value-added tax settlement in Brazil during the second quarter of 2021. |
These factors were partially offset by:
| • | earnings on higher sales; | |
| • | lower net warranty costs of $15 million; and | |
| • | higher net favourable commercial settlements. |
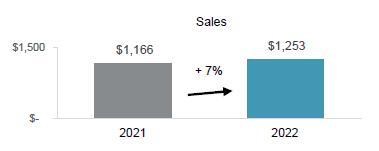
SEATING SYSTEMS
| For the three months ended June 30, | ||||||||||||||||
| 2022 | 2021 | Change | ||||||||||||||
| Sales | $ | 1,253 | $ | 1,166 | $ | 87 | + | 7 | % | |||||||
| Adjusted EBIT | $ | 2 | $ | 26 | $ | (24 | ) | - | 92 | % | ||||||
| Adjusted EBIT as a percentage of sales | 0.2 | % | 2.2 | % | - | 2.0 | % | |||||||||
Sales – Seating Systems
Sales increased 7% or $87 million to $1.25 billion for the second quarter of 2022 compared to $1.17 billion for the second quarter of 2021 primarily due to:
| • | higher global light vehicle production; | |
| • | the launch of programs during or subsequent to the second quarter of 2021, including the: |
| • | BYD Yuan Plus; | |
| • | Skoda Fabia; and | |
| • | Lincoln Zephyr; and |
| • | customer price increases to recover certain higher production input costs. |
These factors were partially offset by:
| • | the net weakening of foreign currencies against the U.S. dollar, which decreased reported U.S. dollar sales by $84 million; | |
| • | lower sales at facilities in Russia; and | |
| • | net customer price concessions subsequent to the second quarter of 2021. |
| 12 | Magna International Inc. Second Quarter Report 2022 |
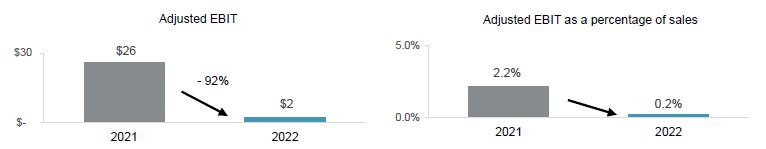
Adjusted EBIT and Adjusted EBIT as a percentage of sales – Seating Systems
Adjusted EBIT decreased $24 million to $2 million for the second quarter of 2022 compared to $26 million for the second quarter of 2021 and Adjusted EBIT as a percentage of sales decreased to 0.2% from 2.2%. These decreases were primarily due to:
| • | higher net production input costs, including commodity, freight and labour costs; | |
| • | higher launch costs; | |
| • | reduced earnings on lower sales at facilities in Russia; and | |
| • | a favourable value-added tax settlement in Brazil during the second quarter of 2021. |
These factors were partially offset by:
| • | productivity and efficiency improvements at certain underperforming facilities; and | |
| • | earnings on higher sales. |
COMPLETE VEHICLES
| For the three months ended June 30, | ||||||||||||||||
| 2022 | 2021 | Change | ||||||||||||||
| Complete Vehicle Assembly Volumes (thousands of units)(i) | 31.0 | 29.5 | 1.5 | + | 5 | % | ||||||||||
| Sales | $ | 1,403 | $ | 1,490 | $ | (87 | ) | - | 6 | % | ||||||
| Adjusted EBIT | $ | 63 | $ | 79 | $ | (16 | ) | - | 20 | % | ||||||
| Adjusted EBIT as a percentage of sales | 4.5 | % | 5.3 | % | - | 0.8 | % | |||||||||
(i) Vehicles produced at our Complete Vehicle operations are included in Europe Light Vehicle Production volumes.
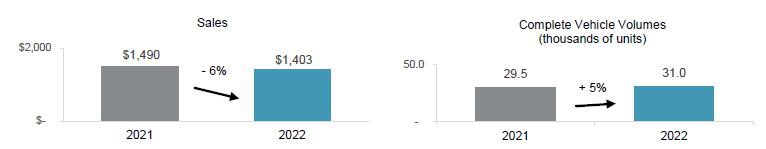
Sales – Complete Vehicles
Sales decreased 6% or $87 million to $1.40 billion for the second quarter of 2022 compared to $1.49 billion for the second quarter of 2021 while assembly volumes increased 5%. The decrease in sales is primarily as a result of a $185 million decrease in reported U.S. dollar sales as a result of the weakening of the euro against the U.S. dollar partially offset by higher assembly volumes and favourable program mix.
| Magna International Inc. Second Quarter Report 2022 | 13 |
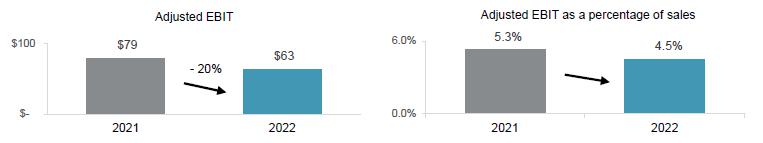
Adjusted EBIT and Adjusted EBIT as a percentage of sales – Complete Vehicles
Adjusted EBIT decreased $16 million to $63 million for the second quarter of 2022 compared to $79 million for the second quarter of 2021 and Adjusted EBIT as a percentage of sales decreased to 4.5% from 5.3%. These decreases were primarily due to:
| • | the net weakening of the euro against the U.S. dollar, which had an unfavourable $7 million impact on reported U.S. dollar Adjusted EBIT; | |
| • | higher net production input costs, including energy and labour costs; and | |
| • | unfavourable program mix. |
These factors were partially offset by higher earnings due to higher assembly volumes, net of contractual fixed cost recoveries on certain programs and higher margins on engineering programs.
CORPORATE AND OTHER
Adjusted EBIT was $11 million for the second quarter of 2022 compared to $22 million for the second quarter of 2021. The $11 million decrease was primarily the result of:
| • | transactional foreign exchange losses in the second quarter of 2022 compared to gains in the second quarter of 2021; and | |
| • | higher costs to accelerate our operational excellence initiatives. |
These factors were partially offset by amortization related to public company securities.
| 14 | Magna International Inc. Second Quarter Report 2022 |
FINANCIAL CONDITION, LIQUIDITY AND CAPITAL RESOURCES
OPERATING ACTIVITIES
| For the three months ended June 30, | ||||||||||||
| 2022 | 2021 | Change | ||||||||||
| Net (loss) income | $ | (145 | ) | $ | 436 | |||||||
| Items not involving current cash flows | 705 | 341 | ||||||||||
| 560 | 777 | $ | (217 | ) | ||||||||
| Changes in operating assets and liabilities | (139 | ) | (249 | ) | 110 | |||||||
| Cash provided from operating activities | $ | 421 | $ | 528 | $ | (107 | ) | |||||
Cash provided from operating activities
Comparing the second quarters of 2022 to 2021, cash provided from operating activities decreased $107 million primarily as a result of an increase in production costs. Specifically, the decrease is primarily a result of:
| • | a $327 million decrease in cash received from customers; | |
| • | a $44 million decrease in dividends received from equity investments; | |
| • | a $20 million increase in cash paid for labour; and | |
| • | a $16 million increase in cash paid for taxes. |
These factors were partially offset by a $305 million decrease in cash paid for materials and overhead.
Changes in operating assets and liabilities
During the second quarter of 2022, we used $139 million for operating assets and liabilities primarily consisting of:
| • | $188 million decrease in trade payables due to lower purchases and timing of payments in the second quarter of 2022; and | |
| • | $83 million decrease in accrued wages and salaries mainly due to the payout of profit sharing awards in the second quarter of 2022. |
These uses of cash were partially offset by:
| • | $100 million increase in other accrued liabilities; and | |
| • | $73 million decrease in current assets. |
| Magna International Inc. Second Quarter Report 2022 | 15 |
INVESTING ACTIVITIES
| For the three months | ||||||||||||
| ended June 30, | ||||||||||||
| 2022 | 2021 | Change | ||||||||||
| Fixed asset additions | $ | (329 | ) | $ | (277 | ) | ||||||
| Increase in investments, other assets and intangible assets | (80 | ) | (93 | ) | ||||||||
| Increase in public and private equity investments | (2 | ) | (17 | ) | ||||||||
| Fixed assets, investments, other assets and intangible assets additions | (411 | ) | (387 | ) | ||||||||
| Proceeds from dispositions | 40 | 20 | ||||||||||
| Business combinations | — | (21 | ) | |||||||||
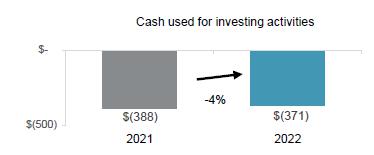
| Cash used for investing activities | $ | (371 | ) | $ | (388 | ) | $ | 17 | ||||
Cash used for investing activities in the second quarter of 2022 was $17 million lower compared to the second quarter of 2021. The change between the second quarter of 2022 and the second quarter of 2021 was primarily due to:
| • | business combinations during the second quarter of 2021; |
| • | higher proceeds from dispositions including the sale of public equity investments; |
| • | lower spending on public and private equity investments; and |
| • | lower spending on investment, other assets and intangible assets. |
These decreases were partially offset by higher spending on fixed assets.
FINANCING ACTIVITIES
| For the three months | ||||||||||||
| ended June 30, | ||||||||||||
| 2022 | 2021 | Change | ||||||||||
| Repurchase of Commons Shares | $ | (212 | ) | $ | (99 | ) | ||||||
| Repayments of debt | (34 | ) | (47 | ) | ||||||||
| Dividends paid | (130 | ) | (127 | ) | ||||||||
| Dividends paid to non-controlling interests | (12 | ) | (8 | ) | ||||||||
| Contributions by non-controlling interests of subsidiaries | 5 | — | ||||||||||
| Tax withholdings on vesting of equity awards | (1 | ) | — | |||||||||
| Issue of Common Shares on exercise of stock options | — | 50 | ||||||||||
| Issues of debt | 3 | 14 | ||||||||||
| Cash used for financing activities | $ | (381 | ) | $ | (217 | ) | $ | (164 | ) | |||
During the second quarter of 2022 we repurchased 3.5 million Common Shares under normal course issuer bids for aggregate cash consideration of $212 million.
Cash dividends paid per Common Share were $0.45 for the second quarter of 2022 compared to $0.43 for the second quarter of 2021.
| 16 | Magna International Inc. Second Quarter Report 2022 |
FINANCING RESOURCES
| As at | As at | |||||||||||
| June 30, | December 31, | |||||||||||
| 2022 | 2021 | Change | ||||||||||
| Liabilities | ||||||||||||
| Long-term debt due within one year | $ | 105 | $ | 455 | ||||||||
| Current portion of operating lease liabilities | 270 | 274 | ||||||||||
| Long-term debt | 3,408 | 3,538 | ||||||||||
| Operating lease liabilities | 1,294 | 1,406 | ||||||||||
| $ | 5,077 | $ | 5,673 | $ | (596 | ) | ||||||
Financial liabilities decreased $596 million to $5.08 billion as at June 30, 2022 primarily as a result of redeeming the Cdn$425 million [$336 million] 3.100% Senior Notes during the first quarter of 2022 and the weakening of foreign currencies against the U.S. dollar.
CASH RESOURCES
In the second quarter of 2022, our cash resources decreased by $332 million to $1.7 billion, primarily as a result of cash used for financing and investing activities partially offset by cash provided from operating activities, as discussed above. In addition to our cash resources at June 30, 2022, we had term and operating lines of credit totaling $3.7 billion, of which $3.5 billion was unused and available.
MAXIMUM NUMBER OF SHARES ISSUABLE
The following table presents the maximum number of shares that would be outstanding if all of the outstanding options at July 28, 2022 were exercised:
| Common Shares | 288,962,417 | ||
| Stock options (i) | 6,038,388 | ||
| 295,000,805 |
| (i) | Options to purchase Common Shares are exercisable by the holder in accordance with the vesting provisions and upon payment of the exercise price as may be determined from time to time pursuant to our stock option plans. |
CONTRACTUAL OBLIGATIONS
There have been no material changes with respect to the contractual obligations requiring annual payments during the six months ended June 30, 2022 that are outside the ordinary course of our business. Refer to our MD&A included in our 2021 Annual Report.
| Magna International Inc. Second Quarter Report 2022 | 17 |
RESULTS OF OPERATIONS – FOR THE SIX MONTHS ENDED JUNE 30, 2022
| For the six months ended June 30, | ||||||||||||||||||||||||
| Sales | Adjusted EBIT | |||||||||||||||||||||||
| 2022 | 2021 | Change | 2022 | 2021 | Change | |||||||||||||||||||
| Body Exteriors & Structures | $ | 8,024 | $ | 7,672 | $ | 352 | $ | 420 | $ | 554 | $ | (134 | ) | |||||||||||
| Power & Vision | 5,934 | 6,037 | (103 | ) | 245 | 500 | (255 | ) | ||||||||||||||||
| Seating Systems | 2,629 | 2,469 | 160 | 51 | 81 | (30 | ) | |||||||||||||||||
| Complete Vehicles | 2,678 | 3,340 | (662 | ) | 113 | 159 | (46 | ) | ||||||||||||||||
| Corporate and Other | (261 | ) | (305 | ) | 44 | 36 | 33 | 3 | ||||||||||||||||
| Total reportable segments | $ | 19,004 | $ | 19,213 | $ | (209 | ) | $ | 865 | $ | 1,327 | $ | (462 | ) | ||||||||||
BODY EXTERIORS & STRUCTURES
| For the six months | ||||||||||||||||
| ended June 30, | ||||||||||||||||
| 2022 | 2021 | Change | ||||||||||||||
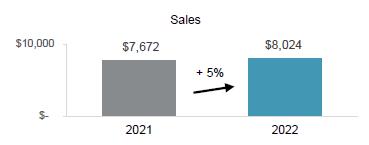
| Sales | $ | 8,024 | $ | 7,672 | $ | 352 | + | 5 | % | |||||||
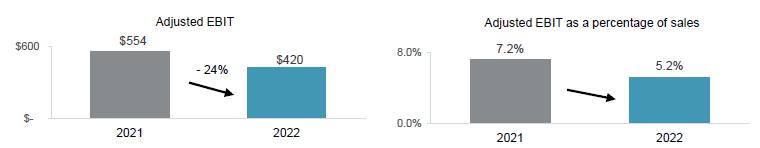
| Adjusted EBIT | $ | 420 | $ | 554 | $ | (134 | ) | - | 24 | % | ||||||
| Adjusted EBIT as a percentage of sales | 5.2 | % | 7.2 | % | - | 2.0 | % | |||||||||
Sales – Body Exteriors & Structures
Sales increased 5% or $352 million to $8.02 billion for the six months ended June 30, 2022 compared to $7.67 billion for the six months ended June 30, 2021, primarily due to:
| · | the launch of programs during or subsequent to the first six months of 2022, including the: |
| · | Jeep Wagoneer and Grand Wagoneer; |
| · | Ford Maverick; |
| · | Ford Bronco; and | |
| · | Nissan Qashqai; and |
| · | customer price increases to recover certain higher production input costs. |
These factors were partially offset by:
| · | the net weakening of foreign currencies against the U.S. dollar, which decreased reported U.S. dollar sales by $260 million; |
| · | divestitures, net of acquisitions subsequent to the first six months of 2021, which decreased sales by $170 million; |
| · | lower global light vehicle production; |
| · | lower sales at facilities in Russia; and |
| · | net customer price concessions subsequent to the first six months of 2021. |
| 18 | Magna International Inc. Second Quarter Report 2022 |
Adjusted EBIT and Adjusted EBIT as a percentage of sales – Body Exteriors & Structures
Adjusted EBIT decreased $134 million to $420 million for the six months ended June 30, 2022 compared to $554 million for the six months ended June 30, 2021 and Adjusted EBIT as a percentage of sales decreased to 5.2% from 7.2% primarily as a result of:
| · | higher net production input costs, including commodity, energy, labour and freight costs; |
| · | inefficiencies and other costs at certain underperforming facilities; |
| · | reduced earnings on lower sales at facilities in Russia; |
| · | the net weakening of foreign currencies against the U.S. dollar that had a $12 million unfavourable impact on reported U.S. dollar Adjusted EBIT; and |
| · | a favourable value-added tax settlement in Brazil during the second quarter of 2021. |
These factors were partially offset by:
| · | higher favourable commercial settlements; |
| · | earnings on higher sales; |
| · | divestitures, net of acquisitions subsequent to the second quarter of 2021; and |
| · | lower launch costs. |
POWER & VISION
| For the six months | ||||||||||||||||
| ended June 30, | ||||||||||||||||
| 2022 | 2021 | Change | ||||||||||||||
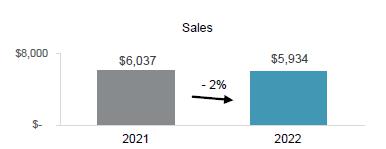
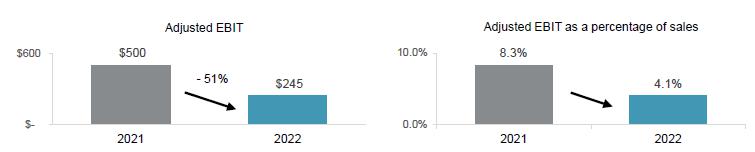
| Sales | $ | 5,934 | $ | 6,037 | $ | (103 | ) | - | 2 | % | ||||||
| Adjusted EBIT | $ | 245 | $ | 500 | $ | (255 | ) | - | 51 | % | ||||||
| Adjusted EBIT as a percentage of sales | 4.1 | % | 8.3 | % | - | 4.2 | % | |||||||||
| Magna International Inc. Second Quarter Report 2022 | 19 |
Sales – Power & Vision
Sales decreased 2% or $103 million to $5.93 billion for the six months ended June 30, 2022 compared to $6.04 billion for the six months ended June 30, 2021, primarily due to:
| • | the net weakening of foreign currencies against the U.S. dollar, which decreased reported U.S. dollar sales by $288 million; |
| • | lower global light vehicle production; and |
| • | net customer price concessions subsequent to the first six months of 2021. |
These factors were partially offset by:
| • | the launch of programs during or subsequent to the first six months of 2021, including the: |
| • | Ford Bronco; |
| • | Jeep Wagoneer and Grand Wagoneer; |
| • | Toyota Tundra; and |
| • | Renault Kangoo/Be Bop; |
| • | an acquisition during the first six months of 2021, which increased sales by $37 million; and |
| • | customer price increases to recover certain higher production input costs. |
Adjusted EBIT and Adjusted EBIT as a percentage of sales – Power & Vision
Adjusted EBIT decreased $255 million to $245 million for the six months ended June 30, 2022 compared to $500 million for the six months ended June 30, 2021 and Adjusted EBIT as a percentage of sales decreased to 4.1% from 8.3%. These decreases were primarily due to:
| • | higher net production input costs, including commodity, freight, energy and labour costs; |
| • | lower equity income; |
| • | higher electrification spending, including at certain equity-accounted entities; |
| • | inefficiencies and other costs at certain underperforming facilities; and |
| • | a favourable value-added tax settlement in Brazil during the second quarter of 2021. |
These factors were partially offset by:
| • | higher net favourable commercial settlements. |
| • | lower net warranty costs of $19 million; and |
| • | lower net engineering costs related to our ADAS business. |
| 20 | Magna International Inc. Second Quarter Report 2022 |
SEATING SYSTEMS
| For the six months | ||||||||||||||||
| ended June 30, | ||||||||||||||||
| 2022 | 2021 | Change | ||||||||||||||
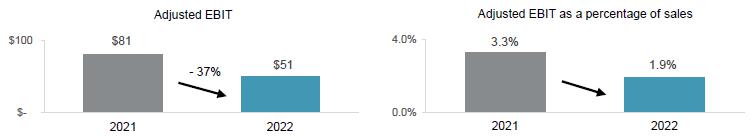
| Sales | $ | 2,629 | $ | 2,469 | $ | 160 | + | 6 | % | |||||||
| Adjusted EBIT | $ | 51 | $ | 81 | $ | (30 | ) | - | 37 | % | ||||||
| Adjusted EBIT as a percentage of sales | 1.9 | % | 3.3 | % | - | 1.4 | % | |||||||||
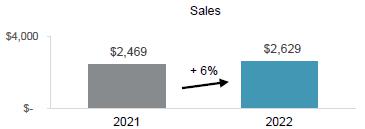
Sales – Seating Systems
Sales increased 6% or $160 million to $2.63 billion for the six months ended June 30, 2022 compared to $2.47 billion for the six months ended June 30, 2021, primarily due to:
| • | the launch of programs during or subsequent to the first six months of 2021, including the: |
| • | Jeep Grand Cherokee; |
| • | BYD Yuan Plus; |
| • | Skoda Fabia; |
| • | BYD Qin Plus; and |
| • | customer price increases to recover certain higher production input costs. |
These factors were partially offset by:
| • | the net weakening of foreign currencies against the U.S. dollar, which decreased reported U.S. dollar sales by $138 million; |
| • | lower sales at facilities in Russia; and |
| • | net customer price concessions subsequent to the first six months of 2021. |
Adjusted EBIT and Adjusted EBIT as a percentage of sales – Seating Systems
Adjusted EBIT decreased $30 million to $51 million for the six months ended June 30, 2022 compared to $81 million for the six months ended June 30, 2021 and Adjusted EBIT as a percentage of sales decreased to 1.9% from 3.3%. These decreases were primarily due to:
| • | higher net production input costs, including commodity, freight and labour costs; | |
| • | reduced earnings on lower sales at facilities in Russia; and | |
| • | a favourable value-added tax settlement in Brazil during the second quarter of 2021. |
These factors were partially offset by:
| • | earnings on higher sales; | |
| • | favourable commercial settlements during the first six months of 2022; and | |
| • | productivity and efficiency improvements at certain underperforming facilities. |
| Magna International Inc. Second Quarter Report 2022 | 21 |
COMPLETE VEHICLES
| For the six months ended June 30, | ||||||||||||||||
| 2022 | 2021 | Change | ||||||||||||||
| Complete Vehicle Assembly Volumes (thousands of units)(i) | 55.6 | 69.6 | (14.0 | ) | - | 20 | % | |||||||||
| Sales | $ | 2,678 | $ | 3,340 | $ | (662 | ) | - | 20 | % | ||||||
| Adjusted EBIT | $ | 113 | $ | 159 | $ | (46 | ) | - | 29 | % | ||||||
| Adjusted EBIT as a percentage of sales | 4.2 | % | 4.8 | % | - | 0.6 | % | |||||||||
| (i) | Vehicles produced at our Complete Vehicle operations are included in Europe Light Vehicle Production volumes. |
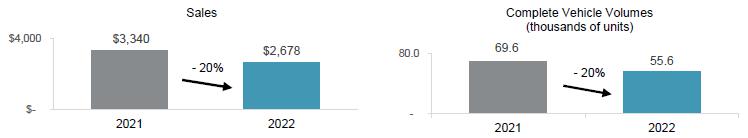
Sales – Complete Vehicles
Sales decreased 20% or $662 million to $2.68 billion for the six months ended June 30, 2022 compared to $3.34 billion for the six months ended June 30, 2021 and assembly volumes decreased 20%. The decrease in sales is primarily as a result of the impact of lower assembly volumes and a $277 million decrease in reported U.S. dollar sales as a result of the weakening of the euro against the U.S. dollar partially offset by favourable program mix.

Adjusted EBIT and Adjusted EBIT as a percentage of sales – Complete Vehicles
Adjusted EBIT decreased $46 million to $113 million for the six months ended June 30, 2022 compared to $159 million for the six months ended June 30, 2021 and Adjusted EBIT as a percentage of sales decreased to 4.2% from 4.8%. These decreases were primarily due to:
| • | lower assembly volumes, net of contractual fixed cost recoveries on certain programs; | |
| • | higher net production input costs, including energy and labour costs; | |
| • | the net weakening of the euro against the U.S. dollar, which had an unfavourable $10 million impact on reported U.S. dollar Adjusted EBIT; and | |
| • | unfavourable program mix. |
These factors were partially offset by higher margins on engineering programs.
| 22 | Magna International Inc. Second Quarter Report 2022 |
CORPORATE AND OTHER
Adjusted EBIT was $36 million for the six months ended June 30, 2022 compared to $33 million for the six months ended June 30, 2021. The $3 million improvement was primarily the result of:
| • | amortization related to public company securities; and | |
| • | lower incentive compensation and employee profit sharing. |
These factors were partially offset by:
| • | a decrease in fees received from our divisions; | |
| • | higher costs to accelerate our operational excellence initiatives; and | |
| • | transactional foreign exchange losses in the six months ended June 30, 2022 compared to gains in the six months ended June 30, 2021. |
NON-GAAP PERFORMANCE MEASURES - FOR THE SIX MONTHS ENDED JUNE 30, 2022
ADJUSTED EBIT AS A PERCENTAGE OF SALES
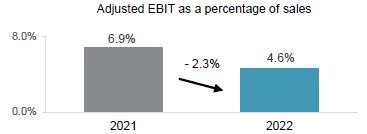
The table below shows the change in Magna's Sales and Adjusted EBIT by segment and the impact each segment's changes have on Magna's Adjusted EBIT as a percentage of sales for the six months ended June 30, 2022 compared to the six months ended June 30, 2021:
| Adjusted EBIT | ||||||||||||
| Adjusted | as a percentage | |||||||||||
| Sales | EBIT | of sales | ||||||||||
| Six months ended June 30, 2021 | $ | 19,213 | $ | 1,327 | + | 6.9 | % | |||||
| Increase related to: | ||||||||||||
| Body Exteriors & Structures | 352 | (134 | ) | - | 0.8 | % | ||||||
| Power & Vision | (103 | ) | (255 | ) | - | 1.3 | % | |||||
| Seating Systems | 160 | (30 | ) | - | 0.2 | % | ||||||
| Complete Vehicles | (662 | ) | (46 | ) | — | |||||||
| Corporate and Other | 44 | 3 | — | |||||||||
| Six months ended June 30, 2022 | $ | 19,004 | $ | 865 | + | 4.6 | % | |||||
Adjusted EBIT as a percentage of sales decreased to 4.6% for the six months ended June 30, 2022 compared to 6.9% for the six months ended June 30, 2021 primarily due to:
| • | higher net production input costs, including commodity, energy, labour and freight costs; | |
| • | inefficiencies and other costs at certain underperforming facilities; | |
| • | higher launch costs; | |
| • | lower equity income; | |
| • | reduced earnings on lower sales at facilities in Russia; | |
| • | a favourable value-added tax settlement in Brazil during the second quarter of 2021; and | |
| • | higher electrification spending, including at certain equity-accounted entities. |
These factors were partially offset by:
| • | higher favourable commercial settlements; | |
| • | lower net warranty costs; | |
| • | lower employee profit sharing and incentive compensation; | |
| • | amortization related to public company securities; and | |
| • | divestitures, net of acquisitions subsequent to the six months ended June 30, 2021. |
| Magna International Inc. Second Quarter Report 2022 | 23 |
RETURN ON INVESTED CAPITAL
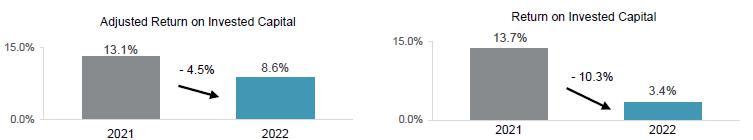
Adjusted Return on Invested Capital decreased to 8.6% for the six months ended June 30, 2022 compared to 13.1% for the six months ended June 30, 2021 as a result of a decrease in Adjusted After-tax operating profits and higher Average Invested Capital. Other expense (income), net, after tax and Adjustments to Deferred Tax Valuation Allowances negatively impacted Return on Invested Capital by 5.2% in the first six months of 2022 and positively impacted Return on Invested Capital by 0.6% in the first six months of 2021.
Average Invested Capital increased $145 million to $16.02 billion for the six months ended June 30, 2022 compared to $15.87 billion for the six months ended June 30, 2021, primarily due to:
| • | acquisitions, net of divestitures during and subsequent to the first six months of 2021; and | |
| • | an increase in average changes in operating assets and liabilities. |
These factors were partially offset by:
| • | the net weakening of foreign currencies against the U.S. dollar; and | |
| • | the impairment of assets recorded during the first six months of 2022. |
RETURN ON EQUITY
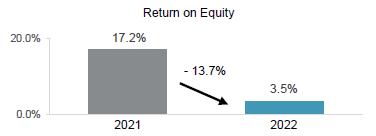
Return on Equity was 3.5% for the six months ended June 30, 2022 compared to 17.2% for the six months ended June 30, 2021. This decrease was due to lower net income attributable to Magna partially offset by lower average shareholders' equity. Other expense (income), net, after tax and Adjustments to Deferred Tax Valuation Allowances negatively impacted Return on Equity by 7.0% in the first six months of 2022 and positively impacted Return on Equity by 0.8% in the first six months of 2021.
| 24 | Magna International Inc. Second Quarter Report 2022 |
NON-GAAP FINANCIAL MEASURES RECONCILIATION
The reconciliation of Non-GAAP financial measures is as follows:
ADJUSTED EBIT
| For the three months | For the six months | |||||||||||||||
| ended June 30, | ended June 30, | |||||||||||||||
| 2022 | 2021 | 2022 | 2021 | |||||||||||||
| Net (loss) income | $ | (145 | ) | $ | 436 | $ | 234 | $ | 1,058 | |||||||
| Add (deduct): | ||||||||||||||||
| Interest expense, net | 20 | 11 | 46 | 34 | ||||||||||||
| Other expense (income), net | 426 | 6 | 487 | (52 | ) | |||||||||||
| Income taxes | 57 | 104 | 98 | 287 | ||||||||||||
| Adjusted EBIT | $ | 358 | $ | 557 | $ | 865 | $ | 1,327 | ||||||||
ADJUSTED EBIT AS A PERCENTAGE OF SALES
| For the three months | For the six months | |||||||||||||||
| ended June 30, | ended June 30, | |||||||||||||||
| 2022 | 2021 | 2022 | 2021 | |||||||||||||
| Sales | $ | 9,362 | $ | 9,034 | $ | 19,004 | $ | 19,213 | ||||||||
| Adjusted EBIT | $ | 358 | $ | 557 | $ | 865 | $ | 1,327 | ||||||||
| Adjusted EBIT as a percentage of sales | 3.8 | % | 6.2 | % | 4.6 | % | 6.9 | % | ||||||||
ADJUSTED DILUTED EARNINGS PER SHARE
| For the three months | For the six months | |||||||||||||||
| ended June 30, | ended June 30, | |||||||||||||||
| 2022 | 2021 | 2022 | 2021 | |||||||||||||
| Net (loss) income attributable to Magna International Inc. | $ | (156 | ) | $ | 424 | $ | 208 | $ | 1,039 | |||||||
| Add (deduct): | ||||||||||||||||
| Other expense (income), net | 426 | 6 | 487 | (52 | ) | |||||||||||
| Tax effect on Other expense (income), net | (27 | ) | (4 | ) | (40 | ) | 5 | |||||||||
| Adjustments to Deferred Tax Valuation Allowances | — | — | (29 | ) | — | |||||||||||
| Adjusted net income attributable to Magna International Inc. | 243 | 426 | 626 | 992 | ||||||||||||
| Diluted weighted average number of Common Shares outstanding during the period (millions) | 291.1 | 303.6 | 295.0 | 303.6 | ||||||||||||
| Adjusted diluted earnings per share | $ | 0.83 | $ | 1.40 | $ | 2.12 | $ | 3.27 | ||||||||
| Magna International Inc. Second Quarter Report 2022 | 25 |
RETURN ON INVESTED CAPITAL AND ADJUSTED RETURN ON INVESTED CAPITAL
Return on Invested Capital is calculated as After-tax operating profits divided by Average Invested Capital for the period. Adjusted Return on Invested Capital is calculated as Adjusted After-tax operating profits divided by Average Invested Capital for the period. Average Invested Capital for the three month period is averaged on a two-fiscal quarter basis and for the six month period is averaged on a three-fiscal quarter basis.
| For the three months | For the six months | |||||||||||||||
| ended June 30, | ended June 30, | |||||||||||||||
| 2022 | 2021 | 2022 | 2021 | |||||||||||||
| Net (loss) income | $ | (145 | ) | $ | 436 | $ | 234 | $ | 1,058 | |||||||
| Add (deduct): | ||||||||||||||||
| Interest expense, net | 20 | 11 | 46 | 34 | ||||||||||||
| Income taxes on interest expense, net at Magna's effective income tax rate: | (5 | ) | (2 | ) | (9 | ) | (7 | ) | ||||||||
| After-tax operating profits | (130 | ) | 445 | 271 | 1,085 | |||||||||||
| Other expense (income), net | 426 | 6 | 487 | (52 | ) | |||||||||||
| Tax effect on Other expense (income), net | (27 | ) | (4 | ) | (40 | ) | 5 | |||||||||
| Adjustments to Deferred Tax Valuation Allowances | — | — | (29 | ) | — | |||||||||||
| Adjusted After-tax operating profits | $ | 269 | $ | 447 | $ | 689 | $ | 1,038 | ||||||||
| As at June 30, | ||||||||
| 2022 | 2021 | |||||||
| Total Assets | $ | 27,283 | $ | 29,546 | ||||
| Excluding: | ||||||||
| Cash and cash equivalents | (1,664 | ) | (3,426 | ) | ||||
| Deferred tax assets | (491 | ) | (389 | ) | ||||
| Less Current Liabilities | (9,816 | ) | (9,864 | ) | ||||
| Excluding: | ||||||||
| Long-term debt due within one year | 105 | 117 | ||||||
| Current portion of operating lease liabilities | 270 | 278 | ||||||
| Invested Capital | $ | 15,687 | $ | 16,262 | ||||
| For the three months | For the six months | |||||||||||||||
| ended June 30, | ended June 30, | |||||||||||||||
| 2022 | 2021 | 2022 | 2021 | |||||||||||||
| After-tax operating profits | $ | (130 | ) | $ | 445 | $ | 271 | $ | 1,085 | |||||||
| Average Invested Capital | $ | 16,006 | $ | 16,015 | $ | 16,019 | $ | 15,874 | ||||||||
| Return on Invested Capital | (3.2 | )% | 11.1 | % | 3.4 | % | 13.7 | % | ||||||||
| For the three months | For the six months | |||||||||||||||
| ended June 30, | ended June 30, | |||||||||||||||
| 2022 | 2021 | 2022 | 2021 | |||||||||||||
| Adjusted After-tax operating profits | $ | 269 | $ | 447 | $ | 689 | $ | 1,038 | ||||||||
| Average Invested Capital | $ | 16,006 | $ | 16,015 | $ | 16,019 | $ | 15,874 | ||||||||
| Adjusted Return on Invested Capital | 6.7 | % | 11.2 | % | 8.6 | % | 13.1 | % | ||||||||
| 26 | Magna International Inc. Second Quarter Report 2022 |
RETURN ON EQUITY
Return on Equity is discussed in the "Non-GAAP Performance Measures" section and is calculated in the table below:
| For the three months | For the six months | |||||||||||||||
| ended June 30, | ended June 30, | |||||||||||||||
| 2022 | 2021 | 2022 | 2021 | |||||||||||||
| Net (loss) income attributable to Magna International Inc. | $ | (156 | ) | $ | 424 | $ | 208 | $ | 1,039 | |||||||
| Average Shareholders' Equity | $ | 11,692 | $ | 12,246 | $ | 11,869 | $ | 12,071 | ||||||||
| Return on Equity | (5.3 | )% | 13.8 | % | 3.5 | % | 17.2 | % | ||||||||
COMMITMENTS AND CONTINGENCIES
From time to time, we may be contingently liable for litigation, legal and/or regulatory actions and proceedings and other claims. Refer to Note 14, "Contingencies" of our unaudited interim consolidated financial statements for the three and six months ended June 30, 2022, which describes these claims.
For a discussion of risk factors relating to legal and other claims/actions against us, refer to "Item 5. Risk Factors" in our Annual Information Form and Annual Report on Form 40-F, each in respect of the year ended December 31, 2021.
CONTROLS AND PROCEDURES
There have been no changes in our internal controls over financial reporting that occurred during the three months ended June 30, 2022 that have materially affected, or are reasonably likely to materially affect, our internal control over financial reporting.
| Magna International Inc. Second Quarter Report 2022 | 27 |
FORWARD-LOOKING STATEMENTS
Certain statements in this MD&A may constitute "forward-looking information" or "forward-looking statements" (collectively, "forward-looking statements"). Any such forward-looking statements are intended to provide information about management's current expectations and plans and may not be appropriate for other purposes. Forward-looking statements may include financial and other projections, as well as statements regarding our future plans, strategic objectives or economic performance, or the assumptions underlying any of the foregoing, and other statements that are not recitations of historical fact. We use words such as "may", "would", "could", "should", "will", "likely", "expect", "anticipate", "believe", "intend", "plan", "aim", "forecast", "outlook", "project", "estimate", "target" and similar expressions suggesting future outcomes or events to identify forward-looking statements.
The following table identifies the material forward-looking statements contained in this document, together with the material potential risks that we currently believe could cause actual results to differ materially from such forward-looking statements. Readers should also consider all of the risk factors which follow below the table:
| Material Forward-Looking Statement | Material Potential Risks Related to Applicable Forward-Looking Statement |
Russian Invasion of Ukraine
| • Impact on global economic growth • Disruption of production in Russia • Lower industry production volumes and lower Magna sales • Higher energy, commodity, transportation/logistics and other input costs • Potential disruption of energy supply to Western European operations • Disruption of supply chains, including potential worsening of semiconductor chip shortage • Increasing cybersecurity threats • Expropriation risks |
| Impact of energy shortages/rationing initiatives | • Risks related to production shutdowns due to energy shortages/rationing. These risks include: • Lower sales • Higher energy costs • Premium freight costs to expedite shipments; and/or other unrecoverable costs • Price increases from sub-suppliers that have been negatively impacted by production inefficiencies, premium freight costs and/or other costs related to production shutdowns resulting from energy rationing |
| Impact of supply chain disruptions | • Risks related to supply chain disruptions include: • Lower sales • Higher commodity costs • Production inefficiencies due to production lines being stopped/restarted unexpectedly • Premium freight costs to expedite shipments; and/or other unrecoverable costs • Price increases from sub-suppliers that have been negatively impacted by production inefficiencies, premium freight costs and/or other costs related to the commodity shortages |
| Inflationary price increases | • Commodity cost volatility • Increase in our cost structure as a result of inability to offset inflationary price increases through continuous improvement actions, price increases, adjustments to our own operations or otherwise • Price increases or surcharges from sub-suppliers in connection with inflationary pressures they face • Skilled labour attraction/retention, including as a result of wage pressures in some markets |
| Rising interest rates | • Impact of higher interest rates and availability of credit on consumer confidence and in turn vehicle sales and vehicle production |
| 28 | Magna International Inc. Second Quarter Report 2022 |
Forward-looking statements are based on information currently available to us, and are based on assumptions and analyses made by us in light of our experience and our perception of historical trends, current conditions and expected future developments, as well as other factors we believe are appropriate in the circumstances. While we believe we have a reasonable basis for making any such forward-looking statements, they are not a guarantee of future performance or outcomes. Whether actual results and developments conform to our expectations and predictions is subject to a number of risks, assumptions and uncertainties, many of which are beyond our control, and the effects of which can be difficult to predict, including, without limitation:
| Risks Related to the Automotive Industry | Pricing Risks | ||
• economic cyclicality; • regional production volume declines; • intense competition; • potential restrictions on free trade; • trade disputes/tariffs;
Customer and Supplier Related Risks
• concentration of sales with six customers; • emergence of potentially disruptive Electric Vehicle OEMs, including risks related to limited revenues/operating history of new OEM entrants; • OEM consolidation and cooperation; • shifts in market shares among vehicles or vehicle segments; • shifts in consumer "take rates" for products we sell; • dependence on outsourcing; • quarterly sales fluctuations; • potential loss of any material purchase orders; • a deterioration in the financial condition of our supply base;
Manufacturing Operational Risks
• risks arising from Russia’s invasion of Ukraine and compliance with the sanctions regime imposed in response; • impact of the semiconductor chip shortage on OEM production volumes and on the efficiency of our operations; • risks related to COVID-19; • supply disruptions and higher costs to mitigate such disruptions; • regional energy shortages and price increases; • skilled labour attraction/retention; • product and new facility launch risks; • operational underperformance; • restructuring costs; • impairment charges; • labour disruptions; • climate change risks; • leadership succession;
IT Security/Cybersecurity Risks
• IT/Cybersecurity breach; • Product cybersecurity breach; | • inflationary pressures; • pricing risks following time of quote or award of new business; • price concessions; • commodity cost volatility; • declines in scrap steel/aluminum prices;
Warranty / Recall Risks
• costs related to repair or replace defective products, including due to a recall; • warranty or recall costs that exceed warranty provisions or insurance coverage limits; • product liability claims;
Acquisition Risks
• competition for strategic acquisition targets; • inherent merger and acquisition risks; • acquisition integration risk;
Other Business Risks
• risks related to conducting business through joint ventures; • our ability to consistently develop and commercialize innovative products or processes; • intellectual property risks; • our changing business risk profile as a result of increased investment in electrification and autonomous/assisted driving, including: higher R&D and engineering costs, and challenges in quoting for profitable returns on products for which we may not have significant quoting experience; • risks of conducting business in foreign markets; • fluctuations in relative currency values; • tax risks; • reduced financial flexibility as a result of an economic shock; • changes in credit ratings assigned to us.
Legal, Regulatory and Other Risks
• antitrust risk; • legal claims and/or regulatory actions against us; and changes in laws and regulations, including those related to vehicle emissions or made as a result of the COVID-19 pandemic. |
In evaluating forward-looking statements, we caution readers not to place undue reliance on any forward-looking statement. Additionally, readers should specifically consider the various factors which could cause actual events or results to differ materially from those indicated by such forward-looking statements, including the risks, assumptions and uncertainties above which are:
| • | discussed under the "Industry Trends and Risks" heading of our Management's Discussion and Analysis; and | |
| • | set out in our Annual Information Form filed with securities commissions in Canada, our annual report on Form 40-F filed with the United States Securities and Exchange Commission, and subsequent filings. |
Readers should also consider discussion of our risk mitigation activities with respect to certain risk factors, which can also be found in our Annual Information Form.
| Magna International Inc. Second Quarter Report 2022 | 29 |
MAGNA INTERNATIONAL INC.
CONSOLIDATED STATEMENTS OF (LOSS) INCOME
[Unaudited]
[U.S. dollars in millions, except per share figures]
| Three months ended | Six months ended | |||||||||||||||||||
| June 30, | June 30, | |||||||||||||||||||
| Note | 2022 | 2021 | 2022 | 2021 | ||||||||||||||||
| Sales | 15 | $ | 9,362 | $ | 9,034 | $ | 19,004 | $ | 19,213 | |||||||||||
| Costs and expenses | ||||||||||||||||||||
| Cost of goods sold | 8,259 | 7,728 | 16,659 | 16,390 | ||||||||||||||||
| Depreciation and amortization | 360 | 374 | 729 | 738 | ||||||||||||||||
| Selling, general and administrative | 410 | 419 | 796 | 849 | ||||||||||||||||
| Interest expense, net | 20 | 11 | 46 | 34 | ||||||||||||||||
| Equity income | (25 | ) | (44 | ) | (45 | ) | (91 | ) | ||||||||||||
| Other expense (income), net | 2 | 426 | 6 | 487 | (52 | ) | ||||||||||||||
| (Loss) income from operations before income taxes | (88 | ) | 540 | 332 | 1,345 | |||||||||||||||
| Income taxes | 10 | 57 | 104 | 98 | 287 | |||||||||||||||
| Net (loss) income | (145 | ) | 436 | 234 | 1,058 | |||||||||||||||
| Income attributable to non-controlling interests | (11 | ) | (12 | ) | (26 | ) | (19 | ) | ||||||||||||
| Net (loss) income attributable to Magna International Inc. | $ | (156 | ) | $ | 424 | $ | 208 | $ | 1,039 | |||||||||||
| (Loss) earnings per Common Share: | 3 | |||||||||||||||||||
| Basic | $ | (0.54 | ) | $ | 1.41 | $ | 0.71 | $ | 3.45 | |||||||||||
| Diluted | $ | (0.54 | ) | $ | 1.40 | $ | 0.70 | $ | 3.42 | |||||||||||
| Cash dividends paid per Common Share | $ | 0.45 | $ | 0.43 | $ | 0.90 | $ | 0.86 | ||||||||||||
| Weighted average number of Common Shares outstanding during the period [in millions]: | 3 | |||||||||||||||||||
| Basic | 291.1 | 301.1 | 293.8 | 301.0 | ||||||||||||||||
| Diluted | 291.1 | 303.6 | 295.0 | 303.6 | ||||||||||||||||
See accompanying notes
| 30 | Magna International Inc. Second Quarter Report 2022 |
MAGNA INTERNATIONAL INC.
CONSOLIDATED STATEMENTS OF COMPREHENSIVE (LOSS) INCOME
[Unaudited]
[U.S. dollars in millions]
| Three months ended | Six months ended | |||||||||||||||||||
| June 30, | June 30, | |||||||||||||||||||
| Note | 2022 | 2021 | 2022 | 2021 | ||||||||||||||||
| Net (loss) income | $ | (145 | ) | $ | 436 | $ | 234 | $ | 1,058 | |||||||||||
| Other comprehensive (loss) income, net of tax: | 12 | |||||||||||||||||||
| Net unrealized (loss) gain on translation of net investment in foreign operations | (348 | ) | 105 | (446 | ) | (3 | ) | |||||||||||||
| Net unrealized (loss) gain on cash flow hedges | (50 | ) | 34 | 5 | 47 | |||||||||||||||
| Reclassification of net gain on cash flow hedges to net income | (13 | ) | (10 | ) | (19 | ) | (18 | ) | ||||||||||||
| Reclassification of net loss on pensions to net income | 1 | 1 | 2 | 4 | ||||||||||||||||
| Reserve for cumulative translation losses | 203 | — | 203 | — | ||||||||||||||||
| Pension and post retirement benefits | — | 1 | 1 | 1 | ||||||||||||||||
| Other comprehensive (loss) income | (207 | ) | 131 | (254 | ) | 31 | ||||||||||||||
| Comprehensive (loss) income | (352 | ) | 567 | (20 | ) | 1,089 | ||||||||||||||
| Comprehensive loss (income) attributable to non-controlling interests | 11 | (17 | ) | (2 | ) | (21 | ) | |||||||||||||
| Comprehensive (loss) income attributable to Magna International Inc. | $ | (341 | ) | $ | 550 | $ | (22 | ) | $ | 1,068 | ||||||||||
See accompanying notes
| Magna International Inc. Second Quarter Report 2022 | 31 |
MAGNA INTERNATIONAL INC.
CONSOLIDATED BALANCE SHEETS
[Unaudited]
[U.S. dollars in millions]
| As at | As at | |||||||||||
| June 30, | December 31, | |||||||||||
| Note | 2022 | 2021 | ||||||||||
| ASSETS | ||||||||||||
| Current assets | ||||||||||||
| Cash and cash equivalents | 4 | $ | 1,664 | $ | 2,948 | |||||||
| Accounts receivable | 6,764 | 6,307 | ||||||||||
| Inventories | 5 | 4,064 | 3,969 | |||||||||
| Prepaid expenses and other | 262 | 278 | ||||||||||
| 12,754 | 13,502 | |||||||||||
| Investments | 6 | 1,375 | 1,593 | |||||||||
| Fixed assets, net | 7,723 | 8,293 | ||||||||||
| Operating lease right-of-use assets | 1,587 | 1,700 | ||||||||||
| Intangible assets, net | 444 | 493 | ||||||||||
| Goodwill | 1,998 | 2,122 | ||||||||||
| Deferred tax assets | 491 | 421 | ||||||||||
| Other assets | 7 | 911 | 962 | |||||||||
| $ | 27,283 | $ | 29,086 | |||||||||
| LIABILITIES AND SHAREHOLDERS' EQUITY | ||||||||||||
| Current liabilities | ||||||||||||
| Accounts payable | $ | 6,443 | $ | 6,465 | ||||||||
| Other accrued liabilities | 8 | 2,096 | 2,156 | |||||||||
| Accrued salaries and wages | 766 | 851 | ||||||||||
| Income taxes payable | 136 | 200 | ||||||||||
| Long-term debt due within one year | 105 | 455 | ||||||||||
| Current portion of operating lease liabilities | 270 | 274 | ||||||||||
| 9,816 | 10,401 | |||||||||||
| Long-term debt | 3,408 | 3,538 | ||||||||||
| Operating lease liabilities | 1,294 | 1,406 | ||||||||||
| Long-term employee benefit liabilities | 651 | 700 | ||||||||||
| Other long-term liabilities | 390 | 376 | ||||||||||
| Deferred tax liabilities | 380 | 440 | ||||||||||
| 15,939 | 16,861 | |||||||||||
| Shareholders' equity | ||||||||||||
| Capital stock | ||||||||||||
| Common Shares | ||||||||||||
| [issued: 288,962,417; December 31, 2021 – 288,962,417] | 11 | 3,326 | 3,403 | |||||||||
| Contributed surplus | 96 | 102 | ||||||||||
| Retained earnings | 8,662 | 9,231 | ||||||||||
| Accumulated other comprehensive loss | 12 | (1,124 | ) | (900 | ) | |||||||
| 10,960 | 11,836 | |||||||||||
| Non-controlling interests | 384 | 389 | ||||||||||
| 11,344 | 12,225 | |||||||||||
| $ | 27,283 | $ | 29,086 | |||||||||
See accompanying notes
| 32 | Magna International Inc. Second Quarter Report 2022 |
MAGNA INTERNATIONAL INC.
CONSOLIDATED STATEMENTS OF CASH FLOWS
[Unaudited]
[U.S. dollars in millions]
| Three months ended | Six months ended | |||||||||||||||||||
| June 30, | June 30, | |||||||||||||||||||
| Note | 2022 | 2021 | 2022 | 2021 | ||||||||||||||||
| Cash provided from (used for): | ||||||||||||||||||||
| OPERATING ACTIVITIES | ||||||||||||||||||||
| Net (loss) income | $ | (145 | ) | $ | 436 | $ | 234 | $ | 1,058 | |||||||||||
| Items not involving current cash flows | 4 | 705 | 341 | 1,075 | 690 | |||||||||||||||
| 560 | 777 | 1,309 | 1,748 | |||||||||||||||||
| Changes in operating assets and liabilities | 4 | (139 | ) | (249 | ) | (708 | ) | (559 | ) | |||||||||||
| Cash provided from operating activities | 421 | 528 | 601 | 1,189 | ||||||||||||||||
| INVESTMENT ACTIVITIES | ||||||||||||||||||||
| Fixed asset additions | (329 | ) | (277 | ) | (567 | ) | (489 | ) | ||||||||||||
| Increase in public and private equity investments | (2 | ) | (17 | ) | (4 | ) | (20 | ) | ||||||||||||
| Increase in investments, other assets and intangible assets | (80 | ) | (93 | ) | (144 | ) | (197 | ) | ||||||||||||
| Proceeds from disposition | 40 | 20 | 63 | 39 | ||||||||||||||||
| Proceeds on disposal of facilities | — | — | 6 | — | ||||||||||||||||
| Acquisitions | — | (21 | ) | — | 18 | |||||||||||||||
| Settlement of long-term receivable from non-consolidated joint venture | — | — | — | 50 | ||||||||||||||||
| Cash used for investing activities | (371 | ) | (388 | ) | (646 | ) | (599 | ) | ||||||||||||
| FINANCING ACTIVITIES | ||||||||||||||||||||
| Issues of debt | 3 | 14 | 31 | 23 | ||||||||||||||||
| Increase (decrease) in short-term borrowings | — | — | 1 | (101 | ) | |||||||||||||||
| Repayments of debt | (34 | ) | (47 | ) | (391 | ) | (81 | ) | ||||||||||||
| Issue of Common Shares on exercise of stock options | — | 50 | 4 | 133 | ||||||||||||||||
| Tax withholdings on vesting of equity awards | (1 | ) | — | (15 | ) | (12 | ) | |||||||||||||
| Contributions to subsidiaries by non-controlling interests | 5 | — | 5 | — | ||||||||||||||||
| Repurchase of Common Shares | 11 | (212 | ) | (99 | ) | (595 | ) | (261 | ) | |||||||||||
| Dividends paid to non-controlling interests | (12 | ) | (8 | ) | (12 | ) | (8 | ) | ||||||||||||
| Dividends paid | (130 | ) | (127 | ) | (263 | ) | (257 | ) | ||||||||||||
| Cash used for financing activities | (381 | ) | (217 | ) | (1,235 | ) | (564 | ) | ||||||||||||
| Effect of exchange rate changes on cash, cash equivalents and restricted cash equivalents | (1 | ) | 39 | (4 | ) | 26 | ||||||||||||||
| Net (decrease) increase in cash, cash equivalents during the period | (332 | ) | (38 | ) | (1,284 | ) | 52 | |||||||||||||
| Cash, cash equivalents and restricted cash equivalents, beginning of period | 1,996 | 3,464 | 2,948 | 3,374 | ||||||||||||||||
| Cash, cash equivalents, end of period | 4 | $ | 1,664 | $ | 3,426 | $ | 1,664 | $ | 3,426 | |||||||||||
See accompanying notes
| Magna International Inc. Second Quarter Report 2022 | 33 |
MAGNA INTERNATIONAL INC.
CONSOLIDATED STATEMENTS OF CHANGES IN EQUITY
[Unaudited]
[U.S. dollars in millions]
| Six months ended June 30, 2022 | ||||||||||||||||||||||||||||||||
| Common Shares | Non- | |||||||||||||||||||||||||||||||
| Stated | Contributed | Retained | controlling | Total | ||||||||||||||||||||||||||||
| Note | Number | Value | Surplus | Earnings | AOCL (i) | Interest | Equity | |||||||||||||||||||||||||
| [in millions] | ||||||||||||||||||||||||||||||||
| Balance, December 31, 2021 | 297.9 | $ | 3,403 | $ | 102 | $ | 9,231 | $ | (900 | ) | $ | 389 | $ | 12,225 | ||||||||||||||||||
| Net income | 208 | 26 | 234 | |||||||||||||||||||||||||||||
| Other comprehensive loss | (230 | ) | (24 | ) | (254 | ) | ||||||||||||||||||||||||||
| Contribution by non-controlling interest | 5 | 5 | ||||||||||||||||||||||||||||||
| Shares issued on exercise of stock options | 0.1 | 5 | (1 | ) | 4 | |||||||||||||||||||||||||||
| Release of stock and stock units | 0.5 | 20 | (20 | ) | ||||||||||||||||||||||||||||
| Tax withholdings on vesting of equity rewards | (0.2 | ) | (2 | ) | (13 | ) | (15 | ) | ||||||||||||||||||||||||
| Repurchase and cancellation under normal course issuer bid | 11 | (9.3 | ) | (104 | ) | (497 | ) | 6 | (595 | ) | ||||||||||||||||||||||
| Stock-based compensation expense | 15 | 15 | ||||||||||||||||||||||||||||||
| Dividends paid to non-controlling interests | (12 | ) | (12 | ) | ||||||||||||||||||||||||||||
| Dividends paid | 4 | (267 | ) | (263 | ) | |||||||||||||||||||||||||||
| Balance, June 30, 2022 | 289.0 | $ | 3,326 | $ | 96 | $ | 8,662 | $ | (1,124 | ) | $ | 384 | $ | 11,344 | ||||||||||||||||||
| Three months ended June 30, 2022 | ||||||||||||||||||||||||||||||||
| Common Shares | Non- | |||||||||||||||||||||||||||||||
| Stated | Contributed | Retained | controlling | Total | ||||||||||||||||||||||||||||
| Note | Number | Value | Surplus | Earnings | AOCL (i) | Interest | Equity | |||||||||||||||||||||||||
| [in millions] | ||||||||||||||||||||||||||||||||
| Balance, March 31, 2022 | 292.3 | $ | 3,358 | $ | 95 | $ | 9,126 | $ | (942 | ) | $ | 402 | $ | 12,039 | ||||||||||||||||||
| Net (loss) income | (156 | ) | 11 | (145 | ) | |||||||||||||||||||||||||||
| Other comprehensive loss | (185 | ) | (22 | ) | (207 | ) | ||||||||||||||||||||||||||
| Contribution by non-controlling interest | 5 | 5 | ||||||||||||||||||||||||||||||
| Release of stock and stock units | 0.2 | 6 | (6 | ) | ||||||||||||||||||||||||||||
| Tax withholdings on vesting of equity rewards | (1 | ) | (1 | ) | ||||||||||||||||||||||||||||
| Repurchase and cancellation under normal course issuer bid | 11 | (3.5 | ) | (40 | ) | (175 | ) | 3 | (212 | ) | ||||||||||||||||||||||
| Stock-based compensation expense | 7 | 7 | ||||||||||||||||||||||||||||||
| Dividends paid to non-controlling interests | (12 | ) | (12 | ) | ||||||||||||||||||||||||||||
| Dividends paid | 2 | (132 | ) | (130 | ) | |||||||||||||||||||||||||||
| Balance, June 30, 2022 | 289.0 | $ | 3,326 | $ | 96 | $ | 8,662 | $ | (1,124 | ) | $ | 384 | $ | 11,344 | ||||||||||||||||||
| (i) | AOCL is Accumulated Other Comprehensive Loss. |
See accompanying notes
| 34 | Magna International Inc. Second Quarter Report 2022 |
MAGNA INTERNATIONAL INC.
CONSOLIDATED STATEMENTS OF CHANGES IN EQUITY
[Unaudited]
[U.S. dollars in millions]
| Six months ended June 30, 2021 | ||||||||||||||||||||||||||||||||
| Common Shares | Non- | |||||||||||||||||||||||||||||||
| Stated | Contributed | Retained | controlling | Total | ||||||||||||||||||||||||||||
| Note | Number | Value | Surplus | Earnings | AOCL (i) | Interest | Equity | |||||||||||||||||||||||||
| [in millions] | ||||||||||||||||||||||||||||||||
| Balance, December 31, 2020 | 300.5 | $ | 3,271 | $ | 128 | $ | 8,704 | $ | (733 | ) | $ | 350 | $ | 11,720 | ||||||||||||||||||
| Net income | 1,039 | 19 | 1,058 | |||||||||||||||||||||||||||||
| Other comprehensive gain | 29 | 2 | 31 | |||||||||||||||||||||||||||||
| Business combinations | 19 | 19 | ||||||||||||||||||||||||||||||
| Shares issued on exercise of stock options | 2.8 | 160 | (27 | ) | 133 | |||||||||||||||||||||||||||
| Release of stock and stock units | 0.3 | 14 | (14 | ) | ||||||||||||||||||||||||||||
| Tax withholdings on vesting of equity rewards | (2 | ) | (10 | ) | (12 | ) | ||||||||||||||||||||||||||
| Repurchase and cancellation under normal course issuer bid | 11 | (3.0 | ) | (32 | ) | (230 | ) | 1 | (261 | ) | ||||||||||||||||||||||
| Stock-based compensation expense | 17 | 17 | ||||||||||||||||||||||||||||||
| Dividends paid to non-controlling interests | (8 | ) | (8 | ) | ||||||||||||||||||||||||||||
| Dividends paid | 0.1 | 5 | (262 | ) | (257 | ) | ||||||||||||||||||||||||||
| Balance, June 30, 2021 | 300.7 | $ | 3,416 | $ | 104 | $ | 9,241 | $ | (703 | ) | $ | 382 | $ | 12,440 | ||||||||||||||||||
| Three months ended June 30, 2021 | ||||||||||||||||||||||||||||||||
| Common Shares | Non- | |||||||||||||||||||||||||||||||
| Stated | Contributed | Retained | controlling | Total | ||||||||||||||||||||||||||||
| Note | Number | Value | Surplus | Earnings | AOCL (i) | Interest | Equity | |||||||||||||||||||||||||
| [in millions] | ||||||||||||||||||||||||||||||||
| Balance, March 31, 2021 | 300.6 | $ | 3,366 | $ | 107 | $ | 9,034 | $ | (829 | ) | $ | 374 | $ | 12,052 | ||||||||||||||||||
| Net income | 424 | 12 | 436 | |||||||||||||||||||||||||||||
| Other comprehensive gain | 126 | 5 | 131 | |||||||||||||||||||||||||||||
| Business combinations | (1 | ) | (1 | ) | ||||||||||||||||||||||||||||
| Shares issued on exercise of stock options | 1.1 | 59 | (9 | ) | 50 | |||||||||||||||||||||||||||
| Repurchase and cancellation under normal course issuer bid | 11 | (1.0 | ) | (12 | ) | (87 | ) | (99 | ) | |||||||||||||||||||||||
| Stock-based compensation expense | 6 | 6 | ||||||||||||||||||||||||||||||
| Dividends paid to non-controlling interests | (8 | ) | (8 | ) | ||||||||||||||||||||||||||||
| Dividends paid | 3 | (130 | ) | (127 | ) | |||||||||||||||||||||||||||
| Balance, June 30, 2021 | 300.7 | $ | 3,416 | $ | 104 | $ | 9,241 | $ | (703 | ) | $ | 382 | $ | 12,440 | ||||||||||||||||||
| (i) | AOCL is Accumulated Other Comprehensive Loss. |
See accompanying notes
| Magna International Inc. Second Quarter Report 2022 | 35 |
MAGNA INTERNATIONAL INC.
NOTES TO INTERIM CONSOLIDATED FINANCIAL STATEMENTS
[Unaudited]
[All amounts in U.S. dollars and all tabular amounts in millions unless otherwise noted]
| 1. | SIGNIFICANT ACCOUNTING POLICIES |
| [a] | Basis of presentation |
The unaudited interim consolidated financial statements of Magna International Inc. and its subsidiaries [collectively “Magna” or the “Company”] have been prepared in U.S. dollars following accounting principles generally accepted in the United States of America [“GAAP”]. The unaudited interim consolidated financial statements do not conform in all respects to the requirements of GAAP for annual financial statements. Accordingly, these unaudited interim consolidated financial statements should be read in conjunction with the December 31, 2021 audited consolidated financial statements and notes thereto included in the Company’s 2021 Annual Report.
The unaudited interim consolidated financial statements reflect all adjustments, which consist only of normal and recurring adjustments, necessary to present fairly the financial position as at June 30, 2022 and the results of operations, changes in equity, and cash flows for the three and six-month periods ended June 30, 2022 and 2021.
| [b] | Use of Estimates |
The preparation of the unaudited interim consolidated financial statements in conformity with GAAP requires management to make estimates and assumptions that affect the amounts reported and disclosed in the interim consolidated financial statements and accompanying notes. Due to the inherent uncertainty involved in making estimates, actual results could ultimately differ from those estimates.
| 36 | Magna International Inc. Second Quarter Report 2022 |
MAGNA INTERNATIONAL INC.
NOTES TO INTERIM CONSOLIDATED FINANCIAL STATEMENTS
[Unaudited]
[All amounts in U.S. dollars and all tabular amounts in millions unless otherwise noted]
| 2. | OTHER EXPENSE (INCOME), NET |
| Three months ended June 30, | Six months ended June 30, | |||||||||||||||||||
| 2022 | 2021 | 2022 | 2021 | |||||||||||||||||
| Restructuring and impairments | [a] | $ | 376 | $ | 44 | $ | 376 | $ | 59 | |||||||||||
| Losses (gains) on investments | [b] | 50 | (38 | ) | 111 | (71 | ) | |||||||||||||
| Gain on business combinations | [c] | — | — | — | (40 | ) | ||||||||||||||
| $ | 426 | $ | 6 | $ | 487 | $ | (52 | ) | ||||||||||||
| [a] | Restructuring and impairments |
The Company’s operations in Russia remain substantially idled and production is not expected to resume before 2024. In accordance with U.S. GAAP, as a result of the expected lack of future cashflows and the continuing uncertainties connected with the Russian economy, the Company recorded a $376 million [$361 million after tax] impairment charge related to its investment in Russia. This included net asset impairments of $173 million and a $203 million reserve against the related foreign currency translation losses that are included in accumulated other comprehensive loss. The net asset impairments consisted of $163 million and $10 million in our Body Exteriors & Structures segment and our Seating segment, respectively.
For the three and six months ended June 30, 2021, the Company recorded restructuring charges of $44 million [$31 million after tax] and $59 million [$46 million after tax], respectively for its Power & Vision operations.
| [b] | Losses (gains) on investments |
| Three months ended June 30, | Six months ended June 30, | |||||||||||||||
| 2022 | 2021 | 2022 | 2021 | |||||||||||||
| Gain on sale of public equity investments | $ | (3 | ) | $ | — | $ | (1 | ) | $ | — | ||||||
| Revaluation of public company warrants | 51 | (29 | ) | 89 | (44 | ) | ||||||||||
| Revaluation of public and private equity investments | 2 | (9 | ) | 23 | (27 | ) | ||||||||||
| Other expense (income), net | 50 | (38 | ) | 111 | (71 | ) | ||||||||||
| Tax effect | (12 | ) | 9 | (25 | ) | 18 | ||||||||||
| Net loss (gain) attributable to Magna | $ | 38 | $ | (29 | ) | $ | 86 | $ | (53 | ) | ||||||
| [c] | Gain on business combinations |
During the first quarter of 2021, the Company acquired a 65% equity interest and a controlling financial interest in Chongqing Hongli Zhixin Scientific Technology Development Group LLC. The acquisition included an additional 15% equity interest in two entities for which the Company previously used equity accounting. On the change in basis of accounting, the Company recognized a $22 million gain [$22 million after tax].
The Company also recorded a gain of $18 million [$18 million after tax] in connection with the distribution of substantially all of the assets of the Company’s European joint venture, Getrag Ford Transmission GmbH.
| Magna International Inc. Second Quarter Report 2022 | 37 |
MAGNA INTERNATIONAL INC.
NOTES TO INTERIM CONSOLIDATED FINANCIAL STATEMENTS
[Unaudited]
[All amounts in U.S. dollars and all tabular amounts in millions unless otherwise noted]
| 3. | (LOSS) EARNINGS PER SHARE |
| Three months ended June 30, | Six months ended June 30, | |||||||||||||||
| 2022 | 2021 | 2022 | 2021 | |||||||||||||
| Basic (loss) earnings per Common Share: | ||||||||||||||||
| Net (loss) income attributable to Magna International Inc. | $ | (156 | ) | $ | 424 | $ | 208 | $ | 1,039 | |||||||
| Weighted average number of Common Shares outstanding | 291.1 | 301.1 | 293.8 | 301.0 | ||||||||||||
| Basic (loss) earnings per Common Share | $ | (0.54 | ) | $ | 1.41 | $ | 0.71 | $ | 3.45 | |||||||
| Diluted (loss) earnings per Common Share [a]: | ||||||||||||||||
| Net (loss) income attributable to Magna International Inc. | $ | (156 | ) | $ | 424 | $ | 208 | $ | 1,039 | |||||||
| Weighted average number of Common Shares outstanding | 291.1 | 303.6 | 295.0 | 303.6 | ||||||||||||
| Diluted (loss) earnings per Common Share | $ | (0.54 | ) | $ | 1.40 | $ | 0.70 | $ | 3.42 | |||||||
| [a] | For the three months ended June 30, 2022, diluted earnings per Common Share excluded 6.0 million Common Shares issuable under the Company’s Incentive Stock Option Plan because the effect of including them would have been anti-dilutive. The dilutive effect of participating securities using the two-class method was excluded from the calculation of earnings per share because the effect would be immaterial. |
For the six months ended June 30, 2022, diluted earnings per Common Share excluded 1.2 million Common Shares issuable under the Company’s Incentive Stock Option Plan because these options were not “in-the-money”. The dilutive effect of participating securities using the two-class method was excluded from the calculation of earnings per share because the effect would be immaterial.
For the six months ended June 30, 2021, diluted earnings per Common Share excluded 0.1 million Common Shares issuable under the Company’s Incentive Stock Option Plan because these options were not “in-the-money”.
| 38 | Magna International Inc. Second Quarter Report 2022 |
MAGNA INTERNATIONAL INC.
NOTES TO INTERIM CONSOLIDATED FINANCIAL STATEMENTS
[Unaudited]
[All amounts in U.S. dollars and all tabular amounts in millions unless otherwise noted]
| 4. | DETAILS OF CASH FROM OPERATING ACTIVITIES |
| [a] | Cash and cash equivalents: |
| June 30, | December 31, | |||||||
| 2022 | 2021 | |||||||
| Bank term deposits and bankers’ acceptances | $ | 725 | $ | 1,984 | ||||
| Cash | 939 | 964 | ||||||
| $ | 1,664 | $ | 2,948 | |||||
| [b] | Items not involving current cash flows: |
| Three months ended June 30, | Six months ended June 30, | |||||||||||||||
| 2022 | 2021 | 2022 | 2021 | |||||||||||||
| Depreciation and amortization | $ | 360 | $ | 374 | $ | 729 | $ | 738 | ||||||||
| Amortization of other assets included in cost of goods sold | 31 | 67 | 78 | 135 | ||||||||||||
| Deferred revenue amortization | (50 | ) | (58 | ) | (109 | ) | (120 | ) | ||||||||
| Other non-cash (recoveries) charges | 7 | (15 | ) | 14 | 21 | |||||||||||
| Impairment Charges | 361 | — | 361 | — | ||||||||||||
| Future tax (recovery) expenses | (29 | ) | 12 | (119 | ) | 26 | ||||||||||
| Dividends received in excess of equity income | (25 | ) | — | 10 | 2 | |||||||||||
| Non-cash portion of Other expense (income), net [note 2] | 50 | (39 | ) | 111 | (112 | ) | ||||||||||
| $ | 705 | $ | 341 | $ | 1,075 | $ | 690 | |||||||||
| [c] | Changes in operating assets and liabilities: |
| Three months ended June 30, | Six months ended June 30, | |||||||||||||||
| 2022 | 2021 | 2022 | 2021 | |||||||||||||
| Accounts receivable | $ | 24 | $ | 705 | $ | (738 | ) | $ | 57 | |||||||
| Inventories | 31 | (348 | ) | (319 | ) | (561 | ) | |||||||||
| Prepaid expenses and other | 18 | 16 | 13 | (7 | ) | |||||||||||
| Accounts payable | (188 | ) | (547 | ) | 253 | (200 | ) | |||||||||
| Accrued salaries and wages | (83 | ) | 10 | (45 | ) | 87 | ||||||||||
| Other accrued liabilities | 100 | (66 | ) | 185 | 24 | |||||||||||
| Income taxes payable | (41 | ) | (19 | ) | (57 | ) | 41 | |||||||||
| $ | (139 | ) | $ | (249 | ) | $ | (708 | ) | $ | (559 | ) | |||||
| Magna International Inc. Second Quarter Report 2022 | 39 |
MAGNA INTERNATIONAL INC.
NOTES TO INTERIM CONSOLIDATED FINANCIAL STATEMENTS
[Unaudited]
[All amounts in U.S. dollars and all tabular amounts in millions unless otherwise noted]
| 5. | INVENTORIES |
Inventories consist of:
| June 30, | December 31, | |||||||
| 2022 | 2021 | |||||||
| Raw materials and supplies | $ | 1,613 | $ | 1,598 | ||||
| Work-in-process | 431 | 400 | ||||||
| Finished goods | 547 | 506 | ||||||
| Tooling and engineering | 1,473 | 1,465 | ||||||
| $ | 4,064 | $ | 3,969 | |||||
Tooling and engineering inventory represents costs incurred on tooling and engineering services contracts in excess of billed and unbilled amounts included in accounts receivable.
| 6. | INVESTMENTS |
| June 30, | December 31, | |||||||
| 2022 | 2021 | |||||||
| Equity method investments | $ | 957 | $ | 1,031 | ||||
| Public and private equity investments | 307 | 358 | ||||||
| Warrants | 111 | 204 | ||||||
| $ | 1,375 | $ | 1,593 | |||||
Cumulative unrealized gains and losses on equity securities held as at June 30, 2022 were $78 million and $126 million [$84 million and $21 million as at December 31, 2021], respectively.
| 7. | OTHER ASSETS |
Other assets consist of:
| June 30, | December 31, | |||||||
| 2022 | 2021 | |||||||
| Preproduction costs related to long-term supply agreements | $ | 602 | $ | 668 | ||||
| Long-term receivables | 203 | 184 | ||||||
| Pension overfunded status | 41 | 41 | ||||||
| Unrealized gain on cash flow hedges | 17 | 11 | ||||||
| Other, net | 48 | 58 | ||||||
| $ | 911 | $ | 962 | |||||
| 8. | WARRANTY |
The following is a continuity of the Company's warranty accruals, included in Other accrued liabilities:
| 2022 | 2021 | |||||||
| Balance, beginning of period | $ | 247 | $ | 284 | ||||
| Expense, net | 17 | 27 | ||||||
| Settlements | (4 | ) | (28 | ) | ||||
| Foreign exchange and other | (5 | ) | (4 | ) | ||||
| Balance, March 31 | 255 | 279 | ||||||
| Expense, net | 7 | 26 | ||||||
| Settlements | (14 | ) | (12 | ) | ||||
| Foreign exchange and other | (9 | ) | 2 | |||||
| Balance, June 30 | $ | 239 | $ | 295 | ||||
| 40 | Magna International Inc. Second Quarter Report 2022 |
MAGNA INTERNATIONAL INC.
NOTES TO INTERIM CONSOLIDATED FINANCIAL STATEMENTS
[Unaudited]
[All amounts in U.S. dollars and all tabular amounts in millions unless otherwise noted]
| 9. | DEBT |
On May 18, 2022, the Company amended its 364-day syndicated revolving credit facility, including an increase to the size of the facility from $750 million to $800 million and an extension of the maturity date to June 24, 2023. The facility can be drawn in U.S. dollars or Canadian dollars. As at June 30, 2022, the Company had not borrowed any funds under this credit facility.
The Company also amended its global revolving credit facility on May 18, 2022, including a decrease to the size of the facility from $2.75 billion to $2.7 billion and an extension of the maturity date to June 24, 2027. As at June 30, 2022, $1 million was outstanding under this facility.
| 10. | INCOME TAX |
For the three and six months ended June 30, 2022, the Company’s effective income tax rate does not reflect the customary rate primarily due to the impairment charges described in note 2 (that affects the rate by -89% and 14% respectively). The three-month rate is also adversely affected by losses not benefited in Europe and the six-month rate is also favourably affected by a partial release of valuation allowances against deferred tax assets resulting from a tax reorganization.
| 11. | CAPITAL STOCK |
| [a] | During the three and six month period ended June 30, 2022, the Company repurchased 3.5 million and 9.4 million shares under a normal course issuer bid for cash consideration of $212 million and $595 million, respectively. |
| [b] | The following table presents the maximum number of shares that would be outstanding if all the dilutive instruments outstanding at July 28, 2022 were exercised or converted: |
| Common Shares | 288,962,417 | ||
| Stock options (i) | 6,038,388 | ||
| 295,000,805 |
| (i) | Options to purchase Common Shares are exercisable by the holder in accordance with the vesting provisions and upon payment of the exercise price as may be determined from time to time pursuant to the Company's stock option plans. |
| Magna International Inc. Second Quarter Report 2022 | 41 |
MAGNA INTERNATIONAL INC.
NOTES TO INTERIM CONSOLIDATED FINANCIAL STATEMENTS
[Unaudited]
[All amounts in U.S. dollars and all tabular amounts in millions unless otherwise noted]
| 12. | ACCUMULATED OTHER COMPREHENSIVE LOSS |
The following is a continuity schedule of accumulated other comprehensive loss:
| 2022 | 2021 | |||||||
| Accumulated net unrealized loss on translation of net investment in foreign operations | ||||||||
| Balance, beginning of period | $ | (735 | ) | $ | (551 | ) | ||
| Net unrealized loss | (96 | ) | (105 | ) | ||||
| Repurchase of shares under normal course issuer bid | 3 | 1 | ||||||
| Balance, March 31 | (828 | ) | (655 | ) | ||||
| Repurchase of shares under normal course issuer bid | 3 | — | ||||||
| Reserve for cumulative translation losses | 203 | — | ||||||
Net unrealized (loss) gain | (326 | ) | 100 | |||||
| Balance, June 30 | (948 | ) | (555 | ) | ||||
| Accumulated net unrealized gain on cash flow hedges (i) | ||||||||
| Balance, beginning of period | 24 | 42 | ||||||
| Net unrealized gain | 55 | 13 | ||||||
| Reclassification of net gain to net income | (6 | ) | (8 | ) | ||||
| Balance, March 31 | 73 | 47 | ||||||
| Net unrealized (loss) gain | (50 | ) | 34 | |||||
| Reclassification of net gain to net income | (13 | ) | (10 | ) | ||||
| Balance, June 30 | 10 | 71 | ||||||
| Accumulated net unrealized loss on pensions | ||||||||
| Balance, beginning of period | (189 | ) | (224 | ) | ||||
| Revaluation | 1 | — | ||||||
| Reclassification of net loss to net income | 1 | 3 | ||||||
| Balance, March 31 | (187 | ) | (221 | ) | ||||
| Revaluation | — | 1 | ||||||
| Reclassification of net loss to net income | 1 | 1 | ||||||
| Balance, June 30 | (186 | ) | (219 | ) | ||||
| Total accumulated other comprehensive loss | $ | (1,124 | ) | $ | (703 | ) | ||
| (i) | The amount of income tax expense that has been netted in the accumulated net unrealized gain on cash flow hedges is as follows: |
| 2022 | 2021 | |||||||
| Balance, beginning of period | $ | (8 | ) | $ | (15 | ) | ||
| Net unrealized gain | (18 | ) | (4 | ) | ||||
| Reclassification of net gain to net income | 2 | 3 | ||||||
| Balance, March 31 | (24 | ) | (16 | ) | ||||
| Net unrealized loss (gain) | 17 | (12 | ) | |||||
| Reclassifications of net gain to net income | 4 | 4 | ||||||
| Balance, June 30 | $ | (3 | ) | $ | (24 | ) | ||
The amount of other comprehensive loss that is expected to be reclassified to net income over the next 12 months is $22 million.
| 42 | Magna International Inc. Second Quarter Report 2022 |
MAGNA INTERNATIONAL INC.
NOTES TO INTERIM CONSOLIDATED FINANCIAL STATEMENTS
[Unaudited]
[All amounts in U.S. dollars and all tabular amounts in millions unless otherwise noted]
| 13. | FINANCIAL INSTRUMENTS |
| [a] | Financial assets and liabilities |
The Company's financial assets and financial liabilities consist of the following:
| June 30, | December 31, | |||||||
| 2022 | 2021 | |||||||
| Financial assets | ||||||||
| Cash and cash equivalents | $ | 1,664 | $ | 2,948 | ||||
| Accounts receivable | 6,764 | 6,307 | ||||||
| Warrants and public and private equity investments | 418 | 562 | ||||||
| Long-term receivables included in other assets | 203 | 184 | ||||||
| $ | 9,049 | $ | 10,001 | |||||
| Financial liabilities | ||||||||
| Long-term debt (including portion due within one year) | $ | 3,513 | $ | 3,993 | ||||
| Accounts payable | 6,443 | 6,465 | ||||||
| $ | 9,956 | $ | 10,458 | |||||
| Derivatives designated as effective hedges, measured at fair value | ||||||||
| Foreign currency contracts | ||||||||
| Prepaid expenses | $ | 47 | $ | 34 | ||||
| Other assets | 17 | 11 | ||||||
| Other accrued liabilities | (29 | ) | (12 | ) | ||||
| Other long-term liabilities | (25 | ) | (8 | ) | ||||
| $ | 10 | $ | 25 | |||||
| [b] | Derivatives designated as effective hedges, measured at fair value |
The Company presents derivatives that are designated as effective hedges at gross fair values in the consolidated balance sheets. However, master netting and other similar arrangements allow net settlements under certain conditions. The following table shows the Company's derivative foreign currency contracts at gross fair value as reflected in the consolidated balance sheets and the unrecognized impacts of master netting arrangements:
| Gross | Gross | |||||||||||
| amounts | amounts | |||||||||||
| presented | not offset | |||||||||||
| in consolidated | in consolidated | |||||||||||
| balance sheets | balance sheets | Net amounts | ||||||||||
| June 30, 2022 | ||||||||||||
| Assets | $ | 64 | $ | 38 | $ | 26 | ||||||
| Liabilities | $ | (54 | ) | $ | (38 | ) | $ | (16 | ) | |||
| December 31, 2021 | ||||||||||||
| Assets | $ | 45 | $ | 14 | $ | 31 | ||||||
| Liabilities | $ | (20 | ) | $ | (14 | ) | $ | (6 | ) | |||
| Magna International Inc. Second Quarter Report 2022 | 43 |
MAGNA INTERNATIONAL INC.
NOTES TO INTERIM CONSOLIDATED FINANCIAL STATEMENTS
[Unaudited]
[All amounts in U.S. dollars and all tabular amounts in millions unless otherwise noted]
| 13. | Financial instruments (CONTINUED) |
| [c] | Fair value |
The Company determined the estimated fair values of its financial instruments based on valuation methodologies it believes are appropriate; however, considerable judgment is required to develop these estimates. Accordingly, these estimated fair values are not necessarily indicative of the amounts the Company could realize in a current market exchange. The estimated fair value amounts can be materially affected by the use of different assumptions or methodologies. The methods and assumptions used to estimate the fair value of financial instruments are described below:
Cash and cash equivalents, accounts receivable and accounts payable.
Due to the short period to maturity of the instruments, the carrying values as presented in the consolidated balance sheets are reasonable estimates of fair values.
Publicly traded and private equity securities
The fair value of the Company’s investments in publicly traded equity securities is determined using the closing price on the measurement date, as reported on the stock exchange on which the securities are traded. [Level 1 input based on the GAAP fair value hierarchy.]
The Company estimates the value of its private equity securities based on valuation methods using the observable transaction price at the transaction date and other observable inputs including rights and obligations of the securities held by the Company. [Level 3 input based on the GAAP fair value hierarchy.]
Warrants
The Company estimates the value of its warrants based on the quoted prices in the active market for Fisker's common shares. [Level 2 inputs based on the GAAP fair value hierarchy.]
Term debt
The Company's term debt includes $105 million due within one year. Due to the short period to maturity of this debt, the carrying value as presented in the consolidated balance sheets is a reasonable estimate of its fair value.
Senior Notes
The fair value of our Senior Notes are classified as Level 1 when we use quoted prices in active markets and Level 2 when the quoted prices are from less active markets or when other observable inputs are used to determine fair value. At June 30, 2022, the net book value of the Company's Senior Notes was $3.3 billion and the estimated fair value was $3.2 billion.
| 44 | Magna International Inc. Second Quarter Report 2022 |
MAGNA INTERNATIONAL INC.
NOTES TO INTERIM CONSOLIDATED FINANCIAL STATEMENTS
[Unaudited]
[All amounts in U.S. dollars and all tabular amounts in millions unless otherwise noted]
| 13. | Financial instruments (CONTINUED) |
| [d] | Credit risk |
The Company's financial assets that are exposed to credit risk consist primarily of cash and cash equivalents, accounts receivable, and foreign exchange forward contracts with positive fair values.
Cash and cash equivalents which consists of short-term investments, are only invested in bank term deposits and bank commercial paper with primarily an investment grade credit rating. Credit risk is further reduced by limiting the amount which is invested in any major financial institution.
The Company is also exposed to credit risk from the potential default by any of its counterparties on its foreign exchange forward contracts. The Company mitigates this credit risk by dealing with counterparties who are major financial institutions that the Company anticipates will satisfy their obligations under the contracts.
In the normal course of business, the Company is exposed to credit risk from its customers, substantially all of which are in the automotive industry and are subject to credit risks associated with the automotive industry. For the three and six month periods ended June 30, 2022, sales to the Company's six largest customers represented 80% and 79% of the Company's sales, respectively, and substantially all of the Company's sales are to customers with which it has ongoing contractual relationships. In determining the allowance for expected credit losses, the Company considers changes in customer's credit ratings, liquidity, customer's historical payments and loss experience, current economic conditions, and the Company's expectations of future economic conditions.
| [e] | Interest rate risk |
The Company is not exposed to significant interest rate risk due to the short-term maturity of its monetary current assets and current liabilities. In particular, the amount of interest income earned on cash and cash equivalents is impacted more by investment decisions made and the demands to have available cash on hand, than by movements in interest rates over a given period.
In addition, the Company is not exposed to interest rate risk on its term debt and Senior Notes as the interest rates on these instruments are fixed.
| [f] | Currency risk and foreign exchange contracts |
The Company is exposed to fluctuations in foreign exchange rates when manufacturing facilities have committed to the delivery of products, and/or the purchase of materials and equipment in currencies other than the facilities' functional currency. In an effort to manage this net foreign exchange exposure, the Company employs hedging programs, primarily through the use of foreign exchange forward contracts.
At June 30, 2022, the Company had outstanding foreign exchange forward contracts representing commitments to buy and sell various foreign currencies. Significant commitments are as follows:
| For Canadian dollars | For U.S. dollars | For Euros | ||||||||||||||||||||||||||||||
| Weighted | Weighted | Weighted | Czech | Weighted | ||||||||||||||||||||||||||||
| U.S. dollar | average | Peso | average | U.S. dollar | average | Koruna | average | |||||||||||||||||||||||||
| amount | rate | amount | rate | amount | rate | Amount | rate | |||||||||||||||||||||||||
| Buy | 167 | 0.78418 | 13,128 | 0.04421 | 164 | 0.86470 | 6,937 | 0.03744 | ||||||||||||||||||||||||
| (Sell) | (1,887 | ) | 1.28058 | (18 | ) | 0.00136 | (230 | ) | 1.15584 | — | — | |||||||||||||||||||||
Forward contracts mature at various dates through 2025. Foreign currency exposures are reviewed quarterly.
| [g] | Equity price risk |
Public equity securities and warrants
The Company's public equity securities and warrants are subject to market price risk due to the risk of loss in value that would result from a decline in the market price of the common shares or underlying common shares.
| Magna International Inc. Second Quarter Report 2022 | 45 |
MAGNA INTERNATIONAL INC.
NOTES TO INTERIM CONSOLIDATED FINANCIAL STATEMENTS
[Unaudited]
[All amounts in U.S. dollars and all tabular amounts in millions unless otherwise noted]
| 14. | CONTINGENCIES |
From time to time, the Company may become involved in regulatory proceedings, or become liable for legal, contractual and other claims by various parties, including customers, suppliers, former employees, class action plaintiffs and others. On an ongoing basis, the Company attempts to assess the likelihood of any adverse judgments or outcomes to these proceedings or claims, together with potential ranges of probable costs and losses. A determination of the provision required, if any, for these contingencies is made after analysis of each individual issue. The required provision may change in the future due to new developments in each matter or changes in approach such as a change in settlement strategy in dealing with these matters.
| [a] | On June 23, 2022, the Conselho Administrativo de Defesa Economica [CADE], Brazil's Federal competition authority, formalized a settlement with the Company relating to an administrative proceeding commenced in 2019 into alleged anticompetitive behaviour regarding the supply of automotive door latches and related products. |
The Company's policy is to comply with all applicable laws, including antitrust and competition laws. Based on a previously completed global review of legacy antitrust risks which led to a September 2020 settlement with the European Commission where Magna received full immunity regarding two separate bilateral cartels involving the supply of closure systems, Magna does not currently anticipate any material liabilities. However, we could be subject to restitution settlements, civil proceedings, reputational damage and other consequences, including as a result of the matters specifically referred to above.
| 46 | Magna International Inc. Second Quarter Report 2022 |
MAGNA INTERNATIONAL INC.
NOTES TO INTERIM CONSOLIDATED FINANCIAL STATEMENTS
[Unaudited]
[All amounts in U.S. dollars and all tabular amounts in millions unless otherwise noted]
| 15. | SEGMENTED INFORMATION |
Magna is a global automotive supplier which has complete vehicle engineering and contract manufacturing expertise, as well as product capabilities which include body, chassis, exterior, seating, powertrain, active driver assistance, electronics, mirrors & lighting, mechatronics, and roof systems. Magna also has electronic and software capabilities across many of these areas.
The Company is organized under four operating segments: Body Exteriors & Structures, Power & Vision, Seating Systems, and Complete Vehicles. These segments have been determined on the basis of technological opportunities, product similarities, and market and operating factors, and are also the Company's reportable segments.
The Company's chief operating decision maker uses Adjusted Earnings before Interest and Income Taxes ["Adjusted EBIT"] as the measure of segment profit or loss, since management believes Adjusted EBIT is the most appropriate measure of operational profitability or loss for its reporting segments. Adjusted EBIT is calculated by taking Net (loss) income and adding back Income taxes, Interest expense, net, and Other expense (income), net.
| Magna International Inc. Second Quarter Report 2022 | 47 |
MAGNA INTERNATIONAL INC.
NOTES TO INTERIM CONSOLIDATED FINANCIAL STATEMENTS
[Unaudited]
[All amounts in U.S. dollars and all tabular amounts in millions unless otherwise noted]
| 15. | Segmented Information (CONTINUED) |
| [a] | The following tables show segment information for the Company's reporting segments and a reconciliation of Adjusted EBIT to the Company's consolidated net (loss) income: |
| Three months ended June 30, 2022 | ||||||||||||||||||||||||
| Depreciation | Equity | Fixed | ||||||||||||||||||||||
| Total | External | Adjusted | and | loss | asset | |||||||||||||||||||
| sales | sales | EBIT [ii] | amortization | (income) | additions | |||||||||||||||||||
| Body Exteriors & Structures | $ | 3,947 | $ | 3,886 | $ | 191 | $ | 181 | $ | 4 | $ | 185 | ||||||||||||
| Power & Vision | 2,888 | 2,834 | 91 | 126 | (25 | ) | 111 | |||||||||||||||||
| Seating Systems | 1,253 | 1,246 | 2 | 22 | (2 | ) | 17 | |||||||||||||||||
| Complete Vehicles | 1,403 | 1,393 | 63 | 27 | (1 | ) | 14 | |||||||||||||||||
| Corporate & Other [i] | (129 | ) | 3 | 11 | 4 | (1 | ) | 2 | ||||||||||||||||
| Total Reportable Segments | $ | 9,362 | $ | 9,362 | $ | 358 | $ | 360 | $ | (25 | ) | $ | 329 | |||||||||||
| Three months ended June 30, 2021 | ||||||||||||||||||||||||
| Depreciation | Equity | Fixed | ||||||||||||||||||||||
| Total | External | Adjusted | and | loss | asset | |||||||||||||||||||
| sales | sales | EBIT [ii] | amortization | (income) | additions | |||||||||||||||||||
| Body Exteriors & Structures | $ | 3,647 | $ | 3,576 | $ | 227 | $ | 184 | $ | 3 | $ | 138 | ||||||||||||
| Power & Vision | 2,881 | 2,825 | 203 | 135 | (41 | ) | 107 | |||||||||||||||||
| Seating Systems | 1,166 | 1,152 | 26 | 24 | (2 | ) | 12 | |||||||||||||||||
| Complete Vehicles | 1,490 | 1,477 | 79 | 27 | (1 | ) | 18 | |||||||||||||||||
| Corporate & Other [i] | (150 | ) | 4 | 22 | 4 | (3 | ) | 2 | ||||||||||||||||
| Total Reportable Segments | $ | 9,034 | $ | 9,034 | $ | 557 | $ | 374 | $ | (44 | ) | $ | 277 | |||||||||||
| Six months ended June 30, 2022 | ||||||||||||||||||||||||
| Depreciation | Equity | Fixed | ||||||||||||||||||||||
| Total | External | Adjusted | and | loss | asset | |||||||||||||||||||
| sales | sales | EBIT [ii] | amortization | (income) | additions | |||||||||||||||||||
| Body Exteriors & Structures | $ | 8,024 | $ | 7,900 | $ | 420 | $ | 364 | $ | 5 | $ | 303 | ||||||||||||
| Power & Vision | 5,934 | 5,823 | 245 | 258 | (41 | ) | 201 | |||||||||||||||||
| Seating Systems | 2,629 | 2,616 | 51 | 44 | (4 | ) | 35 | |||||||||||||||||
| Complete Vehicles | 2,678 | 2,659 | 113 | 54 | (2 | ) | 25 | |||||||||||||||||
| Corporate & Other [i] | (261 | ) | 6 | 36 | 9 | (3 | ) | 3 | ||||||||||||||||
| Total Reportable Segments | $ | 19,004 | $ | 19,004 | $ | 865 | $ | 729 | $ | (45 | ) | $ | 567 | |||||||||||
| Six months ended June 30, 2021 | ||||||||||||||||||||||||
| Depreciation | Equity | Fixed | ||||||||||||||||||||||
| Total | External | Adjusted | and | loss | asset | |||||||||||||||||||
| sales | sales | EBIT [ii] | amortization | (income) | additions | |||||||||||||||||||
| Body Exteriors & Structures | $ | 7,672 | $ | 7,527 | $ | 554 | $ | 365 | $ | 5 | $ | 232 | ||||||||||||
| Power & Vision | 6,037 | 5,922 | 500 | 268 | (85 | ) | 205 | |||||||||||||||||
| Seating Systems | 2,469 | 2,444 | 81 | 46 | (4 | ) | 22 | |||||||||||||||||
| Complete Vehicles | 3,340 | 3,314 | 159 | 50 | (2 | ) | 26 | |||||||||||||||||
| Corporate & Other [i] | (305 | ) | 6 | 33 | 9 | (5 | ) | 4 | ||||||||||||||||
| Total Reportable Segments | $ | 19,213 | $ | 19,213 | $ | 1,327 | $ | 738 | $ | (91 | ) | $ | 489 | |||||||||||
| [i] | Included in Corporate and Other Adjusted EBIT are intercompany fees charged to the automotive segments. |
| 48 | Magna International Inc. Second Quarter Report 2022 |
MAGNA INTERNATIONAL INC.
NOTES TO INTERIM CONSOLIDATED FINANCIAL STATEMENTS
[Unaudited]
[All amounts in U.S. dollars and all tabular amounts in millions unless otherwise noted]
| 15. | Segmented Information (CONTINUED) |
| [ii] | The following table reconciles Net (loss) income to Adjusted EBIT: |
| Three months ended | Six months ended | |||||||||||||||
| June 30, | June 30, | |||||||||||||||
| 2022 | 2021 | 2022 | 2021 | |||||||||||||
| Net (loss) income | $ | (145 | ) | $ | 436 | $ | 234 | $ | 1,058 | |||||||
| Add: | ||||||||||||||||
| Interest expense, net | 20 | 11 | 46 | 34 | ||||||||||||
| Other expense (income), net | 426 | 6 | 487 | (52 | ) | |||||||||||
| Income taxes | 57 | 104 | 98 | 287 | ||||||||||||
| Adjusted EBIT | $ | 358 | $ | 557 | $ | 865 | $ | 1,327 | ||||||||
| [b] | The following table shows Goodwill for the Company's reporting segments: |
| June 30, | December 31, | |||||||
| 2022 | 2021 | |||||||
| Body Exteriors & Structures | $ | 450 | $ | 471 | ||||
| Power & Vision | 1,184 | 1,269 | ||||||
| Seating Systems | 262 | 270 | ||||||
| Complete Vehicles | 102 | 112 | ||||||
| Total Reportable Segments | $ | 1,998 | $ | 2,122 | ||||
| [c] | The following table shows Net Assets for the Company's reporting segments: |
| June 30, | December 31, | |||||||
| 2022 | 2021 | |||||||
| Body Exteriors & Structures | $ | 7,136 | $ | 7,349 | ||||
| Power & Vision | 6,021 | 6,066 | ||||||
| Seating Systems | 1,291 | 1,379 | ||||||
| Complete Vehicles | 641 | 623 | ||||||
| Corporate & Other | 719 | 813 | ||||||
| Total Reportable Segments | $ | 15,808 | $ | 16,230 | ||||
| The following table reconciles Total Assets to Net Assets: |
| June 30, | December 31, | |||||||
| 2022 | 2021 | |||||||
| Total Assets | $ | 27,283 | $ | 29,086 | ||||
| Deduct assets not included in segment net assets: | ||||||||
| Cash and cash equivalents | (1,664 | ) | (2,948 | ) | ||||
| Deferred tax assets | (491 | ) | (421 | ) | ||||
| Long-term receivables from joint venture partners | (15 | ) | (15 | ) | ||||
| Deduct liabilities included in segment net assets: | ||||||||
| Accounts payable | (6,443 | ) | (6,465 | ) | ||||
| Accrued salaries and wages | (766 | ) | (851 | ) | ||||
| Other accrued liabilities | (2,096 | ) | (2,156 | ) | ||||
| Segment Net Assets | $ | 15,808 | $ | 16,230 | ||||
| Magna International Inc. Second Quarter Report 2022 | 49 |
CORPORATE OFFICE
Magna International Inc.
337 Magna Drive
Aurora, Ontario
Canada L4G 7K1
Telephone: (905) 726-2462
www.magna.com
TRANSFER AGENT AND REGISTRAR
Canada – Common Shares
Computershare Trust Company of Canada
100 University Avenue, 8th Floor
Toronto, Ontario, Canada M5J 2Y1
Telephone: 1 (800) 564-6253
United States – Common Shares
Computershare Trust Company N.A.
462 S. 4th Street
Louisville, Kentucky, USA 40202
Telephone: 1 (800) 962-4284
From all other countries
Telephone: 1 (514) 982-7555
www.computershare.com
EXCHANGE LISTINGS
Common Shares
Toronto Stock Exchange MG
The New York Stock Exchange MGA
Shareholders wishing to communicate with the non-management members of the Magna Board of Directors may do so by contacting the Chairman of Board through the office of Magna’s Corporate Secretary at 337 Magna Drive, Aurora, Ontario, Canada L4G 7K1 (905) 726-7070.
Annual Report
Copies of the Annual Report may be obtained from: The Corporate Secretary, Magna International Inc., 337 Magna Drive, Aurora, Ontario, Canada L4G 7K1 or www.magna.com. Copies of financial data and other publicly filed documents are available through the internet on the Canadian Securities Administrators’ System for Electronic Document Analysis and Retrieval (SEDAR) which can be accessed at www.sedar.com, and on the United States Securities and Exchange Commission's Electronic Data Gathering, Analysis and Retrieval System (EDGAR) which can be accessed at www.sec.gov.