Exhibit 99.2

Magna International Inc.
First Quarter Report
2024
MAGNA INTERNATIONAL INC.
Management’s Discussion and Analysis of Results of Operations and Financial Position
Unless otherwise noted, all amounts in this Management’s Discussion and Analysis of Results of Operations and Financial Position [“MD&A”] are in U.S. dollars and all tabular amounts are in millions of U.S. dollars, except per share figures, which are in U.S. dollars. When we use the terms “we”, “us”, “our” or “Magna”, we are referring to Magna International Inc. and its subsidiaries and jointly controlled entities, unless the context otherwise requires.
This MD&A should be read in conjunction with the unaudited interim consolidated financial statements for the three months ended March 31, 2024 included in this Quarterly Report, and the audited consolidated financial statements and MD&A for the year ended December 31, 2023 included in our 2023 Annual Report to Shareholders.
This MD&A may contain statements that are forward looking. Refer to the “Forward-Looking Statements” section in this MD&A for a more detailed discussion of our use of forward-looking statements.
This MD&A has been prepared as at May 2, 2024.
HIGHLIGHTS
Comparing the first quarter of 2024 to the first quarter of 2023:
| • | Global light vehicle production increased 2%, including 2% and 11% higher production in North America and China, respectively, and a decline of 2% in Europe. |
| • | Total sales increased 3% to $11.0 billion, largely reflecting the launch of new programs, higher global light vehicle production and the acquisition of Veoneer Active Safety [“Veoneer AS”] in 2023. These were partially offset by lower complete vehicle assembly volumes. |
| • | Diluted earnings per share were $0.03 and adjusted diluted earnings per share(1) were $1.08, compared to $1.15 in the first quarter of 2023. Earnings on higher components and systems sales, the impact of operational excellence and cost initiatives, productivity and efficiency improvements, and lower net warranty costs were more than offset by higher interest expense, higher employee profit sharing and incentive compensation, lower earnings on lower assembly sales and higher net input costs, primarily labour. |
| • | Cash from operating activities increased $34 million to $261 million. |
In addition, in the first quarter of 2024, we:
| • | Paid dividends of $134 million; |
| • | Raised debt of $400 million in the form of Senior Notes; and |
| • | Were awarded a specialized primary eDrive system for a North America-based global OEM. |
OVERVIEW
OUR BUSINESS(2)
Magna is more than one of the world’s largest suppliers in the automotive space. We are a mobility technology company built to innovate, with a global, entrepreneurial-minded team of over 179,000(3) employees across 343 manufacturing operations and 105 product development, engineering and sales centres spanning 28 countries. With 65+ years of expertise, our ecosystem of interconnected products combined with our complete vehicle expertise uniquely positions us to advance mobility in an expanded transportation landscape. For further information about Magna (NYSE:MGA; TSX:MG), please visit www.magna.com or follow us on social.
1 Adjusted diluted earnings per share is a Non-GAAP financial measure. Refer to the section “Use of Non-GAAP Measures”.
2 Manufacturing operations, product development, engineering and sales centres include certain operations accounted for under the equity method.
3 Number of employees includes over 168,000 employees at our wholly owned or controlled entities and over 11,000 employees at operations accounted for under the equity method.
| Magna International Inc. First Quarter Report 2024 | 1 |
INDUSTRY TRENDS & RISKS
Our operating results are primarily dependent on the levels of North American, European, and Chinese car and light truck production by our customers. While we supply systems and components to every major original equipment manufacturer [“OEM”], we do not supply systems and components for every vehicle, nor is the value of our content consistent from one vehicle to the next. As a result, customer and program mix relative to market trends, as well as the value of our content on specific vehicle production programs, are also important drivers of our results.
Ordinarily, OEM production volumes are aligned with vehicle sales levels and thus affected by changes in such levels. Aside from vehicle sales levels, production volumes are typically impacted by a range of factors, including: labour disruptions; free trade arrangements and tariffs; relative currency values; commodities prices; supply chains and infrastructure; availability and relative cost of skilled labour; regulatory frameworks; and other factors.
Overall vehicle sales levels are significantly affected by changes in consumer confidence levels, which may in turn be impacted by consumer perceptions and general trends related to the job, housing, and stock markets, as well as other macroeconomic and political factors. Other factors which typically impact vehicle sales levels and thus production volumes include: vehicle affordability; interest rates and/or availability of credit; fuel and energy prices; relative currency values; uncertainty as to consumer acceptance of EVs; government subsidies to consumers for the purchase of low- and zero-emission vehicles; and other factors.
While the foregoing economic, political and other factors are part of the general context in which the global automotive industry operates, there are a number of significant industry trends that are shaping the future of the industry and creating opportunities and risks for automotive suppliers. We continue to implement a business strategy which is rooted in our best assessment as to the rate and direction of change in the automotive industry, including with respect to trends related to vehicle electrification, advanced driver assistance systems, connectivity, as well as future mobility business models. Our short and medium-term operational success, as well as our ability to create long-term value through our business strategy, are subject to a number of risks and uncertainties. Significant industry trends, our business strategy and the major risks we face, are discussed in our Annual Information Form [“AIF”] and Annual Report on Form 40-F [“Form 40-F”] in respect of the year ended December 31, 2023, together with subsequent filings. Those industry trends and risk factors remain substantially unchanged in respect of the first quarter ended March 31, 2024, except as follows:
| • | EV Program Deferrals: Although the number of EVs sold globally continues to grow, the rate of sales growth began to slow in the first four months of 2024. As a result, OEMs (primarily in North America) have been updating their EV strategies by deferring new EV programs and/or reducing production shifts for current programs. As a result of these actions, we may be unable to recover various pre-production, tooling, engineering, and other costs incurred in advance of production, or to recover them within the timeframe initially contemplated in our business plan. Additionally, we may experience production inefficiencies, including as a result of unutilized or underutilized production capacity and/or disruptions to our workforce plans at affected facilities. The failure to secure commercial recoveries from customers to offset such costs and inefficiencies may have a material adverse effect on our profitability. |
USE OF NON-GAAP FINANCIAL MEASURES
In addition to results presented in accordance with accounting principles generally accepted in the United States of America [“U.S. GAAP”], this report includes the use of Adjusted earnings before interest and taxes [“Adjusted EBIT”], Adjusted EBIT as a percentage of sales, Adjusted diluted earnings per share, and Adjusted Return on Invested Capital [collectively, the “Non-GAAP Measures”]. We believe these Non-GAAP financial measures provide additional information that is useful to investors in understanding our underlying performance and trends through the same financial measures employed by our management. Readers should be aware that Non-GAAP Measures have no standardized meaning under U.S. GAAP and accordingly may not be comparable to the calculation of similar measures by other companies. We believe that Adjusted EBIT, Adjusted EBIT as a percentage of sales, Adjusted diluted earnings per share and Adjusted Return on Invested Capital provide useful information to our investors for measuring our operational performance as they exclude certain items that are not reflective of ongoing operating profit and facilitate a comparison with prior periods. The presentation of any Non-GAAP Measures should not be considered in isolation or as a substitute for our related financial results prepared in accordance with U.S. GAAP. Non-GAAP financial measures are presented together with the most directly comparable U.S. GAAP financial measure, and a reconciliation to the most directly comparable U.S. GAAP financial measure, can be found in the “Non-GAAP Financial Measures Reconciliation” section of this MD&A.
| 2 | Magna International Inc. First Quarter Report 2024 |
RESULTS OF OPERATIONS
AVERAGE FOREIGN EXCHANGE
| For the three months | ||||||||||||
| ended March 31, | ||||||||||||
| 2024 | 2023 | Change | ||||||||||
| 1 Canadian dollar equals U.S. dollars | 0.741 | 0.740 | — | |||||||||
| 1 euro equals U.S. dollars | 1.085 | 1.073 | + | 1 | % | |||||||
| 1 Chinese renminbi equals U.S. dollars | 0.139 | 0.146 | - | 5 | % | |||||||
The preceding table reflects the average foreign exchange rates between the most common currencies in which we conduct business and our U.S. dollar reporting currency.
The results of operations for which the functional currency is not the U.S. dollar are translated into U.S. dollars using the average exchange rates for the relevant period. Throughout this MD&A, reference is made to the impact of translation of foreign operations on reported U.S. dollar amounts where relevant.
Our results can also be affected by the impact of movements in exchange rates on foreign currency transactions (such as raw material purchases or sales denominated in foreign currencies). However, as a result of hedging programs employed by us, foreign currency transactions in the current period have not been fully impacted by movements in exchange rates. We record foreign currency transactions at the hedged rate where applicable.
Finally, foreign exchange gains and losses on revaluation and/or settlement of monetary items denominated in a currency other than an operation’s functional currency impact reported results. These gains and losses are recorded in selling, general and administrative expense.
LIGHT VEHICLE PRODUCTION VOLUMES
Our operating results are mostly dependent on light vehicle production in the regions reflected in the table below:
Light Vehicle Production Volumes (thousands of units)
| For the three months | ||||||||||||
| ended March 31, | ||||||||||||
| 2024 | 2023 | Change | ||||||||||
| North America | 3,963 | 3,884 | + | 2 | % | |||||||
| Europe | 4,497 | 4,581 | - | 2 | % | |||||||
| China | 6,601 | 5,936 | + | 11 | % | |||||||
| Other | 6,832 | 6,968 | - | 2 | % | |||||||
| Global | 21,893 | 21,369 | + | 2 | % | |||||||
| Magna International Inc. First Quarter Report 2024 | 3 |
RESULTS OF OPERATIONS – FOR THE THREE MONTHS ENDED MARCH 31, 2024
SALES
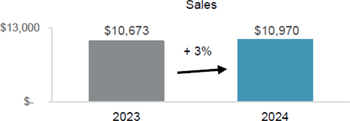
Sales increased 3% or $297 million to $10.97 billion for the first quarter of 2024 compared to $10.67 billion for the first quarter of 2023 primarily due to:
| • | the launch of new programs during or subsequent to the first quarter of 2023; |
| • | higher global light vehicle production; |
| • | acquisitions, net of divestitures, subsequent to the first quarter of 2023, which increased sales by $333 million; and |
| • | customer price increases to recover certain higher production input costs. |
These factors were partially offset by:
| • | the end of production of certain programs, including the assembly of the BMW 5-Series in our Complete Vehicle segment; |
| • | the net weakening of foreign currencies against the U.S. dollar, which decreased reported U.S. dollar sales by $23 million; and |
| • | net customer price concessions subsequent to the first quarter of 2023. |
COST OF GOODS SOLD
| For the three months | ||||||||||||
| ended March 31, | ||||||||||||
| 2024 | 2023 | Change | ||||||||||
| Material | $ | 6,776 | $ | 6,703 | $ | 73 | ||||||
| Direct labour | 826 | 809 | 17 | |||||||||
| Overhead | 2,040 | 1,904 | 136 | |||||||||
| Cost of goods sold | $ | 9,642 | $ | 9,416 | $ | 226 | ||||||
Cost of goods sold increased $226 million to $9.64 billion for the first quarter of 2024 compared to $9.42 billion for the first quarter of 2023, primarily due to:
| • | higher material, direct labour and overhead associated with higher sales; |
| • | acquisitions, net of divestitures subsequent to the first quarter of 2023; |
| • | higher net production input costs, including for labour, partially offset by lower prices for energy and certain commodities; and |
| • | higher employee profit sharing. |
These factors were partially offset by:
| • | a decrease in material and direct labour costs associated with lower sales in our Complete Vehicles segment, which has a higher material content compared to our consolidated average; |
| • | productivity and efficiency improvements, including lower costs at certain underperforming facilities; |
| • | the impact of operational excellence and cost initiatives; |
| • | a decrease in net warranty costs of $18 million; and |
| • | the net weakening of foreign currencies against the U.S. dollar, which decreased reported U.S. dollar cost of goods sold by $15 million. |
| 4 | Magna International Inc. First Quarter Report 2024 |
DEPRECIATION
Depreciation increased $24 million to $377 million for the first quarter of 2024 compared to $353 million for the first quarter of 2023 primarily due to acquisitions, net of divestitures, subsequent to the first quarter of 2023, and increased capital deployed at new and existing facilities including to support the launch of programs subsequent to the first quarter of 2023. These factors were partially offset by the end of production of certain programs.
AMORTIZATION OF ACQUIRED INTANGIBLE ASSETS
Amortization of acquired intangible assets increased $16 million to $28 million for the first quarter of 2024 compared to $12 million for the first quarter of 2023 primarily due to the acquisition of Veoneer AS during the second quarter of 2023.
SELLING, GENERAL AND ADMINISTRATIVE [“SG&A”]
SG&A expense increased $28 million to $516 million for the first quarter of 2024 compared to $488 million for the first quarter of 2023, primarily as a result of:
| • | higher labour and benefit costs; |
| • | higher incentive compensation; |
| • | costs incurred at new facilities; and |
| • | acquisitions, net of divestitures, subsequent to the first quarter of 2023. |
These factors were partially offset by:
| • | higher net transactional foreign exchange gains; |
| • | commercial items in the first quarters of 2024 and 2023, which had a net favourable impact on a year over year basis; |
| • | costs incurred during the first quarter of 2023 relating to the acquisition of the Veoneer AS; and |
| • | gain on sale of an equity-method investment during the first quarter of 2024. |
INTEREST EXPENSE, NET
During the first quarter of 2024, we recorded net interest expense of $51 million compared to $20 million for the first quarter of 2023. The $31 million increase is primarily a result of interest expense on the $1.6 billion of Senior Notes issued during the first quarter of 2023, interest expense on higher short-term borrowings and the Term Loan entered into during the first quarter of 2023. These factors were partially offset by a $569 million repayment of Senior Notes during the fourth quarter of 2023.
EQUITY INCOME
Equity income increased $1 million to $34 million for the first quarter of 2024 compared to $33 million for the first quarter of 2023, primarily as a result of earnings on higher sales at certain equity-accounted entities and commercial items in the first quarters of 2024 and 2023, which had a favourable impact on a year over year basis. These factors were partially offset by lower net transactional foreign exchange gains in the first quarter of 2024 compared to the first quarter of 2023 and higher depreciation due to increased capital deployed at certain facilities to support the launch or programs subsequent to the first quarter of 2023.
| Magna International Inc. First Quarter Report 2024 | 5 |
OTHER EXPENSE, NET
For the three months ended March 31, | ||||||||
| 2024 | 2023 | |||||||
| Impairments and restructuring related to Fisker Inc. [“Fisker”] (1) | $ | 316 | $ | — | ||||
| Restructuring (2) | 38 | 118 | ||||||
| Net losses on investments (3) | 2 | 24 | ||||||
| $ | 356 | $ | 142 | |||||
| (1) | Impairments and restructuring related to Fisker |
Impairment of Fisker related assets
During the first quarter of 2024, we recorded a $261 million [$205 million after tax] impairment charge on our Fisker related assets as a result of the expected lack of future cashflows and the substantial doubt about Fisker’s ability to continue as a going concern. The assets impaired include production receivables, inventory, fixed assets and other capitalized expenditures. The following table summarizes the net asset impairments by segment:
| Body | ||||||||||||||||||||
| Exteriors & | Power & | Seating | Complete | |||||||||||||||||
| Structures | Vision | Systems | Vehicles | Total | ||||||||||||||||
| Accounts receivable | $ | 3 | $ | 4 | $ | 2 | $ | 14 | $ | 23 | ||||||||||
| Inventories | 5 | 37 | 8 | — | 50 | |||||||||||||||
| Other assets, net | — | 54 | — | 90 | 144 | |||||||||||||||
| Fixed assets, net | 1 | 48 | 5 | 3 | 57 | |||||||||||||||
| Other accrued liabilities | (5 | ) | — | — | (10 | ) | (15 | ) | ||||||||||||
| Operating lease right-of-use assets | 1 | — | 1 | — | 2 | |||||||||||||||
| $ | 5 | $ | 143 | $ | 16 | $ | 97 | $ | 261 | |||||||||||
We are also exposed to risk related to third-party obligations of approximately $75 million in connection with manufacturing of the Fisker Ocean SUV.
Impairment of Fisker warrants
Fisker issued approximately 19.5 million penny warrants to us to purchase common stock in connection with our agreements with Fisker for platform sharing, engineering and manufacturing of the Fisker Ocean SUV. These warrants vested during 2021 and 2022 based on specified milestones and have been marked to market each quarter.
During the first quarter of 2024, we recorded a $33 million [$25 million after tax] impairment charge on these warrants reducing the value of the warrants to nil.
When the warrants were issued and the vesting provisions realized, we recorded offsetting amounts to deferred revenue within other accrued liabilities and other long-term liabilities, and was recognized in income as performance obligations are satisfied. The unamortized amount of this deferred revenue as of March 31, 2024 was approximately $195 million, and will be recognized in income as performance obligations are satisfied or upon termination of the agreement for manufacturing of the Fisker Ocean SUV.
Restructuring
In the first quarter of 2024, we recorded restructuring of $22 million [$17 million after tax] in our Complete Vehicles segment in connection with its Fisker related assembly operations.
| (2) | Restructuring |
During the first quarter of 2024, we recorded additional restructuring charges of $26 million [$20 million after tax] in our Complete Vehicles segment, and $12 million [$12 million after tax] related to a facility in Europe in our Body Exteriors & Structures segment.
During the first quarter of 2023, we recorded restructuring charges of $105 million [$82 million after tax] in our Power & Vision segment, and $13 million [$10 million after tax] in our Body Exteriors & Structures segment.
| 6 | Magna International Inc. First Quarter Report 2024 |
| (3) | Net losses on investments |
| For the three months | ||||||||
| ended March 31, | ||||||||
| 2024 | 2023 | |||||||
| Revaluation of public and private equity investments | $ | 2 | $ | 2 | ||||
| Revaluation of Fisker warrants | — | 22 | ||||||
| Other expense, net | 2 | 24 | ||||||
| Tax effect | (1 | ) | (6 | ) | ||||
| Net loss attributable to Magna | $ | 1 | $ | 18 | ||||
INCOME FROM OPERATIONS BEFORE INCOME TAXES
Income from operations before income taxes was $34 million for the first quarter of 2024 compared to $275 million for the first quarter of 2023. This $241 million decrease is a result of the following changes, each as discussed above:
| For the three months | ||||||||||||
| ended March 31, | ||||||||||||
| 2024 | 2023 | Change | ||||||||||
| Sales | $ | 10,970 | $ | 10,673 | $ | 297 | ||||||
| Costs and expenses | ||||||||||||
| Cost of goods sold | 9,642 | 9,416 | 226 | |||||||||
| Depreciation | 377 | 353 | 24 | |||||||||
| Amortization of acquired intangible assets | 28 | 12 | 16 | |||||||||
| Selling, general & administrative | 516 | 488 | 28 | |||||||||
| Interest expense, net | 51 | 20 | 31 | |||||||||
| Equity income | (34 | ) | (33 | ) | (1 | ) | ||||||
| Other expense, net | 356 | 142 | 214 | |||||||||
| Income from operations before income taxes | $ | 34 | $ | 275 | $ | (241 | ) | |||||
INCOME TAXES
For the three months ended March 31, | ||||||||||||||||
| 2024 | 2023 | |||||||||||||||
| Income Taxes as reported | $ | 8 | 23.5 | % | $ | 58 | 21.1 | % | ||||||||
| Tax effect on Other expense, net and Amortization of acquired intangible assets | 82 | (2.0 | ) | 34 | 0.3 | |||||||||||
| $ | 90 | 21.5 | % | $ | 92 | 21.4 | % | |||||||||
Excluding the tax effect on Other expense, net and Amortization of acquired intangible assets, our effective income tax rate increased to 21.5% for the first quarter of 2024 compared to 21.4% for the first quarter of 2023 primarily due to a change in mix of earnings and lower favourable non-taxable foreign exchange adjustments recognized for U.S. GAAP purposes. These factors were partially offset by lower losses not benefited in Europe.
| Magna International Inc. First Quarter Report 2024 | 7 |
INCOME ATTRIBUTABLE TO NON-CONTROLLING INTERESTS
Income attributable to non-controlling interests was $17 million for the first quarter of 2024 compared to $8 million for the first quarter of 2023. This $9 million increase was primarily due to higher net income at our non-wholly owned operations in China.
NET INCOME ATTRIBUTABLE TO MAGNA INTERNATIONAL INC.
Net income attributable to Magna International Inc. was $9 million for the first quarter of 2024 compared to $209 million for the first quarter of 2023. This $200 million decrease was as a result of decreases in income from operations before income taxes of $241 million and income attributable to non-controlling interests of $9 million, respectively, partially offset by a decrease in income taxes of $50 million.
EARNINGS PER SHARE

| For the three months | |||||||||||||
| ended March 31, | |||||||||||||
| 2024 | 2023 | Change | |||||||||||
| Earnings per Common Share | |||||||||||||
| Basic | $ | 0.03 | $ | 0.73 | - | 96 | % | ||||||
| Diluted | $ | 0.03 | $ | 0.73 | - | 96 | % | ||||||
| Weighted average number of Common Shares outstanding (millions) | |||||||||||||
| Basic | 286.9 | 286.1 | — | ||||||||||
| Diluted | 287.1 | 286.6 | — | ||||||||||
| Adjusted diluted earnings per share | $ | 1.08 | $ | 1.15 | - | 6 | % | ||||||
Diluted earnings per share was $0.03 for the first quarter of 2024 compared to diluted earnings per share of $0.73 for the first quarter of 2023. The $0.70 decrease was as a result of lower net income attributable to Magna International Inc., as discussed above.
Other expense, net, and the Amortization of acquired intangible assets, each after tax, negatively impacted diluted earnings per share by $1.05 in the first quarter of 2024 and $0.42 in the first quarter of 2023, respectively. Adjusted diluted earnings per share, as reconciled in the “Non-GAAP Financial Measures Reconciliation” section, was $1.08 for the first quarter of 2024 compared to $1.15 for the first quarter of 2023, a decrease of $0.07.
| 8 | Magna International Inc. First Quarter Report 2024 |
NON-GAAP PERFORMANCE MEASURES – FOR THE THREE MONTHS ENDED MARCH 31, 2024
ADJUSTED EBIT AS A PERCENTAGE OF SALES
The table below shows the change in Magna’s Sales and Adjusted EBIT by segment and the impact each segment’s changes had on Magna’s Adjusted EBIT as a percentage of sales for the first quarter of 2024 compared to the first quarter of 2023:
| Adjusted EBIT | ||||||||||||
| Adjusted | as a percentage | |||||||||||
| Sales | EBIT | of sales | ||||||||||
| First quarter of 2023 | $ | 10,673 | $ | 449 | 4.2 | % | ||||||
| Increase (decrease) related to: | ||||||||||||
| Body Exteriors & Structures | (10 | ) | 26 | + | 0.2 | % | ||||||
| Power & Vision | 519 | 6 | - | 0.1 | % | |||||||
| Seating Systems | (31 | ) | 15 | + | 0.1 | % | ||||||
| Complete Vehicles | (243 | ) | (25 | ) | - | 0.1 | % | |||||
| Corporate and Other | 62 | (2 | ) | — | ||||||||
| First quarter of 2024 | $ | 10,970 | $ | 469 | 4.3 | % | ||||||
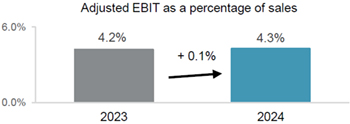
Adjusted EBIT as a percentage of sales increased to 4.3% for the first quarter of 2024 compared to 4.2% for the first quarter of 2023 primarily due to:
| • | earnings on higher sales, including higher margins due to the impact of operational excellence and cost initiatives; |
| • | productivity and efficiency improvements, including lower costs at certain underperforming facilities; |
| • | higher net transactional foreign exchange gains in the first quarter of 2024 compared the first quarter of 2023; and |
| • | lower net warranty costs. |
These factors were partially offset by:
| • | higher employee profit sharing and incentive compensation; |
| • | acquisitions, net of divestitures, subsequent to the first quarter of 2023; |
| • | higher production input costs net of customer recoveries, including for labour, partially offset by lower prices for energy and certain commodities; and |
| • | lower earnings on lower assembly sales due to the end of production of the BMW 5-Series in our Complete Vehicle segment. |
| Magna International Inc. First Quarter Report 2024 | 9 |
ADJUSTED RETURN ON INVESTED CAPITAL

Adjusted Return on Invested Capital decreased to 7.8% for the first quarter of 2024 compared to 8.7% for the first quarter of 2023 as a result of higher Average Invested Capital partially offset by an increase in Adjusted After-tax operating profits.
Average Invested Capital increased $2.55 billion to $18.87 billion for the first quarter of 2024 compared to $16.32 billion for the first quarter of 2023, primarily due to:
| • | the acquisition of Veoneer AS during the second quarter of 2023; |
| • | average investment in fixed assets in excess of our average depreciation expense on fixed assets; |
| • | the net strengthening of foreign currencies against the U.S. dollar; and |
| • | an increase in average operating assets and liabilities. |
These factors were partially offset by impairments and restructuring related to Fisker during the first quarter of 2024 and lower net investments in public and private equity companies and public company warrants.
| 10 | Magna International Inc. First Quarter Report 2024 |
SEGMENT ANALYSIS
We are a global automotive supplier that has complete vehicle engineering and contract manufacturing expertise, as well as product capabilities which include body, chassis, exterior, seating, powertrain, active driver assistance, electronics, mechatronics, mirrors, lighting and roof systems. We also have electronic and software capabilities across many of these areas.
Our reporting segments are: Body Exteriors & Structures; Power & Vision; Seating Systems; and Complete Vehicles.
| For the three months ended March 31, | ||||||||||||||||||||||||
| Sales | Adjusted EBIT | |||||||||||||||||||||||
| 2024 | 2023 | Change | 2024 | 2023 | Change | |||||||||||||||||||
| Body Exteriors & Structures | $ | 4,429 | $ | 4,439 | $ | (10 | ) | $ | 298 | $ | 272 | $ | 26 | |||||||||||
| Power & Vision | 3,842 | 3,323 | 519 | 98 | 92 | 6 | ||||||||||||||||||
| Seating Systems | 1,455 | 1,486 | (31 | ) | 52 | 37 | 15 | |||||||||||||||||
| Complete Vehicles | 1,383 | 1,626 | (243 | ) | 27 | 52 | (25 | ) | ||||||||||||||||
| Corporate and Other | (139 | ) | (201 | ) | 62 | (6 | ) | (4 | ) | (2 | ) | |||||||||||||
| Total reportable segments | $ | 10,970 | $ | 10,673 | $ | 297 | $ | 469 | $ | 449 | $ | 20 | ||||||||||||
BODY EXTERIORS & STRUCTURES
| For the three months | ||||||||||||||||
| ended March 31, | ||||||||||||||||
| 2024 | 2023 | Change | ||||||||||||||
| Sales | $ | 4,429 | $ | 4,439 | $ | (10 | ) | — | ||||||||
| Adjusted EBIT | $ | 298 | $ | 272 | $ | 26 | + | 10 | % | |||||||
| Adjusted EBIT as a percentage of sales | 6.7 | % | 6.1 | % | + | 0.6 | % | |||||||||

Sales – Body Exteriors & Structures
Sales decreased $10 million to $4.43 billion for the first quarter of 2024 compared to $4.44 billion for the first quarter of 2023 primarily due to:
| • | the end of production of certain programs, including the: |
| • | Dodge Charger and Chrysler 300; |
| • | Chevrolet Bolt EV; and |
| • | Jeep Cherokee; |
| • | lower customer recoveries related to certain higher production input costs; and |
| • | net customer price concessions subsequent to the first quarter of 2023. |
These factors were partially offset by:
| • | higher global light vehicle production; and |
| • | the launch of programs during or subsequent to the first quarter of 2023, including the: |
| • | Ford F-Series Super Duty; |
| • | GMC Sierra EV and Chevrolet Silverado EV; |
| • | Chevrolet Equinox and Blazer EV; and |
| • | GMC Hummer EV. |
| Magna International Inc. First Quarter Report 2024 | 11 |
Adjusted EBIT and Adjusted EBIT as a percentage of sales – Body Exteriors & Structures
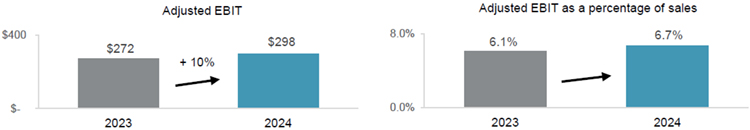
Adjusted EBIT increased $26 million to $298 million for the first quarter of 2024 compared to $272 million for the first quarter of 2023 and Adjusted EBIT as a percentage of sales increased to 6.7% from 6.1%. These increases were primarily due to:
| • | productivity and efficiency improvements, including lower costs at certain underperforming facilities; |
| • | net transactional foreign exchange gains in the first quarter of 2024 compared to net transactional foreign exchange losses in the first quarter of 2023; |
| • | higher tooling contribution in the first quarter of 2024 compared to the first quarter of 2023; and |
| • | lower pre-operating costs incurred at new facilities. |
These factors were partially offset by:
| • | higher production input costs net of customer recoveries, including for labour; |
| • | higher employee profit sharing and incentive compensation; and |
| • | commercial items in the first quarters of 2024 and 2023, which had a net unfavourable impact on a year over year basis. |
POWER & VISION
| For the three months | ||||||||||||||||
| ended March 31, | ||||||||||||||||
| 2024 | 2023 | Change | ||||||||||||||
| Sales | $ | 3,842 | $ | 3,323 | $ | 519 | + | 16 | % | |||||||
| Adjusted EBIT | $ | 98 | $ | 92 | $ | 6 | + | 7 | % | |||||||
| Adjusted EBIT as a percentage of sales | 2.6 | % | 2.8 | % | - | 0.2 | % | |||||||||

Sales – Power & Vision
Sales increased 16% or $519 million to $3.84 billion for the first quarter of 2024 compared to $3.32 billion for the first quarter of 2023 primarily due to:
| • | acquisitions, net of divestitures, subsequent to the first quarter of 2023, which increased sales by $337 million; |
| • | the launch of programs during or subsequent to the first quarter of 2023, including the: |
| • | Chery Jetour Traveler; |
| • | Mazda CX-90; |
| • | Chery Tiggo 9; and |
| • | GMC Canyon and Chevrolet Colorado; |
| • | higher production on certain programs; and |
| • | customer price increases to recover certain higher production input costs. |
These factors were partially offset by the net weakening of foreign currencies against the U.S. dollar, which decreased reported U.S. dollar sales by $29 million and net customer price concessions subsequent to the first quarter of 2023.
| 12 | Magna International Inc. First Quarter Report 2024 |
Adjusted EBIT and Adjusted EBIT as a percentage of sales – Power & Vision
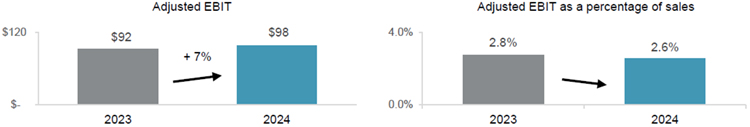
Adjusted EBIT increased $6 million to $98 million for the first quarter of 2024 compared to $92 million for the first quarter of 2023 while Adjusted EBIT as a percentage of sales decreased to 2.6% from 2.8%. Adjusted EBIT was higher primarily as a result of earnings on higher sales, including higher margins due to the impact of operational excellence and cost initiatives. Excluding this factor, Adjusted EBIT and Adjusted EBIT as a percentage of sales were lower primarily due to:
| • | acquisitions, net of divestitures, subsequent to the first quarter of 2023; |
| • | higher launch costs; |
| • | lower equity income; and |
| • | higher employee profit sharing and incentive compensation. |
These factors were partially offset by:
| • | customer recoveries net of higher production input costs, including for energy and freight, partially offset by higher prices for labour; |
| • | lower net warranty costs of $17 million; |
| • | costs incurred during the first quarter of 2023 relating to the acquisition of the Veoneer AS; |
| • | lower net engineering costs including spending related to our electrification and active safety businesses; and |
| • | cost savings and efficiencies realized, including as a result of restructuring actions taken. |
SEATING SYSTEMS
| For the three months | ||||||||||||||||
| ended March 31, | ||||||||||||||||
| 2024 | 2023 | Change | ||||||||||||||
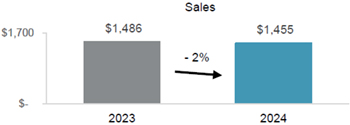
| Sales | $ | 1,455 | $ | 1,486 | $ | (31 | ) | - | 2 | % | ||||||
| Adjusted EBIT | $ | 52 | $ | 37 | $ | 15 | + | 41 | % | |||||||
| Adjusted EBIT as a percentage of sales | 3.6 | % | 2.5 | % | + | 1.1 | % | |||||||||
Sales – Seating Systems
Sales decreased 2% or $31 million to $1.46 billion for the first quarter of 2024 compared to $1.49 billion for the first quarter of 2023 primarily due to:
| • | the end of production of certain programs; including the: |
| • | Chevrolet Bolt EV; |
| • | Lincoln MKX; and |
| • | Ford Fiesta; |
| • | the net weakening of foreign currencies against the U.S. dollar, which decreased reported U.S. dollar sales by $8 million; and |
| • | net customer price concessions subsequent to the first quarter of 2023. |
| Magna International Inc. First Quarter Report 2024 | 13 |
These factors were partially offset by:
| • | the launch of programs during or subsequent to the first quarter of 2023, including the: |
| • | Lynk & Co 08; |
| • | Skoda Kodiaq; and |
| • | Deepal S7; |
| • | higher production on certain programs; and |
| • | customer price increases to recover certain higher production input costs. |

Adjusted EBIT and Adjusted EBIT as a percentage of sales – Seating Systems
Adjusted EBIT increased $15 million to $52 million for the first quarter of 2024 compared to $37 million for the first quarter of 2023 and Adjusted EBIT as a percentage of sales increased to 3.6% from 2.5%. These increases were primarily due to:
| • | commercial items in the first quarters of 2024 and 2023, which had a net favourable impact on a year over year basis; |
| • | customer recoveries, net of higher production input costs primarily related to business in Argentina; and |
| • | lower launch costs. |
These factors were partially offset by lower earnings on lower sales.
COMPLETE VEHICLES
| For the three months | ||||||||||||||||
| ended March 31, | ||||||||||||||||
| 2024 | 2023 | Change | ||||||||||||||
| Complete Vehicle Assembly Volumes (thousands of units)(i) | 22.3 | 33.9 | - | 11.6 | - | 34 | % | |||||||||
| Sales | $ | 1,383 | $ | 1,626 | $ | (243 | ) | - | 15 | % | ||||||
| Adjusted EBIT | $ | 27 | $ | 52 | $ | (25 | ) | - | 48 | % | ||||||
| Adjusted EBIT as a percentage of sales | 2.0 | % | 3.2 | % | - | 1.2 | % | |||||||||
| (i) | Vehicles produced at our Complete Vehicle operations are included in Europe Light Vehicle Production volumes. |

Sales – Complete Vehicles
Sales decreased 15% or $243 million to $1.38 billion for the first quarter of 2024 compared to $1.63 billion for the first quarter of 2023 and assembly volumes decreased 34%. The decrease in sales is substantially a result of lower assembly volumes, including the end of production of the BMW 5-Series, which was partially offset by a $14 million increase in reported U.S. dollar sales as a result of the strengthening of the euro against the U.S. dollar.
| 14 | Magna International Inc. First Quarter Report 2024 |

Adjusted EBIT and Adjusted EBIT as a percentage of sales – Complete Vehicles
Adjusted EBIT decreased $25 million to $27 million for the first quarter of 2024 compared to $52 million for the first quarter of 2023 and Adjusted EBIT as a percentage of sales decreased to 2.0% from 3.2%. These decreases were primarily due to:
| • | lower earnings on lower assembly volumes, including due to the end of production of the BMW 5-Series; and |
| • | higher employee profit sharing. |
These factors were partially offset by:
| • | lower launch, engineering and other costs associated with new assembly business; and |
| • | commercial items in the first quarters of 2024 and 2023, which had a net favourable impact on a year over year basis. |
CORPORATE AND OTHER
Adjusted EBIT was a loss of $6 million for the first quarter of 2024 compared to a loss of $4 million for the first quarter of 2023. The $2 million decrease was primarily the result of:
| • | gain on sale of an equity-method investment during the first quarter of 2024; and |
| • | higher equity income. |
These factors were partially offset by:
| • | higher investments in research, development and new mobility; |
| • | lower amortization of the initial value of public company securities; and |
| • | higher labour and benefit costs. |
| Magna International Inc. First Quarter Report 2024 | 15 |
FINANCIAL CONDITION, LIQUIDITY AND CAPITAL RESOURCES
OPERATING ACTIVITIES

| For the three months | ||||||||||||
| ended March 31, | ||||||||||||
| 2024 | 2023 | Change | ||||||||||
| Net income | $ | 26 | $ | 217 | ||||||||
| Items not involving current cash flows | 565 | 351 | ||||||||||
| 591 | 568 | $ | 23 | |||||||||
| Changes in operating assets and liabilities | (330 | ) | (341 | ) | 11 | |||||||
| Cash provided from operating activities | $ | 261 | $ | 227 | $ | 34 | ||||||
Cash provided from operating activities
Comparing the first quarter of 2024 to 2023, cash provided from operating activities increased $34 million primarily as a result of:
| • | a $877 million increase in cash received from customers; |
| • | a $60 million decrease in cash taxes; and |
| • | higher dividends received from equity investments of $7 million. |
These factors were partially offset by:
| • | a $781 million increase in cash paid for materials and overhead; |
| • | a $97 million increase in cash paid for labour; and |
| • | a $31 million increase in cash interest paid. |
Changes in operating assets and liabilities
Consistent with the seasonality of our business, we invested in operating assets and liabilities during the first quarter of 2024. During the first quarter of 2024, we used $330 million for operating assets and liabilities primarily as a result of higher operating activity in the month of March 2024 compared to the month of December 2023. Specifically, we used cash for operating assets and liabilities for:
| • | a $728 increase in production and other receivables; |
| • | a $85 million increase in prepaids and other; and |
| • | a $61 million increase in production inventory. |
These uses of cash were partially offset by:
| • | a $268 million increase in other accrued liabilities; |
| • | a $169 million increase in accounts payable; and |
| • | a $107 million decrease in tooling investment for current and upcoming program launches. |
| 16 | Magna International Inc. First Quarter Report 2024 |
INVESTING ACTIVITIES

| For the three months | ||||||||||||
| ended March 31, | ||||||||||||
| 2024 | 2023 | Change | ||||||||||
| Fixed asset additions | $ | (493 | ) | $ | (424 | ) | ||||||
| Increase in investments, other assets and intangible assets | (125 | ) | (101 | ) | ||||||||
| Increase in public and private equity investments | (23 | ) | — | |||||||||
| Fixed assets, investments, other assets and intangible assets additions | (641 | ) | (525 | ) | ||||||||
| Proceeds from dispositions | 87 | 19 | ||||||||||
| Net cash inflow (outflow) from disposal of facilities | 4 | (25 | ) | |||||||||
| Acquisitions | (30 | ) | — | |||||||||
| Cash used for investing activities | $ | (580 | ) | $ | (531 | ) | $ | (49 | ) | |||
Cash used for investing activities in the first quarter of 2024 was $49 million higher compared to the first quarter of 2023. The change between the first quarter of 2024 and the first quarter of 2023 was primarily due to a $116 million increase of cash used for fixed assets, investments, other assets and intangible assets. This factor was partially offset by higher proceeds from dispositions during the first quarter of 2024, primarily related to the sale of an equity-method investment.
FINANCING ACTIVITIES
| For the three months | ||||||||||||
| ended March 31, | ||||||||||||
| 2024 | 2023 | Change | ||||||||||
| Issues of debt | $ | 425 | $ | 1,641 | ||||||||
| Increase (decrease) in short-term borrowings | 341 | (3 | ) | |||||||||
| Issue of Common Shares on exercise of stock options | 30 | 6 | ||||||||||
| Dividends paid to non-controlling interests | — | (7 | ) | |||||||||
| Repurchase of Common Shares | (3 | ) | (9 | ) | ||||||||
| Tax withholdings on vesting of equity awards | (4 | ) | (9 | ) | ||||||||
| Repayments of debt | (9 | ) | (2 | ) | ||||||||
| Dividends paid | (134 | ) | (132 | ) | ||||||||
| Cash provided from financing activities | $ | 646 | $ | 1,485 | $ | (839 | ) | |||||
On March 14, 2024 we issued $400 million of Senior Notes carrying an interest rate of 5.050% [the “Senior Notes”], with a maturity of March 14, 2029. The net cash proceeds received from the Senior Note issuance was $397 million. The Senior Notes were issued for general corporate purposes, which may include the repayment of our existing indebtedness of $750 million in Senior Notes coming due in June 2024.
The Senior Notes are unsecured obligations and do not include any financial covenants. We may redeem the Senior Notes in whole or in part at any time, and from time to time, at specified redemption prices determined in accordance with the terms of the indenture governing the Senior Notes. Refer to Note 10, “Debt” of our unaudited interim consolidated financial statements for the three months ended March 31, 2024.
Short-term borrowings increased $341 million during the first quarter of 2024 primarily due to the issuance of Commercial paper.
During the first quarter of 2024 we repurchased 0.1 million Common Shares under normal course issuer bids for aggregate cash consideration of $3 million.
Cash dividends paid per Common Share were $0.475 for the first quarter of 2024 compared to $0.46 for the first quarter of 2023.
| Magna International Inc. First Quarter Report 2024 | 17 |
FINANCING RESOURCES
| As at | As at | |||||||||||
| March 31, | December 31, | |||||||||||
| 2024 | 2023 | Change | ||||||||||
| Liabilities | ||||||||||||
| Short-term borrowings | $ | 838 | $ | 511 | ||||||||
| Long-term debt due within one year | 824 | 819 | ||||||||||
| Current portion of operating lease liabilities | 306 | 399 | ||||||||||
| Long-term debt | 4,549 | 4,175 | ||||||||||
| Operating lease liabilities | 1,407 | 1,319 | ||||||||||
| $ | 7,924 | $ | 7,223 | $ | 701 | |||||||
Financial liabilities increased $701 million to $7.92 billion as at March 31, 2024 primarily as a result the issuance of the Senior Notes during the first quarter of 2024.
CASH RESOURCES
In the first quarter of 2024, our cash resources increased by $0.3 billion to $1.5 billion, primarily as a result of cash provided from financing and operating activities partially offset by cash used for investing activities, as discussed above. In addition to our cash resources at March 31, 2024, we had term and operating lines of credit totaling $4.1 billion, of which $2.7 billion was unused and available.
On March 28, 2024, we amended our $2.7 billion syndicated revolving credit facility, including to extend the maturity date from June 24, 2028 to June 25, 2029.
MAXIMUM NUMBER OF SHARES ISSUABLE
The following table presents the maximum number of shares that would be outstanding if all of the outstanding options at May 2, 2024 were exercised:
| Common Shares | 287,280,095 | |||
| Stock options (i) | 6,074,086 | |||
| 293,354,181 |
| (i) | Options to purchase Common Shares are exercisable by the holder in accordance with the vesting provisions and upon payment of the exercise price as may be determined from time to time pursuant to our stock option plans. |
CONTRACTUAL OBLIGATIONS
There have been no material changes with respect to the contractual obligations requiring annual payments during the first quarter of 2024 that are outside the ordinary course of our business. Refer to our MD&A included in our 2023 Annual Report.
| 18 | Magna International Inc. First Quarter Report 2024 |
NON-GAAP FINANCIAL MEASURES RECONCILIATION
The reconciliation of Non-GAAP financial measures is as follows:
ADJUSTED EBIT
| For the three months | ||||||||
| ended March 31, | ||||||||
| 2024 | 2023 | |||||||
| Net Income | $ | 26 | $ | 217 | ||||
| Add: | ||||||||
| Amortization of acquired intangible assets | 28 | 12 | ||||||
| Interest expense, net | 51 | 20 | ||||||
| Other expense, net | 356 | 142 | ||||||
| Income taxes | 8 | 58 | ||||||
| Adjusted EBIT | $ | 469 | $ | 449 | ||||
ADJUSTED EBIT AS A PERCENTAGE OF SALES
| For the three months | ||||||||
| ended March 31, | ||||||||
| 2024 | 2023 | |||||||
| Sales | $ | 10,970 | $ | 10,673 | ||||
| Adjusted EBIT | $ | 469 | $ | 449 | ||||
| Adjusted EBIT as a percentage of sales | 4.3 | % | 4.2 | % | ||||
ADJUSTED DILUTED EARNINGS PER SHARE
| For the three months | ||||||||
| ended March 31, | ||||||||
| 2024 | 2023 | |||||||
| Net income attributable to Magna International Inc. | $ | 9 | $ | 209 | ||||
| Add (deduct): | ||||||||
| Amortization of acquired intangible assets | 28 | 12 | ||||||
| Other expense, net | 356 | 142 | ||||||
| Tax effect on Amortization of acquired intangible assets and Other expense, net | (82 | ) | (34 | ) | ||||
| Adjusted net income attributable to Magna International Inc. | 311 | 329 | ||||||
| Diluted weighted average number of Common Shares outstanding during the period (millions) | 287.1 | 286.6 | ||||||
| Adjusted diluted earnings per share | $ | 1.08 | $ | 1.15 | ||||
| Magna International Inc. First Quarter Report 2024 | 19 |
ADJUSTED RETURN ON INVESTED CAPITAL
Adjusted Return on Invested Capital is calculated as Adjusted After-tax operating profits divided by Average Invested Capital for the period. Average Invested Capital for the three month period is averaged on a two-fiscal quarter basis.
| For the three months | ||||||||
| ended March 31, | ||||||||
| 2024 | 2023 | |||||||
| Net Income | $ | 26 | $ | 217 | ||||
| Add (deduct): | ||||||||
| Amortization of acquired intangible assets | 28 | 12 | ||||||
| Interest expense, net | 51 | 20 | ||||||
| Other expense, net | 356 | 142 | ||||||
| Tax effect on Interest expense, net, Amortization of acquired intangible assets and Other expense, net | (93 | ) | (38 | ) | ||||
| Adjusted After-tax operating profits | $ | 368 | $ | 353 | ||||
| As at March 31, | ||||||||
| 2024 | 2023 | |||||||
| Total Assets | $ | 32,678 | $ | 30,654 | ||||
| Excluding: | ||||||||
| Cash and cash equivalents | (1,517 | ) | (2,429 | ) | ||||
| Deferred tax assets | (753 | ) | (506 | ) | ||||
| Less Current Liabilities | (13,566 | ) | (12,045 | ) | ||||
| Excluding: | ||||||||
| Short-term borrowing | 838 | 4 | ||||||
| Long-term debt due within one year | 824 | 668 | ||||||
| Current portion of operating lease liabilities | 306 | 285 | ||||||
| Invested Capital | $ | 18,810 | $ | 16,631 | ||||
| For the three months | ||||||||
| ended March 31, | ||||||||
| 2024 | 2023 | |||||||
| Adjusted After-tax operating profits | $ | 368 | $ | 353 | ||||
| Average Invested Capital | $ | 18,871 | $ | 16,318 | ||||
| Adjusted Return on Invested Capital | 7.8 | % | 8.7 | % | ||||
COMMITMENTS AND CONTINGENCIES
From time to time, we may be contingently liable for litigation, legal and/or regulatory actions and proceedings and other claims. Refer to Note 14, “Contingencies” of our unaudited interim consolidated financial statements for the three months ended March 31, 2024, which describes these claims.
For a discussion of risk factors relating to legal and other claims/actions against us, refer to “Item 5. Risk Factors” in our AIF and Form 40-F, each in respect of the year ended December 31, 2023.
CONTROLS AND PROCEDURES
There have been no changes in our internal controls over financial reporting that occurred during the three months ended March 31, 2024 that have materially affected, or are reasonably likely to materially affect, our internal control over financial reporting.
| 20 | Magna International Inc. First Quarter Report 2024 |
FORWARD-LOOKING STATEMENTS
Certain statements in this MD&A may constitute “forward-looking information” or “forward-looking statements” (collectively, “forward-looking statements”). Any such forward-looking statements are intended to provide information about management’s current expectations and plans and may not be appropriate for other purposes. Forward-looking statements may include financial and other projections, as well as statements regarding our future plans, strategic objectives or economic performance, or the assumptions underlying any of the foregoing, and other statements that are not recitations of historical fact. We use words such as “may”, “would”, “could”, “should”, “will”, “likely”, “expect”, “anticipate”, “assume”, “believe”, “intend”, “plan”, “aim”, “forecast”, “outlook”, “project”, “potential”, “cyclicality”, “estimate”, “target” and similar expressions suggesting future outcomes or events to identify forward-looking statements.
Forward-looking statements are based on information currently available to us and are based on assumptions and analyses made by us in light of our experience and our perception of historical trends, current conditions and expected future developments, as well as other factors we believe are appropriate in the circumstances. While we believe we have a reasonable basis for making any such forward-looking statements, they are not a guarantee of future performance or outcomes. Whether actual results and developments conform to our expectations and predictions is subject to a number of risks, assumptions, and uncertainties, many of which are beyond our control, and the effects of which can be difficult to predict, including, without limitation:
Macroeconomic, Geopolitical and Other Risks
| • | inflationary pressures; |
| • | interest rates; |
| • | geopolitical risks; |
Risks Related to the Automotive Industry
| • | economic cyclicality; |
| • | regional production volume declines; |
| • | deteriorating vehicle affordability; |
| • | misalignment between EV production and sales; |
| • | intense competition; |
Strategic Risks
| • | alignment with “Car of the Future”; |
| • | evolving business risk profile; |
| • | technology and innovation; |
| • | investments in mobility and technology companies; |
Customer-Related Risks
| • | customer concentration; |
| • | growth with Asian OEMs; |
| • | growth of EV-focused OEMs; |
| • | risks of conducting business with newer EV-focused OEMs; |
| • | Fisker’s ability to continue as a going concern; |
| • | dependence on outsourcing; |
| • | customer cooperation and consolidation; |
| • | EV program deferrals; |
| • | market shifts; |
| • | consumer take rate shifts; |
| • | quarterly sales fluctuations; |
| • | customer purchase orders; |
| • | potential OEM production-related disruptions; |
Supply Chain Risks
| • | semiconductor chip supply disruptions and price increases; |
| • | supply chain disruptions; |
| • | regional energy supply and pricing; |
| • | supply base condition; |
Manufacturing/Operational Risks
| • | product launch; |
| • | operational underperformance; |
| • | restructuring costs; |
| • | impairments; |
| • | labour disruptions; |
| • | skilled labour attraction/retention; |
| • | leadership expertise and succession; |
Pricing Risks
| • | quote/pricing assumptions; |
| • | customer pricing pressure/contractual arrangements; |
| • | commodity cost volatility; |
| • | scrap steel/aluminum price volatility; |
Warranty/Recall Risks
| • | repair/replace costs; |
| • | warranty provisions; |
| • | product liability; |
Climate Change Risks
| • | transition risks and physical risks; |
| • | strategic and other risks; |
IT Security/Cybersecurity Risks
| • | IT/cybersecurity breach; |
| • | product cybersecurity; |
Acquisition Risks
| • | acquisition of strategic targets; |
| • | inherent merger and acquisition risks; |
| • | acquisition integration and synergies; |
Other Business Risks
| • | joint ventures; |
| • | intellectual property; |
| • | risks of doing business in foreign markets; |
| • | relative foreign exchange rates; |
| • | currency devaluation in Argentina; |
| • | pension risks; |
| • | tax risks; |
| • | returns on capital investments; |
| • | financial flexibility; |
| • | credit ratings changes; |
| • | stock price fluctuation; |
| • | dividends; |
Legal, Regulatory and Other Risks
| • | antitrust proceedings; |
| • | legal and regulatory proceedings; |
| • | changes in laws; |
| • | trade agreements; |
| • | trade disputes/tariffs; and |
| • | environmental compliance. |
| Magna International Inc. First Quarter Report 2024 | 21 |
In evaluating forward-looking statements, we caution readers not to place undue reliance on any forward-looking statement. Additionally, readers should specifically consider the various factors which could cause actual events or results to differ materially from those indicated by such forward-looking statements, including the risks, assumptions and uncertainties above which are:
| • | discussed under the “Industry Trends and Risks” heading of our Management’s Discussion and Analysis; and |
| • | set out in our Annual Information Form filed with securities commissions in Canada, our annual report on Form 40-F filed with the United States Securities and Exchange Commission, and subsequent filings. |
Readers should also consider discussion of our risk mitigation activities with respect to certain risk factors, which can also be found in our Annual Information Form. Additional information about Magna, including our Annual Information Form, is available through the System for Electronic Data Analysis and Retrieval+ (SEDAR+) at www.sedarplus.com.
| 22 | Magna International Inc. First Quarter Report 2024 |
MAGNA INTERNATIONAL INC.
CONSOLIDATED STATEMENTS OF INCOME
[Unaudited]
[U.S. dollars in millions, except per share figures]
| Three months ended | |||||||||||
| March 31, | |||||||||||
| Note | 2024 | 2023 | |||||||||
| Sales | 14 | $ | 10,970 | $ | 10,673 | ||||||
| Costs and expenses | |||||||||||
| Cost of goods sold | 9,642 | 9,416 | |||||||||
| Selling, general and administrative | 516 | 488 | |||||||||
| Depreciation | 377 | 353 | |||||||||
| Amortization of acquired intangible assets | 28 | 12 | |||||||||
| Interest expense, net | 51 | 20 | |||||||||
| Equity income | (34 | ) | (33 | ) | |||||||
| Other expense, net | 2 | 356 | 142 | ||||||||
| Income from operations before income taxes | 34 | 275 | |||||||||
| Income taxes | 8 | 58 | |||||||||
| Net income | 26 | 217 | |||||||||
| Income attributable to non-controlling interests | (17 | ) | (8 | ) | |||||||
| Net income attributable to Magna International Inc. | $ | 9 | $ | 209 | |||||||
| Earnings per Common Share: | 3 | ||||||||||
| Basic | $ | 0.03 | $ | 0.73 | |||||||
| Diluted | $ | 0.03 | $ | 0.73 | |||||||
| Cash dividends paid per Common Share | $ | 0.475 | $ | 0.460 | |||||||
| Weighted average number of Common Shares outstanding during the period [in millions]: | 3 | ||||||||||
| Basic | 286.9 | 286.1 | |||||||||
| Diluted | 287.1 | 286.6 | |||||||||
See accompanying notes
| Magna International Inc. First Quarter Report 2024 | 23 |
MAGNA INTERNATIONAL INC.
CONSOLIDATED STATEMENTS OF COMPREHENSIVE (LOSS) INCOME
[Unaudited]
[U.S. dollars in millions]
| Three months ended | |||||||||||
| March 31, | |||||||||||
| Note | 2024 | 2023 | |||||||||
| Net income | $ | 26 | $ | 217 | |||||||
| Other comprehensive (loss) income, net of tax: | 11 | ||||||||||
| Net unrealized (loss) gain on translation of net investment in foreign operations | (242 | ) | 45 | ||||||||
| Net unrealized (loss) gain on cash flow hedges | (13 | ) | 41 | ||||||||
| Reclassification of net gain on cash flow hedges to net income | (29 | ) | (3 | ) | |||||||
| Pension and post retirement benefits | — | (5 | ) | ||||||||
| Reclassification of net loss on pensions to net income | 1 | 1 | |||||||||
| Other comprehensive (loss) income | (283 | ) | 79 | ||||||||
| Comprehensive (loss) income | (257 | ) | 296 | ||||||||
| Comprehensive income attributable to non-controlling interests | (10 | ) | (10 | ) | |||||||
| Comprehensive (loss) income attributable to Magna International Inc. | $ | (267 | ) | $ | 286 | ||||||
See accompanying notes
| 24 | Magna International Inc. First Quarter Report 2024 |
MAGNA INTERNATIONAL INC.
CONSOLIDATED BALANCE SHEETS
[Unaudited]
[U.S. dollars in millions]
| As at | As at | ||||||||||
| March 31, | December 31, | ||||||||||
| Note | 2024 | 2023 | |||||||||
| ASSETS | |||||||||||
| Current assets | |||||||||||
| Cash and cash equivalents | 4 | $ | 1,517 | $ | 1,198 | ||||||
| Accounts receivable | 8,379 | 7,881 | |||||||||
| Inventories | 5 | 4,511 | 4,606 | ||||||||
| Prepaid expenses and other | 399 | 352 | |||||||||
| 14,806 | 14,037 | ||||||||||
| Investments | 6 | 1,195 | 1,273 | ||||||||
| Fixed assets, net | 9,545 | 9,618 | |||||||||
| Operating lease right-of-use assets | 1,733 | 1,744 | |||||||||
| Intangible assets, net | 821 | 876 | |||||||||
| Goodwill | 2,705 | 2,767 | |||||||||
| Deferred tax assets | 753 | 621 | |||||||||
| Other assets | 7 | 1,120 | 1,319 | ||||||||
| $ | 32,678 | $ | 32,255 | ||||||||
| LIABILITIES AND SHAREHOLDERS’ EQUITY | |||||||||||
| Current liabilities | |||||||||||
| Short-term borrowing | 9 | $ | 838 | $ | 511 | ||||||
| Accounts payable | 7,855 | 7,842 | |||||||||
| Other accrued liabilities | 8 | 2,728 | 2,626 | ||||||||
| Accrued salaries and wages | 883 | 912 | |||||||||
| Income taxes payable | 132 | 125 | |||||||||
| Long-term debt due within one year | 824 | 819 | |||||||||
| Current portion of operating lease liabilities | 306 | 399 | |||||||||
| 13,566 | 13,234 | ||||||||||
| Long-term debt | 9 | 4,549 | 4,175 | ||||||||
| Operating lease liabilities | 1,407 | 1,319 | |||||||||
| Long-term employee benefit liabilities | 584 | 591 | |||||||||
| Other long-term liabilities | 471 | 475 | |||||||||
| Deferred tax liabilities | 177 | 184 | |||||||||
| 20,754 | 19,978 | ||||||||||
| Shareholders’ equity | |||||||||||
| Capital stock | |||||||||||
| Common Shares | |||||||||||
| [issued: 287,280,095; December 31, 2023 – 286,552,908] | 10 | 3,399 | 3,354 | ||||||||
| Contributed surplus | 125 | 125 | |||||||||
| Retained earnings | 9,171 | 9,303 | |||||||||
| Accumulated other comprehensive loss | 11 | (1,174 | ) | (898 | ) | ||||||
| 11,521 | 11,884 | ||||||||||
| Non-controlling interests | 403 | 393 | |||||||||
| 11,924 | 12,277 | ||||||||||
| $ | 32,678 | $ | 32,255 | ||||||||
See accompanying notes
| Magna International Inc. First Quarter Report 2024 | 25 |
MAGNA INTERNATIONAL INC.
CONSOLIDATED STATEMENTS OF CASH FLOWS
[Unaudited]
[U.S. dollars in millions]
| Three months ended | |||||||||||
| March 31, | |||||||||||
| Note | 2024 | 2023 | |||||||||
| Cash provided from (used for): | |||||||||||
| OPERATING ACTIVITIES | |||||||||||
| Net income | $ | 26 | $ | 217 | |||||||
| Items not involving current cash flows | 4 | 565 | 351 | ||||||||
| 591 | 568 | ||||||||||
| Changes in operating assets and liabilities | 4 | (330 | ) | (341 | ) | ||||||
| Cash provided from operating activities | 261 | 227 | |||||||||
| INVESTMENT ACTIVITIES | |||||||||||
| Fixed asset additions | (493 | ) | (424 | ) | |||||||
| Acquisitions | (30 | ) | — | ||||||||
| Increase in public and private equity investments | (23 | ) | — | ||||||||
| Increase in investments, other assets and intangible assets | (125 | ) | (101 | ) | |||||||
| Proceeds from dispositions | 87 | 19 | |||||||||
| Net cash inflow (outflow) from disposal of facilities | 4 | (25 | ) | ||||||||
| Cash used for investing activities | (580 | ) | (531 | ) | |||||||
| FINANCING ACTIVITIES | |||||||||||
| Increase (decrease) in short-term borrowings | 341 | (3 | ) | ||||||||
| Issues of debt | 9 | 425 | 1,641 | ||||||||
| Repayments of debt | (9 | ) | (2 | ) | |||||||
| Issues of Common Shares on exercise of stock options | 30 | 6 | |||||||||
| Tax withholdings on vesting of equity awards | (4 | ) | (9 | ) | |||||||
| Repurchase of Common Shares | 10 | (3 | ) | (9 | ) | ||||||
| Dividends paid to non-controlling interests | — | (7 | ) | ||||||||
| Dividends | (134 | ) | (132 | ) | |||||||
| Cash provided by (used for) financing activities | 646 | 1,485 | |||||||||
| Effect of exchange rate changes on cash and cash equivalents | (8 | ) | 14 | ||||||||
| Net increase in cash and cash equivalents during the period | 319 | 1,195 | |||||||||
| Cash and cash equivalents, beginning of period | 1,198 | 1,234 | |||||||||
| Cash and cash equivalents, end of period | 4 | $ | 1,517 | $ | 2,429 | ||||||
See accompanying notes
| 26 | Magna International Inc. First Quarter Report 2024 |
MAGNA INTERNATIONAL INC.
CONSOLIDATED STATEMENTS OF CHANGES IN EQUITY
[Unaudited]
[U.S. dollars in millions]
| Common Shares | Non- | ||||||||||||||||||||||||||||||
| Stated | Contributed | Retained | controlling | Total | |||||||||||||||||||||||||||
| Note | Number | Value | Surplus | Earnings | AOCL (i) | Interest | Equity | ||||||||||||||||||||||||
| [in millions] | |||||||||||||||||||||||||||||||
| Balance, December 31, 2023 | 286.6 | $ | 3,354 | $ | 125 | $ | 9,303 | $ | (898 | ) | $ | 393 | $ | 12,277 | |||||||||||||||||
| Net income | 9 | 17 | 26 | ||||||||||||||||||||||||||||
| Other comprehensive loss | (276 | ) | (7 | ) | (283 | ) | |||||||||||||||||||||||||
| Shares issued on exercise of stock options | 0.7 | 36 | (6 | ) | 30 | ||||||||||||||||||||||||||
| Release of stock and stock units | 0.1 | 9 | (9 | ) | — | ||||||||||||||||||||||||||
| Tax withholdings on vesting of Equity awards | (0.1 | ) | (1 | ) | (3 | ) | (4 | ) | |||||||||||||||||||||||
| Repurchase and cancellation under normal course issuer bid | 10 | (0.1 | ) | (1 | ) | (2 | ) | (3 | ) | ||||||||||||||||||||||
| Stock-based compensation expense | 15 | 15 | |||||||||||||||||||||||||||||
| Dividends paid | 0.1 | 2 | (136 | ) | (134 | ) | |||||||||||||||||||||||||
| Balance, March 31, 2024 | 287.3 | $ | 3,399 | $ | 125 | $ | 9,171 | $ | (1,174 | ) | $ | 403 | $ | 11,924 | |||||||||||||||||
| Common Shares | Non- | ||||||||||||||||||||||||||||||
| Stated | Contributed | Retained | controlling | Total | |||||||||||||||||||||||||||
| Note | Number | Value | Surplus | Earnings | AOCL (i) | Interest | Equity | ||||||||||||||||||||||||
| [in millions] | |||||||||||||||||||||||||||||||
| Balance, December 31, 2022 | 285.9 | $ | 3,299 | $ | 111 | $ | 8,639 | $ | (1,114 | ) | $ | 400 | $ | 11,335 | |||||||||||||||||
| Net income | 209 | 8 | 217 | ||||||||||||||||||||||||||||
| Other comprehensive income | 77 | 2 | 79 | ||||||||||||||||||||||||||||
| Shares issued on exercise of stock options | 0.1 | 7 | (1 | ) | 6 | ||||||||||||||||||||||||||
| Release of stock and stock units | 0.3 | 15 | (15 | ) | — | ||||||||||||||||||||||||||
| Tax withholdings on vesting of Equity awards | (0.1 | ) | (2 | ) | (7 | ) | (9 | ) | |||||||||||||||||||||||
| Repurchase and cancellation under normal course issuer bid | 10 | (0.1 | ) | (2 | ) | (8 | ) | 1 | (9 | ) | |||||||||||||||||||||
| Stock-based compensation expense | 9 | 9 | |||||||||||||||||||||||||||||
| Dividends paid | 2 | (134 | ) | (132 | ) | ||||||||||||||||||||||||||
| Dividends paid to non-controlling interests | (7 | ) | (7 | ) | |||||||||||||||||||||||||||
| Balance, March 31, 2023 | 286.1 | $ | 3,319 | $ | 104 | $ | 8,699 | $ | (1,036 | ) | $ | 403 | $ | 11,489 | |||||||||||||||||
| (i) | AOCL is Accumulated Other Comprehensive Loss. |
See accompanying notes
| Magna International Inc. First Quarter Report 2024 | 27 |
MAGNA INTERNATIONAL INC.
NOTES TO INTERIM CONSOLIDATED FINANCIAL STATEMENTS
[Unaudited]
[All amounts in U.S. dollars and all tabular amounts in millions unless otherwise noted]
| 1. | SIGNIFICANT ACCOUNTING POLICIES |
| [a] | Basis of presentation |
The unaudited interim consolidated financial statements of Magna International Inc. and its subsidiaries [collectively “Magna” or the “Company”] have been prepared in U.S. dollars following accounting principles generally accepted in the United States of America [“GAAP”]. The unaudited interim consolidated financial statements do not conform in all respects to the requirements of GAAP for annual financial statements. Accordingly, these unaudited interim consolidated financial statements should be read in conjunction with the December 31, 2023 audited consolidated financial statements and notes thereto included in the Company’s 2023 Annual Report.
The unaudited interim consolidated financial statements reflect all adjustments, which consist only of normal and recurring adjustments, necessary to present fairly the financial position as at March 31, 2024 and the results of operations, changes in equity, and cash flows for the three-month periods ended March 31, 2024 and 2023.
For the three months ended March 31, 2023, $12 million has been reclassified from Depreciation and amortization to Amortization of acquired intangible assets on the consolidated statements of income to conform with current period presentation.
| [b] | Use of Estimates |
The preparation of the unaudited interim consolidated financial statements in conformity with GAAP requires management to make estimates and assumptions that affect the amounts reported and disclosed in the interim consolidated financial statements and accompanying notes. Due to the inherent uncertainty involved in making estimates, actual results could ultimately differ from those estimates.
| 2. | OTHER EXPENSE, NET |
| Three months ended | |||||||||||
| March 31, | |||||||||||
| 2024 | 2023 | ||||||||||
| Impairments and restructuring related to Fisker Inc. [“Fisker”] | [a] | $ | 316 | $ | — | ||||||
| Restructuring | [b] | 38 | 118 | ||||||||
| Investments | [c] | 2 | 24 | ||||||||
| $ | 356 | $ | 142 | ||||||||
| [a] | Impairments and restructuring related to Fisker |
Impairment of Fisker related assets
During the first quarter of 2024, the Company recorded a $261 million [$205 million after tax] impairment charge on its Fisker related assets as a result of the expected lack of future cashflows and the substantial doubt about Fisker’s ability to continue as a going concern. The assets impaired include production receivables, inventory, fixed assets and other capitalized expenditures. The following table summarizes the net asset impairments by segment:
| Body | ||||||||||||||||||||
| Exteriors & | Power & | Seating | Complete | |||||||||||||||||
| Structures | Vision | Systems | Vehicles | Total | ||||||||||||||||
| Accounts receivable | $ | 3 | $ | 4 | $ | 2 | $ | 14 | $ | 23 | ||||||||||
| Inventories | 5 | 37 | 8 | — | 50 | |||||||||||||||
| Other assets, net | 54 | — | 90 | 144 | ||||||||||||||||
| Fixed assets, net | 1 | 48 | 5 | 3 | 57 | |||||||||||||||
| Other accrued liabilities | (5 | ) | — | — | (10 | ) | (15 | ) | ||||||||||||
| Operating lease right-of-use assets | 1 | — | 1 | — | 2 | |||||||||||||||
| $ | 5 | $ | 143 | $ | 16 | $ | 97 | $ | 261 | |||||||||||
The Company is also exposed to risk related to third-party obligations of approximately $75 million in connection with manufacturing of the Fisker Ocean SUV.
| 28 | Magna International Inc. First Quarter Report 2024 |
MAGNA INTERNATIONAL INC.
NOTES TO INTERIM CONSOLIDATED FINANCIAL STATEMENTS
[Unaudited]
[All amounts in U.S. dollars and all tabular amounts in millions unless otherwise noted]
| 2. | OTHER EXPENSE, NET (CONTINUED) |
Impairment of Fisker warrants
Fisker issued approximately 19.5 million penny warrants to the Company to purchase common stock in connection with our agreements with Fisker for platform sharing, engineering and manufacturing of the Fisker Ocean SUV. These warrants vested during 2021 and 2022 based on specified milestones and have been marked to market each quarter.
During the first quarter of 2024, Magna recorded a $33 million [$25 million after tax] impairment charge on these warrants reducing the value of the warrants to nil.
When the warrants were issued and the vesting provisions realized, the Company recorded offsetting amounts to deferred revenue within other accrued liabilities and other long-term liabilities, and was recognized in income as performance obligations were satisfied. The unamortized amount of this deferred revenue as of March 31, 2024 was approximately $195 million, and will be recognized in income as performance obligations are satisfied or upon termination of the agreement for manufacturing of the Fisker Ocean SUV.
Restructuring
In the first quarter of 2024, the Company recorded restructuring charges of $22 million [$17 million after tax] in its Complete Vehicles segment in connection with its Fisker related assembly operations.
| [b] | Restructuring |
In the first quarter of 2024, the Company recorded additional restructuring charges of $26 million [$20 million after tax] in its Complete Vehicles segment, and $12 million [$12 million after tax] related to a facility in Europe in its Body Exteriors & Structures segment.
In the first quarter of 2023, the Company recorded restructuring charges of $105 million [$82 million after tax] in its Power & Vision segment, and $13 million [$10 million after tax] in its Body Exteriors & Structures segment.
| [c] | Net losses on investments |
| Three months ended | ||||||||
| March 31, | ||||||||
| 2024 | 2023 | |||||||
| Revaluation of public and private equity investments | $ | 2 | $ | 2 | ||||
| Revaluation of Fisker warrants | — | 22 | ||||||
| Other expense, net | 2 | 24 | ||||||
| Tax effect | (1 | ) | (6 | ) | ||||
| Net loss attributable to Magna | $ | 1 | $ | 18 | ||||
| Magna International Inc. First Quarter Report 2024 | 29 |
MAGNA INTERNATIONAL INC.
NOTES TO INTERIM CONSOLIDATED FINANCIAL STATEMENTS
[Unaudited]
[All amounts in U.S. dollars and all tabular amounts in millions unless otherwise noted]
| 3. | EARNINGS PER SHARE |
| Three months ended | ||||||||
| March 31, | ||||||||
| 2024 | 2023 | |||||||
| Basic earnings per Common Share: | ||||||||
| Net income attributable to Magna International Inc. | $ | 9 | $ | 209 | ||||
| Weighted average number of Common Shares outstanding | 286.9 | 286.1 | ||||||
| Basic earnings per Common Share | $ | 0.03 | $ | 0.73 | ||||
| Diluted earnings per Common Share [a]: | ||||||||
| Net income attributable to Magna International Inc. | $ | 9 | $ | 209 | ||||
| Weighted average number of Common Shares outstanding | 286.9 | 286.1 | ||||||
| Stock options and restricted stock | 0.2 | 0.5 | ||||||
| 287.1 | 286.6 | |||||||
| Diluted earnings per Common Share | $ | 0.03 | $ | 0.73 | ||||
| [a] | For the three months ended March 31, 2024, diluted earnings per Common Share excluded 2.8 million [2023 – 1.4 million] Common Shares issuable under the Company’s Incentive Stock Option Plan because these options were not “in-the-money”. The dilutive effect of participating securities using the two-class method was excluded from the calculation of earnings per share because the effect would be immaterial. |
| 30 | Magna International Inc. First Quarter Report 2024 |
MAGNA INTERNATIONAL INC.
NOTES TO INTERIM CONSOLIDATED FINANCIAL STATEMENTS
[Unaudited]
[All amounts in U.S. dollars and all tabular amounts in millions unless otherwise noted]
| 4. | DETAILS OF CASH FLOWS |
| [a] | Cash and cash equivalents: |
| March 31, | December 31, | |||||||
| 2024 | 2023 | |||||||
| Bank term deposits and bankers’ acceptances | $ | 586 | $ | 502 | ||||
| Cash | 931 | 696 | ||||||
| $ | 1,517 | $ | 1,198 | |||||
| [b] | Items not involving current cash flows: |
| Three months ended | ||||||||
| March 31, | ||||||||
| 2024 | 2023 | |||||||
| Depreciation | $ | 377 | $ | 353 | ||||
| Amortization of acquired intangible assets | 28 | 12 | ||||||
| Other asset amortization | 44 | 65 | ||||||
| Deferred revenue amortization | (74 | ) | (75 | ) | ||||
| Dividends received in excess of equity income | 14 | 8 | ||||||
| Deferred tax recovery | (128 | ) | (37 | ) | ||||
| Other non-cash charges | 8 | 1 | ||||||
| Non-cash portion of Other expense, net [note 2] | 296 | 24 | ||||||
| $ | 565 | $ | 351 | |||||
| [c] | Changes in operating assets and liabilities: |
| Three months ended | ||||||||
| March 31, | ||||||||
| 2024 | 2023 | |||||||
| Accounts receivable | $ | (591 | ) | $ | (1,170 | ) | ||
| Inventories | (66 | ) | (235 | ) | ||||
| Prepaid expenses and other | (85 | ) | (4 | ) | ||||
| Accounts payable | 147 | 693 | ||||||
| Accrued salaries and wages | (11 | ) | (21 | ) | ||||
| Other accrued liabilities | 270 | 491 | ||||||
| Income taxes (receivable) payable | 6 | (95 | ) | |||||
| $ | (330 | ) | $ | (341 | ) | |||
| Magna International Inc. First Quarter Report 2024 | 31 |
MAGNA INTERNATIONAL INC.
NOTES TO INTERIM CONSOLIDATED FINANCIAL STATEMENTS
[Unaudited]
[All amounts in U.S. dollars and all tabular amounts in millions unless otherwise noted]
| 5. | INVENTORIES |
Inventories consist of:
| March 31, | December 31, | |||||||
| 2024 | 2023 | |||||||
| Raw materials and supplies | $ | 1,732 | $ | 1,861 | ||||
| Work-in-process | 470 | 450 | ||||||
| Finished goods | 554 | 569 | ||||||
| Tooling and engineering | 1,755 | 1,726 | ||||||
| $ | 4,511 | $ | 4,606 | |||||
Tooling and engineering inventory represents costs incurred on tooling and engineering services contracts in excess of billed and unbilled amounts included in accounts receivable.
| 6. | INVESTMENTS |
| March 31, | December 31, | |||||||
| 2024 | 2023 | |||||||
| Equity method investments | $ | 921 | $ | 987 | ||||
| Public and private equity investments | 245 | 230 | ||||||
| Fisker Warrants | — | 34 | ||||||
| Debt investments | 29 | 22 | ||||||
| $ | 1,195 | $ | 1,273 | |||||
Cumulative unrealized gains and losses on equity securities held as at March 31, 2024 were $47 million and $357 million [$28 million and $323 million as at December 31, 2023], respectively.
| 7. | OTHER ASSETS |
Other assets consist of:
| March 31, | December 31, | |||||||
| 2024 | 2023 | |||||||
| Preproduction costs related to long-term supply agreements | $ | 691 | $ | 835 | ||||
| Long-term receivables | 276 | 321 | ||||||
| Pension overfunded status | 44 | 41 | ||||||
| Unrealized gain on cash flow hedges | 2 | 4 | ||||||
| Other, net | 107 | 118 | ||||||
| $ | 1,120 | $ | 1,319 | |||||
| 8. | WARRANTY |
The following is a continuity of the Company’s warranty accruals:
| 2024 | 2023 | |||||||
| Balance, beginning of period | $ | 270 | $ | 257 | ||||
| Expense, net | 33 | 49 | ||||||
| Settlements | (18 | ) | (23 | ) | ||||
| Foreign exchange and other | (1 | ) | 1 | |||||
| Balance, March 31 | $ | 284 | $ | 284 | ||||
| 32 | Magna International Inc. First Quarter Report 2024 |
MAGNA INTERNATIONAL INC.
NOTES TO INTERIM CONSOLIDATED FINANCIAL STATEMENTS
[Unaudited]
[All amounts in U.S. dollars and all tabular amounts in millions unless otherwise noted]
| 9. | DEBT |
Short-term borrowings
| [a] | Commercial Paper Program |
As at March 31, 2024, $838 million [$299 million as at December 31, 2023] of notes were outstanding under the U.S. commercial paper program, with a weighted average interest rate of 5.55% [2023 - 5.57%]. No notes were outstanding under the euro-commercial paper program as at March 31, 2024 [$210 million as at December 31, 2023 with a weighted average interest rate of 4.02%]. Maturities on amounts outstanding are less than three months.
Long-term borrowings
| [a] | Senior notes |
On March 14, 2024, the Company issued $400 million of Senior Notes carrying an interest rate of 5.050%, with a maturity date of March 14, 2029. The net cash proceeds received from the Senior Note issuance was $397 million. The Senior Notes were issued for general corporate purposes, which may include the repayment of the Company’s existing indebtedness of $750 million in Senior Notes coming due in June 2024.
The Senior Notes are unsecured obligations and do not include any financial covenants. The Company may redeem the notes in whole or in part at any time, and from time to time, at specified redemption prices determined in accordance with the terms of the indenture governing the Senior Notes.
| [b] | Global Credit Facility |
On March 28, 2024 the Company extended the maturity date of its $2.7 billion syndicated revolving credit facility from June 24, 2028 to June 25, 2029. No amounts are outstanding under this credit facility.
| 10. | CAPITAL STOCK |
| [a] | During the first quarter of 2024, the Company repurchased 0.1 million shares under a normal course issuer bid for cash consideration of $3 million. |
| [b] | The following table presents the maximum number of shares that would be outstanding if all the dilutive instruments outstanding at May 2, 2024 were exercised or converted: |
| Common Shares | 287,280,095 | |||
| Stock options [i] | 6,074,086 | |||
| 293,354,181 |
| [i] | Options to purchase Common Shares are exercisable by the holder in accordance with the vesting provisions and upon payment of the exercise price as may be determined from time to time pursuant to the Company’s stock option plans. |
| Magna International Inc. First Quarter Report 2024 | 33 |
MAGNA INTERNATIONAL INC.
NOTES TO INTERIM CONSOLIDATED FINANCIAL STATEMENTS
[Unaudited]
[All amounts in U.S. dollars and all tabular amounts in millions unless otherwise noted]
| 11. | ACCUMULATED OTHER COMPREHENSIVE LOSS |
| The following is a continuity schedule of accumulated other comprehensive loss: | ||||||||
| 2024 | 2023 | |||||||
| Accumulated net unrealized loss on translation of net investment in foreign operations | ||||||||
| Balance, beginning of period | $ | (836 | ) | $ | (1,018 | ) | ||
| Net unrealized (loss) gain | (235 | ) | 43 | |||||
| Repurchase of shares under normal course issuer bid | — | 1 | ||||||
| Balance, March 31 | (1,071 | ) | (974 | ) | ||||
| Accumulated net unrealized gain on cash flow hedges (i) | ||||||||
| Balance, beginning of period | 43 | 5 | ||||||
| Net unrealized (loss) gain | (13 | ) | 41 | |||||
| Reclassifications to net income | (29 | ) | (3 | ) | ||||
| Balance, March 31 | 1 | 43 | ||||||
| Accumulated net unrealized loss on other long-term liabilities | ||||||||
| Balance, beginning of period | (105 | ) | (101 | ) | ||||
| Net unrealized loss | — | (5 | ) | |||||
| Reclassifications to net income | 1 | 1 | ||||||
| Balance, March 31 | (104 | ) | (105 | ) | ||||
| Total accumulated other comprehensive loss | $ | (1,174 | ) | $ | (1,036 | ) | ||
| (i) | The amount of income tax expense that has been netted in the accumulated net unrealized gain on cash flow hedges is as follows: |
| 2024 | 2023 | |||||||
| Balance, beginning of period | $ | (16 | ) | $ | — | |||
| Net unrealized gains (losses) | 4 | (15 | ) | |||||
| Reclassifications to net income | 10 | 1 | ||||||
| Balance, March 31 | $ | (2 | ) | $ | (14 | ) | ||
The amount of other comprehensive gain that is expected to be reclassified to net income over the next 12 months is $12 million.
| 34 | Magna International Inc. First Quarter Report 2024 |
MAGNA INTERNATIONAL INC.
NOTES TO INTERIM CONSOLIDATED FINANCIAL STATEMENTS
[Unaudited]
[All amounts in U.S. dollars and all tabular amounts in millions unless otherwise noted]
| 12. | FINANCIAL INSTRUMENTS |
| [a] | Financial assets and liabilities |
The Company’s financial assets and financial liabilities consist of the following:
| March 31, | December 31, | |||||||
| 2024 | 2023 | |||||||
| Financial assets | ||||||||
| Cash and cash equivalents | $ | 1,517 | $ | 1,198 | ||||
| Accounts receivable | 8,379 | 7,881 | ||||||
| Fisker Warrants and public and private equity investments | 245 | 264 | ||||||
| Debt investments | 29 | 22 | ||||||
| Long-term receivables included in other assets | 276 | 321 | ||||||
| $ | 10,446 | $ | 9,686 | |||||
| Financial liabilities | ||||||||
| Short-term borrowing | $ | 838 | $ | 511 | ||||
| Long-term debt (including portion due within one year) | 5,373 | 4,994 | ||||||
| Operating lease liabilities (including current portion) | 1,713 | 1,718 | ||||||
| Accounts payable | 7,855 | 7,842 | ||||||
| $ | 15,779 | $ | 15,065 | |||||
| Derivatives designated as effective hedges, measured at fair value | ||||||||
| Foreign currency contracts | ||||||||
| Prepaid expenses | $ | 42 | $ | 78 | ||||
| Other assets | 2 | 4 | ||||||
| Other accrued liabilities | (24 | ) | (13 | ) | ||||
| Other long-term liabilities | (7 | ) | (8 | ) | ||||
| $ | 13 | $ | 61 | |||||
| [b] | Supplier financing program |
The Company has supplier financing programs with third-party financial institutions that provides financing to suppliers of tooling related materials. These arrangements allow suppliers to elect to be paid by a financial institution at a discount earlier than the maturity date of the receivable, which may extend from 6 to 18 months. The Company will pay the full amount owing to the financial institution on the maturity dates. Amounts outstanding under these programs as at March 31, 2024 were $139 million [$132 million at December 31, 2023] and are presented within accounts payable.
| [c] | Fair value |
The Company determined the estimated fair values of its financial instruments based on valuation methodologies it believes are appropriate; however, considerable judgment is required to develop these estimates. Accordingly, these estimated fair values are not necessarily indicative of the amounts the Company could realize in a current market exchange. The estimated fair value amounts can be materially affected by the use of different assumptions or methodologies. The methods and assumptions used to estimate the fair value of financial instruments are described below:
Cash and cash equivalents, accounts receivable, accounts payable and short-term borrowings
Due to the short period to maturity of the instruments, the carrying values as presented in the consolidated balance sheets are reasonable estimates of fair values.
| Magna International Inc. First Quarter Report 2024 | 35 |
MAGNA INTERNATIONAL INC.
NOTES TO INTERIM CONSOLIDATED FINANCIAL STATEMENTS
[Unaudited]
[All amounts in U.S. dollars and all tabular amounts in millions unless otherwise noted]
| 12. | FINANCIAL INSTRUMENTS (CONTINUED) |
Publicly traded and private equity securities
The fair value of the Company’s investments in publicly traded equity securities is determined using the closing price on the measurement date, as reported on the stock exchange on which the securities are traded. [Level 1 input based on the GAAP fair value hierarchy]
The Company estimates the value of its private equity securities based on valuation methods using the observable transaction price at the transaction date and other observable inputs including rights and obligations of the securities held by the Company. [Level 3 input based on the GAAP fair value hierarchy]
Fisker Warrants
The Company determined the value of its warrants based on the last quoted price in the active market for Fisker’s common shares, [Level 2 inputs based on the GAAP fair value hierarchy] followed by an impairment review considering both qualitative and quantitative factors that may have a significant impact on the investee’s fair value.
Term Loan
The Company’s Term Loans consists of advances in the form of 1, 3 or 6-month loans, that may be rolled over until the end of the 3 and 5-year terms. Due to the short-term maturity of each loan, the carrying value as presented in the consolidated balance sheets is a reasonable estimate of its fair value.
Senior Notes
At March 31, 2024, the net book value of the Company’s Senior Notes was $4.9 billion and the estimated fair value was $4.8 billion. The fair value of our Senior Notes are classified as Level 1 when quoted prices in active markets are available and Level 2 when the quoted prices are from less active markets or when other observable inputs are used to determine fair value.
| [d] | Credit risk |
The Company’s financial assets that are exposed to credit risk consist primarily of cash and cash equivalents, accounts receivable, and foreign exchange and commodity forward contracts with positive fair values. Cash and cash equivalents, which consist of short-term investments, are only invested in bank term deposits and bank commercial paper with an investment grade credit rating. Credit risk is further reduced by limiting the amount which is invested in certain major financial institutions.
The Company is also exposed to credit risk from the potential default by any of its counterparties on its foreign exchange forward contracts. The Company mitigates this credit risk by dealing with counterparties who are major financial institutions that the Company anticipates will satisfy their obligations under the contracts.
In the normal course of business, the Company is exposed to credit risk from its customers, substantially all of which are in the automotive industry and are subject to credit risks associated with the automotive industry. For the three months ended March 31, 2024, sales to the Company’s six largest customers represented 74% of the Company’s total sales; and substantially all of its sales are to customers with which the Company has ongoing contractual relationships. The Company continues to develop and conduct business with newer electric vehicle-focused customers, which poses incremental credit risk due to their relatively short operating histories; limited financial resources; less mature product development and validation processes; uncertain market acceptance of their products/services; and untested business models. These factors may elevate our risks in dealing with such customers, particularly with respect to recovery of: pre-production (including tooling, engineering, and launch) and production receivables; inventory; fixed assets and capitalized preproduction expenditures; as well as other third party obligations related to such items. As at March 31, 2024, the Company’s balance sheet exposure related to newer electric vehicle-focused customers was approximately $250 million. In determining the allowance for expected credit losses, the Company considers changes in customer’s credit ratings, liquidity, customer’s historical payments and loss experience, current economic conditions, and the Company’s expectations of future economic conditions.
| 36 | Magna International Inc. First Quarter Report 2024 |
MAGNA INTERNATIONAL INC.
NOTES TO INTERIM CONSOLIDATED FINANCIAL STATEMENTS
[Unaudited]
[All amounts in U.S. dollars and all tabular amounts in millions unless otherwise noted]
| 12. | FINANCIAL INSTRUMENTS (CONTINUED) |
| [e] | Interest rate risk |
The Company is not exposed to significant interest rate risk due to the short-term maturity of its monetary current assets and current liabilities. In particular, the amount of interest income earned on cash and cash equivalents is impacted more by investment decisions made and the demands to have available cash on hand, than by movements in interest rates over a given period.
The Company is exposed to interest rate risk on its Term Loans as the interest rate is variable, however the Company is not exposed to interest rate risk on Senior Notes as the interest rates are fixed.
| [f] | Currency risk and foreign exchange contracts |
The Company is exposed to fluctuations in foreign exchange rates when manufacturing facilities have committed to the delivery of products, and/or the purchase of materials and equipment in currencies other than the facilities’ functional currency. In an effort to manage this net foreign exchange exposure, the Company employs hedging programs, primarily through the use of foreign exchange forward contracts.
At March 31, 2024, the Company had outstanding foreign exchange forward contracts representing commitments to buy and sell various foreign currencies. Significant commitments are as follows:
| For Canadian dollars | For U.S. dollars | For Euros | |||||||||||||||||||||||||||||||
U.S. dollar amount | Weighted average rate | Peso amount | Weighted average rate | U.S. dollar amount | Weighted average rate | Czech Koruna Amount | Weighted average rate | ||||||||||||||||||||||||||
| Buy | 10 | 0.78351 | 2,310 | 0.04310 | 11 | 0.85755 | 719 | 0.03716 | |||||||||||||||||||||||||
| (Sell) | (619 | ) | 1.28153 | — | — | (43 | ) | 1.08593 | — | — | |||||||||||||||||||||||
Forward contracts mature at various dates through 2026. Foreign currency exposures are reviewed quarterly.
| [g] | Equity price risk |
Public equity securities
The Company’s public equity securities are subject to market price risk due to the risk of loss in value that would result from a decline in the market price of the common shares or underlying common shares.
| 13. | CONTINGENCIES |
From time to time, the Company may become involved in regulatory proceedings, or become liable for legal, contractual and other claims by various parties, including customers, suppliers, former employees, class action plaintiffs and others. On an ongoing basis, the Company attempts to assess the likelihood of any adverse judgments or outcomes to these proceedings or claims, together with potential ranges of probable costs and losses. A determination of the provision required, if any, for these contingencies is made after analysis of each individual issue. The required provision may change in the future due to new developments in each matter or changes in approach such as a change in settlement strategy in dealing with these matters.
In December 2023, the Company received a notification [the “Notification Letter”] from a customer informing the Company as to the customer’s initial determination that one of the Company’s operating groups bears responsibility for costs totaling $352 million related to two product recalls. The Notification Letter triggered a negotiation period regarding financial allocation of the total costs for the two recalls, which remains on-going. In the event such negotiations are not concluded successfully, the customer has discretion under its Terms and Conditions to debit Magna up to 50% of the parts and labour costs actually incurred related to the recalls. The Company believes that the product in question met the customer’s specifications, and accordingly, is vigorously contesting the customer’s determination. Magna does not currently anticipate any material liabilities.
| Magna International Inc. First Quarter Report 2024 | 37 |
MAGNA INTERNATIONAL INC.
NOTES TO INTERIM CONSOLIDATED FINANCIAL STATEMENTS
[Unaudited]
[All amounts in U.S. dollars and all tabular amounts in millions unless otherwise noted]
| 14. | SEGMENTED INFORMATION |
Magna is a global automotive supplier which has complete vehicle engineering and contract manufacturing expertise, as well as product capabilities which include body, chassis, exterior, seating, powertrain, active driver assistance, electronics, mirrors & lighting, mechatronics, and roof systems. Magna also has electronic and software capabilities across many of these areas.
The Company is organized under four operating segments: Body Exteriors & Structures, Power & Vision, Seating Systems, and Complete Vehicles. These segments have been determined on the basis of technological opportunities, product similarities, market and operating factors, and are also the Company’s reportable segments.
The Company’s chief operating decision maker uses Adjusted Earnings before Interest and Income Taxes [“Adjusted EBIT”] as the measure of segment profit or loss, since management believes Adjusted EBIT is the most appropriate measure of operational profitability or loss for its reporting segments. Adjusted EBIT is calculated by taking Net income and adding back Amortization of acquired intangible assets, Income taxes, Interest expense, net and Other (income) expense, net.
The Adjusted EBIT presented in the tables below for the prior period have been updated to reflect the revised calculation of Adjusted EBIT adopted by the Company effective July 1, 2023, which excludes the amortization of acquired intangible assets.
| [a] | The following tables show segment information for the Company’s reporting segments and a reconciliation of Adjusted EBIT to the Company’s consolidated net income: |
| Three months ended March 31, 2024 | ||||||||||||||||||||||||
| Fixed | ||||||||||||||||||||||||
| Total | External | Adjusted | Equity | asset | ||||||||||||||||||||
| sales | sales | EBIT [ii] | Depreciation | income | additions | |||||||||||||||||||
| Body Exteriors & Structures | $ | 4,429 | $ | 4,363 | $ | 298 | $ | 180 | $ | — | $ | 306 | ||||||||||||
| Power & Vision | 3,842 | 3,781 | 98 | 142 | (27 | ) | 143 | |||||||||||||||||
| Seating Systems | 1,455 | 1,449 | 52 | 25 | (5 | ) | 22 | |||||||||||||||||
| Complete Vehicles | 1,383 | 1,374 | 27 | 25 | (1 | ) | 12 | |||||||||||||||||
| Corporate & Other [i] | (139 | ) | 3 | (6 | ) | 5 | (1 | ) | 10 | |||||||||||||||
| Total Reportable Segments | $ | 10,970 | $ | 10,970 | $ | 469 | $ | 377 | $ | (34 | ) | $ | 493 | |||||||||||
| Three months ended March 31, 2023 | ||||||||||||||||||||||||
| Equity | Fixed | |||||||||||||||||||||||
| Total | External | Adjusted | (income) | asset | ||||||||||||||||||||
| sales | sales | EBIT [ii] | Depreciation | loss | additions | |||||||||||||||||||
| Body Exteriors & Structures | $ | 4,439 | $ | 4,318 | $ | 272 | $ | 185 | $ | — | $ | 271 | ||||||||||||
| Power & Vision | 3,323 | 3,255 | 92 | 118 | (34 | ) | 113 | |||||||||||||||||
| Seating Systems | 1,486 | 1,479 | 37 | 22 | (4 | ) | 20 | |||||||||||||||||
| Complete Vehicles | 1,626 | 1,617 | 52 | 25 | (1 | ) | 11 | |||||||||||||||||
| Corporate & Other [i] | (201 | ) | 4 | (4 | ) | 3 | 6 | 9 | ||||||||||||||||
| Total Reportable Segments | $ | 10,673 | $ | 10,673 | $ | 449 | $ | 353 | $ | (33 | ) | $ | 424 | |||||||||||
| [i] | Included in Corporate & Other Adjusted EBIT are intercompany fees charged to the automotive segments. |
| [ii] | The following table reconciles Net income to Adjusted EBIT: |
| Three months ended March 31, | ||||||||
| 2024 | 2023 | |||||||
| Net income | $ | 26 | $ | 217 | ||||
| Add: | ||||||||
| Amortization of acquired intangible assets | 28 | 12 | ||||||
| Interest expense, net | 51 | 20 | ||||||
| Other expense, net | 356 | 142 | ||||||
| Income taxes | 8 | 58 | ||||||
| Adjusted EBIT | $ | 469 | $ | 449 | ||||
| 38 | Magna International Inc. First Quarter Report 2024 |
MAGNA INTERNATIONAL INC.
NOTES TO INTERIM CONSOLIDATED FINANCIAL STATEMENTS
[Unaudited]
[All amounts in U.S. dollars and all tabular amounts in millions unless otherwise noted]
| 14. | SEGMENTED INFORMATION (CONTINUED) |
| [b] | The following table shows Goodwill for the Company’s reporting segments: |
| March 31, 2024 | December 31, 2023 | |||||||
| Body Exteriors & Structures | $ | 445 | $ | 452 | ||||
| Power & Vision | 1,880 | 1,928 | ||||||
| Seating Systems | 255 | 258 | ||||||
| Complete Vehicles | 106 | 109 | ||||||
| Corporate & Other | 19 | 20 | ||||||
| Total Reportable Segments | $ | 2,705 | $ | 2,767 | ||||
| [c] | The following table shows Net Assets for the Company’s reporting segments: |
| March 31, 2024 | December 31, 2023 | |||||||
| Body Exteriors & Structures | $ | 8,513 | $ | 8,147 | ||||
| Power & Vision | 7,608 | 7,880 | ||||||
| Seating Systems | 1,333 | 1,340 | ||||||
| Complete Vehicles | 361 | 574 | ||||||
| Corporate & Other | 1,066 | 1,066 | ||||||
| Total Reportable Segments | $ | 18,881 | $ | 19,007 | ||||
The following table reconciles Total Assets to Net Assets:
| March 31, 2024 | December 31, 2023 | |||||||
| Total Assets | $ | 32,678 | $ | 32,255 | ||||
| Deduct assets not included in segment net assets: | ||||||||
| Cash and cash equivalents | (1,517 | ) | (1,198 | ) | ||||
| Deferred tax assets | (753 | ) | (621 | ) | ||||
| Long-term receivables from joint venture partners | (61 | ) | (49 | ) | ||||
| Deduct liabilities included in segment net assets: | ||||||||
| Accounts payable | (7,855 | ) | (7,842 | ) | ||||
| Accrued salaries and wages | (883 | ) | (912 | ) | ||||
| Other accrued liabilities | (2,728 | ) | (2,626 | ) | ||||
| Segment Net Assets | $ | 18,881 | $ | 19,007 | ||||
| Magna International Inc. First Quarter Report 2024 | 39 |