Exhibit 99.2
| Third Quarter 2024 November 1, 2024 Q3 2024 Results 1 |
| Louis Tonelli Vice President, Investor Relations Q3 2024 Results 2 |
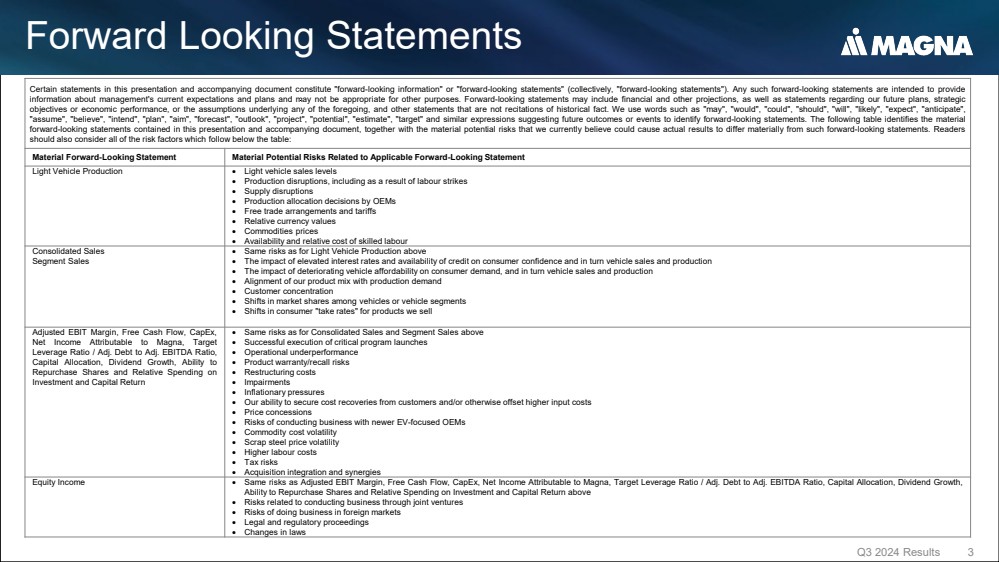
| Forward Looking Statements Q3 2024 Results 3 Certain statements in this presentation and accompanying document constitute "forward-looking information" or "forward-looking statements" (collectively, "forward-looking statements"). Any such forward-looking statements are intended to provide information about management's current expectations and plans and may not be appropriate for other purposes. Forward-looking statements may include financial and other projections, as well as statements regarding our future plans, strategic objectives or economic performance, or the assumptions underlying any of the foregoing, and other statements that are not recitations of historical fact. We use words such as "may", "would", "could", "should", "will", "likely", "expect", "anticipate", "assume", "believe", "intend", "plan", "aim", "forecast", "outlook", "project", "potential", "estimate", "target" and similar expressions suggesting future outcomes or events to identify forward-looking statements. The following table identifies the material forward-looking statements contained in this presentation and accompanying document, together with the material potential risks that we currently believe could cause actual results to differ materially from such forward-looking statements. Readers should also consider all of the risk factors which follow below the table: Material Forward-Looking Statement Material Potential Risks Related to Applicable Forward-Looking Statement Light Vehicle Production • Light vehicle sales levels • Production disruptions, including as a result of labour strikes • Supply disruptions • Production allocation decisions by OEMs • Free trade arrangements and tariffs • Relative currency values • Commodities prices • Availability and relative cost of skilled labour Consolidated Sales Segment Sales • Same risks as for Light Vehicle Production above • The impact of elevated interest rates and availability of credit on consumer confidence and in turn vehicle sales and production • The impact of deteriorating vehicle affordability on consumer demand, and in turn vehicle sales and production • Alignment of our product mix with production demand • Customer concentration • Shifts in market shares among vehicles or vehicle segments • Shifts in consumer "take rates" for products we sell Adjusted EBIT Margin, Free Cash Flow, CapEx, Net Income Attributable to Magna, Target Leverage Ratio / Adj. Debt to Adj. EBITDA Ratio, Capital Allocation, Dividend Growth, Ability to Repurchase Shares and Relative Spending on Investment and Capital Return • Same risks as for Consolidated Sales and Segment Sales above • Successful execution of critical program launches • Operational underperformance • Product warranty/recall risks • Restructuring costs • Impairments • Inflationary pressures • Our ability to secure cost recoveries from customers and/or otherwise offset higher input costs • Price concessions • Risks of conducting business with newer EV-focused OEMs • Commodity cost volatility • Scrap steel price volatility • Higher labour costs • Tax risks • Acquisition integration and synergies Equity Income • Same risks as Adjusted EBIT Margin, Free Cash Flow, CapEx, Net Income Attributable to Magna, Target Leverage Ratio / Adj. Debt to Adj. EBITDA Ratio, Capital Allocation, Dividend Growth, Ability to Repurchase Shares and Relative Spending on Investment and Capital Return above • Risks related to conducting business through joint ventures • Risks of doing business in foreign markets • Legal and regulatory proceedings • Changes in laws |
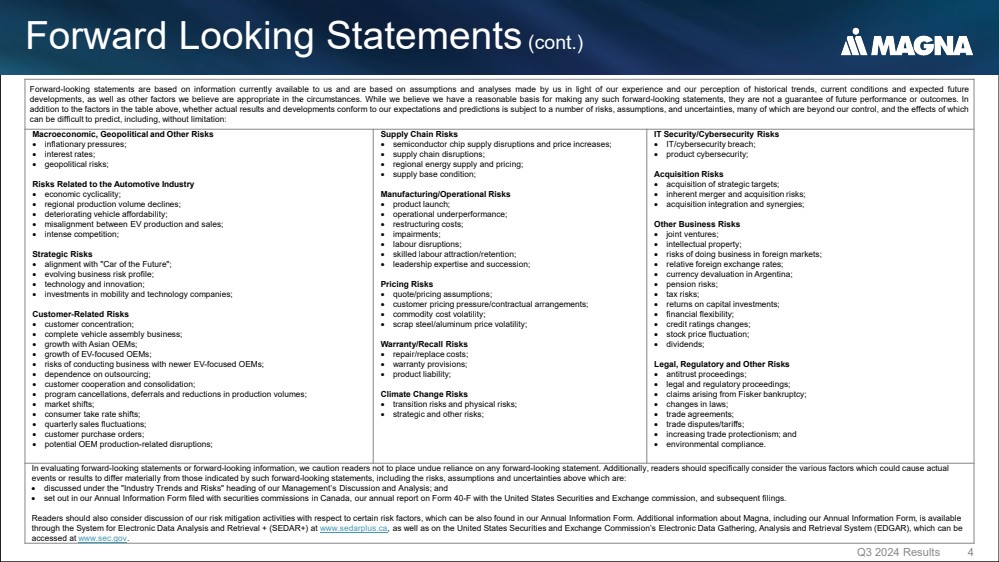
| Forward Looking Statements (cont.) Q3 2024 Results 4 Forward-looking statements are based on information currently available to us and are based on assumptions and analyses made by us in light of our experience and our perception of historical trends, current conditions and expected future developments, as well as other factors we believe are appropriate in the circumstances. While we believe we have a reasonable basis for making any such forward-looking statements, they are not a guarantee of future performance or outcomes. In addition to the factors in the table above, whether actual results and developments conform to our expectations and predictions is subject to a number of risks, assumptions, and uncertainties, many of which are beyond our control, and the effects of which can be difficult to predict, including, without limitation: Macroeconomic, Geopolitical and Other Risks • inflationary pressures; • interest rates; • geopolitical risks; Risks Related to the Automotive Industry • economic cyclicality; • regional production volume declines; • deteriorating vehicle affordability; • misalignment between EV production and sales; • intense competition; Strategic Risks • alignment with "Car of the Future"; • evolving business risk profile; • technology and innovation; • investments in mobility and technology companies; Customer-Related Risks • customer concentration; • complete vehicle assembly business; • growth with Asian OEMs; • growth of EV-focused OEMs; • risks of conducting business with newer EV-focused OEMs; • dependence on outsourcing; • customer cooperation and consolidation; • program cancellations, deferrals and reductions in production volumes; • market shifts; • consumer take rate shifts; • quarterly sales fluctuations; • customer purchase orders; • potential OEM production-related disruptions; Supply Chain Risks • semiconductor chip supply disruptions and price increases; • supply chain disruptions; • regional energy supply and pricing; • supply base condition; Manufacturing/Operational Risks • product launch; • operational underperformance; • restructuring costs; • impairments; • labour disruptions; • skilled labour attraction/retention; • leadership expertise and succession; Pricing Risks • quote/pricing assumptions; • customer pricing pressure/contractual arrangements; • commodity cost volatility; • scrap steel/aluminum price volatility; Warranty/Recall Risks • repair/replace costs; • warranty provisions; • product liability; Climate Change Risks • transition risks and physical risks; • strategic and other risks; IT Security/Cybersecurity Risks • IT/cybersecurity breach; • product cybersecurity; Acquisition Risks • acquisition of strategic targets; • inherent merger and acquisition risks; • acquisition integration and synergies; Other Business Risks • joint ventures; • intellectual property; • risks of doing business in foreign markets; • relative foreign exchange rates; • currency devaluation in Argentina; • pension risks; • tax risks; • returns on capital investments; • financial flexibility; • credit ratings changes; • stock price fluctuation; • dividends; Legal, Regulatory and Other Risks • antitrust proceedings; • legal and regulatory proceedings; • claims arising from Fisker bankruptcy; • changes in laws; • trade agreements; • trade disputes/tariffs; • increasing trade protectionism; and • environmental compliance. In evaluating forward-looking statements or forward-looking information, we caution readers not to place undue reliance on any forward-looking statement. Additionally, readers should specifically consider the various factors which could cause actual events or results to differ materially from those indicated by such forward-looking statements, including the risks, assumptions and uncertainties above which are: • discussed under the "Industry Trends and Risks" heading of our Management’s Discussion and Analysis; and • set out in our Annual Information Form filed with securities commissions in Canada, our annual report on Form 40-F with the United States Securities and Exchange commission, and subsequent filings. Readers should also consider discussion of our risk mitigation activities with respect to certain risk factors, which can be also found in our Annual Information Form. Additional information about Magna, including our Annual Information Form, is available through the System for Electronic Data Analysis and Retrieval + (SEDAR+) at www.sedarplus.ca, as well as on the United States Securities and Exchange Commission’s Electronic Data Gathering, Analysis and Retrieval System (EDGAR), which can be accessed at www.sec.gov. |
| Q3 2024 Results 5 Reminders All amounts are in U.S. Dollars. Today's discussion excludes the impact of other expense (income), net ("Unusual Items") and amortization of acquired intangible assets. Please refer to the reconciliation of Non-GAAP measures in our press release dated November 1, 2024 for further information. "Organic", in the context of sales movements, means "excluding the impact of foreign exchange, acquisitions and divestitures". Weighted Sales Growth over Market (GoM) compares organic sales growth (%) to vehicle production change (%) after applying Magna geographic sales weighting, excluding Complete Vehicles, to regional production. |
| Swamy Kotagiri Chief Executive Officer Q3 2024 Results 6 |
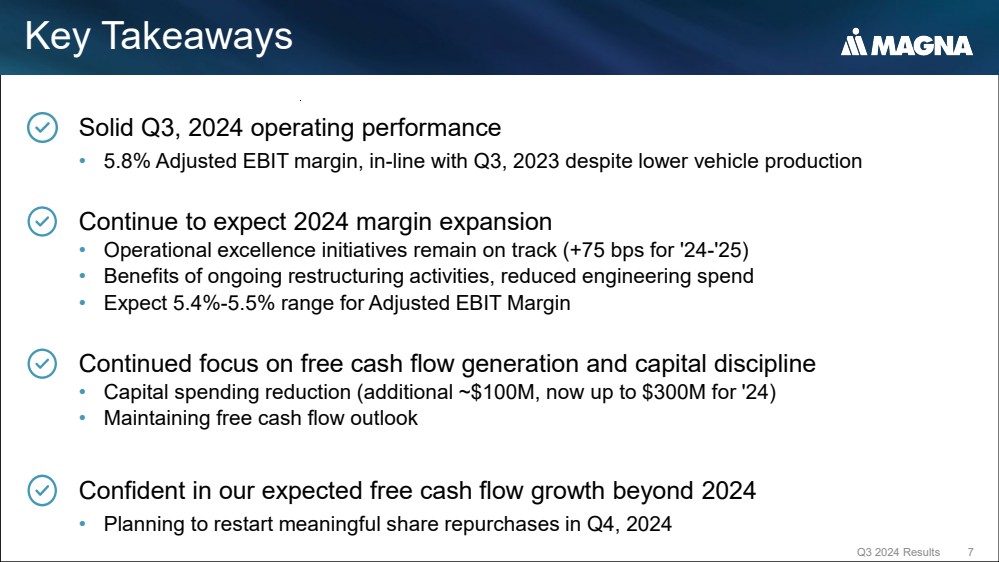
| Solid Q3, 2024 operating performance • 5.8% Adjusted EBIT margin, in-line with Q3, 2023 despite lower vehicle production Continue to expect 2024 margin expansion • Operational excellence initiatives remain on track (+75 bps for '24-'25) • Benefits of ongoing restructuring activities, reduced engineering spend • Expect 5.4%-5.5% range for Adjusted EBIT Margin Continued focus on free cash flow generation and capital discipline • Capital spending reduction (additional ~$100M, now up to $300M for '24) • Maintaining free cash flow outlook Confident in our expected free cash flow growth beyond 2024 • Planning to restart meaningful share repurchases in Q4, 2024 Q3 2024 Results 7 Key Takeaways |
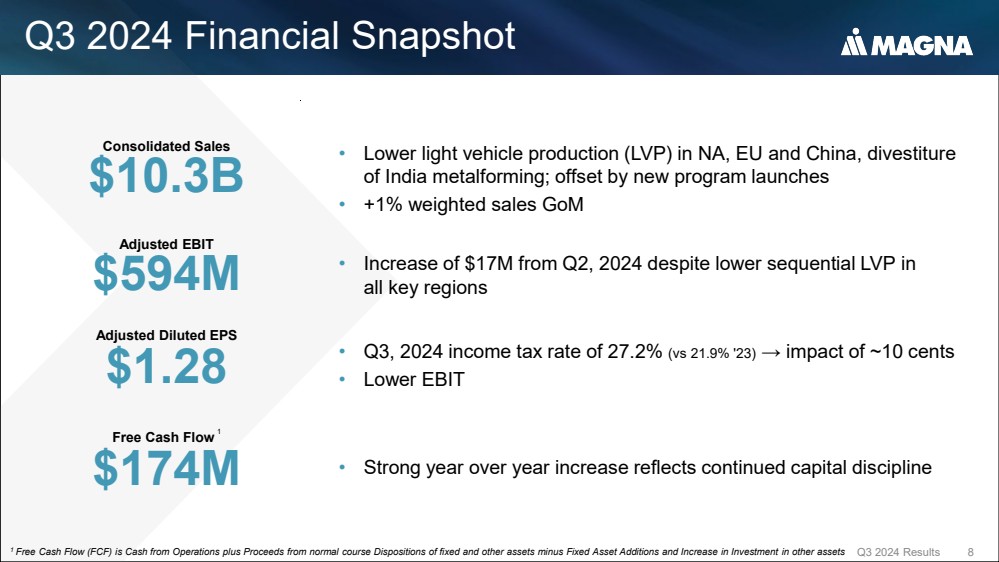
| Q3 2024 Results 8 Q3 2024 Financial Snapshot Consolidated Sales $10.3B • Lower light vehicle production (LVP) in NA, EU and China, divestiture of India metalforming; offset by new program launches • +1% weighted sales GoM Adjusted EBIT $594M • Increase of $17M from Q2, 2024 despite lower sequential LVP in all key regions Adjusted Diluted EPS $1.28 • Q3, 2024 income tax rate of 27.2% (vs 21.9% '23) → impact of ~10 cents • Lower EBIT Free Cash Flow 1 $174M • Strong year over year increase reflects continued capital discipline 1 Free Cash Flow (FCF) is Cash from Operations plus Proceeds from normal course Dispositions of fixed and other assets minus Fixed Asset Additions and Increase in Investment in other assets |
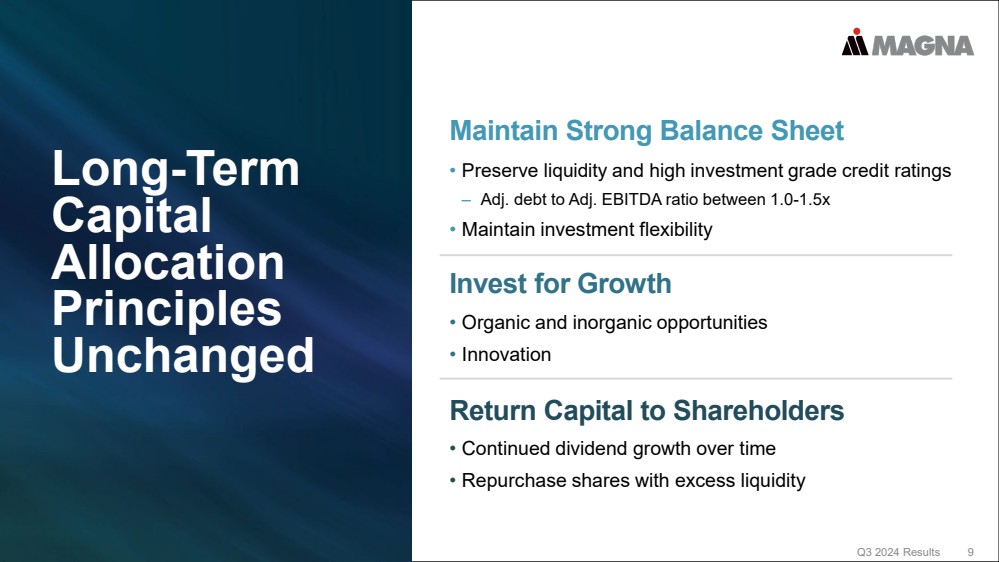
| Maintain Strong Balance Sheet • Preserve liquidity and high investment grade credit ratings ‒ Adj. debt to Adj. EBITDA ratio between 1.0-1.5x • Maintain investment flexibility Invest for Growth • Organic and inorganic opportunities • Innovation Return Capital to Shareholders • Continued dividend growth over time • Repurchase shares with excess liquidity Long-Term Capital Allocation Principles Unchanged Q3 2024 Results 9 |
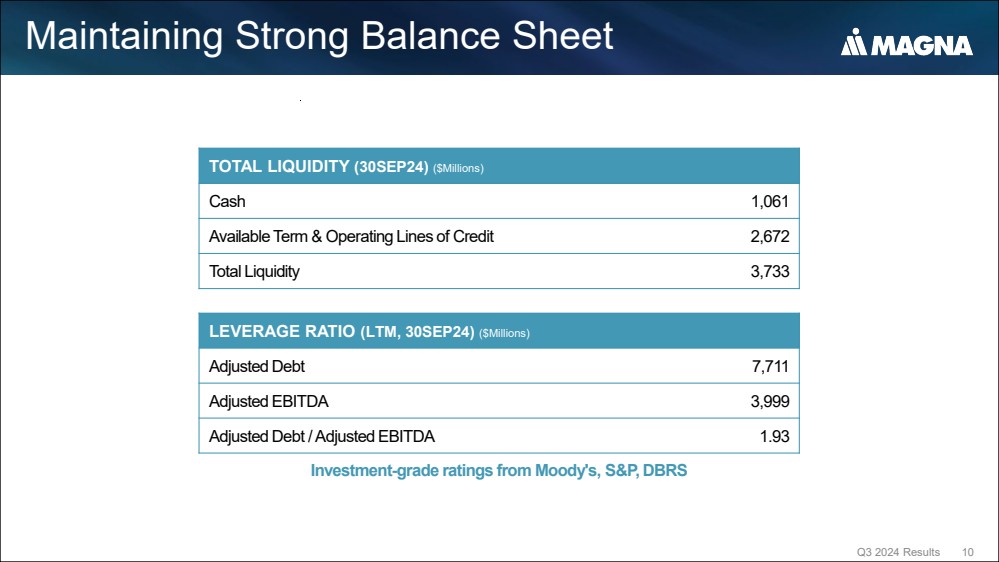
| Maintaining Strong Balance Sheet Q3 2024 Results 10 LEVERAGE RATIO (LTM, 30SEP24) ($Millions) Adjusted Debt 7,711 Adjusted EBITDA 3,999 Adjusted Debt / Adjusted EBITDA 1.93 TOTAL LIQUIDITY (30SEP24) ($Millions) Cash 1,061 Available Term & Operating Lines of Credit 2,672 Total Liquidity 3,733 Investment-grade ratings from Moody's, S&P, DBRS |
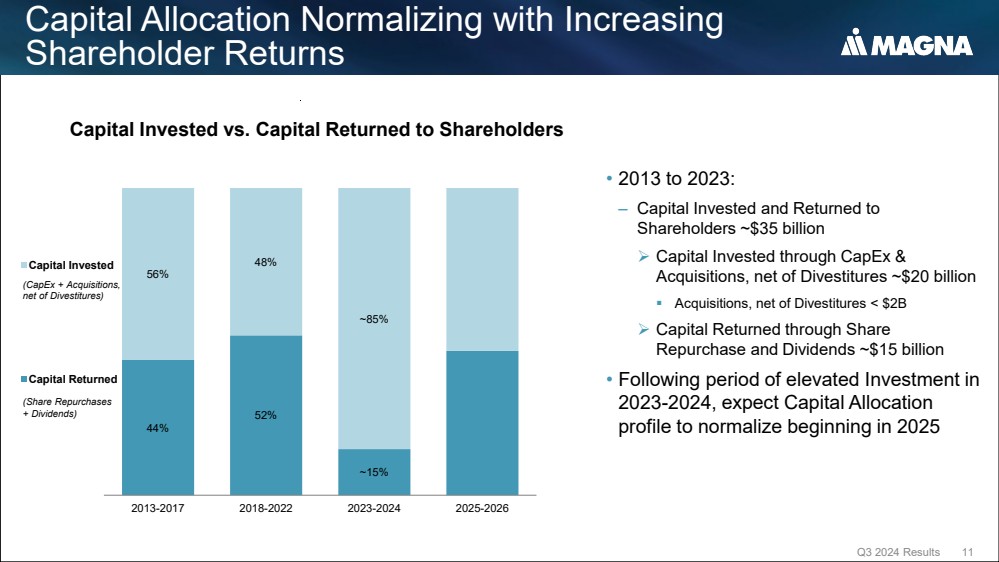
| Capital Allocation Normalizing with Increasing Shareholder Returns Q3 2024 Results 11 • 2013 to 2023: ‒ Capital Invested and Returned to Shareholders ~$35 billion Capital Invested through CapEx & Acquisitions, net of Divestitures ~$20 billion Acquisitions, net of Divestitures < $2B Capital Returned through Share Repurchase and Dividends ~$15 billion • Following period of elevated Investment in 2023-2024, expect Capital Allocation profile to normalize beginning in 2025 Capital Invested vs. Capital Returned to Shareholders 44% 52% ~15% 56% 48% ~85% 2013-2017 2018-2022 2023-2024 2025-2026 Capital Invested Capital Returned (CapEx + Acquisitions, net of Divestitures) (Share Repurchases + Dividends) |
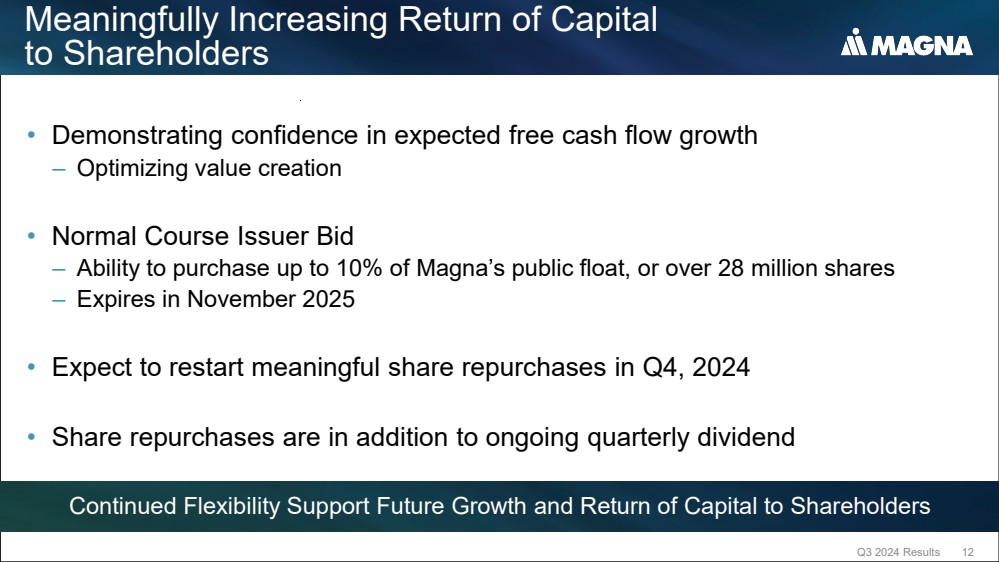
| Q3 2024 Results 12 Meaningfully Increasing Return of Capital to Shareholders • Demonstrating confidence in expected free cash flow growth – Optimizing value creation • Normal Course Issuer Bid – Ability to purchase up to 10% of Magna’s public float, or over 28 million shares – Expires in November 2025 • Expect to restart meaningful share repurchases in Q4, 2024 • Share repurchases are in addition to ongoing quarterly dividend Continued Flexibility Support Future Growth and Return of Capital to Shareholders |
| Pat McCann Executive Vice President & Chief Financial Officer Q3 2024 Results 13 |
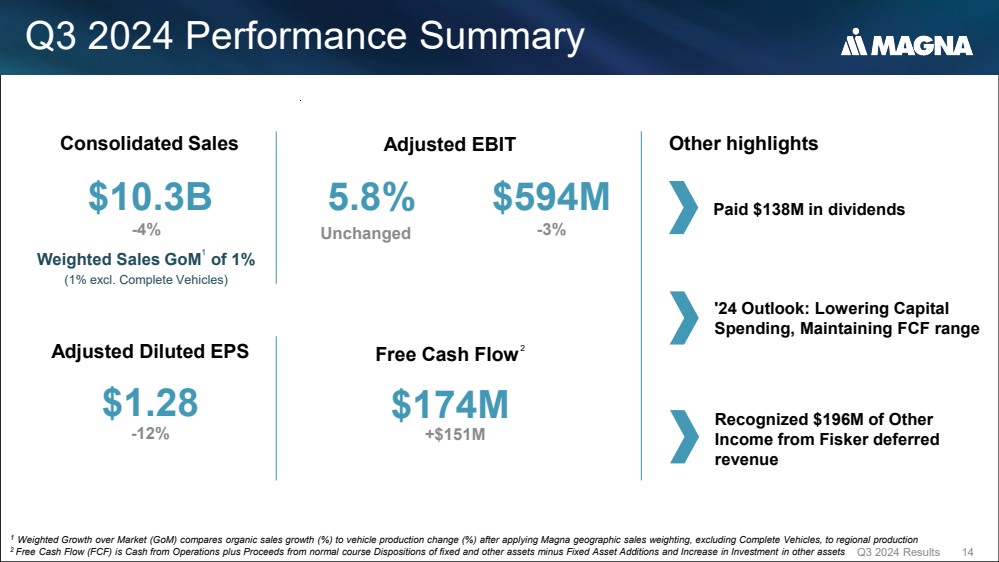
| Q3 2024 Performance Summary Q3 2024 Results 14 Consolidated Sales $10.3B Weighted Sales GoM1 of 1% (1% excl. Complete Vehicles) -4% Adjusted Diluted EPS $1.28 -12% Free Cash Flow2 $174M 1 Weighted Growth over Market (GoM) compares organic sales growth (%) to vehicle production change (%) after applying Magna geographic sales weighting, excluding Complete Vehicles, to regional production 2 Free Cash Flow (FCF) is Cash from Operations plus Proceeds from normal course Dispositions of fixed and other assets minus Fixed Asset Additions and Increase in Investment in other assets Adjusted EBIT 5.8% Unchanged $594M -3% Other highlights Paid $138M in dividends '24 Outlook: Lowering Capital Spending, Maintaining FCF range +$151M Recognized $196M of Other Income from Fisker deferred revenue |
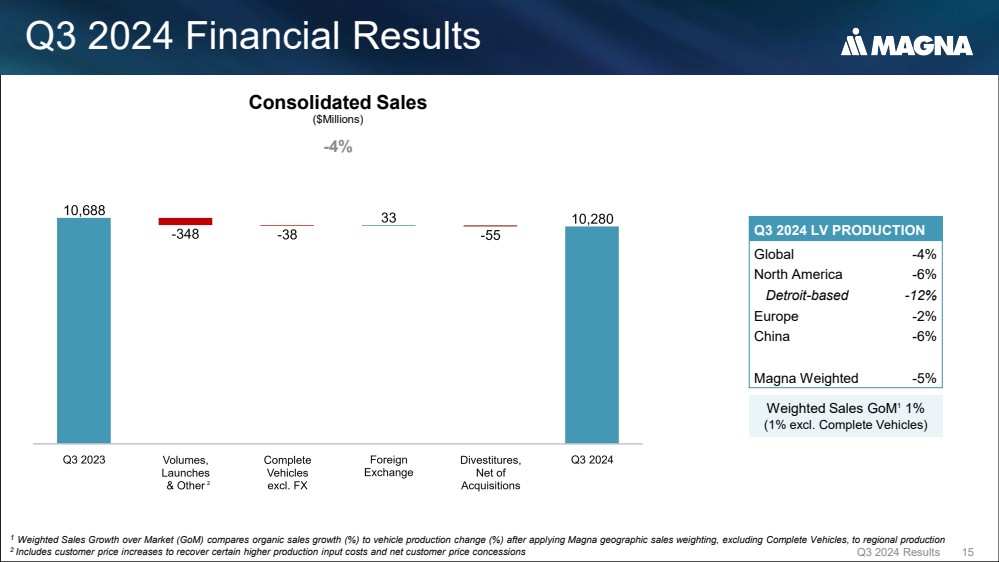
| Q3 2024 Financial Results Q3 2024 Results 15 Weighted Sales GoM1 1% (1% excl. Complete Vehicles) Consolidated Sales ($Millions) -4% 2 Q3 2024 LV PRODUCTION Global -4% North America -6% Detroit-based -12% Europe -2% China -6% Magna Weighted -5% 1 Weighted Sales Growth over Market (GoM) compares organic sales growth (%) to vehicle production change (%) after applying Magna geographic sales weighting, excluding Complete Vehicles, to regional production 2 Includes customer price increases to recover certain higher production input costs and net customer price concessions |
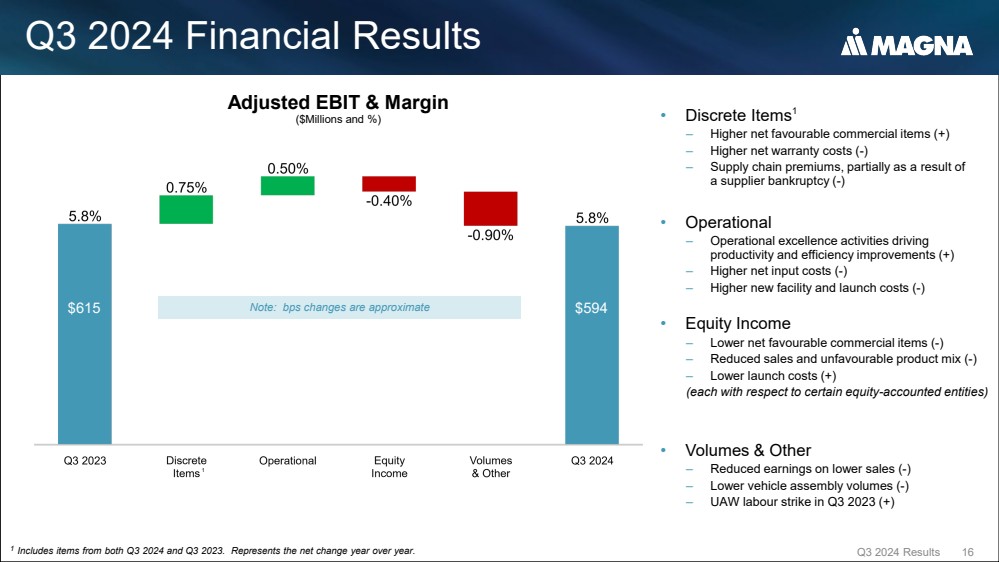
| Q3 2024 Financial Results Q3 2024 Results 16 • Discrete Items1 – Higher net favourable commercial items (+) – Higher net warranty costs (-) – Supply chain premiums, partially as a result of a supplier bankruptcy (-) • Operational – Operational excellence activities driving productivity and efficiency improvements (+) – Higher net input costs (-) – Higher new facility and launch costs (-) • Equity Income – Lower net favourable commercial items (-) – Reduced sales and unfavourable product mix (-) – Lower launch costs (+) (each with respect to certain equity-accounted entities) • Volumes & Other – Reduced earnings on lower sales (-) – Lower vehicle assembly volumes (-) – UAW labour strike in Q3 2023 (+) $615 $594 Adjusted EBIT & Margin ($Millions and %) Note: bps changes are approximate 1 Includes items from both Q3 2024 and Q3 2023. Represents the net change year over year. 1 |
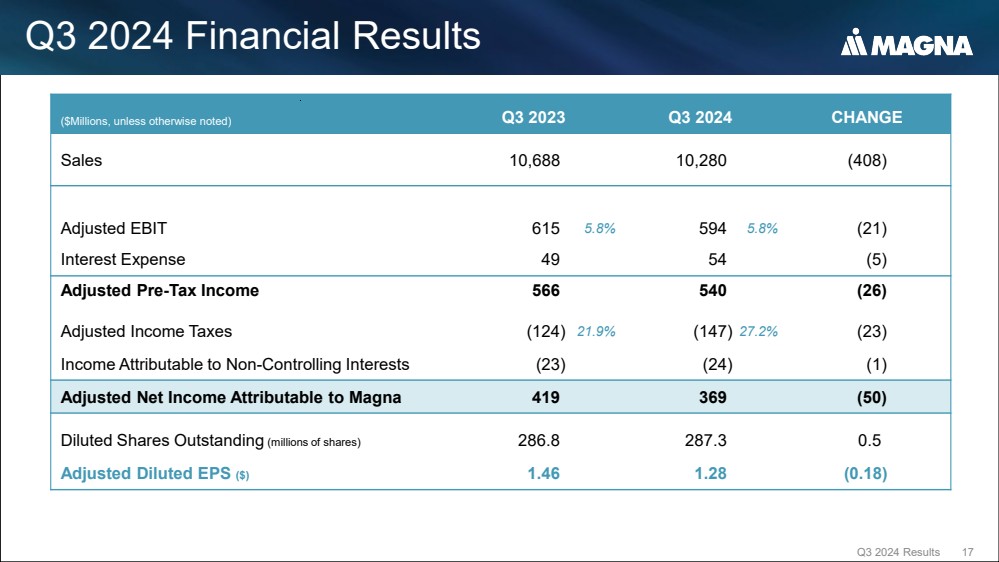
| Q3 2024 Financial Results Q3 2024 Results 17 ($Millions, unless otherwise noted) Q3 2023 Q3 2024 CHANGE Sales 10,688 10,280 (408) Adjusted EBIT 615 594 (21) Interest Expense 49 54 (5) Adjusted Pre-Tax Income 566 540 (26) Adjusted Income Taxes (124) (147) (23) Income Attributable to Non-Controlling Interests (23) (24) (1) Adjusted Net Income Attributable to Magna 419 369 (50) Diluted Shares Outstanding (millions of shares) 286.8 287.3 0.5 Adjusted Diluted EPS ($) 1.46 1.28 (0.18) 21.9% 27.2% 5.8% 5.8% |
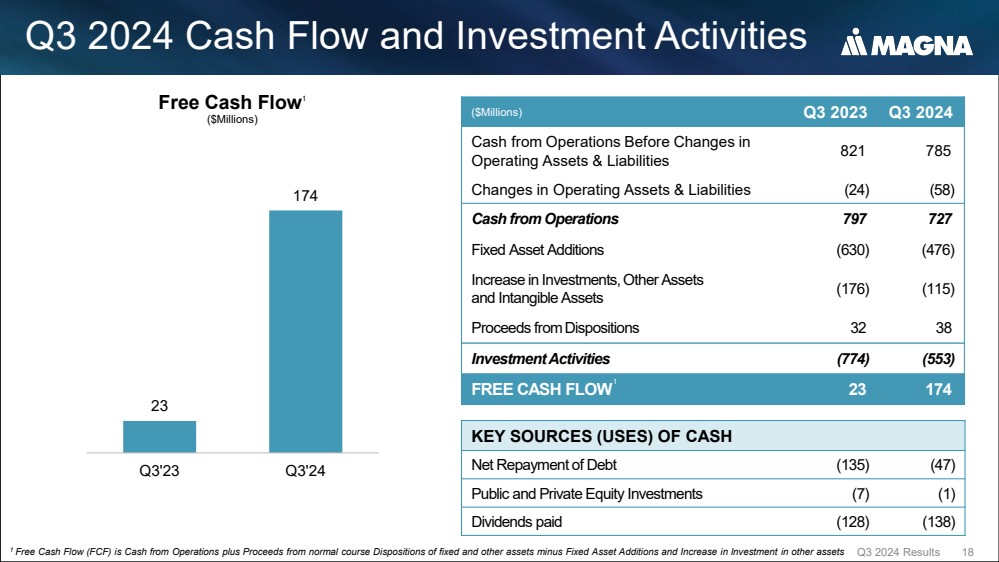
| Q3 2024 Cash Flow and Investment Activities Q3 2024 Results 18 Free Cash Flow1 ($Millions) KEY SOURCES (USES) OF CASH Net Repayment of Debt (135) (47) Public and Private Equity Investments (7) (1) Dividends paid (128) (138) ($Millions) Q3 2023 Q3 2024 Cash from Operations Before Changes in Operating Assets & Liabilities 821 785 Changes in Operating Assets & Liabilities (24) (58) Cash from Operations 797 727 Fixed Asset Additions (630) (476) Increase in Investments, Other Assets and Intangible Assets (176) (115) Proceeds from Dispositions 32 38 Investment Activities (774) (553) FREE CASH FLOW1 23 174 23 174 0 20 40 60 80 100 120 140 160 180 200 Q3'23 Q3'24 1 Free Cash Flow (FCF) is Cash from Operations plus Proceeds from normal course Dispositions of fixed and other assets minus Fixed Asset Additions and Increase in Investment in other assets |
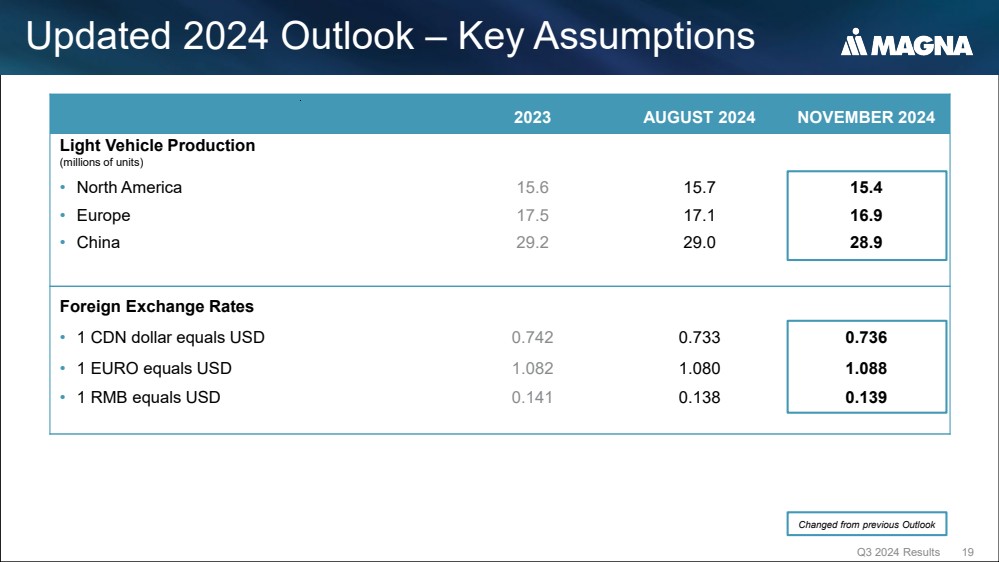
| Updated 2024 Outlook – Key Assumptions Q3 2024 Results 19 2023 AUGUST 2024 NOVEMBER 2024 Light Vehicle Production (millions of units) • North America 15.6 15.7 15.4 • Europe 17.5 17.1 16.9 • China 29.2 29.0 28.9 Foreign Exchange Rates • 1 CDN dollar equals USD 0.742 0.733 0.736 • 1 EURO equals USD 1.082 1.080 1.088 • 1 RMB equals USD 0.141 0.138 0.139 Changed from previous Outlook |
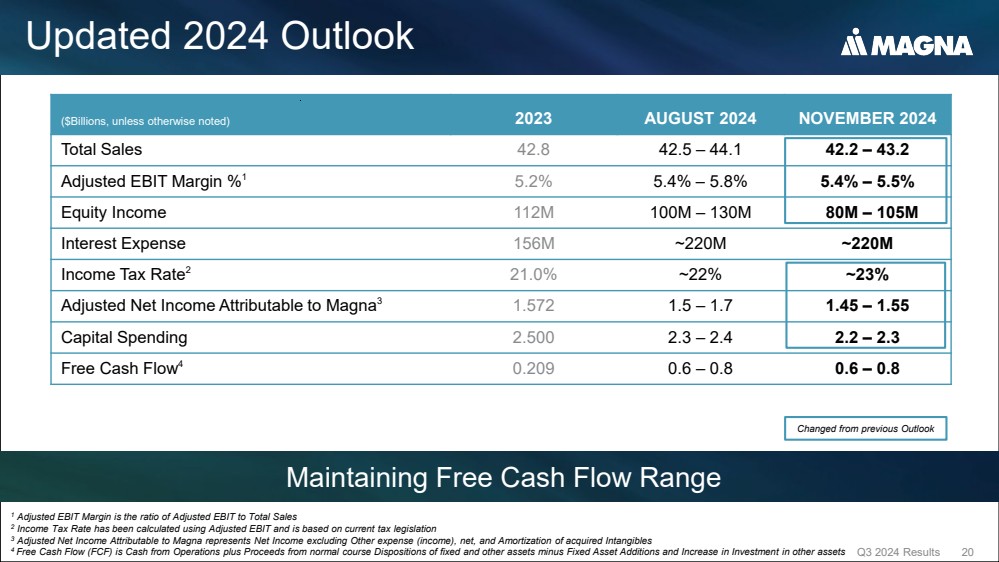
| Updated 2024 Outlook Q3 2024 Results 20 Maintaining Free Cash Flow Range ($Billions, unless otherwise noted) 2023 AUGUST 2024 NOVEMBER 2024 Total Sales 42.8 42.5 – 44.1 42.2 – 43.2 Adjusted EBIT Margin %1 5.2% 5.4% – 5.8% 5.4% – 5.5% Equity Income 112M 100M – 130M 80M – 105M Interest Expense 156M ~220M ~220M Income Tax Rate2 21.0% ~22% ~23% Adjusted Net Income Attributable to Magna3 1.572 1.5 – 1.7 1.45 – 1.55 Capital Spending 2.500 2.3 – 2.4 2.2 – 2.3 Free Cash Flow4 0.209 0.6 – 0.8 0.6 – 0.8 1 Adjusted EBIT Margin is the ratio of Adjusted EBIT to Total Sales 2 Income Tax Rate has been calculated using Adjusted EBIT and is based on current tax legislation 3 Adjusted Net Income Attributable to Magna represents Net Income excluding Other expense (income), net, and Amortization of acquired Intangibles 4 Free Cash Flow (FCF) is Cash from Operations plus Proceeds from normal course Dispositions of fixed and other assets minus Fixed Asset Additions and Increase in Investment in other assets Changed from previous Outlook |
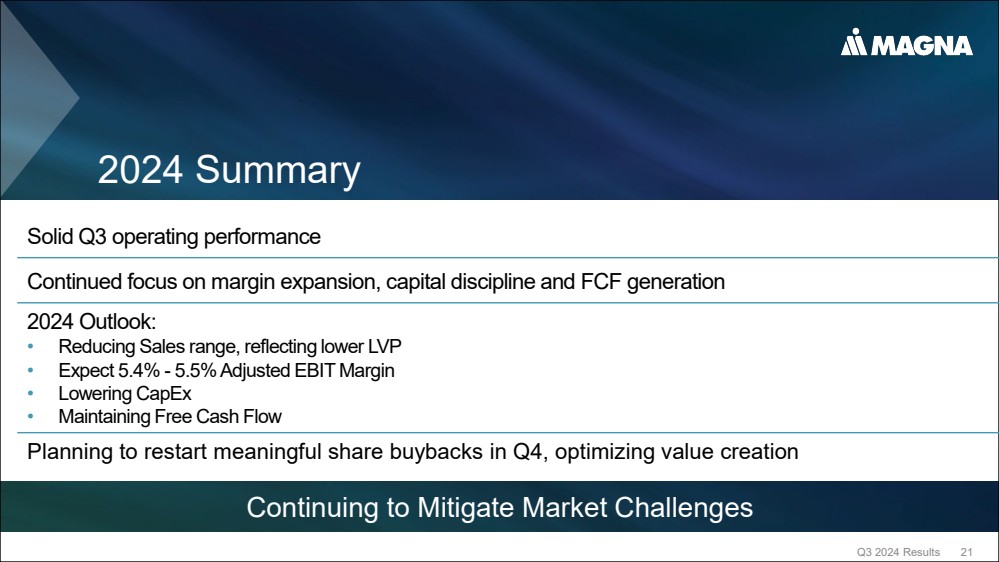
| 2024 Summary Solid Q3 operating performance Continued focus on margin expansion, capital discipline and FCF generation 2024 Outlook: • Reducing Sales range, reflecting lower LVP • Expect 5.4% - 5.5% Adjusted EBIT Margin • Lowering CapEx • Maintaining Free Cash Flow Planning to restart meaningful share buybacks in Q4, optimizing value creation 21 Continuing to Mitigate Market Challenges Q3 2024 Results |
| Appendix Q3 2024 Results 24 |

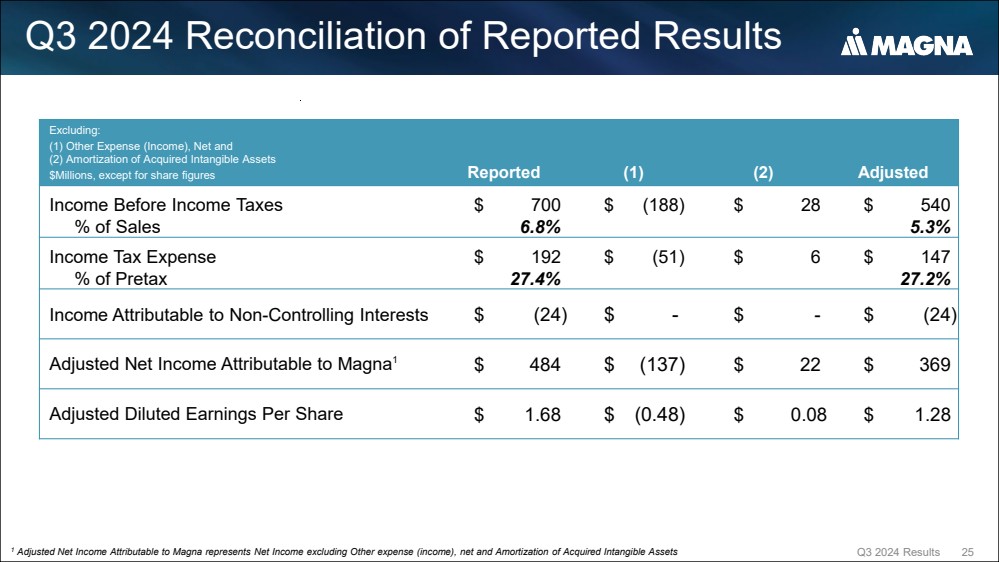
| Q3 2024 Reconciliation of Reported Results Q3 2024 Results 25 Excluding: (1) Other Expense (Income), Net and (2) Amortization of Acquired Intangible Assets $Millions, except for share figures Reported (1) (2) Adjusted Income Before Income Taxes $ 700 $ (188) $ 28 $ 540 % of Sales 6.8% 5.3% Income Tax Expense $ 192 $ (51) $ 6 $ 147 % of Pretax 27.4% 27.2% Income Attributable to Non-Controlling Interests $ (24) $ - $ - $ (24) Adjusted Net Income Attributable to Magna1 $ 484 $ (137) $ 22 $ 369 Adjusted Diluted Earnings Per Share $ 1.68 $ (0.48) $ 0.08 $ 1.28 1 Adjusted Net Income Attributable to Magna represents Net Income excluding Other expense (income), net and Amortization of Acquired Intangible Assets |
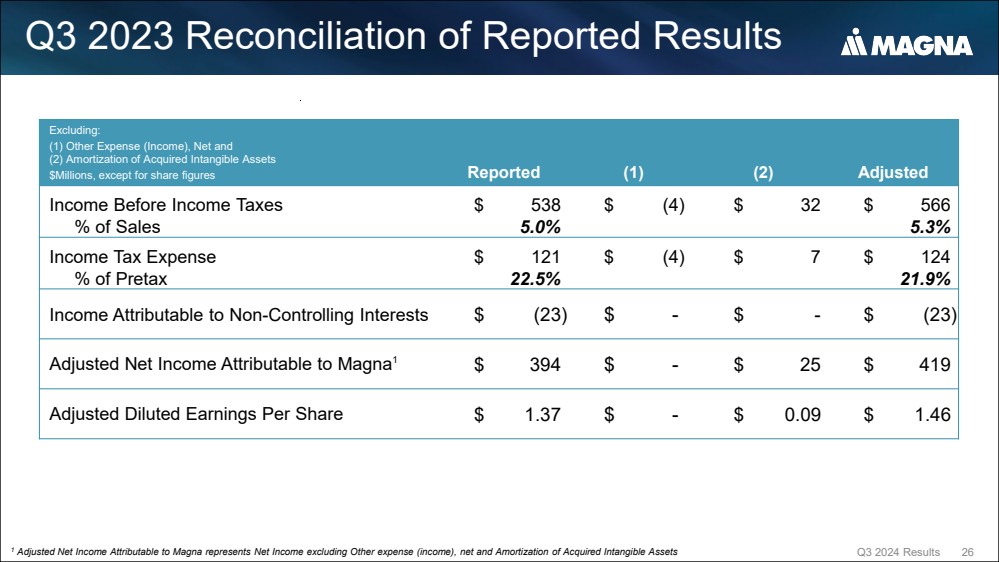
| Q3 2023 Reconciliation of Reported Results Q3 2024 Results 26 Excluding: (1) Other Expense (Income), Net and (2) Amortization of Acquired Intangible Assets $Millions, except for share figures Reported (1) (2) Adjusted Income Before Income Taxes $ 538 $ (4) $ 32 $ 566 % of Sales 5.0% 5.3% Income Tax Expense $ 121 $ (4) $ 7 $ 124 % of Pretax 22.5% 21.9% Income Attributable to Non-Controlling Interests $ (23) $ - $ - $ (23) Adjusted Net Income Attributable to Magna1 $ 394 $ - $ 25 $ 419 Adjusted Diluted Earnings Per Share $ 1.37 $ - $ 0.09 $ 1.46 1 Adjusted Net Income Attributable to Magna represents Net Income excluding Other expense (income), net and Amortization of Acquired Intangible Assets |
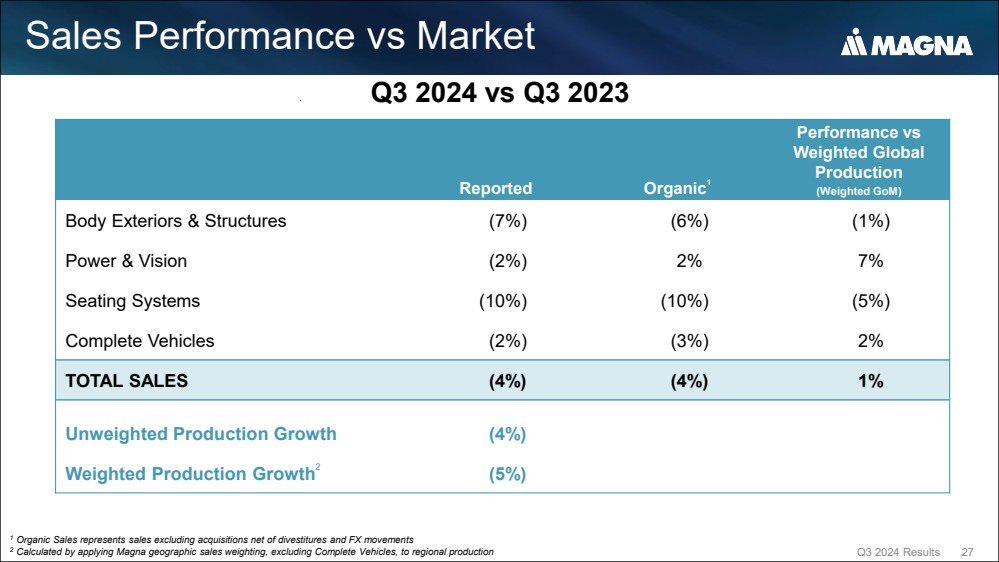
| Sales Performance vs Market Q3 2024 Results 27 Reported Organic1 Performance vs Weighted Global Production (Weighted GoM) Body Exteriors & Structures (7%) (6%) (1%) Power & Vision (2%) 2% 7% Seating Systems (10%) (10%) (5%) Complete Vehicles (2%) (3%) 2% TOTAL SALES (4%) (4%) 1% Unweighted Production Growth (4%) Weighted Production Growth2 (5%) 1 Organic Sales represents sales excluding acquisitions net of divestitures and FX movements 2 Calculated by applying Magna geographic sales weighting, excluding Complete Vehicles, to regional production Q3 2024 vs Q3 2023 |
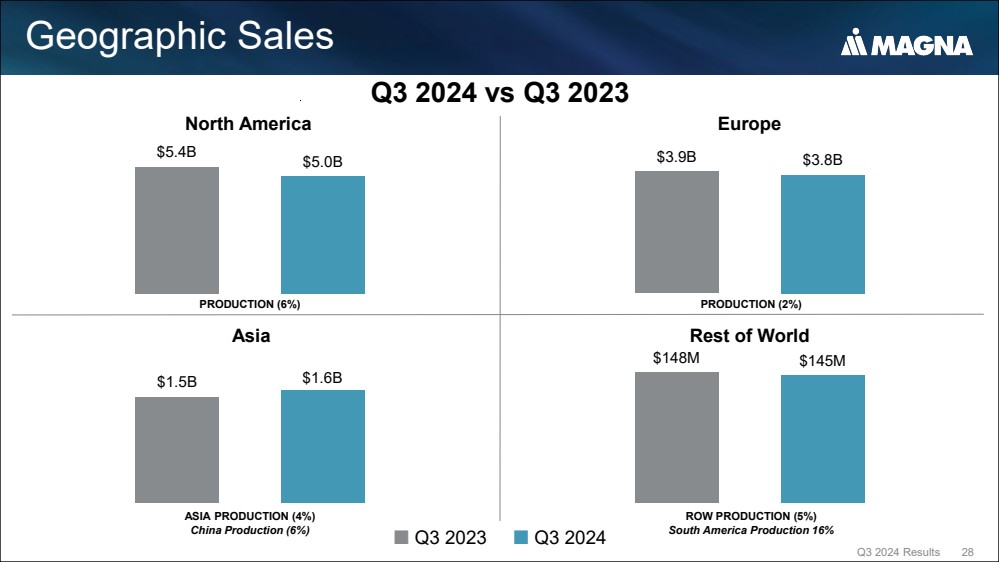
| Geographic Sales Q3 2024 Results 28 Q3 2023 Q3 2024 Asia ASIA PRODUCTION (4%) China Production (6%) $1.5B $1.6B $0.00B $0.20B $0.40B $0.60B $0.80B $1.00B $1.20B $1.40B $1.60B $1.80B $2.00B $5.4B $5.0B $0.0B $1.0B $2.0B $3.0B $4.0B $5.0B $6.0B North America PRODUCTION (6%) $3.9B $3.8B $0.0B $0.5B $1.0B $1.5B $2.0B $2.5B $3.0B $3.5B $4.0B $4.5B Europe PRODUCTION (2%) $148M $145M $0M $20M $40M $60M $80M $100M $120M $140M $160M ROW PRODUCTION (5%) South America Production 16% Rest of World Q3 2024 vs Q3 2023 |
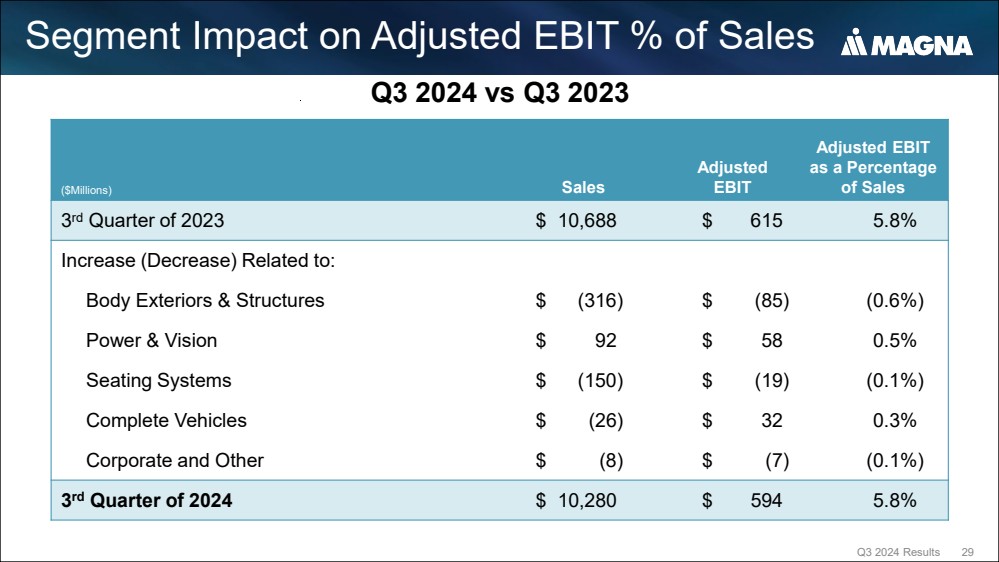
| Segment Impact on Adjusted EBIT % of Sales Q3 2024 Results 29 ($Millions) Sales Adjusted EBIT Adjusted EBIT as a Percentage of Sales 3rd Quarter of 2023 $ 10,688 $ 615 5.8% Increase (Decrease) Related to: Body Exteriors & Structures $ (316) $ (85) (0.6%) Power & Vision $ 92 $ 58 0.5% Seating Systems $ (150) $ (19) (0.1%) Complete Vehicles $ (26) $ 32 0.3% Corporate and Other $ (8) $ (7) (0.1%) 3rd Quarter of 2024 $ 10,280 $ 594 5.8% Q3 2024 vs Q3 2023 |
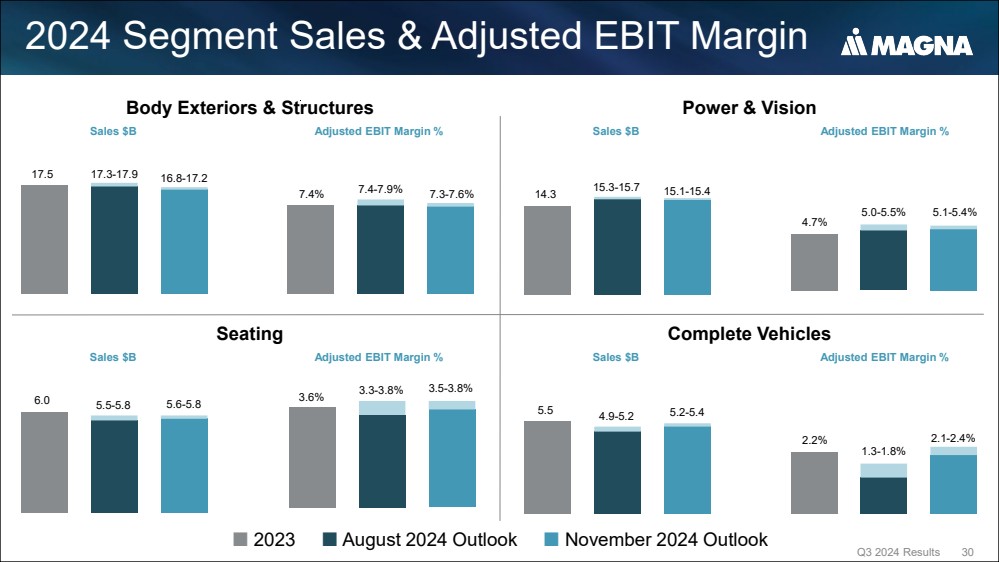
| 2024 Segment Sales & Adjusted EBIT Margin Q3 2024 Results 30 2023 August 2024 Outlook November 2024 Outlook Body Exteriors & Structures Sales $B 17.5 17.3-17.9 16.8-17.2 Adjusted EBIT Margin % 7.4% 7.4-7.9% 7.3-7.6% Power & Vision Sales $B 14.3 15.3-15.7 15.1-15.4 Adjusted EBIT Margin % 4.7% 5.0-5.5% 5.1-5.4% Seating 6.0 5.5-5.8 5.6-5.8 Sales $B 3.6% 3.3-3.8% 3.5-3.8% Adjusted EBIT Margin % Complete Vehicles 5.5 4.9-5.2 5.2-5.4 Sales $B 2.2% 1.3-1.8% 2.1-2.4% Adjusted EBIT Margin % |
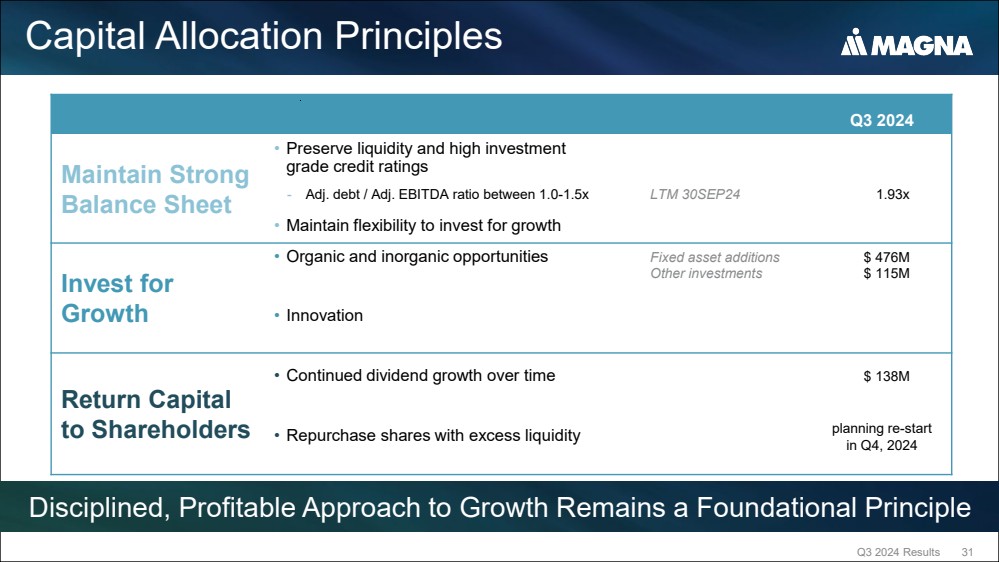
| Capital Allocation Principles Q3 2024 Results 31 Disciplined, Profitable Approach to Growth Remains a Foundational Principle Q3 2024 Maintain Strong Balance Sheet • Preserve liquidity and high investment grade credit ratings - Adj. debt / Adj. EBITDA ratio between 1.0-1.5x LTM 30SEP24 1.93x • Maintain flexibility to invest for growth Invest for Growth • Organic and inorganic opportunities Fixed asset additions Other investments $ 476M $ 115M • Innovation Return Capital to Shareholders • Continued dividend growth over time $ 138M • Repurchase shares with excess liquidity planning re-start in Q4, 2024 |
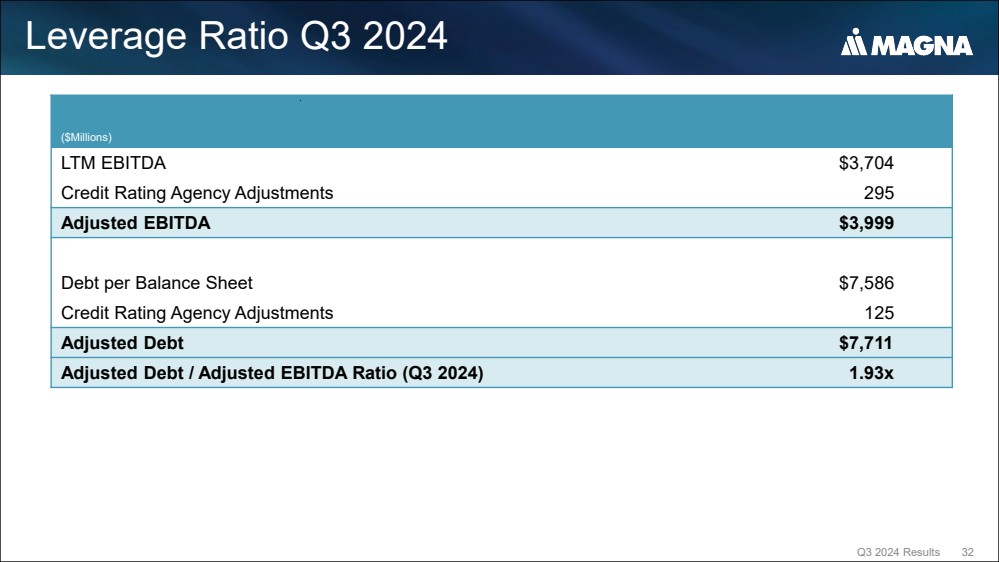
| Leverage Ratio Q3 2024 Q3 2024 Results 32 ($Millions) LTM EBITDA $3,704 Credit Rating Agency Adjustments 295 Adjusted EBITDA $3,999 Debt per Balance Sheet $7,586 Credit Rating Agency Adjustments 125 Adjusted Debt $7,711 Adjusted Debt / Adjusted EBITDA Ratio (Q3 2024) 1.93x |