Exhibit 99

Q1 2019 RESULTS CONFERENCE CALL 1 May 9, 2019

Forward Looking Statements 2 Certain statements in this presentation constitute "forward - looking information" or "forward - looking statements" (collectively, "forward - looking statements") and are intended to provide information about management's current expectations and plans . Such forward - looking statements may not be appropriate for other purposes . Forward - looking statements may include financial and other projections, as well as statements regarding our future plans, strategic objectives or economic performance, or the assumptions underlying any of the foregoing, and other statements that are not recitations of historical fact . We use words such as "may", "would", "could", "should", "will", "likely", "expect", "anticipate", "believe", "intend", "plan", "aim", "forecast", "outlook", "project", "estimate", "target" and similar expressions suggesting future outcomes or events to identify forward - looking statements . Forward - looking statements in this press release include, but are not limited to, statements relating to: • Our expectations for development, validation, testing and other costs related to our advanced driver assistance systems; • Vehicle production trends in our key markets; • Factors impacting the performance of our equity - accounted joint ventures in China; • Cash flow expectations; • Magna’s forecast of light vehicle production in North America and Europe; • Expected consolidated sales, based on such light vehicle production, including expected split by segment in our Body Exteriors & Structures; Power & Vision; Seating Systems; and Complete Vehicles segments; • Consolidated Adjusted EBIT margin; • Consolidated equity income; • Net interest expense; • Effective income tax rate; • Adjusted net income; • Fixed asset expenditures; and • Future returns of capital to our shareholders, including through dividends and share repurchases. Our forward - looking statements are based on information currently available to us, and are based on assumptions and analyses mad e by us in light of our experience and our perception of historical trends, current conditions and expected future developments, as well as other factors we believe are appropriate in the circumstances. While we believe we have a reasonable ba sis for making such forward - looking statements, they are not a guarantee of future performance or outcomes. Whether actual results and developments conform to our expectations and predictions is subject to a number of risks, assumptions and unc ertainties, many of which are beyond our control, and the effects of which can be difficult to predict, including, without limitation: Risks Related to the Automotive Industry • economic cyclicality; • regional production volume declines; • intense competition; • potential restrictions on free trade; • trade disputes/tariffs; Customer and Supplier Related Risks • concentration of sales with six customers; • shifts in market shares among vehicles or vehicle segments; • shifts in consumer "take rates" for products we sell; • quarterly sales fluctuations; • potential loss of any material purchase orders; • a deterioration in the financial condition of our supply base; Manufacturing Operational Risks • product and new facility launch risks; • operational underperformance; • restructuring costs; • impairment charges; • labour disruptions; • supply disruptions; • climate change risks; • attraction/retention of skilled labour ; IT Security Risk • IT/Cybersecurity breach; Pricing Risks • pricing risks between time of quote and start of production; • price concessions; • commodity costs; • declines in scrap steel prices; Warranty / Recall Risks • costs to repair or replace defective products; • warranty costs that exceed warranty provision; • costs related to a significant recall; Acquisition Risks • inherent merger and acquisition risks; • acquisition integration risk; Other Business Risks • risks related to conducting business through joint ventures; • our ability to consistently develop and commercialize innovative products or processes; • our changing business risk profile as a result of increased investment in electrification and autonomous driving, including: higher R&D and engineering costs , and challenges in quoting for profitable returns on products for which we may not have significant quoting experience; • risks of conducting business in foreign markets; • fluctuations in relative currency values; • tax risks; • reduced financial flexibility as a result of an economic shock; • changes in credit ratings assigned to us; Legal, Regulatory and Other Risks • antitrust risk; • legal claims and/or regulatory actions against us; and • changes in laws and regulations, including those related to vehicle emissions. In evaluating forward - looking statements or forward - looking information, we caution readers not to place undue reliance on any forward - looking statement, and readers should specifically consider the various factors which could cause actual events or results to differ materially from those indicated by such forward - looking statements, including the risks, assumptions and uncertainties above which are discussed in greater detail in this document under the section titled "Industry Trends and Risks" and set out in our Annual Information Form filed with securities commissions in Canada and our annual report on Form 40 - F filed with the United States Securities and Exchange Commission, and subsequent filings .
Reminders • All amounts are in U.S. Dollars (unless otherwise noted) • Today’s discussion excludes the impact of other expense, net • Prior period comparatives have been restated to reflect the transfer of certain assets out of Corporate & Other to the Company’s operating segments to better reflect the utilization of these assets 3
Q1 2019 Financial Highlights • Solid first quarter sales and Adjusted Diluted EPS despite: – Challenging global production environment – FX headwinds – Unanticipated costs in Electronics • Generated $347M in free cash flow • Returned $403M to shareholders 4
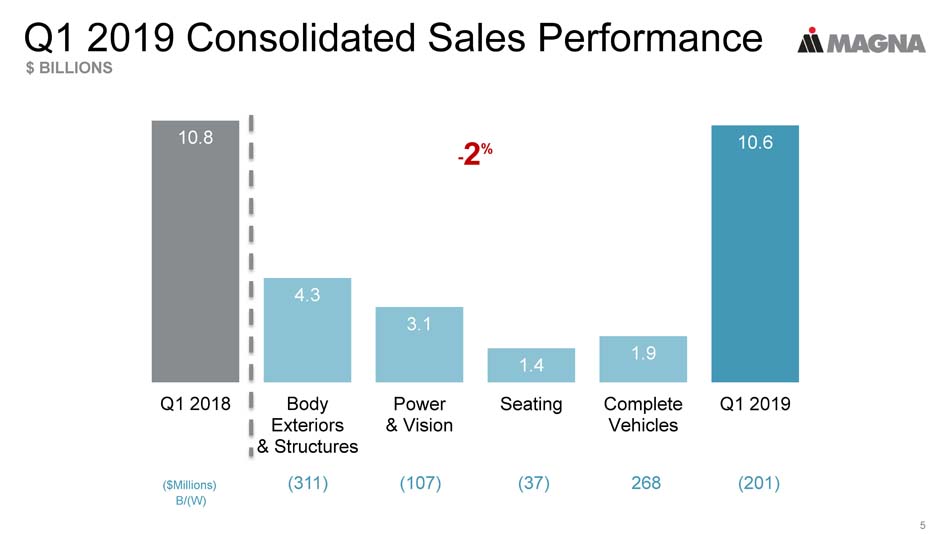
Q1 2019 Consolidated Sales Performance $ BILLIONS 5 ($Millions) (311) (107) (37) 268 (201) B/(W) 10.8 4.3 3.1 1.4 1.9 10.6 Q1 2018 Body Exteriors & Structures Power & Vision Seating Complete Vehicles Q1 2019 - 2 %
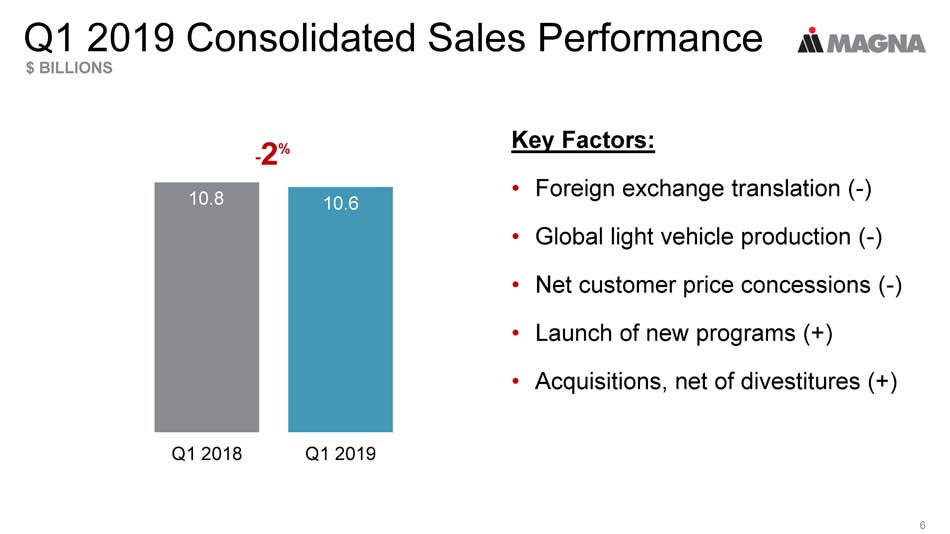
Q1 2019 Consolidated Sales Performance $ BILLIONS 6 Key Factors: • Foreign exchange translation ( - ) • Global light vehicle production ( - ) • Net customer price concessions ( - ) • Launch of new programs (+) • Acquisitions, net of divestitures (+) Q1 2018 Q1 2019 - 2 % 10.8 10.6
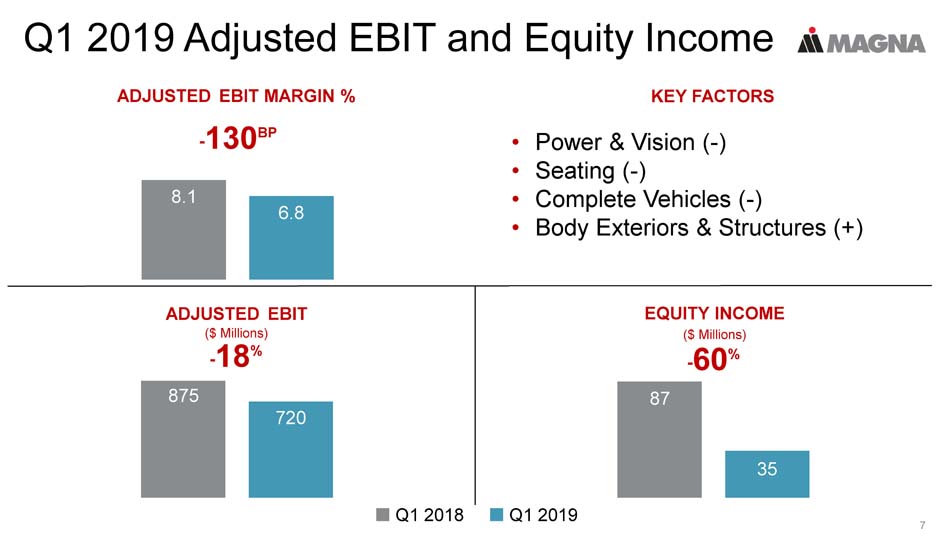
Q1 2019 Adjusted EBIT and Equity Income 7 - 130 BP ADJUSTED EBIT MARGIN % 8.1 6.8 KEY FACTORS - 60 % EQUITY INCOME ($ Millions) 87 35 Q1 2018 Q1 2019 - 18 % ADJUSTED EBIT ($ Millions) 875 720 • Power & Vision ( - ) • Seating ( - ) • Complete Vehicles ( - ) • Body Exteriors & Structures (+)
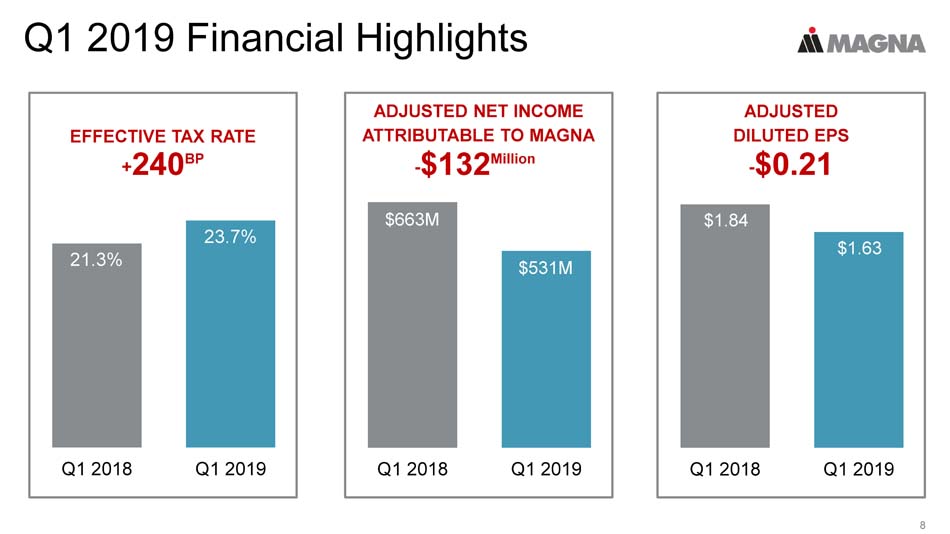
Q1 2019 Financial Highlights 8 Q1 2018 Q1 2019 ADJUSTED DILUTED EPS - $0.21 $1.84 $1.63 Q1 2018 Q1 2019 EFFECTIVE TAX RATE + 240 BP 21.3% 23.7% Q1 2018 Q1 2019 ADJUSTED NET INCOME ATTRIBUTABLE TO MAGNA - $132 Million $663M $531M

Q1 2019 Segment Sales BODY EXTERIORS & STRUCTURES $ BILLIONS 9 • Global light vehicle production ( - ) • Foreign currency translation ( - ) • Net customer price concessions ( - ) • New program launches (+) Significant New Launches: • GMC Sierra and Chevrolet Silverado • BMW X3 • Mercedes - Benz G - Class • Ford Ranger Q1 2018 Q1 2019 - 7 % 4.6 4.3

Q1 2019 Segment Adjusted EBIT Margin % BODY EXTERIORS & STRUCTURES 10 • Lower launch costs (+) • Productivity and efficiency improvements (+) • Customer pricing resolutions and commercial settlements (+) • Foreign exchange gains (+) • Higher depreciation and amortization ( - ) • Inefficiencies at plants we are closing ( - ) Q1 2018 Q1 2019 + 100 BP 7.4% 8.4%
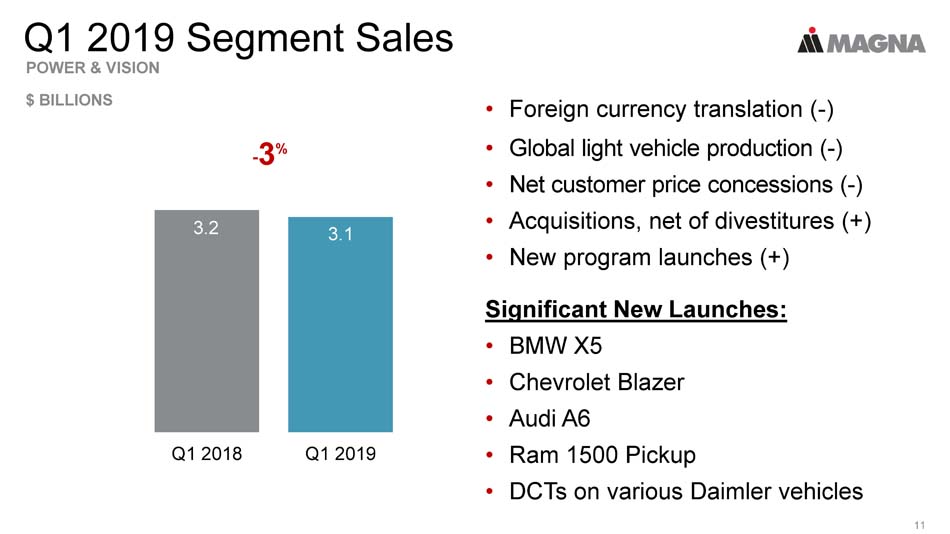
Q1 2019 Segment Sales POWER & VISION $ BILLIONS 11 • Foreign currency translation ( - ) • Global light vehicle production ( - ) • Net customer price concessions ( - ) • Acquisitions, net of divestitures (+) • New program launches (+) Significant New Launches: • BMW X5 • Chevrolet Blazer • Audi A6 • Ram 1500 Pickup • DCTs on various Daimler vehicles Q1 2018 Q1 2019 - 3 % 3.2 3.1
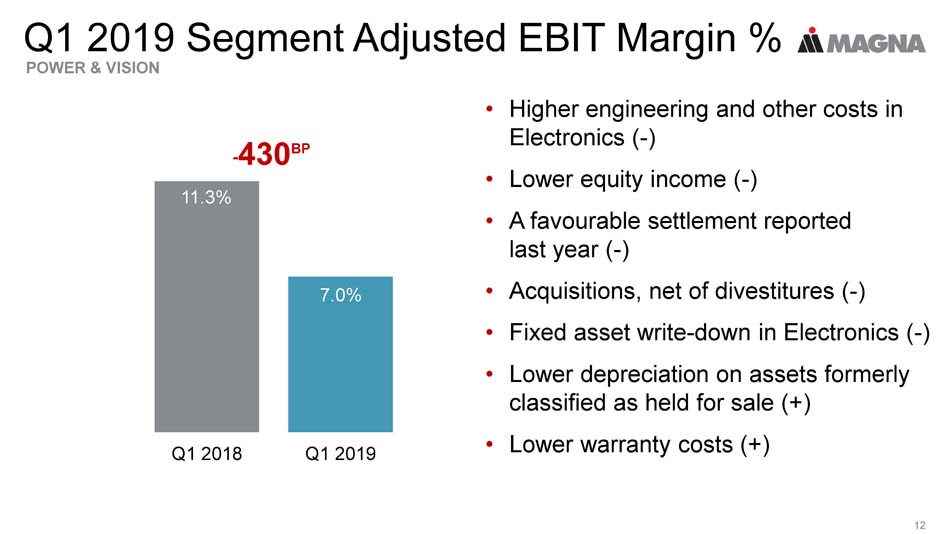
Q1 2019 Segment Adjusted EBIT Margin % POWER & VISION 12 • Higher engineering and other costs in Electronics ( - ) • Lower equity income ( - ) • A favourable settlement reported last year ( - ) • Acquisitions, net of divestitures ( - ) • Fixed asset write - down in Electronics ( - ) • Lower depreciation on assets formerly classified as held for sale (+) • Lower warranty costs (+) Q1 2018 Q1 2019 - 430 BP 11.3% 7.0%
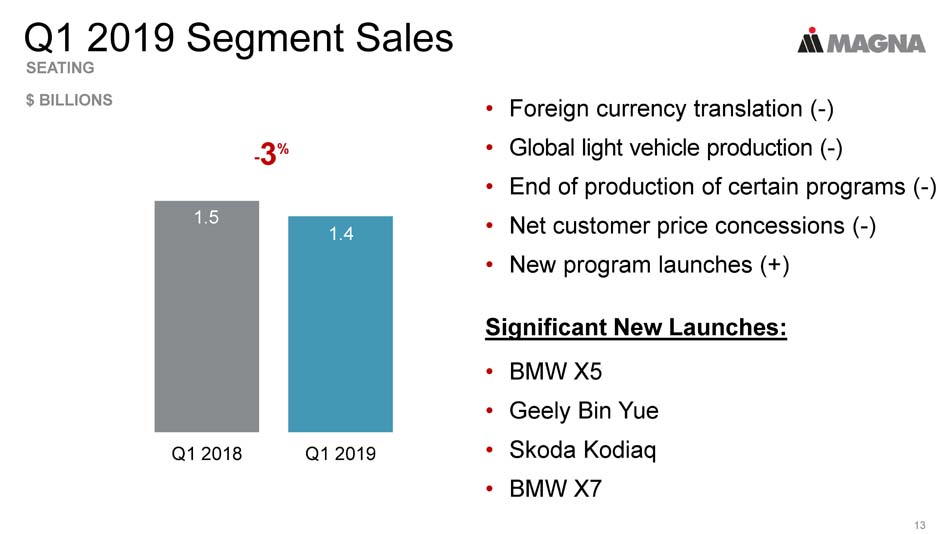
Q1 2019 Segment Sales SEATING $ BILLIONS 13 • Foreign currency translation ( - ) • Global light vehicle production ( - ) • End of production of certain programs ( - ) • Net customer price concessions ( - ) • New program launches (+) Significant New Launches: • BMW X5 • Geely Bin Yue • Skoda Kodiaq • BMW X7 Q1 2018 Q1 2019 1.5 1.4 - 3 %
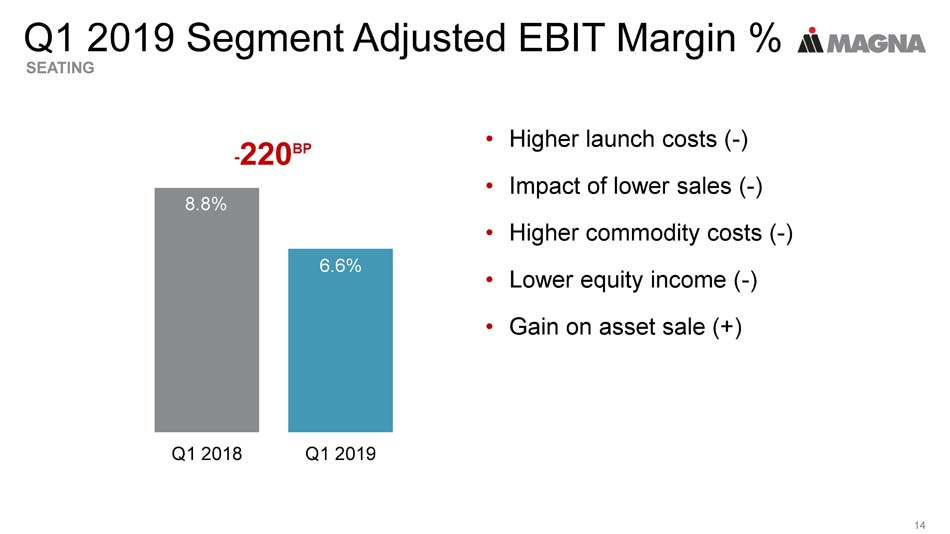
Q1 2019 Segment Adjusted EBIT Margin % SEATING 14 Q1 2018 Q1 2019 - 220 BP 8.8% 6.6% • Higher launch costs ( - ) • Impact of lower sales ( - ) • Higher commodity costs ( - ) • Lower equity income ( - ) • Gain on asset sale (+)
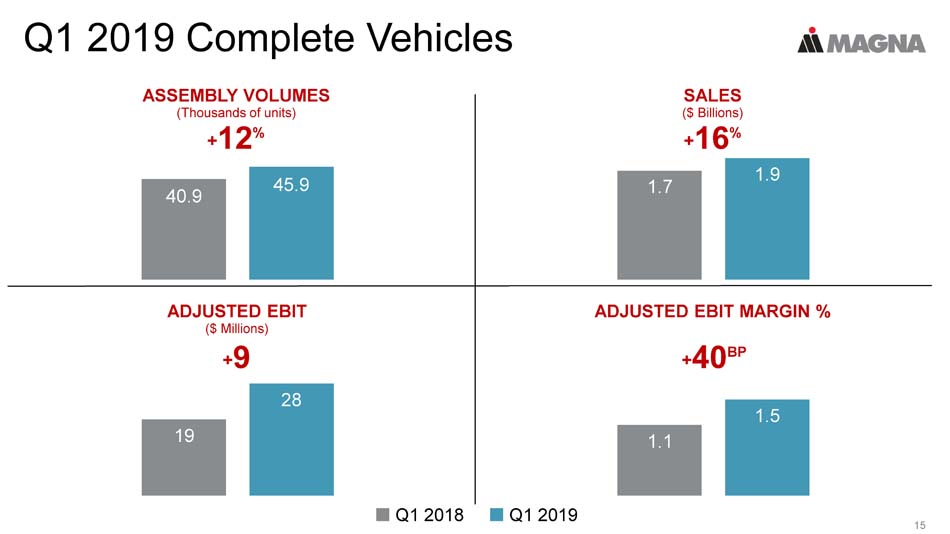
Q1 2019 Complete Vehicles 15 + 12 % ASSEMBLY VOLUMES (Thousands of units) 40.9 45.9 + 16 % SALES ($ Billions) 1.7 1.9 + 9 ADJUSTED EBIT ($ Millions) 19 28 ADJUSTED EBIT MARGIN % 1.1 1.5 Q1 2018 Q1 2019 + 40 BP
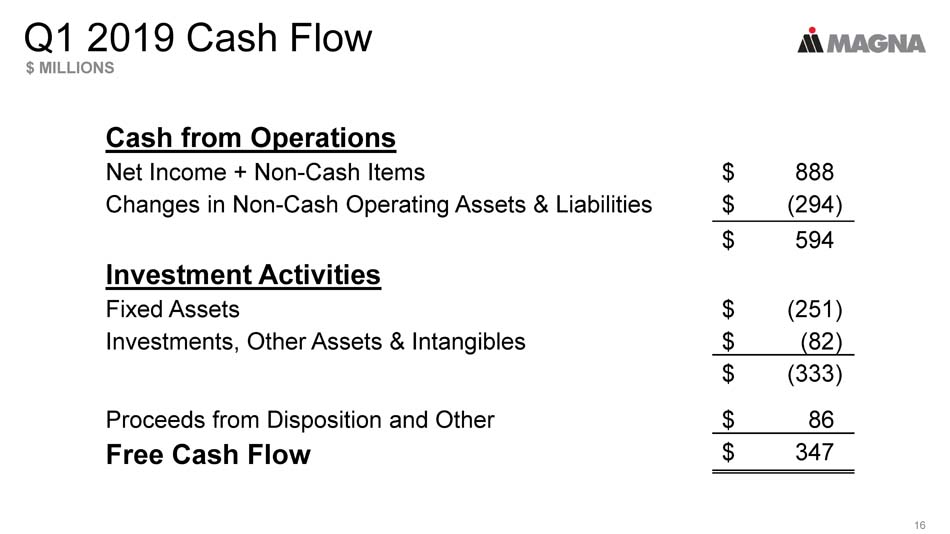
Q1 2019 Cash Flow $ MILLIONS 16 Cash from Operations Net Income + Non - Cash Items $ 888 Changes in Non - Cash Operating Assets & Liabilities $ (294) $ 594 Investment Activities Fixed Assets $ (251) Investments, Other Assets & Intangibles $ (82) $ (333) Proceeds from Disposition and Other $ 86 Free Cash Flow $ 347

Return of Capital to Shareholders 17 Common Shares Repurchased in Q1 5.6M $ to Repurchase Shares in Q1 $ 284M Dividends Paid $ 119M Total Q1 Return to Shareholders $ 403M Common Shares Repurchased to date in Q2 1 2.2M $ to Repurchase Shares in Q2 1 $ ~120M 1 As of May 3, 2019
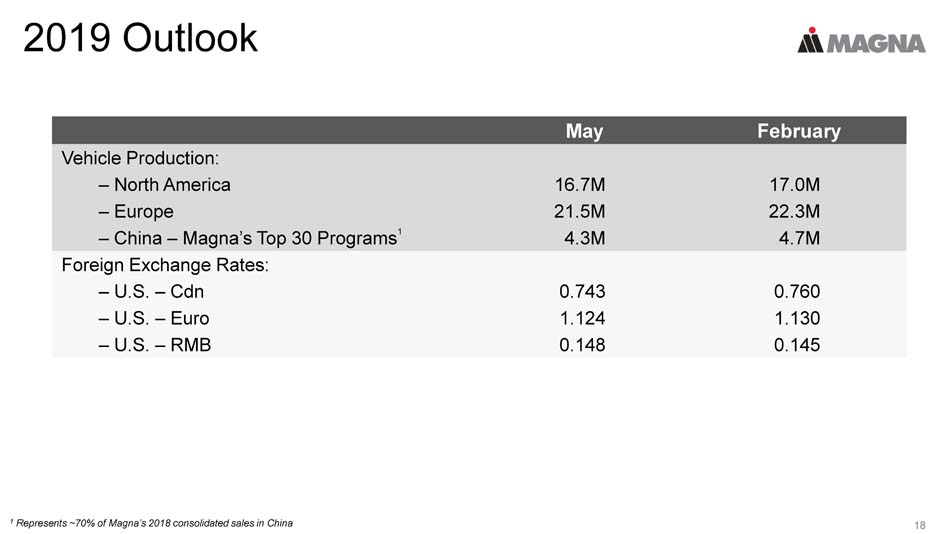
2019 Outlook 18 May February Vehicle Production: – North America 16.7M 17.0M – Europe 21.5M 22.3M – China – Magna’s Top 30 Programs 1 4.3M 4.7M Foreign Exchange Rates: – U.S. – Cdn 0.743 0.760 – U.S. – Euro 1.124 1.130 – U.S. – RMB 0.148 0.145 1 Represents ~70% of Magna’s 2018 consolidated sales in China
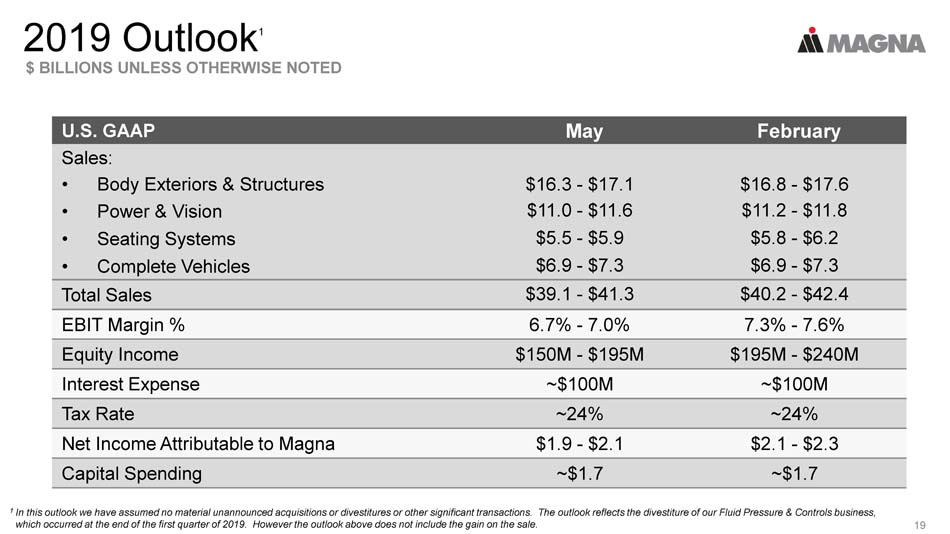
2019 Outlook 1 $ BILLIONS UNLESS OTHERWISE NOTED 19 U.S. GAAP May February Sales: • Body Exteriors & Structures $16.3 - $17.1 $16.8 - $17.6 • Power & Vision $11.0 - $11.6 $11.2 - $11.8 • Seating Systems $5.5 - $5.9 $5.8 - $6.2 • Complete Vehicles $6.9 - $7.3 $6.9 - $7.3 Total Sales $39.1 - $41.3 $40.2 - $42.4 EBIT Margin % 6.7% - 7.0% 7.3% - 7.6% Equity Income $150M - $195M $195M - $240M Interest Expense ~$100M ~$100M Tax Rate ~24% ~24% Net Income Attributable to Magna $1.9 - $2.1 $2.1 - $2.3 Capital Spending ~$1.7 ~$1.7 1 In this outlook we have assumed no material unannounced acquisitions or divestitures or other significant transactions. The out look reflects the divestiture of our Fluid Pressure & Controls business, which occurred at the end of the first quarter of 2019. However the outlook above does not include the gain on the sale.

2019 Segment Adjusted EBIT Margin % 20 2018 Prior 2019 Outlook Current 2019 Outlook BODY EXTERIORS & STRUCTURES 8.1% 8.2 - 8.6% 8.2 - 8.6% SEATING SYSTEMS 7.7% 6.8 - 7.3% 6.2 - 6.7% POWER & VISION 9.5% 8.5 - 9.0% 6.6 - 7.1% COMPLETE VEHICLES 1.1% 1.5 - 2.0% 1.5 - 2.0%

Revised 2021 Outlook 1 CONSOLIDATED UPDATED PREVIOUS Equity Income $220M - $275M $290M - $345M EBIT Margin % 7.9% - 8.3% 8.1% - 8.5% 21 1 We have updated our 2021 outlook for one of our transmission joint ventures in China. Equity income has been reduced by $70 m ill ion as a result of lower than expected production volumes on programs to supply transmissions. We now expect equity income in 2021 to be between $220 million and $275 million, compared to a range of between $290 million and $345 million previously, as set out in our outlook dated January 15, 2019. As a result of our reduced equity income outlook, we now expect our 2021 Adjusted EBIT margin pe rcentage to be in the 7.9% to 8.3% range, compared to a previous range of 8.1% to 8.5%, as provided in January. We have made no other updates to our 2021 outlook from January, including upd ate s in assumptions with respect to total light vehicle production volumes, material unannounced acquisitions and divestitures and foreign exchange rates. To the extent that these assumptions cha nge, our outlook may be further impacted. POWER & VISION UPDATED PREVIOUS Equity Income $190M - $230M $260M - $300M EBIT Margin % 10.5% - 11.1% 11.1% - 11.7%
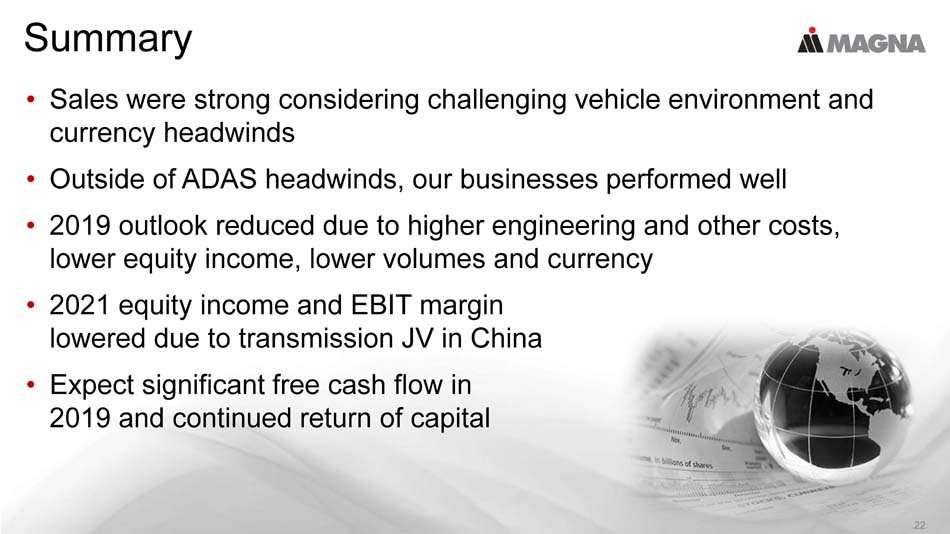
Summary • Sales were strong considering challenging vehicle environment and currency headwinds • Outside of ADAS headwinds, our businesses performed well • 2019 outlook reduced due to higher engineering and other costs, lower equity income, lower volumes and currency • 2021 equity income and EBIT margin lowered due to transmission JV in China • Expect significant free cash flow in 2019 and continued return of capital 22

Q1 2019 APPENDIX 23 May 9, 2019
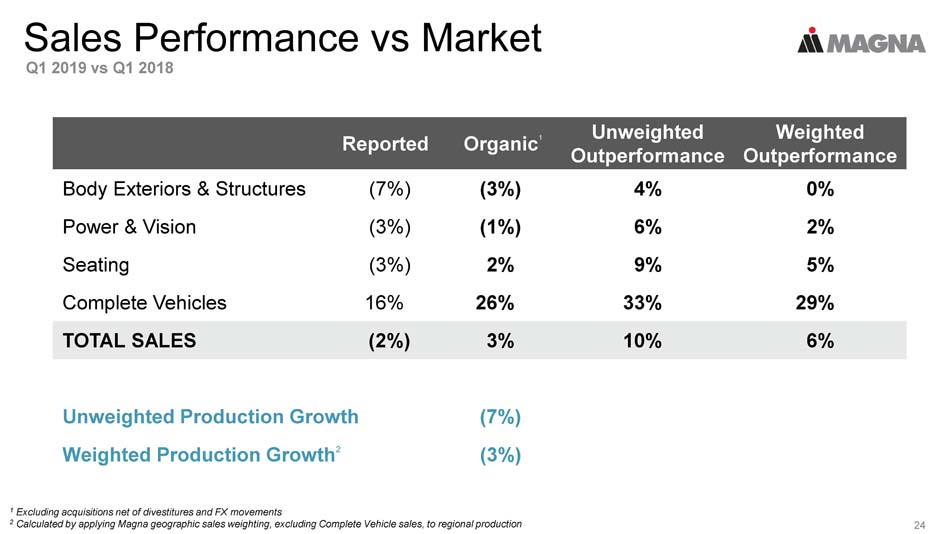
Sales Performance vs Market Q1 2019 vs Q1 2018 Reported Organic 1 Unweighted Outperformance Weighted Outperformance Body Exteriors & Structures (7%) (3%) 4% 0% Power & Vision (3%) (1%) 6% 2% Seating (3%) 2% 9% 5% Complete Vehicles 16% 26% 33% 29% TOTAL SALES (2%) 3% 10% 6% Unweighted Production Growth (7%) Weighted Production Growth 2 (3%) 1 Excluding acquisitions net of divestitures and FX movements 2 Calculated by applying Magna geographic sales weighting, excluding Complete Vehicle sales, to regional production 24

Geographic Sales Q1 2019 vs Q1 2018 25 Q1 2018 Q1 2019 - 5 % NORTH AMERICA ($Billions) PRODUCTION - 3% - 11 % ASIA ($Millions) PRODUCTION - 9% (China - 17%) + 3 % EUROPE ($Billions) PRODUCTION - 3% - 14 % REST OF WORLD ($Millions) S.A. PRODUCTION - 4% 5.4 5.1 4.7 4.9 659 587 137 118
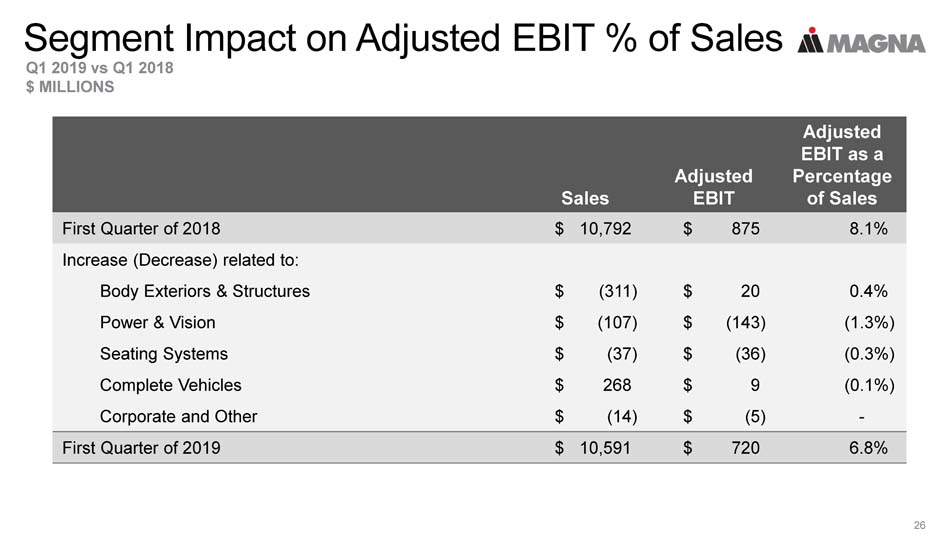
Segment Impact on Adjusted EBIT % of Sales Q1 2019 vs Q1 2018 $ MILLIONS 26 Sales Adjusted EBIT Adjusted EBIT as a Percentage of Sales First Quarter of 2018 $ 10,792 $ 875 8.1% Increase (Decrease) related to: Body Exteriors & Structures $ (311) $ 20 0.4% Power & Vision $ (107) $ (143) (1.3%) Seating Systems $ (37) $ (36) (0.3%) Complete Vehicles $ 268 $ 9 (0.1%) Corporate and Other $ (14) $ (5) - First Quarter of 2019 $ 10,591 $ 720 6.8%
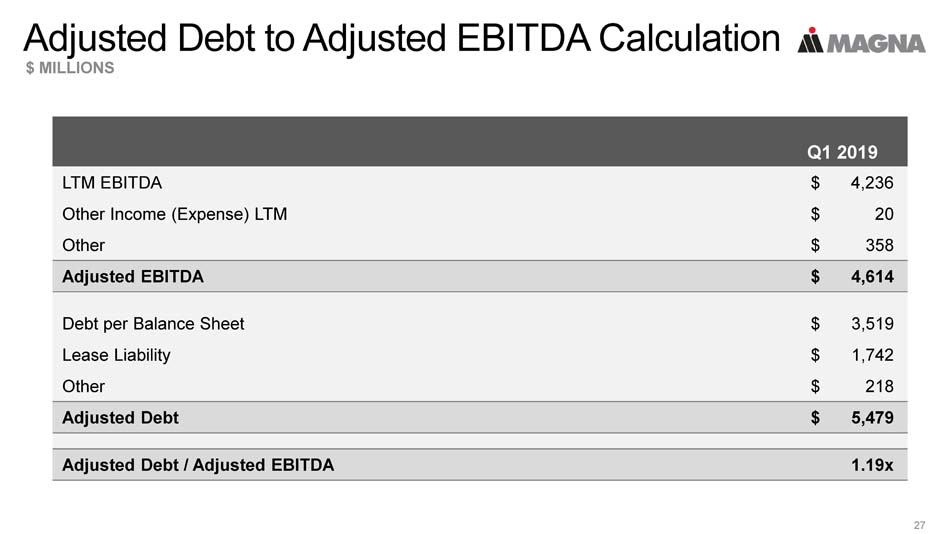
Adjusted Debt to Adjusted EBITDA Calculation $ MILLIONS 27 Q1 2019 LTM EBITDA $ 4,236 Other Income (Expense) LTM $ 20 Other $ 358 Adjusted EBITDA $ 4,614 Debt per Balance Sheet $ 3,519 Lease Liability $ 1,742 Other $ 218 Adjusted Debt $ 5,479 Adjusted Debt / Adjusted EBITDA 1.19x
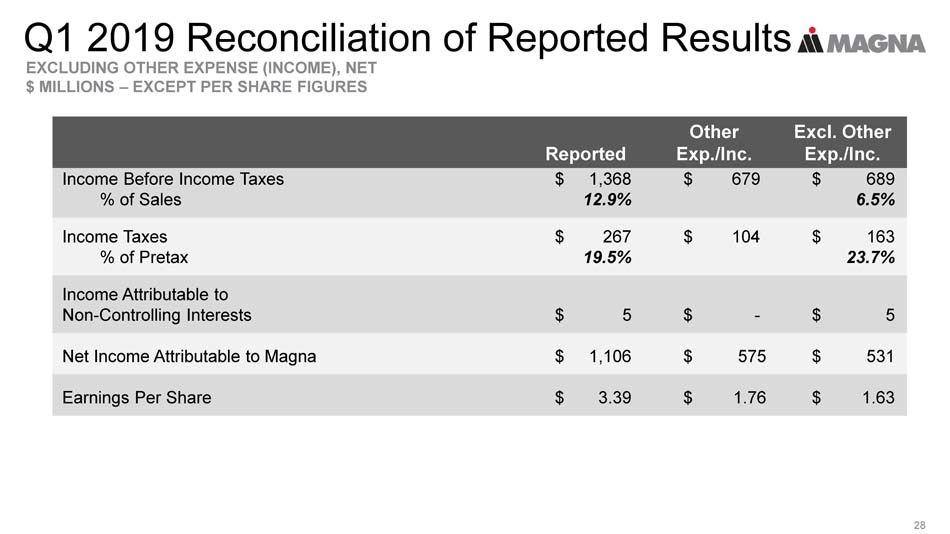
Q1 2019 Reconciliation of Reported Results EXCLUDING OTHER EXPENSE (INCOME), NET $ MILLIONS – EXCEPT PER SHARE FIGURES 28 Reported Other Exp./Inc. Excl. Other Exp./Inc. Income Before Income Taxes $ 1,368 $ 679 $ 689 % of Sales 12.9% 6.5% Income Taxes $ 267 $ 104 $ 163 % of Pretax 19.5% 23.7% Income Attributable to Non - Controlling Interests $ 5 $ - $ 5 Net Income Attributable to Magna $ 1,106 $ 575 $ 531 Earnings Per Share $ 3.39 $ 1.76 $ 1.63
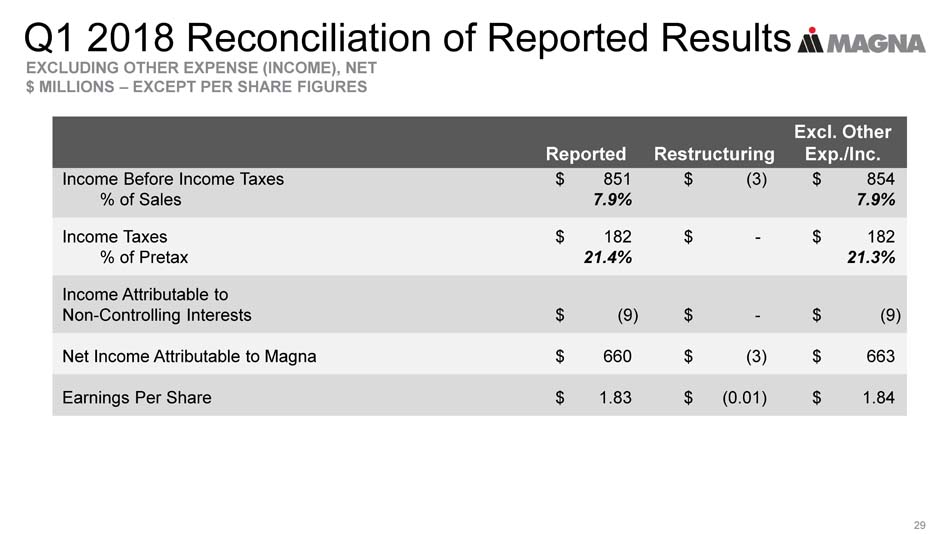
Q1 2018 Reconciliation of Reported Results EXCLUDING OTHER EXPENSE (INCOME), NET $ MILLIONS – EXCEPT PER SHARE FIGURES 29 Reported Restructuring Excl. Other Exp./Inc. Income Before Income Taxes $ 851 $ (3) $ 854 % of Sales 7.9% 7.9% Income Taxes $ 182 $ - $ 182 % of Pretax 21.4% 21.3% Income Attributable to Non - Controlling Interests $ (9) $ - $ (9) Net Income Attributable to Magna $ 660 $ (3) $ 663 Earnings Per Share $ 1.83 $ (0.01) $ 1.84

30