Exhibit 99.2

Q3 2021 Earnings Presentation November 5, 2021

Forward Looking Statements Q3 - 2021 EARNINGS - 05NOV21 2 Certain statements in this presentation constitute "forward - looking information" or "forward - looking statements" (collectively, "forward - looking statements") . Any such forward - looking statements are intended to provide information about management's current expectations and plans and may not be appropriate for other purposes . Forward - looking statements may include financial and other projections, as well as statements regarding our future plans, strategic objectives or economic performance, or the assumptions underlying any of the foregoing, and other statements that are not recitations of historical fact . We use words such as "may", "would", "could", "should", "will", "likely", "expect", "anticipate", "believe", "intend", "plan", "aim", "forecast", "outlook", "project", "estimate", "target" and similar expressions suggesting future outcomes or events to identify forward - looking statements . The following table identifies the material forward - looking statements contained in this document, together with the material potential risks that we currently believe could cause actual results to differ materially from such forward - looking statements . Readers should also consider all of the risk factors which follow below the table : Material Forward - Looking Statement Material Potential Risks Related to Applicable Forward - Looking Statement Impact of the global semiconductor shortage Risks related to OEM actions in response to the semiconductor chip shortage such as unplanned shutdowns of production lines and/or plants ; reductions in OEM vehicle production plans ; and changes to OEM product mix . These risks include : lower sales ; production inefficiencies due to production lines being stopped/restarted unexpectedly based on OEMs' production schedules ; premium freight costs to expedite shipments ; and/or other unrecoverable costs ; skilled labour attraction/retention ; price increases from sub - suppliers that have been negatively impacted by production inefficiencies, premium freight costs and/or other costs related to the semiconductor chip shortage Impact of energy shortages Risks related to production shutdowns due to energy shortages/rationing . These risks include : lower sales ; higher energy costs ; premium freight costs to expedite shipments ; and/or other unrecoverable costs ; price increases from sub - suppliers that have been negatively impacted by production inefficiencies, premium freight costs and/or other costs related to production shutdowns resulting from energy rationing Impact of supply chain disruptions Risks related to supply chain disruptions, such as magnesium and silicon shortages, include : lower sales ; higher commodity costs ; production inefficiencies due to production lines being stopped/restarted unexpectedly ; premium freight costs to expedite shipments ; and/or other unrecoverable costs ; price increases from sub - suppliers that have been negatively impacted by production inefficiencies, premium freight costs and/or other costs related to the supply chain shortages Inflationary price increases Commodity cost volatility Increase in our cost structure as a result of our inability to offset inflationary price increases through continuous improvement actions, price increases, adjustments to our own operations or otherwise Price increases or surcharges from sub - suppliers in connection with inflationary pressures they face Skilled labour attraction/retention Light Vehicle Production Light vehicle sales levels Supply disruptions, including as a result of the current semiconductor chip shortage Production allocation decisions by OEMs Total Sales Segment Sales Economic impact of COVID - 19 on consumer confidence Supply disruptions, including as a result of a semiconductor chip shortage currently being experienced in the industry Global energy shortages Elevated level of inflation Concentration of sales with six customers Shifts in market shares among vehicles or vehicle segments Shifts in consumer "take rates" for products we sell Adjusted EBIT Margin Segment Adjusted EBIT Margin Net Income Attributable to Magna Same risks as for Total Sales and Segment Sales above Operational underperformance Higher costs incurred to mitigate the risk of supply disruptions, including : materials price increases ; higher - priced substitute supplies ; premium freight costs to expedite shipments ; production inefficiencies due to production lines being stopped/restarted unexpectedly based on customers' production schedules ; other unrecoverable costs ; and price increases from sub - suppliers that have been negatively impacted by production inefficiencies Price concessions Commodity cost volatility Higher labour costs Tax risks Equity Income Same risks as Adjusted EBIT Margin/Segment Adjusted EBIT Margin/Net Income Attributable to Magna above Risks related to conducting business through joint ventures Free Cash Flow Same risks as for Total Sales/Segment Sales, and Adjusted EBIT Margin/Segment Adjusted EBIT Margin/Net Income Attributable to Magna above
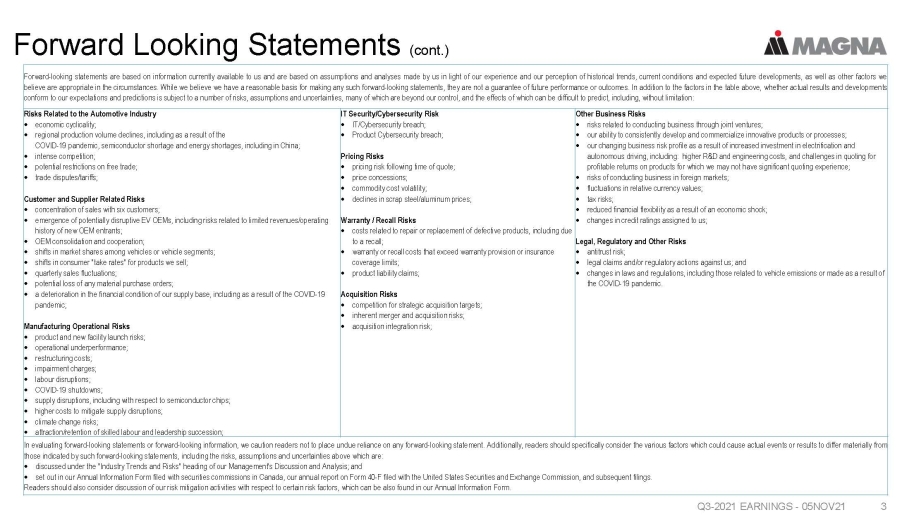
Forward Looking Statements (cont.) Q3 - 2021 EARNINGS - 05NOV21 3 Forward - looking statements are based on information currently available to us and are based on assumptions and analyses made by us in light of our experience and our perception of historical trends, current conditions and expected future developments, as well as other factors we believe are appropriate in the circumstances . While we believe we have a reasonable basis for making any such forward - looking statements, they are not a guarantee of future performance or outcomes . In addition to the factors in the table above, whether actual results and developments conform to our expectations and predictions is subject to a number of risks, assumptions and uncertainties, many of which are beyond our control, and the effects of which can be difficult to predict, including, without limitation : Risks Related to the Automotive Industry economic cyclicality; regional production volume declines, including as a result of the COVID - 19 pandemic, semiconductor shortage and energy shortages, including in China; intense competition; potential restrictions on free trade; trade disputes/tariffs; Customer and Supplier Related Risks concentration of sales with six customers; emergence of potentially disruptive EV OEMs, including risks related to limited revenues/operating history of new OEM entrants; OEM consolidation and cooperation; shifts in market shares among vehicles or vehicle segments; shifts in consumer "take rates" for products we sell; quarterly sales fluctuations; potential loss of any material purchase orders; a deterioration in the financial condition of our supply base, including as a result of the COVID - 19 pandemic; Manufacturing Operational Risks product and new facility launch risks; operational underperformance; restructuring costs; impairment charges; labour disruptions; COVID - 19 shutdowns; supply disruptions, including with respect to semiconductor chips; higher costs to mitigate supply disruptions; climate change risks; attraction/retention of skilled labour and leadership succession; IT Security/Cybersecurity Risk IT/Cybersecurity breach; Product Cybersecurity breach; Pricing Risks pricing risk following time of quote; price concessions; commodity cost volatility; declines in scrap steel/aluminum prices; Warranty / Recall Risks costs related to repair or replacement of defective products, including due to a recall; warranty or recall costs that exceed warranty provision or insurance coverage limits; product liability claims; Acquisition Risks competition for strategic acquisition targets; inherent merger and acquisition risks; acquisition integration risk; Other Business Risks risks related to conducting business through joint ventures; our ability to consistently develop and commercialize innovative products or processes; our changing business risk profile as a result of increased investment in electrification and autonomous driving, including: higher R&D and engineering costs, and challenges in quoting for profitable returns on products for which we may not have significant quoting experience; risks of conducting business in foreign markets; fluctuations in relative currency values; tax risks; reduced financial flexibility as a result of an economic shock; changes in credit ratings assigned to us; Legal, Regulatory and Other Risks antitrust risk; legal claims and/or regulatory actions against us; and changes in laws and regulations, including those related to vehicle emissions or made as a result of the COVID - 19 pandemic. In evaluating forward - looking statements or forward - looking information, we caution readers not to place undue reliance on any forward - looking statement . Additionally, readers should specifically consider the various factors which could cause actual events or results to differ materially from those indicated by such forward - looking statements, including the risks, assumptions and uncertainties above which are : discussed under the "Industry Trends and Risks" heading of our Management's Discussion and Analysis ; and set out in our Annual Information Form filed with securities commissions in Canada, our annual report on Form 40 - F filed with the United States Securities and Exchange Commission, and subsequent filings . Readers should also consider discussion of our risk mitigation activities with respect to certain risk factors, which can be also found in our Annual Information Form .

Q3 - 2021 EARNINGS - 05NOV21 4 Reminders All amounts are in U.S. Dollars Today's discussion excludes the impact of other expense (income), net ("Unusual Items") "Organic", in the context of sales movements, means "excluding the impact of foreign exchange, acquisitions and divestitures"

5 Key Messages Q3 - 2021 EARNINGS - 05NOV21 Solid Q3 performance in an increasingly challenged industry environment 1 Challenges expected to continue to a lesser degree in Q4 2 Strategic portfolio positions us for sales growth over market and strong free cash flow 3 Well - positioned to capture growing market opportunities with systems approach and unique complete vehicle capabilities 4

Current Market Dynamics Q3 - 2021 EARNINGS - 05NOV21 6 Auto Demand Environment Remains Strong HEADWINDS TAILWINDS Low Dealer Inventory Levels OEMs Indications Point to Strong Future Production Continued Semiconductor Chip Supply Constraints Unpredictable OEM Production Schedules Causing Operational Inefficiencies Inflationary Input Cost Pressures

CONSOLIDATED SALES $7.9B Q3 2021 Performance Highlights Q3 - 2021 EARNINGS - 05NOV21 7 ADJUSTED EBIT MARGIN % 2.9% ADJUSTED DILUTED EPS $0.56 FREE CASH FLOW 1 ($25M) 1 Free Cash Flow (FCF) is Cash from Operating Activities plus proceeds from normal course dispositions of fixed and other asset s p lus settlement of long - term receivable from a non - consolidated joint venture minus capital spending minus investment in other assets Managing Through a Challenging Operating Environment

8 Q3 - 2021 EARNINGS - 05NOV21 Customer and Industry Recognition
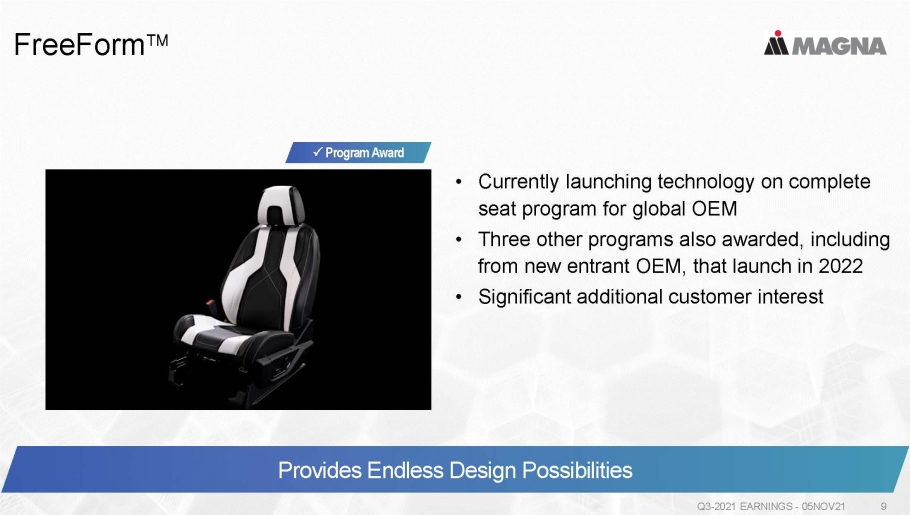
FreeForm Q3 - 2021 EARNINGS - 05NOV21 9 Provides Endless Design Possibilities • Currently launching technology on complete seat program for global OEM • Three other programs also awarded, including from new entrant OEM, that launch in 2022 • Significant additional customer interest Program Award

MEZZO Panel Q3 - 2021 EARNINGS - 05NOV21 10 Changing the Face of Electric Vehicles • First - to - market, large - format decorated front integration panel • Integrates ADAS sensors and lighting • Features hidden - until - lit functionality • Awarded program using this core technology • Enables design distinction for EV front ends Program Award

Q3 - 2021 EARNINGS - 05NOV21 11 Program Award Bolsters Magna's Leading Camera Position Supports Magna's Growth in Electrification Advanced Front Cameras • Awarded new business with European - based global OEM • Will utilize latest generation camera technology • Based on platform that already has applications in production Program Award NEW PIC? Dual - Clutch Transmissions • Awarded family of transmissions from Daimler, including traditional (DCT) and hybrid (HDT) launching in 2025 • Represents third high - volume HDT program award • Beginning to launch HDTs this quarter for two additional global customers Program Awards

12 Management Updates Q3 - 2021 EARNINGS - 05NOV21 Vince Galifi appointed as President Pat McCann promoted to EVP & CFO Anton Mayer promoted to EVP & CTO

Q3 2021 Financial Results Q3 - 2021 EARNINGS - 05NOV21 13 Reflects Current Industry Environment Adjusted EBIT ($Millions) $778 $229 $0 $100 $200 $300 $400 $500 $600 $700 $800 Q3'20 Q3'21 Consolidated Sales ($Billions) $9.1 $7.9 0.0 0.1 0.1 0.1 0.1 0.1 0.1 0.1 $0.0 $1.0 $2.0 $3.0 $4.0 $5.0 $6.0 $7.0 $8.0 $9.0 $10.0 Q3'20 Q3'21 Adjusted EPS ($) $1.95 $0.56 0.0 0.1 0.1 0.1 0.1 0.1 0.1 0.1 $0.00 $0.50 $1.00 $1.50 $2.00 Q3'20 Q3'21
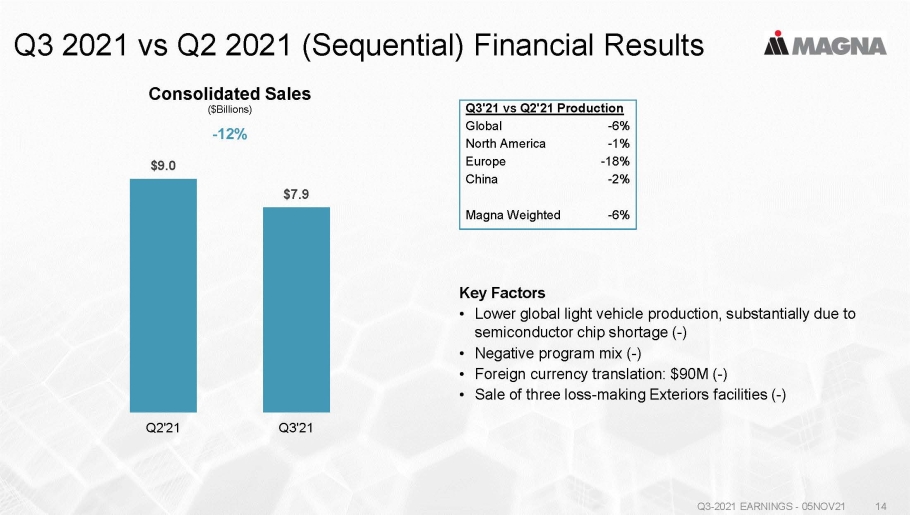
14 Q3 2021 vs Q2 2021 (Sequential) Financial Results Q3 - 2021 EARNINGS - 05NOV21 Key Factors • Lower global light vehicle production, substantially due to semiconductor chip shortage ( - ) • Negative program mix ( - ) • Foreign currency translation: $90M ( - ) • Sale of three loss - making Exteriors facilities ( - ) Q3'21 vs Q2'21 Production Global - 6% North America - 1% Europe - 18% China - 2% Magna Weighted - 6% Consolidated Sales ($Billions) - 12% $9.0 $7.9 0.0 0.1 0.1 0.1 0.1 0.1 0.1 0.1 $0.0 $1.0 $2.0 $3.0 $4.0 $5.0 $6.0 $7.0 $8.0 $9.0 $10.0 Q2'21 Q3'21

15 Q3 2021 vs Q2 2021 (Sequential) Financial Results Q3 - 2021 EARNINGS - 05NOV21 Key Factors • Lower earnings on $1.1B decline in sales ( - ) • Production inefficiencies driven by unpredictable OEM production schedules ( - ) • Increased production costs, including freight and commodities ( - ) • $45 million provision on engineering service contracts with automotive unit of Evergrande ( - ) • Favourable value - added tax settlement in Brazil in Q2 ( - ) • Lower profit sharing and incentive comp (+) • Lower launch costs (+) • Sale of three loss - making Exteriors facilities (+) Adjusted EBIT & Margin ($Millions) - 59% $557 $229 6.2% 2.9% 0.0 0.0 0.1 0.1 0.2 $0 $100 $200 $300 $400 $500 $600 $700 $800 Q2'21 Q3'21

16 Q3 2021 Cash Flow and Investment Activities Q3 - 2021 EARNINGS - 05NOV21 Free Cash Flow 1 ($Millions) $1,345 $178 - $25 0.0 0.1 0.1 0.1 0.1 0.1 0.1 0.1 -$250 -$50 $150 $350 $550 $750 $950 $1,150 $1,350 Q3'20 Q2'21 Q3'21 OTHER USES OF CASH Acquisition of 49% interest in LG - Magna JV $454M Public and Private Equity Investments $3M Funding Provided on Sale of Exter . Facilities $41M Dividends ($0.43/share) $130M Cash from Operations Before Changes in Operating Assets & Liabilities $532M Changes in Operating Assets & Liabilities ($132M) Cash from Operations $400M Fixed Asset Additions ($334M) Increase in Investments, Other Assets and Intangible Assets ($101M) Proceeds from Dispositions $10M Free Cash Flow 1 ($25M) 1 Free Cash Flow (FCF) is Cash from Operating Activities plus proceeds from normal course dispositions of fixed and other asset s p lus settlement of long - term receivable from a non - consolidated joint venture minus capital spending minus investment in other assets
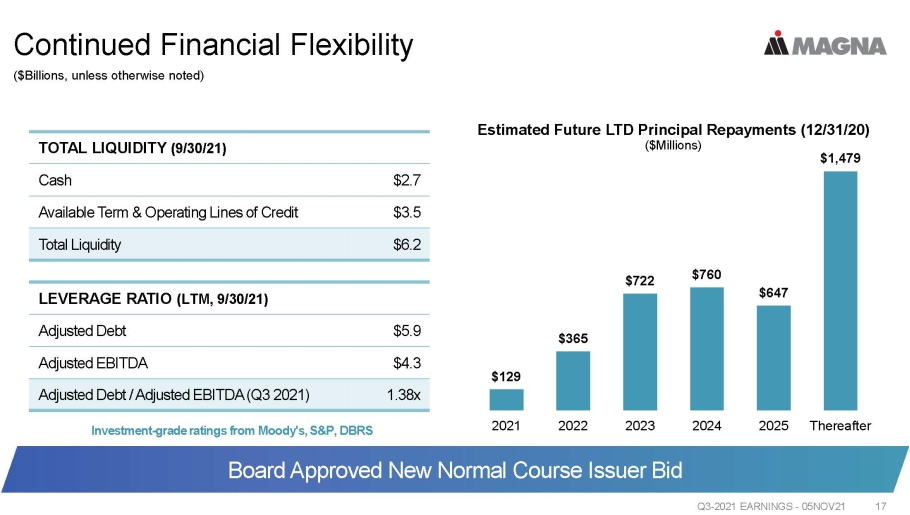
Continued Financial Flexibility Q3 - 2021 EARNINGS - 05NOV21 17 ($Billions, unless otherwise noted) Estimated Future LTD Principal Repayments (12/31/20) ($Millions) $129 $365 $722 $760 $647 $1,479 2021 2022 2023 2024 2025 Thereafter LEVERAGE RATIO (LTM, 9/30/21) Adjusted Debt $5.9 Adjusted EBITDA $4.3 Adjusted Debt / Adjusted EBITDA (Q3 2021) 1.38x TOTAL LIQUIDITY (9/30/21) Cash $2.7 Available Term & Operating Lines of Credit $3.5 Total Liquidity $6.2 Investment - grade ratings from Moody's, S&P, DBRS Board Approved New Normal Course Issuer Bid

2021 Outlook Assumptions Q3 - 2021 EARNINGS - 05NOV21 18 2020 AUGUST NOVEMBER Light Vehicle Production (millions of units) • North America 13.0 14.4 13.4 • Europe 16.5 18.1 16.5 • China 23.5 24.7 23.0 Foreign Exchange Rates • 1 CDN dollar equals USD 0.746 0.801 0.800 • 1 EURO equals USD 1.141 1.193 1.187 • 1 RMB equals USD 0.145 0.155 0.155 Changed from previous Outlook
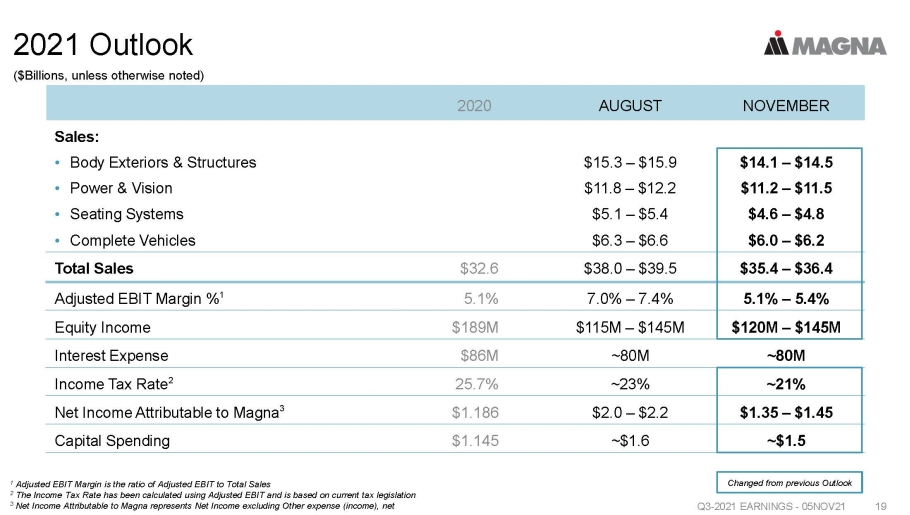
2021 Outlook Q3 - 2021 EARNINGS - 05NOV21 19 2020 AUGUST NOVEMBER Sales: • Body Exteriors & Structures $15.3 – $15.9 $14.1 – $14.5 • Power & Vision $11.8 – $12.2 $11.2 – $11.5 • Seating Systems $5.1 – $5.4 $4.6 – $4.8 • Complete Vehicles $6.3 – $6.6 $6.0 – $6.2 Total Sales $32.6 $38.0 – $39.5 $35.4 – $36.4 Adjusted EBIT Margin % 1 5.1% 7.0% – 7.4% 5.1% – 5.4% Equity Income $189M $115M – $145M $120M – $145M Interest Expense $86M ~80M ~80M Income Tax Rate 2 25.7% ~23% ~21% Net Income Attributable to Magna 3 $1.186 $2.0 – $2.2 $1.35 – $1.45 Capital Spending $1.145 ~$1.6 ~$1.5 1 Adjusted EBIT Margin is the ratio of Adjusted EBIT to Total Sales 2 The Income Tax Rate has been calculated using Adjusted EBIT and is based on current tax legislation 3 Net Income Attributable to Magna represents Net Income excluding Other expense (income), net Changed from previous Outlook ($Billions, unless otherwise noted)
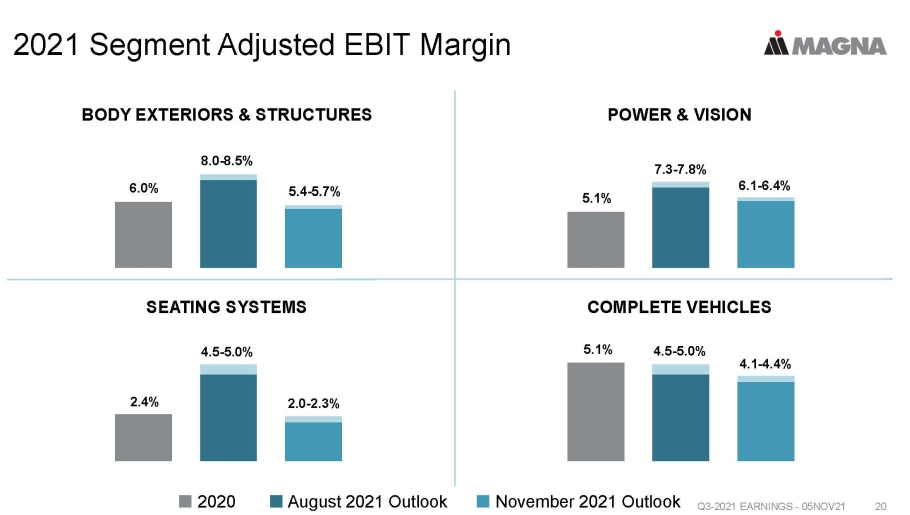
2021 Segment Adjusted EBIT Margin Q3 - 2021 EARNINGS - 05NOV21 20 2020 August 2021 Outlook November 2021 Outlook BODY EXTERIORS & STRUCTURES 6.0% 8.0 - 8.5% 5.4 - 5.7% SEATING SYSTEMS 2.4% 4.5 - 5.0% 2.0 - 2.3% POWER & VISION 5.1% 7.3 - 7.8% 6.1 - 6.4% COMPLETE VEHICLES 5.1% 4.5 - 5.0% 4.1 - 4.4%

21 Free Cash Flow 1 Expectations Q3 - 2021 EARNINGS - 05NOV21 2021 ($Billions) $0.00 $0.20 $0.40 $0.60 $0.80 $1.00 $1.20 $1.40 $1.60 $1.80 $2.00 $1.6 - $1.8 ~$1 August 2021 Outlook November 2021 Outlook 1 Free Cash Flow (FCF) is Cash from Operating Activities plus proceeds from normal course dispositions of fixed and other asset s p lus settlement of long - term receivable from a non - consolidated joint venture minus capital spending minus investment in other assets • Significant reduction in light vehicle production assumptions • Lower earnings on decline in sales • Production inefficiencies • Increased production costs • Higher working capital levels

22 IN SUMMARY Solid Q3 Performance in an Increasingly Challenged Industry Environment Q3 - 2021 EARNINGS - 05NOV21 Managing through volatile production environment and inflationary pressures Continuing to win business with our technology portfolio Positioned to support anticipated strong recovery of vehicle production Investing for further future growth
Q3 - 2021 EARNINGS - 05NOV21 23 Appendix

Q3 2021 Reconciliation of Reported Results Q3 - 2021 EARNINGS - 05NOV21 24 REPORTED OTHER EXPENSE, NET EXCL. OTHER EXPENSE, NET Income Before Income Taxes $ 27 $ 180 $ 207 % of Sales 0.3% 2.6% Income Tax Expense $ 10 $ 21 $ 31 % of Pretax 37.0% 15.0% Income Attributable to Non - Controlling Interests $ (6) $ - $ (6) Net Income Attributable to Magna $ 11 $ 159 $ 170 Earnings Per Share $ 0.04 $ 0.52 $ 0.56 Excluding Other Expense (Income), Net $Millions – except for share figures

Q3 2020 Reconciliation of Reported Results Q3 - 2021 EARNINGS - 05NOV21 25 REPORTED OTHER EXPENSE, NET EXCL. OTHER EXPENSE, NET Income Before Income Taxes $ 436 $ 316 $ 752 % of Sales 4.8% 8.2% Income Tax Expense $ 109 $ 61 $ 170 % of Pretax 25.0% 22.6% Loss Attributable to Non - Controlling Interests $ 78 $ (75) $ 3 Net Income Attributable to Magna $ 405 $ 180 $ 585 Earnings Per Share $ 1.35 $ 0.60 $ 1.95 Excluding Other Expense (Income), Net $Millions – except for share figures

Sales Performance vs Market 26 REPORTED ORGANIC 1 PERFORMANCE VS WEIGHTED GLOBAL PRODUCTION (Weighted GoM) Body Exteriors & Structures (17%) (16%) 2% Power & Vision (8%) (17%) 1% Seating Systems (12%) (21%) (3%) Complete Vehicles (10%) (11%) 7% TOTAL SALES (13%) (17%) 1% Unweighted Production Growth (12%) Weighted Production Growth 2 (18%) 1 Organic Sales represents sales excluding acquisitions net of divestitures and FX movements 2 Calculated by applying Magna geographic sales weighting, excluding Complete Vehicles, to regional production Q3 - 2021 EARNINGS - 05NOV21 Q3 2021 vs Q3 2020

Sales Performance vs Market 27 REPORTED ORGANIC 1 PERFORMANCE VS WEIGHTED GLOBAL PRODUCTION (Weighted GoM) Body Exteriors & Structures 19% 16% 2% Power & Vision 30% 17% 3% Seating Systems 17% 6% (8%) Complete Vehicles 26% 18% 4% TOTAL SALES 23% 15% 1% Unweighted Production Growth 16% Weighted Production Growth 2 14% 1 Organic Sales represents sales excluding acquisitions net of divestitures and FX movements 2 Calculated by applying Magna geographic sales weighting, excluding Complete Vehicles, to regional production Q3 - 2021 EARNINGS - 05NOV21 2021 YTD vs 2020

Geographic Sales 28 Q3 2020 Q3 2021 NORTH AMERICA $4.7B $3.9B PRODUCTION (19%) EUROPE $3.8B $3.1B PRODUCTION (20%) ASIA $592M $927M PRODUCTION (8%) (China (12%)) REST OF WORLD $100M $96M S.A. PRODUCTION (11%) Q3 2021 vs Q3 2020 Q3 - 2021 EARNINGS - 05NOV21

2023 Financial Outlook 1 Q3 - 2021 EARNINGS - 05NOV21 29 1 We have not updated 2023 Outlook ranges from our February 19 th , 2021 press release. 2 Adjusted EBIT Margin is the ratio of Adjusted EBIT to Total Sales Assumptions Light Vehicle Production (millions of units) • North America 16.3 • Europe 20.1 • China 26.0 Foreign Exchange Rates • 1 CDN dollar equals USD 0.770 • 1 EURO equals USD 1.210 • 1 RMB equals USD 0.153 $Billions, Unless Otherwise Noted Sales • Body Exteriors & Structures $18.0 – $19.0 • Power & Vision $13.0 – $13.6 • Seating Systems $6.1 – $6.5 • Complete Vehicles $6.3 – $6.8 Total Sales $43.0 – $45.5 • Adjusted EBIT Margin % 2 8.1% – 8.6% • Equity Income $155M – $200M
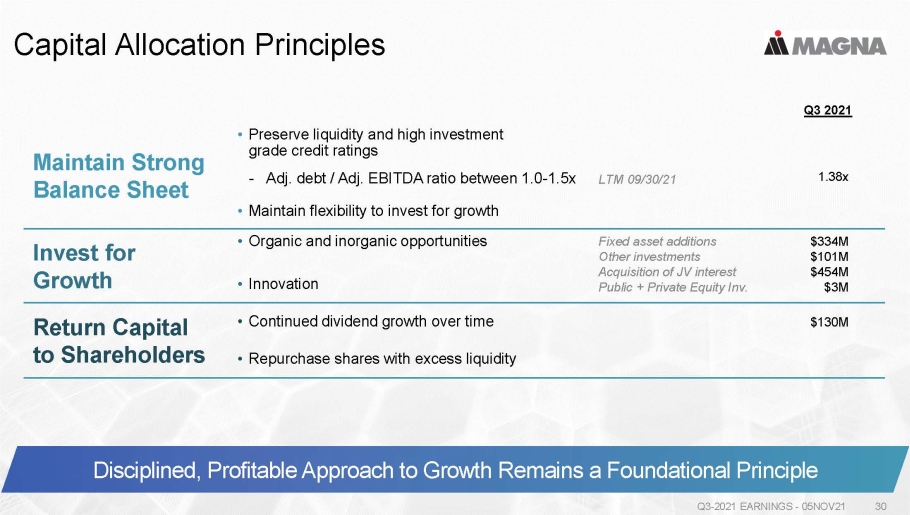
Capital Allocation Principles Q3 - 2021 EARNINGS - 05NOV21 30 Disciplined, Profitable Approach to Growth Remains a Foundational Principle Q3 2021 Maintain Strong Balance Sheet • Preserve liquidity and high investment grade credit ratings - Adj. debt / Adj. EBITDA ratio between 1.0 - 1.5x LTM 09/30/21 1.38x • Maintain flexibility to invest for growth Invest for Growth • Organic and inorganic opportunities Fixed asset additions Other investments Acquisition of JV interest Public + Private Equity Inv. $334M $101M $454M $3M • Innovation Return Capital to Shareholders • Continued dividend growth over time $130M • Repurchase shares with excess liquidity
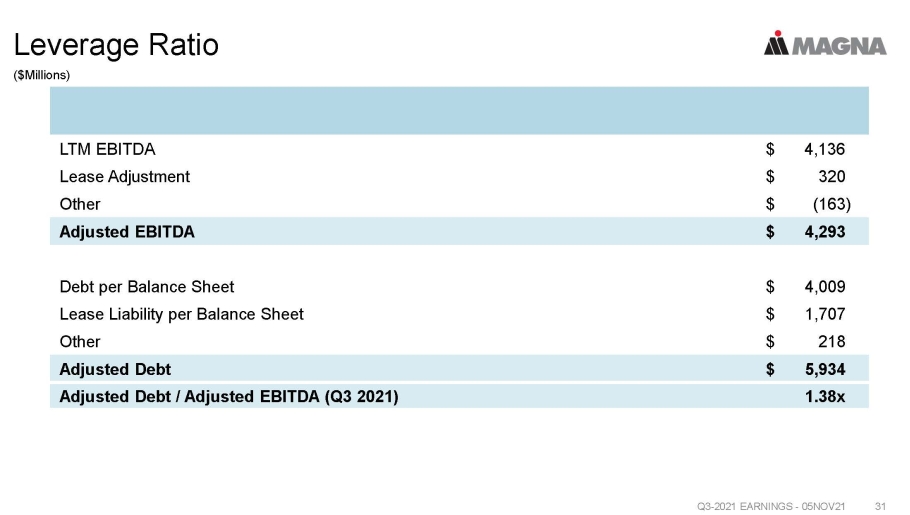
($Millions) Leverage Ratio Q3 - 2021 EARNINGS - 05NOV21 31 LTM EBITDA $ 4,136 Lease Adjustment $ 320 Other $ (163) Adjusted EBITDA $ 4,293 Debt per Balance Sheet $ 4,009 Lease Liability per Balance Sheet $ 1,707 Other $ 218 Adjusted Debt $ 5,934 Adjusted Debt / Adjusted EBITDA (Q3 2021) 1.38x

BODY EXTERIORS & STRUCTURES Segment Financial Performance Q3 - 2021 EARNINGS - 05NOV21 32 • Reduced earnings on lower sales ( - ) • Negative impact of production disruptions ( - ) • Higher production costs, including freight ( - ) • Benefit of COVID - 19 related government employee support programs in 2020 ( - ) • Higher new facility costs ( - ) • Net customer price concessions ( - ) • Lower employee profit sharing and incentive comp (+) • Transactional FX gains in 2021 compared to losses in 2020 (+) • Sale of three loss - making Exteriors facilities (+) • Lower global light vehicle production, including impact of semiconductor chip shortage ( - ) • Sale of three loss - making Exteriors facilities: $99M ( - ) • End of production of certain programs ( - ) • Net customer price concessions ( - ) • Launch of new programs (+) • Foreign currency translation: $52M (+) $3.9 $3.2 Q3'20 Q3'21 Sales ($Billions) - 17% Adjusted EBIT ($Millions) $390 $98 0.0 0.1 0.1 0.1 0.1 0.1 0.1 0.1 $0 $50 $100 $150 $200 $250 $300 $350 $400 $450 Q3'20 Q3'21
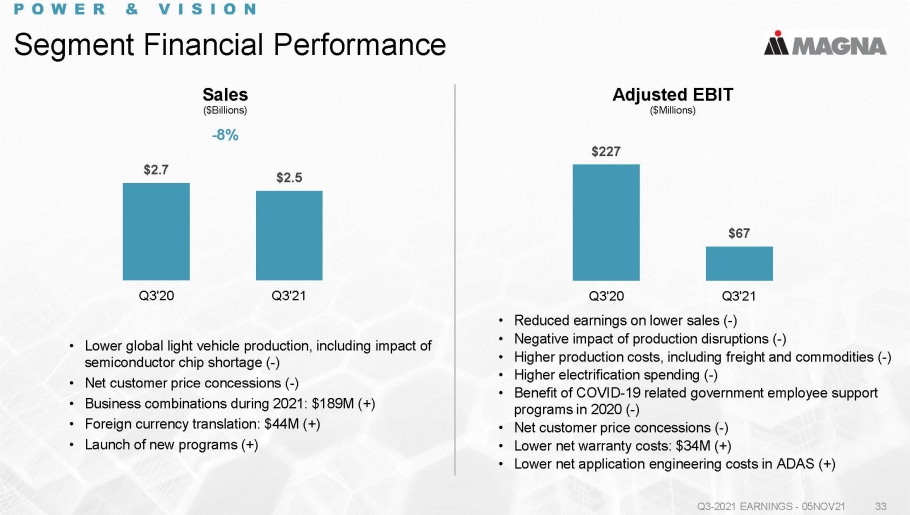
• Lower global light vehicle production, including impact of semiconductor chip shortage ( - ) • Net customer price concessions ( - ) • Business combinations during 2021: $189M (+) • Foreign currency translation: $44M (+) • Launch of new programs (+) POWER & VISION Segment Financial Performance Q3 - 2021 EARNINGS - 05NOV21 33 • Reduced earnings on lower sales ( - ) • Negative impact of production disruptions ( - ) • Higher production costs, including freight and commodities ( - ) • Higher electrification spending ( - ) • Benefit of COVID - 19 related government employee support programs in 2020 ( - ) • Net customer price concessions ( - ) • Lower net warranty costs: $34M (+) • Lower net application engineering costs in ADAS (+) $2.7 $2.5 Q3'20 Q3'21 $227 $67 0.0 0.1 0.1 0.1 0.1 0.1 0.1 0.1 0.1 0.1 0.1 $0 $50 $100 $150 $200 $250 Q3'20 Q3'21 Sales ($Billions) - 8% Adjusted EBIT ($Millions)
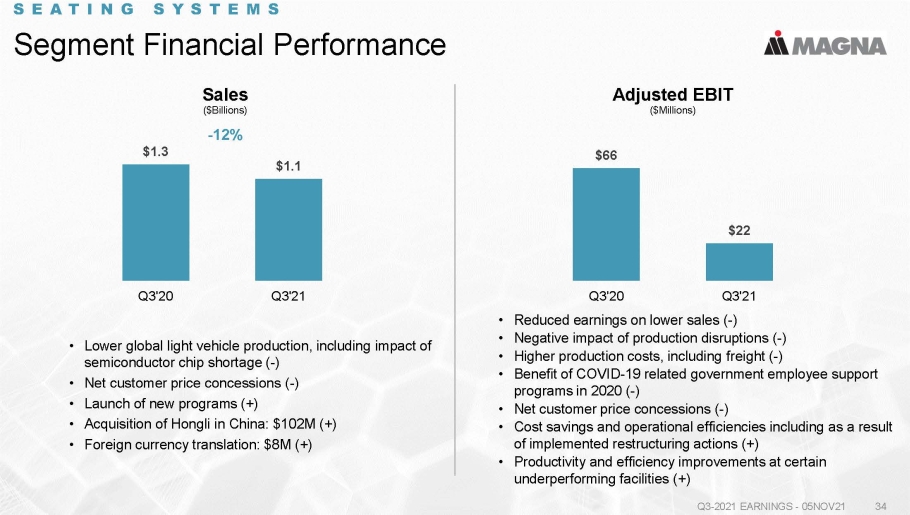
• Lower global light vehicle production, including impact of semiconductor chip shortage ( - ) • Net customer price concessions ( - ) • Launch of new programs (+) • Acquisition of Hongli in China: $102M (+) • Foreign currency translation: $8M (+) SEATING SYSTEMS Segment Financial Performance Q3 - 2021 EARNINGS - 05NOV21 34 • Reduced earnings on lower sales ( - ) • Negative impact of production disruptions ( - ) • Higher production costs, including freight ( - ) • Benefit of COVID - 19 related government employee support programs in 2020 ( - ) • Net customer price concessions ( - ) • Cost savings and operational efficiencies including as a result of implemented restructuring actions (+) • Productivity and efficiency improvements at certain underperforming facilities (+) $1.3 $1.1 Q3'20 Q3'21 $66 $22 0.0 0.0 0.0 0.0 0.0 0.1 0.1 0.1 Q3'20 Q3'21 Sales ($Billions) - 12% Adjusted EBIT ($Millions)

• Lower vehicle assembly volumes, including impact of semiconductor chip shortage ( - 4K units) • Higher euro: $13M (+) COMPLETE VEHICLES Segment Financial Performance Q3 - 2021 EARNINGS - 05NOV21 35 • $45M provision on engineering service contracts with the automotive unit of Evergrande ( - ) • Lower earnings due to lower assembly volumes, net of contractual fixed cost recoveries on certain programs ( - ) • Net customer price concessions ( - ) • Higher margins on engineering programs (+) $1.4 $1.3 Q3'20 Q3'21 $70 $30 $0 $10 $20 $30 $40 $50 $60 $70 $80 $90 Q3'20 Q3'21 Sales ($Billions) - 10% Adjusted EBIT ($Millions)

Q3 - 2021 EARNINGS - 05NOV21 36 END