Exhibit 99.3
Q4 & Year End 2021 Results & 2022 Outlook February 11, 2022
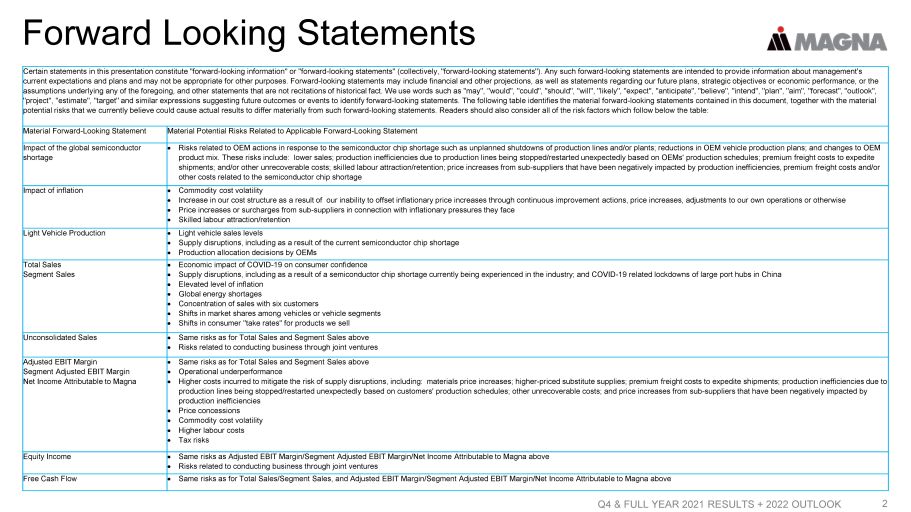
Forward Looking Statements Q4 & FULL YEAR 2021 RESULTS + 2022 OUTLOOK 2 Certain statements in this presentation constitute "forward - looking information" or "forward - looking statements" (collectively, "forward - looking statements"). Any such forward - looking statements are intended to provide information about management's current expectations and plans and may not be appropriate for other purposes. Forward - looking statements may include financial a nd other projections, as well as statements regarding our future plans, strategic objectives or economic performance, or the assumptions underlying any of the foregoing, and other statements that are not recitations of historical fact. We use words s uch as "may", "would", "could", "should", "will", "likely", "expect", "anticipate", "believe", "intend", "plan", "aim", "forecast ", "outlook", "project", "estimate", "target" and similar expressions suggesting future outcomes or events to identify forward - looking stateme nts. The following table identifies the material forward - looking statements contained in this document, together with the materi al potential risks that we currently believe could cause actual results to differ materially from such forward - looking statements. Readers should also consider all of the risk factors which follow below the table: Material Forward - Looking Statement Material Potential Risks Related to Applicable Forward - Looking Statement Impact of the global semiconductor shortage Risks related to OEM actions in response to the semiconductor chip shortage such as unplanned shutdowns of production lines a nd/ or plants; reductions in OEM vehicle production plans; and changes to OEM product mix. These risks include: lower sales; production inefficiencies due to production lines being stopped/restarted unexpe ctedly based on OEMs' production schedules; premium freight costs to expedite shipments; and/or other unrecoverable costs; skilled labour attraction/retention; price increases from sub - suppliers that have been negatively impacted by production inefficiencies, premi um freight costs and/or other costs related to the semiconductor chip shortage Impact of inflation Commodity cost volatility Increase in our cost structure as a result of our inability to offset inflationary price increases through continuous improveme nt actions, price increases, adjustments to our own operations or otherwise Price increases or surcharges from sub - suppliers in connection with inflationary pressures they face Skilled labour attraction/retention Light Vehicle Production Light vehicle sales levels Supply disruptions, including as a result of the current semiconductor chip shortage Production allocation decisions by OEMs Total Sales Segment Sales Economic impact of COVID - 19 on consumer confidence Supply disruptions, including as a result of a semiconductor chip shortage currently being experienced in the industry; and C OVI D - 19 related lockdowns of large port hubs in China Elevated level of inflation Global energy shortages Concentration of sales with six customers Shifts in market shares among vehicles or vehicle segments Shifts in consumer "take rates" for products we sell Unconsolidated Sales Same risks as for Total Sales and Segment Sales above Risks related to conducting business through joint ventures Adjusted EBIT Margin Segment Adjusted EBIT Margin Net Income Attributable to Magna Same risks as for Total Sales and Segment Sales above Operational underperformance Higher costs incurred to mitigate the risk of supply disruptions, including: materials price increases; higher - priced substitut e supplies; premium freight costs to expedite shipments; production inefficiencies due to production lines being stopped/restarted unexpectedly based on customers' production schedules; other unrecoverable costs; an d p rice increases from sub - suppliers that have been negatively impacted by production inefficiencies Price concessions Commodity cost volatility Higher labour costs Tax risks Equity Income Same risks as Adjusted EBIT Margin/Segment Adjusted EBIT Margin/Net Income Attributable to Magna above Risks related to conducting business through joint ventures Free Cash Flow Same risks as for Total Sales/Segment Sales, and Adjusted EBIT Margin/Segment Adjusted EBIT Margin/Net Income Attributable to Ma gna above
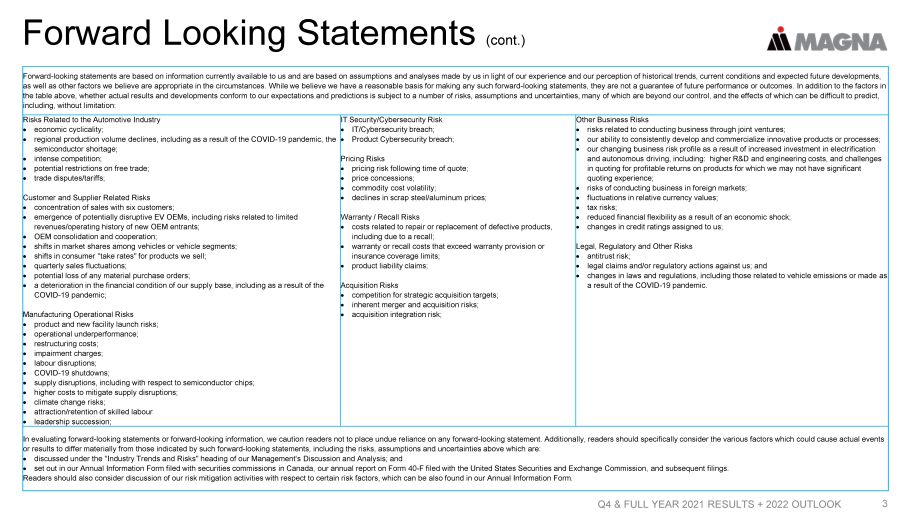
Forward Looking Statements (cont.) Q4 & FULL YEAR 2021 RESULTS + 2022 OUTLOOK 3 Forward - looking statements are based on information currently available to us and are based on assumptions and analyses made by us in light of our experience and our perception of historical trends, current conditions and expected future developments, as well as other factors we believe are appropriate in the circumstances. While we believe we have a reasonable basis for mak ing any such forward - looking statements, they are not a guarantee of future performance or outcomes. In addition to the factors in the table above, whether actual results and developments conform to our expectations and predictions is subject to a number o f r isks, assumptions and uncertainties, many of which are beyond our control, and the effects of which can be difficult to predi ct, including, without limitation: Risks Related to the Automotive Industry economic cyclicality; regional production volume declines, including as a result of the COVID - 19 pandemic, the semiconductor shortage; intense competition; potential restrictions on free trade; trade disputes/tariffs; Customer and Supplier Related Risks concentration of sales with six customers; emergence of potentially disruptive EV OEMs, including risks related to limited revenues/operating history of new OEM entrants; OEM consolidation and cooperation; shifts in market shares among vehicles or vehicle segments; shifts in consumer "take rates" for products we sell; quarterly sales fluctuations; potential loss of any material purchase orders; a deterioration in the financial condition of our supply base, including as a result of the COVID - 19 pandemic; Manufacturing Operational Risks product and new facility launch risks; operational underperformance; restructuring costs; impairment charges; labour disruptions; COVID - 19 shutdowns; supply disruptions, including with respect to semiconductor chips; higher costs to mitigate supply disruptions; climate change risks; attraction/retention of skilled labour leadership succession; IT Security/Cybersecurity Risk IT/Cybersecurity breach; Product Cybersecurity breach; Pricing Risks pricing risk following time of quote; price concessions; commodity cost volatility; declines in scrap steel/aluminum prices; Warranty / Recall Risks costs related to repair or replacement of defective products, including due to a recall; warranty or recall costs that exceed warranty provision or insurance coverage limits; product liability claims; Acquisition Risks competition for strategic acquisition targets; inherent merger and acquisition risks; acquisition integration risk; Other Business Risks risks related to conducting business through joint ventures; our ability to consistently develop and commercialize innovative products or processes; our changing business risk profile as a result of increased investment in electrification and autonomous driving, including: higher R&D and engineering costs, and challenges in quoting for profitable returns on products for which we may not have significant quoting experience; risks of conducting business in foreign markets; fluctuations in relative currency values; tax risks; reduced financial flexibility as a result of an economic shock; changes in credit ratings assigned to us; Legal, Regulatory and Other Risks antitrust risk; legal claims and/or regulatory actions against us; and changes in laws and regulations, including those related to vehicle emissions or made as a result of the COVID - 19 pandemic. In evaluating forward - looking statements or forward - looking information, we caution readers not to place undue reliance on any f orward - looking statement. Additionally, readers should specifically consider the various factors which could cause actual events or results to differ materially from those indicated by such forward - looking statements, including the risks, assumptions and un certainties above which are: discussed under the "Industry Trends and Risks" heading of our Management's Discussion and Analysis; and set out in our Annual Information Form filed with securities commissions in Canada, our annual report on Form 40 - F filed with th e United States Securities and Exchange Commission, and subsequent filings. Readers should also consider discussion of our risk mitigation activities with respect to certain risk factors, which can be als o found in our Annual Information Form.
4 Reminders All amounts are in U.S. Dollars Today's discussion excludes the impact of other expense (income), net ("Unusual Items") "Organic", in the context of sales movements, means "excluding the impact of foreign exchange, acquisitions and divestitures" Q4 & FULL YEAR 2021 RESULTS + 2022 OUTLOOK
5 Q4 & FULL YEAR 2021 RESULTS + 2022 OUTLOOK Agenda 2021 Highlights and Q4 2021 Operating Results 2022 Outlook Financial Strategy
2021 HIGHLIGHTS Q4 & FULL YEAR 2021 RESULTS + 2022 OUTLOOK 6
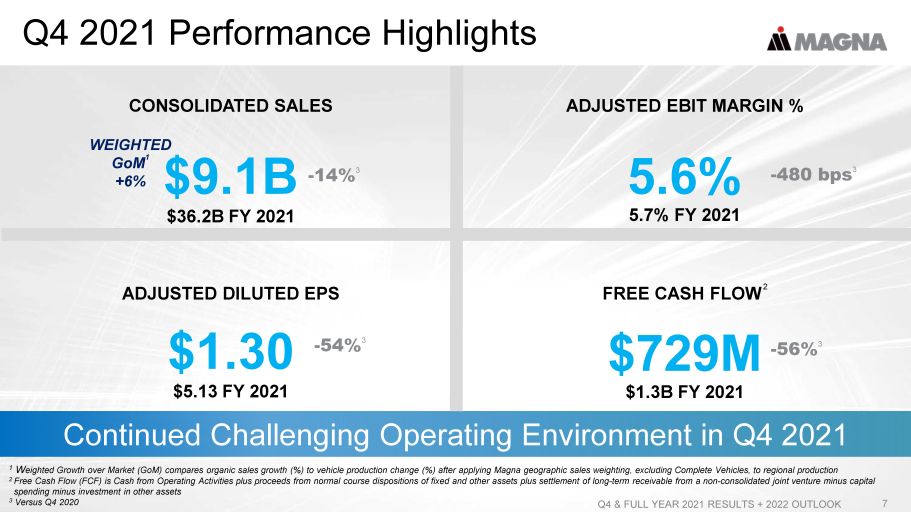
CONSOLIDATED SALES $9.1B Q4 2021 Performance Highlights Q4 & FULL YEAR 2021 RESULTS + 2022 OUTLOOK 7 Continued Challenging Operating Environment in Q4 2021 ADJUSTED EBIT MARGIN % 5.6% ADJUSTED DILUTED EPS $1.30 FREE CASH FLOW 2 $729M 1 W eighted Growth over Market ( GoM ) compares organic sales growth (%) to vehicle production change (%) after applying Magna geographic sales weighting, excludi ng Complete Vehicles, to regional production 2 Free Cash Flow (FCF) is Cash from Operating Activities plus proceeds from normal course dispositions of fixed and other asset s p lus settlement of long - term receivable from a non - consolidated joint venture minus capital spending minus investment in other assets 3 Versus Q4 2020 WEIGHTED GoM 1 +6% $36.2B FY 2021 - 14% 3 5.7% FY 2021 - 480 bps 3 $5.13 FY 2021 - 54% 3 $1.3B FY 2021 - 56% 3

2021 Accomplishments Q4 & FULL YEAR 2021 RESULTS + 2022 OUTLOOK 8 Continuing to keep our employees safe during pandemic Increased focus on Diversity & Inclusion Launched a number of new education programs 5th Straight Year Named to Forbes "World's Best Employers" Focus People
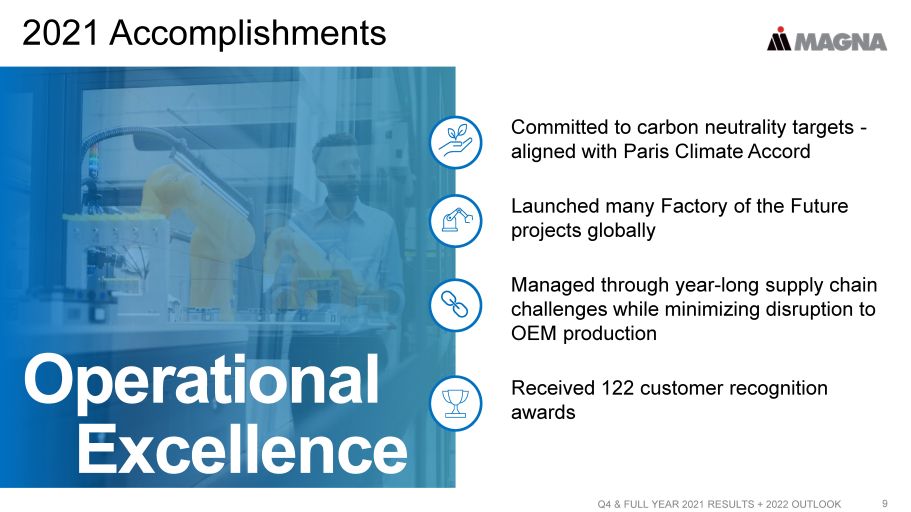
2021 Accomplishments Q4 & FULL YEAR 2021 RESULTS + 2022 OUTLOOK 9 Committed to carbon neutrality targets - aligned with Paris Climate Accord Launched many Factory of the Future projects globally Managed through year - long supply chain challenges while minimizing disruption to OEM production Received 122 customer recognition awards Excellence Operational
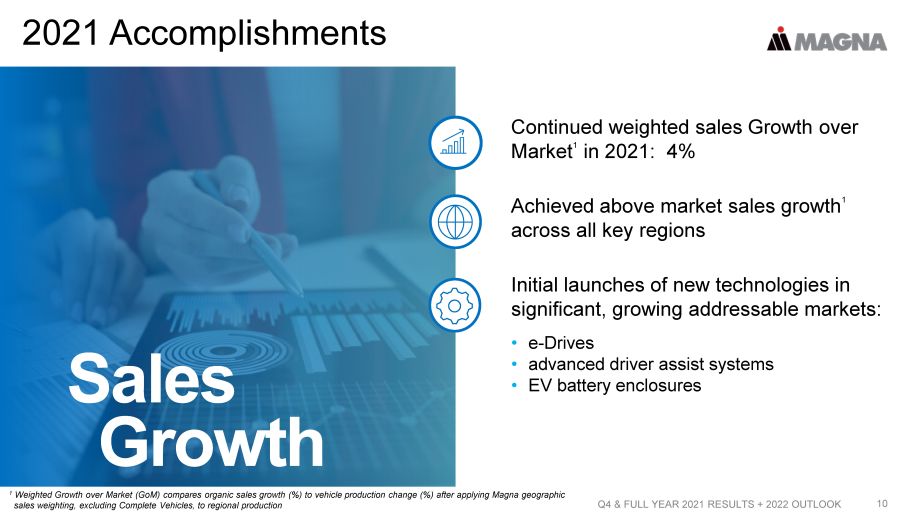
2021 Accomplishments Q4 & FULL YEAR 2021 RESULTS + 2022 OUTLOOK 10 Continued weighted sales Growth over Market 1 in 2021: 4% Achieved above market sales growth 1 across all key regions Initial launches of new technologies in significant, growing addressable markets: • e - Drives • advanced driver assist systems • EV battery enclosures Growth Sales 1 Weighted Growth over Market ( GoM ) compares organic sales growth (%) to vehicle production change (%) after applying Magna geographic sales weighting, excluding Complete Vehicles, to regional production
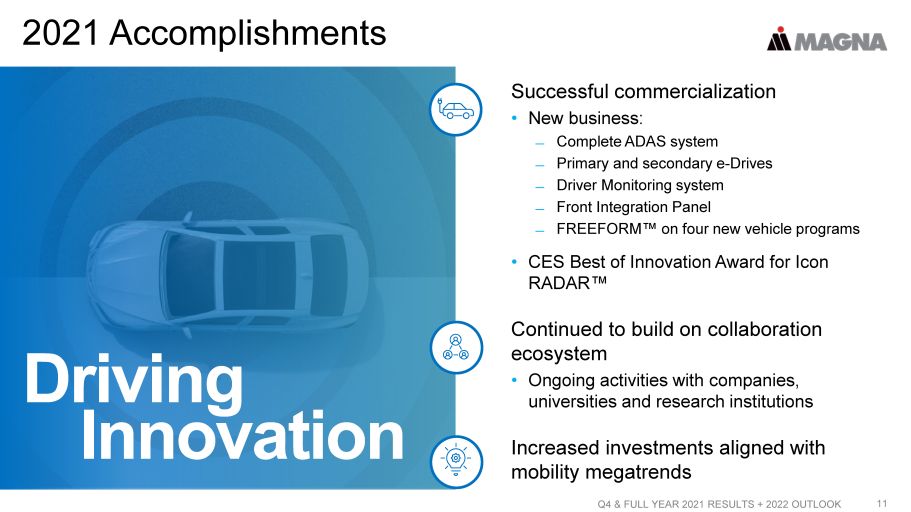
2021 Accomplishments Q4 & FULL YEAR 2021 RESULTS + 2022 OUTLOOK 11 Successful commercialization • New business: ̶ Complete ADAS system ̶ Primary and secondary e - Drives ̶ Driver Monitoring system ̶ Front Integration Panel ̶ FREEFORM Œ on four new vehicle programs • CES Best of Innovation Award for Icon RADAR Œ Continued to build on collaboration ecosystem • Ongoing activities with companies, universities and research institutions Increased investments aligned with mobility megatrends Innovation Driving
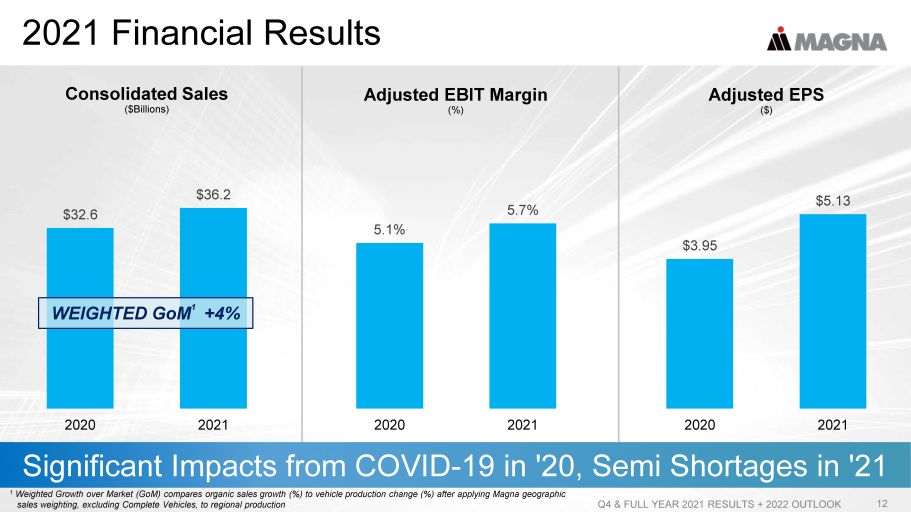
2021 Financial Results Q4 & FULL YEAR 2021 RESULTS + 2022 OUTLOOK 12 Significant Impacts from COVID - 19 in '20, Semi Shortages in '21 Adjusted EBIT Margin (%) 5.1% 5.7% 0.0% 1.0% 2.0% 3.0% 4.0% 5.0% 6.0% 7.0% 2020 2021 Consolidated Sales ($Billions) $32.6 $36.2 0.0 0.1 0.1 0.1 0.1 0.1 0.1 0.1 $0.0 $5.0 $10.0 $15.0 $20.0 $25.0 $30.0 $35.0 $40.0 2020 2021 Adjusted EPS ($) $3.95 $5.13 0.0 0.1 0.1 0.1 0.1 0.1 0.1 0.1 $0.00 $1.00 $2.00 $3.00 $4.00 $5.00 $6.00 2020 2021 1 Weighted Growth over Market ( GoM ) compares organic sales growth (%) to vehicle production change (%) after applying Magna geographic sales weighting, excluding Complete Vehicles, to regional production WEIGHTED GoM 1 +4%

Q4 2021 Financial Results Q4 & FULL YEAR 2021 RESULTS + 2022 OUTLOOK 13 Reflect Industry Environment Q4 2021, Exceptional Q4 2020 Adjusted EBIT ($Millions) $1,095 $508 $0 $200 $400 $600 $800 $1,000 Q4'20 Q4'21 Consolidated Sales ($Billions) $10.6 $9.1 0.0 0.1 0.1 0.1 0.1 0.1 0.1 0.1 $0.0 $2.0 $4.0 $6.0 $8.0 $10.0 $12.0 Q4'20 Q4'21 Adjusted EPS ($) $2.83 $1.30 0.0 0.1 0.1 0.1 0.1 0.1 0.1 0.1 $0.00 $0.50 $1.00 $1.50 $2.00 $2.50 $3.00 Q4'20 Q4'21 Q4'21 vs Q4'20 Prod'n Global - 17% Magna Weighted - 21% WEIGHTED GoM 1 +6% 1 Weighted Growth over Market ( GoM ) compares organic sales growth (%) to vehicle production change (%) after applying Magna geographic sales weighting, excluding Complete Vehicles, to regional production
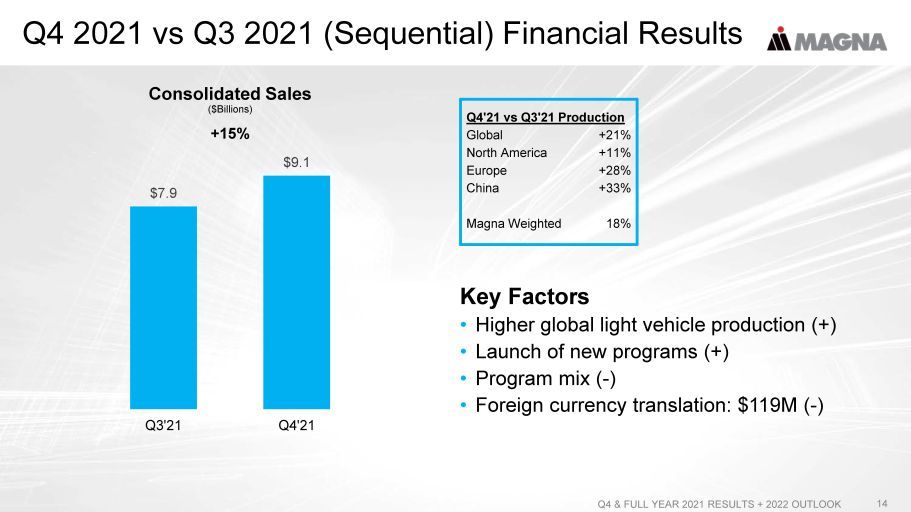
Q4 2021 vs Q3 2021 (Sequential) Financial Results Q4 & FULL YEAR 2021 RESULTS + 2022 OUTLOOK 14 Key Factors • Higher global light vehicle production (+) • Launch of new programs (+) • Program mix ( - ) • Foreign currency translation: $119M ( - ) Q4'21 vs Q3'21 Production Global +21% North America +11% Europe +28% China +33% Magna Weighted 18% Consolidated Sales ($Billions) +15% $7.9 $9.1 0.0 0.1 0.1 0.1 0.1 0.1 0.1 0.1 $0.0 $1.0 $2.0 $3.0 $4.0 $5.0 $6.0 $7.0 $8.0 $9.0 $10.0 Q3'21 Q4'21
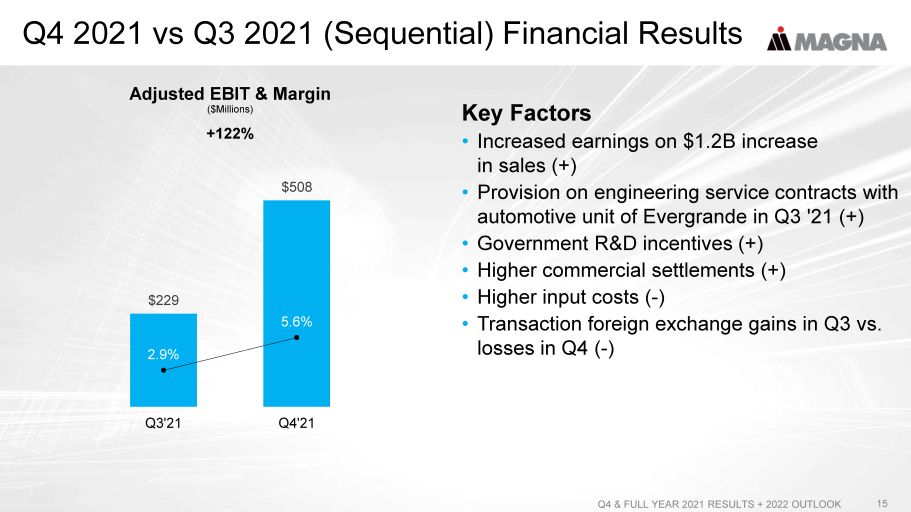
Q4 2021 vs Q3 2021 (Sequential) Financial Results Q4 & FULL YEAR 2021 RESULTS + 2022 OUTLOOK 15 Key Factors • Increased earnings on $1.2B increase in sales (+) • Provision on engineering service contracts with automotive unit of Evergrande in Q3 '21 (+) • Government R&D incentives (+) • Higher commercial settlements (+) • Higher input costs ( - ) • Transaction foreign exchange gains in Q3 vs. losses in Q4 ( - ) Adjusted EBIT & Margin ($Millions) +122% $229 $508 2.9% 5.6% 0.0 0.0 0.1 0.1 0.2 $0 $100 $200 $300 $400 $500 $600 Q3'21 Q4'21
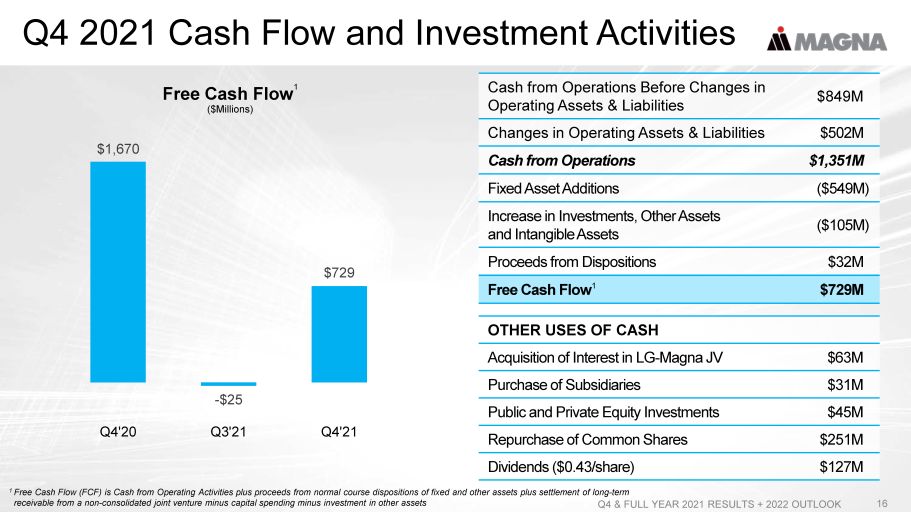
Q4 2021 Cash Flow and Investment Activities Q4 & FULL YEAR 2021 RESULTS + 2022 OUTLOOK 16 Free Cash Flow 1 ($Millions) $1,670 - $25 $729 0.0 0.1 0.1 0.1 0.1 0.1 0.1 0.1 -$250 -$50 $150 $350 $550 $750 $950 $1,150 $1,350 $1,550 Q4'20 Q3'21 Q4'21 OTHER USES OF CASH Acquisition of Interest in LG - Magna JV $63M Purchase of Subsidiaries $31M Public and Private Equity Investments $45M Repurchase of Common Shares $251M Dividends ($0.43/share) $127M Cash from Operations Before Changes in Operating Assets & Liabilities $849M Changes in Operating Assets & Liabilities $502M Cash from Operations $1,351M Fixed Asset Additions ($549M) Increase in Investments, Other Assets and Intangible Assets ($105M) Proceeds from Dispositions $32M Free Cash Flow 1 $729M 1 Free Cash Flow (FCF) is Cash from Operating Activities plus proceeds from normal course dispositions of fixed and other asset s p lus settlement of long - term receivable from a non - consolidated joint venture minus capital spending minus investment in other assets
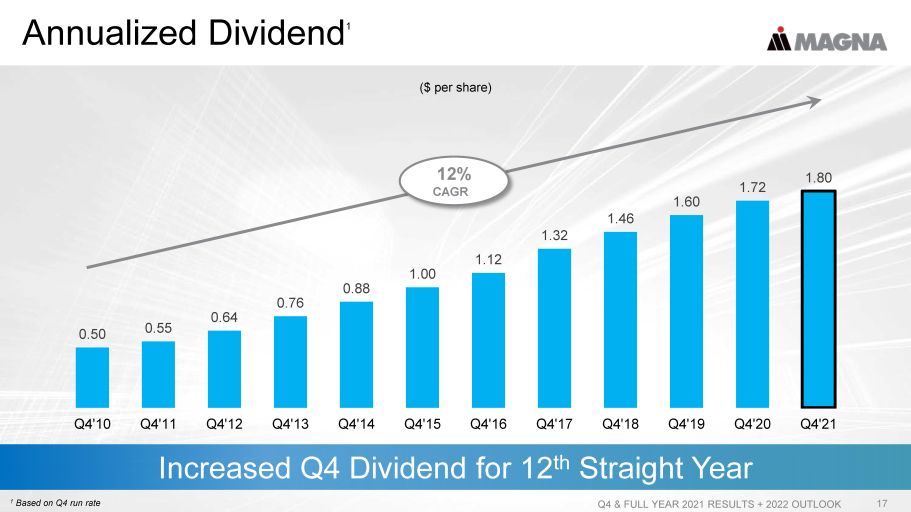
Annualized Dividend 1 Q4 & FULL YEAR 2021 RESULTS + 2022 OUTLOOK 17 Increased Q4 Dividend for 12 th Straight Year 1 Based on Q4 run rate 0.50 0.55 0.64 0.76 0.88 1.00 1.12 1.32 1.46 1.60 1.72 1.80 0.0 0.1 0.1 0.1 0.1 0.1 0.1 0.1 0.00 0.20 0.40 0.60 0.80 1.00 1.20 1.40 1.60 1.80 2.00 Q4'10 Q4'11 Q4'12 Q4'13 Q4'14 Q4'15 Q4'16 Q4'17 Q4'18 Q4'19 Q4'20 Q4'21 ($ per share) 12% CAGR

2022 OUTLOOK Q4 & FULL YEAR 2021 RESULTS + 2022 OUTLOOK 18
Outlook Reflects Our Go Forward Strategy Q4 & FULL YEAR 2021 RESULTS + 2022 OUTLOOK 19 Accelerate Deployment of Capital towards High - Growth Areas Drive Operational Excellence Unlock New Business Models and Markets
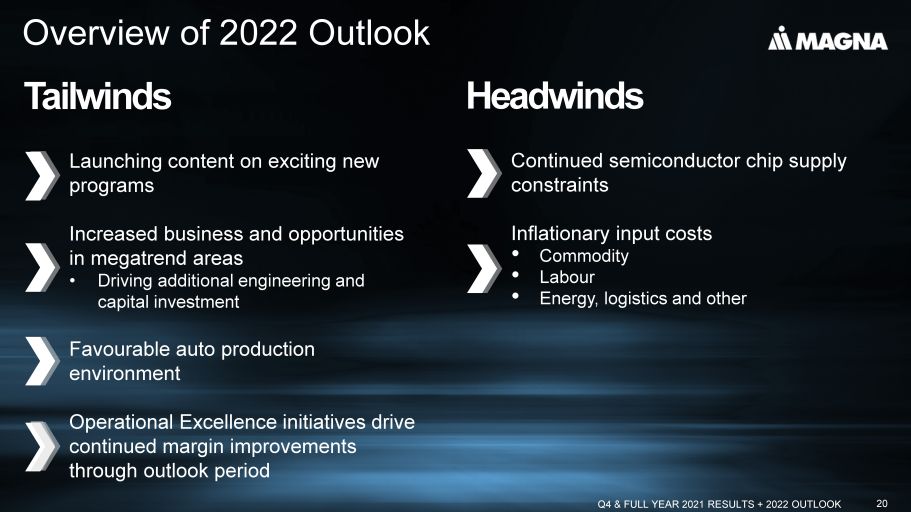
Q4 & FULL YEAR 2021 RESULTS + 2022 OUTLOOK 20 Overview of 2022 Outlook Headwinds Continued semiconductor chip supply constraints Inflationary input costs • Commodity • Labour • Energy, logistics and other Tailwinds Launching content on exciting new programs Increased business and opportunities in megatrend areas • Driving additional engineering and capital investment Favourable auto production environment Operational Excellence initiatives drive continued margin improvements through outlook period
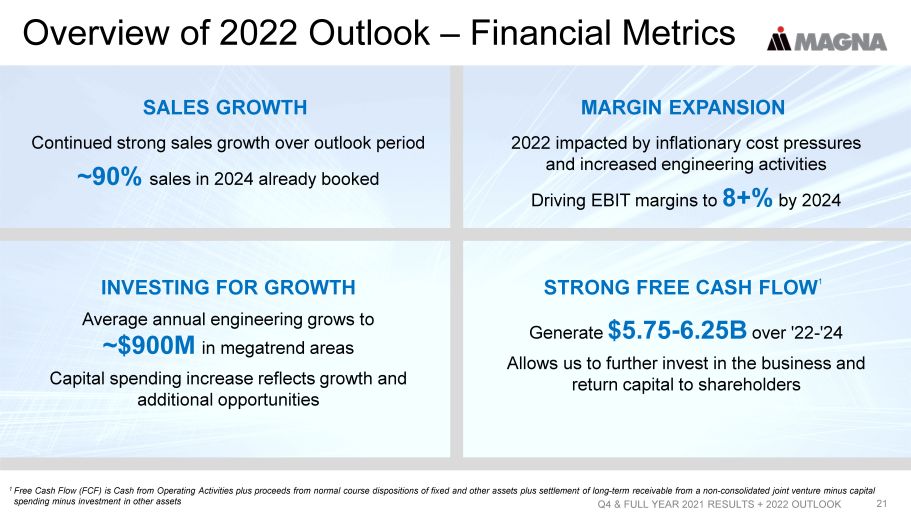
SALES GROWTH Overview of 2022 Outlook – Financial Metrics Q4 & FULL YEAR 2021 RESULTS + 2022 OUTLOOK 21 MARGIN EXPANSION INVESTING FOR GROWTH STRONG FREE CASH FLOW 1 1 Free Cash Flow (FCF) is Cash from Operating Activities plus proceeds from normal course dispositions of fixed and other asset s p lus settlement of long - term receivable from a non - consolidated joint venture minus capital spending minus investment in other assets Continued strong sales growth over outlook period ~90% sales in 2024 already booked Generate $5.75 - 6.25B over '22 - '24 Allows us to further invest in the business and return capital to shareholders Average annual engineering grows to ~$900M in megatrend areas Capital spending increase reflects growth and additional opportunities 2022 impacted by inflationary cost pressures and increased engineering activities Driving EBIT margins to 8+% by 2024
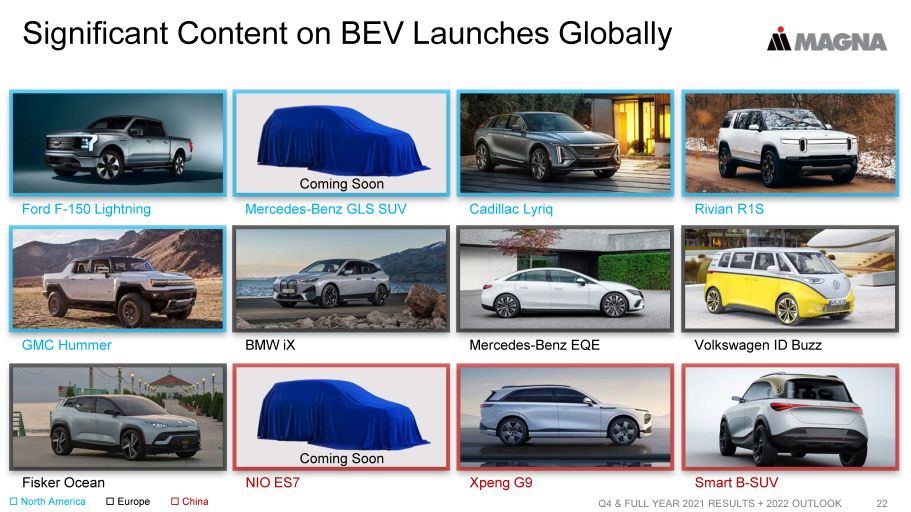
22 Q4 & FULL YEAR 2021 RESULTS + 2022 OUTLOOK Ford F - 150 Lightning Mercedes - Benz GLS SUV Cadillac Lyriq GMC Hummer BMW iX Mercedes - Benz EQE Significant Content on BEV Launches Globally Rivian R1S Volkswagen ID Buzz Fisker Ocean NIO ES7 Xpeng G9 Smart B - SUV Coming Soon North America Europe China Coming Soon
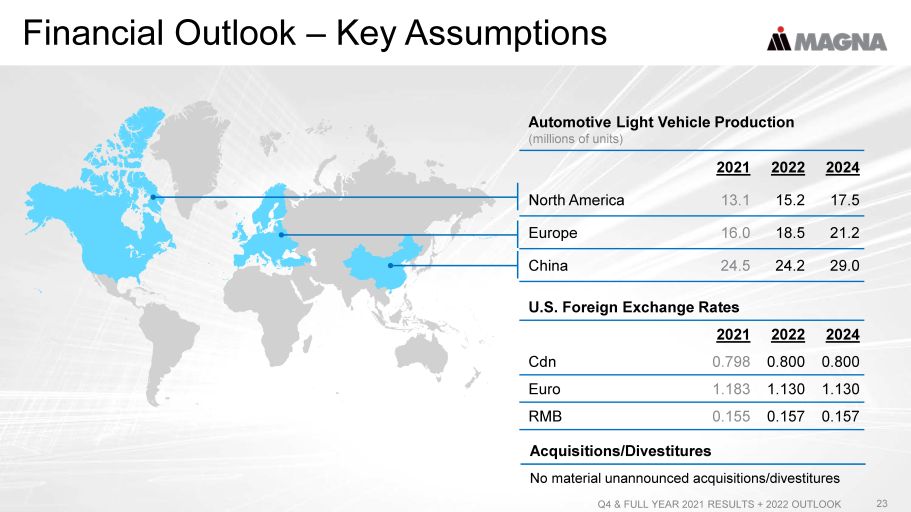
Financial Outlook – Key Assumptions Q4 & FULL YEAR 2021 RESULTS + 2022 OUTLOOK 23 Automotive Light Vehicle Production (millions of units) 2021 2022 2024 North America 13.1 15.2 17.5 Europe 16.0 18.5 21.2 China 24.5 24.2 29.0 U.S. Foreign Exchange Rates 2021 2022 2024 Cdn 0.798 0.800 0.800 Euro 1.183 1.130 1.130 RMB 0.155 0.157 0.157 Acquisitions/Divestitures No material unannounced acquisitions/divestitures

CONSOLIDATED OUTLOOK Q4 & FULL YEAR 2021 RESULTS + 2022 OUTLOOK 24
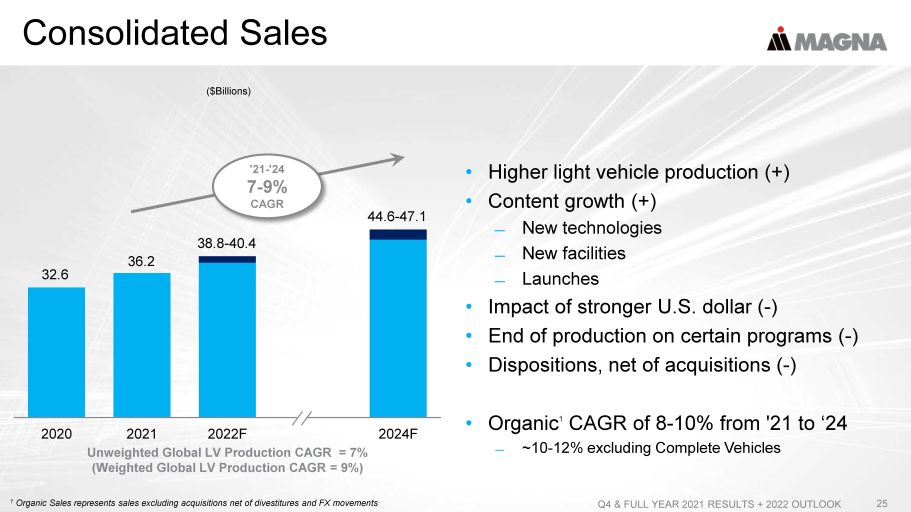
Consolidated Sales Q4 & FULL YEAR 2021 RESULTS + 2022 OUTLOOK 25 2020 2021 2022F 2024F • Higher light vehicle production (+) • Content growth (+) ̶ New technologies ̶ New facilities ̶ Launches • Impact of stronger U.S. dollar ( - ) • End of production on certain programs ( - ) • Dispositions, net of acquisitions ( - ) • Organic 1 CAGR of 8 - 10% from '21 to ‘24 ̶ ~10 - 12% excluding Complete Vehicles 32.6 Unweighted Global LV Production CAGR = 7% (Weighted Global LV Production CAGR = 9%) ($Billions) '21 - '24 7 - 9% CAGR 36.2 38.8 - 40.4 44.6 - 47.1 1 Organic Sales represents sales excluding acquisitions net of divestitures and FX movements
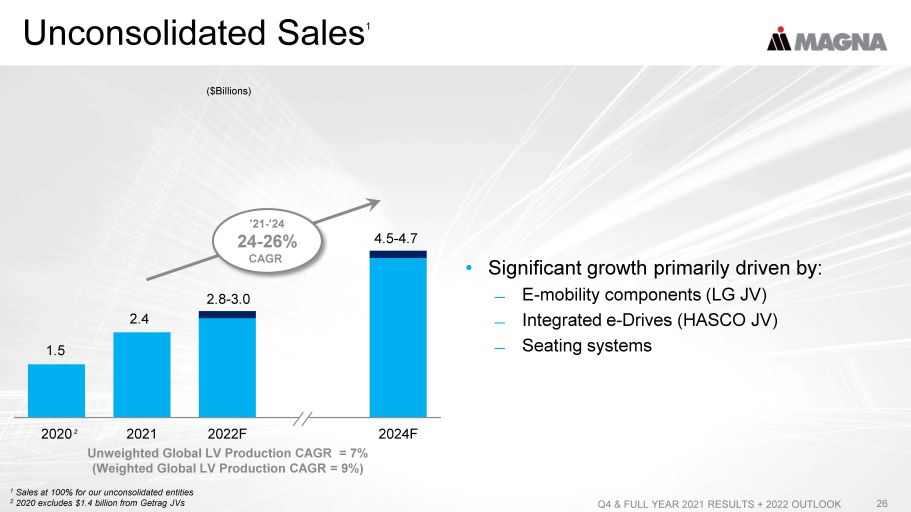
Q4 & FULL YEAR 2021 RESULTS + 2022 OUTLOOK 26 2020 2021 2022F 2024F • Significant growth primarily driven by: ̶ E - mobility components (LG JV) ̶ Integrated e - Drives (HASCO JV) ̶ Seating systems 1 Sales at 100% for our unconsolidated entities 2 2020 excludes $1. 4 billion from Getrag JVs 1.5 Unweighted Global LV Production CAGR = 7% (Weighted Global LV Production CAGR = 9%) ($Billions) 2.4 2.8 - 3.0 4.5 - 4.7 2 '21 - '24 24 - 26% CAGR Unconsolidated Sales 1
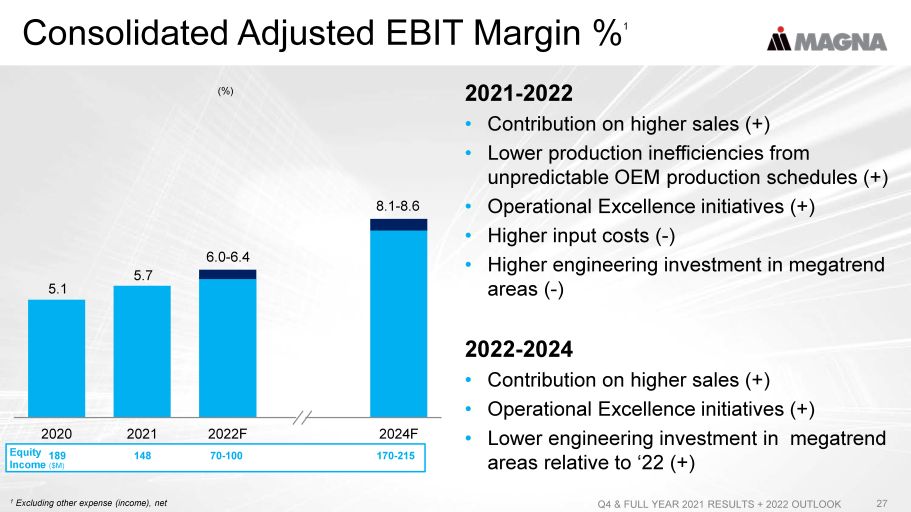
Consolidated Adjusted EBIT Margin % 1 Q4 & FULL YEAR 2021 RESULTS + 2022 OUTLOOK 27 2020 2021 2022F 2024F 2021 - 2022 • Contribution on higher sales (+) • Lower production inefficiencies from unpredictable OEM production schedules (+) • Operational Excellence initiatives (+) • Higher input costs ( - ) • Higher engineering investment in megatrend areas ( - ) 2022 - 2024 • Contribution on higher sales (+) • Operational Excellence initiatives (+) • Lower engineering investment in megatrend areas relative to ‘22 (+) 1 Excluding other expense (income), net 5.1 Equity Income ($M) 189 148 170 - 215 70 - 100 5.7 6.0 - 6.4 8.1 - 8.6 (%)

SEGMENT OUTLOOK Q4 & FULL YEAR 2021 RESULTS + 2022 OUTLOOK 28
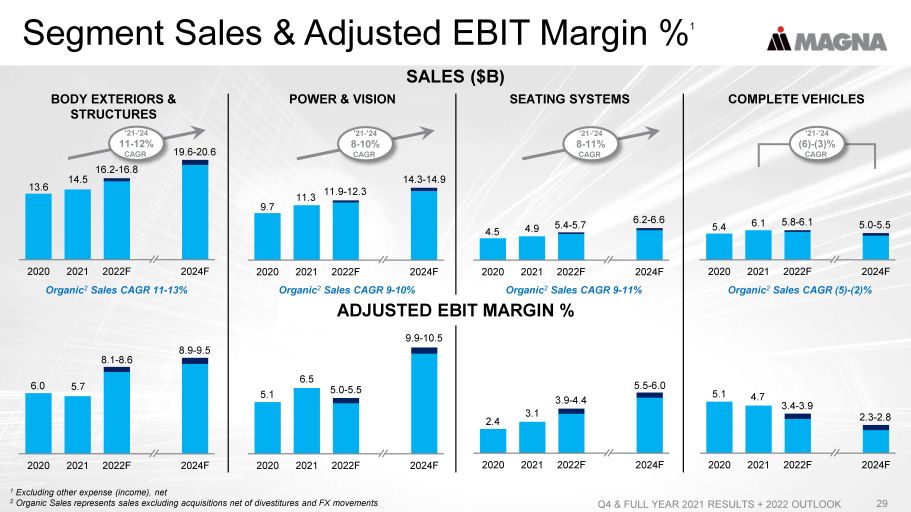
Segment Sales & Adjusted EBIT Margin % 1 Q4 & FULL YEAR 2021 RESULTS + 2022 OUTLOOK 29 1 Excluding other expense (income), net 2 Organic Sales represents sales excluding acquisitions net of divestitures and FX movements BODY EXTERIORS & STRUCTURES 2020 2021 2022F 2024F 6.0 5.7 8.1 - 8.6 8.9 - 9.5 POWER & VISION 2020 2021 2022F 2024F 9.7 11.3 11.9 - 12.3 14.3 - 14.9 '21 - '24 8 - 10% CAGR SEATING SYSTEMS 2020 2021 2022F 2024F 4.5 4.9 5.4 - 5.7 6.2 - 6.6 '21 - '24 8 - 11% CAGR 2020 2021 2022F 2024F 2.4 3.1 3.9 - 4.4 5.5 - 6.0 2020 2021 2022F 2024F 5.1 6.5 5.0 - 5.5 9.9 - 10.5 COMPLETE VEHICLES 2020 2021 2022F 2024F 5.4 6.1 5.8 - 6.1 5.0 - 5.5 '21 - '24 (6) - (3)% CAGR 2020 2021 2022F 2024F 5.1 4.7 3.4 - 3.9 2.3 - 2.8 2020 2021 2022F 2024F 13.6 14.5 16.2 - 16.8 19.6 - 20.6 '21 - '24 11 - 12% CAGR SALES ($B) ADJUSTED EBIT MARGIN % Organic 2 Sales CAGR 11 - 13% Organic 2 Sales CAGR 9 - 10% Organic 2 Sales CAGR 9 - 11% Organic 2 Sales CAGR (5) - (2)%

FINANCIAL STRATEGY Q4 & FULL YEAR 2021 RESULTS + 2022 OUTLOOK 30
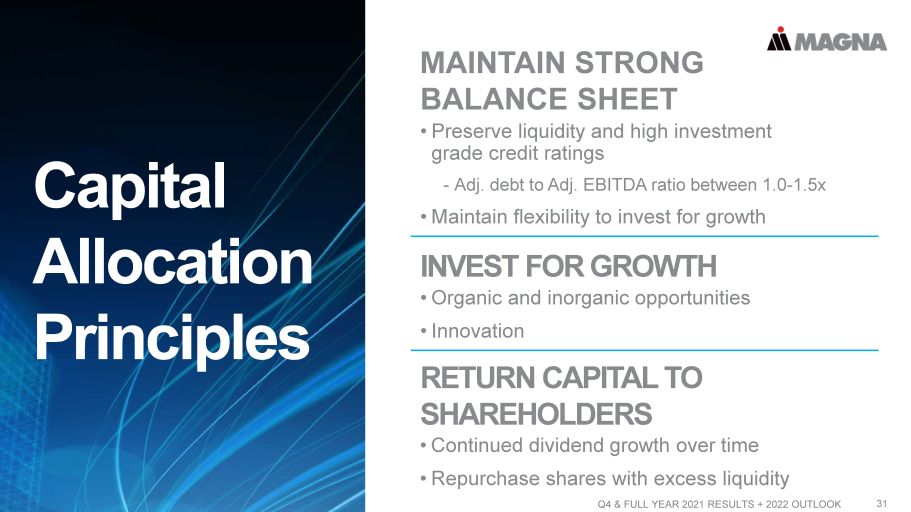
MAINTAIN STRONG BALANCE SHEET • Preserve liquidity and high investment grade credit ratings - Adj. debt to Adj. EBITDA ratio between 1.0 - 1.5x • Maintain flexibility to invest for growth INVEST FOR GROWTH • Organic and inorganic opportunities • Innovation RETURN CAPITAL TO SHAREHOLDERS Capital Allocation Principles • Continued dividend growth over time • Repurchase shares with excess liquidity Q4 & FULL YEAR 2021 RESULTS + 2022 OUTLOOK 31
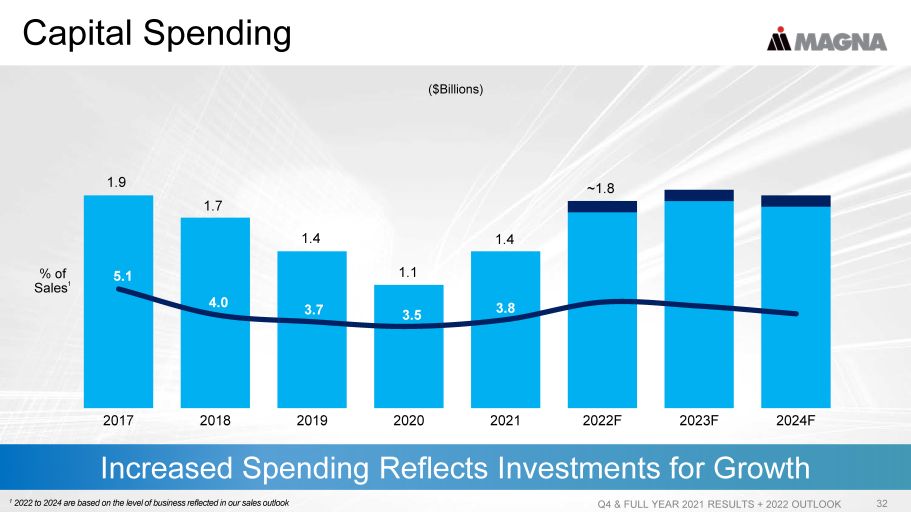
Capital Spending Q4 & FULL YEAR 2021 RESULTS + 2022 OUTLOOK 32 Increased Spending Reflects Investments for Growth 1 2022 to 2024 are based on the level of business reflected in our sales outlook ($Billions) 2017 2018 2019 2020 2021 2022F 2023F 2024F 1.9 1.4 % of Sales 1 5.1 3.7 1.1 1.4 3.5 ~1.8 3.5 1.7 4.0 3.8
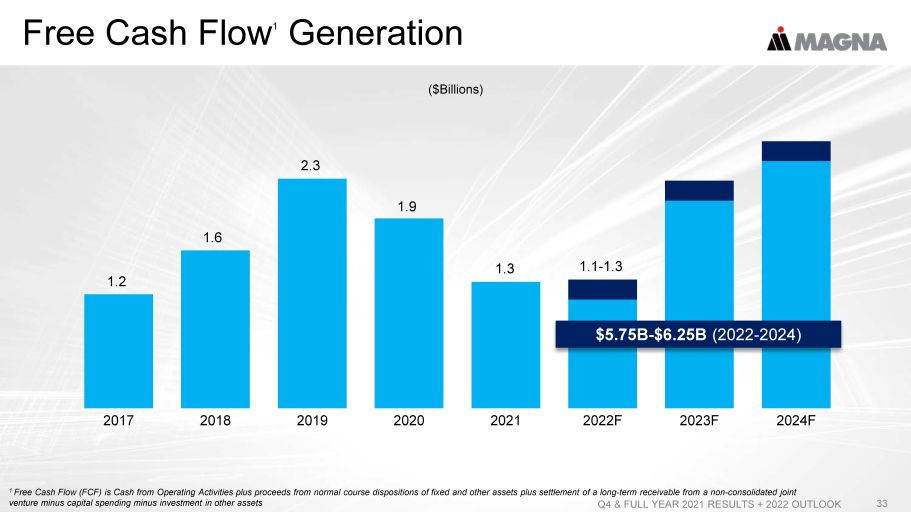
Free Cash Flow 1 Generation Q4 & FULL YEAR 2021 RESULTS + 2022 OUTLOOK 33 1 Free Cash Flow (FCF) is Cash from Operating Activities plus proceeds from normal course dispositions of fixed and other asset s p lus settlement of a long - term receivable from a non - consolidated joint venture minus capital spending minus investment in other assets 2017 2018 2019 2020 2021 2022F 2023F 2024F 2.3 ($Billions) $5.75B - $6.25B (2022 - 2024) 1.1 - 1.3 1.9 1.2 1.6 1.3
In Summary Q4 & FULL YEAR 2021 RESULTS + 2022 OUTLOOK 34 Continued strong sales growth Margin expansion through outlook period Solid free cash flow generation Accelerating investments to support growth in megatrend areas % $ Executing Our Go Forward Strategy
Appendix - Q4 - 2021 Results Q4 & FULL YEAR 2021 RESULTS + 2022 OUTLOOK 35
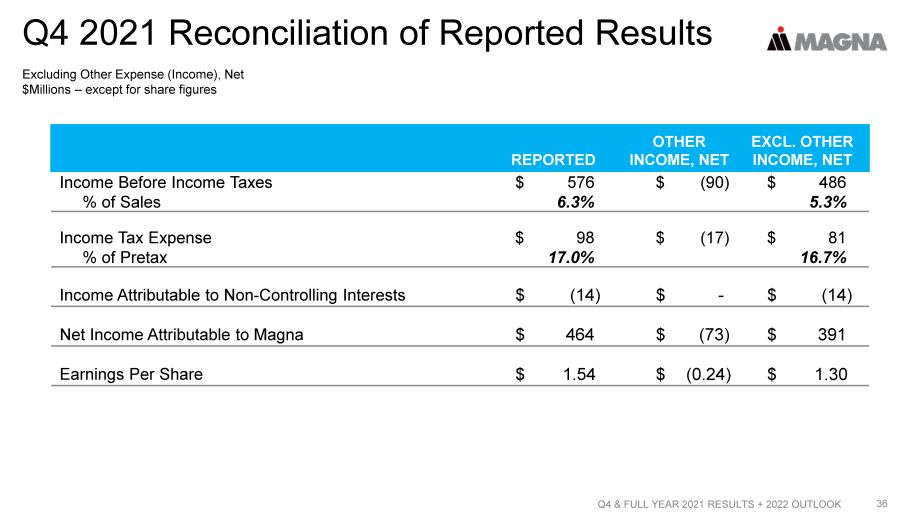
Q4 2021 Reconciliation of Reported Results 36 REPORTED OTHER INCOME, NET EXCL. OTHER INCOME, NET Income Before Income Taxes $ 576 $ (90) $ 486 % of Sales 6.3% 5.3% Income Tax Expense $ 98 $ (17) $ 81 % of Pretax 17.0% 16.7% Income Attributable to Non - Controlling Interests $ (14) $ - $ (14) Net Income Attributable to Magna $ 464 $ (73) $ 391 Earnings Per Share $ 1.54 $ (0.24) $ 1.30 Excluding Other Expense (Income), Net $Millions – except for share figures Q4 & FULL YEAR 2021 RESULTS + 2022 OUTLOOK
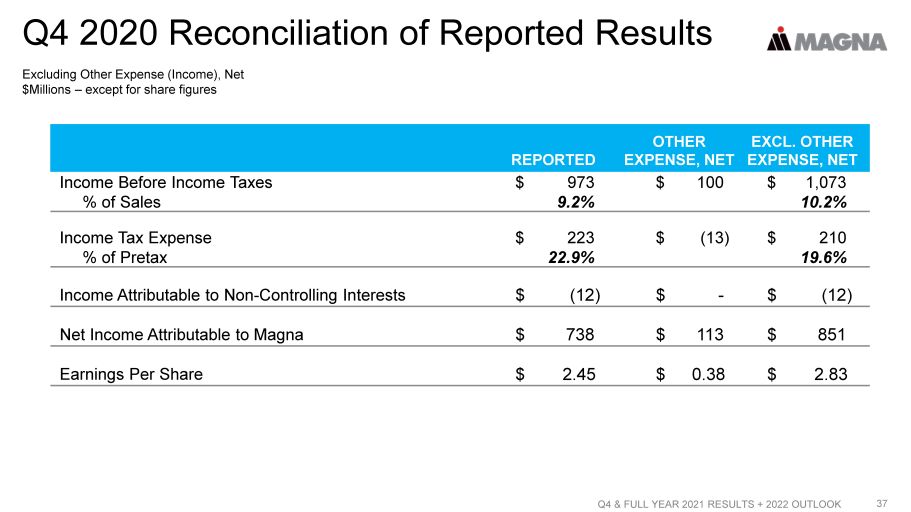
Q4 2020 Reconciliation of Reported Results 37 REPORTED OTHER EXPENSE, NET EXCL. OTHER EXPENSE, NET Income Before Income Taxes $ 973 $ 100 $ 1,073 % of Sales 9.2% 10.2% Income Tax Expense $ 223 $ (13) $ 210 % of Pretax 22.9% 19.6% Income Attributable to Non - Controlling Interests $ (12) $ - $ (12) Net Income Attributable to Magna $ 738 $ 113 $ 851 Earnings Per Share $ 2.45 $ 0.38 $ 2.83 Excluding Other Expense (Income), Net $Millions – except for share figures Q4 & FULL YEAR 2021 RESULTS + 2022 OUTLOOK
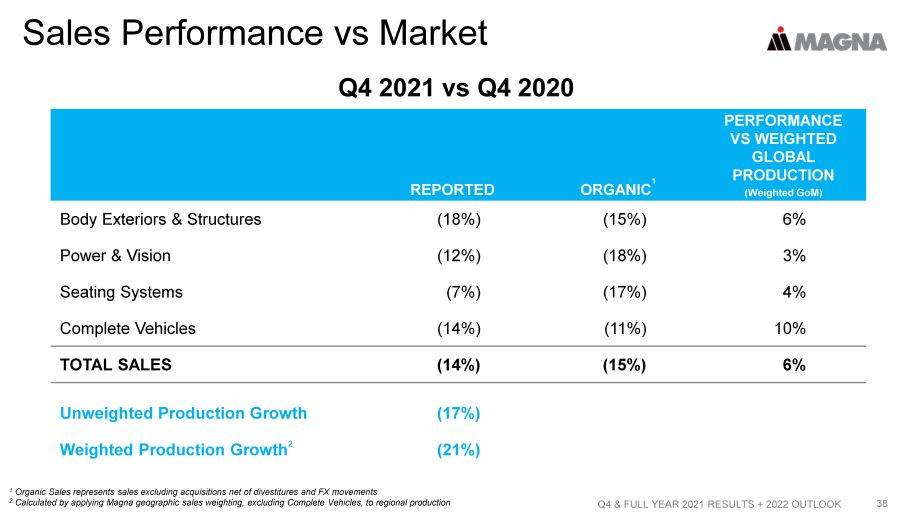
Sales Performance vs Market 38 REPORTED ORGANIC 1 PERFORMANCE VS WEIGHTED GLOBAL PRODUCTION (Weighted GoM) Body Exteriors & Structures (18%) (15%) 6% Power & Vision (12%) (18%) 3% Seating Systems (7%) (17%) 4% Complete Vehicles (14%) (11%) 10% TOTAL SALES (14%) (15%) 6% Unweighted Production Growth (17%) Weighted Production Growth 2 (21%) 1 Organic Sales represents sales excluding acquisitions net of divestitures and FX movements 2 Calculated by applying Magna geographic sales weighting, excluding Complete Vehicles, to regional production Q4 2021 vs Q4 2020 Q4 & FULL YEAR 2021 RESULTS + 2022 OUTLOOK
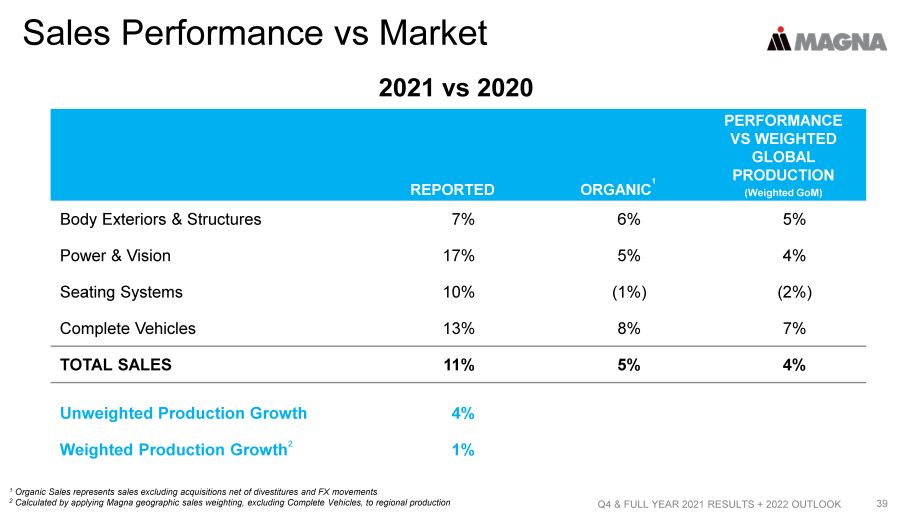
Sales Performance vs Market 39 REPORTED ORGANIC 1 PERFORMANCE VS WEIGHTED GLOBAL PRODUCTION (Weighted GoM) Body Exteriors & Structures 7% 6% 5% Power & Vision 17% 5% 4% Seating Systems 10% (1%) (2%) Complete Vehicles 13% 8% 7% TOTAL SALES 11% 5% 4% Unweighted Production Growth 4% Weighted Production Growth 2 1% 1 Organic Sales represents sales excluding acquisitions net of divestitures and FX movements 2 Calculated by applying Magna geographic sales weighting, excluding Complete Vehicles, to regional production 2021 vs 2020 Q4 & FULL YEAR 2021 RESULTS + 2022 OUTLOOK
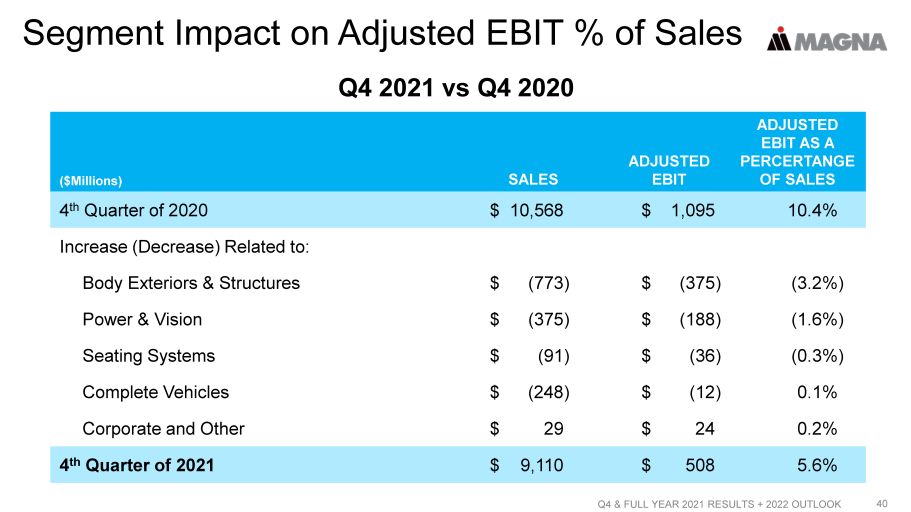
Segment Impact on Adjusted EBIT % of Sales 40 ($Millions) SALES ADJUSTED EBIT ADJUSTED EBIT AS A PERCERTANGE OF SALES 4 th Quarter of 2020 $ 10,568 $ 1,095 10.4% Increase (Decrease) Related to: Body Exteriors & Structures $ (773) $ (375) (3.2%) Power & Vision $ (375) $ (188) (1.6%) Seating Systems $ (91) $ (36) (0.3%) Complete Vehicles $ (248) $ (12) 0.1% Corporate and Other $ 29 $ 24 0.2% 4 th Quarter of 2021 $ 9,110 $ 508 5.6% Q4 2021 vs Q4 2020 Q4 & FULL YEAR 2021 RESULTS + 2022 OUTLOOK
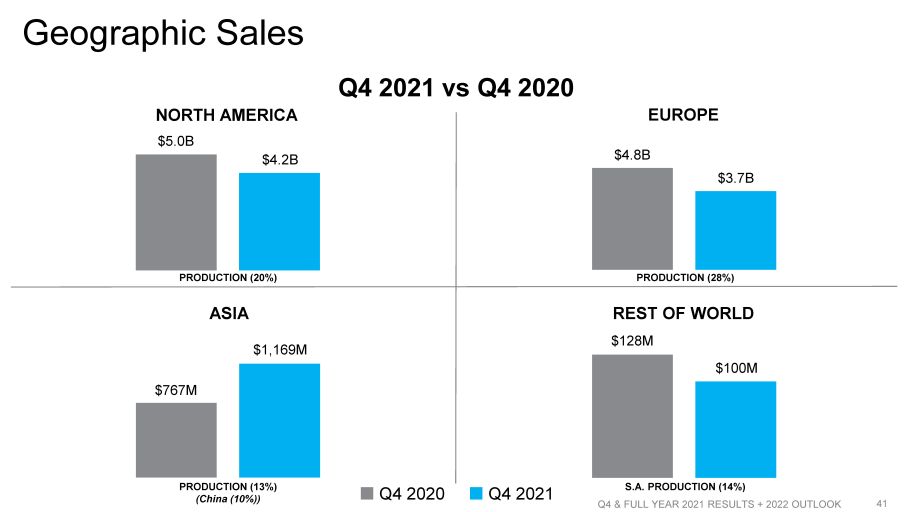
Q4 & FULL YEAR 2021 RESULTS + 2022 OUTLOOK 41 Geographic Sales Q4 2020 Q4 2021 NORTH AMERICA $5.0B $4.2B PRODUCTION (20%) EUROPE $4.8B $3.7B PRODUCTION (28%) ASIA $767M $1,169M PRODUCTION (13%) (China (10%)) REST OF WORLD $128M $100M S.A. PRODUCTION (14%) Q4 2021 vs Q4 2020
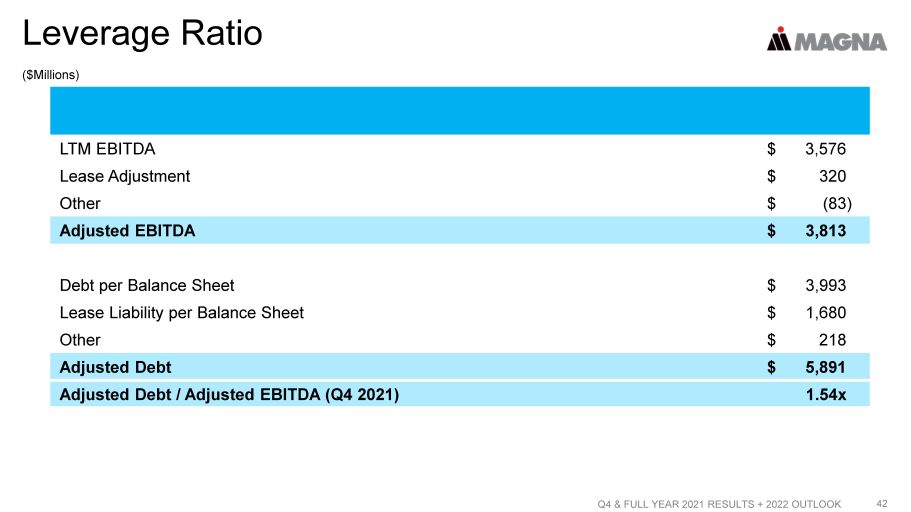
($Millions) Leverage Ratio 42 LTM EBITDA $ 3,576 Lease Adjustment $ 320 Other $ (83) Adjusted EBITDA $ 3,813 Debt per Balance Sheet $ 3,993 Lease Liability per Balance Sheet $ 1,680 Other $ 218 Adjusted Debt $ 5,891 Adjusted Debt / Adjusted EBITDA (Q4 2021) 1.54x Q4 & FULL YEAR 2021 RESULTS + 2022 OUTLOOK
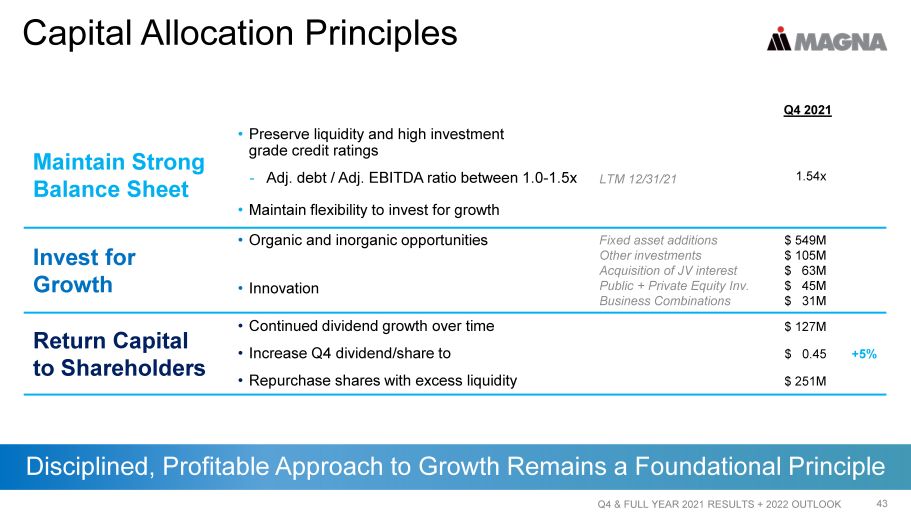
Capital Allocation Principles Q4 & FULL YEAR 2021 RESULTS + 2022 OUTLOOK 43 Disciplined, Profitable Approach to Growth Remains a Foundational Principle Q4 2021 Maintain Strong Balance Sheet • Preserve liquidity and high investment grade credit ratings - Adj. debt / Adj. EBITDA ratio between 1.0 - 1.5x LTM 12/31/21 1.54x • Maintain flexibility to invest for growth Invest for Growth • Organic and inorganic opportunities Fixed asset additions Other investments Acquisition of JV interest Public + Private Equity Inv. Business Combinations $ 549M $ 105M $ 63M $ 45M $ 31M • Innovation Return Capital to Shareholders • Continued dividend growth over time $ 127M • Increase Q4 dividend/share to $ 0.45 +5% • Repurchase shares with excess liquidity $ 251M
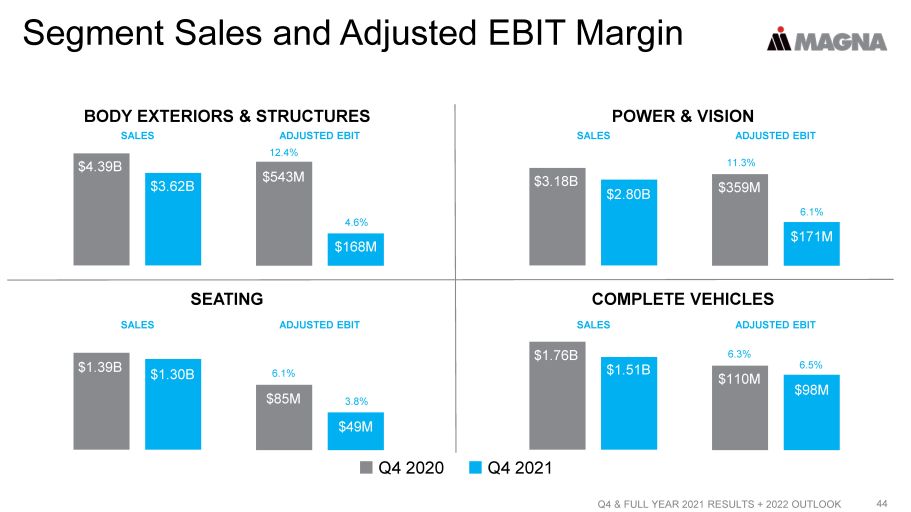
Segment Sales and Adjusted EBIT Margin Q4 & FULL YEAR 2021 RESULTS + 2022 OUTLOOK 44 Q4 2020 Q4 2021 BODY EXTERIORS & STRUCTURES $4.39B $3.62B SALES ADJUSTED EBIT $543M $168M 12.4% 4.6% SEATING $1.39B $1.30B SALES ADJUSTED EBIT $85M $49M 6.1% 3.8% POWER & VISION $3.18B $2.80B SALES ADJUSTED EBIT $359M $171M 11.3% 6.1% COMPLETE VEHICLES $1.76B $1.51B SALES ADJUSTED EBIT $110M $98M 6.3% 6.5%
Appendix - Outlook Q4 & FULL YEAR 2021 RESULTS + 2022 OUTLOOK 45
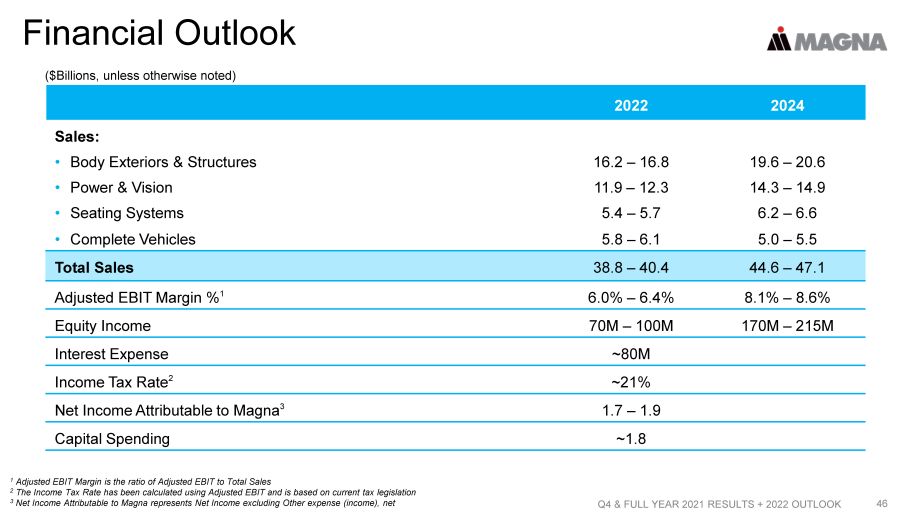
Financial Outlook 46 2022 2024 Sales: • Body Exteriors & Structures 16.2 – 16.8 19.6 – 20.6 • Power & Vision 11.9 – 12.3 14.3 – 14.9 • Seating Systems 5.4 – 5.7 6.2 – 6.6 • Complete Vehicles 5.8 – 6.1 5.0 – 5.5 Total Sales 38.8 – 40.4 44.6 – 47.1 Adjusted EBIT Margin % 1 6.0% – 6.4% 8.1% – 8.6% Equity Income 70M – 100M 170M – 215M Interest Expense ~80M Income Tax Rate 2 ~21% Net Income Attributable to Magna 3 1.7 – 1.9 Capital Spending ~1.8 1 Adjusted EBIT Margin is the ratio of Adjusted EBIT to Total Sales 2 The Income Tax Rate has been calculated using Adjusted EBIT and is based on current tax legislation 3 Net Income Attributable to Magna represents Net Income excluding Other expense (income), net ($Billions, unless otherwise noted) Q4 & FULL YEAR 2021 RESULTS + 2022 OUTLOOK
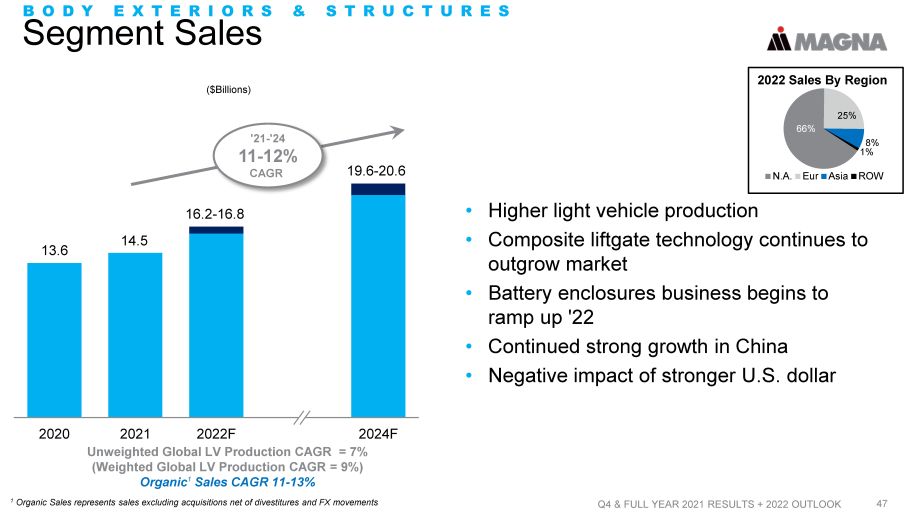
Segment Sales Q4 & FULL YEAR 2021 RESULTS + 2022 OUTLOOK 47 • Higher light vehicle production • Composite liftgate technology continues to outgrow market • Battery enclosures business begins to ramp up '22 • Continued strong growth in China • Negative impact of stronger U.S. dollar 2020 2021 2022F 2024F BODY EXTERIORS & STRUCTURES N.A. Eur Asia ROW 2022 Sales By Region 1% 8% 25% 66% ($Billions) Unweighted Global LV Production CAGR = 7% (Weighted Global LV Production CAGR = 9%) Organic 1 Sales CAGR 11 - 13% 13.6 14.5 16.2 - 16.8 19.6 - 20.6 '21 - '24 11 - 12% CAGR 1 Organic Sales represents sales excluding acquisitions net of divestitures and FX movements

Segment Adjusted EBIT Margin % 1 Q4 & FULL YEAR 2021 RESULTS + 2022 OUTLOOK 48 2020 2021 2022F 2024F 2021 to 2022 • Contribution on higher sales (+) • Lower production inefficiencies from unpredictable OEM production schedules (+) • Operational Excellence initiatives (+) • Disposition of loss - making Exteriors facilities (+) • Higher input costs ( - ) • Higher engineering costs ( - ) 2022 to 2024 • Contribution on higher sales (+) • Operational Excellence initiatives (+) • Higher input costs ( - ) • Higher launch and new facility costs ( - ) BODY EXTERIORS & STRUCTURES 1 Excluding other expense (income), net 6.0 Equity Income ($M) 0 (13) 5 - 10 0 - 5 (%) 5.7 8.1 - 8.6 8.9 - 9.5
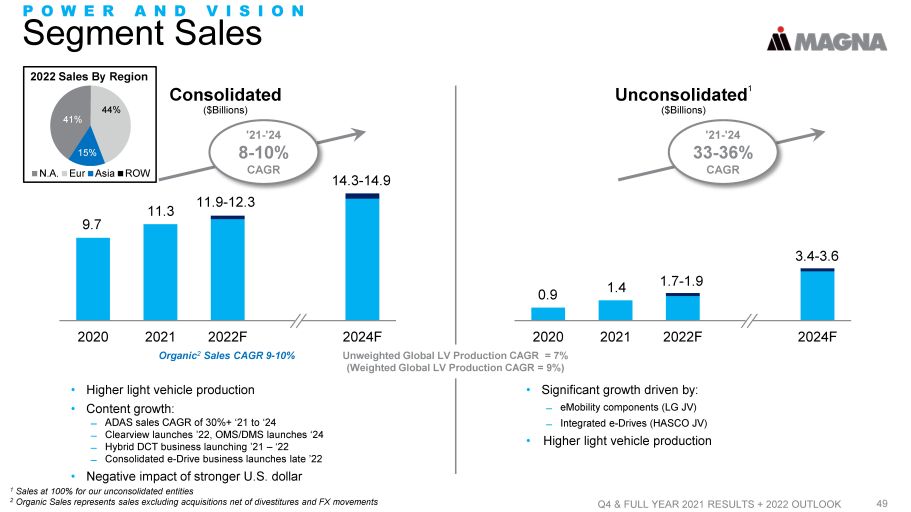
Q4 & FULL YEAR 2021 RESULTS + 2022 OUTLOOK 49 POWER AND VISION Segment Sales 1 Sales at 100% for our unconsolidated entities 2 Organic Sales represents sales excluding acquisitions net of divestitures and FX movements • Higher light vehicle production • Content growth: ̶ ADAS sales CAGR of 30%+ ‘21 to ‘24 ̶ Clearview launches ’22, OMS/DMS launches ‘24 ̶ Hybrid DCT business launching ’21 – ‘22 ̶ Consolidated e - Drive business launches late ’22 • Negative impact of stronger U.S. dollar 2020 2021 2022F 2024F Consolidated ($Billions) 9.7 11.3 11.9 - 12.3 14.3 - 14.9 N.A. Eur Asia ROW 2022 Sales By Region 15% 44% 41% '21 - '24 8 - 10% CAGR Organic 2 Sales CAGR 9 - 10% 2020 2021 2022F 2024F Unconsolidated 1 ($Billions) 0.9 1.4 1.7 - 1.9 3.4 - 3.6 • Significant growth driven by: ̶ eMobility components (LG JV) ̶ Integrated e - Drives (HASCO JV) • Higher light vehicle production '21 - '24 33 - 36% CAGR Unweighted Global LV Production CAGR = 7% (Weighted Global LV Production CAGR = 9%)
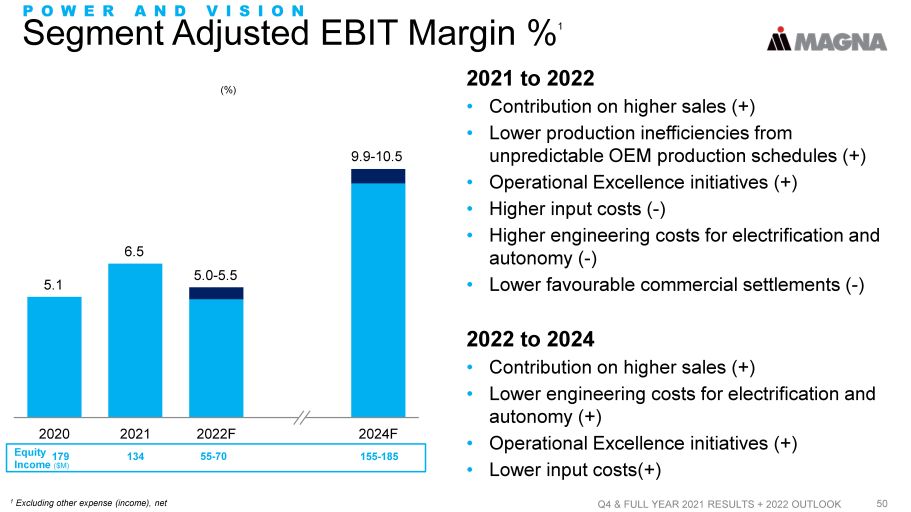
Segment Adjusted EBIT Margin % 1 Q4 & FULL YEAR 2021 RESULTS + 2022 OUTLOOK 50 2020 2021 2022F 2024F 2021 to 2022 • Contribution on higher sales (+) • Lower production inefficiencies from unpredictable OEM production schedules (+) • Operational Excellence initiatives (+) • Higher input costs ( - ) • Higher engineering costs for electrification and autonomy ( - ) • Lower favourable commercial settlements ( - ) 2022 to 2024 • Contribution on higher sales (+) • Lower engineering costs for electrification and autonomy (+) • Operational Excellence initiatives (+) • Lower input costs(+) POWER AND VISION 1 Excluding other expense (income), net 5.1 Equity Income ($M) 179 134 155 - 185 55 - 70 (%) 6.5 5.0 - 5.5 9.9 - 10.5
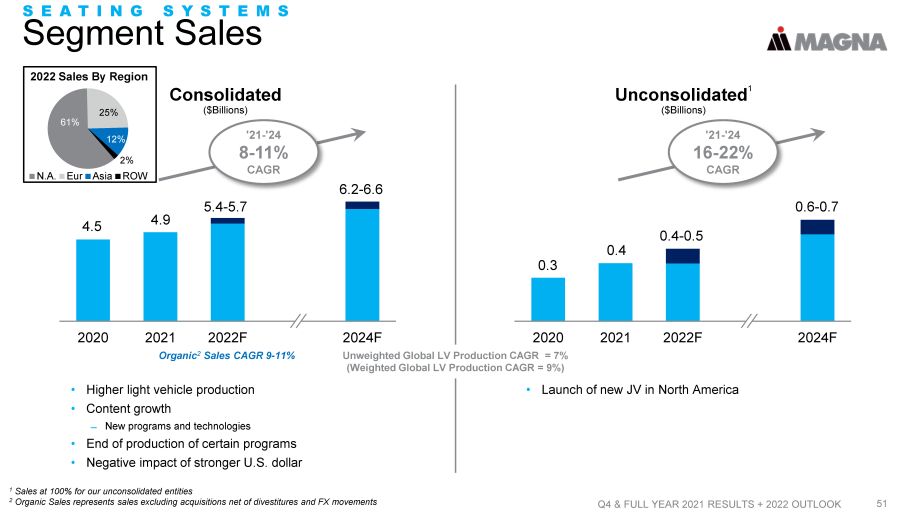
Q4 & FULL YEAR 2021 RESULTS + 2022 OUTLOOK 51 SEATING SYSTEMS Segment Sales 1 Sales at 100% for our unconsolidated entities 2 Organic Sales represents sales excluding acquisitions net of divestitures and FX movements • Higher light vehicle production • Content growth ̶ New programs and technologies • End of production of certain programs • Negative impact of stronger U.S. dollar 2020 2021 2022F 2024F Consolidated ($Billions) 2022 Sales By Region N.A. Eur Asia ROW 2% 25% 61% 12% 4.5 4.9 5.4 - 5.7 6.2 - 6.6 '21 - '24 8 - 11% CAGR Organic 2 Sales CAGR 9 - 11% 2020 2021 2022F 2024F Unconsolidated 1 ($Billions) • Launch of new JV in North America 0.3 0.4 0.4 - 0.5 0.6 - 0.7 '21 - '24 16 - 22% CAGR Unweighted Global LV Production CAGR = 7% (Weighted Global LV Production CAGR = 9%)
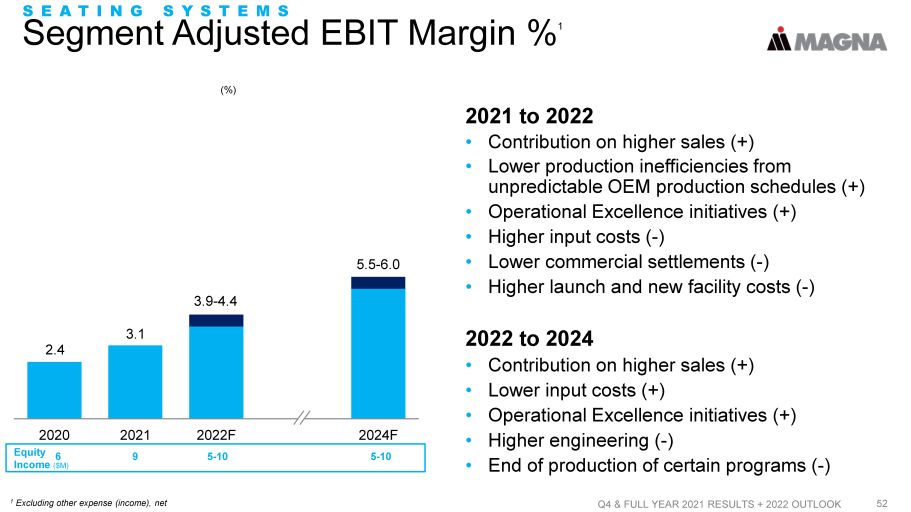
Segment Adjusted EBIT Margin % 1 Q4 & FULL YEAR 2021 RESULTS + 2022 OUTLOOK 52 2020 2021 2022F 2024F 2021 to 2022 • Contribution on higher sales (+) • Lower production inefficiencies from unpredictable OEM production schedules (+) • Operational Excellence initiatives (+) • Higher input costs ( - ) • Lower commercial settlements ( - ) • Higher launch and new facility costs ( - ) 2022 to 2024 • Contribution on higher sales (+) • Lower input costs (+) • Operational Excellence initiatives (+) • Higher engineering ( - ) • End of production of certain programs ( - ) 1 Excluding other expense (income), net 2.4 Equity Income ($M) 6 9 5 - 10 5 - 10 (%) 3.1 3.9 - 4.4 5.5 - 6.0 SEATING SYSTEMS
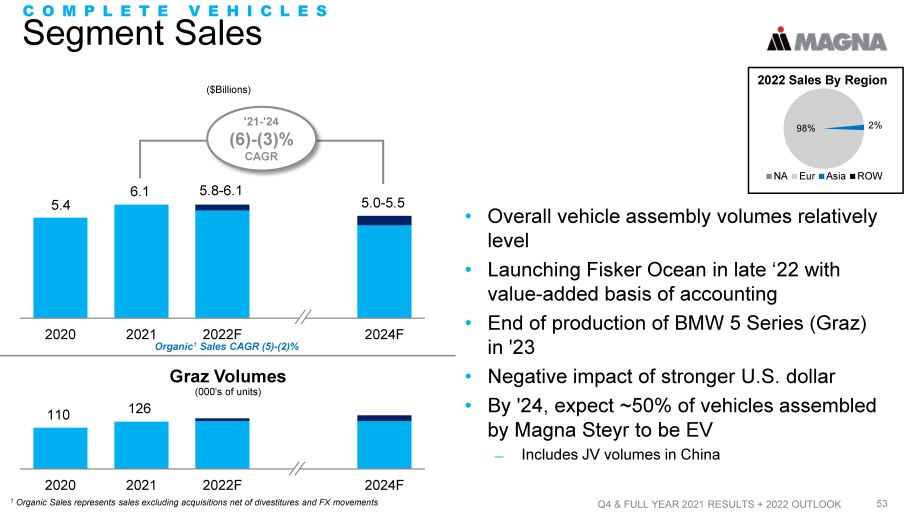
2020 2021 2022F 2024F Segment Sales Q4 & FULL YEAR 2021 RESULTS + 2022 OUTLOOK 53 • Overall vehicle assembly volumes relatively level • Launching Fisker Ocean in late ‘22 with value - added basis of accounting • End of production of BMW 5 Series (Graz) in '23 • Negative impact of stronger U.S. dollar • By '24, expect ~50% of vehicles assembled by Magna Steyr to be EV ̶ Includes JV volumes in China COMPLETE VEHICLES NA Eur Asia ROW 2022 Sales By Region 2% 98% 2020 2021 2022F 2024F Graz Volumes (000's of units) 110 126 ($Billions) 5.4 6.1 5.8 - 6.1 5.0 - 5.5 '21 - '24 (6) - (3)% CAGR Organic 1 Sales CAGR (5) - (2)% 1 Organic Sales represents sales excluding acquisitions net of divestitures and FX movements
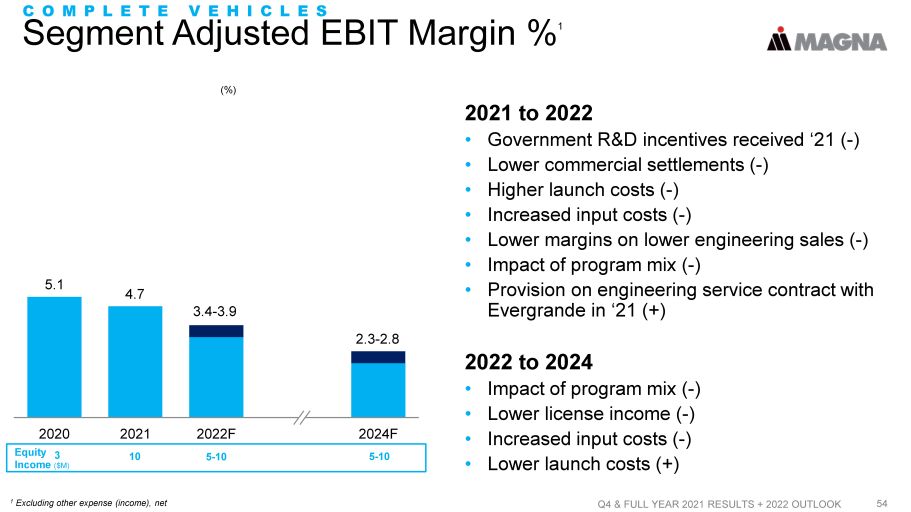
Segment Adjusted EBIT Margin % 1 Q4 & FULL YEAR 2021 RESULTS + 2022 OUTLOOK 54 2020 2021 2022F 2024F 2021 to 2022 • Government R&D incentives received ‘21 ( - ) • Lower commercial settlements ( - ) • Higher launch costs ( - ) • Increased input costs ( - ) • Lower margins on lower engineering sales ( - ) • Impact of program mix ( - ) • Provision on engineering service contract with Evergrande in ‘21 (+) 2022 to 2024 • Impact of program mix ( - ) • Lower license income ( - ) • Increased input costs ( - ) • Lower launch costs (+) COMPLETE VEHICLES 1 Excluding other expense (income), net 5.1 Equity Income ($M) 5 - 10 10 5 - 10 (%) 4.7 3.4 - 3.9 2.3 - 2.8 3
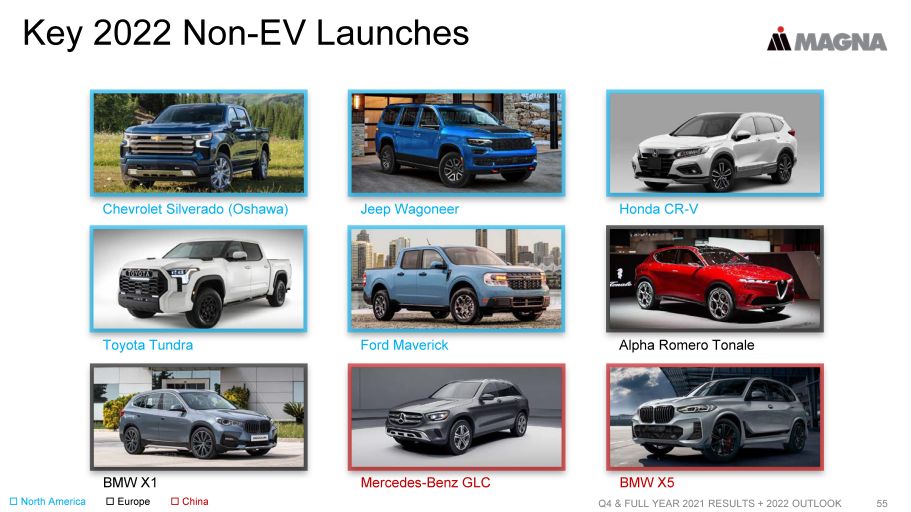
55 Q4 & FULL YEAR 2021 RESULTS + 2022 OUTLOOK Chevrolet Silverado (Oshawa) Jeep Wagoneer Honda CR - V Toyota Tundra Ford Maverick Alpha Romero Tonale Key 2022 Non - EV Launches BMW X1 Mercedes - Benz GLC BMW X5 North America Europe China
END