Exhibit 99.2

Q3 2022 Results November 4, 2022

Forward Looking Statements Q3 - 2022 RESULTS 2 Certain statements in this document constitute "forward - looking information" or "forward - looking statements" (collectively, "for ward - looking statements"). Any such forward - looking statements are intended to provide information about management's current expectations and plans and may not be appropriate for other purposes. Forward - looking sta tements may include financial and other projections, as well as statements regarding our future plans, strategic objectives or economic performance, or the assumptions underlying any of the foregoing, and other st atements that are not recitations of historical fact. We use words such as "may", "would", "could", "should", "will", "likely", "expect", "anticipate", "believe", "intend", "plan", "aim", "forecast", "outlook", "proj ect ", "estimate", "target" and similar expressions suggesting future outcomes or events to identify forward - looking statements. The following table identifies the material forward - looking statements contained in this document, together with the material potential risks that we currently believe could cause actual results to differ materially from such forward - looking statements. Readers should also consider all of the risk factors which follow below the tab le: Material Forward - Looking Statement Material Potential Risks Related to Applicable Forward - Looking Statement Total Sales Segment Sales Supply disruptions, including as a result of the semiconductor chip shortage currently being experienced in the industry ; and Russia’s invasion of Ukraine ; The impact of the Russian invasion of Ukraine on global economic growth, and industry production volumes, as well as potential disruption of energy supply to Western European operations, particularly natural gas The impact of rising interest rates and availability of credit on consumer confidence and, in turn, vehicle sales and production The impact of deteriorating vehicle affordability on consumer demand, and in turn vehicle sales and production Concentration of sales with six customers Shifts in market shares among vehicles or vehicle segments Shifts in consumer “take rates” for products we sell Adjusted EBIT Margin Net Income Attributable to Magna Same risks as for Total Sales and Segment Sales above Operational underperformance Higher costs incurred to mitigate the risk of supply disruptions, including : materials price increases ; higher - priced substitute supplies ; premium freight costs to expedite shipments ; production inefficiencies due to production lines being stopped/restarted unexpectedly based on customers’ production schedules ; price increases from sub - suppliers that have been negatively impacted by production inefficiencies ; and potential claims against us if customer production is disrupted Inability to offset inflationary price increases Price concessions Commodity cost volatility Higher labour costs Tax risks Expected Sequential Earnings Improvement Same risks as for Adjusted EBIT Margin/Net Income Attributable to Magna above Equity Income Same risks as Adjusted EBIT Margin and Net Income Attributable to Magna Risks related to conducting business through joint ventures Free Cash Flow Same risks as for Total Sales/Segment Sales, and Adjusted EBIT Margin/Net Income Attributable to Magna above
Forward Looking Statements (cont.) Q3 - 2022 RESULTS 3 Forward - looking statements are based on information currently available to us and are based on assumptions and analyses made by us in light of our experience and our perception of historical trends, current conditions and expected future developments, as well as other factors we believe are appropriate in the circumstances. While we believe we have a reasonable basis for making any such forward - looking statements, they are not a guarantee of future performance or outcomes. In addition to the factors in the table above, whether actual results and develo pme nts conform to our expectations and predictions is subject to a number of risks, assumptions and uncertainties, many of which are beyond our control, and the effects of which can be difficult to predict, in clu ding, without limitation: Risks Related to the Automotive Industry economic cyclicality; regional production volume declines, including as a result of deteriorating vehicle affordability; intense competition; potential restrictions on free trade; trade disputes/tariffs; Customer and Supplier Related Risks concentration of sales with six customers; emergence of potentially disruptive Electric Vehicle OEMs, including risks related to limited revenues/operating history of new OEM entrants; OEM consolidation and cooperation; shifts in market shares among vehicles or vehicle segments; shifts in consumer "take rates" for products we sell; dependence on outsourcing; quarterly sales fluctuations; potential loss of any material purchase orders; a deterioration in the financial condition of our supply base; Manufacturing Operational Risks risks arising from Russia’s invasion of Ukraine and compliance with the sanctions regime imposed in response; impact of the semiconductor chip shortage on OEM production volumes and the efficiency of our operations; supply disruptions, including with respect to semiconductor chips; regional energy shortages and price increases; skilled labour attraction/retention; Manufacturing Operational Risks (cont.) product and new facility launch risks; operational underperformance; restructuring costs; impairment charges; labour disruptions; risks related to COVID - 19; climate change risks; IT Security/Cybersecurity Risk IT/cybersecurity breach; product cybersecurity breach; Pricing Risks inflationary pressures: pricing risks between time of quote and start of production; price concessions; commodity cost volatility; declines in scrap steel/aluminum prices; Warranty / Recall Risks costs related to repair or replacement of defective products, including due to a recall; warranty or recall costs that exceed warranty provision or insurance coverage limits; product liability claims; Acquisition Risks competition for strategic acquisition targets; inherent merger and acquisition risks; acquisition integration risk; Other Business Risks risks related to conducting business through joint ventures; our ability to consistently develop and commercialize innovative products or processes; intellectual property risks; our changing business risk profile as a result of increased investment in electrification and autonomous driving, including: higher R&D and engineering costs, and challenges in quoting for profitable returns on products for which we may not have significant quoting experience; risks of conducting business in foreign markets; fluctuations in relative currency values; tax risks; reduced financial flexibility as a result of an economic shock; changes in credit ratings assigned to us; Legal, Regulatory and Other Risks antitrust risk; legal claims and/or regulatory actions against us; and changes in laws and regulations, including those related to vehicle emissions or made as a result of the COVID - 19 pandemic. In evaluating forward - looking statements or forward - looking information, we caution readers not to place undue reliance on any f orward - looking statement. Additionally, readers should specifically consider the various factors which could cause actual events or results to differ materially from those indicated by such forward - looking statements, including the risks, assumptions and uncertainties above which are: discussed under the “Industry Trends and Risks” heading of our Management’s Discussion and Analysis; and set out in our Annual Information Form filed with securities commissions in Canada, our annual report on Form 40 - F filed with th e United States Securities and Exchange commission, and subsequent filings. Readers should also consider discussion of our risk mitigation activities with respect to certain risk factors, which can be als o found in our Annual Information Form.

4 Reminders All amounts are in U.S. Dollars Today's discussion excludes the impact of other expense (income), net ("Unusual Items") "Organic", in the context of sales movements, means "excluding the impact of foreign exchange, acquisitions and divestitures" Q3 - 2022 RESULTS

Key Messages – Q3 2022 Q3 - 2022 RESULTS 5 Improved YoY and sequential results in Q3 1. Expect sequential improvement in earnings again in Q4 2. Reduced 2022 outlook for sales and margin 3. Further progress in our go - forward strategy 4.

Current Market Dynamics Q3 - 2022 RESULTS 6 Tailwinds Auto forecasters expecting increased global light vehicle production in 2023+ Dealer inventory levels remain well below historical levels Underlying auto demand remains resilient Headwinds Continued supply constraints Input costs remain elevated Foreign currency translation due to stronger USD Impact of high inflation and rising interest rates on consumer demand

CONSOLIDATED SALES $9.3B Weighted GoM 1 3% +17% Q3 2022 Performance Highlights Q3 - 2022 RESULTS 7 ADJUSTED EBIT MARGIN % 4.8% +190 bps OTHER HIGHLIGHTS Paid out $125M in dividends ADJUSTED DILUTED EPS $1.07 +91% FREE CASH FLOW 2 - $210M Repurchased 3.1M shares for $180M 1 Weighted Growth over Market (GoM) compares organic sales growth (%) to vehicle production change (%) after applying Magna geo gra phic sales weighting, excluding Complete Vehicles, to regional production 2 Free Cash Flow is Cash from Operating Activities plus proceeds from normal course dispositions of fixed and other assets plus se ttlement of long - term receivable from a non - consolidated joint venture minus capital spending minus investment in other assets 3 Represents managed sales. Managed sales = consolidated sales + sales at 100% for unconsolidated entities Improved EBIT margin in every operating segment

Updated 2022 Outlook – Key Factors Q3 - 2022 RESULTS 8 Expect Sequential Earnings Improvement Q4/22 vs Q3/22 • Operating efficiencies at certain facilities ~15 bps ̶ Most significant is BES facility in Europe » Action plans in place » We expect progress improving run - rate of losses going forward • Lower volumes driving lower sales in key markets ~10 bps ̶ Reduced volumes in North America and Europe ̶ Partially offset by increased volumes in China ̶ Ongoing industry disruption costs: Start - stop, OEM release volatility » Previous outlook anticipated improvements • Modestly higher net input costs ~5 bps ̶ Lower sales of scrap steel and aluminum (~$20M) Reduction in 2022 Adjusted EBIT Margin %

Magna Enters Micromobility Market Q3 - 2022 RESULTS 9 • Utilizing Magna’s capabilities and platform technologies • Invested in Yulu and in growing battery - swapping business • Ongoing activities with delivery robots

Launching 48Volt Hybrid Transmissions Q3 - 2022 RESULTS 10 • Hybrid dual - clutch transmission debuted on the Jeep Renegade and Compass e - Hybrid, Fiat 500X and Tipo • Agreement includes additional hybrid models in the future for Europe • Scalable technology aids customers in the transition to vehicle electrification Magna’s 48 - Volt hybrid transmission system launches on several Stellantis models around the globe

Technology Recognitions from Automotive News Q3 - 2022 RESULTS 11

Q3 2022 Financial Results Q3 - 2022 RESULTS 12 Key Factors • Higher global light vehicle production and assembly volumes (+) • Launch of new programs (+) • Customer price increases to recover higher input costs (+) • Foreign currency translation: $774M or 10% ( - ) • Lower sales at facilities in Russia ( - ) • Customer price concessions ( - ) Q3'22 Production Global 24% North America 24% Europe 25% China 27% Magna Weighted 24% Consolidated Sales ($Billions) +17% $7.9 $9.3 0.0 0.1 0.1 0.1 0.1 0.1 0.1 0.1 $0.0 $1.0 $2.0 $3.0 $4.0 $5.0 $6.0 $7.0 $8.0 $9.0 $10.0 Q3'21 Q3'22 Weighted GoM 1 3% 1 Weighted Growth over Market (GoM) compares organic sales growth (%) to vehicle production change (%) after applying Magna geo gra phic sales weighting, excluding Complete Vehicles, to regional production

Q3 2022 Financial Results Q3 - 2022 RESULTS 13 Adjusted effective tax rate of 25.5% vs 15.0% in Q3'21: • Lower R&D credits ( - ) • Change in the mix of earnings ( - ) • Favourable changes in reserves for uncertain tax positions (+) Adjusted Net Income Attributable to Magna of $308M, up $138M Adjusted EBIT & Margin ($Millions) +93% Adjusted EPS ($) +91% $0.56 $1.07 0.0 0.1 0.1 0.1 0.1 0.1 0.1 0.1 0.00 0.20 0.40 0.60 0.80 1.00 1.20 Q3'21 Q3'22 $229 $441 2.9% 4.8% 0.0 0.0 0.0 0.0 0.1 0.1 0.1 0.1 0.1 0.1 0.1 0 50 100 150 200 250 300 350 400 450 500 Q3'21 Q3'22 Adjusted EBIT Margin % • Earnings on higher sales (+) • Commercial settlements (+) • Provision on engineering services contract with Evergrande in Q3'21 (+) • Higher tooling contribution (+) • Divestitures, net of acquisitions (+) • Higher net input costs ( - ) • Operating i nefficiencies at a facility in Europe ( - ) • Higher launch costs ( - ) • Higher net warranty costs ( - ) • Reduced earnings on lower sales at facilities in Russia ( - )

Q3 2022 Cash Flow and Investment Activities Q3 - 2022 RESULTS 14 Free Cash Flow 1 ($Millions) - $25 - $210 0.0 0.1 0.1 0.1 0.1 0.1 0.1 0.1 -$250 -$200 -$150 -$100 -$50 $0 Q3'21 Q3'22 OTHER USES OF CASH Net Repayment of Debt $10 Private Equity Investments $25 Repurchase of Common Shares $180 Dividends ($0.45/share) $125 Cash from Operations Before Changes in Operating Assets & Liabilities $591 Changes in Operating Assets & Liabilities ($353) Cash from Operations $238 Fixed Asset Additions ($364) Increase in Investments, Other Assets and Intangible Assets ($125) Proceeds from Dispositions $41 Free Cash Flow 1 ($210) 1 Free Cash Flow (FCF) is Cash from Operating Activities plus proceeds from normal course dispositions of fixed and other asset s p lus settlement of long - term receivable from a non - consolidated joint venture minus capital spending minus investment in other assets ($Millions)
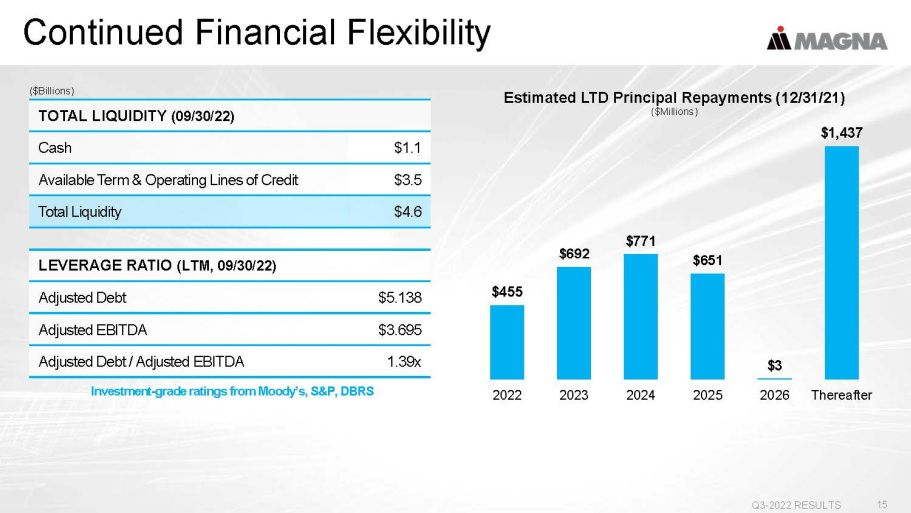
Continued Financial Flexibility Q3 - 2022 RESULTS 15 ($Billions) Estimated LTD Principal Repayments (12/31/21) ($Millions) $455 $692 $771 $651 $3 $1,437 2022 2023 2024 2025 2026 Thereafter LEVERAGE RATIO (LTM, 09/30/22) Adjusted Debt $5.138 Adjusted EBITDA $3.695 Adjusted Debt / Adjusted EBITDA 1.39x TOTAL LIQUIDITY (09/30/22) Cash $1.1 Available Term & Operating Lines of Credit $3.5 Total Liquidity $4.6 Investment - grade ratings from Moody’s, S&P, DBRS
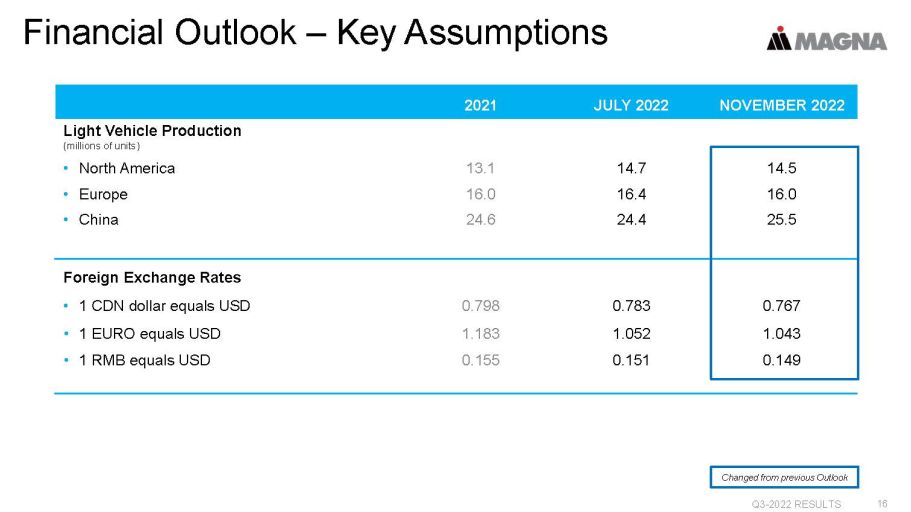
Financial Outlook – Key Assumptions Q3 - 2022 RESULTS 16 2021 JULY 2022 NOVEMBER 2022 Light Vehicle Production (millions of units) • North America 13.1 14.7 14.5 • Europe 16.0 16.4 16.0 • China 24.6 24.4 25.5 Foreign Exchange Rates • 1 CDN dollar equals USD 0.798 0.783 0.767 • 1 EURO equals USD 1.183 1.052 1.043 • 1 RMB equals USD 0.155 0.151 0.149 Changed from previous Outlook
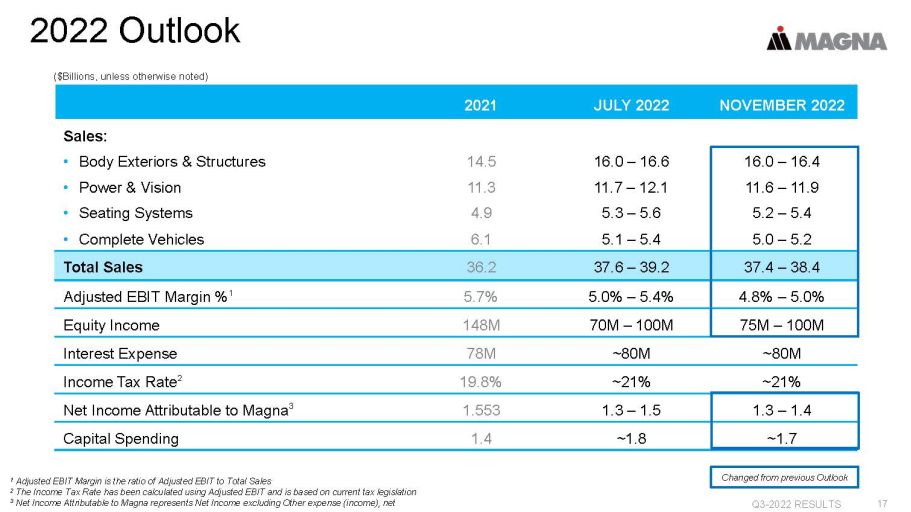
2022 Outlook Q3 - 2022 RESULTS 17 2021 JULY 2022 NOVEMBER 2022 Sales: • Body Exteriors & Structures 14.5 16.0 – 16.6 16.0 – 16.4 • Power & Vision 11.3 11.7 – 12.1 11.6 – 11.9 • Seating Systems 4.9 5.3 – 5.6 5.2 – 5.4 • Complete Vehicles 6.1 5.1 – 5.4 5.0 – 5.2 Total Sales 36.2 37.6 – 39.2 37.4 – 38.4 Adjusted EBIT Margin % 1 5.7% 5.0% – 5.4% 4.8% – 5.0% Equity Income 148M 70M – 100M 75M – 100M Interest Expense 78M ~80M ~80M Income Tax Rate 2 19.8% ~21% ~21% Net Income Attributable to Magna 3 1.553 1.3 – 1.5 1.3 – 1.4 Capital Spending 1.4 ~1.8 ~1.7 1 Adjusted EBIT Margin is the ratio of Adjusted EBIT to Total Sales 2 The Income Tax Rate has been calculated using Adjusted EBIT and is based on current tax legislation 3 Net Income Attributable to Magna represents Net Income excluding Other expense (income), net ($Billions, unless otherwise noted) Changed from previous Outlook

Free Cash Flow 1 Expectations Q3 - 2022 RESULTS 18 • Reduced earnings outlook ( - ) • Higher expected year end working capital ( - ) • Lower capital spending outlook (+) 2022 ($Billions) 0.0 0.1 0.2 0.3 0.4 0.5 0.6 0.7 0.8 0.9 1.0 $0.7 - $0.9 $0.4 - $0.6 July 2022 Outlook November 2022 Outlook 1 Free Cash Flow is Cash from Operating Activities plus proceeds from normal course dispositions of fixed and other assets plus se ttlement of long - term receivable from a non - consolidated joint venture minus capital spending minus investment in other assets
In Summary Q3 - 2022 RESULTS 19 • Further sequential earnings improvement expected in Q4 • Continued focus on improvements in our underperforming operations, managing costs and customer recoveries • Ongoing progress in our go - forward strategy Improved Results in Q3, Both YoY and Sequentially
Appendix – Q3 2022 Results Q3 - 2022 RESULTS 20

Q3 2022 Reconciliation of Reported Results 21 REPORTED OTHER EXPENSE, NET EXCL. OTHER EXPENSE, NET Income Before Income Taxes $ 400 $ 23 $ 423 % of Sales 4.3% 4.6% Income Tax Expense $ 104 $ 4 $ 108 % of Pretax 26.0% 25.5% Income Attributable to Non - Controlling Interests $ (7) $ - $ (7) Net Income Attributable to Magna $ 289 $ 19 $ 308 Earnings Per Share $ 1.00 $ 0.07 $ 1.07 Q3 - 2022 RESULTS ($Millions, except for share figures)

Q3 2021 Reconciliation of Reported Results 22 REPORTED OTHER EXPENSE, NET EXCL. OTHER EXPENSE, NET Income Before Income Taxes $ 27 $ 180 $ 207 % of Sales 0.3% 2.6% Income Tax Expense $ 10 $ 21 $ 31 % of Pretax 37.0% 15.0% Income Attributable to Non - Controlling Interests $ (6) $ - $ (6) Net Income Attributable to Magna $ 11 $ 159 $ 170 Earnings Per Share $ 0.04 $ 0.52 $ 0.56 Q3 - 2022 RESULTS ($Millions, except for share figures)

Sales Performance vs Market 23 REPORTED ORGANIC 1 PERFORMANCE VS WEIGHTED GLOBAL PRODUCTION (Weighted GoM) Body Exteriors & Structures 25% 31% 7% Power & Vision 16% 26% 2% Seating Systems 15% 25% 1% Complete Vehicles (3%) 13% (11%) TOTAL SALES 17% 27% 3% Unweighted Production Growth 24% Weighted Production Growth 2 24% 1 Organic Sales represents sales excluding acquisitions net of divestitures and FX movements 2 Calculated by applying Magna geographic sales weighting, excluding Complete Vehicles, to regional production Q3 - 2022 RESULTS Q3 2022 vs Q3 2021

Sales Performance vs Market 24 REPORTED ORGANIC 1 PERFORMANCE VS WEIGHTED GLOBAL PRODUCTION (Weighted GoM) Body Exteriors & Structures 11% 16% 10% Power & Vision 4% 9% 3% Seating Systems 9% 17% 11% Complete Vehicles (15%) (5%) (11%) TOTAL SALES 4% 11% 5% Unweighted Production Growth 6% Weighted Production Growth 2 6% 1 Organic Sales represents sales excluding acquisitions net of divestitures and FX movements 2 Calculated by applying Magna geographic sales weighting, excluding Complete Vehicles, to regional production Q3 - 2022 RESULTS 2022 YTD vs 2021 YTD

Geographic Sales Q3 - 2022 RESULTS 25 Q3 2021 Q3 2022 ASIA ASIA PRODUCTION 23% China Production 27% Q3 2022 vs Q3 2021 $3.9B $4.7B $0.0B $0.5B $1.0B $1.5B $2.0B $2.5B $3.0B $3.5B $4.0B $4.5B $5.0B $3.1B $3.3B $0.0B $0.5B $1.0B $1.5B $2.0B $2.5B $3.0B $3.5B $927M $1.2B $0M $200M $400M $600M $800M $1000M $1200M $1400M $96M $133M $0M $20M $40M $60M $80M $100M $120M $140M NORTH AMERICA PRODUCTION 24% EUROPE PRODUCTION 25% S.A. PRODUCTION 33% REST OF WORLD

2022 Segment Adjusted EBIT Margin Q3 - 2022 RESULTS 26 2021 July 2022 Outlook November 2022 Outlook BODY EXTERIORS & STRUCTURES 5.7% 6.0 - 6.5% 5.8 - 6.1% SEATING SYSTEMS 3.1% 3.0 - 3.5% 2.1 - 2.4% POWER & VISION 6.5% 4.5 - 5.0% 4.3 - 4.6% COMPLETE VEHICLES 4.7% 3.8 - 4.3% 4.0 - 4.3%

Capital Allocation Principles Q3 - 2022 RESULTS 27 Disciplined, Profitable Approach to Growth Remains a Foundational Principle Q3 2022 Maintain Strong Balance Sheet • Preserve liquidity and high investment grade credit ratings - Adj. debt / Adj. EBITDA ratio between 1.0 - 1.5x LTM 9/30/22 1.39x • Maintain flexibility to invest for growth Invest for Growth • Organic and inorganic opportunities Fixed asset additions Other investments Private Equity Investments $ 364M $ 125M $ 25M • Innovation Return Capital to Shareholders • Continued dividend growth over time $ 125M • Repurchase shares with excess liquidity $ 180M

Segment Financial Performance Q3 - 2022 RESULTS 28 Adjusted EBIT Margin % • Earnings on higher sales (+) • Commercial settlements (+) • Higher tooling contribution (+) • Divestitures, net of acquisitions (+) • Higher net input costs ( - ) • Operating inefficiencies at a facility in Europe ( - ) • Reduced earnings on lower sales at facilities in Russia ( - ) • Higher global light vehicle production (+) • Launch of new programs (+) • Customer price increases to recover higher input costs (+) • Acquisitions, net of divestitures: $15M (+) • Foreign currency translation: $209M ( - ) • Lower sales at facilities in Russia ( - ) • Net customer price concessions ( - ) $3.2 $4.0 Q3'21 Q3'22 Sales ($Billions) 25% Adjusted EBIT & Margin ($Millions) 130% $98 $225 3.1% 5.7% 0.0 0.0 0.1 0.1 0.1 0.1 0.1 0 50 100 150 200 250 Q3'21 Q3'22 BODY EXTERIORS & STRUCTURES

• Higher global light vehicle production (+) • Launch of new programs (+) • Customer price increases to recover higher production costs (+) • Foreign currency translation: $239M ( - ) • Net customer price concessions ( - ) Segment Financial Performance Q3 - 2022 RESULTS 29 POWER & VISION $2.5 $2.9 Q3'21 Q3'22 $67 $117 2.7% 4.0% 0.0 0.1 0.1 0.2 0.2 0.3 0 50 100 150 200 250 Q3'21 Q3'22 Sales ($Billions) 16% Adjusted EBIT & Margin ($Millions) 75% Adjusted EBIT Margin % • Earnings on higher sales (+) • Commercial settlements (+) • Higher net input costs ( - ) • Higher net warranty costs: $14M ( - ) • Higher launch costs ( - )

• Higher global light vehicle production (+) • Launch of new programs (+) • Customer price increases to recover higher production input costs (+) • Foreign currency translation: $103M ( - ) • Lower sales at facilities in Russia ( - ) • Divestitures: $9M ( - ) • Net customer price concessions ( - ) Segment Financial Performance Q3 - 2022 RESULTS 30 Adjusted EBIT Margin % • Earnings on higher sales (+) • Commercial settlements (+) • Higher net input costs ( - ) • Higher launch costs ( - ) SEATING $1.1 $1.3 Q3'21 Q3'22 $22 $35 2.0% 2.7% 0.0 0.0 0.0 0.0 0.1 0.1 0.1 Q3'21 Q3'22 Sales ($Billions) 15% Adjusted EBIT & Margin ($Millions) 59%

• Weaker euro: $207M ( - ) • Higher vehicle assembly volumes: 1.6K units (+) Segment Financial Performance Q3 - 2022 RESULTS 31 Adjusted EBIT Margin % • Provision on engineering services contract with Evergrande in Q3'21 (+) • Higher earnings on higher assembly volumes, net of contractual fixed cost recoveries on certain programs (+) • Higher net input costs ( - ) COMPLETE VEHICLES $1.3 $1.2 Q3'21 Q3'22 $30 $65 2.4% 5.4% 0.0 0.0 0.1 0.1 0.1 0.1 0.1 0.2 0 10 20 30 40 50 60 70 80 90 Q3'21 Q3'22 Sales ($Billions) - 3% Adjusted EBIT & Margin ($Millions) 117%

END Q3 - 2022 RESULTS 32