Exhibit 99.3

Q4 & Full Year 2023 + 2024 Outlook February 9, 2024
Louis Tonelli Vice President, Investor Relations Q4 & FULL YEAR 2023 + 2024 OUTLOOK 2

Forward Looking Statements Q4 & FULL YEAR 2023 + 2024 OUTLOOK 3 Certain statements in this document constitutes "forward - looking information" or "forward - looking statements" (collectively, "forward - looking statements") . Any such forward - looking statements are intended to provide information about management's current expectations and plans and may not be appropriate for other purposes . Forward - looking statements may include financial and other projections, as well as statements regarding our future plans, strategic objectives or economic performance, or the assumptions underlying any of the foregoing, and other statements that are not recitations of historical fact . We use words such as "may", "would", "could", "should", "will", "likely", "expect", "anticipate", "believe", "intend", "plan", "aim", "forecast", "outlook", "project", "estimate", "target" and similar expressions suggesting future outcomes or events to identify forward - looking statements . The following table identifies the material forward - looking statements contained in this document, together with the material potential risks that we currently believe could cause actual results to differ materially from such forward - looking statements . Readers should also consider all of the risk factors which follow below the table : Material Potential Risks Related to Applicable Forward - Looking Statement Material Forward - Looking Statement Light vehicle sales levels Production disruptions, including as a result of labour strikes Supply disruptions Production allocation decisions by OEMs Light Vehicle Production Same risks as for Light Vehicle Production above The impact of elevated interest rates and availability of credit on consumer confidence and in turn vehicle sales and production The impact of deteriorating vehicle affordability on consumer demand, and in turn vehicle sales and production Misalignment between EV production and sales Strategic and other risks relating to the transition to electromobility Concentration of sales with six customers Shifts in market shares among vehicles or vehicle segments Shifts in consumer "take rates" for products we sell Relative foreign exchange rates Total Sales Unconsolidated Sales Segment Sales Weighted Sales Growth Over Market ( 2023 - 2026 Sales in Megatrend areas (to 2026 ) Same risks as for Total Sales/Unconsolidated Sales/Segment Sales/Weighted Sales Growth/Megatrend Sales above Successful execution of critical program launches Operational underperformance Product warranty/recall risks Production inefficiencies in our operations due to volatile vehicle production allocation decisions by OEMs Higher costs incurred to mitigate the risk of supply disruptions Inflationary pressures Our ability to secure cost recoveries from customers and/or otherwise offset higher input costs Price concessions Risks of conducting business with Fisker and other newer EV - focused OEMs Commodity cost volatility Scrap steel price volatility Higher labour costs Tax risks Adjusted EBIT Margin Segment and Megatrend Area Adjusted EBIT Margin Potential Margin Expansion (to 2026 ) Target Leverage Ratio Same risks as for Total Sales/Unconsolidated Sales/Segment Sales/Weighted Sales Growth/Megatrend Sales and Adjusted EBIT Margin/Segment and Megatrend Area Adjusted EBIT Margin/Potential Margin Expansion/Target Leverage Ratio above Free Cash Flow
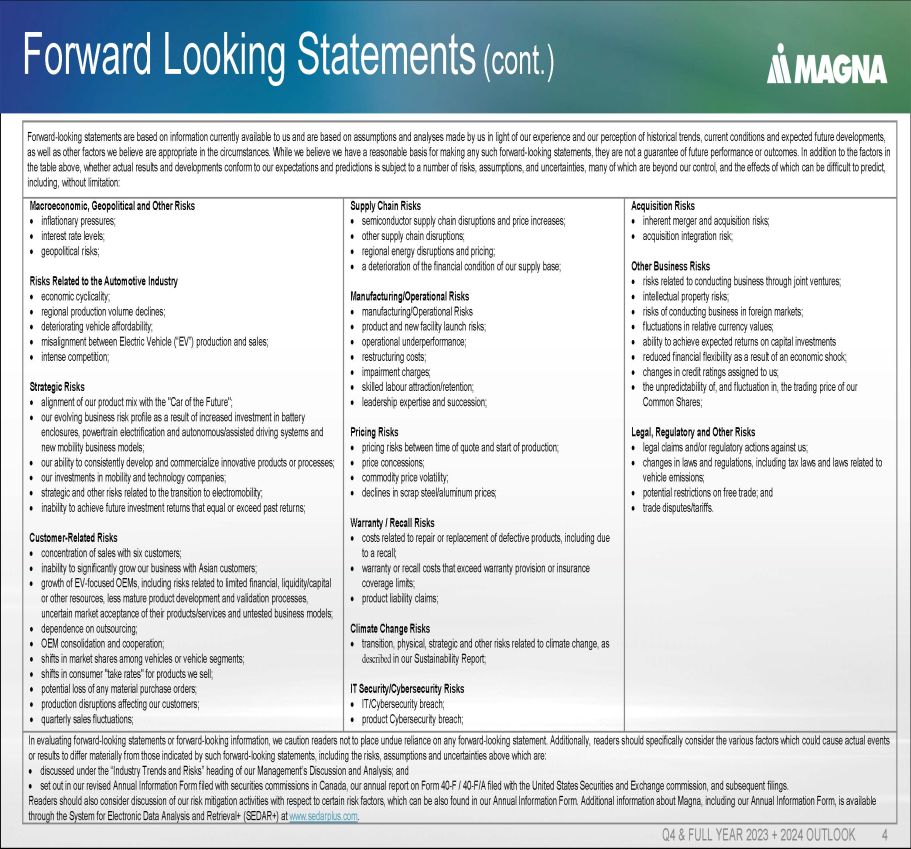
Forward Looking Statements (cont.) Q4 & FULL YEAR 2023 + 2024 OUTLOOK 4 Forward - looking statements are based on information currently available to us and are based on assumptions and analyses made by us in light of our experience and our perception of historical trends, current conditions and expected future developments, as well as other factors we believe are appropriate in the circumstances. While we believe we have a reasonable basis for mak ing any such forward - looking statements, they are not a guarantee of future performance or outcomes. In addition to the factors in the table above, whether actual results and developments conform to our expectations and predictions is subject to a number o f r isks, assumptions, and uncertainties, many of which are beyond our control, and the effects of which can be difficult to pred ict , including, without limitation: Acquisition Risks inherent merger and acquisition risks; acquisition integration risk; Other Business Risks risks related to conducting business through joint ventures; intellectual property risks; risks of conducting business in foreign markets; fluctuations in relative currency values; ability to achieve expected returns on capital investments reduced financial flexibility as a result of an economic shock; changes in credit ratings assigned to us; the unpredictability of, and fluctuation in, the trading price of our Common Shares; Legal, Regulatory and Other Risks legal claims and/or regulatory actions against us; changes in laws and regulations, including tax laws and laws related to vehicle emissions; potential restrictions on free trade; and trade disputes/tariffs. Supply Chain Risks semiconductor supply chain disruptions and price increases; other supply chain disruptions; regional energy disruptions and pricing; a deterioration of the financial condition of our supply base; Manufacturing/Operational Risks manufacturing/Operational Risks product and new facility launch risks; operational underperformance; restructuring costs; impairment charges; skilled labour attraction/retention; leadership expertise and succession; Pricing Risks pricing risks between time of quote and start of production; price concessions; commodity price volatility; declines in scrap steel/aluminum prices; Warranty / Recall Risks costs related to repair or replacement of defective products, including due to a recall; warranty or recall costs that exceed warranty provision or insurance coverage limits; product liability claims; Climate Change Risks transition, physical, strategic and other risks related to climate change, as described in our Sustainability Report; IT Security/Cybersecurity Risks IT/Cybersecurity breach; product Cybersecurity breach; Macroeconomic, Geopolitical and Other Risks inflationary pressures; interest rate levels; geopolitical risks; Risks Related to the Automotive Industry economic cyclicality; regional production volume declines; deteriorating vehicle affordability; misalignment between Electric Vehicle (“EV”) production and sales; intense competition; Strategic Risks alignment of our product mix with the "Car of the Future"; our evolving business risk profile as a result of increased investment in battery enclosures, powertrain electrification and autonomous/assisted driving systems and new mobility business models; our ability to consistently develop and commercialize innovative products or processes; our investments in mobility and technology companies; strategic and other risks related to the transition to electromobility; inability to achieve future investment returns that equal or exceed past returns; Customer - Related Risks concentration of sales with six customers; inability to significantly grow our business with Asian customers; growth of EV - focused OEMs, including risks related to limited financial, liquidity/capital or other resources, less mature product development and validation processes, uncertain market acceptance of their products/services and untested business models; dependence on outsourcing; OEM consolidation and cooperation; shifts in market shares among vehicles or vehicle segments; shifts in consumer "take rates" for products we sell; potential loss of any material purchase orders; production disruptions affecting our customers; quarterly sales fluctuations; In evaluating forward - looking statements or forward - looking information, we caution readers not to place undue reliance on any f orward - looking statement. Additionally, readers should specifically consider the various factors which could cause actual events or results to differ materially from those indicated by such forward - looking statements, including the risks, assumptions and un certainties above which are: discussed under the “Industry Trends and Risks” heading of our Management’s Discussion and Analysis; and set out in our revised Annual Information Form filed with securities commissions in Canada, our annual report on Form 40 - F / 40 - F/A filed with the United States Securities and Exchange commission, and subsequent filings. Readers should also consider discussion of our risk mitigation activities with respect to certain risk factors, which can be als o found in our Annual Information Form. Additional information about Magna, including our Annual Information Form, is availab le through the System for Electronic Data Analysis and Retrieval+ (SEDAR+) at www.sedarplus.com .

Q4 & FULL YEAR 2023 + 2024 OUTLOOK 5 Reminders All amounts are in U.S. Dollars. Effective July 1, 2023 we revised our calculation of Non - GAAP measures to exclude amortization of acquired intangible assets. The historical presentation of non - GAAP measures has also been updated to reflect the revised calculations. Today's discussion excludes the impact of other expense (income), net ("Unusual Items") and amortization of acquired intangible assets. Please refer to the reconciliation of Non - GAAP measures in our press release dated February 9, 2024 for further information. "Organic", in the context of sales movements, means "excluding the impact of foreign exchange, acquisitions and divestitures". Weighted Growth over Market ( GoM ) compares organic sales growth (%) to vehicle production change (%) after applying Magna geographic sales weighting, excluding Complete Vehicles, to regional production.

Q4 & FULL YEAR 2023 + 2024 OUTLOOK 6 • 2023 Highlights and Q4 2023 Operating Results • 2024 Outlook • Financial Strategy Agenda
Swamy Kotagiri Chief Executive Officer Q4 & FULL YEAR 2023 + 2024 OUTLOOK 7

2023 Highlights Q4 & FULL YEAR 2023 + 2024 OUTLOOK 8
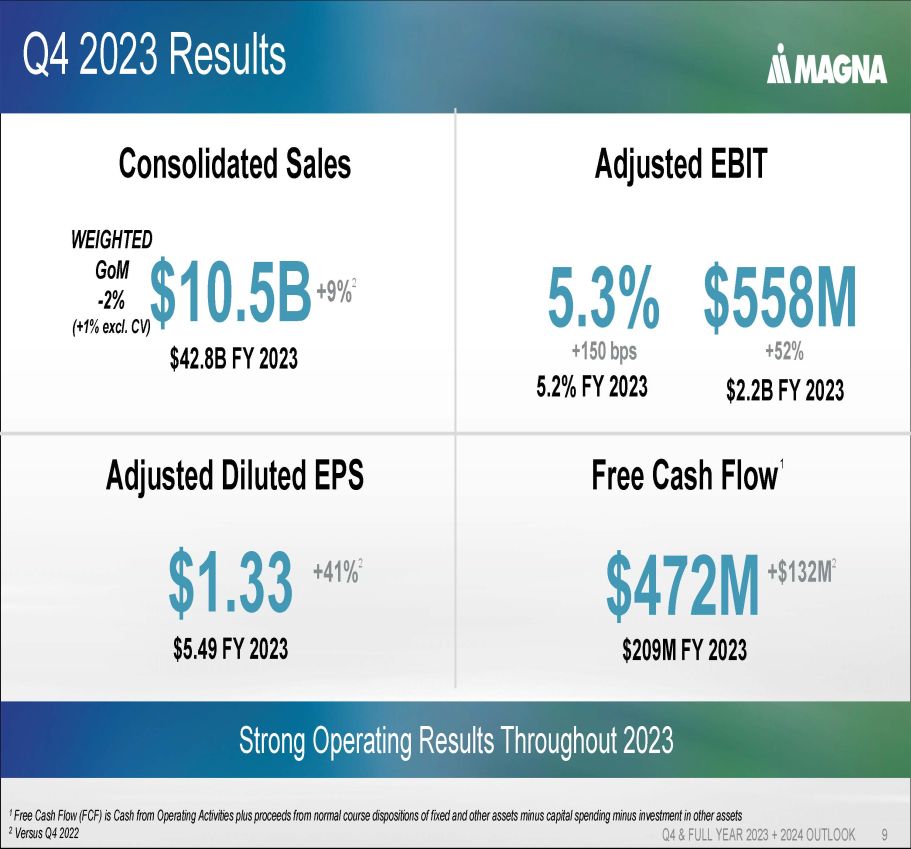
Q4 2023 Results Q4 & FULL YEAR 2023 + 2024 OUTLOOK 9 Strong Operating Results Throughout 2023 1 Free Cash Flow (FCF) is Cash from Operating Activities plus proceeds from normal course dispositions of fixed and other asset s m inus capital spending minus investment in other assets 2 Versus Q4 2022 Consolidated Sales $10.5B WEIGHTED GoM - 2% (+1% excl. CV) $42.8B FY 2023 +9% 2 Adjusted Diluted EPS $1.33 $5.49 FY 2023 +41 % 2 Free Cash Flow 1 $472M $209M FY 2023 +$132M 2 Adjusted EBIT 5.2% FY 2023 5.3% +150 bps $558M +52% $2.2B FY 2023

2023 Accomplishments Q4 & FULL YEAR 2023 + 2024 OUTLOOK 10 • Executed on Operational Excellence activities • 107 customer recognition awards • Committed to net zero by 2050 Operational Excellence • New business in core areas: ‒ Advanced front camera modules ‒ Battery enclosures ‒ E - Drives • Industry - first 100% melt recyclable foam and trim seating solutions Driving Innovation • Launched Operational Management Accelerator program • Named one of Ethisphere's "World's Most Ethical Companies" – 2 nd consecutive year • Named one of Fortune's "World's Most Admired Companies" – 7 th consecutive year People Focus • Weighted Sales Growth over Mark et o f 2% (3% excl. Complete Vehicles) • ~$12 billion in business awards (average annual sales) • Continued progress on Veoneer Active Safety integration Sales Growth
Pat McCann Executive Vice President & Chief Financial Officer Q4 & FULL YEAR 2023 + 2024 OUTLOOK 11
Q4 and 2023 Results Q4 & FULL YEAR 2023 + 2024 OUTLOOK 12

2023 Financial Results Q4 & FULL YEAR 2023 + 2024 OUTLOOK 13 Consolidated Sales ($Billions) $37.8 $42.8 0.0 0.1 0.1 0.1 0.1 0.1 0.1 0.1 $0.0 $5.0 $10.0 $15.0 $20.0 $25.0 $30.0 $35.0 $40.0 $45.0 2022 2023 +13% Adjusted EPS ($) $4.24 $5.49 0.0 0.1 0.1 0.1 0.1 0.1 0.1 0.1 $0.00 $1.00 $2.00 $3.00 $4.00 $5.00 $6.00 2022 2023 +29% 4.5% 5.2% 0.0% 1.0% 2.0% 3.0% 4.0% 5.0% 6.0% 2022 2023 Adjusted EBIT Margin (%) +70bps
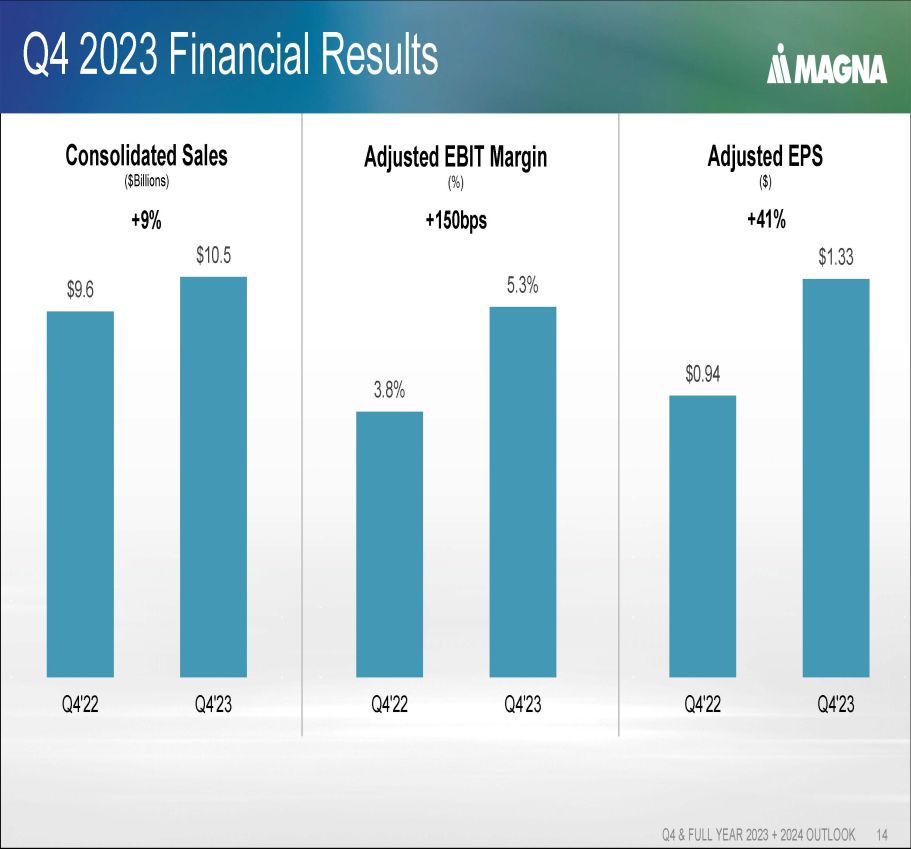
Q4 2023 Financial Results Q4 & FULL YEAR 2023 + 2024 OUTLOOK 14 Consolidated Sales ($Billions) $9.6 $10.5 0.0 0.1 0.1 0.1 0.1 0.1 0.1 0.1 $0.0 $2.0 $4.0 $6.0 $8.0 $10.0 Q4'22 Q4'23 +9% Adjusted EPS ($) $0.94 $1.33 0.0 0.1 0.1 0.1 0.1 0.1 0.1 0.1 $0.00 $0.20 $0.40 $0.60 $0.80 $1.00 $1.20 $1.40 Q4'22 Q4'23 +41% Adjusted EBIT Margin (%) 3.8% 5.3% 0.0% 1.0% 2.0% 3.0% 4.0% 5.0% 6.0% Q4'22 Q4'23 +150bps

Q4 2023 Financial Results Q4 & FULL YEAR 2023 + 2024 OUTLOOK 15 Weighted GoM - 2% (+1% excl. Complete Vehicles) Consolidated Sales ($Millions) +9% 1 Q4 2023 PRODUCTION 7% Global 5% North America - 11% Detroit - based 7% Europe 12% China 6% Magna Weighted 1 Includes customer recoveries of certain higher production input costs and contractual customer price givebacks

Q4 2023 Financial Results Q4 & FULL YEAR 2023 + 2024 OUTLOOK 16 • Operational – Operational excellence activities – Productivity and efficiency improvements – Higher tooling contribution • Volumes, Performance & Other – Earnings on higher sales – Impact of UAW strike ( - ) – Program changeover in Complete Vehicles ( - ) • Non - Recurring – Lower warranty costs (+) – Net commercial items (+) – Restructuring costs ( - ) – Lower amortization on pubco securities ( - ) – FX loss on Argentinian peso ( - ) • Lower Net Input Costs – Customer recoveries – Lower costs for energy and commodities – Higher labour costs • Lower Equity Income – Earnings on higher unconsolidated sales (+) – Finalization of year end tax balances in one JV ( - ) – Unfavourable product mix ( - ) 1 Excludes the amortization of acquired intangibles $558 1 $367 1 Adjusted EBIT & Margin ($Millions) 1 1
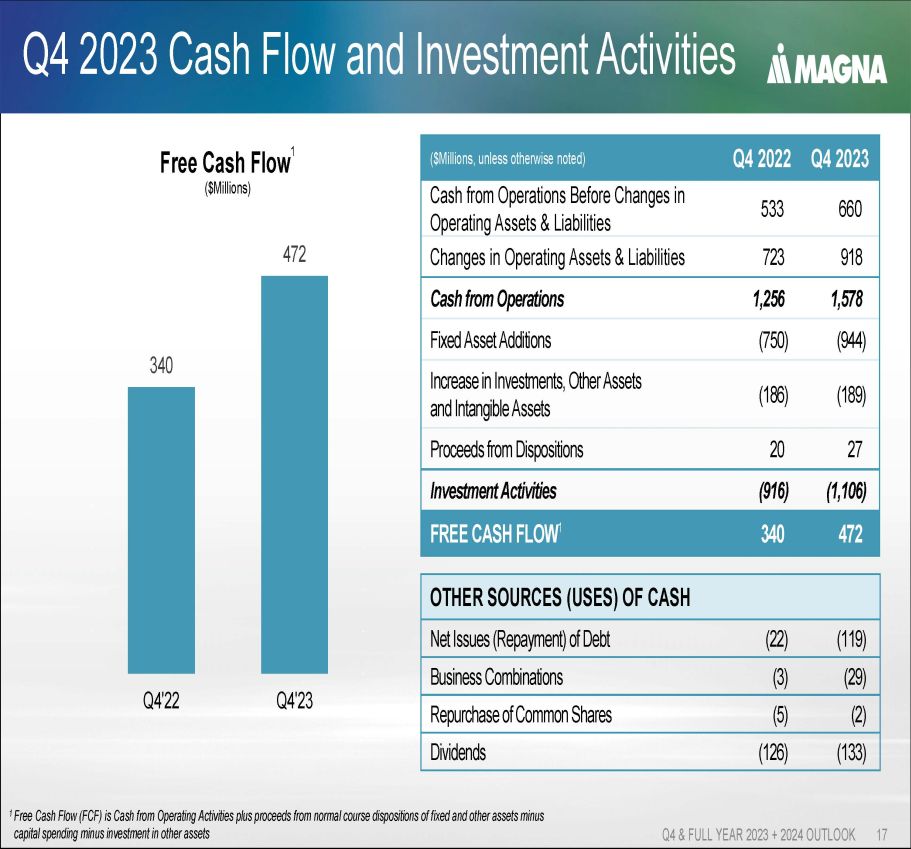
Q4 2023 Cash Flow and Investment Activities Q4 & FULL YEAR 2023 + 2024 OUTLOOK 17 Free Cash Flow 1 ($Millions) OTHER SOURCES (USES) OF CASH (119) (22) Net Issues (Repayment) of Debt (29) (3) Business Combinations (2) (5) Repurchase of Common Shares (133) (126) Dividends Q4 2023 Q4 2022 ($Millions, unless otherwise noted) 660 533 Cash from Operations Before Changes in Operating Assets & Liabilities 918 723 Changes in Operating Assets & Liabilities 1,578 1,256 Cash from Operations (944) (750) Fixed Asset Additions (189) (186) Increase in Investments, Other Assets and Intangible Assets 27 20 Proceeds from Dispositions (1,106) (916) Investment Activities 472 340 FREE CASH FLOW 1 340 472 0.0 0.0 0.0 0.0 0.1 0.1 0.1 0.1 0.1 0.1 0.1 0 50 100 150 200 250 300 350 400 450 500 Q4'22 Q4'23 1 Free Cash Flow (FCF) is Cash from Operating Activities plus proceeds from normal course dispositions of fixed and other asset s m inus capital spending minus investment in other assets
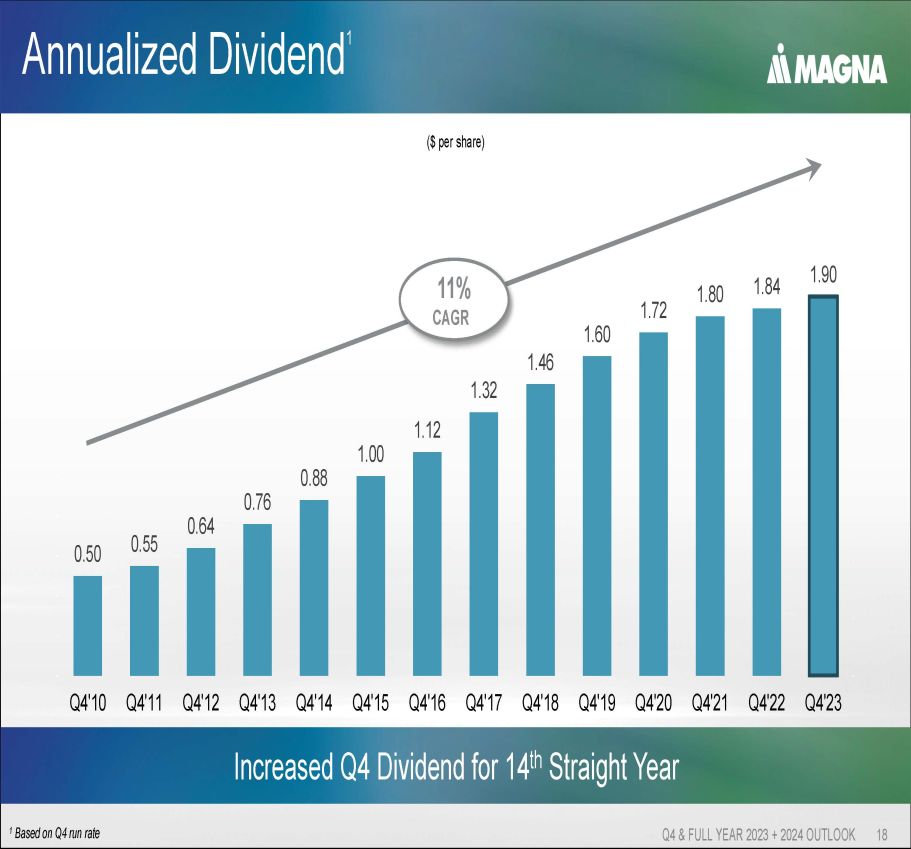
Annualized Dividend 1 Q4 & FULL YEAR 2023 + 2024 OUTLOOK 18 Increased Q4 Dividend for 14 th Straight Year 0.50 0.55 0.64 0.76 0.88 1.00 1.12 1.32 1.46 1.60 1.72 1.80 1.84 1.90 0.0 0.1 0.1 0.1 0.1 0.1 0.1 0.1 0.00 0.20 0.40 0.60 0.80 1.00 1.20 1.40 1.60 1.80 2.00 Q4'10 Q4'11 Q4'12 Q4'13 Q4'14 Q4'15 Q4'16 Q4'17 Q4'18 Q4'19 Q4'20 Q4'21 Q4'22 Q4'23 ($ per share) 11% CAGR 1 Based on Q4 run rate
2024 Outlook Q4 & FULL YEAR 2023 + 2024 OUTLOOK 19

Q4 & FULL YEAR 2023 + 2024 OUTLOOK 20 Further Advancing Our Go - Forward Strategy Accelerate Deployment of Capital towards High - Growth Areas Unlock New Business Models and Markets Drive Operational Excellence

Q4 & FULL YEAR 2023 + 2024 OUTLOOK 21 Tailwinds • Launching content on exciting new programs • Significant sales and Adjusted EBIT growth in megatrend areas • Continued traction in Operational Excellence – Contributing to margin expansion through outlook period Headwinds • Continuing net input cost increases – Labour , Scrap steel • Macro Challenges – Impacts of higher interest rates, inflation on consumers – Moderating industry production growth • EV penetration pushed out – Some impact on expected sales growth Overview of 2024 Outlook

Overview of 2024 Outlook – Financial Metrics Q4 & FULL YEAR 2023 + 2024 OUTLOOK 22 1 Free Cash Flow (FCF) is Cash from Operating Activities plus proceeds from normal course dispositions of fixed and other asset s m inus capital spending minus investment in other assets 2 Includes ~$300M related to acquisition of Veoneer Active Safety Sales Growth Ongoing focus on disciplined profitable growth Weighted sales growth over market averaging 3 - 5% over 2023 - 2026 period Free Cash Flow 1 Improvement Anticipate increases each year over outlook period $2B+ in 2026 Investment for Growth Annual engineering continues to average ~$1.2B 2 in megatrend areas – rapidly declining as a % of sales Capital spending expected to decline post - 2024, cap/ex to sales ratio normalizing Margin Expansion 180 bps or more of EBIT margin improvement 2023 to 2026 Operational excellence activities and contribution on higher sales are key factors

Rapid Megatrend Sales Growth through Outlook Q4 & FULL YEAR 2023 + 2024 OUTLOOK 23 1 Powertrain electrification includes consolidated 48 - volt and high - voltage sales Sales 0% 20% 40% 60% 80% 100% 120% 0.0 1.0 2.0 3.0 4.0 5.0 6.0 7.0 8.0 2022 2023 2024F 2025F 2026F ($Billions) (% of sales) 4.2 - 4.6 2.5 Powertrain Electrification 1 Battery Enclosures Active Safety Eng. % of Sales <1.0 5.5 - 6.0 6.6 - 7.2 >($500) 2022 2023 2024F 2025F 2026F Adjusted EBIT ($Millions) Megatrend profitability inflection point expected in 2026

Consolidated Outlook Q4 & FULL YEAR 2023 + 2024 OUTLOOK 24

Financial Outlook – Key Assumptions Q4 & FULL YEAR 2023 + 2024 OUTLOOK 25 Automotive Light Vehicle Production (millions of units) 2026 2024 2023 16.1 15.7 15.6 North America 17.3 17.4 17.5 Europe 30.6 28.3 28.6 China ~1% ('23 - '26) ~0% ('23 - '24) Weighted GLVP CAGR U.S. Foreign Exchange Rates 2026 2024 2023 0.740 0.740 0.742 Cdn 1.080 1.080 1.082 Euro 0.137 0.137 0.141 RMB Acquisitions/Divestitures No material unannounced acquisitions/divestitures Content Growth Driving Organic Sales
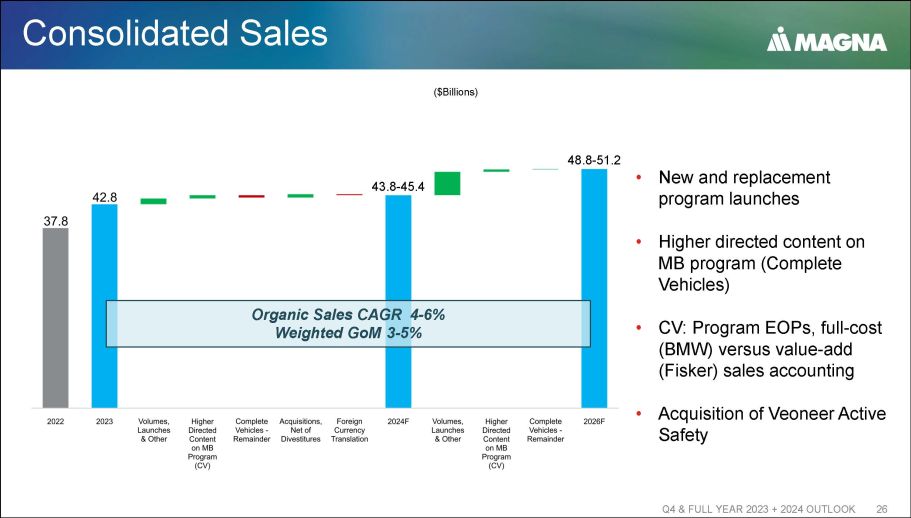
Consolidated Sales Q4 & FULL YEAR 2023 + 2024 OUTLOOK 26 ($Billions) • New and replacement program launches • Higher directed content on MB program (Complete Vehicles) • CV: Program EOPs, full - cost (BMW) versus value - add ( Fisker ) sales accounting • Acquisition of Veoneer Active Safety 43.8 - 45.4 48.8 - 51.2 Organic Sales CAGR 4 - 6% Weighted GoM 3 - 5%
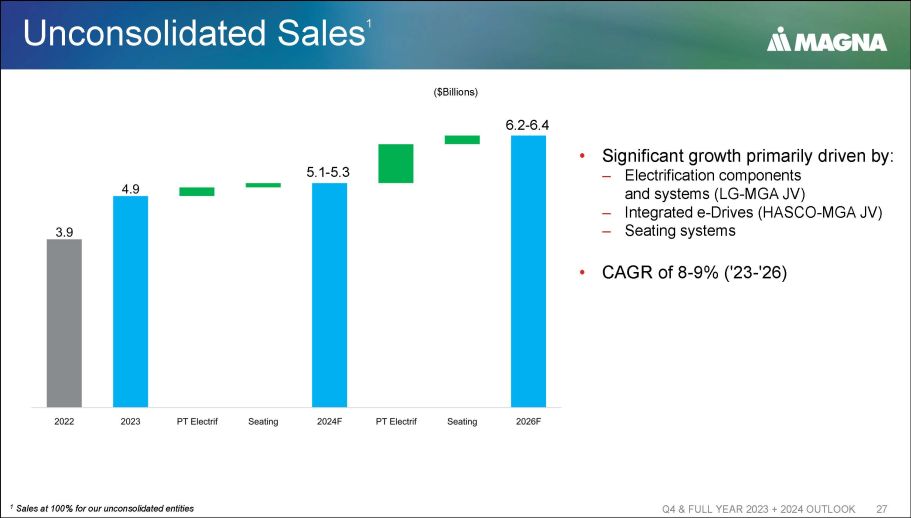
Unconsolidated Sales 1 Q4 & FULL YEAR 2023 + 2024 OUTLOOK 27 ($Billions) 1 Sales at 100% for our unconsolidated entities • Significant growth primarily driven by: – Electrification components and systems (LG - MGA JV) – Integrated e - Drives (HASCO - MGA JV) – Seating systems • CAGR of 8 - 9% ('23 - '26) 5.1 - 5.3 6.2 - 6.4
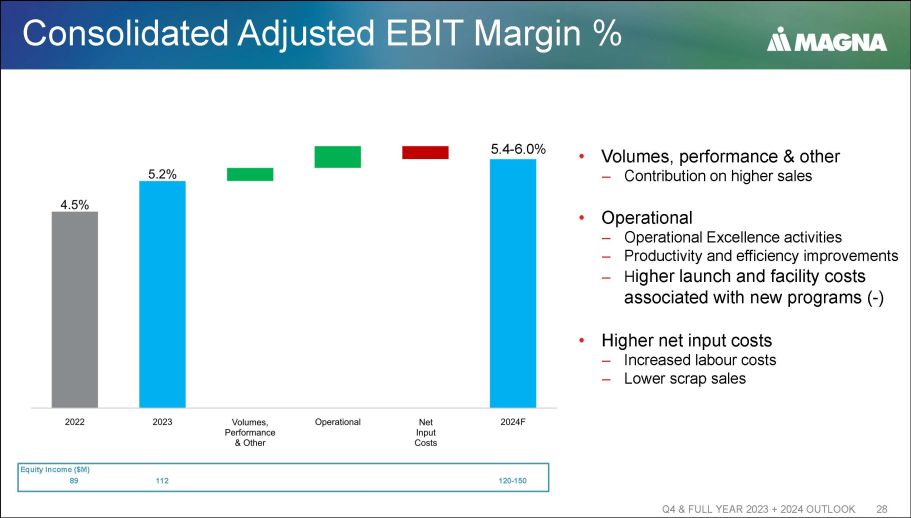
Consolidated Adjusted EBIT Margin % Q4 & FULL YEAR 2023 + 2024 OUTLOOK 28 • Volumes, performance & other – Contribution on higher sales • Operational – Operational Excellence activities – Productivity and efficiency improvements – H igher launch and facility costs associated with new programs ( - ) • Higher net input costs – Increased labour costs – Lower scrap sales 5.4 - 6.0% Equity Income ($M) 89 112 120 - 150
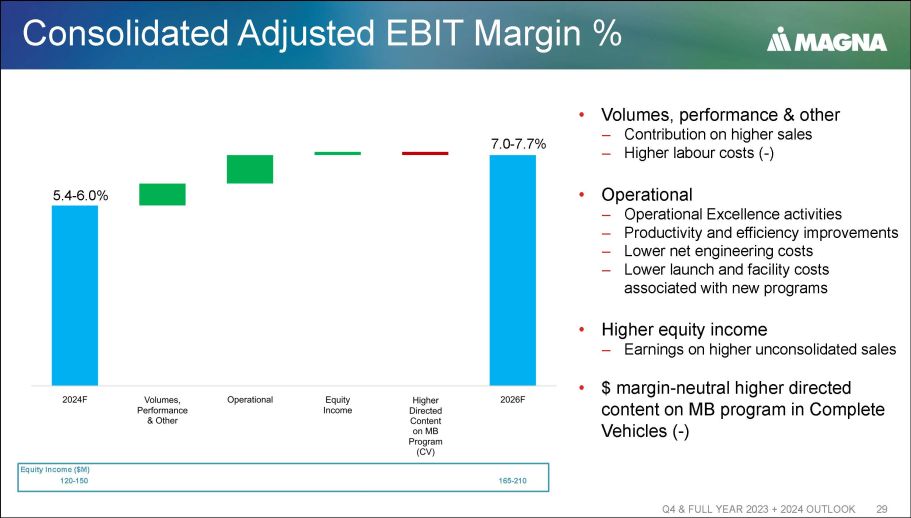
Consolidated Adjusted EBIT Margin % Q4 & FULL YEAR 2023 + 2024 OUTLOOK 29 5.4 - 6.0% 7.0 - 7.7% Equity Income ($M) 120 - 150 165 - 210 • Volumes, performance & other – Contribution on higher sales – Higher labour costs ( - ) • Operational – Operational Excellence activities – Productivity and efficiency improvements – Lower net engineering costs – Lower launch and facility costs associated with new programs • Higher equity income – Earnings on higher unconsolidated sales • $ margin - neutral higher directed content on MB program in Complete Vehicles ( - )

Segment Outlook Q4 & FULL YEAR 2023 + 2024 OUTLOOK 30

Segment Sales & Adjusted EBIT Margin % Q4 & FULL YEAR 2023 + 2024 OUTLOOK 31 2022 2023 2024F 2026F 5.3 7.4 7.4 - 8.0 8.3 - 9.0 2022 2023 2024F 2026F 2.0 3.6 3.1 - 3.7 4.5 - 5.2 2022 2023 2024F 2026F 4.2 4.7 5.5 - 6.1 7.8 - 8.5 2022 2023 2024F 2026F 4.5 2.2 1.2 - 1.8 2.1 - 2.8 Sales ($Billions) Adjusted EBIT Margin % Body Exteriors & Structures 2022 2023 2024F 2026F 16.0 17.5 17.4 - 18.0 19.6 - 20.6 '23 - '26 4 - 6% CAGR Weighted GoM 3 - 5% Power & Vision 2022 2023 2024F 2026F 11.9 15.8 - 16.2 16.8 - 17.4 '23 - '26 6 - 7% CAGR 14.3 Weighted GoM 3 - 5% Seating Systems 2022 2023 2024F 2026F 5.3 6.0 5.5 - 5.8 6.5 - 6.9 '23 - '26 2 - 5% CAGR Weighted GoM 2 - 4% Complete Vehicles 2022 2023 2024F 2026F 5.2 5.5 5.6 - 5.9 6.1 - 6.5 Weighted GoM 3 - 5% '23 - '26 3 - 6% CAGR
Financial Strategy Q4 & FULL YEAR 2023 + 2024 OUTLOOK 32

Q4 & FULL YEAR 2023 + 2024 OUTLOOK 33 Maintain Strong Balance Sheet • Preserve liquidity and high investment grade credit ratings – Adj. debt to Adj. EBITDA ratio between 1.0 - 1.5x • Maintain flexibility to invest for growth Invest For Growth • Organic and inorganic opportunities • Innovation Return Capital To Shareholders • Continued dividend growth over time • Repurchase shares with excess liquidity Capital Allocation Principles

Continued Financial Strength Q4 & FULL YEAR 2023 + 2024 OUTLOOK 34 LEVERAGE RATIO (LTM, 31DEC23) ($M illions) 7,371 Adjusted Debt 3,905 Adjusted EBITDA 1.89 Adjusted Debt / Adjusted EBITDA TOTAL LIQUIDITY (31DEC23) ($M illions) 1,198 Cash 2,989 Available Term & Operating Lines of Credit 4,187 Total Liquidity Investment - grade ratings from Moody's, S&P, DBRS 2.19 2.02 1.89 0.0 0.5 1.0 1.5 2.0 2.5 Q2'23 Q3'23 Q4'23F 2025F Adjusted Debt/EBITDA Back in target range during 2025
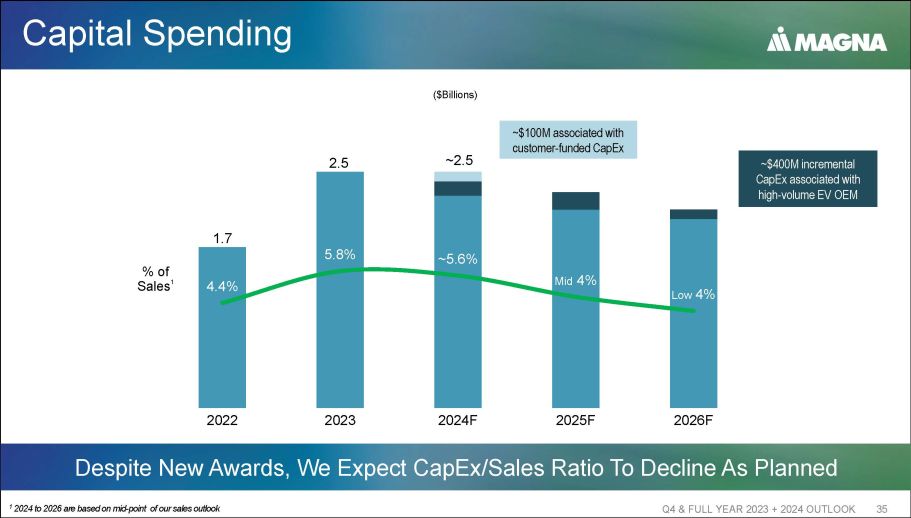
Capital Spending Q4 & FULL YEAR 2023 + 2024 OUTLOOK 35 Despite New Awards, We Expect CapEx /Sales Ratio To Decline As Planned 1 2024 to 2026 are based on mid - point of our sales outlook ($Billions) 1.7 2.5 ~2.5 4.4 % 5.8 % ~ 5.6 % Mid 4% Low 4% 2022 2023 2024F 2025F 2026F % of Sales 1 ~$400M incremental CapEx associated with high - volume EV OEM ~$100M associated with customer - funded CapEx
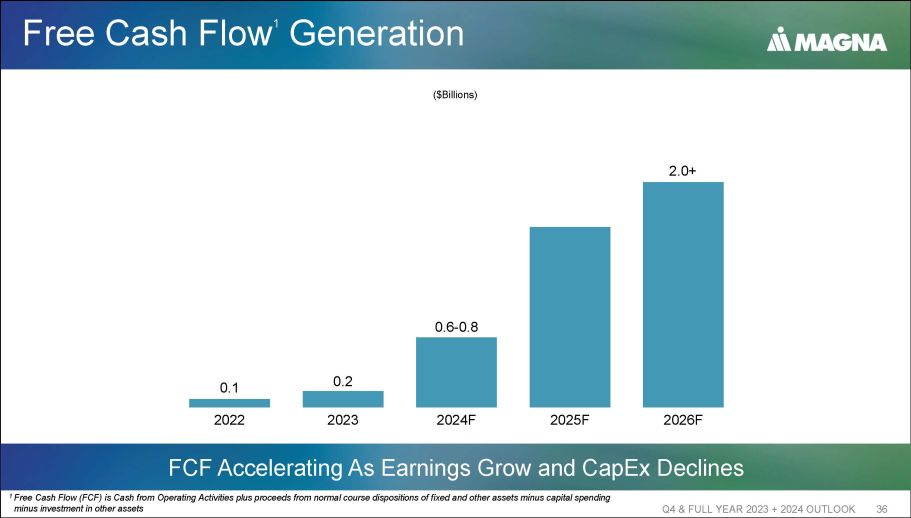
Free Cash Flow 1 Generation Q4 & FULL YEAR 2023 + 2024 OUTLOOK 36 FCF Accelerating As Earnings Grow and CapEx Declines 1 Free Cash Flow (FCF) is Cash from Operating Activities plus proceeds from normal course dispositions of fixed and other asset s m inus capital spending minus investment in other assets 0.1 0.2 0.6 - 0.8 2.0+ 2022 2023 2024F 2025F 2026F ($Billions)
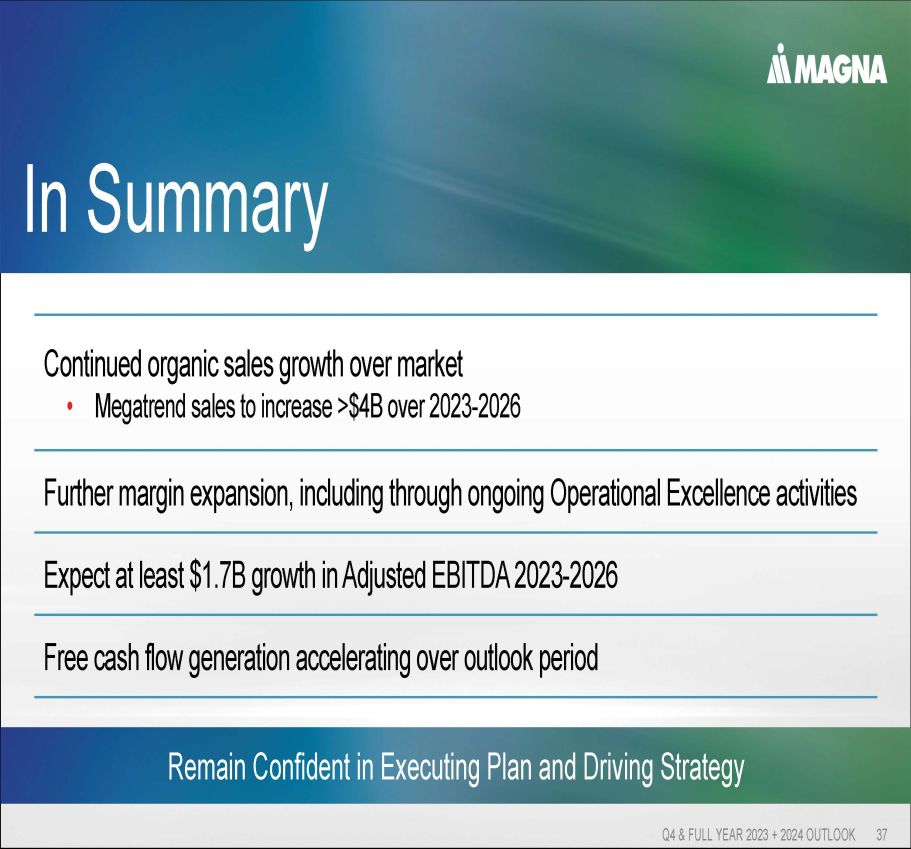
Q4 & FULL YEAR 2023 + 2024 OUTLOOK 37 In Summary Remain Confident in Executing Plan and Driving Strategy Continued organic sales growth over market • Megatrend sales to increase >$4B over 2023 - 2026 Further margin expansion, including through ongoing Operational Excellence activities Expect at least $1.7B growth in Adjusted EBITDA 2023 - 2026 Free cash flow generation accelerating over outlook period

Q4 & FULL YEAR 2023 + 2024 OUTLOOK 38
Appendix – Q4 2023 Results Q4 & FULL YEAR 2023 + 2024 OUTLOOK 39
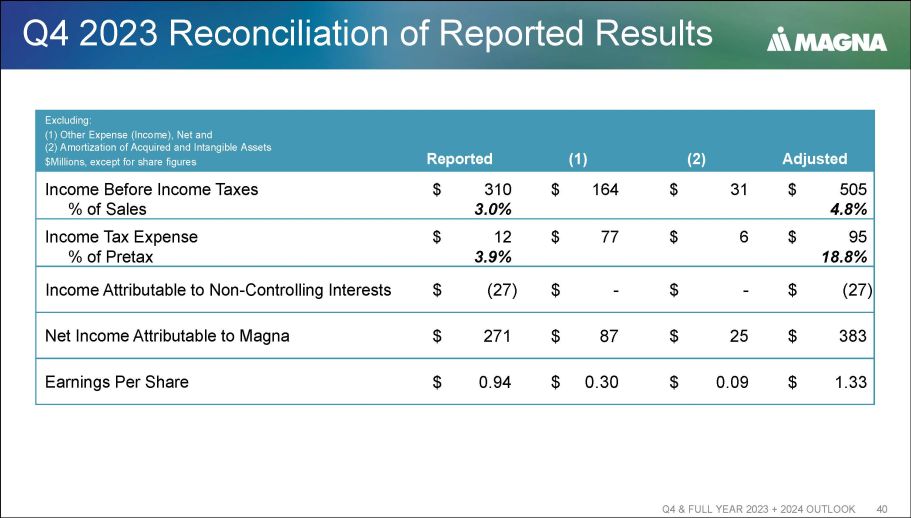
Q4 2023 Reconciliation of Reported Results Q4 & FULL YEAR 2023 + 2024 OUTLOOK 40 Adjusted (2) (1) Reported Excluding: (1) Other Expense (Income), Net and (2) Amortization of Acquired and Intangible Assets $Millions, except for share figures $ 505 $ 31 $ 164 $ 310 Income Before Income Taxes 4.8% 3.0% % of Sales $ 95 $ 6 $ 77 $ 12 Income Tax Expense 18.8% 3.9% % of Pretax $ (27) $ - $ - $ (27) Income Attributable to Non - Controlling Interests $ 383 $ 25 $ 87 $ 271 Net Income Attributable to Magna $ 1.33 $ 0.09 $ 0.30 $ 0.94 Earnings Per Share

Q4 2022 Reconciliation of Reported Results Q4 & FULL YEAR 2023 + 2024 OUTLOOK 41 Excl. Other Expense, Net (2) (1) Reported Excluding: (1) Other Expense, Net (2) Restate $Millions, except for share figures $ 350 $ 11 $ 193 $ 146 Income Before Income Taxes 3.7% 1.5% % of Sales $ 64 $ 2 $ 27 $ 35 Income Tax Expense 18.3% 24.0% % of Pretax $ (16) $ - $ - $ (16) Income Attributable to Non - Controlling Interests $ 270 $ 9 $ 166 $ 95 Net Income Attributable to Magna $ 0.94 $ 0.03 $ 0.58 $ 0.33 Earnings Per Share
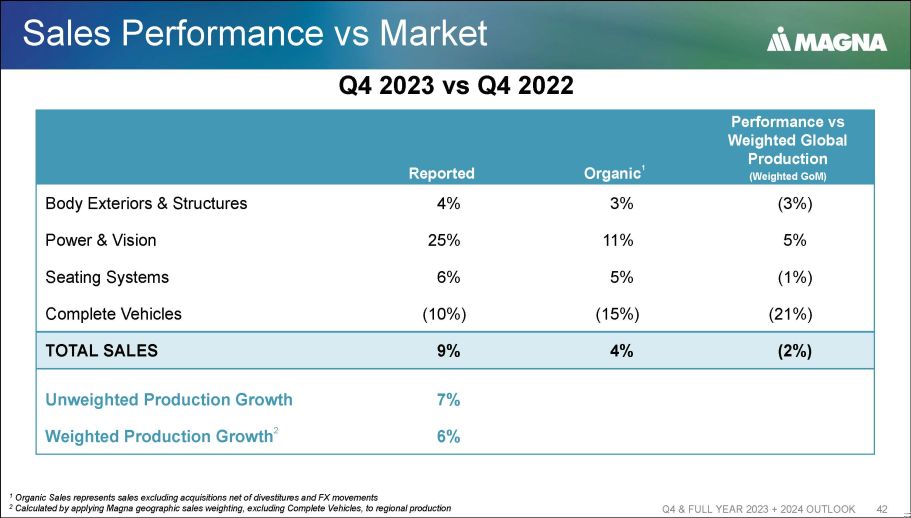
Sales Performance vs Market Q4 & FULL YEAR 2023 + 2024 OUTLOOK 42 Performance vs Weighted Global Production (Weighted GoM) Organic 1 Reported (3%) 3% 4% Body Exteriors & Structures 5% 11% 25% Power & Vision (1%) 5% 6% Seating Systems (21%) (15%) (10%) Complete Vehicles (2%) 4% 9% TOTAL SALES 7% Unweighted Production Growth 6% Weighted Production Growth 2 1 Organic Sales represents sales excluding acquisitions net of divestitures and FX movements 2 Calculated by applying Magna geographic sales weighting, excluding Complete Vehicles, to regional production Q4 2023 vs Q4 2022
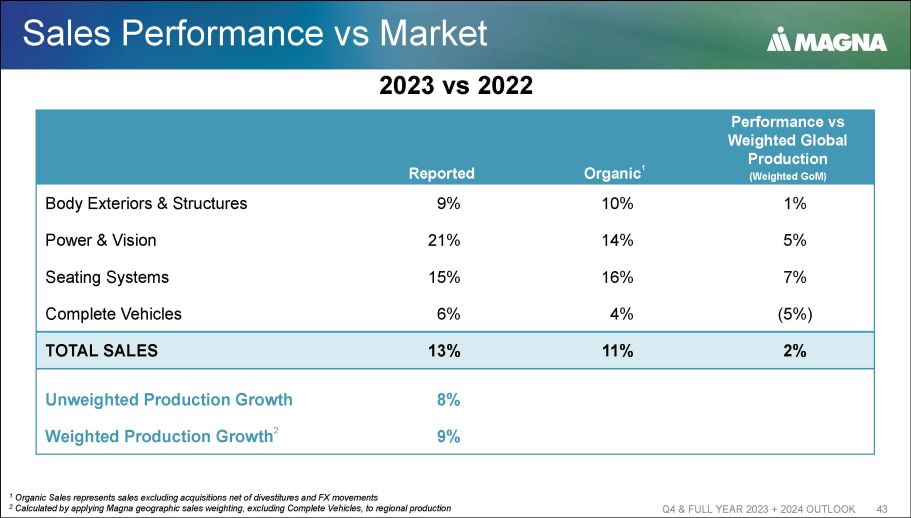
Sales Performance vs Market Q4 & FULL YEAR 2023 + 2024 OUTLOOK 43 Performance vs Weighted Global Production (Weighted GoM) Organic 1 Reported 1% 10% 9% Body Exteriors & Structures 5% 14% 21% Power & Vision 7% 16% 15% Seating Systems (5%) 4% 6% Complete Vehicles 2% 11% 13% TOTAL SALES 8% Unweighted Production Growth 9% Weighted Production Growth 2 1 Organic Sales represents sales excluding acquisitions net of divestitures and FX movements 2 Calculated by applying Magna geographic sales weighting, excluding Complete Vehicles, to regional production 2023 vs 2022
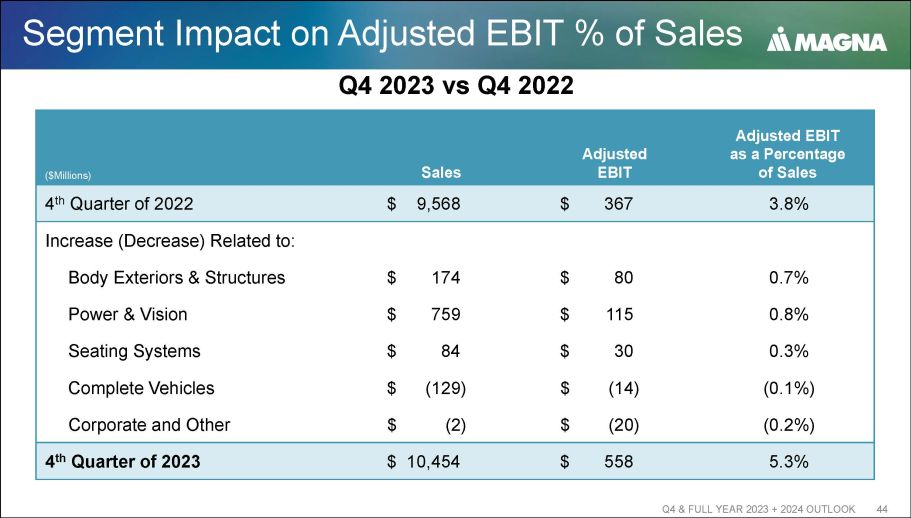
Segment Impact on Adjusted EBIT % of Sales Q4 & FULL YEAR 2023 + 2024 OUTLOOK 44 Adjusted EBIT as a Percentage of Sales Adjusted EBIT Sales ($Millions) 3.8% $ 367 $ 9,568 4 th Quarter of 2022 Increase (Decrease) Related to: 0.7% $ 80 $ 174 Body Exteriors & Structures 0.8% $ 115 $ 759 Power & Vision 0.3% $ 30 $ 84 Seating Systems (0.1%) $ (14) $ (129) Complete Vehicles (0.2%) $ (20) $ (2) Corporate and Other 5.3% $ 558 $ 10,454 4 th Quarter of 2023 Q4 2023 vs Q4 2022
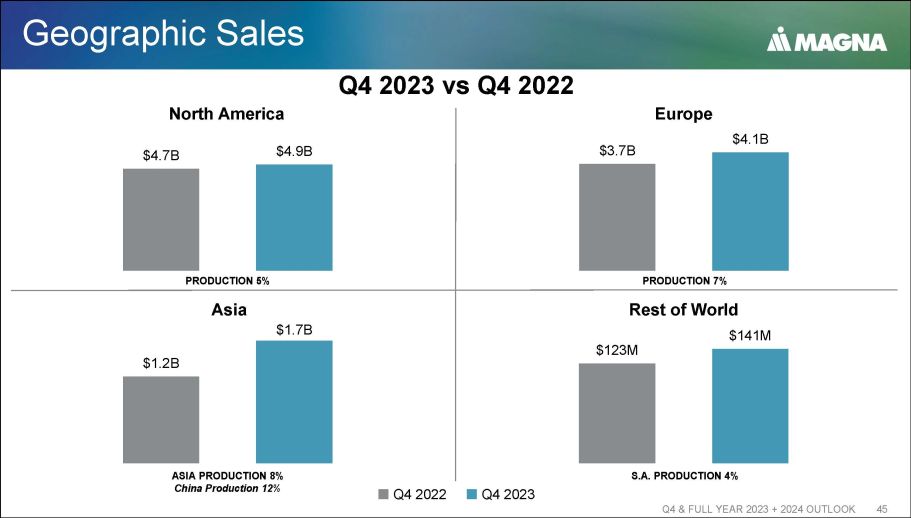
Geographic Sales Q4 & FULL YEAR 2023 + 2024 OUTLOOK 45 Q4 2022 Q4 2023 $4.7B $4.9B $0.0B $1.0B $2.0B $3.0B $4.0B $5.0B $6.0B North America PRODUCTION 5% $3.7B $4.1B $0.0B $0.5B $1.0B $1.5B $2.0B $2.5B $3.0B $3.5B $4.0B $4.5B Europe PRODUCTION 7% $123M $141M $0M $20M $40M $60M $80M $100M $120M $140M $160M S.A. PRODUCTION 4% Rest of World Q4 2023 vs Q4 2022 Asia ASIA PRODUCTION 8% China Production 12% $1.2B $1.7B $0.0B $0.2B $0.4B $0.6B $0.8B $1.0B $1.2B $1.4B $1.6B $1.8B

Q4 2023 Financial Results Q4 & FULL YEAR 2023 + 2024 OUTLOOK 46 CHANGE Q4 2023 Q4 2022 ($Millions, unless otherwise noted) 191 558 367 Adjusted EBIT 1 36 53 17 Interest Expense 155 505 350 Adjusted Pre - Tax Income 31 95 64 Adjusted Income Taxes 11 27 16 Income Attributable to Non - Controlling Interests 113 383 270 Adjusted Net Income Attributable to Magna 0.3 286.6 286.3 Diluted Share Count (millions of units) 0.39 1.33 0.94 Adjusted EPS ($) 18.3% 18.8% 1 Excludes the amortization of acquired intangibles
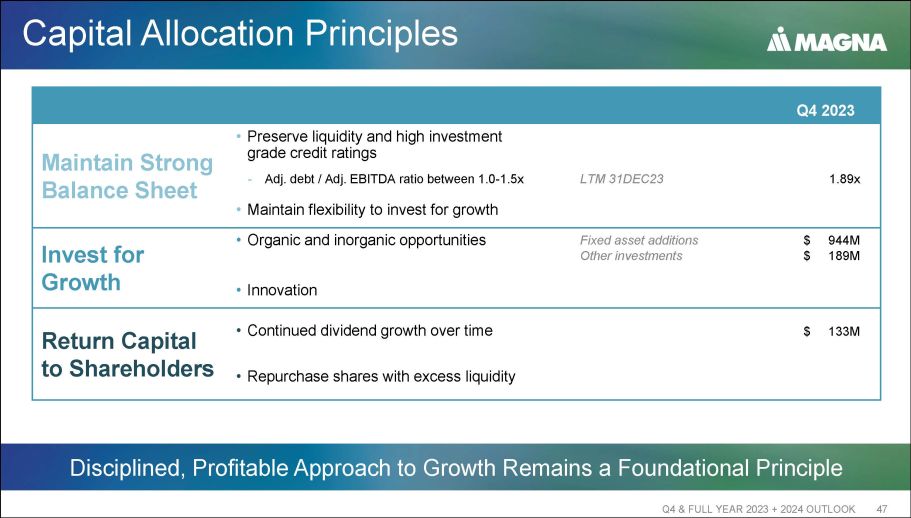
Capital Allocation Principles Q4 & FULL YEAR 2023 + 2024 OUTLOOK 47 Disciplined, Profitable Approach to Growth Remains a Foundational Principle Q4 2023 • Preserve liquidity and high investment grade credit ratings Maintain Strong Balance Sheet 1.89x LTM 31DEC23 - Adj. debt / Adj. EBITDA ratio between 1.0 - 1.5x • Maintain flexibility to invest for growth $ 944M $ 189M Fixed asset additions Other investments • Organic and inorganic opportunities Invest for Growth • Innovation $ 133M • Continued dividend growth over time Return Capital to Shareholders • Repurchase shares with excess liquidity
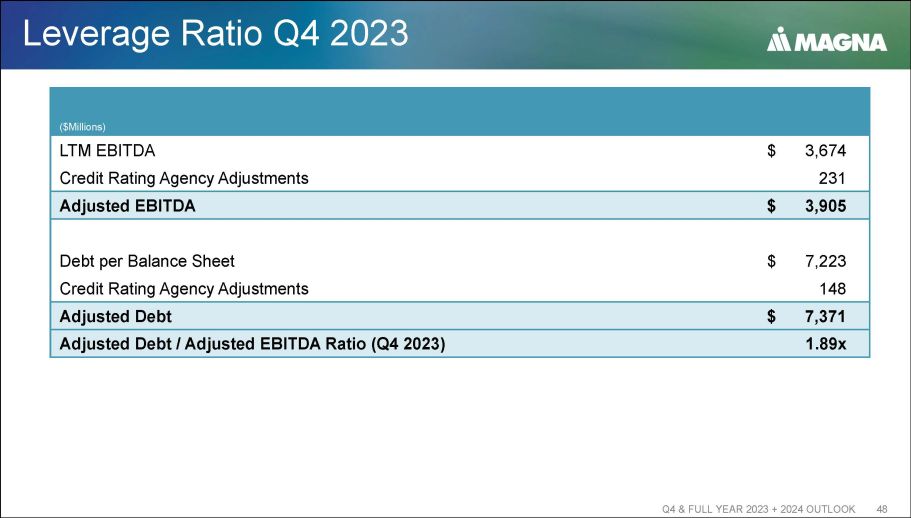
Leverage Ratio Q4 2023 Q4 & FULL YEAR 2023 + 2024 OUTLOOK 48 ($Millions) $ 3,674 LTM EBITDA 231 Credit Rating Agency Adjustments $ 3,905 Adjusted EBITDA $ 7,223 Debt per Balance Sheet 148 Credit Rating Agency Adjustments $ 7,371 Adjusted Debt 1.89x Adjusted Debt / Adjusted EBITDA Ratio (Q4 2023)

Appendix - Outlook Q4 & FULL YEAR 2023 + 2024 OUTLOOK 49
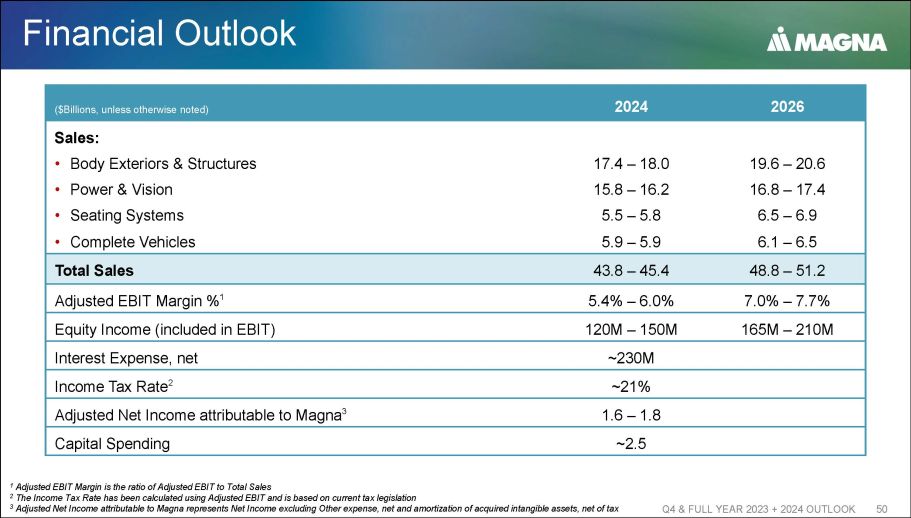
Financial Outlook Q4 & FULL YEAR 2023 + 2024 OUTLOOK 50 2026 2024 ($Billions, unless otherwise noted) Sales: 19.6 – 20.6 17.4 – 18.0 • Body Exteriors & Structures 16.8 – 17.4 15.8 – 16.2 • Power & Vision 6.5 – 6.9 5.5 – 5.8 • Seating Systems 6.1 – 6.5 5.9 – 5.9 • Complete Vehicles 48.8 – 51.2 43.8 – 45.4 Total Sales 7.0% – 7.7% 5.4% – 6.0% Adjusted EBIT Margin % 1 165M – 210M 120M – 150M Equity Income (included in EBIT) ~230M Interest Expense, net ~21% Income Tax Rate 2 1.6 – 1.8 Adjusted Net Income attributable to Magna 3 ~2.5 Capital Spending 1 Adjusted EBIT Margin is the ratio of Adjusted EBIT to Total Sales 2 The Income Tax Rate has been calculated using Adjusted EBIT and is based on current tax legislation 3 Adjusted Net Income attributable to Magna represents Net Income excluding Other expense, net and amortization of acquired int an gible assets, net of tax

Q4 & FULL YEAR 2023 + 2024 OUTLOOK 51