EXHIBIT 99.1


1 Brian Shipman Group Vice President, Investor Relations This presentation, including any supporting materials, is owned by Gartner, Inc. and/or its affiliates and is for the sole use of the intended Gartner audience or other authorized recipients. This presentation may contain information that is confidential, proprietary or otherwise legally protected, and it may not be further copied, distributed or publicly displayed without the express written permission of Gartner, Inc. or its affiliates. © 2014 Gartner, Inc. and/or its affiliates. All rights reserved. Forward Looking Statements Statements contained in this presentation regarding the growth and prospects of the business, the Company’s projected 2014 financial results, long-term objectives and all other statements in this presentation other than recitation of historical facts are forward looking statements (as defined in the Private Securities Litigation Reform Act of 1995). Such forward looking statements involve known and unknown risks, uncertainties and other factors; consequently, actual results may differ materially from those expressed or implied thereby. Factors that could cause actual results to differ materially include, but are not limited to, the ability to maintain and expand Gartner’s products and services; the ability to expand or retain Gartner’s customer base; the ability to grow or sustain revenue from individual customers; the ability to attract and retain a professional staff of research analysts and consultants upon whom Gartner is dependent; the ability to achieve and effectively manage growth, including the ability to integrate acquisitions and consummate acquisitions in the future; the ability to pay Gartner’s debt obligations; the ability to achieve continued customer renewals and achieve new contract value, backlog and deferred revenue growth in light of competitive pressures; the ability to carry out Gartner’s strategic initiatives and manage associated costs; the ability to successfully compete with existing competitors and potential new competitors; the ability to enforce our intellectual property rights; additional risks associated with international operations including foreign currency fluctuations; the impact of restructuring and other charges on Gartner’s businesses and operations; general economic conditions; risks associated with the credit worthiness and budget cuts of governments and agencies; and other risks listed from time to time in Gartner’s reports filed with the Securities and Exchange Commission, including Gartner’s most recent Annual Report on Form 10-K and Quarterly Reports on Form 10-Q. The Company’s SEC filings can be found on Gartner’s website at investor.gartner.com and on the SEC’s website at www.sec.gov. Forward looking statements included herein speak only as of February 13, 2014 and the Company disclaims any obligation to revise or update such statements to reflect events or circumstances after this date or to reflect the occurrence of unanticipated events or circumstances. 2


2 Agenda Business Overview Gene Hall Research Peter Sondergaard Events Alwyn Dawkins Consulting Per Anders Waern Break Sales David Godfrey Financial Overview Chris Lafond Summary / Q&A Gene Hall and Chris Lafond Why Gartner 4
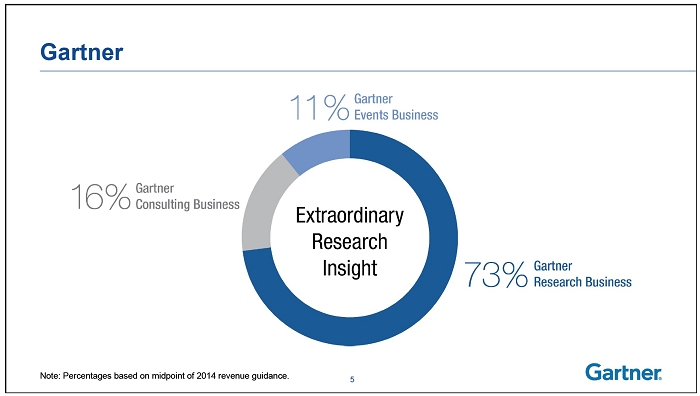

3 Gartner Note: Percentages based on midpoint of 2014 revenue guidance. 5 Gartner Research • Contract Value • Revenue • Earnings • EBITDA • Cash Flow 6
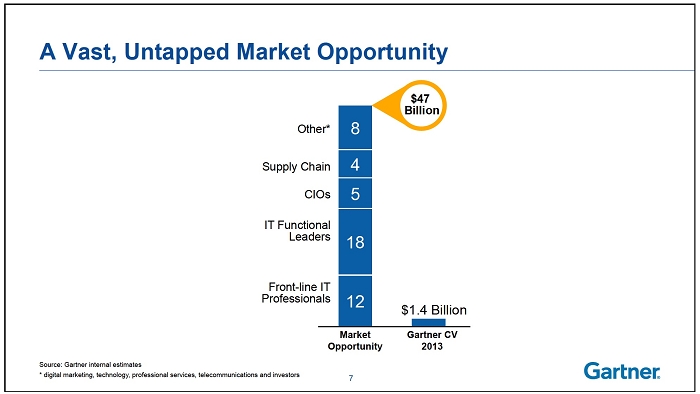
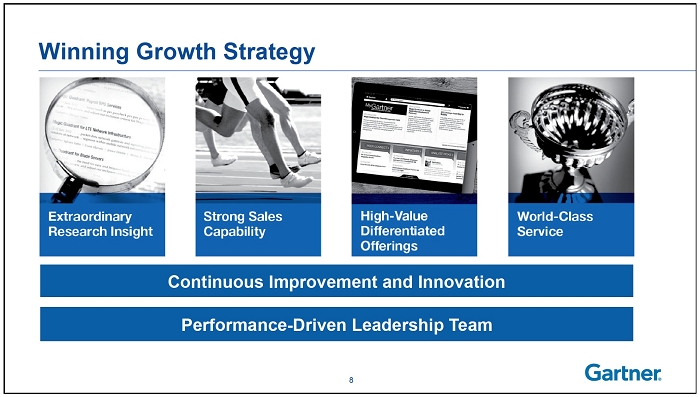
4 A Vast, Untapped Market Opportunity Consistent, double-digit growth Other* 8 Supply Chain 4 CIOs 5 IT Functional Leaders 18 Front-line IT Professionals 12 $47 Billion $1.4 Billion Market Opportunity Gartner CV 2013 Source: Gartner internal estimates * digital marketing, technology, professional services, telecommunications and investors 7 Winning Growth Strategy Continuous Improvement and Innovation Performance-Driven Leadership Team 8


5 Performance Driven Leadership Team Tenure World-Class Talent Global Avg Tenure at Gartner 14 years Avg Tenure in Role 7 years External 29% Acquisition 14% Promotion 57% Nationality Source of Leadership US Non-US 9 12%
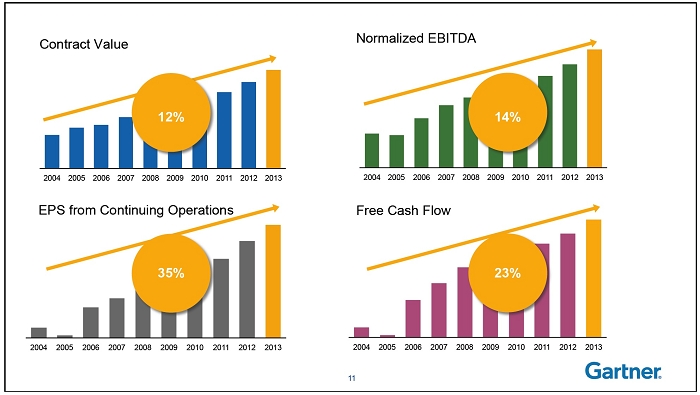

6 Contract Value 2004 2005 2006 2007 2008 2009 2010 2011 2012 2013 Normalized EBITDA 2004 2005 2006 2007 2008 2009 2010 2011 2012 2013 EPS from Continuing Operations 2004 2005 2006 2007 2008 2009 2010 2011 2012 2013 Free Cash Flow 2004 2005 2006 2007 2008 2009 2010 2011 2012 2013 12% 14% 35% 23% 11 Contract Value 2004 2005 2006 2007 2008 2009 2010 2011 2012 2013 12% 12


7 Why Gartner 13 Senior Vice President, Research Peter Sondergaard

8 Today’s Roadmap Accelerating Impact of Technology Unparalleled Value of Gartner Research Innovative Products 15


9

10 Business Process Business Model Business Moment


11 Business Moment TRANSIENT OPPORTUNITIES EXPLOITED DYNAMICALLY


12 Digitalization Suppliers Information


13 Unprecedented combinations of new technologies generating revenue and value. digitalization By 2017, 10% of computers will be learning rather than processing
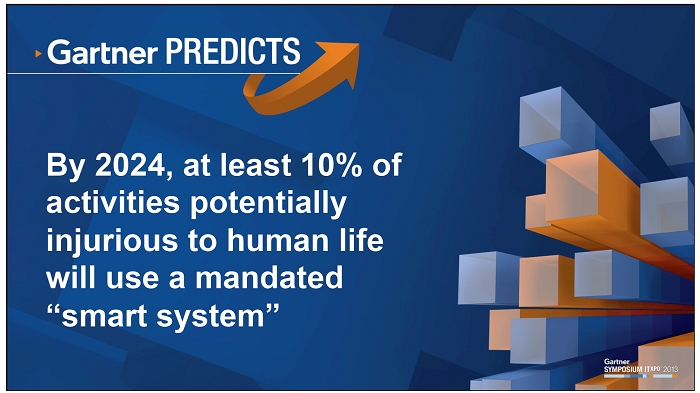

14 By 2024, at least 10% of activities potentially injurious to human life will use a mandated “smart system” By 2020, 1 in 3 knowledge workers will be replaced by enterprise owned smart machines they trained

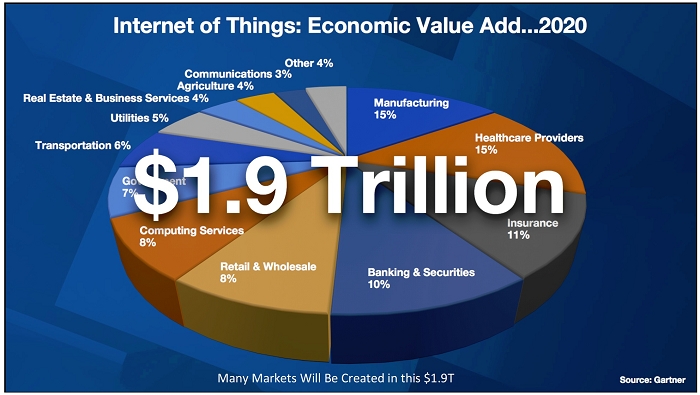
15 Many Markets Will Be Created in this $1.9T


16


17


18


19


20


21 ALL LEADERS ARE DIGITAL LEADERS Today’s Roadmap Accelerating Impact of Technology Unparalleled Value of Gartner Research Innovative Products 42


22 2013 Client Key Initiatives Source: Gartner.com Data, January 2014 2 Mobile Enterprise Strategy 3 IT Strategic Planning 4 Enterprise Architecture Program 5 Data Center Modernization and Consolidation 7 IT Cost Optimization 8 IT Governance 9 Process Improvement 10 BI & Analytics 1 Cloud Computing 6 Application Development 43 2006 Client Key Initiatives Source: Gartner.com Data, January 2007 4 Application Development 5 ERP & Supply Chain Management 6 Mobile & Wireless 7 Customer Relationship Management 8 Application Integration and Middleware 9 Outsourcing 10 Emerging Technologies 1 IT Strategic Planning 2 Security & Privacy 3 Business Intelligence 44

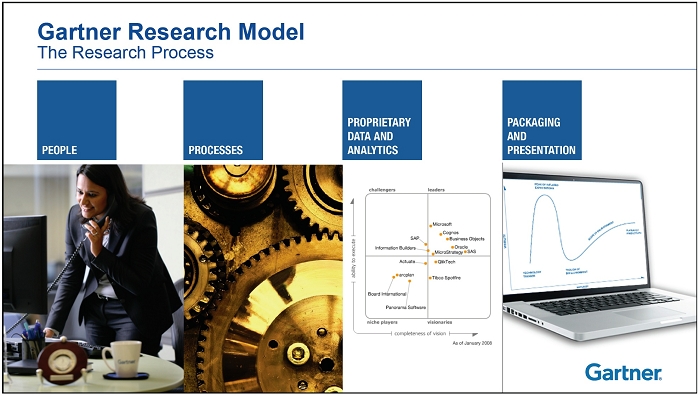
23 Gartner Note: Percentages based on midpoint of 2014 revenue guidance. 45 Gartner Research Model The Research Process


24 Gartner Research Model The People — Analysts Over 960 analysts in 30 countries Over 160 based in APAC, over 220 based in Europe Minimum 15 years of experience at time of hire 60% have 20+ years of industry experience 160 220 580 Subject Matter Experts 47 Decision Makers in 9,071 enterprises Technology & Service Providers 16,500 briefings Gartner Research Model The Research Process Academic Institutions Investors 48


25 Gartner Research Model The Research Process Transparency Objectivity Quality 49 2 Mobile Enterprise Strategy 3 IT Strategic Planning 4 Enterprise Architecture 5 Data Center Modernization and Consolidation Rank Key Initiative 1 Cloud Computing Gartner Research Model The Research Process 50
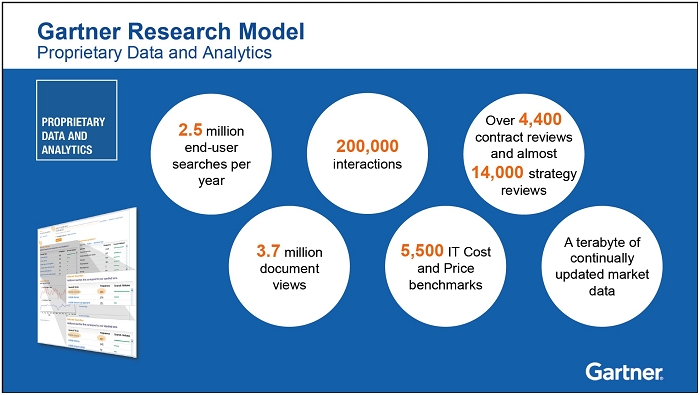
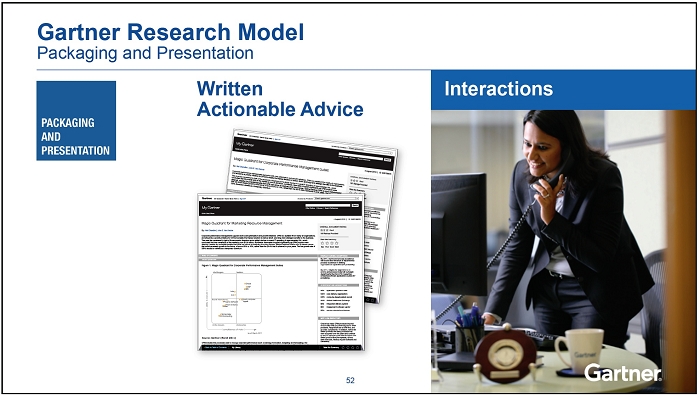
26 Gartner Research Model Proprietary Data and Analytics Over 4,400 contract reviews and almost 14,000 strategy reviews A terabyte of continually updated market data 5,500 IT Cost and Price benchmarks 200,000 interactions 3.7 million document views 2.5 million end-user searches per year Written Actionable Advice Gartner Research Model Packaging and Presentation Interactions 52


27 Select Research Documents: “Agenda Overview for Analytics, BI and Performance Management” “Gartner Business Analytics Framework” “Predicts 2014: BI & Analytics Will Remain CIO’s Top Priority” “Hype Cycle for Business Intelligence and Analytics” Gartner Research Model Packaging and Presentation Gartner Research Model Packaging and Presentation Select Research Documents: “Magic Quadrant for BI and Analytics Platforms” “Toolkit: BI and Analytics Platform RFP Template and Vendor Questionnaire” “Assessing Business Analytics in the Cloud” “Midmarket Insights: Criteria for Selecting the Right BI and Analytics Vendors”

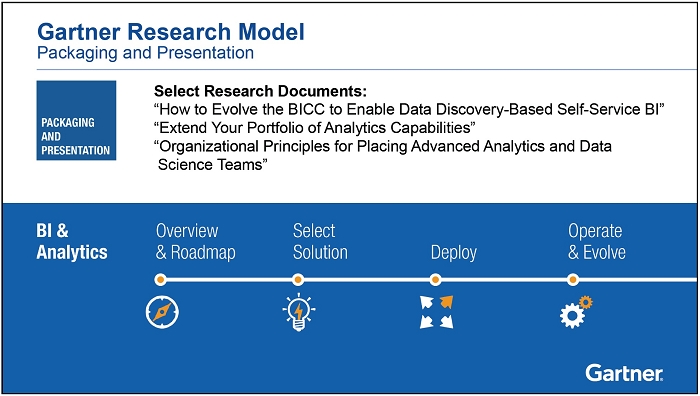
28 Gartner Research Model Packaging and Presentation Select Research Documents: “Toolkit: Effective Requirements Gathering in Business Analytics Projects” “Deliver BI with a ‘Think Global Act Local’ Organizational Model” “Use Incentives to Bolster BI Adoption and Advance Program Maturity” “Why Business Analytics Projects Succeed: Voices from the Field” Select Research Documents: “How to Evolve the BICC to Enable Data Discovery-Based Self-Service BI” “Extend Your Portfolio of Analytics Capabilities” “Organizational Principles for Placing Advanced Analytics and Data Science Teams” Gartner Research Model Packaging and Presentation
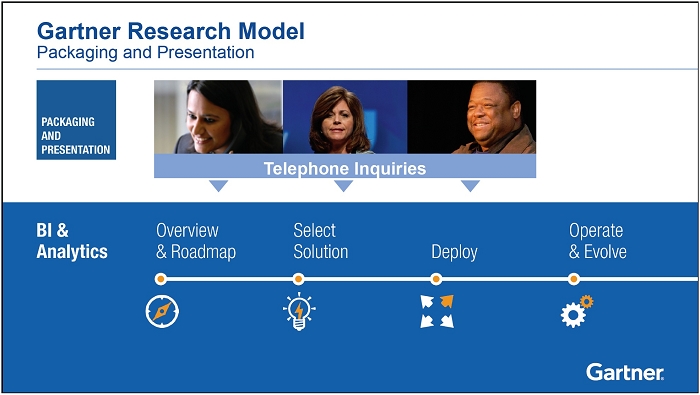
29 Gartner Research Model Packaging and Presentation Telephone Inquiries Today’s Roadmap Accelerating Impact of Technology Unparalleled Value of Gartner Research Innovative Products 58


30 Gartner for IT Executives Equips CIOs and senior executives with the tools and insights they need to deliver exceptional business results for their organizations and develop themselves as successful business leaders. Gartner Research Vast Untapped Market Opportunity $1.4 Billion Source: Gartner internal estimates * digital marketing, technology, professional services, telecommunications and investors $47 Billion Market Opportunity Other* Front-line IT Professionals Supply Chain CIOs IT Functional Leaders 12 18 5 4 8 Gartner CV 2013 Gartner Research Vast Untapped Market Opportunity $1.4 Billion $47 Billion Other* Front-line IT Professionals Supply Chain CIOs IT Functional Leaders 12 18 5 4 8 Gartner for IT Leaders Provides IT leaders with just-in-time, rolespecific insight and advice from Gartner analysts to drive success on critical initiatives and IT purchases. Market Opportunity Gartner CV 2013 Source: Gartner internal estimates * digital marketing, technology, professional services, telecommunications and investors


31 Gartner Research Vast Untapped Market Opportunity $1.4 Billion $47 Billion Other* Front-line IT Professionals Supply Chain CIOs IT Functional Leaders 12 18 5 4 8 Gartner for Technical Professionals Provides technical teams with in-depth advice for implementing the CIO’s strategy through projectbased research and reference architecture. Market Opportunity Gartner CV 2013 Source: Gartner internal estimates * digital marketing, technology, professional services, telecommunications and investors Gartner for Supply Chain Leaders Provides Supply Chain Leaders tools and advice tied to their key initiatives to improve business performance. Gartner Research Vast Untapped Market Opportunity $1.4 Billion $47 Billion Other* Front-line IT Professionals Supply Chain CIOs IT Functional Leaders 12 18 5 4 8 Market Opportunity Gartner CV 2013 Source: Gartner internal estimates * digital marketing, technology, professional services, telecommunications and investors
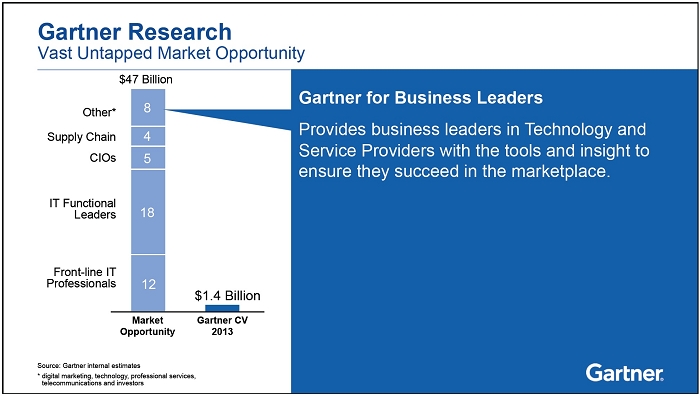
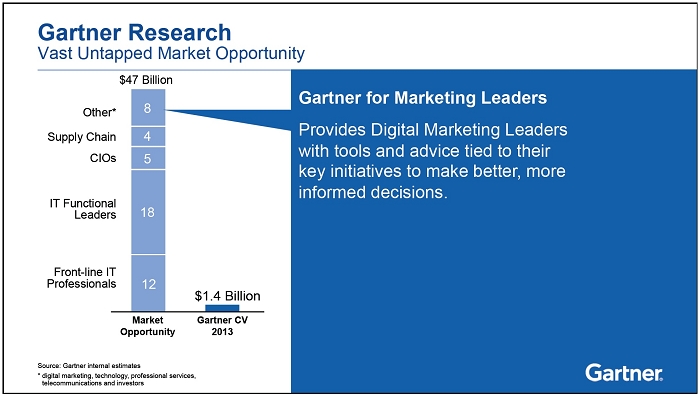
32 Gartner Research Vast Untapped Market Opportunity $1.4 Billion $47 Billion Other* Front-line IT Professionals Supply Chain CIOs IT Functional Leaders 12 18 5 4 8 Gartner for Business Leaders Provides business leaders in Technology and Service Providers with the tools and insight to ensure they succeed in the marketplace. Market Opportunity Gartner CV 2013 Source: Gartner internal estimates * digital marketing, technology, professional services, telecommunications and investors Gartner Research Vast Untapped Market Opportunity $1.4 Billion $47 Billion Other* Front-line IT Professionals Supply Chain CIOs IT Functional Leaders 12 18 5 4 8 Gartner for Marketing Leaders Provides Digital Marketing Leaders with tools and advice tied to their key initiatives to make better, more informed decisions. Source: Gartner internal estimates * digital marketing, technology, professional services, telecommunications and investors Market Opportunity Gartner CV 2013
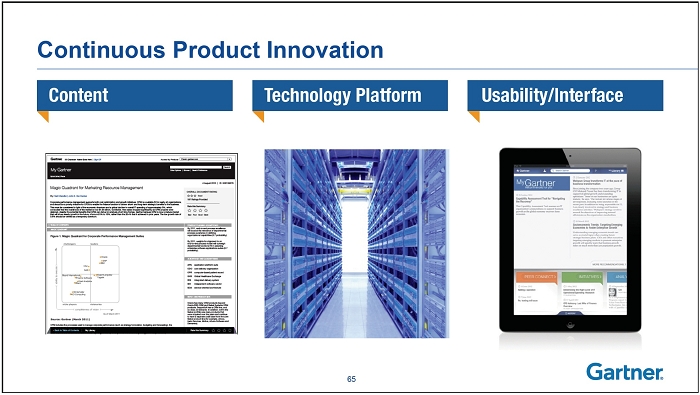

33 Continuous Product Innovation 65 Strong Value Proposition Right direction, right away Immediate shortlists on key initiatives Contract proposal reviews Best-practice budget benchmark Global perspective Best practice by vertical industry Strategic guidance Making the right decision Personal development Increased credibility

34 Why Gartner 67 Senior Vice President, Gartner Events Alwyn Dawkins


35 Why Gartner 69 Gartner Events Differentiated live events leveraging research content 70


36 Make every conference we produce theMUST ATTENDevent for the communities we serve Our mission: Gartner Events 64 Events 6 Continents World’s Leading IT Conference Producer 45,000 Attendees 2,000 Exhibitors
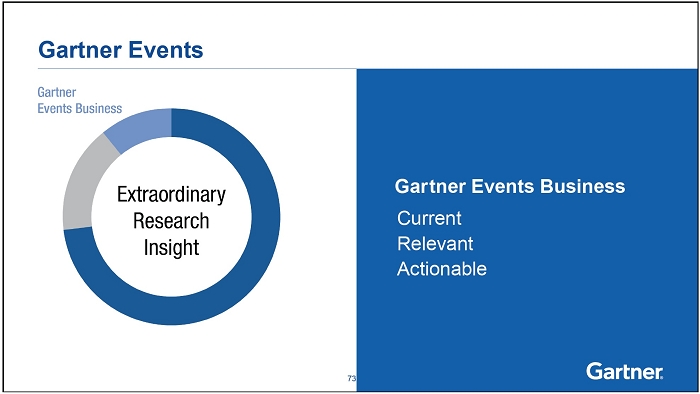
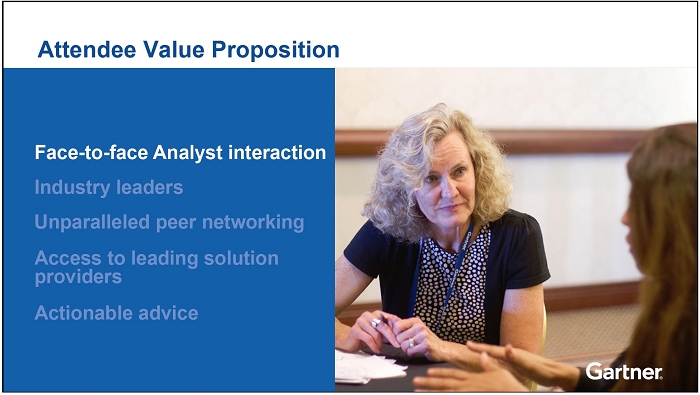
37 Gartner Events Current Relevant Actionable Gartner Events Business 73 Attendee Value Proposition Face-to-face Analyst interaction Industry leaders Unparalleled peer networking Access to leading solution providers Actionable advice


38 Attendee Value Proposition 75 Face-to-face Analyst interaction Industry leaders Unparalleled peer networking Access to leading solution providers Actionable advice Attendee Value Proposition Face-to-face Analyst interaction Industry leaders Unparalleled peer networking Access to leading solution providers Actionable advice

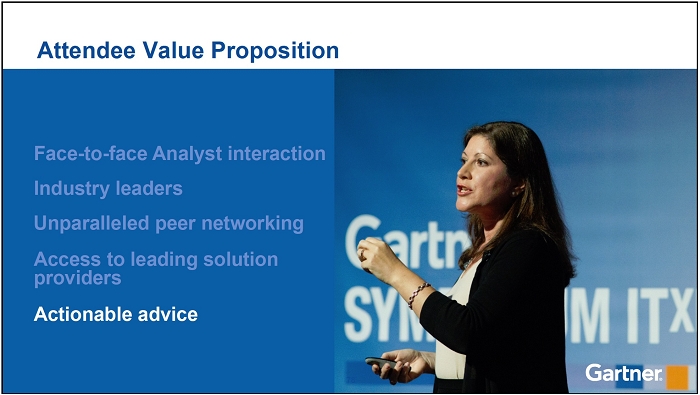
39 Attendee Value Proposition Face-to-face Analyst interaction Industry leaders Unparalleled peer networking Access to leading solution providers Actionable advice Attendee Value Proposition 78 Face-to-face Analyst interaction Industry leaders Unparalleled peer networking Access to leading solution providers Actionable advice

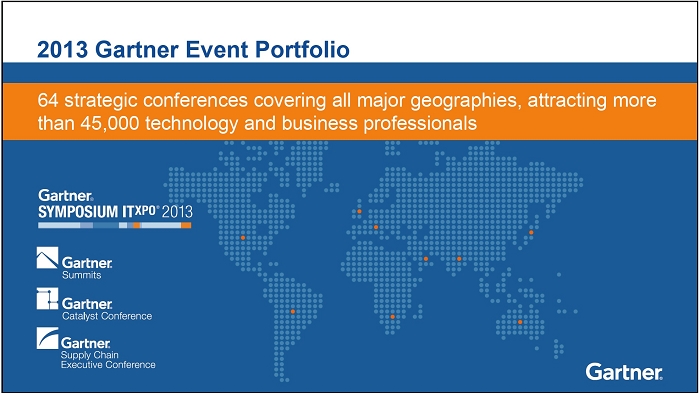
40 Exhibitor Value Proposition Face to face interaction with high level attendees Cost effective lead generation 2013 Gartner Event Portfolio 64 strategic conferences covering all major geographies, attracting more than 45,000 technology and business professionals
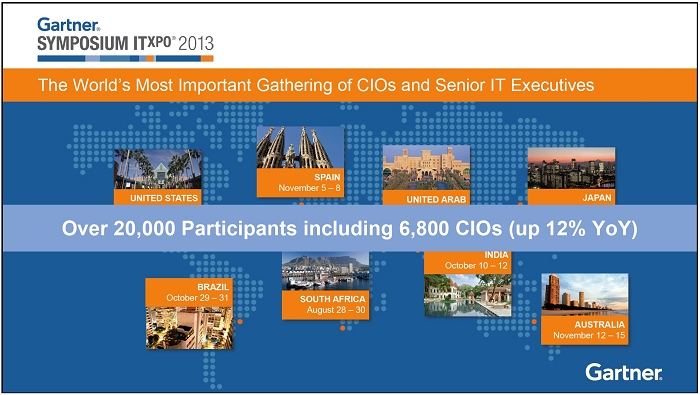
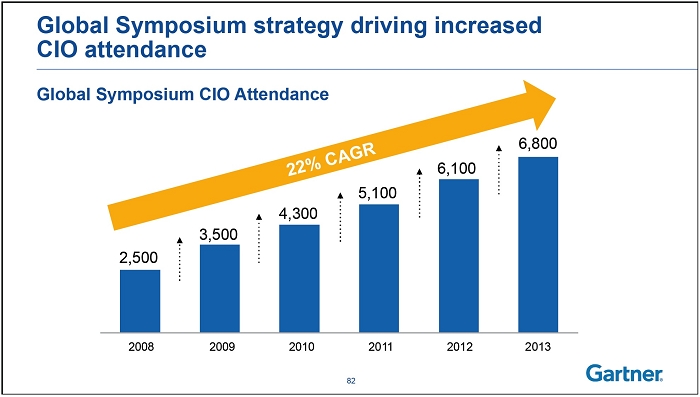
41 UNITED STATES October 21 – 25 SPAIN November 5 – 8 JAPAN October 3 – 5 AUSTRALIA November 12 – 15 BRAZIL October 29 – 31 INDIA October 10 – 12 SOUTH AFRICA August 28 – 30 UNITED ARAB EMIRATES March 5 – 7 The World’s Most Important Gathering of CIOs and Senior IT Executives Over 20,000 Participants including 6,800 CIOs (up 12% YoY) Global Symposium strategy driving increased CIO attendance Global Symposium CIO Attendance 2,500 3,500 4,300 5,100 6,100 6,800 2008 2009 2010 2011 2012 2013 22% CAGR 82


42 2014 Gartner Event Portfolio 64 strategic conferences Why Gartner 84

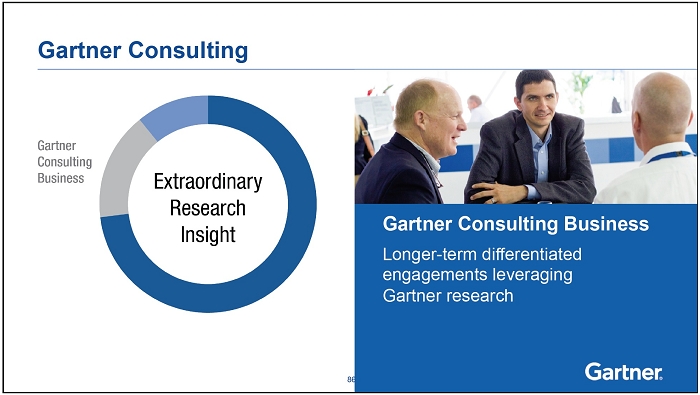
43 Senior Vice President, Gartner Consulting Per Anders Waern Gartner Consulting Longer-term differentiated engagements leveraging Gartner research Gartner Consulting Business 86


44 Why Gartner 87 Photo Image will be inserted here Gartner Consulting Independent and Objective Powered by Gartner Research Proprietary Benchmark Enabled 88

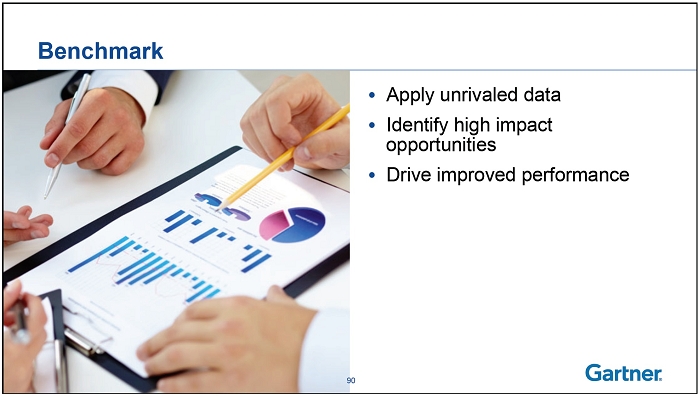
45 Photo Image will be inserted here Gartner Consulting Benchmarking Best Practices Products and Pricing 89 Benchmark • Apply unrivaled data • Identify high impact opportunities • Drive improved performance 90

46 Best Practices For Key IT Initiatives • Customize application of proven best practices • Tied to client key initiatives • Reduce risks, improve business impact 91 Right Products, Right Terms, Right Pricing • Needs assessment • Contract negotiation support • Bottom line impact 92


47 Photo Image will be inserted here Gartner Consulting Independent and Objective Powered by Gartner Research Proprietary Benchmark Enabled Gartner Consulting Business 93 Photo Image will be inserted here Experienced Senior Practitioners • 509 billable Consultants • Over $400K average annual revenue per head • Powerful value proposition for attracting top talent 94
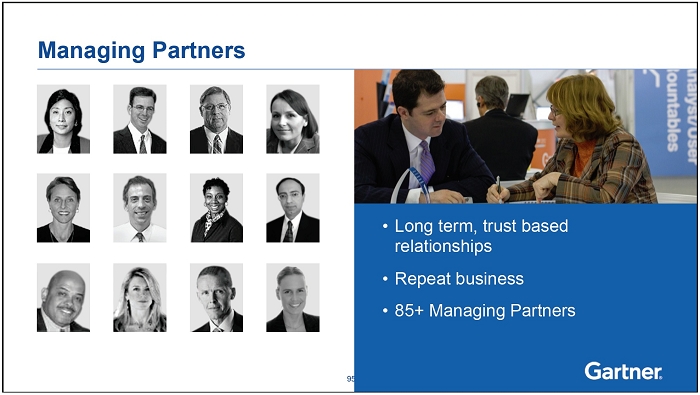

48 Managing Partners • Long term, trust based relationships • Repeat business • 85+ Managing Partners 95 Improved Efficiency Through Managing Partner Model • Improved utilization and billing rates • Increased engagement sizes • Enter 2014 with >$100M in backlog 96


49 Why Gartner 97 Senior Vice President, Worldwide Sales David Godfrey


50 Gartner Note: Percentages based on midpoint of 2014 revenue guidance. 99 Gartner Sales 100


51 Gartner Sales 1,643 quota-bearing sales associates • 270% growth since 2004 • 51% outside of United States Profile of a Gartner Account Executive • Highly motivated • Great sales DNA • Passionate • Goal oriented 101 Vast Market Opportunity for Research Total 108,000 38,000 # of Enterprises Market Opportunity 98,929 Prospects Clients 9,071 Percent of Total 100% 92% 8% $1.4 Billion Gartner CV 2013 12 18 5 4 Other* 8 Front-line IT Professionals Supply Chain CIOs IT Functional Leaders $47 Billion Source: Gartner internal estimates * digital marketing, technology, professional services, telecommunications and investors 102


52 Client Enterprise and Contract Value Growth +12% FX Neutral 2004 2005 2006 2007 2008 2009 2010 2011 2012 2013 Research Contract Value $1,263M $1,116M $978M $753M $834M $784M $509M $593M $640M $1,423M # Of Client Enterprises 6,400 6,544 6,798 6,215 6,318 5,818 9,071 8,070 7,680 2004 2005 2006 2007 2008 2009 2010 2011 2012 2013 8,630 +441 103 … … … … … Research sold as subscriptions to individuals • Role-based • Recurring revenue IT Functional Leaders CIO IT Professionals 104
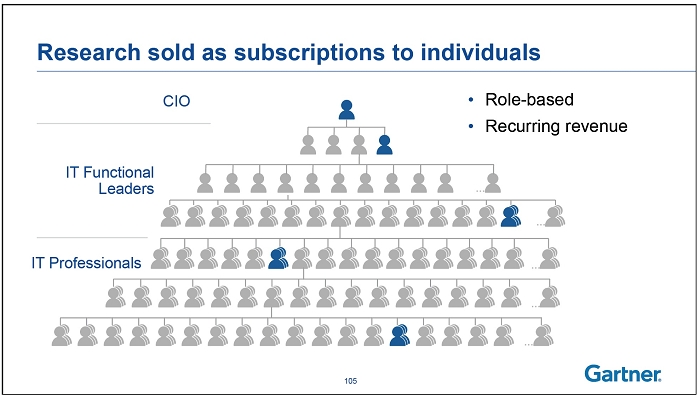

53 … … … … … Research sold as subscriptions to individuals • Role-based • Recurring revenue IT Functional Leaders CIO IT Professionals 105 … … … … … Research sold as subscriptions to individuals IT Functional Leaders CIO IT Professionals 106

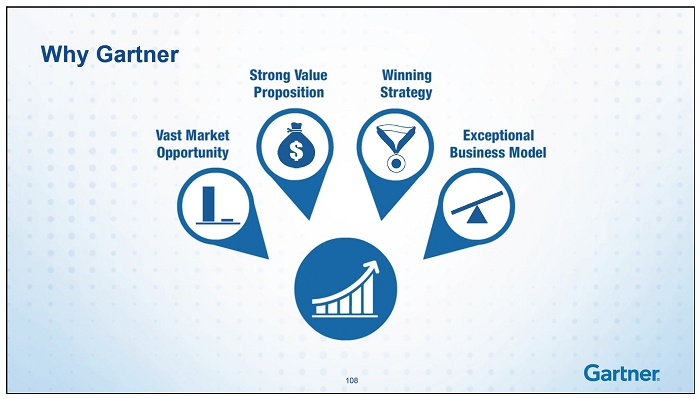
54 … … … … … Research sold as subscriptions to individuals IT Functional Leaders CIO IT Professionals 107 Why Gartner 108


55 Sales Strategy to Capture Market Opportunity Coverage Capacity Sales Effectiveness 109 Sales Strategy to Capture Market Opportunity Coverage Capacity Sales Effectiveness 110
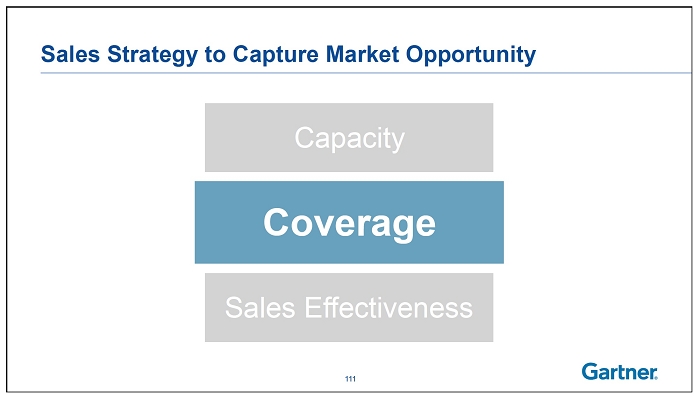
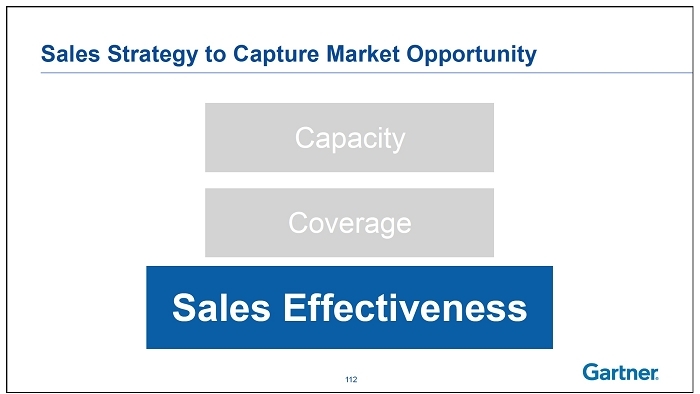
56 Sales Strategy to Capture Market Opportunity Coverage Sales Effectiveness Capacity 111 Sales Strategy to Capture Market Opportunity Sales Effectiveness Capacity Coverage 112


57 Sales Strategy to Capture Market Opportunity • Grow sales headcount 15 – 20% annually • Architected recruitment and training plan Capacity 443 550 663 806 928 942 1,049 1,268 1,417 1,643 2004 2005 2006 2007 2008 2009 2010 2011 2012 2013 Direct Quota Bearing Headcount Sales Strategy to Capture Market Opportunity • Grow sales headcount 15 – 20% annually • Architected recruitment and training plan Capacity 114

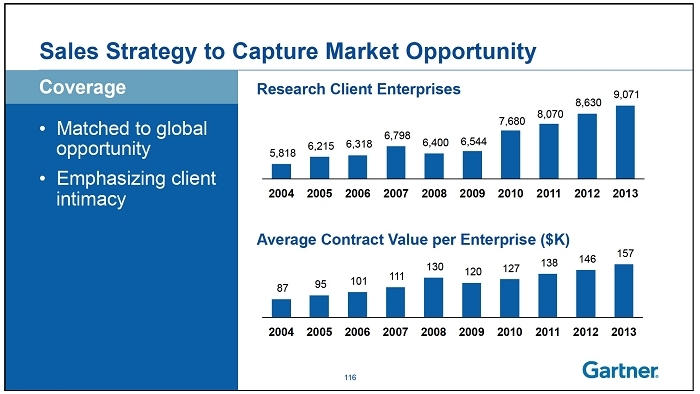
58 Coverage Sales Strategy to Capture Market Opportunity • Matched to global opportunity • Emphasizing client intimacy Coverage 87 95 101 111 130 120 127 138 146 157 2004 2005 2006 2007 2008 2009 2010 2011 2012 2013 Average Contract Value per Enterprise ($K) 5,818 6,215 6,318 6,798 6,400 6,544 7,680 8,070 8,630 9,071 2004 2005 2006 2007 2008 2009 2010 2011 2012 2013 Research Client Enterprises Sales Strategy to Capture Market Opportunity • Matched to global opportunity • Emphasizing client intimacy 116
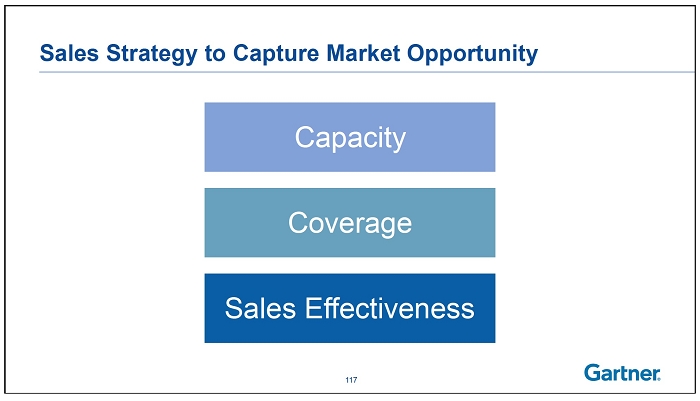

59 Sales Strategy to Capture Market Opportunity Coverage Capacity Sales Effectiveness 117 Sales Strategy to Capture Market Opportunity • Great Talent • World Class Training • Proprietary Tools and Best Practices Sales Effectiveness


60 Best Place To Work, Employees’ Choice Winner 2013 and 2014 Ten Best Tech Companies to Work For 2013 Gartner Sales: A great place to work Gartner reputation Gartner Sales: A great place to work Gartner culture • Strategic relationships • Collaboration • Leading tools and best practices • Innovative products


61 Why Gartner 121 Chief Financial Officer Chris Lafond
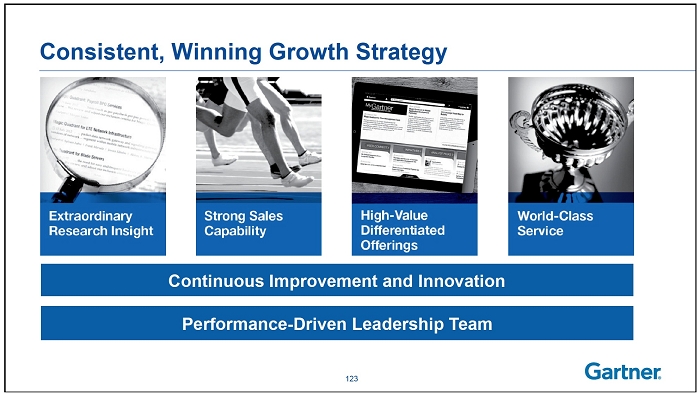

62 Consistent, Winning Growth Strategy Performance-Driven Leadership Team Continuous Improvement and Innovation 123 Today’s Roadmap Exceptional Performance Powerful Economics Strong Cash Generation Outlook 124
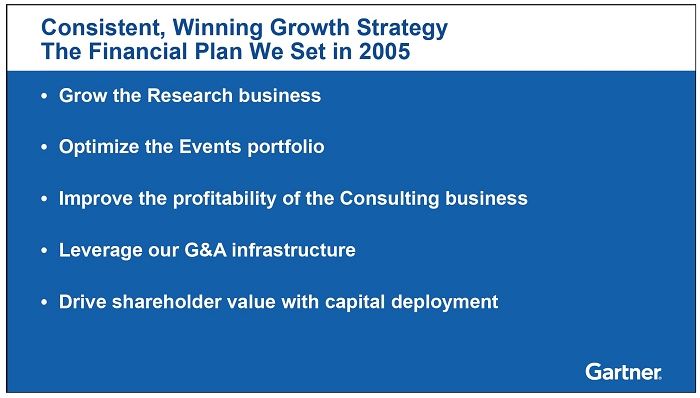

63 Consistent, Winning Growth Strategy The Financial Plan We Set in 2005 • Grow the Research business • Optimize the Events portfolio • Improve the profitability of the Consulting business • Leverage our G&A infrastructure • Drive shareholder value with capital deployment Consistent, Winning Growth Strategy Grow the Research Business 509 1,423 2004 2013 $M Contract Value >150% 126


64 Consistent, Winning Growth Strategy Grow the Research Business Events 13% 2004 Consulting 30% Research 57% Events 11% 2013 Consulting 18% Research 71% 127 Consistent, Winning Growth Strategy Grow the Research Business 62% Research Contribution Margin 2004 128
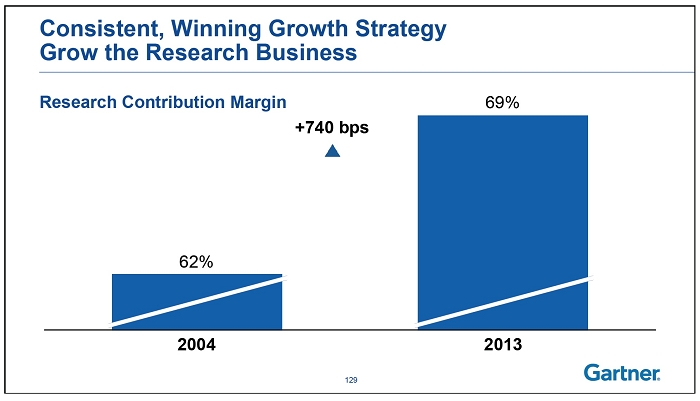

65 Consistent, Winning Growth Strategy Grow the Research Business 69% 2004 62% 2013 +740 bps Research Contribution Margin 129 Consistent, Winning Growth Strategy Optimize the Events Portfolio # Events +14% 2004 64 2013 56 Attendees 30,999 44,986 +45% 2004 2013 1,321 +54% 2,040 2004 2013 Exhibitors 130

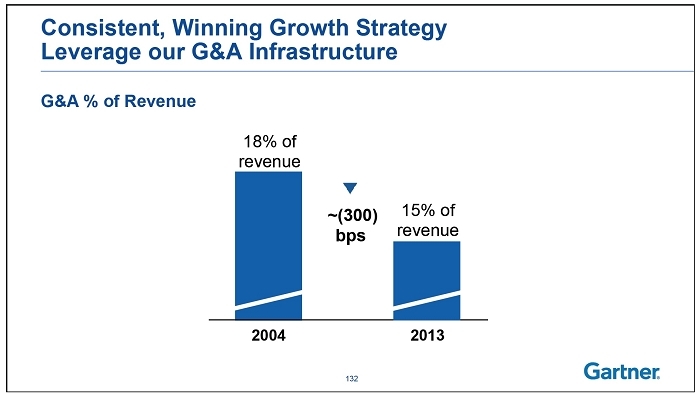
66 Revenue ($M) 2004 $259 2013 $314 Headcount 2004 493 2013 509 Utilization (%) 2004 60% 2013 64% Consistent, Winning Growth Strategy Improve Consulting Performance 131 Consistent, Winning Growth Strategy Leverage our G&A Infrastructure 2004 18% of revenue 2013 15% of revenue ~(300) bps G&A % of Revenue 132
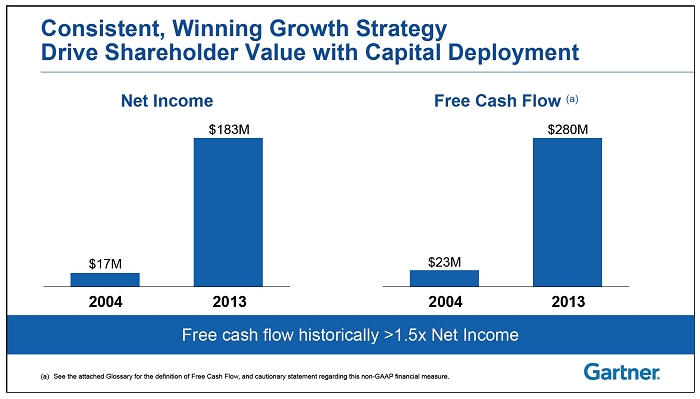

67 Consistent, Winning Growth Strategy Drive Shareholder Value with Capital Deployment 2004 2013 Net Income 2004 2013 Free Cash Flow (a) Free cash flow historically >1.5x Net Income $183M $17M $280M $23M (a) See the attached Glossary for the definition of Free Cash Flow, and cautionary statement regarding this non-GAAP financial measure. Consistent, Winning Growth Strategy Drive Shareholder Value with Capital Deployment Q4 Fully Diluted Shares Outstanding (in thousands) 2004 126,326 2013 93,940 -26% Share Repurchases 50 million shares repurchased Over $1.2 billion returned to shareholders 2005: META ($160M) 2009: AMR Research ($63M) 2009: Burton Group ($56M) 2012: IDEAS ($18M) Strategic Acquisitions ~$300M on four deals 134


68 Consistent, Winning Growth Strategy The Financial Plan We Set in 2005 • Grow the Research business • Optimize the Events portfolio • Improve the profitability of the Consulting business • Leverage our G&A infrastructure • Drive shareholder value with capital deployment Consistent, Winning Growth Strategy Earnings & Cash Flow Track Record Normalized EBITDA (b) $ in millions (a) See the attached Glossary for the definition of Free Cash Flow, and cautionary statement regarding this non-GAAP financial measure. (b) See the attached Glossary for the definition of Normalized EBITDA, and cautionary statement regarding this non-GAAP financial measure $103 $345 2004 2013 Free Cash Flow (a) $ in millions $23 $280 2004 2013 Normalized EBITDA Margin (b) 11.8% 19.4% 2004 2013 EBITDA% EPS from Continuing Operations $0.09 $1.93 2004 2013

69 Why Gartner 137 Consistent, Winning Growth Strategy Grow the Research Business Events 11% 2013 Consulting 18% Research 71% Events 11% 2014 Estimate Consulting 16% Research 73% Note: Based upon mid-point of 2014 Revenue Guidance 138

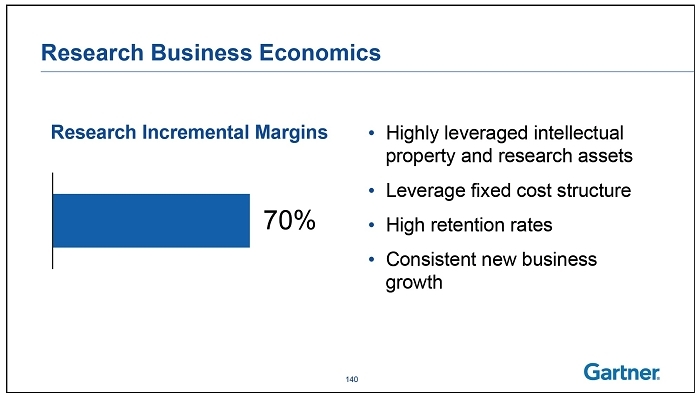
70 Research Business Characteristics • Subscription-based model with recurring revenue • Annual contracts • High client renewal rates • Negative working capital • High incremental margins • Strong cash generation Note: Based upon mid-point of 2014 Revenue Guidance 139 Research Business Economics 70% Research Incremental Margins • Highly leveraged intellectual property and research assets • Leverage fixed cost structure • High retention rates • Consistent new business growth 140

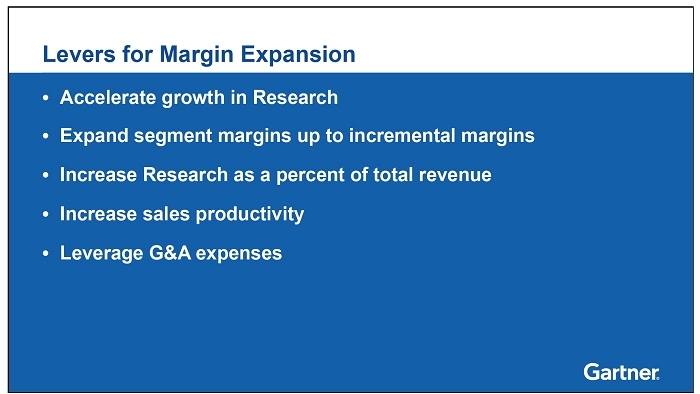
71 Margin Expansion 11.8% 19.4% Normalized EBITDA Margin(a) +760 bps 2004 2013 Incremental Margins (a) See the attached Glossary for the definition of Normalized EBITDA, and cautionary statement regarding this non-GAAP financial measure Events 50% Research 70% Consulting 40% 52% 60% Gross Contribution Margin +800 bps 2004 2013 Levers for Margin Expansion • Accelerate growth in Research • Expand segment margins up to incremental margins • Increase Research as a percent of total revenue • Increase sales productivity • Leverage G&A expenses
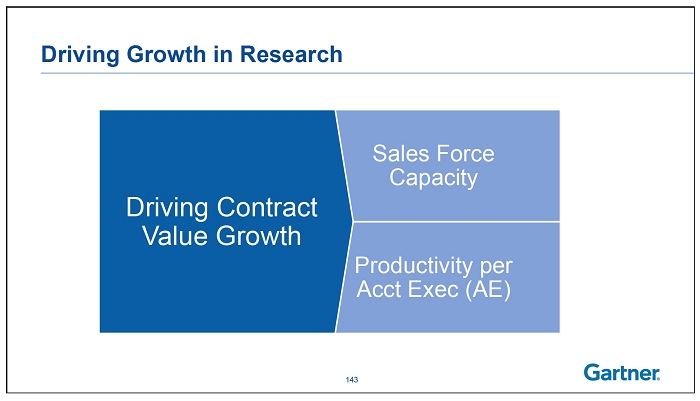

72 Productivity per Acct Exec (AE) Sales Force Capacity Driving Contract Value Growth Driving Growth in Research 143 1,643 1,417 1,268 1,049 928 942 806 663 550 443 Increasing Sales Capacity Direct Quota Bearing Headcount 2004 2005 2006 2007 2008 2009 2010 2011 2012 2013 16% CAGR 144

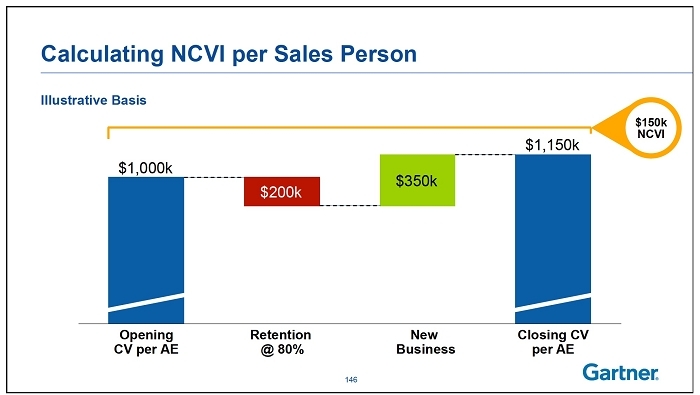
73 Calculating Average Productivity per Sales Person • Rolling four quarter to eliminate seasonality • Measuring change in total contract value (net contract value increase or NCVI) • FX neutral • Use opening headcount for simplicity Calculating NCVI per Sales Person Closing CV per AE Opening CV per AE New Business $1,150k $1,000k $200k $350k Illustrative Basis $150k NCVI Retention @ 80% 146


74 2013 Contract Value Growth and Productivity $153M 2013 Opening CV $1,270M 2013 Closing CV $1,423M 2013 NCVI 2013 FX Neutral NCVI $153M Opening 2013 direct quota bearing headcount 1,417 Average Productivity (NCVI) per AE $108k +12% Constant Productivity Scenario Opening 2014 direct quota bearing headcount 1,643 (+16%) 2013 Average NCVI per AE $108k $177M Net Contract Value Increase +13% 2014 Opening CV* 2014 Est NCVI 2014 Est Closing CV $1,579M $1,402M $177M * Opening Contract Value at 2014 FX rates 148


75 Productivity Improvement Scenarios $5k Improvement $10k Improvement $20k improvement Incremental NCVI $9M $17M $33M Incremental Contribution @ 70% flow thru (following year) $6M $12M $23M $108k per AE +13% $177M $5k improvement +13% $186M $10k improvement +14% $194M $210M $20k improvement +16% 149 Combining Sales Expansion with Productivity Improvements $28M Yr2 $9M $3M $177M $186M $17M $177M $225M Yr1 +13% +14% $5k Productivity improvement per year – growth AEs Growth AEs $5k Productivity improvement per year – current AEs Current AEs 150
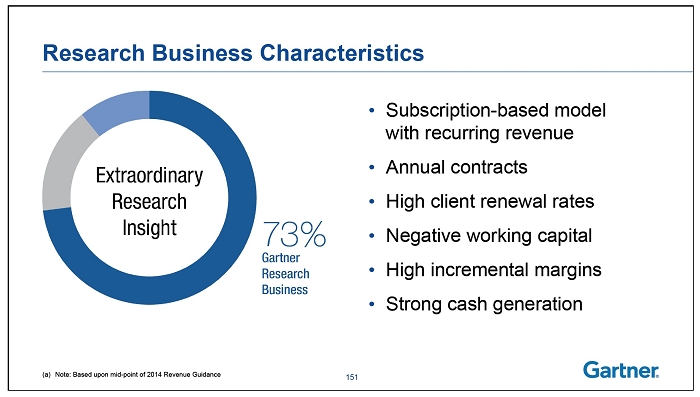

76 Research Business Characteristics • Subscription-based model with recurring revenue • Annual contracts • High client renewal rates • Negative working capital • High incremental margins • Strong cash generation (a) Note: Based upon mid-point of 2014 Revenue Guidance 151 Capital Deployment Cash Flow Generation (a) See the attached Glossary for the definition of Free Cash Flow, and cautionary statement regarding this non-GAAP financial measure. (b) Based upon the mid-point of 2014 Guidance 2012 2013 2014E (b ) Free Cash Flow (a) Net Income Free cash flow >1.5x Net Income $183M $166M $205M $280M $236M $310M

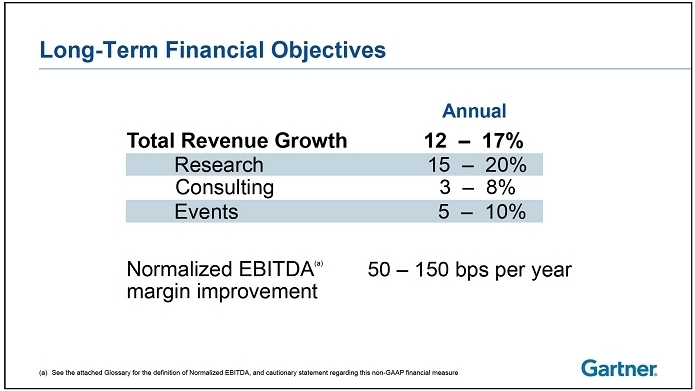
77 Capital Deployment Share Repurchase Programs Expect to end 2014 with 89 – 90 million shares outstanding 2010 2011 2012 2015E $100M $111M $197M $400M $212M 2014E $400M 2013 Annual Share Repurchase Activity ($ millions) 153 Long-Term Financial Objectives Normalized EBITDA(a) margin improvement 50 – 150 bps per year Total Revenue Growth 12 – 17% Annual Research 15 – 20% Consulting 3 – 8% Events 5 – 10% (a) See the attached Glossary for the definition of Normalized EBITDA, and cautionary statement regarding this non-GAAP financial measure

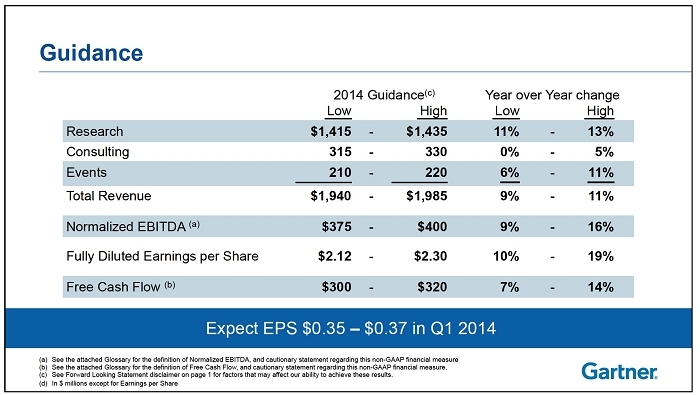
78 Levers for Margin Expansion • Accelerate growth in Research • Expand segment margins up to incremental margins • Increase Research as a percent of total revenue • Increase sales productivity • Leverage G&A expenses Normalized EBITDA(a) margin improvement 50 – 150 bps per year (a) See the attached Glossary for the definition of Normalized EBITDA, and cautionary statement regarding this non-GAAP financial measure Guidance Expect EPS $0.35 – $0.37 in Q1 2014 2014 Guidance(c) Year over Year change Low High Low High Research $1,415 - $1,435 11% - 13% Consulting 315 - 330 0% - 5% Events 210 - 220 6% - 11% Total Revenue $1,940 - $1,985 9% - 11% Normalized EBITDA (a) $375 - $400 9% - 16% Fully Diluted Earnings per Share $2.12 - $2.30 10% - 19% Free Cash Flow (b) $300 - $320 7% - 14% (a) See the attached Glossary for the definition of Normalized EBITDA, and cautionary statement regarding this non-GAAP financial measure (b) See the attached Glossary for the definition of Free Cash Flow, and cautionary statement regarding this non-GAAP financial measure. (c) See Forward Looking Statement disclaimer on page 1 for factors that may affect our ability to achieve these results. (d) In $ millions except for Earnings per Share


79 Why Gartner 157 Appendix


80 Projected 2014 Earnings and Cash Flow Outlook Diluted Earnings per share $2.12 – $2.30 10% – 19% Operating Cash Flow $336 – $358 6% – 13% Capital Expenditures $(36) – $(38) Free Cash Flow (1) $300 – $320 7% – 14% (1) See the attached Glossary for a discussion of Free Cash Flow. (2) See Forward Looking Statement disclaimer on page 1 for factors that may affect our ability to achieve these results. ($ in millions except per share data) 2014 Projection (2) Reported % change Glossary Non-GAAP Financial Measures Investors are cautioned that Normalized EBITDA and Free Cash Flow are not financial measures under generally accepted accounting principles. In addition, they should not be construed as alternatives to any other measures of performance determined in accordance with generally accepted accounting principles. These non-GAAP financial measures are provided to enhance the user's overall understanding of the Company's current financial performance and the Company's prospects for the future. Normalized EBITDA Represents operating income excluding depreciation, accretion on obligations related to excess facilities, amortization, stock-based compensation expense, Acquisition Adjustments and Other charges. We believe Normalized EBITDA is an important measure of our recurring operations as it excludes items that may not be indicative of our core operating results. Reconciliation of Normalized EBITDA to GAAP ($ in millions) 2004 2005 2006 2007 2008 2009 2010 2011 2012 2013 Net income (loss) $17 ($2) $58 $74 $104 $83 $96 $137 $166 $183 Interest expense, net 1 11 17 22 19 16 16 10 9 9 Other (income) expense, net 7 9 1 (3) 1 3 — 2 1 — Discontinued operations (1) (5) (4) (4) (3) (7) — — — — — Tax provision 16 7 26 40 48 33 38 65 70 84 Operating income (1) $36 $20 $98 $129 $164 $134 $149 214 $246 $275 Normalizing adjustments: Depreciation, accretion and amortization 31 36 34 28 28 28 36 32 30 35 META integration charges — 15 1 — — — — — — — Other charges 36 29 — 9 — — — — — — SFAS No. 123(R) stock compensation expense — — 17 24 21 26 33 33 36 35 Pre-acquisition deferred revenue fair value adjustments — 4 — — — Acquisition and Integration Charges (2) 3 8 — 3 1 Normalized EBITDA (1) $103 $100 $150 $190 $213 $191 $230 $279 $315 $345 160

81 Glossary Non-GAAP Financial Measures Free Cash Flow: Represents cash provided by operating activities excluding cash charges related to the acquisitions of AMR Research and Burton Group, which primarily consist of certain nonrecurring costs such as severance and other exit costs (“Cash Acquisition and Integration Charges”), less additions to property, equipment and leasehold improvements (“Capital Expenditures”). We believe that Free Cash Flow is an important measure of the recurring cash generated by the Company’s core operations that is available to be used to repurchase stock, repay debt obligations and invest in future growth through new business development activities or acquisitions. Reconciliation of Free Cash Flow to GAAP ($ in millions) 2004 2005 2006 2007 2008 2009 2010 2011 2012 2013 Cash provided by operating activities $48 $27 $106 $148 $184 $162 $205 $256 $280 $316 Cash Acquisition and Integration Charges — — — — — — 8 — 1 1 Capital Expenditures (25) (22) (21) (24) (24) (15) (21) (42) (44) (37) Free Cash Flow $23 $5 $85 124 $160 $147 $192 $214 $237 $280 161


