Exhibit 99.2
Link to searchable text of slide shown above
Link to searchable text of slide shown above

Link to searchable text of slide shown above
Link to searchable text of slide shown above
Link to searchable text of slide shown above

Link to searchable text of slide shown above

Link to searchable text of slide shown above

Link to searchable text of slide shown above

Link to searchable text of slide shown above
Link to searchable text of slide shown above

Link to searchable text of slide shown above

Link to searchable text of slide shown above
Link to searchable text of slide shown above

Link to searchable text of slide shown above
Link to searchable text of slide shown above

Link to searchable text of slide shown above
Link to searchable text of slide shown above
Searchable text section of graphics shown above
[GRAPHIC]
2004 3rd quarter review
a matter of convenience
[LOGO]
12 November 2004
©2004 TRM Corporation
The information contained herein is subject to change without notice.
1
[GRAPHIC]
[LOGO]
Forward Looking Statements
Except for historical information contained herein, the matters discussed in this presentation contain forward-looking statementswithin the meaning of section 27A of the Securities Act of 1933, as amended (the “Securities Act”), and Section 21E of the Securities Exchange Act of 1934, as amended (the “Exchange Act”), that involve substantial risks and uncertainties. Actual results, performance or achievements could differ materially from those contemplated, expressed or implied by the forward-lookingstatements contained herein. These forward-looking statements are based largely on the expectations of TRM Corporation (“TRM”) and are subject to a number of risks and uncertainties that are subject to change based on factors which are, in many instances, beyond TRM’s control.
2
Overview
The TRM Network
4,868 ATMs and 24,774 self-service photocopiers
[GRAPHIC]
3
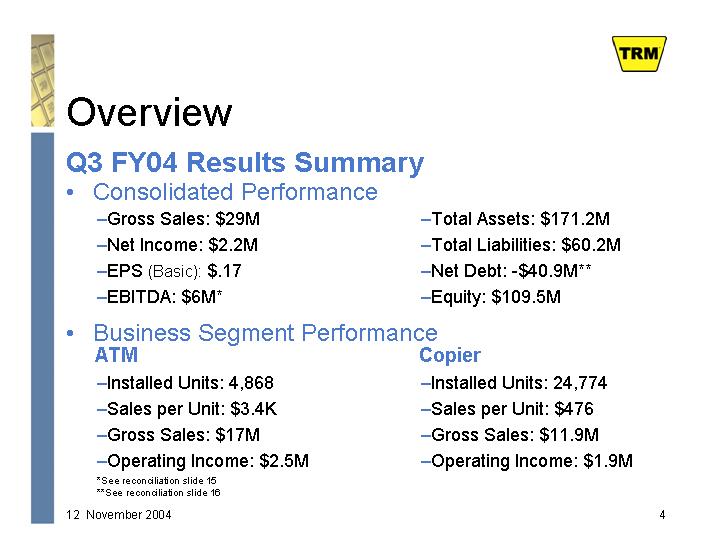
Overview
Q3 FY04 Results Summary
• Consolidated Performance
• Gross Sales: $29M
• Net Income: $2.2M
• EPS (Basic): $.17
• EBITDA: $6M*
• Total Assets: $171.2M
• Total Liabilities: $60.2M
• Net Debt: -$40.9M**
• Equity: $109.5M
• Business Segment Performance
ATM
• Installed Units: 4,868
• Sales per Unit: $3.4K
• Gross Sales: $17M
• Operating Income: $2.5M
Copier
• Installed Units: 24,774
• Sales per Unit: $476
• Gross Sales: $11.9M
• Operating Income: $1.9M
*See reconciliation slide 15
**See reconciliation slide 16
4
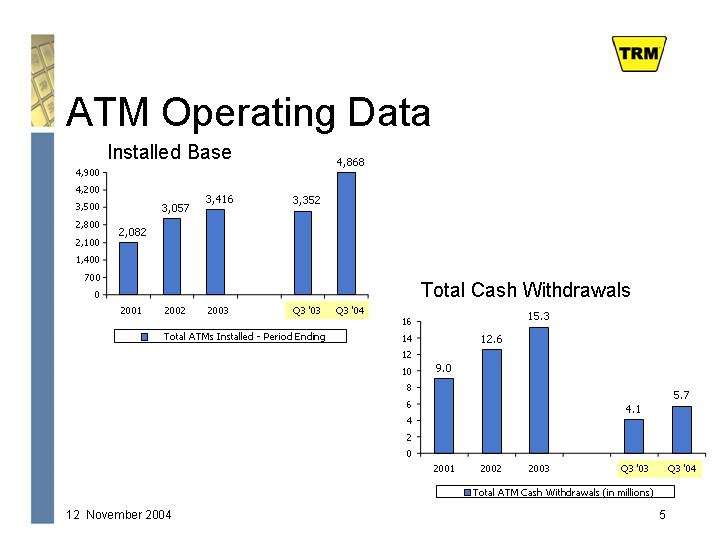
ATM Operating Data
Installed Base
[CHART]
Total Cash Withdrawals
[CHART]
5
ATM Unit Economics
Sales/Unit
[CHART]
Sales/Transaction
[CHART]
6
ATM Financials
ATM P&L
(in millions)
| | Q3 ’03 | | Q3 ’04 | | YTD ’03 | | YTD ’04 | |
| | | | | | | | | |
Gross Sales | | $ | 11.3 | | $ | 17.0 | | $ | 30.5 | | $ | 44.4 | |
| | | | | | | | | |
Gross Profit | | $ | 4.6 | | $ | 5.6 | | $ | 11.4 | | $ | 15.1 | |
| | | | | | | | | |
Operating Income* | | $ | 1.9 | | $ | 2.5 | | $ | 3.2 | | $ | 6.5 | |
ATM Margin Analysis
| | Q3 ’03 | | Q3 ’04 | | YTD ’03 | | YTD ’04 | |
| | | | | | | | | |
Gross Margin | | 41.0 | % | 32.9 | % | 37.5 | % | 34.0 | % |
| | | | | | | | | |
Operating Margin* | | 16.9 | % | 14.4 | % | 10.6 | % | 14.7 | % |
* From continuing operations. Excludes cost of raising capital & pursuing acquisitions
7
Photocopy Operating Data
Installed Base
[CHART]
Gross Sales
[CHART]
8
Photocopy Unit Economics
Sales/Unit
[CHART]
Sales/Copy
[CHART]
9
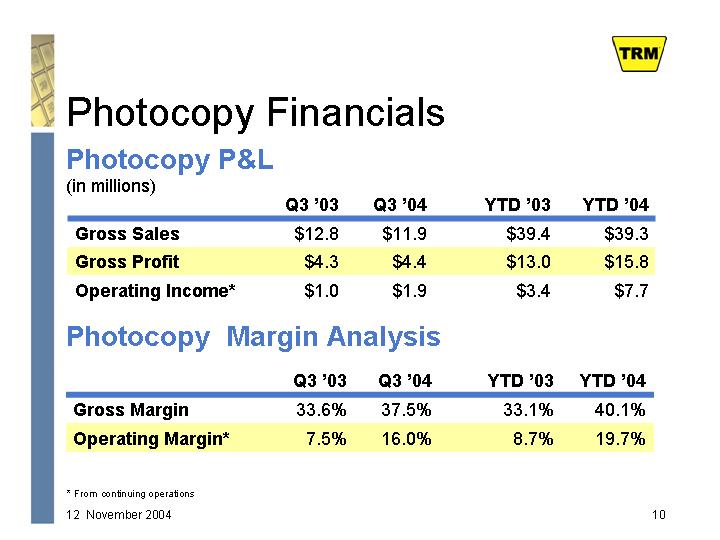
Photocopy Financials
Photocopy P&L
(in millions)
| | Q3 ’03 | | Q3 ’04 | | YTD ’03 | | YTD ’04 | |
| | | | | | | | | |
Gross Sales | | $ | 12.8 | | $ | 11.9 | | $ | 39.4 | | $ | 39.3 | |
| | | | | | | | | |
Gross Profit | | $ | 4.3 | | $ | 4.4 | | $ | 13.0 | | $ | 15.8 | |
| | | | | | | | | |
Operating Income* | | $ | 1.0 | | $ | 1.9 | | $ | 3.4 | | $ | 7.7 | |
Photocopy Margin Analysis
| | Q3 ’03 | | Q3 ’04 | | YTD ’03 | | YTD ’04 | |
| | | | | | | | | |
Gross Margin | | 33.6 | % | 37.5 | % | 33.1 | % | 40.1 | % |
| | | | | | | | | |
Operating Margin* | | 7.5 | % | 16.0 | % | 8.7 | % | 19.7 | % |
* From continuing operations
10
Consolidated P&L
(in millions)
| | Q3 ’03 | | Q3 ’04 | | YTD ’03 | | YTD ’04 | |
| | | | | | | | | |
Gross Sales | | $ | 24.1 | | $ | 29.0 | | $ | 70.1 | | $ | 83.8 | |
| | | | | | | | | |
Gross Profit | | $ | 8.8 | | $ | 10.1 | | $ | 24.7 | | $ | 30.8 | |
| | | | | | | | | |
Operating Income | | $ | 2.5 | | $ | 3.3 | | $ | 6.1 | | $ | 11.4 | |
| | | | | | | | | |
Pre-Tax Income | | $ | 2.4 | | $ | 3.4 | | $ | 5.3 | | $ | 10.9 | |
| | | | | | | | | |
Net Income | | $ | 1.5 | | $ | 2.2 | | $ | 3.4 | | $ | 7.4 | |
| | | | | | | | | |
EBITDA* | | $ | 5.0 | | $ | 6.0 | | $ | 13.5 | | $ | 18.6 | |
| | | | | | | | | |
EPS (Basic) | | $ | .14 | | $ | .17 | | $ | .27 | | $ | .67 | |
*See reconciliation slide 15
11
Margin Analysis
| | 2002 | | 2003 | | Q3 ’03 | | Q3 ’04 | | YTD
’03 | | YTD
’04 | |
| | | | | | | | | | | | | |
Gross Margin | | 31.6 | % | 36.2 | % | 36.6 | % | 34.7 | % | 34.8 | % | 36.8 | % |
| | | | | | | | | | | | | |
Operating Margin* | | -2.1 | % | 9.5 | % | 10.3 | % | 11.2 | % | 8.6 | % | 13.7 | % |
| | | | | | | | | | | | | |
Pre-Tax Margin | | -6.1 | % | 8.5 | % | 9.8 | % | 11.7 | % | 7.5 | % | 13.0 | % |
| | | | | | | | | | | | | |
Net Profit Margin | | -4.4 | % | 5.7 | % | 6.3 | % | 7.5 | % | 4.8 | % | 8.8 | % |
* From continuing operations
12
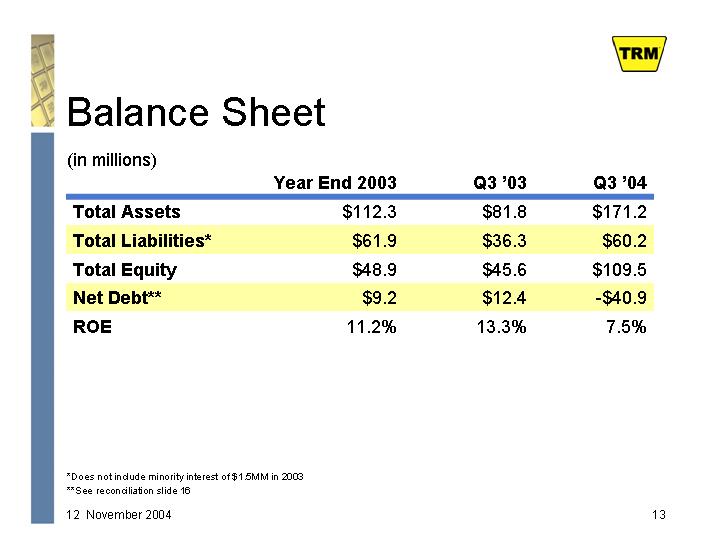
Balance Sheet
(in millions)
| | Year End 2003 | | Q3 ’03 | | Q3 ’04 | |
| | | | | | | |
Total Assets | | $ | 112.3 | | $ | 81.8 | | $ | 171.2 | |
| | | | | | | |
Total Liabilities* | | $ | 61.9 | | $ | 36.3 | | $ | 60.2 | |
| | | | | | | |
Total Equity | | $ | 48.9 | | $ | 45.6 | | $ | 109.5 | |
| | | | | | | |
Net Debt** | | $ | 9.2 | | $ | 12.4 | | $ | -40.9 | |
| | | | | | | |
ROE | | 11.2 | % | 13.3 | % | 7.5 | % |
*Does not include minority interest of $1.5MM in 2003
**See reconciliation slide 16
13
Additional Information
14
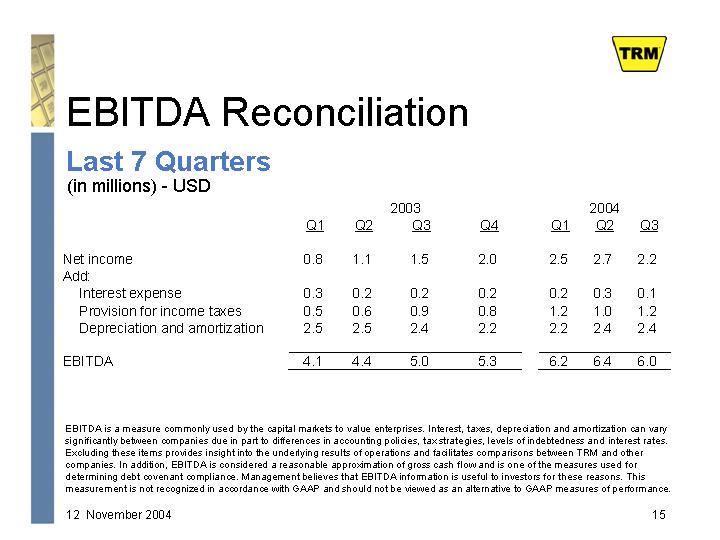
EBITDA Reconciliation
Last 7 Quarters
(in millions) - USD
| | 2003 | | 2004 | |
| | Q1 | | Q2 | | Q3 | | Q4 | | Q1 | | Q2 | | Q3 | |
| | | | | | | | | | | | | | | |
Net income | | 0.8 | | 1.1 | | 1.5 | | 2.0 | | 2.5 | | 2.7 | | 2.2 | |
Add: | | | | | | | | | | | | | | | |
Interest expense | | 0.3 | | 0.2 | | 0.2 | | 0.2 | | 0.2 | | 0.3 | | 0.1 | |
Provision for income taxes | | 0.5 | | 0.6 | | 0.9 | | 0.8 | | 1.2 | | 1.0 | | 1.2 | |
Depreciation and amortization | | 2.5 | | 2.5 | | 2.4 | | 2.2 | | 2.2 | | 2.4 | | 2.4 | |
| | | | | | | | | | | | | | | |
EBITDA | | 4.1 | | 4.4 | | 5.0 | | 5.3 | | 6.2 | | 6.4 | | 6.0 | |
EBITDA is a measure commonly used by the capital markets to value enterprises. Interest, taxes, depreciation and amortization can vary significantly between companies due in part to differences in accounting policies, tax strategies, levels of indebtedness and interest rates. Excluding these items provides insight into the underlying results of operations and facilitates comparisons between TRM and other companies. In addition, EBITDA is considered a reasonable approximation of gross cash flow and is one of the measures used fordetermining debt covenant compliance. Management believes that EBITDA information is useful to investors for these reasons. Thismeasurement is not recognized in accordance with GAAP and should not be viewed as an alternative to GAAP measures of performance.
15
Net Debt Reconciliation
(in millions) - USD
| | Year End 2003 | | Q3 ’03 | | Q3 ’04 | |
| | | | | | | |
All Debt | | 10.1 | | 14.3 | | 0.1 | |
| | | | | | | |
All Capital Leases | | 4.9 | | 5.0 | | 3.3 | |
| | | | | | | |
Cash & Cash Equivalents | | (5.7 | ) | (6.9 | ) | (44.3 | ) |
| | | | | | | |
| | 9.2 | | 12.4 | | (40.9 | ) |
16
Q & A
17