Exhibit 99.1

Company Overview EXPLORE DEVELOP GROW EXPLORE DEVELOP GROW EXPLORE
Richard A. Bachmann Chairman and CEO
November 17, 2006
Strategic Alternatives Process
Initiated process on October 12
Goal is to maximize stockholder value
Exploring all options, including sale of the Company
This process is underway with the multiple parties who have signed confidentiality agreements
Continuing to entertain interest from others.
EPL is committed to continuing and completing this process
EPL does not intend to further disclose developments with respect to this process unless and until an agreement in principle or a definitive agreement has been reached
Page 2
EPL – Business Description
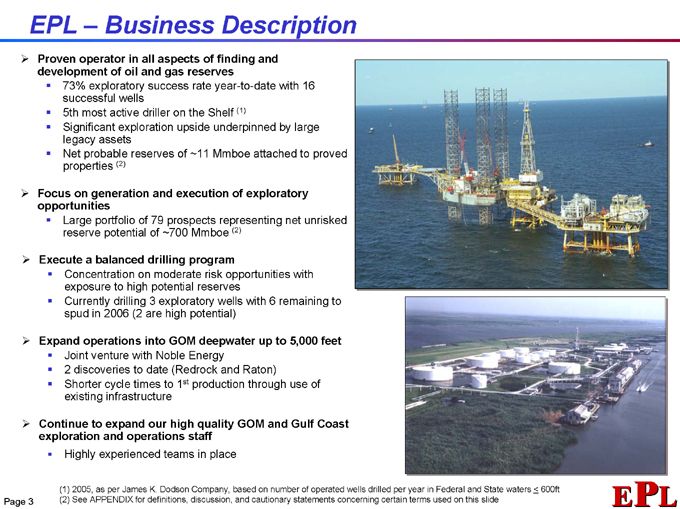
Proven operator in all aspects of finding and development of oil and gas reserves
73% exploratory success rate year-to-date with 16 successful wells 5th most active driller on the Shelf (1) Significant exploration upside underpinned by large legacy assets Net probable reserves of ~11 Mmboe attached to proved properties (2)
Focus on generation and execution of exploratory opportunities
Large portfolio of 79 prospects representing net unrisked reserve potential of ~700 Mmboe (2)
Execute a balanced drilling program
Concentration on moderate risk opportunities with exposure to high potential reserves Currently drilling 3 exploratory wells with 6 remaining to spud in 2006 (2 are high potential)
Expand operations into GOM deepwater up to 5,000 feet
Joint venture with Noble Energy
2 | | discoveries to date (Redrock and Raton) |
Shorter cycle times to 1st production through use of existing infrastructure
Continue to expand our high quality GOM and Gulf Coast exploration and operations staff
Highly experienced teams in place
(1) 2005, as per James K. Dodson Company, based on number of operated wells drilled per year in Federal and State waters < 600ft (2) See APPENDIX for definitions, discussion, and cautionary statements concerning certain terms used on this slide
Page 3
Company Milestones
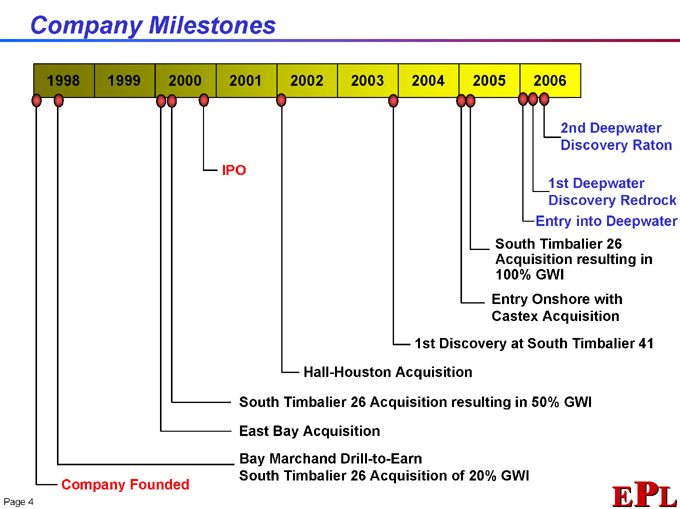
1998 1999 2000 2001 2002 2003 2004 2005 2006
2nd Deepwater Discovery Raton
1st Deepwater Discovery Redrock
Entry into Deepwater
South Timbalier 26 Acquisition resulting in 100% GWI
Entry Onshore with Castex Acquisition
1st Discovery at South Timbalier 41
Hall-Houston Acquisition
South Timbalier 26 Acquisition resulting in 50% GWI
East Bay Acquisition
Bay Marchand Drill-to-Earn
South Timbalier 26 Acquisition of 20% GWI
Company Founded
Page 4
Proven Track Record
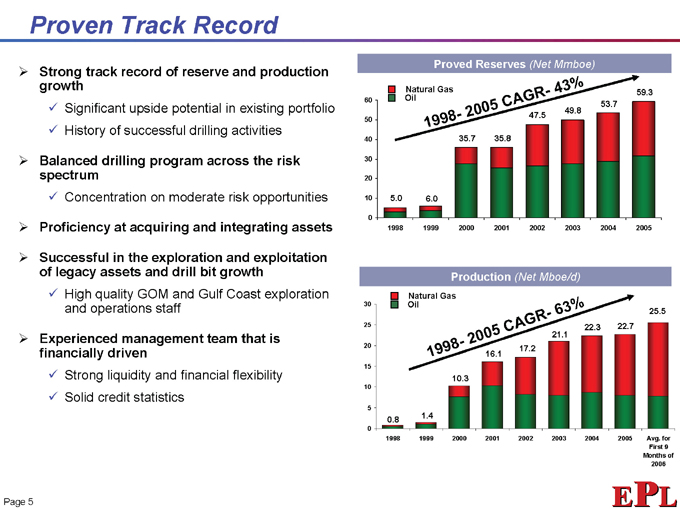
Strong track record of reserve and production growth
Significant upside potential in existing portfolio
History of successful drilling activities
Balanced drilling program across the risk spectrum
Concentration on moderate risk opportunities
Proficiency at acquiring and integrating assets
Successful in the exploration and exploitation of legacy assets and drill bit growth
High quality GOM and Gulf Coast exploration and operations staff
Experienced management team that is financially driven
Strong liquidity and financial flexibility
Solid credit statistics
Proved Reserves (Net Mmboe)
Natural Gas Oil
60 50 40
30
20
10
0
1998 1999 2000 2001 2002 2003 2004 2005
1998— 2005 CAGR—43%
5.0
6.0
35.7
35.8
47.5
49.8
53.7
59.3
Production (Net Mboe/d)
Natural Gas Oil
30 25 20 15 10 5 0
1998 1999 2000 2001 2002 2003 2004 2005 Avg. for First 9 Months of 2006
1998 – 2005 CAGR—63%
0.8
1.4
10.3
16.1
17.2
21.1
22.3
22.7
25.5
Page 5
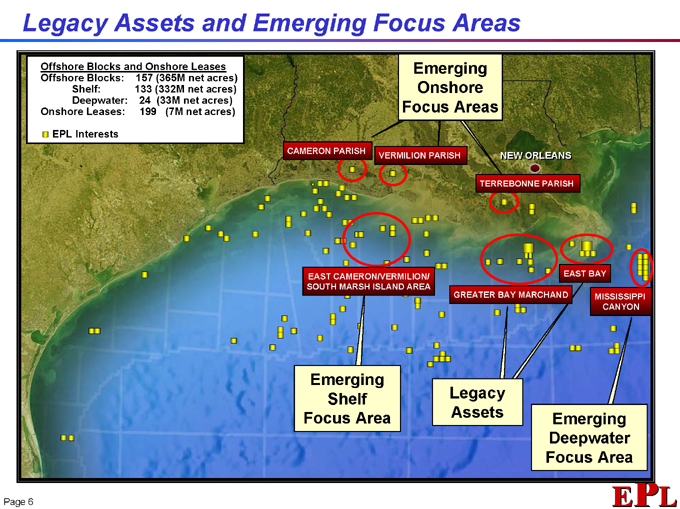
Legacy Assets and Emerging Focus Areas
Offshore Blocks and Onshore Leases Offshore Blocks: 157 (365M net acres) Shelf: 133 (332M net acres) Deepwater: 24 (33M net acres) Onshore Leases: 199 (7M net acres)
EPL Interests
Emerging Onshore Focus Areas
CAMERON PARISH
VERMILION PARISH
NEW ORLEANS
TERREBONNE PARISH
EAST CAMERON/VERMILION/ SOUTH MARSH ISLAND AREA
EAST BAY
GREATER BAY MARCHAND
MISSISSIPPI
CANYON
Emerging Shelf Focus Area
Legacy Assets
Emerging Deepwater Focus Area
Page 6
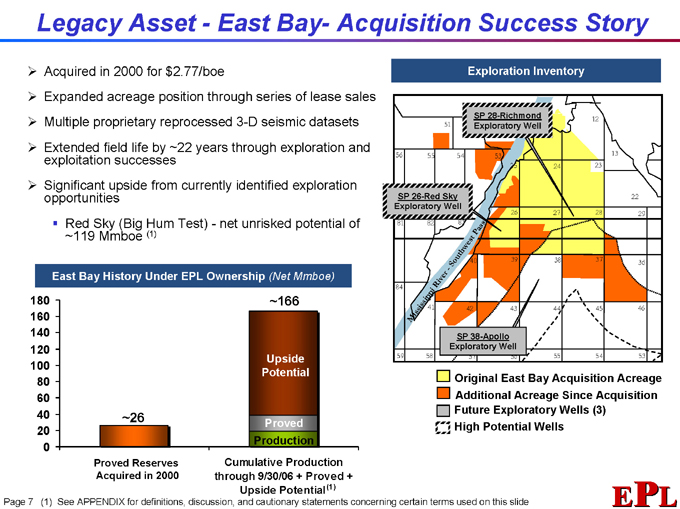
Legacy Asset—East Bay- Acquisition Success Story
Acquired in 2000 for $2.77/boe
Expanded acreage position through series of lease sales Multiple proprietary reprocessed 3-D seismic datasets Extended field life by ~22 years through exploration and exploitation successes Significant upside from currently identified exploration opportunities Red Sky (Big Hum Test)—net unrisked potential of ~119 Mmboe (1)
East Bay History Under EPL Ownership (Net Mmboe)
180 160 140 120 100 80 60 40 20 0
~26
~166
Upside Potential
Proved Production
Proved Reserves Acquired in 2000
Cumulative Production through 9/30/06 + Proved + Upside Potential (1)
Exploration Inventory
SP 28-Richmond Exploratory Well
SP 26-Red Sky Exploratory Well
SP 38-Apollo Exploratory Well
Original East Bay Acquisition Acreage Additional Acreage Since Acquisition Future Exploratory Wells (3) High Potential Wells
(1) | | See APPENDIX for definitions, discussion, and cautionary statements concerning certain terms used on this slide |
Page 7
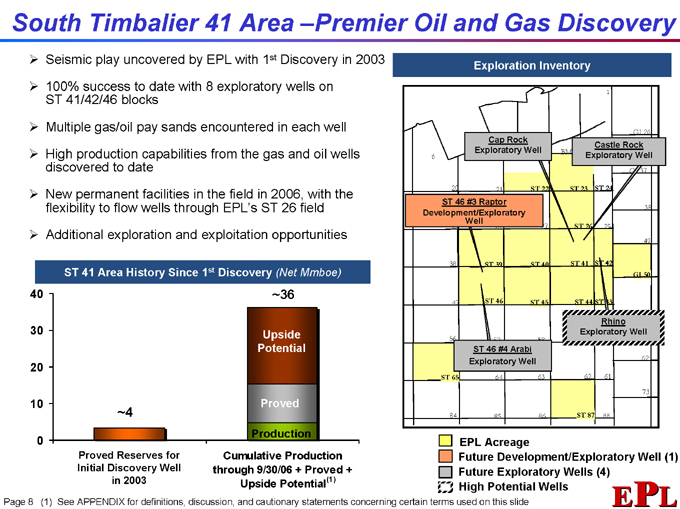
South Timbalier 41 Area –Premier Oil and Gas Discovery
Seismic play uncovered by EPL with 1st Discovery in 2003
100% success to date with 8 exploratory wells on ST 41/42/46 blocks
Multiple gas/oil pay sands encountered in each well
High production capabilities from the gas and oil wells discovered to date
New permanent facilities in the field in 2006, with the flexibility to flow wells through EPL’s ST 26 field
Additional exploration and exploitation opportunities
ST 41 Area History Since 1st Discovery (Net Mmboe)
40 30 20 10 0
~4
~36
Upside Potential
Proved
Production
Proved Reserves for Initial Discovery Well in 2003
Cumulative Production through 9/30/06 + Proved + Upside Potential(1)
Exploration Inventory
Cap Rock Exploratory Well
Castle Rock Exploratory Well
ST 46 #3 Raptor Development/Exploratory Well
Rhino Exploratory Well
ST 46 #4 Arabi Exploratory Well
EPL Acreage
Future Development/Exploratory Well (1) Future Exploratory Wells (4)
High Potential Wells
(1) | | See APPENDIX for definitions, discussion, and cautionary statements concerning certain terms used on this slide |
Page 8
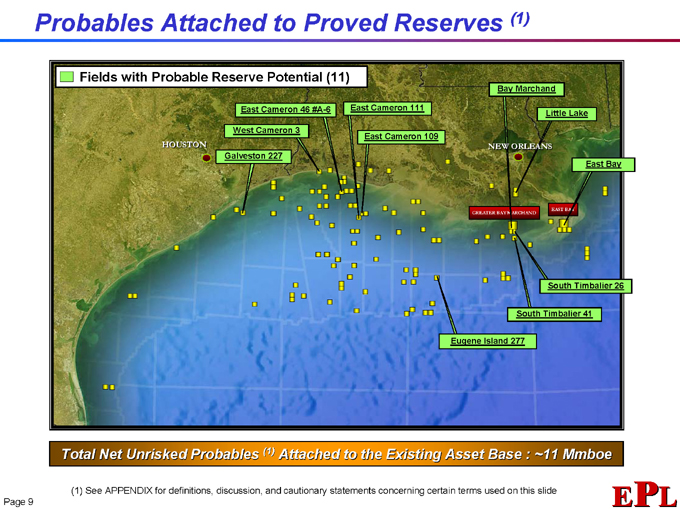
Probables Attached to Proved Reserves (1)
Fields with Probable Reserve Potential (11)
East Cameron 46 #A-6
East Cameron 111
Bay Marchand
West Cameron 3
East Cameron 109
Little Lake
HOUSTON
Galveston 227
NEW ORLEANS
East Bay
GREATER BAY MARCHAND
EAST BAY
South Timbalier 26
South Timbalier 41
Eugene Island 277
Total Net Unrisked Probables (1) Attached to the Existing Asset Base : ~11 Mmboe
(1) | | See APPENDIX for definitions, discussion, and cautionary statements concerning certain terms used on this slide |
Page 9
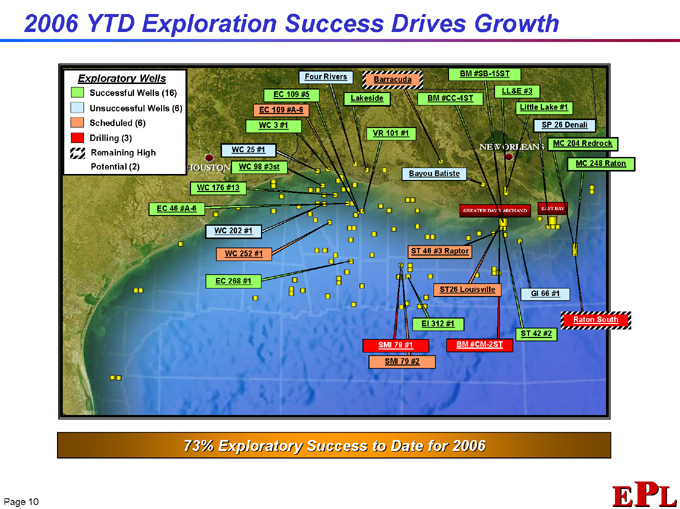
2006 YTD Exploration Success Drives Growth
Exploratory Wells
Successful Wells (16) Unsuccessful Wells (6) Scheduled (6) Drilling (3) Remaining High Potential (2)
Four Rivers BM #SB-15ST
Barracuda
LL&E #3 EC 109 #5 Lakeside BM #CC-4ST
EC 109 #A-6 Little Lake #1 WC 3 #1 SP 26 Denali VR 101 #1 NEW ORLEANS MC 204 Redrock WC 25 #1 WC 98 #3st MC 248 Raton Bayou Batiste HOUSTON
WC 176 #13
EC 46 #A-6
WC 202 #1
WC 252 #1
EC 268 #1
GREATER BAY MARCHAND
EAST BAY
ST 46 #3 Raptor
ST26 Louisville
GI 66 #1
EI 312 #1
Raton South
SMI 79 #1
SMI 79 #2
BM #CM-2ST
ST 42 #2
73% Exploratory Success to Date for 2006
Page 10
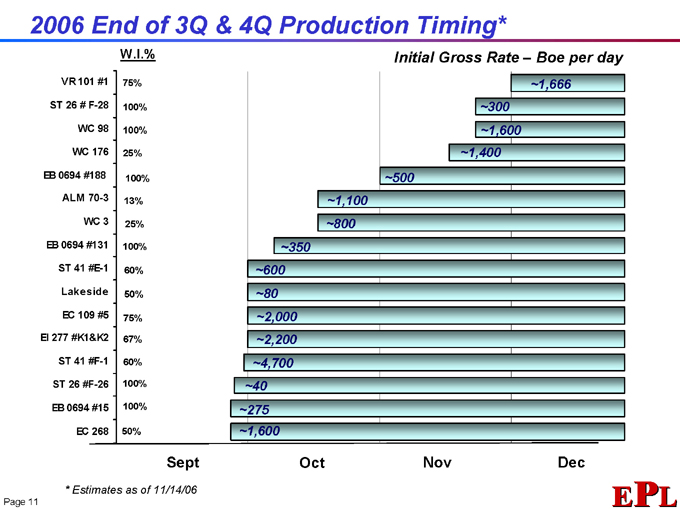
2006 End of 3Q & 4Q Production Timing*
W.I.%
VR 101 #1 ST 26 # F-28 WC 98 WC 176 EB 0694 #188 ALM 70-3 WC 3 EB 0694 #131 ST 41 #E-1 Lakeside EC 109 #5 EI 277 #K1&K2 ST 41 #F-1 ST 26 #F-26 EB 0694 #15 EC 268
75% 100% 100% 25% 100% 13% 25% 100% 60% 50% 75% 67% 60% 100% 100% 50%
Initial Gross Rate – Boe per day
~1,666
~300
~1,600
~1,400
~500
~1,100
~800
~350
~600 ~80 ~2,000 ~2,200 ~4,700
~40 ~275 ~1,600
Sept Oct Nov Dec
* | | Estimates as of 11/14/06 |
Page 11
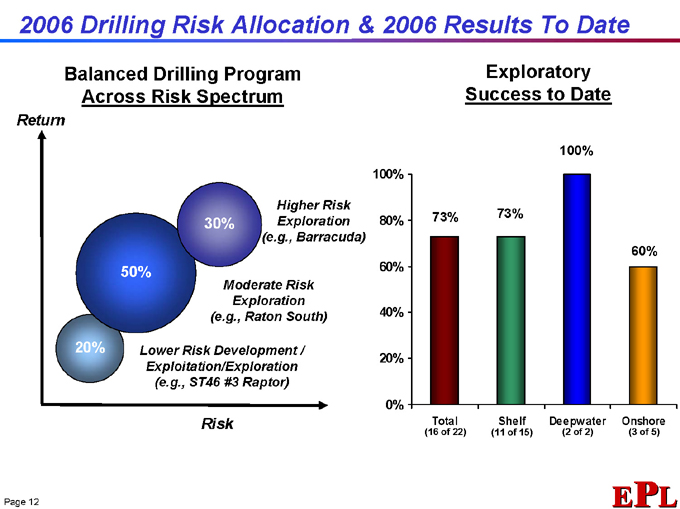
2006 Drilling Risk Allocation & 2006 Results To Date
Balanced Drilling Program Across Risk Spectrum
Return
30%
Higher Risk Exploration (e.g., Barracuda)
50%
Moderate Risk Exploration (e.g., Raton South)
20%
Lower Risk Development / Exploitation/Exploration (e.g., ST46 #3 Raptor)
Risk
Exploratory Success to Date
100% 80% 60% 40% 20% 0%
73%
73%
100%
60%
Total
(16 of 22)
Shelf
(11 of 15)
Deepwater
(2 of 2)
Onshore
(3 of 5)
Page 12
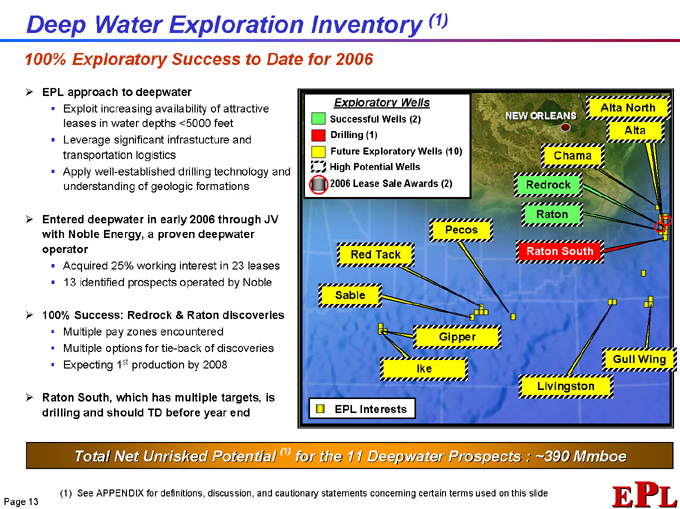
Deep Water Exploration Inventory (1)
100% Exploratory Success to Date for 2006
EPL approach to deepwater
Exploit increasing availability of attractive leases in water depths <5000 feet Leverage significant infrastucture and transportation logistics Apply well-established drilling technology and understanding of geologic formations
Entered deepwater in early 2006 through JV with Noble Energy, a proven deepwater operator
Acquired 25% working interest in 23 leases 13 identified prospects operated by Noble
100% Success: Redrock & Raton discoveries
Multiple pay zones encountered
Multiple options for tie-back of discoveries Expecting 1st production by 2008
Raton South, which has multiple targets, is drilling and should TD before year end
Exploratory Wells
Successful Wells (2) Drilling (1)
Future Exploratory Wells (10) High Potential Wells 2006 Lease Sale Awards (2)
NEW ORLEANS
Alta North Alta
Chama Redrock Raton
Pecos
Red Tack
Raton South
Sable
Gipper
Ike
Gull Wing
Livingston
EPL Interests
Total Net Unrisked Potential (1) for the 11 Deepwater Prospects : ~390 Mmboe
(1) | | See APPENDIX for definitions, discussion, and cautionary statements concerning certain terms used on this slide |
Page 13
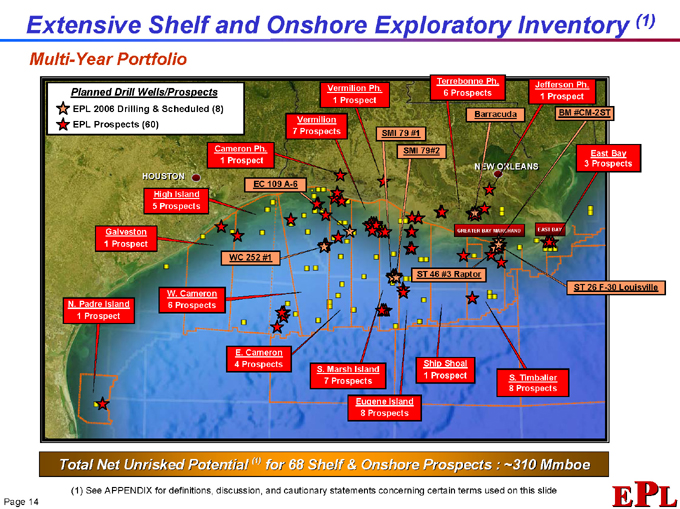
Extensive Shelf and Onshore Exploratory Inventory (1)
Multi-Year Portfolio
Planned Drill Wells/Prospects
EPL 2006 Drilling & Scheduled (8) EPL Prospects (60)
Vermilion Ph.
Terrebonne Ph.
Jefferson Ph.
Vermilion 7 Prospects
Cameron Ph.
HOUSTON
High Island 5 Prospects
Galveston 1 Prospect
N. Padre Island 1 Prospect
EC 109 A-6
WC 252 #1
W. Cameron 6 Prospects
SMI 79 #1
Barracuda
BM #CM-2ST
SMI 79#2
NEW ORLEANS
East Bay 3 Prospects
GREATER BAY MARCHAND
EAST BAY
ST 46 #3 Raptor
ST 26 F-30 Louisville
E. Cameron 4 Prospects
S. Marsh Island 7 Prospects
Ship Shoal 1 Prospect
S. Timbalier 8 Prospects
Eugene Island 8 Prospects
Total Net Unrisked Potential (1) for 68 Shelf & Onshore Prospects : ~310 Mmboe
(1) | | See APPENDIX for definitions, discussion, and cautionary statements concerning certain terms used on this slide |
Page 14
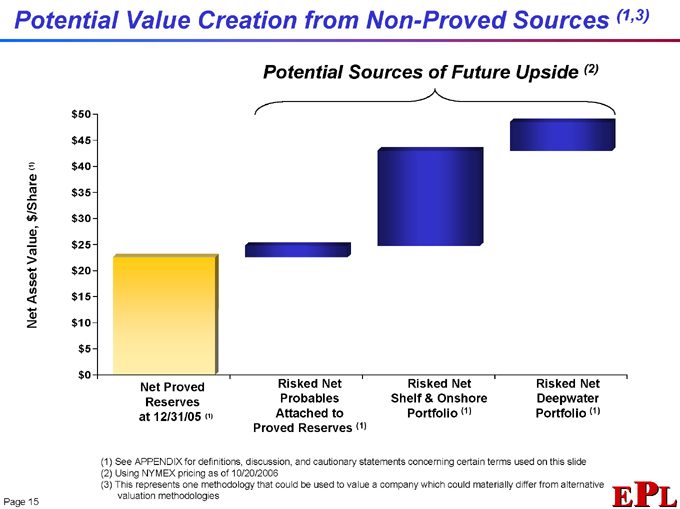
Potential Value Creation from Non-Proved Sources (1,3)
Potential Sources of Future Upside (2)
Net Asset Value, $/Share (1) $50 $45 $40 $35 $30 $25 $20 $15 $10 $5 $0
Net Proved Risked Net Risked Net Risked Net Reserves Probables Shelf & Onshore Deepwater at 12/31/05 (1) Attached to Portfolio (1) Portfolio (1) Proved Reserves (1)
(1) See APPENDIX for definitions, discussion, and cautionary statements concerning certain terms used on this slide (2) Using NYMEX pricing as of 10/20/2006 (3) This represents one methodology that could be used to value a company which could materially differ from alternative valuation methodologies
Page 15
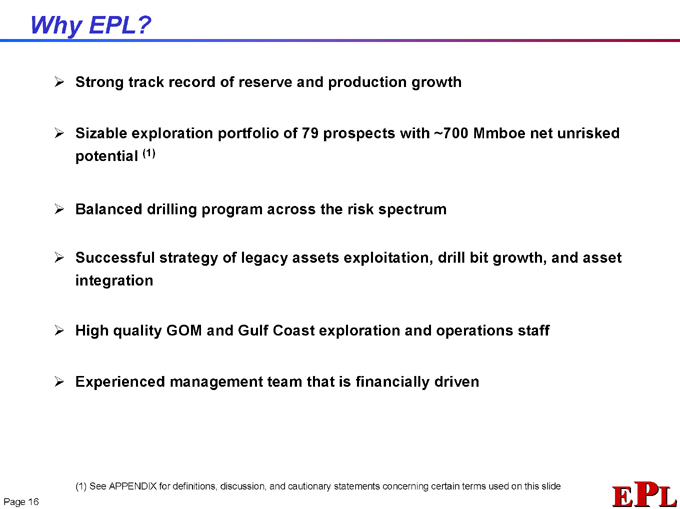
Why EPL?
Strong track record of reserve and production growth
Sizable exploration portfolio of 79 prospects with ~700 Mmboe net unrisked potential (1)
Balanced drilling program across the risk spectrum
Successful strategy of legacy assets exploitation, drill bit growth, and asset integration
High quality GOM and Gulf Coast exploration and operations staff
Experienced management team that is financially driven
(1) | | See APPENDIX for definitions, discussion, and cautionary statements concerning certain terms used on this slide |
Page 16
Corporate Information
Richard A. Bachmann Chairman and Chief Executive Officer
Phillip A. Gobe President and Chief Operating Officer
Timothy R. Woodall
Executive Vice President and Chief Financial Officer
John H. Peper
Executive Vice President General Counsel and Corporate Secretary
Principal Corporate Office 201 St. Charles Ave. Suite 3400 New Orleans, LA 70170
Phone: (504) 569-1875 Web: www.eplweb.com
Investor Relations Contacts T.J. Thom tthom@eplweb.com
Al Petrie alpetrie@eplweb.com
Page 17
Forward-Looking Statements & Other Information
Forward Looking Statements
This presentation contains forward-looking information regarding EPL that is intended to be covered by the safe harbor “forward-looking statements” provided by the Private Securities Litigation Reform Act of 1995. All statements included in this presentation that address activities, events or developments that EPL expects, believes or anticipates will or may occur in the future are forward-looking statements. These include statements regarding: reserve and production estimates, oil and gas prices, the impact of derivative positions, production expense estimates, cash flow estimates, future financial performance, planned capital expenditures, and other matters that are discussed in EPL’s filings with the Securities and Exchange Commission (SEC).
These statements are based on current expectations and projections about future events and involve known and unknown risks, uncertainties, and other factors that may cause actual results and performance to be materially different from any future results or performance expressed or implied by these forward-looking statements. Please refer to EPL’s filings with the SEC, including Form 10-K for the year ended December 31, 2005, and Form 10-Q for the quarter ended September 30, 2006, for a discussion of these risks.
Reserve Information
In its filings with the SEC, EPL is generally permitted to disclose only proved reserves, which are reserve estimates that geological and engineering data demonstrate with reasonable certainty to be recoverable in future years from known reservoirs under existing economic and operating conditions. EPL uses certain terms in this presentation, such as “potential” and “probable” in relation to reserves. Estimates of “potential” and “probable” reserves which may potentially be recoverable through additional drilling or recovery techniques are by their nature more uncertain than estimates of proved reserves and accordingly are subject to substantially greater risk of not actually being realized by the Company. For more information regarding these types of reserves, see “Definitions”. Investors are urged to consider closely EPL’s disclosure of its proved reserves, along with certain risk factors and uncertainties inherent in its business set forth in its Form 10-K and other filings with the SEC. Oil and gas exploration is inherently risky. There is no assurance that the Company can realize any of this potential.
Consent Solicitation
EPL HAS FILED A CONSENT REVOCATION STATEMENT WITH THE SECURITIES AND EXCHANGE COMMISSION IN RESPONSE TO WOODSIDE AND ATS’ CONSENT SOLICITATION TO REMOVE EPL’S BOARD OF DIRECTORS. INVESTORS AND SECURITY HOLDERS ARE URGED TO READ CAREFULLY THE CONSENT REVOCATION STATEMENT BECAUSE IT CONTAINS IMPORTANT INFORMATION REGARDING EPL, THE ATS OFFER AND THE CONSENT SOLICITATION. THE CONSENT REVOCATION STATEMENT HAS BEEN SENT TO SECURITY HOLDERS OF EPL SEEKING REVOCATION OF ANY CONSENTS GIVEN TO ATS OR WOODSIDE.
The documents filed with the SEC by EPL may be obtained free of charge from EPL’s website at www.eplweb.com or by directing a request to: Energy Partners, Ltd. 201 St. Charles Avenue, Suite 3400, New Orleans, Louisiana 70170, Attn: Secretary, (504) 569-1875. Investors and security holders are urged to read the consent revocation statement and the other relevant materials when they become available before making any decision with respect to the consent solicitation.
EPL and its officers and directors and certain other persons may be deemed to be participants in the solicitation of consents from the stockholders of EPL in opposition to the ATS consent solicitation. Information about the such persons and their direct or indirect interests, by security holdings or otherwise, in the consent solicitation is set forth in the consent revocation statement.
Page 18
Appendix: Definitions
Potential Value Creation from Non-Proved Sources- This represents one methodology that could be used to value a company which could materially differ from alternative valuation methodologies. Other persons valuing a company using this particular method could reach a different value as a result of, among other things, different risk factors being applied to the potential sources of future value. Actual results will be dependent on our drilling success, oil and natural gas markets and the accuracy of production and reserves estimates, which includes timing of future operations.
Proved Reserves- Proved reserves are those quantities of natural gas, crude oil, and condensate that geological and engineering data demonstrate, with reasonable certainty, to be recoverable in future years from known reservoirs under existing economic and operating conditions. There is no assurance of the recovery of all proved reserves over a given timeframe or at all.
Non-Proved Reserves- Non-proved reserves are considered not reasonably certain to be recovered. Estimates of non-proved reserves are based on geologic and/or engineering data similar to that used to estimate proved reserves, but technical, contractual, economic considerations and/or SEC, state or other regulations preclude such reserves from being classified as proved. Non-proved reserves may be further sub-classified as probable and potential to denote progressively increasing uncertainty of recoverability. Importantly, estimation of non-proved reserves may assume future economic conditions different than those prevailing at the time of the estimate. The effect of possible future improvements in economic conditions and technological developments can be expressed by allocating appropriate quantities of reserves to the probable and potential classifications. There is no assurance of the recovery of non-proved reserves over a given timeframe or at all, and non-proved reserves are less likely to recovered than those reserves considered proved.
Probable Reserves- Probable reserves are estimates of non-proved reserves which analysis of geological and engineering data suggests are more likely than not to be recoverable. For estimates of probable reserves based on probabilistic methods, there should be at least a 50% probability that the quantities of reserves actually recoverable will equal or exceed the sum of the estimated proved plus probable reserves. Probable reserves may include: 1. reserves in formations known to be productive where SEC regulations limit recognition of proved reserves to direct-offset locations one legal spacing-unit away from a producing well; 2. reserves anticipated to be proved by normal step-out drilling where subsurface control is currently inadequate to classify these reserves as proved; 3. reserves in formations that appear to be productive based on well-log characteristics but lack core data or other definitive tests to indicate productive potential and which are not analogous to producing or proved reserves in the area; 4. incremental reserves attributable to infill drilling that could have been classified as proved if closer statutory spacing had been approved at the time of the estimate; 5. reserves attributable to improved recovery methods that have been established by repeated commercially successful applications where: a. a project or pilot is planned but not in operation; and b. rock, fluid and reservoir characteristics appear favorable for commercial application; 6. reserves in an area of the formation that appears to be separated from the proved area by faulting and where geologic interpretation indicates that the area is structurally higher than the proved area; 7. reserves attributable to future workover, treatment, re-treatment, change of equipment, or other mechanical procedures, where such mechanical procedure has not been proved successful in wells which exhibit similar behavior in analogous reservoirs; and/or 8. incremental reserves in proved reservoirs where an alternative interpretation of performance or volumetric data indicates more reserves are present than can be classified as proved due to the restriction of classifying reserves as proven only to the lowest known hydrocarbons limit as identified through open hole logging of well penetrations in the reservoir. There is no assurance of the recovery of probable reserves over a given timeframe or at all, and probable reserves are less likely to recovered than those reserves considered proved.
Page 19
Appendix: Definitions
Unrisked Potential- Unrisked potential for each prospect as identified in EPL’s current portfolio of undrilled and currently drilling exploratory wells is used to describe the potential reserve value as evaluated geologically for each prospect that is the highest supportable reserve value that the prospect could potentially produce after discovery and up through its terminating reserve life. The resulting unrisked potential for multiple prospects is the summation of each individual prospect’s unrisked potential as defined above. Unrisked potential reflects a best case scenario and does not reflect expectations. It is very unlikely that all reserves included in unrisked potential will be recovered.
Upside Potential for East Bay and ST41 area- Upside potential for East Bay and South Timbalier 41, as set forth in slides 7 and 8, refers to the probable reserves associated with proved reserves plus the unrisked potential for prospects identified in those specific field areas (see definitions above).
Total Net Unrisked Potential for 68 Shelf and Onshore Prospects- The unrisked potential (see definition above) has been identified on a per prospect basis for EPL’s onshore South Louisiana and GOM Shelf portfolio of identified drilling opportunities, and represents EPL’s net revenue interest in the gross unrisked potential reserves attributed to each such prospect.
Total Net Unrisked Potential for 11 Deepwater Prospects- The unrisked potential (see definition above) has been identified on a per prospect basis for EPL’s deepwater GOM portfolio of identified drilling opportunities, and represents EPL’s net revenue interest in the gross unrisked potential reserves attributed this portfolio of drilling opportunities.
Risked Net Probables Attached to Proved Reserves– The probable reserves (see definition above) have been identified on a per field basis, and represents EPL’s net revenue interest in the gross probable reserves attributed to each such field. Subsequently, a general risk factor has been applied to the total probable reserves based on the judgment of EPL, which, among other things, reflects that these probables are less likely to be recovered than those reserves considered proved. Actual results will be dependent on oil and natural gas markets and the accuracy of production and reserves estimates, which includes timing of future operations.
Risked Net Shelf & Onshore Portfolio- The unrisked potential (see definition above) has been identified on a per prospect basis for EPL’s onshore South Louisiana and GOM Shelf portfolio of identified drilling opportunities, and represents EPL’s net revenue interest in the gross unrisked potential reserves attributed to each such prospect. Subsequently, a general risk factor has been applied to the Shelf and onshore portfolio based on the judgment of EPL. These opportunities have yet to be discovered and hence are subject to greater uncertainty than the net probables attached to proved reserves. Actual results will be dependent on our drilling success, oil and natural gas markets and the accuracy of production and reserves estimates, which includes timing of future operations.
Risked Net Deepwater Portfolio- The unrisked potential (see definition above) has been identified on a per prospect basis for EPL’s deepwater GOM portfolio of identified drilling opportunities, and represents EPL’s net revenue interest in the gross unrisked potential reserves attributed this portfolio of drilling opportunities. Subsequently, a general risk factor has been applied to the Deepwater portfolio based on the judgment of EPL. These opportunities have yet to be discovered and hence are subject to greater uncertainty than the net probables attached to proved reserves. Actual results will be dependent on our drilling success, oil and natural gas markets and the accuracy of production and reserves estimates, which includes timing of future operations.
Page 20
Appendix: Definitions
Net Asset Value per Share for Proved Reserves at 12/31/05 – The present value of the 12/31/05 future cash flow streams of EPL’s proved reserves at year end using year end prices for oil and natural gas held constant into the future, net of expenses, estimated capital expenditures and abandonment costs net of salvage, discounted to 10% on an after tax basis, less current outstanding debt of $320 million as of 9/30/06, less working capital of $2.8 million and less outstanding hedge positions of $22.1 million. The calculation then derives a per share value using fully diluted shares for the nine months ended on 9/30/06 of 40.5 million shares. This represents one methodology that could be used to value a company which could materially differ from alternative valuation methodologies. Other persons valuing a company using this particular method could reach a different value as a result of, among other things, different risk factors being applied to the potential sources of future value. Actual results will be dependent on our drilling success, oil and natural gas markets and the accuracy of production and reserves estimates, which includes timing of future operations.
Net Asset Value for Potential Sources of Future Upside – Net asset value for risked net probables attached to proved reserves, risked net Shelf and onshore portfolio, and risked net deepwater portfolio (see definitions above) is defined herein as the present value of the future cash flow streams of EPL’s probable reserves, and those contained in the portfolio of Shelf, onshore and deepwater prospects using New York Mercantile Exchange (NYMEX) pricing as of 10/20/06 for oil and natural gas for future periods, net of expenses, estimated future capital expenditures and abandonment costs net of salvage, discounted to 10% on an after tax basis. The calculation then derives a per share value using fully diluted shares for the nine months ended on 9/30/06 of 40.5 million shares. This represents one methodology that could be used to value a company which could materially differ from alternative valuation methodologies. Other persons valuing a company using this particular method could reach a different value as a result of, among other things, different risk factors being applied to the potential sources of future value. Actual results will be dependent on our drilling success, oil and natural gas markets and the accuracy of production and reserves estimates, which includes timing of future operations.
Page 21

201 St. Charles Avenue, Suite 3400 New Orleans, Louisiana 70170 (504) 569-1875 www.eplweb.com


