Exhibit 13.1
SunTrust
|
SunTrust Banks, Inc.
2002 Annual Report |
| |
| |
| |
| |
| |
| Performing well in unsettled times… |
|
| demonstrating the capacity to do even better |
| | |
About the Company
SunTrust Banks, Inc., with year-end 2002 assets of $117.3 billion, is one of the nation’s largest and strongest financial holding companies.
Through its flagship subsidiary, SunTrust Bank, the Company provides deposit, credit, and trust and investment services. Other subsidiaries provide mortgage banking, credit-related insurance, asset management, brokerage and capital market services. SunTrust’s customer base encompasses a broad range of individuals and families, high-net-worth clients, businesses and institutions.
SunTrust enjoys leading market positions in some of the highest-growth markets in the United States and also serves customers in selected markets nationally. The Company’s priorities include consistency in financial performance, quality in customer service and a strong commitment to all segments of the communities it serves.
SunTrust’s 1,184 retail branches and 2,286 ATMs are located primarily in Florida, Georgia, Maryland, Tennessee, Virginia and the District of Columbia. In addition, SunTrust provides customers with a selection of technology-based banking channels including Internet, PC and Telephone Banking. Our Internet address is www.suntrust.com.
As of December 31, 2002, SunTrust had total assets under advisement of $162.6 billion. This includes $121.1 billion in trust assets as well as $17.0 billion in retail brokerage assets. SunTrust’s mortgage servicing portfolio grew to $57.1 billion at year end.
Sun Trust 2002 Annual Report
to our shareholders |
|
| 
| L. Phillip Humann
Chairman, President and
Chief Executive Officer |
| |
SunTrust ended 2002
looking relatively good. | With its weak economy and unsettled business climate, 2002 was in many ways a year we are happy to have behind us. * For banks in general, the year was marked by slower revenue growth, higher credit quality costs and weaker performance than we have seen in some time. In addition, visible problems at a handful of well-known institutions seemed at times to cast a shadow over the rest of the industry. * SunTrust’s results, inevitably, reflected industry-wide pressures. Even so, we ended 2002 looking relatively good in most key measures of financial performance, strength and stability––especially when compared with other large U.S. banks. | |
| |
| | | |
financial highlights
SunTrust Banks, Inc.
| | Year Ended December 31 | |
| |
| |
(Dollars in millions except per share data) | | 2002 | | 2001 | | 2000 | |
| |
|
| |
|
| |
|
| |
For the Year | | | | | | | | | | |
| Income before extraordinary gain | | $ | 1,331.8 | | $ | 1,369.2 | | $ | 1,294.1 | |
| Extraordinary gain, net of taxes | | | — | | | 6.3 | | | — | |
| | |
|
| |
|
| |
|
| |
| Net income | | $ | 1,331.8 | | $ | 1,375.5 | | $ | 1,294.1 | |
| | |
|
| |
|
| |
|
| |
| Common dividends paid | | $ | 489.5 | | $ | 463.5 | | $ | 443.4 | |
| | |
|
| |
|
| |
|
| |
Per Common Share | | | | | | | | | | |
| Income – diluted before extraordinary gain | | $ | 4.66 | | $ | 4.70 | | $ | 4.30 | |
| Extraordinary gain | | | — | | | 0.02 | | | — | |
| | |
|
| |
|
| |
|
| |
| Net income – diluted | | $ | 4.66 | | $ | 4.72 | | $ | 4.30 | |
| | |
|
| |
|
| |
|
| |
| Dividends declared | | $ | 1.72 | | $ | 1.60 | | $ | 1.48 | |
| Common stock closing price | | | 56.92 | | | 62.70 | | | 63.00 | |
| Book value | | | 31.04 | | | 28.97 | | | 27.81 | |
| | |
|
| |
|
| |
|
| |
Financial Ratios | | | | | | | | | | |
| Return on average total assets less net unrealized gains on securities | | | 1.26 | % | | 1.37 | % | | 1.35 | % |
| Return on average total assets | | | 1.23 | | | 1.34 | | | 1.32 | |
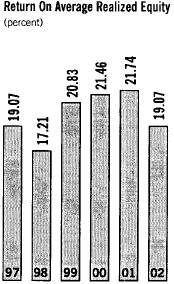
| Return on average realized shareholders’ equity | | | 19.07 | | | 21.74 | | | 21.46 | |
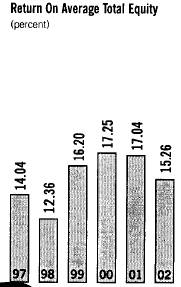
| Return on average total shareholders’ equity | | | 15.26 | | | 17.04 | | | 17.25 | |
| Net interest margin (taxable-equivalent) | | | 3.41 | | | 3.58 | | | 3.55 | |
| Efficiency ratio | | | 58.90 | | | 56.96 | | | 57.47 | |
| Tier 1 capital ratio | | | 7.47 | | | 8.02 | | | 7.09 | |
| Total capital ratio | | | 11.62 | | | 12.18 | | | 10.85 | |
| | |
|
| |
|
| |
|
| |
Selected Average Balances | | | | | | | | | | |
| Total assets | | $ | 108,516.1 | | $ | 102,884.2 | | $ | 98,397.8 | |
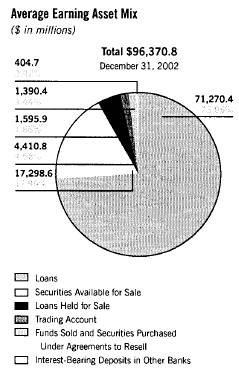
| Earning assets | | | 96,370.8 | | | 92,034.1 | | | 88,609.0 | |
| Loans | | | 71,270.4 | | | 70,023.0 | | | 70,044.3 | |
| Deposits | | | 71,157.2 | | | 64,568.7 | | | 66,691.9 | |
| Realized shareholders’ equity | | | 6,984.6 | | | 6,328.0 | | | 6,031.6 | |
| Total shareholders’ equity | | | 8,725.7 | | | 8,073.8 | | | 7,501.9 | |
| Common shares – diluted (thousands) | | | 286,052 | | | 291,584 | | | 300,956 | |
| | |
|
| |
|
| |
|
| |
At December 31 | | | | | | | | | | |
| Total assets | | $ | 117,322.5 | | $ | 104,740.6 | | $ | 103,660.4 | |
| Earning assets | | | 104,759.6 | | | 93,327.5 | | | 92,147.8 | |
| Loans | | | 73,167.9 | | | 68,959.2 | | | 72,239.8 | |
| Allowance for loan losses | | | 930.1 | | | 867.1 | | | 874.5 | |
| Deposits | | | 79,706.6 | | | 67,536.4 | | | 69,533.3 | |
| Realized shareholders’ equity | | | 7,260.0 | | | 6,704.3 | | | 6,296.4 | |
| Total shareholders’ equity | | | 8,769.5 | | | 8,359.6 | | | 8,239.2 | |
| Common shares outstanding (thousands) | | | 282,505 | | | 288,602 | | | 296,266 | |
| Market value of investment in common stock of The Coca-Cola Company (48,266,496 shares) | | $ | 2,116 | | $ | 2,276 | | $ | 2,941 | |
| | |
|
| |
|
| |
|
| |
| In this report, SunTrust presents a return on average assets less net unrealized gains on securities and a return on average realized equity. These performance measures exclude the net unrealized gains on the Company’s securities portfolio. Due to its ownership of 48 million shares of common stock of The Coca-Cola Company, the Company believes this is a more indicative performance measure when being compared to other companies. |
| |
| | 2 | Sun Trust 2002 Annual Report |
| | | | | | | | | | | | |
| For us, however, “relatively good” is not good enough. It is satisfying, therefore, that 2002 also brought with it tangible evidence of SunTrust’s capacity to deliver demonstrably better results in a more accommodating economic and market environment. |
| |
2002 brought tangible evidence of SunTrust’s capacity
to deliver demonstrably better results in a more accommodating environment. |
| |
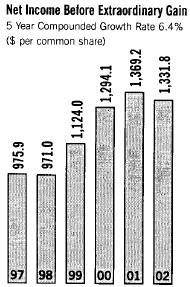
| For the year, SunTrust reported net income of $1.33 billion. This compared with $1.38 billion in 2001. On a per share basis, net income in 2002 was $4.66, compared with $4.72 in the prior year. It is important to note that the year’s reported earnings were reduced by $39.8 million, or $.14 per share, in after-tax merger charges connected with our acquisition of the Florida franchise of Huntington Bancshares, Inc. That transaction was announced in 2001 and the merger integration completed, smoothly, in early 2002. |
| |
| 
|
| |
| Earnings as originally reported. There are no adjustments for mergers accounted for as poolings. |
| |
| Given the harshness of the environment, SunTrust’s performance last year was respectable. That said, shareholders should know our 2002 results don’t suggest the kind of growth we consider either satisfactory or indicative of our Company’s true earnings potential. |
| |
| Shareholders and others desiring a detailed discussion of the year’s financial performance are encouraged to review the Management’s Discussion and Analysis section of this report. In this letter I will talk in more general terms about our results. Perhaps more important, I will also tell you why I think it’s reasonable for shareholders to feel optimistic about our prospects for 2003 and beyond. |
| | | |
Sun Trust 2002 Annual Report | 3 | |
| |
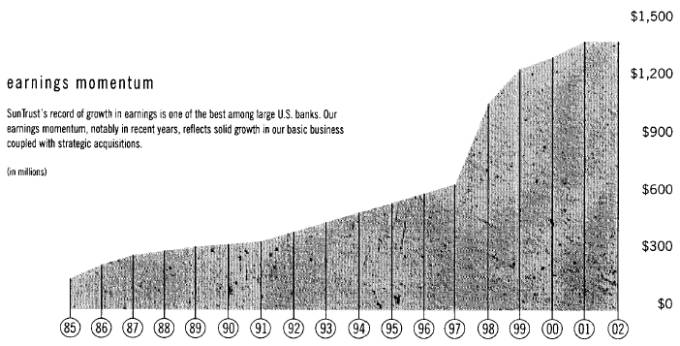
bottom line consistency |
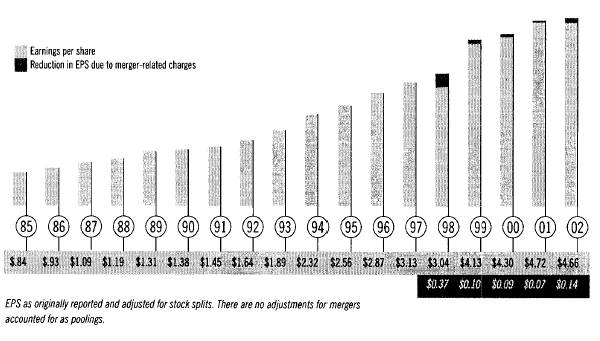 |
SunTrust’s emphasis on consistency in “bottom line” results is reflected in earnings per share (EPS) growth over an extended period. |
|
|
| |
|
| Operating Earnings Momentum |
| 2002 pressures notwithstanding, SunTrust can point to a multi-year record of generally consistent growth in operating earnings. Not many other large U.S. banks can say the same. We think shareholders deserve consistency in core performance, not surprises, and we strive to deliver it despite industry pressures and ups and downs of the economy. |
| |
| There has, properly, been much recent discussion in the business community about the validity of operating earnings versus earnings reported according to generally accepted accounting principles (called “GAAP earnings”). We fully embrace the view that GAAP earnings are the earnings that matter. But we also consider it appropriate to present operating earnings – which exclude merger-related charges – as an additional indicator of SunTrust’s basic business performance over time. |
| |
| SunTrust’s operating earnings differed from our GAAP earnings in just five recent instances. Each time, the only one-time charges excluded were costs incurred directly and specifically in connection with merger activity that took place outside our day-to-day business. We are proud that we have not taken either so-called “restructuring” or credit-related one-time charges. Although these charges were not uncommon in our industry in 2002, we believe them to be ultimately incompatible with the interests of our shareholders. |
| |
| 4 | Sun Trust 2002 Annual Report |
| | | | |
| Stock Trends: In Line with the Industry |
| Mirroring the poor performance of the stock market as a whole, the performance of SunTrust stock in 2002 was not, to say the least, what we would have liked it to be. |
| |
| As has been the case since mid-1998, the market tended to lump all banks together and our shares traded more or less in line with our peer group. The problem is that the performance of the group was lackluster. |
| |
| 2002’s experience confirmed the wisdom of not trying to predict future market movements. We remain convinced, however, that over time the price of SunTrust shares will improve in line with our improving performance. We also realistically hope to outperform our peers as we have in the past. We are doing the right things to make that happen. |
| |
| Meanwhile, the Board of Directors in February 2003 approved a 5% increase in the dividend on SunTrust common stock, bringing our annual dividend to $1.80 per share. Our dividend history is another reflection of the premium we place on consistency. |
| |
| Maintaining Strong Credit Quality |
| With economic growth elusive, credit quality emerged as the number one concern for banks in 2002. The issue was framed by highly visible bankruptcies of some major corporations that, in turn, sparked announcements of related credit losses at several large U.S. banks. In addition, bank loans to certain large borrowers came under increased regulatory scrutiny under “shared national credit” (SNC) examinations by the Federal Reserve. |
| |
dividend history |
 |
|
|
Sun Trust 2002 Annual Report | 5 | |
| | | |
| SunTrust fared well in its SNC examinations, and our exposure to the more notorious bankruptcies of the year was manageable. Yet we still experienced our share of the industry’s credit challenges, especially in our portfolio of loans to large corporate borrowers. Nonperforming assets were down from the prior year but still higher than in normal times. Charge-offs were up from a year ago as we moved aggressively to recognize problems and get them behind us – without taking any special charge to earnings. |
| |
| Historically, SunTrust has done better than most during times of credit weakness. That continued to be the case in 2002. |
| |
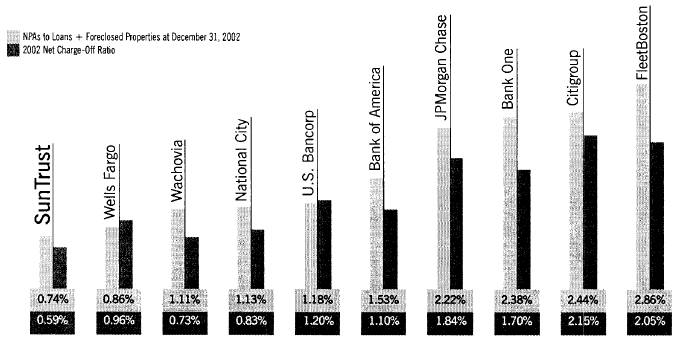
strong credit quality |
| |
SunTrust continued to outperform the largest U.S. banks in two key indicators of credit quality: nonperforming assets (NPAs) as a percentage of loans and foreclosed properties, and net charge-offs as a percentage of loans. |
 |
|
|
Top 10 U.S. banks based on December 31,2002 assets.
Source: SNL Financial and company reports. |
|
| To put things in perspective, our level of nonperforming assets as a percentage of total loans and foreclosed properties remained one of the lowest among major banks. Charge-offs, while high for us, still compared very well with the competition. And based on our current risk assessment as well as our historic loss experience, we are appropriately reserved. |
| |
| Countering the Impact of a Weak Economy |
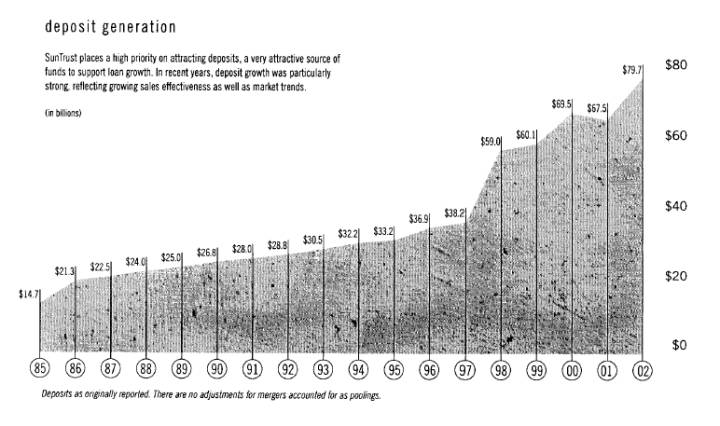
| A series of bright spots in our 2002 earnings picture helped soften the financial impact of the sluggish economy. For example, several loan categories – including home equity, small business and automobile lending – showed strong growth. With record levels of refinance activity, our Mortgage business had a blockbuster year. And customer deposits continued to grow at a strong pace, reflecting our growing sales effectiveness as well as market trends. |
| |
| 6 | Sun Trust 2002 Annual Report |
| | | |
| But as is typical in periods of prolonged economic weakness, many business customers cut back on their bank borrowing. So for us, as for most other banks, total loan growth was weak. Further, we took deliberate action to position our balance sheet for the higher rate environment that comes with a strong economic recovery. As a strong recovery failed to materialize, unusually low interest rates put a squeeze on our net interest margin. As a result of all this, net interest income, our largest revenue component, was essentially flat for the year. |
| |
| Noninterest income was also hurt by the economy. For example, trust and investment fees, a major driver of noninterest income, were up 4% last year. Even though 4% doesn’t look so bad given a 23% drop in the S&P 500 Index, it is not the kind of growth we generally expect – or get – from this key business line. |
| |
| The impact of weaker market-driven fees was offset to some degree by some positive trends. For example, we added a record number of new clients in our trust, investment and brokerage businesses. We enjoyed strong sales results of fee-based products in both our Retail and Commercial business lines. 2002 was also another year of excellent performance by our debt capital markets area, where results were up substantially over the prior year. |
| |
|
|
|
Sun Trust 2002 Annual Report | 7 | |
| | | |
| Enhancing Revenue Potential |
| The pervasive financial impact of the weak economy is masking what we think is SunTrust’s underlying earnings potential. Through a deliberate program of investment, selective acquisitions and concentrated management attention, we have worked to enhance the Company’s revenue generation capacity. In 2002, for example: |
| |
| • | We reconfigured our geographic banking organization to intensify local market focus, to streamline behind-the-scenes management processes and to make it easier to implement product innovations. |
|
investment, selective acquisitions and |
| focused management |
| have worked to enhance the Company’s |
| revenue-generation capacity |
| |
| • | The completion of our “One Bank” initiative – the largest systems consolidation effort in SunTrust’s history – enhances consistency in customer service, improves efficiency and prepares us operationally to handle significant new growth. |
| | |
| • | Our wealth management capabilities were enhanced, including expansion of our financial planning capability and entry into new markets by our family office affiliate, Asset Management Advisors (AMA), and Alexander Key Investments, our full-service brokerage unit. |
| | |
| • | SunTrust Robinson Humphrey, our capital markets arm, demonstrated its potential by achieving significant growth in relationships with commercial clients despite the worst equity markets in recent memory. |
| | |
| • | Our position in several fast-growing Florida markets was strengthened, and our merger integration skills illustrated, with the seamless integration of the former Huntington Bancshares Florida franchise. The transition was completed with virtually no customer disruption. |
| | |
| • | In another merger development that reflects our focus on high-growth markets, we announced in January 2003 plans to purchase Lighthouse Financial Services, Inc., owner of the largest mortgage lender on Hilton Head Island, South Carolina. |
| | |
| • | Creation of a senior sales executive position, impressive sales results in a cross-section of businesses and the installation of higher sales, service and retention standards for 2003 underscore our determination to deepen existing customer relationships as well as add new ones. |
| | |
| 8 | Sun Trust 2002 Annual Report |
| | | | | | |
| | |
| • | The volume of new accounts opened through our SunTrust Online telephone banking service and also via our redesigned website – www.suntrust.com – was again up substantially from prior year levels, illustrating the payoff from our investment in technology-based delivery channels. |
| | |
| Finally, recognizing that successful implementation of business initiatives ultimately depends on the quality of our workforce, we stepped up programs aimed at attracting and retaining top people. For example, our corporate diversity program was expanded with more than 2,500 managers participating in formal diversity training. Our in-house training arm, SunTrust University, offers nearly 1,400 training and developmental courses, including an expanded library of online training tools. |
| |
| SunTrust’s Conservative Operating Approach |
| SunTrust’s ability to emerge relatively unscathed from the turbulence of 2002 is in part attributable to a traditionally conservative approach to our business that has sometimes seemed out of step with our industry. We have, frankly, been skeptical at times when positive market recognition accrued to financial services institutions where rapid expansion was apparently not matched by a full understanding of the risks involved. But in 2002, amidst heightened public, media and government scrutiny, SunTrust’s brand of conservatism seemed to be more valued. |
| |
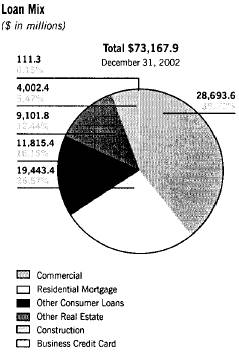
conservative loan portfolio |
|
SunTrust’s traditionally conservative approach to our business is reflected in the composition of our loan portfolio. We emphasize lower risk loan categories, such as residential mortgages and loans to smaller and mid-sized businesses, and a high degree of diversification. Equally important, SunTrust has avoided higher risk loan categories such as consumer credit card, Latin America and sub-prime lending. |
|

|
|
Sun Trust 2002 Annual Report | 9 | |
| | | | |
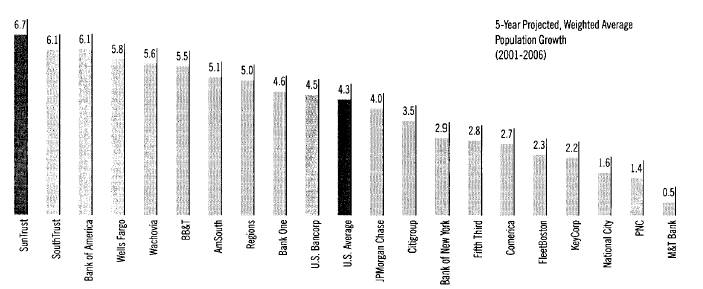
a high-growth footprint |
|
The 6.7% projected population growth rate for SunTrust’s “footprint” is not only the highest among large U.S. banks, but significantly higher than the national average. We capitalize on the growth opportunities our markets present by offering highly competitive products and services to a broadly defined client base. |
|
|
|
Top 20 banks by market capitalization excluding Mellon, State Street and Northern Trust as of August 14,2002. Weighted average based on MSA deposits.
Source: Claritas demographic data and SNL Financial. |
|
| Our conservative approach is reflected in different aspects of our operation: in our measured growth over time... our fundamentally risk-averse balance sheet... our disciplined approach to mergers and acquisitions... and in our resistance to esoteric financial or accounting strategies. SunTrust, for example, has made very limited use of off-balance sheet financing vehicles. |
| |
| Merits of Positive Differentiation |
| SunTrust benefited in 2002 from distinctive strengths that historically have differentiated us from the competition. They also figure prominently in our growth strategies. |
| |
| Perhaps most visible is our strong Southeast/Mid-Atlantic geographic franchise. With almost 1,200 well-placed branches, we enjoy leading positions in some of the most attractive, high-growth banking markets in the United States. |
| |
| We work to capitalize on the organic growth opportunities our markets present by offering highly competitive products and services to a broadly defined client base. In addition, our operating model emphasizes the role of local management – and local decision making – in product and service delivery. |
| |
| For most individual customers, the “face” of SunTrust is not our Atlanta headquarters. Rather, it is one of our 50-plus local banks, each headed by a local executive empowered to bring the full range of SunTrust capabilities to bear on client needs. Or perhaps it is our mortgage subsidiary, which in 2002 ranked as a national leader in customer satisfaction. |
| |
| 10 | Sun Trust 2002 Annual Report |
| | | |
| SunTrust takes seriously its commitment to all segments of the communities in which we operate. In addition to our product offerings, that commitment is reflected in a wide range of activities ranging from corporate contributions to specialized loan programs to employee volunteerism and leadership in civic affairs. |
| |
| Behind-the-scenes support is provided by a highly rated technology and information infrastructure. Its increasing effectiveness reflects significant capital investment in recent years. |
| |
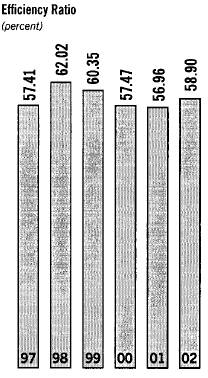
| Balancing Revenue and Efficiency |
| As economic clouds clear, we expect to see the positive impact of earnings enhancement moves to become much more pronounced. But we are not counting on, nor waiting for, an improved economy alone to lift our performance. |
| |
focus on efficiency | As 2003 began, a series of targeted profit acceleration initiatives was getting underway in each of our key business lines. They are designed to spur revenue growth even if a strong economic recovery is slow in coming. At the same time, recognizing that we can’t control the economy, we continue to focus with intensity on something we can control – expenses. |
| |
One indication of our focus on efficiency is a steady drop in our “core” staff level. This reduction was accomplished primarily through attrition. | In 2002, as it became clear that economy-related earnings pressures were not easing, expense control moved to center stage as a corporate priority. We instituted measures ranging from a company-wide hiring holiday at mid-year to tough decisions later to freeze executive salaries, forego management bonuses and eliminate an employee profit-sharing-type program. |
| |
| Over the past few years, SunTrust has been doing a better job at keeping operating expense growth in line. One indication of our success is a steady drop in our “core” staff level; that is, our employee base not counting people added as a result of acquisitions. Importantly, this reduction was accomplished primarily through attrition and a disciplined approach to new hiring. In a year when announcements of broad-scale employee layoffs were almost commonplace in the financial services industry, SunTrust chose not to take such an action. |
|
It is unavoidable that our people feel the pinch of corporate belt-tightening moves. But our approach to expense control reflects a long-standing belief that expense targets must be achieved without irreparably damaging the employee morale essential for providing quality customer service. |
|
Corporate Governance
In the wake of inexcusable misdeeds by some major U.S. corporations, issues of corporate governance became, understandably, the subject of intense public policy focus in 2002. |
Year-end core staff levels are adjusted for acquisitions and divestitures. | |
| |
Sun Trust 2002 Annual Report | 11 | |
| | | |
| |
| In line with national trends, we announced in mid-2002 that we were instituting a number of investor-oriented measures. Included was the creation of a new Compensation and Governance Committee of our Board of Directors. It is composed entirely of independent directors. We declared our intent to expense the cost of stock options awarded to employees each year. And we noted that, in accordance with newly crafted government requirements, our Chief Executive Officer and Chief Financial Officer had formally attested to the accuracy of the Company’s financial statements. |
| |
| At SunTrust the high value we place on corporate integrity overall surely covers areas like financial management and financial reporting. Moves by national policy makers to raise the standards in these areas for all publicly held companies are, in our view, very much to the good. |
| |
| A Closing Perspective |
| Before inviting your attention to the financial section of this report, let me observe that while 2002 was in some ways a year we are happy to have behind us, it was not without its positive dimensions. Perhaps most satisfying, it underscored the capacity of our organization not only to withstand the impact of a weak economy, but to maintain a steady, forward momentum despite it. |
| |
| 2002 also brought out the best in our people, many of whom were confronted with a problematic industry environment for the first time in their careers. My thanks go to all our employees for their extra effort in 2002. |
| |
| I also thank our Board of Directors – to which we were pleased to welcome Karen Hastie Williams, partner in the Washington, D.C. law firm of Crowell & Moring – for its perspective and insight in a year when Board-related issues were making front-page news across the country. |
| |
| Our shareholders deserve a special word of appreciation for their understanding that SunTrust is not entirely immune to market forces. |
| |
| Finally, to our customers, thank you for your business. We remain committed to meeting your financial services needs. |
| |
| /s/ L. P HILLIP H UMANN |
|
|
| L. Phillip Humann
Phillip Humann
Chairman, President and Chief Executive Officer |
| |
| 12 | Sun Trust 2002 Annual Report |
| | | |
selected financial data
selected financial data
| | Year Ended December 31 | |
| |
| |
(In millions except per share and other data) | | 2002 | | 2001 | | 2000 | | 1999 | | 1998 | | 1997 | |
| |
|
| |
|
| |
|
| |
|
| |
|
| |
|
| |
Summary of Operations | | | | | | | | | | | | | | | | | | | |
| Interest and dividend income | | $ | 5,135.2 | | $ | 6,279.6 | | $ | 6,845.4 | | $ | 5,960.2 | | $ | 5,675.9 | | $ | 5,238.2 | |
| Interest expense | | | 1,891.5 | | | 3,027.0 | | | 3,736.9 | | | 2,814.7 | | | 2,746.8 | | | 2,453.5 | |
| |
|
| |
|
| |
|
| |
|
| |
|
| |
|
| |
| Net interest income | | | 3,243.7 | | | 3,252.6 | | | 3,108.5 | | | 3,145.5 | | | 2,929.1 | | | 2,784.7 | |
| Provision for loan losses | | | 469.8 | | | 275.2 | | | 134.0 | | | 170.4 | | | 214.6 | | | 225.1 | |
| |
|
| |
|
| |
|
| |
|
| |
|
| |
|
| |
| Net interest income after provision for loan losses | | | 2,773.9 | | | 2,977.4 | | | 2,974.5 | | | 2,975.1 | | | 2,714.5 | | | 2,559.6 | |
Noninterest income1 | | | 2,391.7 | | | 2,155.8 | | | 1,773.6 | | | 1,625.9 | | | 1,653.9 | | | 1,329.2 | |
Noninterest expense2, 4 | | | 3,342.3 | | | 3,113.5 | | | 2,828.5 | | | 2,905.3 | | | 2,870.1 | | | 2,389.2 | |
| |
|
| |
|
| |
|
| |
|
| |
|
| |
|
| |
| Income before provision for income taxes and extraordinary gain | | | 1,823.3 | | | 2,019.7 | | | 1,919.6 | | | 1,695.7 | | | 1,498.3 | | | 1,499.6 | |
| Provision for income taxes | | | 491.5 | | | 650.5 | | | 625.5 | | | 571.7 | | | 527.3 | | | 523.7 | |
| |
|
| |
|
| |
|
| |
|
| |
|
| |
|
| |
| Income before extraordinary gain | | | 1,331.8 | | | 1,369.2 | | | 1,294.1 | | | 1,124.0 | | | 971.0 | | | 975.9 | |
Extraordinary gain, net of taxes3 | | | — | | | 6.3 | | | — | | | 202.6 | | | — | | | — | |
| |
|
| |
|
| |
|
| |
|
| |
|
| |
|
| |
| Net income | | $ | 1,331.8 | | $ | 1,375.5 | | $ | 1,294.1 | | $ | 1,326.6 | | $ | 971.0 | | $ | 975.9 | |
| | |
|
| |
|
| |
|
| |
|
| |
|
| |
|
| |
| Net interest income (taxable-equivalent) | | $ | 3,283.2 | | $ | 3,293.4 | | $ | 3,148.4 | | $ | 3,188.0 | | $ | 2,973.5 | | $ | 2,832.6 | |
Per Common Share | | | | | | | | | | | | | | | | | | | |
| Diluted | | | | | | | | | | | | | | | | | | | |
| | Income before extraordinary gain | | $ | 4.66 | | $ | 4.70 | | $ | 4.30 | | $ | 3.50 | | $ | 3.04 | | $ | 3.04 | |
| | Extraordinary gain | | | — | | | 0.02 | | | — | | | 0.63 | | | — | | | — | |
| |
|
| |
|
| |
|
| |
|
| |
|
| |
|
| |
| | Net income | | | 4.66 | | | 4.72 | | | 4.30 | | | 4.13 | | | 3.04 | | | 3.04 | |
| Basic | | | | | | | | | | | | | | | | | | | |
| | Income before extraordinary gain | | | 4.71 | | | 4.76 | | | 4.35 | | | 3.54 | | | 3.08 | | | 3.08 | |
| | Extraordinary gain | | | — | | | 0.02 | | | — | | | 0.64 | | | — | | | — | |
| | |
|
| |
|
| |
|
| |
|
| |
|
| |
|
| |
| | Net income | | | 4.71 | | | 4.78 | | | 4.35 | | | 4.18 | | | 3.08 | | | 3.08 | |
| Dividends declared | | | 1.72 | | | 1.60 | | | 1.48 | | | 1.38 | | | 1.00 | | | 0.925 | |
| Market price: | | | | | | | | | | | | | | | | | | | |
| | High | | | 70.20 | | | 72.35 | | | 68.06 | | | 79.81 | | | 87.75 | | | 75.25 | |
| | Low | | | 51.48 | | | 57.29 | | | 41.63 | | | 60.44 | | | 54.00 | | | 44.13 | |
| | Close | | | 56.92 | | | 62.70 | | | 63.00 | | | 68.81 | | | 76.50 | | | 71.38 | |
Selected Average Balances | | | | | | | | | | | | | | | | | | | |
| Total assets | | $ | 108,516.1 | | $ | 102,884.2 | | $ | 98,397.8 | | $ | 92,820.8 | | $ | 85,536.9 | | $ | 76,017.3 | |
| Earning assets | | | 96,370.8 | | | 92,034.1 | | | 88,609.0 | | | 82,255.7 | | | 74,880.9 | | | 66,944.0 | |
| Loans | | | 71,270.4 | | | 70,023.0 | | | 70,044.3 | | | 62,749.4 | | | 57,590.5 | | | 51,788.1 | |
| Deposits | | | 71,157.2 | | | 64,568.7 | | | 66,691.9 | | | 57,842.1 | | | 53,725.3 | | | 51,673.7 | |
| Realized shareholders’ equity | | | 6,984.6 | | | 6,328.0 | | | 6,031.6 | | | 6,368.3 | | | 5,641.4 | | | 5,116.7 | |
| Total shareholders’ equity | | | 8,725.7 | | | 8,073.8 | | | 7,501.9 | | | 8,190.7 | | | 7,853.6 | | | 6,953.4 | |
At December 31 | | | | | | | | | | | | | | | | | | | |
| Total assets | | $ | 117,322.5 | | $ | 104,740.6 | | $ | 103,660.4 | | $ | 95,390.0 | | $ | 93,169.9 | | $ | 82,840.8 | |
| Earning assets | | | 104,759.6 | | | 93,327.5 | | | 92,147.8 | | | 85,193.4 | | | 81,295.1 | | | 72,258.9 | |
| Loans | | | 73,167.9 | | | 68,959.2 | | | 72,239.8 | | | 66,002.8 | | | 61,540.6 | | | 55,476.4 | |
| Allowance for loan losses | | | 930.1 | | | 867.1 | | | 874.5 | | | 871.3 | | | 944.6 | | | 933.5 | |
| Deposits | | | 79,706.6 | | | 67,536.4 | | | 69,533.3 | | | 60,100.5 | | | 59,033.3 | | | 54,580.8 | |
| Long-term debt | | | 11,879.8 | | | 12,660.6 | | | 8,945.4 | | | 6,017.3 | | | 5,807.9 | | | 4,010.4 | |
| Realized shareholders’ equity | | | 7,260.0 | | | 6,704.3 | | | 6,296.4 | | | 6,064.0 | | | 6,090.4 | | | 5,263.9 | |
| Total shareholders’ equity | | | 8,769.5 | | | 8,359.6 | | | 8,239.2 | | | 7,626.9 | | | 8,178.6 | | | 7,312.1 | |
Ratios and Other Data | | | | | | | | | | | | | | | | | | | |
| Return on average assets less net unrealized gains on securities | | | 1.26 | % | | 1.37 | % | | 1.35 | % | | 1.48 | % | | 1.18 | % | | 1.34 | % |
| Return on average total assets | | | 1.23 | | | 1.34 | | | 1.32 | | | 1.43 | | | 1.14 | | | 1.28 | |
| Return on average realized shareholders’ equity | | | 19.07 | | | 21.74 | | | 21.46 | | | 20.83 | | | 17.21 | | | 19.07 | |
| Return on average total shareholders’ equity | | | 15.26 | | | 17.04 | | | 17.25 | | | 16.20 | | | 12.36 | | | 14.04 | |
| Net interest margin | | | 3.41 | | | 3.58 | | | 3.55 | | | 3.88 | | | 3.97 | | | 4.23 | |
| Efficiency ratio | | | 58.90 | | | 56.96 | | | 57.47 | | | 60.35 | | | 62.02 | | | 57.41 | |
| Total shareholders’ equity to assets | | | 7.47 | | | 7.98 | | | 7.95 | | | 8.00 | | | 8.78 | | | 8.83 | |
| Allowance to year-end loans | | | 1.27 | | | 1.26 | | | 1.21 | | | 1.32 | | | 1.53 | | | 1.68 | |
| Nonperforming assets to total loans plus OREO and other repossessed assets | | | 0.74 | | | 0.87 | | | 0.61 | | | 0.43 | | | 0.40 | | | 0.43 | |
| Common dividend payout ratio | | | 36.8 | | | 33.7 | | | 34.3 | | | 33.4 | | | 32.9 | | | 30.4 | |
| Full-service banking offices | | | 1,184 | | | 1,128 | | | 1,129 | | | 1,114 | | | 1,079 | | | 1,072 | |
| ATMs | | | 2,286 | | | 1,944 | | | 1,991 | | | 1,968 | | | 1,839 | | | 1,691 | |
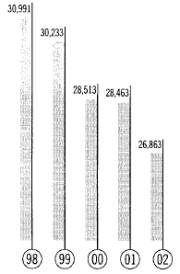
| Full-time equivalent employees | | | 27,622 | | | 28,391 | | | 28,268 | | | 30,222 | | | 30,452 | | | 29,442 | |
| Average common shares – diluted (thousands) | | | 286,052 | | | 291,584 | | | 300,956 | | | 321,174 | | | 319,711 | | | 320,932 | |
| Average common shares – basic (thousands) | | | 282,495 | | | 287,702 | | | 297,834 | | | 317,079 | | | 314,908 | | | 316,436 | |
| | |
|
| |
|
| |
|
| |
|
| |
|
| |
|
| |
| | | | | | | | | | | | | | | | | | | | |
1Includes securities gains of $204.5 million and $100.2 million and securities losses of $114.9 million related to the securities portfolio repositioning in 2002, 2001 and 1999, respectively. An additional $52.9 million security gain was recorded in 2001 on the sale of Star Systems, Inc. |
2Includes merger-related expenses of $16.0 million in 2002 related to the acquisition of Huntington-Florida and $42.4 million in 2000, $45.6 million in 1999 and $119.4 million in 1998 related to the acquisition of Crestar. |
3Represents the gain on the early extinguishment of long-term debt in 2001, net of $3.4 million in taxes, and the gain on sale of the Company’s consumer credit card portfolio in 1999, net of $124.6 million in taxes. |
4Includes expenses of $32.0 million from the proposal to acquire the former Wachovia Corporation in 2001. |
| |
| selected financial data | 14 | Sun Trust 2002 Annual Report |
| | | | | | | | | | | | | | | | | | | | | | |
management’s discussion
This narrative will assist readers in their analysis of the accompanying consolidated financial statements and supplemental financial information. It should be read in conjunction with the Consolidated Financial Statements and Notes on pages 53 through 93. In Management’s Discussion, net interest income, net interest margin and the efficiency ratio are presented on a fully taxable-equivalent (FTE) basis, which is adjusted for the tax-favored status of income from certain loans and investments. The Company believes this measure to be the preferred industry measurement of net interest income and provides relevant comparison between taxable and non-taxable amounts. Certain reclassifications have been made to prior year financial statements and related information to conform them to the 2002 presentation.
SunTrust has made, and may continue to make, various forward-looking statements with respect to financial and business matters. The following discussion contains forward-looking statements that involve inherent risks and uncertainties. Actual results may differ materially from those contained in these forward-looking statements. For additional information regarding forward-looking statements, see “A Warning About Forward-looking Information” on page 51 of this Annual Report. In addition, the preparation of the financial statements, upon which this Management’s Discussion is based, requires management to make estimates which impact these financial statements. Included in the Notes to the Consolidated Financial Statements, which start on page 59, are the most significant accounting policies used in the preparation of these statements as required by generally accepted accounting principles. These Notes should be read in conjunction with the reader’s review of SunTrust’s financial statements and results of operations.
Critical Accounting Policies
The Company’s accounting policies are integral to understanding the results reported. Accounting policies are described in detail in Note 1 to the Consolidated Financial Statements. The Company’s most complex accounting policies require management’s judgment to ascertain the valuation of assets, liabilities, commitments and contingencies. A variety of factors could affect the ultimate value that is obtained either when earning income, recognizing an expense, recovering an asset or relieving a liability. In many instances, we use a discount factor to determine the present value of assets and liabilities. A change in the discount factor could increase or decrease the values of those assets and liabilities. That change could result in either a beneficial or adverse impact on our financial results. The Company has established detailed policies and control procedures that are intended to ensure valuation methods are well controlled and applied consistently from period to period. In addition, the policies and procedures are intended to ensure that the process for changing methodologies occurs in an appropriate manner. The following is a brief description of the Company’s current accounting policies involving significant management valuation judgments.
Allowance for Loan Losses
The allowance for loan losses represents management’s estimate of losses inherent in the existing loan portfolio. The allowance for loan losses is increased by the provision for loan losses charged to expense and reduced by loans charged off, net of recoveries. The allowance for loan losses is determined based on management’s assessment of several factors: reviews and evaluations of specific loans, changes in the nature and volume of the loan portfolio, current economic conditions and the related impact on segments of the loan portfolio, historical loan loss experiences and the level of classified and nonperforming loans.
Loans are considered impaired if, based on current information and events, it is probable that SunTrust will be unable to collect the scheduled payments of principal or interest when due according to the contractual terms of the loan agreement. The measurement of impaired loans is based on either the fair value of the underlying collateral, the present value of the future cash flows discounted at the historical effective interest rate stipulated in the loan agreement, or the estimated market value of the loan. In measuring the fair value of the collateral, management uses assumptions (e.g., discount rate) and methodologies (e.g., comparison to the recent selling price of similar assets) consistent with those that would be utilized by unrelated third parties.
Changes in the financial condition of individual borrowers, economic conditions, historical loss experience, or the condition of the various markets in which collateral may be sold may affect the required level of the allowance for loan losses and the associated provision for loan losses. Should cash flow assumptions or market conditions change, a different amount may be reported for the allowance for loan losses and the associated provision for loan losses.
Estimates of Fair Value
The estimation of fair value is significant to a number of SunTrust’s assets, including trading account assets, loans held for sale, available-for-sale investment securities, mortgage servicing rights (“MSRs”), other real estate owned, other repossessed assets, as well as assets and liabilities associated with derivative financial instruments. These are all recorded at either fair value or at the lower of cost or fair value. Fair values are volatile and may be influenced by a number of factors. Circumstances that could cause estimates of the fair value of certain assets and liabilities to change include a change in prepayment speeds, discount rates, or market interest rates.
Fair values for trading account assets, most available-for-sale investment securities and most derivative financial instruments are based on quoted market prices. If quoted market prices are not available, fair values are based on the quoted prices of similar instruments. The fair values of loans held for sale are based on anticipated liquidation values, while the fair values of mortgage servicing rights are based on discounted cash flow analysis utilizing dealer consensus prepayment speeds and market discount rates. The fair values of other real estate owned are typically determined based on appraisals by third parties, less estimated costs to sell.
Estimates of fair value are also required in performing an impairment analysis of goodwill. The Company reviews goodwill for impairment at least once annually and whenever events or circumstances indicate the carrying value may not be recoverable. An impairment would be indicated if the carrying value exceeds the fair value of a reporting unit.
Recent Accounting Developments
The Company adopted the provisions of several new accounting pronouncements in the current year, including Statement of Financial Accounting Standards (“SFAS”) Nos. 144, 145, 146, 147,148 and the disclosure requirements of FASB Interpretation (“FIN”) Nos. 45 and 46. The provisions of these pronouncements and the related impact to the Company are discussed in the Recent Accounting Developments section of Note 1 to the Consolidated Financial Statements beginning on page 59.
Sun Trust 2002 Annual Report | 15 | management’s discussion |
management’s discussion
Earnings Overview
SunTrust’s net income for 2002 totaled $1,331.8 million, or $4.66 per diluted share, down 3.2% from the net income of $1,375.5 million, or $4.72 per diluted share, earned in 2001. Results included the following items:
• | After-tax merger-related expenses totaling $39.8 million, or $0.14 per diluted share, associated with the Huntington-Florida franchise acquisition in 2002. |
| |
• | One Bank initiative costs of $36.5 million, net of tax, or $0.13 per diluted share, and $35.5 million, or $0.12 per diluted share, for the Company’s enhancements during 2002 and 2001, respectively, to customer-based systems that will yield further operating efficiencies in the future. |
| |
• | After-tax securities gains of $133.0 million, or $0.46 per diluted share, and $65.1 million, or $0.22 per diluted share, related to the balance sheet repositioning during 2002 and 2001, respectively. |
| |
• | After-tax merger-related expenses totaling $20.2 million, or $0.07 per diluted share, associated with the Company’s proposal to acquire the former Wachovia Corporation in 2001. |
| |
• | Extraordinary gain of $6.3 million, net of tax, or $0.02 per diluted share, for the early extinguishments of long-term debt in 2001. |
Impacting operating results was the continued decline of interest rates in 2002. Net interest income decreased $10.1 million to $3,283.2 million, and the net interest margin decreased 17 basis points in 2002. Net interest income was favorably impacted by mortgage refinancing experienced during 2002, which led to an increase in average loans to be sold in the secondary market from $2.9 billion in 2001 to $4.4 billion in 2002.
Operating results for 2002 were impacted by a weak economy, which resulted in credit deterioration in the large corporate portfolio. Results were negatively impacted by a $194.6 million increase in the provision for loan losses. Net charge-offs were $422.3 million, or 0.59% of average loans for 2002, compared to $272.4 million, or 0.39% of average loans for 2001. The 2002 loan loss provision of $469.8 million was 70.7% higher than the $275.2 million recorded in 2001. These increases were primarily due to increased large corporate charge-offs due to the weakened economy. Additionally impacting the increase was $45.3 million of additional provision expense in 2002 related to the Huntington-Florida acquisition in order to conform the Huntington-Florida portfolio to SunTrust’s credit standards.
Noninterest income increased 10.9% to $2,391.7 million for 2002. Noninterest income, excluding securities gains and losses, was $2,187.1 million, a 9.2% increase compared to 2001. This increase was driven by a $159.2 million, or 21.2%, increase in service charges on deposit accounts and other charges and fees as the Company benefited from increased usage of products and services, a more consistent pricing strategy throughout the Company’s markets and a lower earnings credit rate. Also positively impacting noninterest income was a $68.5 million, or 63.1%, increase in investment banking income due to improvements in the performance of the Company’s capital markets business and the addition of the institutional business of Robinson-Humphrey during the third quarter of 2001. Additionally, the Company benefited from increases of $28.9 million, or 26.8%, in retail investment services and $18.4 million, or 3.8%, in trust and investment management income. Mortgage production related income increased $29.1 million, or 15.6%, due to significant refinancing activity in 2002, while mortgage servicing related income decreased $104.0 million due to accelerated amortization of mortgage servicing rights resulting from increased prepayments.
Noninterest expense for 2002 was $3,342.3 million, a 7.3% increase compared to 2001. Noninterest expense, excluding merger-related expenses, increased $212.7 million or 6.8% compared to 2001. Personnel expenses increased $160.0 million, or 9.0%, primarily attributable to increased benefits costs and the acquisitions of Huntington-Florida, the institutional business of Robinson-Humphrey and AMA Holdings, Inc., as well as expenses related to the now-completed One Bank initiative. Also negatively impacting personnel expenses was increased incentive payments resulting from record mortgage production. Mortgage production for 2002 was $30.8 billion compared to $24.2 billion in 2001. The $34.2 million, or 5.9%, increase in other noninterest expense is mainly attributable to an expense of $25.0 million related to the standardization of the financial performance of the Company’s affordable housing business. Also impacting noninterest expense was an increase in net occupancy expense of $18.8 million, or 8.9%, due to the acquisitions of Huntington-Florida and the institutional business of Robinson-Humphrey. Amortization of intangible assets increased $12.6 million, or 27.3%, due to amortization of intangibles related to the Huntington-Florida acquisition. In 2001, the Company recorded $41.7 million of goodwill amortization that is no longer being amortized in conjunction with the provisions of SFAS No. 142.
management’s discussion | 16 | Sun Trust 2002 Annual Report |
Business Segments
Prior to 2001, the Company’s segment disclosures were aligned with its geographic regions as defined by its former multiple bank charters. During 2000, as a result of the consolidation of its multiple bank charters into a single legal entity, the Company began to redefine its operating model and created a line of business management structure to overlay its former multiple bank management structure. Beginning in January 2001, the Company implemented significant changes to its internal management reporting system to begin to measure and manage certain business activities by line of business. For more financial details on business segment disclosures, please see Note 23 – Business Segment Reporting in the Notes to the Financial Statements. The lines of business are defined as follows:
Retail
The Retail line of business includes loans, deposits, and other fee-based services for consumer and private banking clients, as well as business clients with less than $5 million in sales. Retail serves clients through an extensive network of traditional and in-store branches, ATMs, and the Internet (www.suntrust.com). In addition to serving the retail market, the Retail line of business serves as an entry point for other lines of business. When client needs change and expand, Retail refers clients to the Private Client Services, Mortgage and Commercial lines of business.
Commercial
The Commercial line of business provides enterprises with a full array of financial solutions, including traditional commercial lending, treasury management, financial risk management products and corporate card services. The primary customer segments served by this line of business include “Commercial” ($5 million to $50 million in annual revenues), “Middle Market” ($50 million to $250 million in annual revenues), “Commercial Real Estate” (entities that specialize in Commercial Real Estate activities), “Financial Institutions” (correspondent banking entities), and “Government/Not-for-Profit” entities. Also included in this segment are specialty groups that operate both within and outside of the SunTrust footprint, such as Receivables Capital Management (factoring services), Affordable Housing (tax credits related to community development) and Premium Assignment Corporation (insurance premium financing).
Corporate and Investment Banking
Corporate & Investment Banking serves firms with over $250 million in annual revenues in a variety of industries both inside and outside the SunTrust footprint. Industry Specialties include Media & Communications, Energy, Healthcare, Franchise & Distributor Finance, Restaurants, Agrifoods, Fabrics & Furnishings, Business Services, Retail & Consumer, and Technology.
Corporate & Investment Banking is comprised of the following units: Corporate Banking, Treasury Management, International Banking, SunTrust Leasing, SunTrust Robinson-Humphrey Debt Capital Markets, SunTrust Robinson-Humphrey Equity Capital Markets and SunTrust Equity Partners. These units offer commercial lending and treasury management services, as well as numerous products and services outside of the traditional commercial lending environment.
Private Client Services
Private Client Services (“PCS”) provides a full array of asset management products and professional services to both individual and institutional clients. PCS’ primary segments include brokerage, individual wealth management, and institutional investment management and administration. Individual clients seeking brokerage services may choose between PCS’ discount/online, mid-tier, or full service brokerage offerings. PCS also offers professional investment management and trust services to clients seeking active management of their financial resources. Institutional investment management and administration is comprised of Trusco Capital Management, Inc. (“Trusco”), Retirement Services, Endowment & Foundation Services, Corporate Trust, and Stock Transfer. Retirement Services provides administration and custody services for 401(k) and employee defined benefit plans. Endowment & Foundation Services also provides administration and custody services to non-profit organizations, including government agencies, colleges and universities, community charities and foundations, and hospitals. Corporate Trust targets issuers of tax-exempt and corporate debt and asset-based securities, as well as corporations and attorneys requiring escrow and custodial services. Trusco is a registered investment advisor that acts as the investment manager for PCS’ institutional clients and the STI Classic Funds.
Mortgage
The Mortgage line of business originates mortgage loans through retail, broker and correspondent channels. These loans are securitized and sold in the secondary market with servicing rights retained or held in the Company’s residential loan portfolio. The line of business services loans for its own residential mortgage portfolio as well as for others.
Corporate/Other
Corporate/Other (“Other”) includes the investment securities portfolio, long-term debt, capital, derivative instruments, short-term liquidity and funding activities, balance sheet risk management, office premises and certain support activities not currently allocated to the aforementioned Lines of Business. The major components of the Other line of business include Enterprise Information Services, which is the primary data processing and operations group; the Corporate Real Estate group, which manages the company’s facilities; Marketing, which handles advertising, product management and customer information functions; SunTrust Online, which handles customer phone inquiries and phone sales and manages the Internet banking function; Human Resources, which includes the recruiting, training and employee benefit administration functions; Finance, which includes accounting, budgeting, planning, audit, tax, treasury, risk management and internal control. Other functions included in the Other line of business are asset quality administration, loan review, legal and compliance, branch operations, corporate strategies development and the executive management group. The Other line of business also contains certain expenses that have not been allocated to the primary lines of business, eliminations, and the residual offsets derived from matched-maturity funds transfer pricing and provision for loan losses/credit risk premium allocations.
Sun Trust 2002 Annual Report | 17 | management’s discussion |
management’s discussion
The following table for SunTrust’s reportable business segments compares total income before taxes for the twelve months ended December 31, 2002 to the same period last year:
TABLE 1 Total Contribution Before Taxes And Extraordinary Items
| | Twelve Months Ended | |
| |
| |
(Dollars in millions) | | December 31, 2002 | | December 31, 2001 | |
| |
| |
| |
| Retail | | $ | 770.1 | | $ | 875.2 | |
| Commercial | | | 447.5 | | | 401.9 | |
| Corporate and Investment Banking | | | 185.9 | | | 194.6 | |
| Mortgage | | | 161.5 | | | 123.2 | |
| Private Client Services | | | 212.5 | | | 227.9 | |
| Corporate/Other | | | 85.3 | | | 237.7 | |
| | |
|
| |
|
| |
| | Total Consolidated FTE Adjusted | | | 1,862.8 | | | 2,060.5 | |
| FTE Adjustments | | | (39.5 | ) | | (40.8 | ) |
| | |
|
| |
|
| |
| | Total Consolidated | | $ | 1,823.3 | | $ | 2,019.7 | |
| | | |
|
| |
|
| |
The following table for SunTrust’s reportable business segments compares average loans and average deposits for the twelve months ended December 31, 2002 to the same period last year:
TABLE 2 Average Loans And Deposits By Line Of Business
| | Twelve Months Ended | |
| |
| |
(Dollars in millions) | | December 31, 2002 | | December 31, 2001 | |
| |
| |
| |
Lines of Business | | Average
loans | | Average
deposits | | Average
loans | | Average
deposits | |
| |
| |
| |
| |
| |
| Retail | | $ | 21,702.8 | | $ | 51,516.3 | | $ | 18,316.5 | | $ | 45,457.7 | |
| Commercial | | | 20,354.9 | | | 9,788.2 | | | 18,814.6 | | | 7,580.4 | |
| Corporate and Investment Banking | | | 15,352.6 | | | 1,381.6 | | | 17,579.8 | | | 1,454.3 | |
| Mortgage | | | 12,137.4 | | | 1,013.9 | | | 13,409.8 | | | 785.9 | |
| Private Client Services | | | 1,588.8 | | | 1,530.7 | | | 1,265.0 | | | 1,324.2 | |
The following analysis details the operating results for each line of business for the twelve months ended December 31, 2002 and 2001.
Retail
Retail’s full year 2002 income before taxes was $770.1 million, $105.1 million or 12.0% lower than full year 2001. The decrease in net income is attributable to a decrease in net interest revenue on deposits. Net interest revenue for deposits declined as the lower interest rate environment depressed funds transfer credit rates on deposits. Higher fee income partially offset the impact of lower net interest revenue.
As losses in the consumer lending portfolio grew in 2002 (primarily due to charge-offs in the indirect auto lending portfolio), the provision for loan loss increased by $53.1 million.
Average loan balances showed strong growth in 2002, increasing $3.4 billion or 18.5% from 2001. Loan balances acquired from Huntington-Florida provided 38.2% of the year over year increase. Deposit balances also experienced double digit growth. Average deposit balances for 2002 grew $6.1 billion or 13.3% year over year. Deposit balances acquired from Huntington-Florida provided 53.7% of the 2002 growth.
Commercial
Commercial’s income before taxes for the year ended December 31, 2002 grew by $45.6 million or 11.4% from the comparable 2001 period. Net interest income increased $2.2 million to $560.1 million for 2002 from $557.9 million for 2001. Factoring fees in the amount of $26.4 million, which were classified as noninterest income in 2002, were recorded in net interest income in 2001. Interest income from the acquisition of Huntington-Florida of $12.0 million is included in the 2002 numbers.
Net interest income from loans increased due to higher volumes. Average loans grew by $1.5 billion, or 8.2%, year over year. Huntington-Florida loan volume totaled $625.0 million in 2002. Deposit volume increased by $2.2 billion, or 29.1% year over year. Huntington-Florida volume of $185.0 million is included in the growth for 2002. The volume increase reflects SunTrust’s commitment to raise core deposit levels in addition to limited industrial investment opportunity among clients and prospects as a result of a depressed economic outlook.
management’s discussion | 18 | Sun Trust 2002 Annual Report |
Noninterest income increased $41.2 million to $304.5 million for 2002 from $263.3 million for 2001. The increase was primarily due to $26.4 million of factoring fees, included in noninterest income in 2002, that were included in net interest income in 2001. Noninterest expense decreased by $10.0 million, or 2.6%, for the year.
Corporate and Investment Banking
Corporate and Investment Banking’s income before taxes decreased $8.7 million, or 4.5% in 2002 compared to 2001. The provision for loan losses increased $79.8 million between the current and prior year.
As compared to 2001, the current year’s net interest income declined $77.5 million and noninterest revenue increased $110.4 million, resulting in $33.0 million net improvement in total revenue. The decline in net interest income is attributable to lower loan balances associated with the significant level of public debt issuance, weak loan demand related to current economic conditions, and a conscious effort to exit marginally profitable relationships. The 27.3% increase in noninterest revenue was mainly due to a $70.0 million increase from SunTrust Robinson-Humphrey Equity Capital Markets, acquired during the third quarter of 2001, as well as strong growth in deposit account service charges and letters of credit fees. The combination of lower net interest income and higher noninterest income improved the mix of noninterest income to total revenue from 56.4% in 2001 to 68.6% in 2002.
Noninterest expense decreased $38.2 million, or 10.0%, as expenses were better managed under a challenging operating environment.
Mortgage
The Mortgage line of business’ 2002 income before taxes was up $38.3 million or 31.1% compared with 2001. Driven by record low interest rates, mortgage loan production reached a record $30.8 billion in 2002, a 27.5% increase from the prior year.
Net interest income was up $132.7 million or 54.5% over the comparable period. The higher net interest income was principally a result of wider spreads and higher mortgage loans held for sale volume resulting from the record mortgage loan production.
Noninterest income was down $69.7 million in 2002 compared with 2001. Higher mortgage servicing rights amortization expense resulting from record loan payoff levels as well as higher amortization expense on existing serviced loans more than offset gains in production-related income. Noninterest expense increased $25.3 million or 7.8% in 2002 compared with 2001 principally due to increases in volume-related expenses such as commission-based compensation that varies with loan production.
Private Client Services
Private Client Services’ income before taxes decreased $15.4 million, or 6.7%, for the year ended December 31, 2002 compared to the same period in 2001.
Trust and investment management income increased 4.0% over prior year. Assets under management as of December 31, 2002 and December 31, 2001 were both approximately $89.6 billion. Despite the significant decline in the equity markets, trust and investment management income has been able to moderately increase due to assets under management remaining relatively stable throughout 2002. Assets under management did not decline to the same extent as the equity markets due to strong net new business and an appreciation in bond values. Retained business is satisfactory given market conditions and is comparable with prior periods; however, new business is up significantly compared to 2001. Assets under management include individually managed assets, the STI Classic Funds, institutional assets managed by Trusco Capital Management, and participant-directed retirement accounts. As of December 31, 2002, SunTrust’s total assets under advisement were approximately $162.6 billion, which included $24.5 billion held in non-managed corporate trust accounts and $17.0 billion in retail brokerage accounts, including $1.3 billion in Alexander Key.
Retail investment income increased 27.5% over prior year. The increase is primarily due to an increase in broker production and the number of brokers. The Company launched its full-service brokerage division, Alexander Key, during the second quarter of 2002, and has continued to build its broker network. Thus far the division has generated nominal revenue.
Noninterest expense increased 15.6% over prior year. The increase in noninterest expense is due to higher incentive expense associated with the increase in new business and continued investment in the core business, new product capabilities, and new distribution channels.
The increase over prior year in assets and liabilities is due to loan growth of 25.6% and deposit growth of 15.6%; however, net interest revenue decreased 11.1% due to interest rate spreads compressing as a result of the 2002 decline in interest rates. The Company is not aware of any material credit risk within Private Client Services’ loan portfolio.
Corporate/Other
The Corporate/Other line of business’ income before taxes decreased from $237.7 million in 2001 to $85.3 million in 2002. Net interest income increased by $20.9 million, or 3.2%, as a result of the residual offsets derived from matched maturity funds transfer pricing.
The provision for loan losses increased $53.6 million, primarily due to $45.3 million recorded in the first quarter of 2002, to bring the Huntington-Florida loan portfolio into compliance with SunTrust’s credit standards.
Noninterest revenue decreased $14.0 million in 2002 compared to 2001. Security gains were $48.3 million higher in 2002 than 2001 but were offset by declines between the two years in other charges and fees, trading account profits and other noninterest income.
Noninterest expense increased $105.6 million in 2002 compared to the prior year. This increase is primarily the result of increased amortization of intangibles expense from the Huntington-Florida acquisition and the dividend expense associated with the preferred shares issued by a real estate trust subsidiary.
Average total liabilities declined $8.5 billion, or 25.4%, in 2002 compared to 2001, primarily as a result of consumer and commercial deposit growth from the other business lines that eliminated the need for borrowings.
Sun Trust 2002 Annual Report | 19 | management’s discussion |
management’s discussion
Cash Basis Financial Data
Effective January 1, 2002, in accordance with the provisions of Statement of Financial Accounting Standards (“SFAS”) No. 142, “Goodwill and Other Intangible Assets”, SunTrust no longer amortizes goodwill. Table 3 presents financial data excluding the impact of the after-tax amortization of goodwill, core deposit intangibles and other intangible assets.
TABLE 3 Cash Basis Selected Financial Data
| | Year Ended December 31 | |
| |
| |
(In millions except per share data) | | 2002 | | 2001 | | 2000 | | 1999 | | 1998 | | 1997 | |
| |
|
| |
|
| |
|
| |
|
| |
|
| |
|
| |
Operations | | | | | | | | | | | | | | | | | | | |
| Noninterest expense | | $ | 3,283.4 | | $ | 3,057.6 | | $ | 2,793.1 | | $ | 2,869.1 | | $ | 2,827.0 | | $ | 2,350.7 | |
| Net income | | | 1,370.4 | | | 1,414.9 | | | 1,326.0 | | | 1,359.1 | | | 1,010.3 | | | 1,011.2 | |
| |
|
| |
|
| |
|
| |
|
| |
|
| |
|
| |
Goodwill and Core Deposit Intangibles (CDI) | | | | | | | | | | | | | | | | | | | |
| Goodwill average balance | | $ | 919.4 | | $ | 469.8 | | $ | 488.9 | | $ | 511.5 | | $ | 524.9 | | $ | 389.0 | |
| CDI average balance | | | 194.3 | | | 19.8 | | | 23.7 | | | 30.3 | | | 19.4 | | | 21.7 | |
| Other intangible asset average balance | | | 9.6 | | | 0.5 | | | 0.9 | | | 2.5 | | | 3.4 | | | 4.5 | |
| Goodwill amortization (after tax) | | | — | | | 36.1 | | | 27.9 | | | 27.8 | | | 34.2 | | | 30.6 | |
| CDI amortization (after tax) | | | 37.5 | | | 3.1 | | | 3.8 | | | 4.5 | | | 4.2 | | | 3.9 | |
| Other intangible asset amortization (after tax) | | | 1.1 | | | 0.1 | | | 0.1 | | | 0.3 | | | 0.8 | | | 0.7 | |
| | |
|
| |
|
| |
|
| |
|
| |
|
| |
|
| |
| | | | | | | | | | | | | | | | | | | | |
| management’s discussion | 20 | Sun Trust 2002 Annual Report |
| | | | | | | | | | | | | | | | | | | | | |
TABLE 4 Analysis Of Changes In Net Interest Income1
| | 2002 Compared to 2001
Increase (Decrease) Due to | | 2001 Compared to 2000
Increase (Decrease) Due to | |
| |
| |
| |
(In millions on a taxable- equivalent basis) | | Volume | | Rate | | Net | | Volume | | Rate | | Net | |
| |
|
| |
|
| |
|
| |
|
| |
|
| |
|
| |
Interest Income | | | | | | | | | | | | | | | | | | | |
| Loans | | | | | | | | | | | | | | | | | | | |
| | Taxable | | $ | 75.9 | | $ | (1,017.7 | ) | $ | (941.8 | ) | $ | (6.0 | ) | $ | (683.7 | ) | $ | (689.7 | ) |
| | Tax-exempt2 | | | 10.2 | | | (17.7 | ) | | (7.5 | ) | | 4.1 | | | (8.7 | ) | | (4.6 | ) |
| Securities available for sale | | | | | | | | | | | | | | | | | | | |
| | Taxable | | | 60.7 | | | (276.0 | ) | | (215.3 | ) | | 86.6 | | | (34.1 | ) | | 52.5 | |
| | Tax-exempt2 | | | (3.0 | ) | | (4.7 | ) | | (7.7 | ) | | (1.6 | ) | | 1.9 | | | 0.3 | |
| Funds sold and securities purchased under agreements to resell | | | 5.2 | | | (31.9 | ) | | (26.7 | ) | | (11.0 | ) | | (30.6 | ) | | (41.6 | ) |
| Loans held for sale | | | 95.0 | | | (26.1 | ) | | 68.9 | | | 107.8 | | | (6.9 | ) | | 100.9 | |
| Interest-bearing deposits | | | 5.2 | | | (3.9 | ) | | 1.3 | | | 4.1 | | | 0.8 | | | 4.9 | |
| Trading assets | | | 8.2 | | | (25.0 | ) | | (16.8 | ) | | 26.1 | | | (13.6 | ) | | 12.5 | |
| |
|
| |
|
| |
|
| |
|
| |
|
| |
|
| |
| | Total Interest income | | | 257.4 | | | (1,403.0 | ) | | (1,145.6 | ) | | 210.1 | | | (774.9 | ) | | (564.8 | ) |
| |
|
| |
|
| |
|
| |
|
| |
|
| |
|
| |
Interest Expense | | | | | | | | | | | | | | | | | | | |
| NOW accounts | | | 19.2 | | | (46.0 | ) | | (26.8 | ) | | 5.6 | | | (11.8 | ) | | (6.2 | ) |
| Money Market accounts | | | 125.1 | | | (325.9 | ) | | (200.8 | ) | | 141.6 | | | (140.9 | ) | | 0.7 | |
| Savings deposits | | | 6.6 | | | (93.0 | ) | | (86.4 | ) | | (12.5 | ) | | (44.5 | ) | | (57.0 | ) |
| Consumer time deposits | | | 12.6 | | | (134.2 | ) | | (121.6 | ) | | (44.1 | ) | | (15.6 | ) | | (59.7 | ) |
| Brokered deposits | | | (3.7 | ) | | 18.5 | | | 14.8 | | | (39.3 | ) | | (61.3 | ) | | (100.6 | ) |
| Foreign deposits | | | (66.5 | ) | | (109.3 | ) | | (175.8 | ) | | (229.5 | ) | | (152.7 | ) | | (382.2 | ) |
| Other time deposits | | | (5.2 | ) | | (93.3 | ) | | (98.5 | ) | | (14.5 | ) | | (20.9 | ) | | (35.4 | ) |
| Funds purchased and securities sold under agreements to repurchase | | | (30.8 | ) | | (241.0 | ) | | (271.8 | ) | | 30.8 | | | (269.8 | ) | | (239.0 | ) |
| Other short-term borrowings | | | (19.9 | ) | | (29.4 | ) | | (49.3 | ) | | 2.6 | | | (37.1 | ) | | (34.5 | ) |
| Long-term debt | | | (30.8 | ) | | (88.5 | ) | | (119.3 | ) | | 269.9 | | | (65.8 | ) | | 204.1 | |
| |
|
| |
|
| |
|
| |
|
| |
|
| |
|
| |
| | Total interest expense | | | 6.6 | | | (1,142.1 | ) | | (1,135.5 | ) | | 110.6 | | | (820.4 | ) | | (709.8 | ) |
| |
|
| |
|
| |
|
| |
|
| |
|
| |
|
| |
| | Net change in net interest income | | $ | 250.8 | | $ | (260.9 | ) | $ | (10.1 | ) | $ | 99.5 | | $ | 45.5 | | $ | 145.0 | |
| | | |
|
| |
|
| |
|
| |
|
| |
|
| |
|
| |
| | | | | | | | | | | | | | | | | | | | | |
| | 1 | Changes in net interest income are attributed to either changes in average balances (volume change) or changes in average rates (rate change) for earning assets and sources of funds on which interest is received or paid. Volume change is calculated as change in volume times the previous rate, while rate change is change in rate times the previous volume. The rate/volume change, change in rate times change in volume, is allocated between volume change and rate change at the ratio each component bears to the absolute value of their total. |
| | 2 | Interest income includes the effects of taxable-equivalent adjustments (reduced by the nondeductible portion of interest expense)using a federal income tax rate of 35% and, where applicable, state income taxes to increase tax-exempt interest income to a taxable-equivalent basis. |
| | | | | | | | | | | | | | | | | | | | | | |
TABLE 5 Loan Portfolio By Types Of Loans
| | At December 31 | |
| |
| |
(In millions) | | 2002 | | 2001 | | 2000 | | 1999 | | 1998 | | 1997 | |
| |
| |
| |
| |
| |
| |
| |
| Commercial | | $ | 28,693.6 | | $ | 28,945.9 | | $ | 30,781.1 | | $ | 26,933.5 | | $ | 24,589.6 | | $ | 19,043.7 | |
| Real estate | | | | | | | | | | | | | | | | | | | |
| | Construction | | | 4,002.4 | | | 3,627.3 | | | 2,966.1 | | | 2,457.1 | | | 2,085.0 | | | 1,809.8 | |
| | Residential mortgages | | | 19,443.4 | | | 17,297.1 | | | 19,953.0 | | | 19,619.3 | | | 16,880.9 | | | 17,297.2 | |
| | Other | | | 9,101.8 | | | 8,152.0 | | | 8,121.4 | | | 7,794.9 | | | 8,254.3 | | | 7,457.6 | |
| Credit card | | | 111.3 | | | 92.0 | | | 76.8 | | | 77.4 | | | 1,563.5 | | | 2,195.6 | |
| Consumer loans | | | 11,815.4 | | | 10,844.9 | | | 10,341.4 | | | 9,120.6 | | | 8,167.3 | | | 7,672.5 | |
| | |
| |
| |
| |
| |
| |
| |
| | Total loans | | $ | 73,167.9 | | $ | 68,959.2 | | $ | 72,239.8 | | $ | 66,002.8 | | $ | 61,540.6 | | $ | 55,476.4 | |
| | | |
|
| |
|
| |
|
| |
|
| |
|
| |
|
| |
| | | | | | | | | | | | | | | | | | | | | | | | | | | | | | | | | |
Sun Trust 2002 Annual Report | 21 | management’s discussion |
management’s discussion
TABLE 6 Consolidated Daily Average Balances, Income/Expense And Average Yields Earned And Rates Paid
| | 2002 | | 2001 | | 2000 | |
| |
| |
| |
| |
(Dollars in millions; yields on taxable-equivalent basis ) | | Average Balances | | Income/ Expense | | Yields/
Rates | | Average
Balances | | Income/
Expense | | Yields/
Rates | | Average
Balances | | Income/
Expense | | Yields/
Rates | |
| |
|
| |
|
| |
|
| |
|
| |
|
| |
|
| |
|
| |
|
| |
|
| |
Assets | | | | | | | | | | | | | | | | | | | | | | | | | | | | |
Loans: 1 | | | | | | | | | | | | | | | | | | | | | | | | | | | | |
| | Taxable | | $ | 69,981.0 | | $ | 3,920.9 | | | 5.60 | % | $ | 68,892.8 | | $ | 4,862.7 | | | 7.06 | % | $ | 68,968.8 | | $ | 5,552.4 | | | 8.05 | % |
| | Tax-exempt2 | | | 1,289.4 | | | 70.8 | | | 5.49 | | | 1,130.2 | | | 78.4 | | | 6.94 | | | 1,075.5 | | | 83.0 | | | 7.72 | |
| | |
|
| |
|
| |
|
| |
|
| |
|
| |
|
| |
|
| |
|
| |
|
| |
| | Total loans | | | 71,270.4 | | | 3,991.7 | | | 5.60 | | | 70,023.0 | | | 4,941.1 | | | 7.06 | | | 70,044.3 | | | 5,635.4 | | | 8.05 | |
| Securities available for sale | | | | | | | | | | | | | | | | | | | | | | | | | | | | |
| | Taxable | | | 16,890.3 | | | 818.6 | | | 4.85 | | | 15,904.8 | | | 1,033.9 | | | 6.50 | | | 14,593.7 | | | 981.4 | | | 6.73 | |
| | Tax-exempt 2 | | | 408.3 | | | 28.0 | | | 6.85 | | | 448.7 | | | 35.7 | | | 7.95 | | | 469.7 | | | 35.4 | | | 7.54 | |
| | |
|
| |
|
| |
|
| |
|
| |
|
| |
|
| |
|
| |
|
| |
|
| |
| Total securities available for sale | | | 17,298.6 | | | 846.6 | | | 4.89 | | | 16,353.5 | | | 1,069.6 | | | 6.54 | | | 15,063.4 | | | 1,016.8 | | | 6.75 | |
| Funds sold and securities purchased under agreements to resell | | | 1,390.4 | | | 24.5 | | | 1.76 | | | 1,250.3 | | | 51.2 | | | 4.09 | | | 1,439.8 | | | 92.8 | | | 6.44 | |
| Loans held for sale | | | 4,410.8 | | | 280.4 | | | 6.36 | | | 2,949.9 | | | 211.5 | | | 7.17 | | | 1,451.1 | | | 110.6 | | | 7.62 | |
| Interest-bearing deposits | | | 404.7 | | | 7.0 | | | 1.73 | | | 167.6 | | | 5.8 | | | 3.43 | | | 39.9 | | | 0.9 | | | 2.17 | |
| Trading assets | | | 1,595.9 | | | 24.5 | | | 1.54 | | | 1,289.8 | | | 41.3 | | | 3.20 | | | 570.5 | | | 28.8 | | | 5.06 | |
| | |
|
| |
|
| |
|
| |
|
| |
|
| |
|
| |
|
| |
|
| |
|
| |
| | Total earning assets | | | 96,370.8 | | | 5,174.7 | | | 5.37 | | | 92,034.1 | | | 6,320.5 | | | 6.87 | | | 88,609.0 | | | 6,885.3 | | | 7.77 | |
| Allowance for loan losses | | | (924.3 | ) | | | | | | | | (876.3 | ) | | | | | | | | (869.0 | ) | | | | | | |
| Cash and due from banks | | | 3,343.2 | | | | | | | | | 3,383.4 | | | | | | | | | 3,316.4 | | | | | | | |
| Premises and equipment | | | 1,621.2 | | | | | | | | | 1,599.7 | | | | | | | | | 1,625.4 | | | | | | | |
| Other assets | | | 5,373.4 | | | | | | | | | 4,043.3 | | | | | | | | | 3,362.2 | | | | | | | |
| Unrealized gains on securities available for sale | | | 2,731.8 | | | | | | | | | 2,700.0 | | | | | | | | | 2,353.8 | | | | | | | |
| | |
|
| |
|
| |
|
| |
|
| |
|
| |
|
| |
|
| |
|
| |
|
| |
| | Total assets | | $ | 108,516.1 | | | | | | | | $ | 102,884.2 | | | | | | | | $ | 98,397.8 | | | | | | | |
| | | |
|
| |
|
| |
|
| |
|
| |
|
| |
|
| |
|
| |
|
| |
|
| |
Liabilities and Shareholders’ Equity | | | | | | | | | | | | | | | | | | | | | | | | | | | | |
| NOW accounts | | $ | 10,315.4 | | $ | 74.5 | | | 0.72 | % | $ | 8,471.3 | | $ | 101.2 | | | 1.20 | % | $ | 8,035.4 | | $ | 107.4 | | | 1.34 | % |
| Money Market accounts | | | 20,470.9 | | | 326.8 | | | 1.60 | | | 15,830.1 | | | 527.6 | | | 3.33 | | | 12,093.6 | | | 526.9 | | | 4.36 | |
| Savings | | | 6,310.0 | | | 85.1 | | | 1.35 | | | 6,066.6 | | | 171.5 | | | 2.83 | | | 6,434.2 | | | 228.5 | | | 3.55 | |
| Consumer time | | | 9,342.4 | | | 347.1 | | | 3.72 | | | 9,092.6 | | | 468.8 | | | 5.16 | | | 9,935.5 | | | 528.5 | | | 5.32 | |
| Other time | | | 3,722.8 | | | 102.1 | | | 2.74 | | | 3,823.9 | | | 200.6 | | | 5.25 | | | 4,085.3 | | | 236.0 | | | 5.78 | |
| | |
|
| |
|
| |
|
| |
|
| |
|
| |
|
| |
|
| |
|
| |
|
| |
| | Total interest-bearing consumer and commercial deposits | | | 50,161.5 | | | 935.6 | | | 1.87 | | | 43,284.5 | | | 1,469.7 | | | 3.40 | | | 40,584.0 | | | 1,627.3 | | | 4.01 | |
| Brokered deposits | | | 2,537.2 | | | 130.1 | | | 5.13 | | | 2,617.7 | | | 115.3 | | | 4.40 | | | 3,308.7 | | | 215.9 | | | 6.52 | |
| Foreign deposits | | | 3,190.4 | | | 51.6 | | | 1.62 | | | 5,175.4 | | | 227.5 | | | 4.39 | | | 9,621.7 | | | 609.7 | | | 6.34 | |
| | |
|
| |
|
| |
|
| |
|
| |
|
| |
|
| |
|
| |
|
| |
|
| |
| | Total interest bearing deposits | | | 55,889.1 | | | 1,117.30 | | | 2.00 | | | 51,077.6 | | | 1,812.5 | | | 3.55 | | | 53,514.4 | | | 2,452.9 | | | 4.58 | |
| Funds purchased and securities sold under agreements to repurchase | | | 10,376.2 | | | 140.5 | | | 1.35 | | | 11,283.6 | | | 412.2 | | | 3.65 | | | 10,754.4 | | | 651.2 | | | 6.06 | |
| Other short-term borrowings | | | 924.8 | | | 14.1 | | | 1.52 | | | 1,593.8 | | | 63.4 | | | 3.98 | | | 1,550.6 | | | 97.9 | | | 6.31 | |
| Long-term debt | | | 11,960.0 | | | 619.6 | | | 5.18 | | | 12,497.2 | | | 739.0 | | | 5.91 | | | 8,034.6 | | | 534.9 | | | 6.66 | |
| | |
|
| |
|
| |
|
| |
|
| |
|
| |
|
| |
|
| |
|
| |
|
| |
| | Total interest-bearing liabilities | | | 79,150.1 | | | 1,891.5 | | | 2.39 | | | 76,452.2 | | | 3,027.1 | | | 3.96 | | | 73,854.0 | | | 3,736.9 | | | 5.06 | |
| Noninterest-bearing deposits | | | 15,268.1 | | | | | | | | | 13,491.1 | | | | | | | | | 13,177.5 | | | | | | | |
| Other liabilities | | | 5,372.2 | | | | | | | | | 4,867.1 | | | | | | | | | 3,864.4 | | | | | | | |
| Realized shareholders’ equity | | | 6,984.6 | | | | | | | | | 6,328.0 | | | | | | | | | 6,031.6 | | | | | | | |
| Accumulated other comprehensive income | | | 1,741.1 | | | | | | | | | 1,745.8 | | | | | | | | | 1,470.3 | | | | | | | |
| | |
|
| |
|
| |
|
| |
|
| |
|
| |
|
| |
|
| |
|
| |
|
| |
| | Total liabilities and shareholders’ equity | | $ | 108,516.1 | | | | | $ | 102,884.2 | | | | | | | | | | | $ | 98,397.8 | | | | | | | |
| | |
|
| |
|
| |
|
| |
|
| |
|
| |
|
| |
|
| |
|
| |
|
| |
| Interest Rate Spread | | | | | | | | | 2.98 | % | | | | | | | | 2.91 | % | | | | | | | | 2.71 | % |
| | |
|
| |
|
| |
|
| |
|
| |
|
| |
|
| |
|
| |
|
| |
|
| |
Net Interest Income | | | | | $ | 3,283.2 | | | | | | | | $ | 3,293.4 | | | | | | | | $ | 3,148.4 | | | | |
| | |
|
| |
|
| |
|
| |
|
| |
|
| |
|
| |
|
| |
|
| |
|
| |
Net Interest Margin3 | | | | | | | | | 3.41 | % | | | | | | | | 3.58 | % | | | | | | | | 3.55 | % |
| | |
|
| |
|
| |
|
| |
|
| |
|
| |
|
| |
|
| |
|
| |
|
| |
| | | | | | | | | | | | | | | | | | | | | | | | | | | | | |
1 | Interest income includes loan fees of $122.6, $148.7, $135.6, $142.3, $118.4, and $108.5 million in the six years ended December 31, 2002. Nonaccrual loans are included in average balances and income on such loans, if recognized, is recorded on a cash basis. |
2 | Interest income includes the effects of taxable-equivalent adjustments (reduced by the nondeductible portion of interest expense) using a federal income tax rate of 35% for all years reported and where applicable, state income taxes, to increase tax-exempt interest income to a taxable-equivalent basis. The net taxable-equivalent adjustment amounts included in the above table were $39.5, $40.8, $39.9, $42.5, $44.4, and $47.9 million in the six years ended December 31, 2002. |
| | | | | | | | | | | | | | | | | | | | | | | | | | | | | | | | | | | |
management’s discussion | 22 | Sun Trust 2002 Annual Report |
| | 1999 | | 1998 | | 1997 | |
| |
| |
| |
| |
(Dollars in millions; yields on taxable-equivalent basis) | | Average Balances | | Income/ Expense | | Yields/ Rates | | Average Balances | | Income/ Expense | | Yields/ Rates | | Average Balances | | Income/ Expense | | Yields/ Rates | |
| |
|
| |
|
| |
|
| |
|
| |
|
| |
|
| |
|
| |
|
| |
|
| |
Assets | | | | | | | | | | | | | | | | | | | | | | | | | | | | |
Loans: 1 | | | | | | | | | | | | | | | | | | | | | | | | | | | | |
| | Taxable | | $ | 61,648.3 | | $ | 4,691.2 | | | 7.61 | % | $ | 56,537.1 | | $ | 4,499.6 | | | 7.96 | % | $ | 50,813.7 | | $ | 4,198.8 | | | 8.26 | % |
| | Tax-exempt2 | | | 1,101.1 | | | 80.1 | | | 7.27 | | | 1,053.4 | | | 81.9 | | | 7.78 | | | 974.4 | | | 79.2 | | | 8.13 | |
| |
|
| |
|
| |
|
| |
|
| |
|
| |
|
| |
|
| |
|
| |
|
| |
| | Total loans | | | 62,749.4 | | | 4,771.3 | | | 7.60 | | | 57,590.5 | | | 4,581.5 | | | 7.96 | | | 51,788.1 | | | 4,278.0 | | | 8.26 | |
| Securities available for sale | | | | | | | | | | | | | | | | | | | | | | | | | | | | |
| | Taxable | | | 14,728.7 | | | 927.6 | | | 6.30 | | | 12,618.9 | | | 819.7 | | | 6.50 | | | 11,882.4 | | | 779.9 | | | 6.56 | |
| | Tax-exempt2 | | | 558.2 | | | 44.6 | | | 7.99 | | | 633.8 | | | 52.2 | | | 8.23 | | | 749.8 | | | 64.0 | | | 8.53 | |
| | |
|
| |
|
| |
|
| |
|
| |
|
| |
|
| |
|
| |
|
| |
|
| |
| Total securities available for sale | | | 15,286.9 | | | 972.2 | | | 6.36 | | | 13,252.7 | | | 871.9 | | | 6.58 | | | 12,632.2 | | | 843.9 | | | 6.68 | |
| Funds sold and securities purchased under agreements to resell | | | 1,338.0 | | | 73.4 | | | 5.48 | | | 1,306.2 | | | 71.6 | | | 5.48 | | | 1,378.5 | | | 80.4 | | | 5.83 | |
| Loans held for sale | | | 2,577.1 | | | 172.2 | | | 6.68 | | | 2,414.7 | | | 180.4 | | | 7.47 | | | 865.4 | | | 70.0 | | | 8.09 | |
| Interest-bearing deposits | | | 53.0 | | | 2.7 | | | 5.02 | | | 99.8 | | | 5.8 | | | 5.78 | | | 46.1 | | | 2.9 | | | 6.20 | |
| Trading assets | | | 251.3 | | | 10.9 | | | 4.36 | | | 217.0 | | | 9.1 | | | 4.21 | | | 233.7 | | | 10.9 | | | 4.69 | |
| | |
|
| |
|
| |
|
| |
|
| |
|
| |
|
| |
|
| |
|
| |
|
| |
| | Total earning assets | | | 82,255.7 | | | 6,002.7 | | | 7.30 | | | 74,880.9 | | | 5,720.3 | | | 7.64 | | | 66,944.0 | | | 5,286.1 | | | 7.90 | |
| Allowance for loan losses | | | (942.1 | ) | | | | | | | | (940.5 | ) | | | | | | | | (913.3 | ) | | | | | | |
| Cash and due from banks | | | 3,630.3 | | | | | | | | | 3,306.9 | | | | | | | | | 3,156.7 | | | | | | | |
| Premises and equipment | | | 1,596.3 | | | | | | | | | 1,486.6 | | | | | | | | | 1,395.1 | | | | | | | |
| Other assets | | | 3,332.5 | | | | | | | | | 3,219.1 | | | | | | | | | 2,459.3 | | | | | | | |
| Unrealized gains on securities available for sale | | | 2,948.1 | | | | | | | | | 3,583.9 | | | | | | | | | 2,975.5 | | | | | | | |
| | |
|
| |
|
| |
|
| |
|
| |
|
| |
|
| |
|
| |
|
| |
|
| |
| | Total assets | | $ | 92,820.8 | | | | | | | | $ | 85,536.9 | | | | | | | | $ | 76,017.3 | | | | | | | |
| | |
|
| |
|
| |
|
| |
|
| |
|
| |
|
| |
|
| |
|
| |
|
| |
Liabilities and Shareholders’ Equity | | | | | | | | | | | | | | | | | | | | | | | | | | | | |
| NOW accounts | | $ | 7,736.3 | | $ | 70.9 | | | 0.92 | % | $ | 7,149.5 | | $ | 101.6 | | | 1.42 | % | $ | 6,776.2 | | $ | 106.4 | | | 1.57 | % |
| Money Market accounts | | | 12,189.7 | | | 456.1 | | | 3.74 | | | 11,104.1 | | | 422.9 | | | 3.81 | | | 9,584.3 | | | 355.8 | | | 3.71 | |
| Savings | | | 6,918.8 | | | 203.8 | | | 2.95 | | | 6,645.9 | | | 216.9 | | | 3.26 | | | 6,810.1 | | | 227.5 | | | 3.34 | |
| Consumer time | | | 9,824.3 | | | 468.6 | | | 4.77 | | | 10,390.4 | | | 534.4 | | | 5.14 | | | 11,032.1 | | | 562.4 | | | 5.10 | |
| Other time | | | 4,275.0 | | | 214.3 | | | 5.01 | | | 4,423.9 | | | 244.4 | | | 5.53 | | | 4,082.2 | | | 227.6 | | | 5.57 | |
| | |
|
| |
|
| |
|
| |
|
| |
|
| |
|
| |
|
| |
|
| |
|
| |
| | Total interest-bearing consumer and commercial deposits | | | 40,944.1 | | | 1,413.7 | | | 3.45 | | | 39,713.8 | | | 1,520.2 | | | 3.86 | | | 38,284.9 | | | 1,479.7 | | | 3.83 | |
| Brokered deposits | | | 7.0 | | | 0.4 | | | 5.27 | | | 394.0 | | | 21.6 | | | 5.47 | | | 108.1 | | | 6.1 | | | 5.64 | |
| Foreign deposits | | | 4,087.8 | | | 212.0 | | | 5.19 | | | 1,906.2 | | | 102.4 | | | 5.37 | | | 2,574.7 | | | 141.7 | | | 5.50 | |
| | |
|
| |
|
| |
|
| |
|
| |
|
| |
|
| |
|
| |
|
| |
|
| |
| | Total interest bearing deposits | | | 45,038.9 | | | 1,626.1 | | | 3.61 | | | 42,014.0 | | | 1,644.2 | | | 3.91 | | | 40,967.7 | | | 1,627.5 | | | 3.97 | |
| Funds purchased and securities sold under agreements to repurchase | | | 15,220.8 | | | 749.6 | | | 4.92 | | | 12,164.9 | | | 634.1 | | | 5.21 | | | 8,641.9 | | | 461.7 | | | 5.34 | |
| Other short-term borrowings | | | 1,689.9 | | | 79.5 | | | 4.71 | | | 2,391.8 | | | 127.8 | | | 5.34 | | | 2,591.9 | | | 133.8 | | | 5.16 | |
| Long-term debt | | | 5,858.6 | | | 359.5 | | | 6.14 | | | 5,368.0 | | | 340.7 | | | 6.35 | | | 3,275.4 | | | 230.5 | | | 7.04 | |
| | |
|
| |
|
| |
|
| |
|
| |
|
| |
|
| |
|
| |
|
| |
|
| |
| | Total interest-bearing liabilities | | | 67,808.2 | | | 2,814.7 | | | 4.15 | | | 61,938.7 | | | 2,746.8 | | | 4.43 | | | 55,476.9 | | | 2,453.5 | | | 4.42 | |
| Noninterest-bearing deposits | | | 12,803.2 | | | | | | | | | 11,711.3 | | | | | | | | | 10,706.0 | | | | | | | |
| Other liabilities | | | 4,018.7 | | | | | | | | | 4,033.3 | | | | | | | | | 2,881.0 | | | | | | | |
| Realized shareholders’ equity | | | 6,368.3 | | | | | | | | | 5,641.4 | | | | | | | | | 5,116.7 | | | | | | | |
| Accumulated other comprehensive income | | | 1,822.4 | | | | | | | | | 2,212.2 | | | | | | | | | 1,836.7 | | | | | | | |
| | |
|
| |
|
| |
|
| |
|
| |
|
| |
|
| |
|
| |
|
| |
|
| |
| | Total liabilities and shareholders’ equity | | $ | 92,820.8 | | | | | | | | | 85,536.9 | | | | | | | | $ | 76,017.3 | | | | | | | |
| | |
|
| |
|
| |
|
| |
|
| |
|
| |
|
| |
|
| |
|
| |
|
| |
| Interest Rate Spread | | | | | | 3.15 | % | | | | | | | | | | | 3.21 | % | | | | | | | | 3.48 | % |
| | |
|
| |
|
| |
|
| |
|
| |
|
| |
|
| |
|
| |
|
| |
|
| |
| Net Interest Income | | | | | $ | 3,188.0 | | | | | | | | $ | 2,973.5 | | | | | | | | $ | 2,832.6 | | | | |
| | |
|
| |
|
| |
|
| |
|
| |
|
| |
|
| |
|
| |
|
| |
|
| |
Net Interest Margin3 | | | 3.88 | % | | | | | | | | | | | | | | 3.97 | % | | | | | | | | 4.23 | % |
| | |
|
| |
|
| |
|
| |
|
| |
|
| |
|
| |
|
| |
|
| |
|
| |
| | | | | | | | | | | | | | | | | | | | | | | | | | | | | | | | | | | | | | | | | | | | | | | | | | |
3 | Derivative instruments used to help balance the Company’s interest-sensitivity position decreased net interest income by $50.4 million in 2002, $37.4 million in 2001 and $0.5 million in 2000, increased net interest income by $16.3 million and $0.7 million in 1999 and 1998, and decreased net interest income by $7.7 million in 1997. Without these derivative instruments, the net interest margin would have been 3.46%, 3.62%, 3.55%, 3.86%, 3.97%, and 4.24% in the six years ended December 31, 2002. |
| |
Sun Trust 2002 Annual Report | 23 | management’s discussion |
| | | |
management’s discussion
Net Interest Income/Margin
Net interest income for 2002 was $3,283.2 million or 0.3% lower than the prior year. The net interest margin declined 17 basis points from 3.58% in 2001 to 3.41% in 2002. The earning asset yield for 2002 declined 150 basis points from 2001; loan yields decreased 146 basis points and the securities available for sale yields decreased 165 basis points. Total interest-bearing liability costs declined 157 basis points from 2001; including noninterest-bearing deposits, the cost declined only 137 basis points. The larger decrease in earning asset yield versus the decrease in liability cost (including noninterest-bearing deposits) caused the overall net interest margin to decline.
The decrease in net interest income and margin was due to a number of factors. Loan demand continued to be weak due to the sluggish economy; average loans, adjusted for securitizations and the acquisition of Huntington-Florida, decreased 2.0% in 2002. The shift in the Company’s balance sheet to a slightly asset-sensitive position in anticipation of rising rates has not produced the expected margin benefit since rates have not risen and the yield curve flattened during the second half of 2002. STI prime rate averaged 4.67% in 2002, a decline of 224 basis points from a year ago, and the Federal Reserve Bank fed funds rate averaged 1.67%, 221 basis points below the 2001 average. The lower rates and flattening of the yield curve in 2002 created an acceleration of prepayments in the mortgage industry. The higher than anticipated cash flow from higher yielding assets, which were replaced by lower yielding assets, reduced the yield on the residential mortgage loans and the mortgage-backed securities portfolios. The repositioning of the investment portfolio (see Management’s Discussion of Securities Available for Sale on page 32) shortened the duration of the portfolio and contributed to the decrease in the portfolio yield. Free funding sources, comprised of demand deposits, equity, and other assets and liabilities, are worth less in a low/declining rate environment, contributing to compression of the net interest margin.
Adjusting for Huntington-Florida, average earning assets were up 1.2% and average interest-bearing liabilities decreased 1.3% in 2002. Including Huntington-Florida, average earning assets increased 4.7% and average interest-bearing liabilities increased 3.5%. The adverse impact of the lower rate environment more than offset the favorable increase due to higher volumes on earning asset yields.
SunTrust restructured its balance sheet throughout 2002 and 2001 to shift its interest rate risk from a liability-sensitive position to a slightly asset-sensitive position. The restructuring has been concentrated in the investment portfolio and long-term debt. The Company believes it is now positioned to benefit from a rising interest rate environment. However, the Company will continue to evaluate its present portfolio mix relative to market valuations and buy and sell securities that meet its overall interest rate strategies.
As part of its ongoing balance sheet management, the Company continues to take steps to obtain alternative lower cost funding sources, such as developing initiatives to grow retail deposits to maximize net interest income. Campaigns to attract consumer deposits were implemented in 2002 and 2001. The Company believes that deposit growth has also benefited from the volatility in the financial markets. Excluding the effects of Huntington-Florida, average money market deposits grew 23.6%, NOW accounts 16.8%, and demand deposits 9.6% in 2002 over 2001. Interest income that the Company was unable to recognize on nonperforming loans had a negative impact of three basis points in 2002 and 2001. Table 6 contains more detailed information concerning average balances, yields earned and rates paid.
Provision For Loan Losses
The provision for loan losses charged to expense is based upon credit loss experience and the results of a detailed analysis estimating an appropriate and adequate allowance for loan and lease losses. The analysis includes the evaluation of impaired loans as prescribed under SFAS Nos. 114 and 118, pooled loans as prescribed under SFAS No. 5 and economic and other risk factors as outlined in various Joint Interagency Statements issued by the bank regulatory agencies. The 2002 loan loss provision of $469.8 million was 70.7% higher than the $275.2 million recorded in 2001. The increase was driven by credit deterioration in the commercial and consumer portfolios, along with an additional provision expense related to the first quarter acquisition of the Huntington-Florida loan portfolio.
The deterioration in the commercial loan portfolio was mainly in large corporate credits (national and large business clients generally, with total annual revenues in excess of $250 million) in various industry sectors. Net charge-offs related to these loans totaled $220.3 million in 2002, compared to $142.4 million in 2001, and were significantly impacted by the bankruptcy of a large energy company. The deterioration in the consumer portfolio was mostly in the indirect lending segment, which had increasing credit costs throughout the year due to higher default rates and increased weakness in vehicle resale markets. Consumer net charge-offs totaled $126.8 million in 2002 with 85% attributable to the indirect loan portfolio. The related figures for 2001 are $65.2 million and 75%.
The Company added $45.3 million to the allowance in the first quarter to bring the acquired Huntington-Florida loan portfolio into compliance with SunTrust’s credit standards.
management’s discussion | 24 | Sun Trust 2002 Annual Report |
Loans
The Company’s loan portfolio increased $4.2 billion, or 6.1%, from December 31, 2001 to December 31, 2002. The increase was aided by $2.7 billion of loans acquired from the February 2002 acquisition of Huntington-Florida. Excluding the impact of the Huntington-Florida transaction and reflecting the soft loan demand typical in an uncertain economy, average loans decreased 1.6% over the prior year. Compared to the prior year-end without adjustments for Huntington-Florida, the Company’s portfolio of commercial loans declined 0.9%, real estate loans grew 11.9% and consumer loans grew 8.9%.
The loan portfolio continues to be well-diversified from both a product and industry concentration standpoint. The product mix remained relatively constant from year-end 2001 to 2002, with real estate loans accounting for the largest segment (44.5% of total loans). Residential real estate represented 26.6% of total loans at year end, including $14.2 billion in home mortgages and $5.2 billion in home equity lines. The increase of $2.4 billion in home equity lines was due to a more focused strategy to grow this product, appreciation in the housing market and the favorable interest rate environment.
During 2001, in order to improve liquidity, the Company securitized $1,903.5 million in residential mortgages. As of December 31, 2002, $880.3 million of the securitized residential mortgage loans were carried on the Consolidated Balance Sheet as “Securities Available for Sale.” The Company did not securitize any loans in 2002. As a part of its ongoing balance sheet management, the Company may securitize residential mortgages and other loans during 2003. From an industry concentration perspective, Manufacturing, Transportation and Business services sectors are the only areas that represent more than 5% of year-end loans.
Sun Trust 2002 Annual Report | 25 | management’s discussion |
management’s discussion
TABLE 7 Noninterest Income
| | Year Ended December 31 | |
| |
| |
(In millions) | | 2002 | | 2001 | | 2000 | | 1999 | | 1998 | | 1997 | |
| |
|
| |
|
| |
|
| |
|
| |
|
| |
|
| |
| Service charges on deposit accounts | | $ | 612.9 | | $ | 510.2 | | $ | 459.7 | | $ | 438.1 | | $ | 401.1 | | $ | 374.1 | |
| Trust and investment management income | | | 504.5 | | | 486.1 | | | 493.9 | | | 495.6 | | | 453.4 | | | 387.3 | |
| Retail investment services | | | 136.7 | | | 107.8 | | | 108.2 | | | 97.4 | | | 64.6 | | | 51.5 | |
| Other charges and fees | | | 296.9 | | | 240.3 | | | 210.8 | | | 200.1 | | | 191.0 | | | 166.9 | |
| Mortgage production | | | 215.2 | | | 186.1 | | | 90.0 | | | 153.0 | | | 238.3 | | | 97.0 | |
| Mortgage servicing | | | (110.1 | ) | | (6.1 | ) | | 32.8 | | | 27.1 | | | 2.8 | | | 20.8 | |
| Securities gains (losses) | | | 204.5 | | | 153.1 | | | 6.6 | | | (109.1 | ) | | 8.2 | | | 6.9 | |
| Investment banking income | | | 177.0 | | | 108.5 | | | 111.3 | | | 67.8 | | | 55.8 | | | 16.8 | |
| Trading account profits and commissions | | | 103.2 | | | 95.7 | | | 31.7 | | | 35.1 | | | 44.6 | | | 22.7 | |
| Credit card and other fees | | | 120.0 | | | 113.6 | | | 95.7 | | | 106.2 | | | 87.3 | | | 81.1 | |
| Other income | | | 130.9 | | | 160.5 | | | 132.9 | | | 114.6 | | | 106.8 | | | 104.1 | |
| | |
|
| |
|
| |
|
| |
|
| |
|
| |
|
| |
| Total noninterest income | | $ | 2,391.7 | | $ | 2,155.8 | | $ | 1,773.6 | | $ | 1,625.9 | | $ | 1,653.9 | | $ | 1,329.2 | |
| | |
|
| |
|
| |
|
| |
|
| |
|
| |
|
| |
Noninterest Income
The Company continues to make significant progress in the diversification of its sources of income. Noninterest income has grown to comprise 42% of total revenues compared with 32% in 1997. Noninterest income for 2002 was $2,391.7 million, an increase of 10.9% compared to 2001. Noninterest income, excluding securities gains and losses, was $2,187.1 million in 2002, an increase of $184.4 million or 9.2% compared to 2001.
Trust and investment management income increased $18.4 million or 3.8% compared to 2001. As of December 31, 2002 and 2001, assets under management were approximately $89.6 billion. Assets under management include individually managed assets, the STI Classic Funds, institutional assets managed by Trusco Capital Management, and participant-directed retirement accounts. SunTrust’s total assets under advisement were approximately $162.6 billion, which included $24.5 billion held in non-managed corporate trust accounts and $17.0 billion in retail brokerage accounts. The retail brokerage accounts include $1.3 billion related to Alexander Key. Assets under management remained flat despite the decline in the equity markets due to strong net new business and an appreciation in bond values. Lost business is comparable with prior periods; however, new business is up significantly compared to 2001. Continued revenue growth is significantly dependent on improvement in the equity markets, which continue to be volatile.
Retail investment services income increased $28.9 million, or 26.8%, compared to prior year. The increase is primarily due to an increase in broker production and the number of brokers. The Company recently launched its full-service brokerage division, Alexander Key, which so far has generated nominal revenue.
Service charges on deposit accounts increased $102.7 million or 20.1% compared to 2001. Increased usage of products and services, a more consistent pricing strategy and lower earnings credit rate contributed to the increase in this line item. Mortgage production related income increased by $29.1 million or 15.6%, due primarily to an increase in refinancing activity resulting from the declining rate environment. Mortgage production for 2002 was $30.8 billion compared to $24.2 billion in 2001. Also associated with the high volume of refinancing activity, mortgage servicing related income decreased $104.0 million due to accelerated amortization of mortgage servicing rights related to increased prepayments. Other charges and fees were up $56.6 million or 23.5%, as a result of increased letter-of-credit fees, ATM fees and factoring fees.
The Company incurred net securities gains during 2002 of $204.5 million compared to $153.1 million in 2001 due to the continued repositioning of the securities portfolio. Investment banking increased $68.5 million or 63.1% compared to 2001. The increase in investment banking income is a result of the enhanced sales force through the acquisition of the institutional business of Robinson-Humphrey. The decline in other income is primarily due to a drop in net construction and development profit from the Company’s affordable housing subsidiary.
management’s discussion | 26 | Sun Trust 2002 Annual Report |
TABLE 8 Noninterest Expense
| | Year Ended December 31 | |
| |
| |
(In millions) | | 2002 | | 2001 | | 2000 | | 1999 | | 1998 | | 1997 | |
| |
| |
| |
| |
| |
| |
| |
| Salaries | | $ | 1,257.4 | | $ | 1,166.4 | | $ | 1,139.9 | | $ | 1,174.5 | | $ | 1,095.5 | | $ | 977.9 | |
| Other compensation | | | 377.5 | | | 422.0 | | | 329.1 | | | 348.1 | | | 338.2 | | | 218.1 | |
| Employee benefits | | | 306.4 | | | 193.0 | | | 175.0 | | | 175.8 | | | 181.8 | | | 176.9 | |
| | |
|
| |
|
| |
|
| |
|
| |
|
| |
|
| |
| | Total personnel expense | | | 1,941.3 | | | 1,781.4 | | | 1,644.0 | | | 1,698.4 | | | 1,615.5 | | | 1,372.9 | |
| Net occupancy expense | | | 229.3 | | | 210.4 | | | 202.6 | | | 197.4 | | | 192.2 | | | 187.2 | |
| Outside processing and software | | | 225.2 | | | 199.1 | | | 172.3 | | | 150.3 | | | 138.4 | | | 112.7 | |
| Equipment expense | | | 174.8 | | | 189.8 | | | 193.7 | | | 198.5 | | | 178.8 | | | 167.7 | |
| Consulting and legal | | | 91.1 | | | 87.7 | | | 59.6 | | | 62.5 | | | 67.5 | | | 51.7 | |
| Marketing and customer development | | | 80.0 | | | 104.0 | | | 106.2 | | | 105.4 | | | 107.1 | | | 95.4 | |
| Postage and delivery | | | 69.4 | | | 64.0 | | | 63.3 | | | 68.1 | | | 64.4 | | | 64.1 | |
| Communications | | | 64.8 | | | 59.2 | | | 59.8 | | | 66.3 | | | 62.1 | | | 52.7 | |
| Credit and collection services | | | 64.6 | | | 74.6 | | | 56.9 | | | 68.7 | | | 70.4 | | | 59.5 | |
| Amortization of intangible assets | | | 58.9 | | | 46.3 | | | 35.5 | | | 32.8 | | | 43.1 | | | 38.5 | |
| Other staff expense | | | 52.0 | | | 58.5 | | | 51.5 | | | 50.1 | | | 47.8 | | | 40.3 | |
| Operating supplies | | | 46.8 | | | 48.3 | | | 47.3 | | | 51.9 | | | 54.0 | | | 50.0 | |
| FDIC premiums | | | 17.4 | | | 16.0 | | | 13.5 | | | 18.1 | | | 18.3 | | | 17.6 | |
| Merger-related expense | | | 16.0 | | | — | | | 42.4 | | | 45.6 | | | 119.4 | | | — | |
| Other real estate income | | | (0.1 | ) | | (4.2 | ) | | (3.8 | ) | | (4.8 | ) | | (9.8 | ) | | (8.6 | ) |
| Other expense | | | 210.8 | | | 178.4 | | | 83.7 | | | 96.0 | | | 100.9 | | | 87.5 | |
| | |
|
| |
|
| |
|
| |
|
| |
|
| |
|
| |
| Total noninterest expense | | $ | 3,342.3 | | $ | 3,113.5 | | $ | 2,828.5 | | $ | 2,905.3 | | $ | 2,870.1 | | $ | 2,389.2 | |
| | |
|
| |
|
| |
|
| |
|
| |
|
| |
|
| |
| Efficiency ratio | | | 58.90 | % | | 56.96 | % | | 57.47 | % | | 60.35 | % | | 62.02 | % | | 57.41 | % |
| | |
|
| |
|
| |
|
| |
|
| |
|
| |
|
| |
| | | | | | | | | | | | | | | | | | | | |
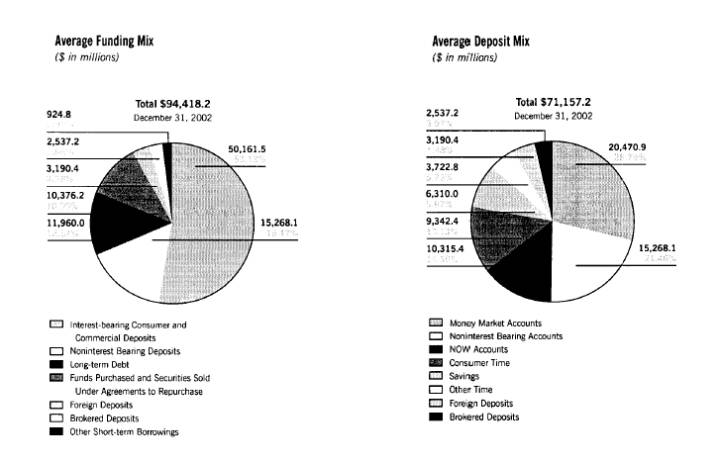 |
SunTrust 2002 Annual Report | 27 | management’s discussion |
management’s discussion
Noninterest Expense
Noninterest expense increased 7.3% in 2002. During 2002, total personnel expense increased $160.0 million, or 9.0%, primarily because of increased employee benefits costs, the acquisitions of Huntington-Florida, the institutional business of Robinson-Humphrey, and AMA Holdings, Inc. Additionally, personnel expense was impacted by increased incentive expense resulting from record mortgage production in 2002. Mortgage production increased 27.3% compared to 2001. Included in personnel expense in 2002 was $0.7 million related to stock option expense as a result of adopting the fair value provisions of SFAS No. 123 effective January 1, 2003. All future employee stock option grants and modifications will be expensed over the stock option vesting period based on the fair value at the date options are granted using the Black-Scholes valuation model in accordance with SFAS No. 123. If the Company grants stock options in 2003 at historical levels, the estimated expense for 2003 is $12.8 million. Assuming annual grants at historical levels and an $11.00 per share fair value, the increase per share would increase annually over the next several years and level off at approximately $0.08 per diluted share by 2005. Pension expense for the Retirement Plan is expected to increase from $15 million in 2002 to approximately $58 million in 2003 due to several factors. First, based on the decline in the equity markets and the expected long-term forecast for these markets, we have adjusted our expected rate of return for the Retirement Plan assets from 9.50% to 8.75%. SunTrust uses the preferred accounting method for determining the asset value for the Retirement Plan that immediately recognizes losses and gains in the asset value (i.e., market value of assets), rather than deferring these losses into the future. Companies that do not use the actual market value of assets have less volatility in their annual pension expense and are deferring costs into the future. Another factor that has increased the level of pension expense in 2003 is the required use of a lower interest rate (6.75%) for measuring liabilities. This interest rate was 7.25% in the prior year.
Also impacting noninterest expense was the now completed One Bank initiative. The One Bank initiative represents enhancements to customer-based systems across the Company’s geographic footprint and is expected to yield operating efficiencies in the future. One Bank expenses for 2002 were $56.2 million compared to $54.6 million for 2001. The One Bank project was completed in the fourth quarter of 2002.
Amortization of intangible assets increased $12.6 million or 27.3% due to the amortization of core deposit and other intangibles from the acquisition of Huntington-Florida. However, due to the issuance of SFAS No. 142, no goodwill amortization was recorded in 2002. The Company assessed goodwill for impairment as of December 31, 2002, and it was determined that there was no impairment as of that date. Amortization of goodwill in 2001 was $41.7 million and included the write-off of $12.7 million related to the sale of SunTrust Credit Corporation.
In 2002, the acquisition of Huntington-Florida resulted in an increase in noninterest expense of $151.5 million. The $151.5 million includes $16.0 million of merger-related charges for operations and systems integration and $54.6 million for the amortization of related intangible assets. The efficiency ratio for 2002 was 58.9%, an increase from 57.0% for 2001.
Provision For Income Taxes
The provision for income taxes covers federal and state income taxes. In 2002, the provision was $491.5 million, compared to $653.9 million in 2001. The provision represents an effective tax rate of 27.0% for 2002 compared to 32.2% for 2001. Included in the 2001 provision, the Company recorded $3.4 million in income tax expense related to the early extinguishments of long-term debt. The extraordinary gain on the consolidated statements of income is shown net of taxes.
The 2002 effective tax rate was lower than historical levels due to several factors. In the first quarter, the Company realized a tax benefit upon the reversal of a deferred liability, which resulted from the change in status of a subsidiary to a real estate investment trust (“REIT”). A tax benefit was also realized when the Company standardized the recognition of low income housing tax credits. Finally, during 2002, a REIT subsidiary of the Company issued $350 million of preferred stock, which qualifies as Tier 1 capital for regulatory capital purposes. A tax benefit was realized on the dividends declared by the REIT on the preferred stock.
Allowance For Loan Losses
SunTrust continuously reviews its loan portfolio and maintains an allowance for loan losses sufficient to absorb losses inherent in the portfolio. The Company is committed to the early recognition of problem loans and to an appropriate and adequate level of allowance. At year-end 2002, the Company’s total allowance was $930.1 million, which represented 1.27% of period-end loans.
In addition to the review of credit quality through ongoing credit review processes, the Company constructs an independent and comprehensive allowance analysis for its loan portfolios at least quarterly. The analysis includes three basic elements: specific allowances for individual loans, general allowances for loan pools and allowances based on economic conditions and other risk factors. The SunTrust Allowance for Loan Losses Review Committee has the responsibility of affirming the allowance methodology and assessing all of the risk elements in order to determine the appropriate level of allowance for the inherent losses in the loan portfolio at the point in time being reviewed.
The first element of the Allowance for Loan Losses analysis involves the calculation of specific allowances for individual impaired loans as required by SFAS Nos. 114 and 118. Moreover, the Company applies the same specific allowance methodology to a broader group of loans that, while not defined as impaired, have internal risk ratings below a predetermined classification and credit exposure greater than $0.5 million. The specific allowance established for these two groups of impaired and certain other loans is based on a thorough analysis of the most probable sources of repayment, including discounted future cash flows, liquidation of collateral, the market value of the loan itself and the guarantor’s repayment capacity (if applicable). As of December 31, 2002 and 2001, the specific allowance calculations totaled $177 million and $254 million, respectively. The decrease between these two periods primarily resulted from a 20% decline in the dollar amount of loans that met the criteria for specific allowance review.
management’s discussion | 28 | SunTrust 2002 Annual Report |
The second element – the general allowance for loan pools – is determined per SFAS No. 5 by applying loan loss allowance factors to groups of loans within the portfolio that have similar characteristics. The general allowance factors are based upon the results of an annual statistical loss migration analysis and other analyses of recent and historical charge-off experience and are typically applied to the portfolio in terms of loan type and internal risk rating. The loss migration analysis provides the basis for factors applied to the commercial and commercial real estate loan portfolios by examining the most recent twelve-month’s loss experience in relation to internal credit risk ratings over time. Historical loss analyses provide the basis for factors used for more homogenous pools of smaller loans, such as residential real estate and other consumer loan categories. While these analyses that establish the general allowance factors are formally prepared annually, the Company continuously monitors credit quality in all portfolio segments and may revise the general factors whenever necessary in order to address improving or deteriorating credit quality trends or specific risks associated with any given loan category. As of December 31, 2002 and 2001, the general allowance calculations totaled $478 million and $425 million, respectively. The increase between the periods was primarily the result of an increase in the overall pooled loan population and increased loss factors.
The third element – allowances for economic conditions and other risk factors – is based on guidance in various Joint Interagency Statements issued by bank regulatory agencies and focuses on risks that are not otherwise evaluated in the first two elements. The economic risk assessment considers periodic changes in several widely publicized U.S. economic indicators along with the public viewpoints of Federal Agencies and well-known economists regarding the status of the economy. The concentration risk methodology considers credit exposure when grouped by borrower, collateral type, region and industry, and estimates the incremental risks (see Note 20 for additional details of credit concentration and Table 9 for Loans by Selected Industries). Administrative risks are typically few in number and are related to specific changes in the organization or loan portfolio, such as reorganization or centralization efforts, along with changes in credit policy or client selection criteria. The qualitative risk factors of this third allowance element are subjective and require a high degree of management judgment. As of December 31, 2002 and 2001, the allowance calculated for economic conditions and other risk factors totaled $239 million and $179 million, respectively. The change between the two periods was primarily the result of different economic outlooks at each year-end. While economic optimism was widespread at the end of 2001, traditional economic indicators in subsequent periods failed to produce evidence of the expected rapid recovery. Revised forecasts based on economic performance caused the Company to raise its economic risk assessment early in 2002, which is expected to be maintained until clear evidence of sustained recovery is observed.
The Company’s provision for loan losses in 2002 was $469.8 million, which exceeded net charge-offs of $422.3 million by $47.5 million. The comparable provision and net charge-off amounts for 2001 were $275.2 million and $272.4 million, respectively. Provision expense increased from 2001 to 2002 due to deterioration in certain large corporate credits that led to higher charge-offs for that segment, an increase in consumer loan losses resulting primarily from higher default rates in the indirect lending portfolio and an increase of $45.3 million related to the acquisition of the Huntington-Florida portfolio.
Net charge-offs for 2002 represented .59% of average loans, compared to .39% of average loans for 2001. 2002 loan recoveries were $14.2 million, or 27%, higher than in 2001, but the ratio of recoveries to total charge-offs decreased to 13.8% from 16.4% due to higher gross charge-offs. The allowance at year-end represented just over two years’ coverage of 2002 net charge-offs. The SunTrust charge-off policy is consistent with regulatory standards, although a somewhat more conservative policy governs the unsecured consumer loan portfolio. Losses on unsecured consumer loans are recognized at 90 days past due, compared to the regulatory loss criteria of 120 days. Secured installment loans are typically charged off at 120 days past due if repayment from all sources has been determined to be improbable, or at the occurrence of a loss confirming event (e.g., repossession).
Nonperforming assets decreased to $542.0 million at December 31, 2002 from $599.8 million at December 31, 2001 (see “Nonperforming Assets” section and Table 12 for further details). Nonaccrual loans declined $47.1 million or 8.4% to $511.0 million during the same period. The ratio of the allowance for loan losses to total nonaccrual loans (excluding other real estate owned and other repossessed assets) increased to 182.0% at December 31, 2002 from 155.4% at December 31, 2001. The modest decline in nonaccrual loans did not have a material impact on the allowance, apart from the change in the specific allowance element note above, because the Company’s allowance methodology evaluates adversely rated loans, both impaired and unimpaired, according to provisions of SFAS Nos. 114 and 118. (See above discussion of the specific allowance element.)
Commercial loans and real estate loans are typically placed on nonaccrual when principal or interest is past due for 90 days or more, unless the loan is both secured by collateral having realizable value sufficient to discharge the debt in full and the loan is in the legal process of collection. Accordingly, secured loans may be charged down to the estimated value of the collateral and previously accrued unpaid interest is reversed. Subsequent charge-offs may be required as a result of changes in the market value of collateral or other repayment prospects.
SunTrust 2002 Annual Report | 29 | management’s discussion |
management’s discussion
TABLE 9 Loans By Selected Industries1
| | At December 31, 2002 | |
| |
| |
(Dollars in millions) | | Loans | | % of Total Loans | |
| |
| |
| |
| Manufacturing | | $ | 5,027.7 | | | 6.9 | |
| Transportation | | | 3,952.2 | | | 5.4 | |
| Business services | | | 3,901.1 | | | 5.3 | |
| Construction/Contractors | | | 2,850.0 | | | 3.9 | |
| Healthcare | | | 2,165.6 | | | 3.0 | |
| Real estate investors | | | 2,118.5 | | | 2.9 | |
| Wholesale trade | | | 1,900.3 | | | 2.6 | |
| Hospitality/Entertainment | | | 1,725.4 | | | 2.4 | |
| Investment services | | | 1,559.7 | | | 2.1 | |
| Financial services | | | 1,317.7 | | | 1.8 | |
| Media/Telecommunications | | | 1,236.4 | | | 1.7 | |
| Textiles | | | 1,196.3 | | | 1.6 | |
| Government agencies | | | 1,083.2 | | | 1.5 | |
| Retail trade | | | 1,073.2 | | | 1.5 | |
| | |
|
| |
|
| |
1 Includes loans in aggregate greater than $1 billion to selected industries.
TABLE 10 Allowance For Loan Losses
| | At December 31 | |
| |
| |
(Dollars in millions) | | 2002 | | 2001 | | 2000 | | 1999 | | 1998 | | 1997 | |
| |
| |
| |
| |
| |
| |
| |
Allocation by Loan Type | | | | | | | | | | | | | | | | | | | |
| Commercial | | $ | 408.5 | | $ | 435.8 | | $ | 389.0 | | $ | 286.7 | | $ | 251.4 | | $ | 247.8 | |
| Real estate | | | 150.8 | | | 145.5 | | | 190.2 | | | 208.0 | | | 229.8 | | | 229.3 | |
| Consumer loans | | | 332.8 | | | 251.3 | | | 252.3 | | | 339.3 | | | 420.9 | | | 406.9 | |
| Unallocated | | | 38.0 | | | 34.5 | | | 43.0 | | | 37.3 | | | 42.5 | | | 49.5 | |
| | |
|
| |
|
| |
|
| |
|
| |
|
| |
|
| |
| | Total | | $ | 930.1 | | $ | 867.1 | | $ | 874.5 | | $ | 871.3 | | $ | 944.6 | | $ | 933.5 | |
| | |
|
| |
|
| |
|
| |
|
| |
|
| |
|
| |
Allocation as a Percent of Total Allowance | | | | | | | | | | | | | | | | | | | |
| Commercial | | | 43.9 | % | | 50.2 | % | | 44.5 | % | | 32.9 | % | | 26.6 | % | | 26.5 | % |
| Real estate | | | 16.2 | | | 16.8 | | | 21.7 | | | 23.9 | | | 24.3 | | | 24.6 | |
| Consumer loans | | | 35.8 | | | 29.0 | | | 28.9 | | | 38.9 | | | 44.6 | | | 43.6 | |
| Unallocated | | | 4.1 | | | 4.0 | | | 4.9 | | | 4.3 | | | 4.5 | | | 5.3 | |
| | |
|
| |
|
| |
|
| |
|
| |
|
| |
|
| |
| | Total | | | 100.0 | % | | 100.0 | % | | 100.0 | % | | 100.0 | % | | 100.0 | % | | 100.0 | % |
| | |
|
| |
|
| |
|
| |
|
| |
|
| |
|
| |
Year-end Loan Types as a Percent of Total Loans | | | | | | | | | | | | | | | | | | | |
| Commercial | | | 39.4 | % | | 42.0 | % | | 42.6 | % | | 40.8 | % | | 40.0 | % | | 34.3 | % |
| Real estate | | | 44.5 | | | 42.3 | | | 43.0 | | | 45.3 | | | 44.2 | | | 47.9 | |
| Consumer loans | | | 16.1 | | | 15.7 | | | 14.4 | | | 13.9 | | | 15.8 | | | 17.8 | |
| | |
|
| |
|
| |
|
| |
|
| |
|
| |
|
| |
| | Total | | | 100.0 | % | | 100.0 | % | | 100.0 | % | | 100.0 | % | | 100.0 | % | | 100.0 | % |
| | | |
|
| |
|
| |
|
| |
|
| |
|
| |
|
| |
| | | | | | | | | | | | | | | | | | | | | | |
management’s discussion | 30 | SunTrust 2002 Annual Report |
TABLE 11 Summary Of Loan Loss Experience
| | Year Ended December 31 | |
| |
| |
(Dollars in millions) | | 2002 | | 2001 | | 2000 | | 1999 | | 1998 | | 1997 | |
| |
| |
| |
| |
| |
| |
| |
Allowance for Loan Losses | | | | | | | | | | | | | | | | | | | |
| Balance – beginning of year | | $ | 867.1 | | $ | 874.5 | | $ | 871.3 | | $ | 944.6 | | $ | 933.5 | | $ | 897.0 | |
| Allowance from acquisitions, dispositions and other activity – net | | | 15.5 | | | (10.2 | ) | | — | | | (13.3 | ) | | (10.0 | ) | | 2.2 | |
| Provision for loan losses | | | 469.8 | | | 275.2 | | | 134.0 | | | 170.4 | | | 214.6 | | | 225.1 | |
| Charge-offs | | | | | | | | | | | | | | | | | | | |
| | Commercial | | | (295.1 | ) | | (217.3 | ) | | (115.6 | ) | | (142.0 | ) | | (49.0 | ) | | (30.0 | ) |
| | Real estate | | | | | | | | | | | | | | | | | | | |
| | Construction | | | (0.8 | ) | | (0.3 | ) | | (0.2 | ) | | (2.2 | ) | | (3.2 | ) | | (4.0 | ) |
| | Residential mortgages | | | (16.7 | ) | | (10.8 | ) | | (7.8 | ) | | (15.0 | ) | | (13.8 | ) | | (11.8 | ) |
| | Other | | | (17.8 | ) | | (5.9 | ) | | (3.3 | ) | | (5.2 | ) | | (5.2 | ) | | (6.9 | ) |
| | Credit card | | | (1.9 | ) | | (2.7 | ) | | (5.4 | ) | | (78.9 | ) | | (129.5 | ) | | (143.2 | ) |
| | Consumer loans | | | (157.8 | ) | | (89.0 | ) | | (57.5 | ) | | (52.8 | ) | | (63.6 | ) | | (79.3 | ) |
| | |
|
| |
|
| |
|
| |
|
| |
|
| |
|
| |
| | Total charge-offs | | | (490.1 | ) | | (326.0 | ) | | (189.8 | ) | | (296.1 | ) | | (264.3 | ) | | (275.2 | ) |
| Recoveries | | | | | | | | | | | | | | | | | | | |
| | Commercial | | | 27.8 | | | 23.8 | | | 22.7 | | | 15.5 | | | 14.8 | | | 22.0 | |
| | Real estate | | | | | | | | | | | | | | | | | | | |
| | Construction | | | 0.4 | | | 0.4 | | | 0.3 | | | 0.7 | | | 0.3 | | | 2.5 | |
| | Residential mortgages | | | 3.7 | | | 2.2 | | | 3.3 | | | 3.4 | | | 2.7 | | | 2.8 | |
| | Other | | | 3.9 | | | 1.8 | | | 3.9 | | | 6.1 | | | 8.4 | | | 8.9 | |
| | Credit card | | | 1.0 | | | 1.6 | | | 3.1 | | | 11.9 | | | 14.9 | | | 17.7 | |
| | Consumer loans | | | 31.0 | | | 23.8 | | | 25.7 | | | 28.1 | | | 29.7 | | | 30.5 | |
| | |
|
| |
|
| |
|
| |
|
| |
|
| |
|
| |
| | Total recoveries | | | 67.8 | | | 53.6 | | | 59.0 | | | 65.7 | | | 70.8 | | | 84.4 | |
| | |
|
| |
|
| |
|
| |
|
| |
|
| |
|
| |
| Net charge-offs | | | (422.3 | ) | | (272.4 | ) | | (130.8 | ) | | (230.4 | ) | | (193.5 | ) | | (190.8 | ) |
| | |
|
| |
|
| |
|
| |
|
| |
|
| |
|
| |
| Balance – end of year | | $ | 930.1 | | $ | 867.1 | | $ | 874.5 | | $ | 871.3 | | $ | 944.6 | | $ | 933.5 | |
| | |
|
| |
|
| |
|
| |
|
| |
|
| |
|
| |
| Total loans outstanding at year end | | $ | 73,167.9 | | $ | 68,959.2 | | $ | 72,239.8 | | $ | 66,002.8 | | $ | 61,540.6 | | $ | 55,476.4 | |
| Average loans | | $ | 71,270.4 | | $ | 70,023.0 | | $ | 70,044.3 | | $ | 62,749.4 | | $ | 57,590.5 | | $ | 51,788.1 | |
| | |
|
| |
|
| |
|
| |
|
| |
|
| |
|
| |
Ratios | | | | | | | | | | | | | | | | | | | |
| Allowance to year-end loans | | | 1.27 | % | | 1.26 | % | | 1.21 | % | | 1.32 | % | | 1.53 | % | | 1.68 | % |
| Allowance to nonaccrual loans | | | 182.0 | | | 155.4 | | | 215.8 | | | 350.0 | | | 456.0 | | | 494.6 | |
| Net charge-offs to average loans | | | 0.59 | | | 0.39 | | | 0.19 | | | 0.37 | | | 0.34 | | | 0.37 | |
| Provision to average loans | | | 0.66 | | | 0.39 | | | 0.19 | | | 0.27 | | | 0.37 | | | 0.43 | |
| Recoveries to total charge-offs | | | 13.8 | | | 16.4 | | | 31.1 | | | 22.2 | | | 26.8 | | | 30.7 | |
| | |
|
| |
|
| |
|
| |
|
| |
|
| |
|
| |
| | | | | | | | | | | | | | | | | | | | | | | | |
Nonperforming Assets
Nonperforming assets, which consist of nonaccrual loans, other real estate owned (OREO) and other repossessed assets, totaled $542.0 million at December 31, 2002, a decrease of $57.8 million or 9.6% from December 31, 2001. At year-end, the ratio of nonperforming assets to total loans plus OREO and other repossessed assets improved to 0.74%, compared to 0.87% at December 31, 2001.
The reduction in nonperforming assets resulted in part from fewer additions to nonaccrual loans throughout the year, which favorably impacted year-end Commercial and Commercial Real Estate nonaccrual loan totals, and from lower levels of OREO and other repossessed assets. Total nonaccrual loans were down $47.1 million, or 8.4%, due to a 31.1% decline in large corporate nonaccrual loan inflow and higher levels of large corporate charge-offs, which totaled $220.3 million in 2002, including $66.2 million related to loan sales transactions. The modest decline in OREO was due to normal foreclosure and sales activity, while other repossessed assets, primarily repossessed vehicles related to the Consumer Indirect Loan portfolio, declined $8 million from December 31, 2001 due to lower unit valuations at the end of 2002.
SunTrust 2002 Annual Report | 31 | management’s discussion |
management’s discussion
TABLE 12 Nonperforming Assets And Accruing Loans Past Due 90 Days Or More
| | At December 31 | |
| |
| |
(Dollars in millions) | | 2002 | | 2001 | | 2000 | | 1999 | | 1998 | | 1997 | |
| |
| |
| |
| |
| |
| |
| |
Nonperforming Assets | | | | | | | | | | | | | | | | | | | |
| Nonaccrual loans | | | | | | | | | | | | | | | | | | | |
| | Commercial | | $ | 351.3 | | $ | 377.6 | | $ | 273.6 | | $ | 105.0 | | $ | 50.7 | | $ | 37.8 | |
| | Real estate | | | | | | | | | | | | | | | | | | | |
| | Construction | | | 10.0 | | | 4.0 | | | 2.2 | | | 9.0 | | | 13.5 | | | 16.0 | |
| | Residential mortgages | | | 82.5 | | | 79.9 | | | 81.8 | | | 82.6 | | | 83.9 | | | 75.2 | |
| | Other | | | 38.0 | | | 62.8 | | | 29.0 | | | 34.9 | | | 46.6 | | | 47.6 | |
| | Consumer loans | | | 29.2 | | | 33.8 | | | 18.7 | | | 17.4 | | | 12.5 | | | 12.1 | |
| | |
|
| |
|
| |
|
| |
|
| |
|
| |
|
| |
| | Total nonaccrual loans | | | 511.0 | | | 558.1 | | | 405.3 | | | 248.9 | | | 207.2 | | | 188.7 | |
| | Other real estate owned (OREO) | | | 18.0 | | | 20.7 | | | 23.0 | | | 26.8 | | | 34.9 | | | 48.2 | |
| | Other repossessed assets | | | 13.0 | | | 21.0 | | | 10.3 | | | 8.3 | | | 7.0 | | | 6.7 | |
| | |
|
| |
|
| |
|
| |
|
| |
|
| |
|
| |
| Total nonperforming assets | | $ | 542.0 | | $ | 599.8 | | $ | 438.6 | | $ | 284.0 | | $ | 249.1 | | $ | 243.6 | |
| | |
|
| |
|
| |
|
| |
|
| |
|
| |
|
| |
Ratios | | | | | | | | | | | | | | | | | | | |
| | Nonaccrual loans to total loans | | | 0.70 | % | | 0.81 | % | | 0.56 | % | | 0.38 | % | | 0.34 | % | | 0.34 | % |
| | Nonperforming assets to total loans plus OREO and other repossessed assets | | | 0.74 | | | 0.87 | | | 0.61 | | | 0.43 | | | 0.40 | | | 0.43 | |
Accruing Loans Past Due 90 Days or More | | $ | 177.9 | | $ | 185.5 | | $ | 181.2 | | $ | 117.4 | | $ | 108.2 | | $ | 109.0 | |
| | |
|
| |
|
| |
|
| |
|
| |
|
| |
|
| |
| | | | | | | | | | | | | | | | | | | | | | | | | |
Interest income on nonaccrual loans, if recognized, is recorded using the cash basis method of accounting. When a loan is placed on nonaccrual, unpaid interest is reversed against interest income if it was accrued in the current year and is charged to the allowance for loan losses if it was accrued in prior years. When a nonaccrual loan is returned to accruing status, any unpaid interest is recorded as interest income only after all principal has been collected.
For the year 2002, the gross amount of interest income that would have been recorded on nonaccrual loans at December 31, 2002, if all such loans had been accruing interest at the original contractual rate, was $45.2 million. Interest payments recorded in 2002 as interest income (excluding reversals of previously accrued interest) for all such nonperforming loans at December 31, 2002, were $15.6 million.
Securities Available For Sale
The investment portfolio is managed as part of the overall asset and liability management process to optimize income and market performance over an entire interest rate cycle, while mitigating risk. In conjunction with interest rate risk management, the Company continued the repositioning of the portfolio during 2002 to shorten its average life and shift its mix toward more floating rate assets. The average life shortened to 2.8 years from 4.0 years, and the percentage of floating rate securities increased to 21% from 17% of the total portfolio as of December 31, 2002 and 2001, respectively. The average duration of the portfolio, a measure of price sensitivity, was 1.3% at December 31, 2002 compared with 2.0% at December 31, 2001. The portfolio yield decreased from 6.54% in 2001 to 4.89% in 2002, primarily from purchasing shorter-term securities and reinvesting accelerated prepayments and maturities at lower market rates. Net securities gains of $204.5 million were realized in 2002, primarily from selling longer-term, fixed-rate securities as part of the repositioning.
The securities portfolio increased in size, largely in the second half of the year, to profitably invest excess liquidity from stronger deposit growth and slower loan growth. The average portfolio size on an amortized cost basis was $19.3 billion or 16.8% of average total assets for the fourth quarter of 2002, compared with $16.2 billion or 15.6% of average total assets for the fourth quarter of 2001. The credit quality of the investment portfolio continues to be sound, with 62.2% of the total par value of debt securities being backed by the U.S. Treasury or other U.S. government-sponsored agencies at December 31, 2002. All of the Company’s asset-backed securities were rated “AAA” by at least one nationally recognized rating agency and 91.8% of the Company’s corporate bonds were rated “A” or higher by Moody’s Investors Service at December 31, 2002.
The carrying value of the investment portfolio, all of which is classified as “securities available for sale,” reflected $2.4 billion in net unrealized gains at December 31, 2002, including a $2.1 billion unrealized gain on the Company’s investment in common stock of The Coca-Cola Company. The market value of this common stock investment decreased $165.1 million, while the unrealized gain on the remainder of the portfolio decreased $45.6 million compared to December 31, 2001. These changes in market value did not affect the net income of SunTrust, but were included in accumulated other comprehensive income.
management’s discussion | 32 | SunTrust 2002 Annual Report |
TABLE 13 Securities Available For Sale
| | At December 31 | |
| |
| |
(In millions) | | Amortized
Cost | | Fair
Value | | Unrealized
Gains | | Unrealized
Losses | |
| |
| |
| |
| |
| |
| U.S. Treasury and other U.S. government agencies and corporations | | | | | | | | | | | | | |
| 2002 | | $ | 3,601.5 | | $ | 3,684.0 | | $ | 82.9 | | $ | 0.4 | |
| 2001 | | | 2,229.5 | | | 2,340.2 | | | 111.2 | | | 0.5 | |
| 2000 | | | 2,763.5 | | | 2,845.3 | | | 82.3 | | | 0.5 | |
| States and political subdivisions | | | | | | | | | | | | | |
| 2002 | | | 398.6 | | | 419.1 | | | 20.9 | | | 0.4 | |
| 2001 | | | 434.1 | | | 443.7 | | | 11.1 | | | 1.5 | |
| 2000 | | | 449.3 | | | 455.6 | | | 8.0 | | | 1.7 | |
| Asset-backed securities | | | | | | | | | | | | | |
| 2002 | | | 4,478.2 | | | 4,518.1 | | | 44.9 | | | 5.0 | |
| 2001 | | | 3,508.4 | �� | | 3,544.1 | | | 45.5 | | | 9.8 | |
| 2000 | | | 1,865.1 | | | 1,887.7 | | | 24.3 | | | 1.7 | |
| Mortgage-backed securities | | | | | | | | | | | | | |
| 2002 | | | 9,467.2 | | | 9,622.1 | | | 155.6 | | | 0.7 | |
| 2001 | | | 8,142.5 | | | 8,291.7 | | | 163.2 | | | 14.0 | |
| 2000 | | | 7,651.4 | | | 7,679.5 | | | 62.5 | | | 34.4 | |
| Corporate bonds | | | | | | | | | | | | | |
| 2002 | | | 1,923.5 | | | 1,929.7 | | | 64.6 | | | 58.4 | |
| 2001 | | | 1,969.5 | | | 1,983.5 | | | 62.6 | | | 48.6 | |
| 2000 | | | 2,362.2 | | | 2,300.8 | | | 37.0 | | | 98.4 | |
Other securities1 | | | | | | | | | | | | | |
| 2002 | | | 1,154.6 | | | 3,272.2 | | | 2,117.6 | | | — | |
| 2001 | | | 740.1 | | | 3,053.2 | | | 2,313.1 | | | — | |
| 2000 | | | 670.5 | | | 3,641.4 | | | 2,970.9 | | | — | |
| Total securities available for sale | | | | | | | | | | | | | |
| 2002 | | $ | 21,023.6 | | $ | 23,445.2 | | $ | 2,486.5 | | $ | 64.9 | |
| 2001 | | | 17,024.1 | | | 19,656.4 | | | 2,706.7 | | | 74.4 | |
| 2000 | | | 15,762.0 | | | 18,810.3 | | | 3,185.0 | | | 136.7 | |
| | |
|
| |
|
| |
|
| |
|
| |
1 Includes the Company’s investment in 48,266,496 shares of common stock of The Coca-Cola Company.
Liquidity Management
Liquidity Risk is the risk of being unable to timely meet obligations as they come due at reasonable cost. SunTrust manages this risk by maintaining borrowing resources to fund increases in assets and replace maturing obligations or deposit withdrawals, both in the normal course of business and in times of unusual events. The Asset Liability Management Committee (ALCO) of the Company sets the policies and reviews adherence to these policies.
The Company’s sources of funds include a large, stable deposit base, secured advances from the Federal Home Loan Bank and access to the capital markets. The Company structures its Balance Sheet such that illiquid assets, such as loans, are funded through customer deposits, long-term debt, other liabilities and capital. The Company utilizes short-term unsecured borrowings to the extent there are adequate pledgeable or marketable securities and other secured borrowing sources.
Customer-based core deposits, the Company’s largest and most cost-effective source of funding, accounted for 69% of the funding base on average for 2002, as compared to 63% in 2001. The increase over 2001 is attributable to strong customer-based core deposit growth aided by the acquisition of Huntington-Florida and successful marketing campaigns. In addition, deposits increased due to the volatility of the financial markets. Increases in rates, improved economic activity and confidence in the financial markets may lead to disintermediation of deposits, which may need to be replaced with higher cost borrowings in the future.
Net short-term unsecured borrowed funds, including wholesale domestic and international deposits and fed funds, totaled $14.3 billion at year-end 2002, as compared to $9.1 billion for 2001. Total net wholesale funding, including short-term unsecured borrowings, secured wholesale borrowings and long-term debt, totaled $32.0 billion at year-end 2002, compared to $28.0 billion for 2001. The Company manages reliance on short-term unsecured borrowings as well as total wholesale funding through policy limits reviewed by ALCO.
The Company maintains access to a diversified base of wholesale funding sources. These sources include fed funds purchased, securities sold under agreements to repurchase,
SunTrust 2002 Annual Report | 33 | management’s discussion |
management’s discussion
TABLE 14 Off-Balance Sheet Lending Related Commitments
(Dollars in millions) | | At December 31, 2002 | |
| |
| |
| Lines of credit | | | | |
| | Home equity lines | | $ | 5,748.3 | |
| | Credit card | | | 944.1 | |
| | Commercial real estate | | | 3,004.9 | |
| | Mortgage commitments1 | | | 7,812.2 | |
| | Commercial paper conduit | | | 3,927.2 | |
| | Commercial | | | 33,609.3 | |
| | |
|
| |
| Total lines of credit | | $ | 55,046.0 | |
| | |
|
| |
| Letters of credit | | $ | 9,361.7 | |
| | |
|
| |
1 Includes $5,489.4 million in interest rate locks accounted for as derivatives.
negotiable certificates of deposit, offshore deposits, Federal Home Loan Bank advances, Global Bank Note issuance and commercial paper issuance. Liquidity is also available through unpledged securities in the investment portfolio and capacity to securitize loans, including single-family mortgage loans. The Company’s credit ratings are important to its access of unsecured wholesale borrowings. Significant changes in these ratings could change the cost and availability of these sources.
The low rate environment has created heavy refinance activity and an increase in the amount of mortgage loans originated by the Company. The Company sells most of these loans into the secondary market and they are reflected in loans held for sale. The significant increase in loan closings in the fourth quarter of 2002, totaling $11.3 billion, inflated the balance in this account until delivery of these loans occurs in 2003. In 2002, the Company originated $30.8 billion in mortgages, compared to $24.2 billion in 2001. As of December 31, 2002, the balance of loans held for sale was $7.7 billion compared to $4.3 billion on December 31, 2001. SunTrust has been able to fund this increase in balances in the normal course of business and anticipates being able to do so in the future. It is anticipated that when interest rates increase, loans held for sale will decrease due to a drop in mortgage originations that are typically sold to secondary markets.
As is common in the Financial Services Industry, SunTrust Bank assists in providing liquidity to select corporate customers by directing them to a third-party-owned commercial paper conduit. SunTrust’s conduit relationship is with Three Pillars Funding Corporation (Three Pillars). Three Pillars provides financing for or direct purchases of financial assets originated and serviced by SunTrust Bank’s corporate customers. Three Pillars finances this activity by issuing A-1/P-1-rated commercial paper. The result is a favorable funding arrangement for these SunTrust Bank customers.
Three Pillars had assets and liabilities not included in the Consolidated Balance Sheet of approximately $2.8 and $2.2 billion as of December 31, 2002 and 2001, respectively, which primarily consisted of secured loans, marketable asset-backed securities and short-term commercial paper liabilities. For the years ended December 31, 2002 and 2001, activities related to the Three Pillars relationship generated approximately $16.4 million and $11.1 million in fee revenue for SunTrust Bank. These activities include: client referrals and investment recommendations to Three Pillars; the issuing of a letter of credit, which provides partial credit protection to commercial paper holders; and providing a majority of the temporary liquidity arrangements that would provide funding to Three Pillars in the event that it can no longer issue commercial paper. As of December 31, 2002, the liquidity commitments and other credit enhancement SunTrust Bank made to Three Pillars totaled $3.9 billion and $346.6 million, respectively, which represents the Company’s maximum exposure to potential loss. The Company manages the credit risk associated with these commitments by subjecting them to the Company’s normal credit approval and monitoring processes. SunTrust Bank has never had to fund under either the liquidity arrangement or credit enhancement on behalf of Three Pillars. Currently, the Company believes it is unlikely it would be required to fund under these arrangements.
management’s discussion | 34 | SunTrust 2002 Annual Report |
The Company had $36.6 billion in Corporate and Commercial Real Estate Commitments, in addition to the amounts described above for Three Pillars at December 31, 2002. The Company also had $9.4 billion at December 31, 2002 in letters of credit, most of which are Standby Letters of Credit that provide that the Bank will fund if certain future events occur. Of this, approximately $5.1 billion supports Variable Rate Demand Obligations (VRDO) remarketed by SunTrust and other agents. VRDOs are municipal securities, which are remarketed by the agent on a regular basis, usually weekly. In the event that the securities are unable to be remarketed, the Bank would fund under the letters of credit.
The Company has a contingency funding plan that stress tests liquidity needs that may arise from certain events such as agency rating downgrades, rapid loan growth, or significant deposit runoff. The plan also provides for continual monitoring of net borrowed funds dependence and available sources of liquidity. Management believes the Company has the funding capacity to meet the liquidity needs arising from potential events. In addition to pledgeable securities, SunTrust maintains borrowing capacity through the Federal Reserve Discount Window and the Federal Home Loan Bank of Atlanta secured with loans and marketable securities. As of December 31, 2002, SunTrust Bank had approximately $6.9 billion available borrowing capacity through the Federal Reserve Discount Window and approximately $6.0 billion available borrowing capacity at the Federal Home Loan Bank of Atlanta.
Certain provisions of long-term debt agreements and Holding Company lines of credit prevent the Company from creating liens on, disposing of, or issuing (except to related parties) voting stock of subsidiaries. Further, there are restrictions on mergers, consolidations, certain leases, sales or transfers of assets, and minimum shareholders’ equity ratios. As of December 31, 2002, the Company was in compliance with all covenants and provisions of these agreements.
TABLE 15 Composition Of Average Deposits
| | Year Ended December 31 | | Percent of Total | |
| |
| |
| |
(Dollars in millions) | | 2002 | | 2001 | | 2000 | | 2002 | | 2001 | | 2000 | |
| | |
| |
| |
| |
| |
| |
| |
| Noninterest-bearing | | $ | 15,268.1 | | $ | 13,491.1 | | $ | 13,177.5 | | | 21.5 | % | | 20.9 | % | | 19.8 | % |
| NOW accounts | | | 10,315.4 | | | 8,471.3 | | | 8,035.4 | | | 14.5 | | | 13.1 | | | 12.0 | |
| Money Market accounts | | | 20,470.9 | | | 15,830.1 | | | 12,093.6 | | | 28.8 | | | 24.5 | | | 18.2 | |
| Savings | | | 6,310.0 | | | 6,066.6 | | | 6,434.2 | | | 8.9 | | | 9.4 | | | 9.6 | |
| Consumer time | | | 9,342.4 | | | 9,092.6 | | | 9,935.5 | | | 13.1 | | | 14.1 | | | 14.9 | |
| Other time | | | 3,722.8 | | | 3,823.9 | | | 4,085.3 | | | 5.2 | | | 5.9 | | | 6.1 | |
| | |
|
| |
|
| |
|
| |
|
| |
|
| |
|
| |
| Total consumer and commercial deposits | | | 65,429.6 | | | 56,775.6 | | | 53,761.5 | | | 92.0 | | | 87.9 | | | 80.6 | |
| Brokered deposits | | | 2,537.2 | | | 2,617.7 | | | 3,308.7 | | | 3.6 | | | 4.1 | | | 5.0 | |
| Foreign deposits | | | 3,190.4 | | | 5,175.4 | | | 9,621.7 | | | 4.4 | | | 8.0 | | | 14.4 | |
| | |
|
| |
|
| |
|
| |
|
| |
|
| |
|
| |
| Total deposits | | $ | 71,157.2 | | $ | 64,568.7 | | $ | 66,691.9 | | | 100.0 | % | | 100.0 | % | | 100.0 | % |
| | |
|
| |
|
| |
|
| |
|
| |
|
| |
|
| |
TABLE 16 Funds Purchased And Securities Sold Under Agreements To Repurchase1
| | | | | | | | | | | | | | Maximum
Outstanding
at Any
Month-End | |
| | At December 31 | | Daily Average | | |
| |
| |
| | |
(Dollars in millions) | | Balance | | Rate | | Balance | | Rate | | |
| |
| |
| |
| |
| |
| |
| 2002 | | $ | 10,402.5 | | | 1.01 | % | $ | 10,376.2 | | | 1.35 | % | $ | 12,701.9 | |
| 2001 | | | 10,104.3 | | | 1.46 | | | 11,283.6 | | | 3.65 | | | 13,546.6 | |
| 2000 | | | 10,895.9 | | | 5.04 | | | 10,754.4 | | | 6.06 | | | 12,451.4 | |
| | |
|
| |
|
| |
|
| |
|
| |
|
| |
1 | Consists of federal funds purchased and securities sold under agreements to repurchase that mature either overnight or at a fixed maturity generally not exceeding three months. Rates on overnight funds reflect current market rates. Rates on fixed maturity borrowings are set at the time of borrowings. |
Funds Purchased And Securities Sold Under Agreements To Repurchase
Average funds purchased decreased $907.4 million or 8.0% in 2002, as the Company benefited from initiatives to grow retail deposits, which reduced its reliance on short-term funding sources.
SunTrust 2002 Annual Report | 35 | management’s discussion |
management’s discussion
Deposits
Average consumer and commercial deposits increased $8,654.0 million, or 15.2%, in 2002 and comprised 92.0%, 87.9% and 80.6% of average total deposits in 2002, 2001 and 2000, respectively. The acquisition of Huntington-Florida contributed $3,835.4 million of the growth in consumer and commercial deposits. The remaining growth was primarily due to initiatives to grow retail deposits and reduce reliance on wholesale funding. Specifically, money market accounts increased 29.3% and brokered and foreign deposits decreased 26.5% compared to 2001. The continued uncertainty of the financial markets contributed to the success of this initiative.
Capital Resources
SunTrust’s primary regulator, the Federal Reserve Board, measures capital adequacy within a framework that makes capital sensitive to the risk profiles of individual banking institutions. The guidelines weight assets and off balance sheet risk exposures (risk weighted assets) according to predefined classifications, creating a base from which to compare capital levels. Tier 1 Capital primarily includes realized equity and qualified preferred instruments, less purchase accounting intangibles such as goodwill and core deposit intangibles. Total Capital consists of Tier 1 Capital and Tier 2 Capital, which includes qualifying portions of subordinated debt, allowance for loan loss up to a maximum of 1.25% of risk weighted assets, and 45% of the unrealized gain on equity securities.
The Company and subsidiary banks are subject to minimum Tier 1 Risk-Based Capital and Total Capital ratios of 4% and 8%, respectively, of risk weighted assets. To be considered “well-capitalized,” ratios of 6% and 10%, respectively, are needed. Additionally, the Company and the Banks are subject to Tier 1 Leverage ratio requirements, which measures Tier 1 Capital against average assets for the quarter. The minimum and well-capitalized ratios are 3% and 5%, respectively. As of December 31, 2002, SunTrust Banks, Inc. had Tier 1, Total Capital and Tier 1 Leverage ratios of 7.47%, 11.62%, and 7.30%, respectively. SunTrust is committed to remaining well capitalized.
SunTrust manages capital through dividends and share repurchases authorized by the Company’s Board of Directors. Historically, SunTrust has generally maintained a dividend payout ratio of between 30-35%. The Company’s capital needs are assessed based on expected growth and the current economic climate. In 2002, the Company repurchased 5.7 million shares or $341 million, compared to 8.2 million shares, or $551 million, repurchased in 2001. Shares issued under various compensation programs of 1.0 million in 2002 and 2001 partially offset these amounts. As of December 31, 2002, the Company was authorized to purchase up to 9.5 million shares under current Board resolutions.
In 2002, the Company raised $350 million of Tier 1 regulatory capital through the sale of preferred shares issued by a real estate investment trust subsidiary. In 2001, the Company raised $600 million of Tier 1 regulatory capital through the issuance of Trust Preferred Securities.
The Company raises subordinated debt as part of managing the Total Capital regulatory ratios. SunTrust Bank issued $500 million and $1 billion in subordinated debt in 2002 and 2001, respectively, under its Global Bank Note program. There is $8.5 billion remaining under its Global Bank Note program to issue senior or subordinated debt. SunTrust Banks, Inc. has $1 billion remaining on its current shelf registration for either senior or subordinated debt.
In January 2003, the FASB issued FIN No. 46, “Consolidation of Variable Interest Entities,” which addresses the criteria for consolidation of entities similar to Three Pillars. SunTrust believes that Three Pillars, as currently structured, would be consolidated. If consolidated, Three Pillars would not have a material impact on the results of operations of the Company and would have an estimated 19 basis point and 29 basis point impact on Tier 1 and total capital, respectively. The Company is in the process of reviewing Three Pillars’ current operations to determine the most optimal operating structure given these new rules.
TABLE 17 Capital Ratios
| | At December 31 | |
| |
| |
(Dollars in millions) | | 2002 | | 2001 | | 2000 | | 1999 | | 1998 | | 1997 | |
| |
| |
| |
| |
| |
| |
| |
Tier 1 capital1 | | $ | 8,106.1 | | $ | 7,994.2 | | $ | 6,850.6 | | $ | 6,579.6 | | $ | 6,586.5 | | $ | 5,587.2 | |
| Total capital | | | 12,609.8 | | | 12,144.2 | | | 10,488.9 | | | 9,939.1 | | | 10,307.9 | | | 8,608.2 | |
| Risk-weighted assets | | | 108,501.1 | | | 99,700.9 | | | 96,656.7 | | | 87,866.1 | | | 80,586.4 | | | 69,503.3 | |
| Risk-based ratios | | | | | | | | | | | | | | | | | | | |
| | Tier 1 capital | | | 7.47 | % | | 8.02 | % | | 7.09 | % | | 7.48 | % | | 8.17 | % | | 8.04 | % |
| | Total capital | | | 11.62 | | | 12.18 | | | 10.85 | | | 11.31 | | | 12.79 | | | 12.39 | |
| Tier 1 leverage ratio | | | 7.30 | | | 7.94 | | | 6.98 | | | 7.17 | | | 7.68 | | | 7.70 | |
| Total shareholders’ equity to assets | | | 7.47 | | | 7.98 | | | 7.95 | | | 8.00 | | | 8.78 | | | 8.83 | |
| | |
|
| |
|
| |
|
| |
|
| |
|
| |
|
| |
1 | Tier 1 capital includes trust preferred obligations of $1,650 million at the end of 2002 and 2001, $1,050 million at the end of 2000, 1999 and 1998, respectively. Tier 1 capital also includes preferred shares issued by a real estate investment trust subsidiary of $450, $100 and $100 million at the end of 2002, 2001 and 2000, respectively. |
management’s discussion | 36 | SunTrust 2002 Annual Report |
TABLE 18 Loan Maturity
| | At December 31, 2002
Remaining Maturities of Selected Loans | |
| |
| |
(In millions) | | Total | | Within
1 Year | | 1–5
Years | | After
5 Years | |
| |
| |
| |
| |
| |
Loan Maturity | | | | | | | | | | | | | |
Commercial1 | | $ | 25,842.3 | | $ | 12,267.3 | | $ | 9,613.5 | | $ | 3,961.5 | |
| Real estate – construction | | | 4,002.4 | | | 1,810.9 | | | 950.5 | | | 1,241.0 | |
| | |
|
| |
|
| |
|
| |
|
| |
| | Total | | $ | 29,844.7 | | $ | 14,078.2 | | $ | 10,564.0 | | | 5,202.5 | |
| | |
|
| |
|
| |
|
| |
|
| |
Interest Rate Sensitivity | | | | | | | | | | | | | |
| Selected loans with: | | | | | | | | | | | | | |
| | Predetermined interest rates | | | | | | | | $ | 1,642.3 | | $ | 2,039.4 | |
| | Floating or adjustable interest rates | | | | | | | | | 8,921.7 | | | 3,163.1 | |
| | |
|
| |
|
| |
|
| |
|
| |
| | Total | | | | | | | | $ | 10,564.0 | | $ | 5,202.5 | |
| | |
|
| |
|
| |
|
| |
|
| |
| | | | | | | | | | | | | | | |
1 Excludes $2,851.3 million in lease financing.
Market Risk Management
Market risk refers to potential losses arising from changes in interest rates, foreign exchange rates, equity prices, commodity prices and other relevant market rates or prices.
Interest rate risk, defined as the exposure of net interest income and Economic Value of Equity (EVE) to adverse movements in interest rates, is SunTrust’s primary market risk, and mainly arises from the structure of the balance sheet (non-trading activities). SunTrust is also exposed to market risk in its trading activities, mortgage servicing rights, mortgage warehouse and pipeline, and equity holdings of The Coca-Cola Company common stock. The Asset/Liability Committee (ALCO) meets regularly and is responsible for reviewing the interest-rate sensitivity position of the Company and establishing policies to monitor and limit exposure to interest rate risk. The policies established by ALCO are reviewed and approved by the Company’s Board of Directors.
Market Risk from Non-Trading Activities
The primary goal of interest rate risk management is to control exposure to interest rate risk, both within policy limits approved by the Board and within narrower guidelines established by ALCO. These limits and guidelines reflect SunTrust’s tolerance for interest rate risk over both short-term and long-term horizons.
The major sources of the Company’s non-trading interest rate risk are timing differences in the maturity and repricing characteristics of assets and liabilities, changes in relationships between rate indices (basis risk), changes in the shape of the yield curve, and the potential exercise of explicit or embedded options. SunTrust measures these risks and their impact by identifying and quantifying exposures through use of sophisticated simulation and valuation models, as well as repricing gap analysis.
The primary method that SunTrust uses to quantify and manage interest rate risk is simulation analysis, which is used to model net interest income from assets, liabilities, and derivative positions over a specified time period under various interest rate scenarios and balance sheet structures. This analysis measures the sensitivity of net interest income over a relatively short time horizon (two years). Key assumptions in the simulation analysis (and in the valuation analysis discussed below) relate to the behavior of interest rates and spreads, the changes in product balances and the behavior of loan and deposit customers in different rate environments. Material assumptions include the repricing characteristics and balance fluctuations of indeterminate, or non-contractual, deposits.
As the future path of interest rates cannot be known in advance, management uses simulation analysis to project net interest income under various interest rate scenarios including expected, or “most likely,” as well as deliberately extreme and perhaps unlikely, scenarios. The analyses may include rapid ramping of interest rates, gradual ramping of interest rates, spread narrowing and widening, and yield curve twists. Usually, each analysis incorporates what management believes to be the most appropriate assumptions about customer behavior in an interest rate scenario, but in some analyses, assumptions are deliberately changed to test the Company’s exposure to a specified event or set of events. Specific strategies are also analyzed to determine their impact on net interest income levels and sensitivities.
The following table reflects the estimated change in net interest income as a percent of net interest income forecasted under stable rates for the next twelve months due to a gradual change in interest rates (25 basis points per quarter). Estimated changes set forth below are dependent on material assumptions such as those previously discussed.
Estimated Changes in Net Interest Income
Rate Change
(Basis Points) | | Estimated % Change in
Net Interest Income Over 12 Months | |
| |
| |
| | 2002 | | 2001 | |
| | |
| |
| |
| +100 | | | 0.6 | % | | 0.3 | % |
| -100 | | | -0.9 | % | | -0.4 | % |
As indicated, a gradual 100 basis point decrease in interest rates would reduce net interest income, but by an amount that is within the policy limits. A gradual 100 basis point increase would tend to enhance net interest income. Thus, the Company’s interest rate sensitivity position is modestly asset-sensitive. While simulations of more rapid changes in interest rates indicate more adverse changes in net interest income, the Company is still within the policy limits.
Estimated net interest income exposures at December 31, 2002 differ from those at year-end 2001, reflecting changes in the balance sheet, economic environment, and level of interest rates. The increase in the asset sensitive position from 2001 reflects the continued restructuring of the securities available
SunTrust 2002 Annual Report | 37 | management’s discussion |
management’s discussion
for sale portfolio in 2002, which had the effect of reducing the duration of the portfolio, as well as significant growth of low rate customer deposits (DDA and NOW’s) that would not reprice or reprice very slowly in a rising rate environment.
SunTrust also performs valuation analysis, which is used for discerning levels of risk present in the balance sheet and derivative positions that might not be taken into account in the net interest income simulation analysis. Whereas net interest income simulation highlights exposures over a relatively short time horizon, valuation analysis incorporates all cash flows over the estimated remaining life of all balance sheet and derivative positions. The valuation of the balance sheet, at a point in time, is defined as the discounted present value of asset cash flows and derivative cash flows minus the discounted value of liability cash flows, the net of which is referred to as EVE. The sensitivity of EVE to changes in the level of interest rates is a measure of the longer-term repricing risk and options risk embedded in the balance sheet. In contrast to the net interest income simulation, which assumes interest rates will change over a period of time, EVE uses instantaneous changes in rates. EVE values only the current balance sheet, and does not incorporate the growth assumptions that are used in the net interest income simulation model. As with the net interest income simulation model, assumptions about the timing and variability of balance sheet cash flows are critical in the EVE analysis. Particularly important are the assumptions driving prepayments and the expected changes in balances and pricing of the indeterminate deposit portfolios. As of December 31, 2002, an instantaneous 100 basis point increase in rates is estimated to increase the EVE 2.7% versus the EVE in a stable rate environment. An instantaneous 100 basis point decrease in rates is estimated to decrease the EVE 7.2% versus the EVE in a stable rate environment. These changes are within the established policy limits. As of December 31, 2001, these estimates were a 0.5% increase and a 2.7% decrease, respectively.
While an instantaneous and severe shift in interest rates is used in this analysis to provide an estimate of exposure under an extremely adverse scenario, management believes that a gradual shift in interest rates would have a much more modest impact. Since EVE measures the discounted present value of cash flows over the estimated lives of instruments, the change in EVE does not directly correlate to the degree that earnings would be impacted over a shorter time horizon, i.e. the next fiscal year. Further, EVE does not take into account factors such as future balance sheet growth, changes in product mix, changes in yield curve relationships, and changing product spreads that could mitigate the adverse impact of changes in interest rates.
Estimated EVE exposures at December 31, 2002 are larger than at year-end 2001. As indicated earlier, the very low level of rates magnify certain exposures. A sharp decline in rates substantially increases the prepayment of residential mortgages and mortgage-backed securities, which reduces the market value appreciation they otherwise would have. Further, a sharp decline in rates would increase the market value of certain liabilities, such as customer deposits and longer-term borrowings, which would negatively impact EVE.
The net interest income simulation and valuation analyses do not necessarily include certain actions that management may undertake to manage this risk in response to anticipated changes in interest rates.
Trading Activities
Most of the Company’s trading activities are designed to provide capital markets services to customers and not to position the Company’s portfolio for gains from market movements. In order to accommodate customers, an inventory of capital markets instruments is carried, and access to market liquidity is maintained by making bid-offer prices to other market makers. Trading activities are confined to financial instruments and derivatives. The Company participates in derivatives and foreign exchange trading as well as underwriting and market making in equity securities as an accommodation to customers. Cash instruments are bought and sold to satisfy customer investment needs. Derivative contracts are initially entered into to meet the customer risk management needs. The Company enters into subsequent transactions to manage the level of risk in accordance with approved limits.
The Company has developed policies and procedures to manage market risk associated with trading, capital markets and foreign exchange activities using a value-at-risk (VaR) approach that combines interest rate risk, equity risk, foreign exchange risk, spread risk and volatility risk. For trading portfolios, VaR measures the maximum fair value the Company could lose on a trading position, given a specified confidence level and time horizon. VaR limits and exposures are monitored daily for each significant trading portfolio. The Company’s VaR calculation measures the potential losses in fair value using a 99% confidence level. This equates to 2.33 standard deviations from the mean under a normal distribution. This means that, on average, daily profits and losses are expected to exceed VaR one out of every 100 overnight trading days. The VaR methodology includes holding periods for each position based upon an assessment of relative trading market liquidity. For the Foreign Exchange and Derivatives desks, the Company estimates VaR by applying the Monte Carlo simulation platform as designed by RiskMetrics™, and for the estimate of the Fixed Income desks’ VaR, the Company uses Bloomberg™ analytics. The Company uses internally developed methodology to estimate VaR for the Equity Structured Products and Loan Trading Desks.
The estimated average combined VaR of all trading operations using this measurement was $2.4 million for 2002 and $1.6 million for 2001. The trading account asset balance on average was $1.6 billion for 2002 and $1.3 billion for 2001. The estimated combined period-end VaR was $1.4 million at December 31, 2002 and $1.9 million at December 31, 2001. The trading account asset balance was $1.7 billion for the period ended December 31, 2002 and $1.3 billion for the period ended December 31, 2001.
Other Market Risk
Other sources of market risk include mortgage servicing rights (MSRs) and the risk associated with holding mortgage loans prior to selling them (mortgage warehouse) into the secondary market, and commitments to customers to make mortgage loans (mortgage pipeline) that will be sold to the secondary market.
The value of the MSR asset is highly dependent upon the assumed prepayment speed of the mortgage portfolio. Future expected net cash flows from servicing a loan in the servicing portfolio would not be realized if the loan pays off earlier than anticipated. MSRs are the discounted present value of future net cash flows that are expected to be received from the servicing portfolio. Accordingly, prepayment risk subjects the MSR to impairment risk. The Company
management’s discussion | 38 | SunTrust 2002 Annual Report |
does not specifically hedge the MSR asset for the potential impairment risk. The fair value determination, key economic assumptions and the sensitivity of the current fair value of the MSRs as of December 31, 2002 is discussed in greater detail in Note 13.
The Company hedges the risks associated with the mortgage warehouse and pipeline. The mortgage warehouse and pipeline consist primarily of fixed and adjustable-rate single family residential real estate loans. The risk associated with the mortgage warehouse and pipeline is the potential change in interest rates between the time the customer locks in the rate on the loan and the time the loan is sold. This period is usually 90-150 days. To hedge this risk, forward sales agreements and option contracts are executed. The Company has set exposure limits on the risk associated with the changes in market value of the mortgage warehouse and pipeline. The limit is based on a percentage of the aggregate mortgage warehouse and pipeline for price movements within two standard deviations.
The Company is also subject to risk from changes in equity prices that arise from owning The Coca-Cola Company common stock. SunTrust owns 48,266,496 shares of common stock of The Coca-Cola Company, which had a carrying value of $2.1 billion at December 31, 2002. A 10% decrease in share price of The Coca-Cola Company common stock at December 31, 2002 would result in a decrease, net of deferred taxes, of approximately $134 million in accumulated other comprehensive income.
TABLE 19 Maturity Distribution Of Debt Securities Available For Sale
| | At December 31, 2002 | |
| |
| |
(Dollars in millions) | | 1 Year
or Less | | 1–5
Years | | 5–10
Years | | After 10
Years | | Total | | Average
Maturity
in Years | |
| |
| |
| |
| |
| |
| |
| |
Distribution of Maturities: | | | | | | | | | | | | | | | | | | | |
Amortized Cost | | | | | | | | | | | | | | | | | | | |
| U.S. Treasury and other U.S. government agencies and corporations | | $ | 392.6 | | $ | 3,183.3 | | $ | 24.2 | | $ | 1.5 | | $ | 3,601.6 | | | 1.9 | |
| States and political subdivisions | | | 47.0 | | | 172.0 | | | 158.0 | | | 21.5 | | | 398.5 | | | 4.7 | |
Asset-backed securities1 | | | 456.6 | | | 3,896.6 | | | 125.0 | | | — | | | 4,478.2 | | | 2.7 | |
Mortgage-backed securities1 | | | 4,526.9 | | | 4,541.2 | | | 353.2 | | | 45.9 | | | 9,467.2 | | | 1.8 | |
| Corporate bonds | | | 26.9 | | | 1,211.0 | | | 140.0 | | | 545.6 | | | 1,923.5 | | | 9.2 | |
| | |
|
| |
|
| |
|
| |
|
| |
|
| |
|
| |
| | Total debt securities | | $ | 5,450.0 | | $ | 13,004.1 | | $ | 800.4 | | $ | 614.5 | | $ | 19,869.0 | | | 2.8 | |
| | |
|
| |
|
| |
|
| |
|
| |
|
| |
|
| |
Fair Value | | | | | | | | | | | | | | | | | | | |
| U.S. Treasury and other U.S. government agencies and corporations | | $ | 397.6 | | $ | 3,259.0 | | $ | 25.8 | | $ | 1.6 | | $ | 3,684.0 | | | | |
| States and political subdivisions | | | 47.6 | | | 181.1 | | | 166.0 | | | 24.3 | | | 419.0 | | | | |
Asset-backed securities1 | | | 459.5 | | | 3,931.8 | | | 126.9 | | | — | | | 4,518.2 | | | | |
Mortgage-backed securities1 | | | 4,590.4 | | | 4,622.0 | | | 363.5 | | | 46.2 | | | 9,622.1 | | | | |
| Corporate bonds | | | 27.2 | | | 1,241.9 | | | 152.0 | | | 508.6 | | | 1,929.7 | | | | |
| | |
|
| |
|
| |
|
| |
|
| |
|
| | | | |
| | Total debt securities | | $ | 5,522.3 | | $ | 13,235.8 | | $ | 834.2 | | $ | 580.7 | | $ | 20,173.0 | | | | |
| | |
|
| |
|
| |
|
| |
|
| |
|
| | | | |
Weighted Average Yield (FTE): | | | | | | | | | | | | | | | | | | | |
| U.S. Treasury and other U.S. government agencies and corporations | | | 3.01 | % | | 3.17 | % | | 5.06 | % | | 8.00 | % | | 3.17 | % | | | |
| States and political subdivisions | | | 7.18 | | | 6.79 | | | 7.24 | | | 6.92 | | | 7.01 | | | | |
Asset-backed securities1 | | | 2.95 | | | 2.57 | | | 3.11 | | | — | | | 2.62 | | | | |
Mortgage-backed securities1 | | | 3.64 | | | 4.48 | | | 5.18 | | | 4.31 | | | 4.10 | | | | |
| Corporate bonds | | | 6.12 | | | 4.98 | | | 6.70 | | | 3.77 | | | 4.78 | | | | |
| | |
|
| |
|
| |
|
| |
|
| |
|
| | | | |
| | Total debt securities | | | 3.58 | % | | 3.66 | % | | 5.53 | % | | 4.08 | % | | 3.73 | % | | | |
| | | |
|
| |
|
| |
|
| |
|
| |
|
| | | | |
| | | | | | | | | | | | | | | | | | | | | |
1 Distribution of maturities is based on the expected average life of the asset.
TABLE 20 Maturity Of Consumer Time And Other Time Deposits In Amounts Of $100,000 Or More
| | At December 31, 2002 | |
| |
| |
(In millions) | | Consumer
Time | | Brokered
Time | | Foreign
Time | | Other
Time | | Total | |
| |
| |
| |
| |
| |
| |
Months to Maturity | | | | | | | | | | | | | | | | |
| 3 or less | | $ | 1,444.6 | | $ | 700.0 | | $ | 6,310.0 | | $ | 86.2 | | $ | 8,540.8 | |
| Over 3 through 6 | | | 483.8 | | | 875.0 | | | — | | | — | | | 1,358.8 | |
| Over 6 through 12 | | | 576.1 | | | 500.0 | | | — | | | — | | | 1,076.1 | |
| Over 12 | | | 1,149.7 | | | 1,094.8 | | | — | | | — | | | 2,244.5 | |
| | |
|
| |
|
| |
|
| |
|
| |
|
| |
| | Total | | $ | 3,654.2 | | $ | 3,169.8 | | $ | 6,310.0 | | $ | 86.2 | | $ | 13,220.2 | |
| | |
|
| |
|
| |
|
| |
|
| |
|
| |
| | | | | | | | | | | | | | | | | |
SunTrust 2002 Annual Report | 39 | management’s discussion |
management’s discussion
Derivative Instruments
The Company monitors its sensitivity to changes in interest rates and may use derivative instruments to limit the volatility of net interest income. Derivative instruments decreased net interest income in 2002 and 2001 by $50.4 and $37.4 million, respectively.
The Company adopted SFAS No. 133 “Accounting for Derivative Instruments and Hedging Activities,” as amended, on January 1, 2001. In accordance with the transition provisions of SFAS No. 133, the following net-of-tax effect on earnings and equity was recorded in January 2001:
Earnings increased $1.6 million |
• | $16.6 million gain for the fair value adjustment on fair-value hedging instruments |
• | $16.6 million loss for the fair value adjustment on related hedged assets and liabilities |
• | $0.4 million gain for the fair value on the mortgage pipeline |
• | $1.2 million gain for the derecognition of a previously deferred gain |
Equity (Other Comprehensive Income) |
• | $10.6 million loss from cash flow hedging instruments |
For a detailed discussion of the impact of SFAS No. 133 on Accumulated Other Comprehensive Income see Note 24.
The following tables summarize the derivative instruments entered into by the Company as an end-user. See Note 18 for a complete description of the derivative instruments and activity for 2002 and 2001.
TABLE 21 Risk Management Derivative Financial Instruments1
| | As of December 31, 2002 | |
| |
| |
(In thousands) | | Notional
Amount | | Unrealized
Gains7 | | Unrealized
Losses7 | | Equity8 | | Average
Maturity
in Years | |
| |
| |
| |
| |
| |
| |
Asset Hedges | | | | | | | | | | | | | | | | |
| Cash flow hedges | | | | | | | | | | | | | | | | |
| | Equity collar 2 | | $ | 56,081 | | $ | 425 | | $ | — | | $ | 276 | | | 0.25 | |
| Fair value hedges | | | | | | | | | | | | | | | | |
| | Interest rate swaps3 | | | 25,000 | | | — | | | (1,106 | ) | | — | | | 1.82 | |
| | Forward contracts4 | | | 6,285,580 | | | — | | | (79,433 | ) | | — | | | 0.08 | |
| | |
|
| |
|
| |
|
| |
|
| |
|
| |
| | Total asset hedges | | $ | 6,366,661 | | $ | 425 | | $ | (80,539 | ) | $ | 276 | | | 0.09 | |
| | |
|
| |
|
| |
|
| |
|
| |
|
| |
Liability Hedges | | | | | | | | | | | | | | | | |
| Cash flow hedges | | | | | | | | | | | | | | | | |
| | Interest rate swaps5 | | $ | 2,345,000 | | $ | — | | $ | (72,340 | ) | $ | (47,021 | ) | | 0.91 | |
| Fair value hedges | | | | | | | | | | | | | | | | |
| | Interest rate swaps6 | | | 2,525,000 | | | 157,912 | | | — | | | — | | | 9.32 | |
| | |
|
| |
|
| |
|
| |
|
| |
|
| |
| | Total liability hedges | | $ | 4,870,000 | | $ | 157,912 | | $ | (72,340 | ) | $ | (47,021 | ) | | 5.27 | |
| | | |
|
| |
|
| |
|
| |
|
| |
|
| |
| | | | | | | | | | | | | | | | | | |
1 | Includes only derivative financial instruments related to risk management of exposure to interest rates and equity price movements. All of the Company’s other derivative instruments are classified as trading. All of the interest rate swaps have variable pay or receive rates based on one-to-six month LIBOR or the average federal funds rate, and they are the pay or receive rates in effect at December 31, 2002. |
2 | Represents a zero cost equity collar designated as a cash flow hedge of the forecasted sale of equity securities. |
3 | Interest rate swaps are designated as fair value hedges of fixed rate loans. |
4 | Forward contracts are designated as fair value hedges of mortgage loans in the warehouse. |
5 | Represents interest rate swaps designated as cash flow hedges of floating rate certificates of deposit. |
6 | Interest rate swaps designated as fair value hedges of trust preferred securities, subordinated notes and fixed rate certificates of deposit. |
7 | Represents the fair value of derivative financial instruments less accrued interest receivable or payable. |
8 | At December 31, 2002, the net unrealized loss on derivatives included in accumulated other comprehensive income, which is a component of stockholders’ equity, was $46.7 million, net of tax, that represents the effective portion of the net gains and losses on derivatives that qualify as cash flow hedges. Gains or losses on hedges of interest rate risk will be classified into interest income or expense as a yield adjustment of the hedged item in the same period that the hedged cash flows impact earnings. Hedges of noninterest rate risks will be classified into other income or expense upon occurrence of the forecasted transaction. As of December 31, 2002, $37.8 million of net losses, net of income taxes, recorded in accumulated other comprehensive income are expected to be reclassified as interest expense during the next twelve months. |
management’s discussion | 40 | SunTrust 2002 Annual Report |
| | As of December 31, 2001 | |
| |
| |
(In thousands) | | Notional
Amount | | Unrealized
Gains | | Unrealized
Losses | | Equity | | Average
Maturity
in Years | |
| |
| |
| |
| |
| |
| |
Asset Hedges | | | | | | | | | | | | | | | | |
| Cash flow hedges | | | | | | | | | | | | | | | | |
| | Equity collar | | $ | 56,081 | | $ | — | | $ | — | | $ | — | | | 1.24 | |
| Fair value hedges | | | | | | | | | | | | | | | | |
| | Interest rate swaps | | | 25,000 | | | 6 | | | — | | | — | | | 2.82 | |
| | Forward contracts | | | 3,707,988 | | | 51,160 | | | — | | | — | | | 0.12 | |
| | |
|
| |
|
| |
|
| |
|
| |
|
| |
| | Total asset hedges | | $ | 3,789,069 | | $ | 51,166 | | $ | — | | $ | — | | | 0.15 | |
| | |
|
| |
|
| |
|
| |
|
| |
|
| |
Liability Hedges | | | | | | | | | | | | | | | | |
| Cash flow hedges | | | | | | | | | | | | | | | | |
| | Interest rate swaps | | $ | 3,470,000 | | $ | — | | $ | (85,736 | ) | $ | (55,728 | ) | | 1.47 | |
| Fair value hedges | | | | | | | | | | | | | | | | |
| | Interest rate swaps | | | 750,000 | | | 69,954 | | | — | | | — | | | 14.69 | |
| | |
|
| |
|
| |
|
| |
|
| |
|
| |
| | Total liability hedges | | $ | 4,220,000 | | $ | 69,954 | | $ | (85,736 | ) | $ | (55,728 | ) | | 3.82 | |
| | | |
|
| |
|
| |
|
| |
|
| |
|
| |
| | | | | | | | | | | | | | | | | | |
The following table presents the expected maturities of risk management derivative financial instruments:
| | As of December 31, 2002 | |
| |
| |
(In thousands) | | 1 Year
or Less | | 1–2
Years | | 2–5
Years | | 5–10
Years | | After 10
Years | | Total | |
| |
| |
| |
| |
| |
| |
| |
Cash Flow Asset Hedges | | | | | | | | | | | | | | | | | | | |
| Notional amount – swaps | | $ | — | | $ | — | | $ | — | | $ | — | | $ | — | | $ | — | |
| Notional amount – other | | | 56,081 | | | — | | | — | | | — | | | — | | | 56,081 | |
Weighted average receive rate1 | | | — | | | — | | | — | | | — | | | — | | | — | |
Weighted average pay rate1 | | | — | | | — | | | — | | | — | | | — | | | — | |
| Unrealized gain | | | 425 | | | — | | | — | | | — | | | — | | | 425 | |
| | |
|
| |
|
| |
|
| |
|
| |
|
| |
|
| |
Fair Value Asset Hedges | | | | | | | | | | | | | | | | | | | |
| Notional amount – swaps | | | — | | | 25,000 | | | — | | | — | | | — | | | 25,000 | |
| Notional amount – forwards | | | 6,285,580 | | | — | | | — | | | — | | | — | | | 6,285,580 | |
Weighted average receive rate1 | | | — | | | 2.58 | % | | — | | | — | | | — | | | 2.58 | % |
Weighted average pay rate1 | | | — | | | 4.97 | % | | — | | | — | | | — | | | 4.97 | % |
| Unrealized loss | | | (79,433 | ) | | (1,106 | ) | | — | | | — | | | — | | | (80,539 | ) |
| | |
|
| |
|
| |
|
| |
|
| |
|
| |
|
| |
Cash Flow Liability Hedges | | | | | | | | | | | | | | | | | | | |
| Notional amount – swaps | | | 1,250,000 | | | 1,095,000 | | | — | | | — | | | — | | | 2,345,000 | |
| Notional amount – other | | | — | | | — | | | — | | | — | | | — | | | — | |
Weighted average receive rate1 | | | 1.42 | % | | 1.60 | % | | — | | | — | | | — | | | 1.51 | % |
Weighted average pay rate1 | | | 4.79 | % | | 4.91 | % | | — | | | — | | | — | | | 4.85 | % |
| Unrealized loss | | | (21,799 | ) | | (50,541 | ) | | — | | | — | | | — | | | (72,340 | ) |
| | |
|
| |
|
| |
|
| |
|
| |
|
| |
|
| |
Fair Value Liability Hedges | | | | | | | | | | | | | | | | | | | |
| Notional amount – swaps | | | 825,000 | | | — | | | 750,000 | | | — | | | 950,000 | | | 2,525,000 | |
| Notional amount – other | | | — | | | — | | | — | | | — | | | — | | | — | |
Weighted average receive rate1 | | | 1.23 | % | | — | | | 6.33 | % | | — | | | 6.23 | % | | 4.63 | % |
Weighted average pay rate1 | | | 1.25 | % | | — | | | 1.73 | % | | — | | | 1.66 | % | | 1.55 | % |
| Unrealized gain | | | — | | | — | | | 93,521 | | | — | | | 64,391 | | | 157,912 | |
| | |
|
| |
|
| |
|
| |
|
| |
|
| |
|
| |
1 | All of the interest rate swaps have variable pay or receive rates based on one-to-six month LIBOR or average federal funds rate, and they are the pay or receive rates in effect at December 31, 2002. |
SunTrust 2002 Annual Report | 41 | management’s discussion |
management’s discussion
The following table presents the expected maturities of risk management derivative financial instruments:
| | As of December 31, 2001 | |
| |
| |
(In thousands) | | 1 Year
or Less | | 1–2
Years | | 2–5
Years | | 5–10
Years | | After 10
Years | | Total | |
| |
| |
| |
| |
| |
| |
| |
Cash Flow Asset Hedges | | | | | | | | | | | | | | | | | | | |
| Notional amount – swaps | | $ | — | | $ | — | | $ | — | | $ | — | | $ | — | | $ | — | |
| Notional amount – other | | | — | | | 56,081 | | | — | | | — | | | — | | | 56,081 | |
| Weighted average receive rate | | | — | | | — | | | — | | | — | | | — | | | — | |
| Weighted average pay rate | | | — | | | — | | | — | | | — | | | — | | | — | |
| Unrealized gain (loss) | | | — | | | — | | | — | | | — | | | — | | | — | |
| | |
|
| |
|
| |
|
| |
|
| |
|
| |
|
| |
Fair Value Asset Hedges | | | | | | | | | | | | | | | | | | | |
| Notional amount – swaps | | | — | | | — | | | 25,000 | | | — | | | — | | | 25,000 | |
| Notional amount – forwards | | | 3,707,988 | | | — | | | — | | | — | | | — | | | 3,707,988 | |
| Weighted average receive rate | | | — | | | — | | | 2.37 | % | | — | | | — | | | 2.37 | % |
| Weighted average pay rate | | | — | | | — | | | 4.97 | % | | — | | | — | | | 4.97 | % |
| Unrealized gain | | | 51,160 | | | — | | | 6 | | | — | | | — | | | 51,166 | |
| | |
|
| |
|
| |
|
| |
|
| |
|
| |
|
| |
Cash Flow Liability Hedges | | | | | | | | | | | | | | | | | | | |
| Notional amount – swaps | | | 1,125,000 | | | 1,250,000 | | | 1,095,000 | | | — | | | — | | | 3,470,000 | |
| Notional amount – other | | | — | | | — | | | — | | | — | | | — | | | — | |
| Weighted average receive rate | | | 2.19 | % | | 2.08 | % | | 2.20 | % | | — | | | — | | | 2.16 | % |
| Weighted average pay rate | | | 6.26 | % | | 4.79 | % | | 4.91 | % | | — | | | — | | | 5.31 | % |
| Unrealized loss | | | (27,396 | ) | | (32,795 | ) | | (25,545 | ) | | — | | | — | | | (85,736 | ) |
| | |
|
| |
|
| |
|
| |
|
| |
|
| |
|
| |
Fair Value Liability Hedges | | | | | | | | | | | | | | | | | | | |
| Notional amount – swaps | | | — | | | — | | | 450,000 | | | — | | | 300,000 | | | 750,000 | |
| Notional amount – other | | | — | | | — | | | — | | | — | | | — | | | — | |
| Weighted average receive rate | | | — | | | — | | | 7.18 | % | | — | | | 7.13 | % | | 7.16 | % |
| Weighted average pay rate | | | — | | | — | | | 2.19 | % | | — | | | 1.95 | % | | 2.10 | % |
| Unrealized gain | | | — | | | — | | | 38,284 | | | — | | | 31,670 | | | 69,954 | |
| | |
|
| |
|
| |
|
| |
|
| |
|
| |
|
| |
Earnings And Balance Sheet Analysis 2001 vs. 2000
Net income was $1,375.5 million in 2001 compared with $1,294.1 million in 2000, an increase of 6.3%. Diluted earnings per common share were $4.72 in 2001 and $4.30 in 2000. In 2001, SunTrust recorded an extraordinary gain of $6.3 million, net of tax, or $0.02 per diluted share, for the early extinguishments of long-term debt. Security gains of $65.1 million, net of tax, or $.22 per diluted share, were also reported in 2001 due to the repositioning of the balance sheet. After-tax merger-related expenses totaling $20.2 million, or $0.07 per diluted share, were incurred in 2001 related to the Company’s proposal to acquire the former Wachovia Corporation. Additionally in 2001, the Company recorded One Bank initiative charges of $35.5 million, net of tax, or $0.12 per diluted share related to enhancements to customer based systems that are expected to yield further operating efficiencies in the future. Merger-related charges of $27.6 million, net of tax, or $0.09 per diluted share, were incurred in 2000.
Operating results for 2001 were impacted by a slowing economy causing increased charge-offs and nonperforming assets resulting in a $141.2 million increase in the provision for loan losses. Net interest income increased $145.0 million to $3,293.4 million in 2001, compared to $3,148.4 million in 2000. Net interest margin increased 3 basis points in 2001 to 3.58%.
Net charge-offs were $272.4 million, or .39% of average loans for 2001, compared to $130.8 million, or .19% of average loans for 2000. The 2001 loan loss provision of $275.2 million was 105.4% higher than the $134.0 million recorded in 2000. These increases were primarily due to the continued economic slowdown that resulted in deterioration in some large corporate credits.
Noninterest income in 2001 was $2,155.8 million, a 21.5% increase compared to 2000. Noninterest income, excluding securities gains and losses, was $2,002.7 million, a 13.3% increase compared to 2000. This increase was driven by a $64.0 million, or 201.4%, growth in trading account profits and commissions. Also positively impacting noninterest income was a $96.1 million, or 106.7%, increase in mortgage production related income as the low rate environment led to significant refinancing activity during 2001. Negatively impacting noninterest income was a $38.9 million, or 118.5%, decrease in mortgage servicing related income due to accelerated amortization of mortgage servicing rights resulting from increased prepayments.
management’s discussion | 42 | SunTrust 2002 Annual Report |
Noninterest expense was $3,113.5 million in 2001, a 10.1% increase compared to 2000. Noninterest expense, excluding merger-related expenses, increased $327.4 million or 11.8% compared to 2000. Personnel expenses increased $137.4 million, or 8.4%, primarily attributable to increased incentive payments related to mortgage production, bonus payments from the acquisition of the institutional business of The Robinson-Humphrey Company, LLC and expenditures for the One Bank initiative. Other expenses in 2001 included $32.0 million associated with the Company’s proposal to acquire the former Wachovia Corporation. Also contributing to the increase was a $10.8 million, or 30.5%, increase in amortization of intangible assets due to the write-off of the remaining $12.7 million of goodwill associated with the sale of the assets and liabilities of SunTrust Credit Corporation during 2001.
Average earning assets increased $3.4 billion, or 3.9%. Average loans adjusted for securitizations increased 3.4% and average loans held for sale increased 103.3%. The increase in average loans held for sale was due to increased refinancing activity in 2001 as a result of the low rate environment.
Total interest bearing liabilities increased $2.6 billion, or 3.5%. Average long-term debt increased $4.5 billion compared to 2000. The increase was due to a $2.0 billion increase in Federal Home Loan Bank advances, $1.0 billion issuance under the Global Bank Note program and $600 million issuance of Trust Preferred Securities. Average consumer and commercial deposits increased 5.6%. In order to reduce its reliance on higher priced wholesale funding, the Company initiated a campaign to attract retail deposits, specifically money market accounts. As a result, average money market accounts increased 30.9% and brokered and foreign deposits decreased 39.7% compared to 2000.
Fourth Quarter Results
SunTrust reported $340.3 million, or $1.20 per diluted share, of net income for the fourth quarter of 2002 compared with $356.7 million, or $1.24 per diluted share, for the fourth quarter of 2001. Results included the following items:
• | One Bank initiative costs of $7.6 million, net of tax, or $0.03 per diluted share, and $10.0 million, net of tax, or $0.03 per diluted share, in the fourth quarter of 2002 and 2001, respectively. |
• | Net of tax securities gains of $25.7 million, or $0.09 per diluted share, and $20.8 million, or $0.07 per diluted share in the fourth quarter of 2002 and 2001, respectively. |
• | Extraordinary gain of $24.1 million, net of tax, or $0.08 per diluted share, for the early extinguishment of long-term debt in the fourth quarter of 2001. |
| Operating results for the fourth quarter of 2002 were also impacted by the following: |
• | Fully taxable net interest income increased $7.2 million, or 0.9%, and the net interest margin decreased 30 basis points from the fourth quarter of 2001 to the fourth quarter of 2002. The decrease in the net interest margin in the fourth quarter of 2002 was primarily due to continued weak loan demand resulting from the sluggish economy. Average loans, adjusted for the impact of the Huntington-Florida acquisition, were flat compared to the fourth quarter of 2001. |
• | For the fourth quarter of 2002, net charge-offs were $95.7 million, an increase of $8.3 million, or 9.5%, from the fourth quarter of 2001. The loan loss provision of $96.5 million was $8.4 million, or 9.5%, higher than the fourth quarter of 2001. These increases resulted primarily from increased consumer charge-offs due to the weakened economy. |
• | Noninterest income was $569.7 million in the fourth quarter of 2002, a 2.2% increase compared to the fourth quarter of 2001. Noninterest income, excluding securities gains and losses, was $530.2 million in the fourth quarter of 2002, a $4.5 million, or 0.9%, increase from the fourth quarter of 2001. Mortgage production related income increased $44.9 million, or 76.9%, due to significant refinancing activity in 2002, while mortgage servicing related income decreased $57.1 million, or 522.3%, due to accelerated amortization of mortgage servicing rights resulting from increased prepayments. Also driving the increase in noninterest income was a $29.1 million, or 14.5%, increase in service charges on deposit accounts and other charges and fees as SunTrust benefited from increased usage of products and services, a more consistent pricing strategy throughout the Company’s markets and a lower earnings credit rate. |
• | Noninterest expense in the fourth quarter of 2002 was $878.4 million, an increase of $48.2 million, or 5.8%, from the fourth quarter of 2001. Personnel expense grew $28.7 million, or 6.1%, from the fourth quarter of 2001, primarily as a result of increased benefits costs, the acquisitions of Huntington-Florida, the institutional business of Robinson-Humphrey and AMA Holdings, Inc. and incentive payments related to record mortgage production in the fourth quarter of 2002. Other noninterest expense in 2002 included an expense of $25.0 million related to the standardization of financial performance of the Company’s affordable housing business. |
• | Provision for income taxes was $81.6 million for the fourth quarter of 2002 compared to $139.8 million in the same period of 2001. Included in the fourth quarter of 2001 provision, the Company recorded $13.0 million in income tax expense related to the early extinguishment of long-term debt. The effective tax rate for the fourth quarter of 2002 was 19.4% compared to 28.2% for the fourth quarter of 2001. The decrease in the effective tax rate is primarily due to tax benefits realized in the fourth quarter of 2002 due to the Company standardizing the recognition of low income housing tax credits and dividends declared by a real estate investment trust subsidiary. |
SunTrust 2002 Annual Report | 43 | management’s discussion |
management’s discussion
TABLE 22 Quarterly Financial Data
(Dollars in millions
except per share data) | | 2002 | | 2001 | |
| |
| |
| |
| | 4 | | 3 | | 2 | | 1 | | 4 | | 3 | | 2 | | 1 | |
| |
| |
| |
| |
| |
| |
| |
| |
| |
Summary of Operations | | | | | | | | | | | | | | | | | | | | | | | | | |
| Interest and dividend income | | $ | 1,274.9 | | $ | 1,270.7 | | $ | 1,292.0 | | $ | 1,297.6 | | $ | 1,391.1 | | $ | 1,509.9 | | $ | 1,634.7 | | $ | 1,743.9 | |
| Interest expense | | | 447.8 | | | 465.6 | | | 478.6 | | | 499.5 | | | 571.1 | | | 706.1 | | | 810.8 | | | 939.0 | |
| | |
|
| |
|
| |
|
| |
|
| |
|
| |
|
| |
|
| |
|
| |
| Net interest income | | | 827.1 | | | 805.1 | | | 813.4 | | | 798.1 | | | 820.0 | | | 803.8 | | | 823.9 | | | 804.9 | |
| Provision for loan losses | | | 96.5 | | | 98.7 | | | 111.0 | | | 163.6 | | | 88.1 | | | 80.2 | | | 39.6 | | | 67.3 | |
| | |
|
| |
|
| |
|
| |
|
| |
|
| |
|
| |
|
| |
|
| |
| Net interest income after provision for loan losses | | | 730.6 | | | 706.4 | | | 702.4 | | | 634.5 | | | 731.9 | | | 723.6 | | | 784.3 | | | 737.6 | |
Noninterest income1 | | | 569.7 | | | 580.9 | | | 625.8 | | | 615.3 | | | 557.7 | | | 550.4 | | | 521.8 | | | 525.9 | |
Noninterest expense 2, 3, 4 | | | 878.4 | | | 808.1 | | | 818.1 | | | 837.6 | | | 830.2 | | | 776.8 | | | 763.8 | | | 742.7 | |
| | |
|
| |
|
| |
|
| |
|
| |
|
| |
|
| |
|
| |
|
| |
| Income before provision for income taxes and extraordinary items | | | 421.9 | | | 479.2 | | | 510.1 | | | 412.2 | | | 459.4 | | | 497.2 | | | 542.3 | | | 520.8 | |
| Provision for income taxes | | | 81.6 | | | 136.2 | | | 166.4 | | | 107.3 | | | 126.8 | | | 163.1 | | | 177.3 | | | 183.3 | |
| | |
|
| |
|
| |
|
| |
|
| |
|
| |
|
| |
|
| |
|
| |
| Income before extraordinary items | | | 340.3 | | | 343.0 | | | 343.7 | | | 304.9 | | | 332.6 | | | 334.1 | | | 365.0 | | | 337.5 | |
Extraordinary gain (loss),net of taxes5 | | | — | | | — | | | — | | | — | | | 24.1 | | | — | | | (17.8 | ) | | — | |
| | |
|
| |
|
| |
|
| |
|
| |
|
| |
|
| |
|
| |
|
| |
| Net income | | $ | 340.3 | | $ | 343.0 | | $ | 343.7 | | $ | 304.9 | | $ | 356.7 | | $ | 334.1 | | $ | 347.2 | | $ | 337.5 | |
| | |
|
| |
|
| |
|
| |
|
| |
|
| |
|
| |
|
| |
|
| |
| Net interest income (taxable-equivalent) | | $ | 837.3 | | $ | 815.1 | | $ | 823.1 | | $ | 807.7 | | $ | 830.1 | | $ | 813.9 | | $ | 834.1 | | $ | 815.2 | |
Per Common Share | | | | | | | | | | | | | | | | | | | | | | | | | |
| Diluted | | | | | | | | | | | | | | | | | | | | | | | | | |
| | Income before extraordinary items | | $ | 1.20 | | $ | 1.20 | | $ | 1.20 | | $ | 1.06 | | $ | 1.16 | | $ | 1.15 | | $ | 1.25 | | $ | 1.14 | |
| | Extraordinary gain (loss),net of taxes | | | — | | | — | | | — | | | — | | | 0.08 | | | — | | | (0.06 | ) | | — | |
| | |
|
| |
|
| |
|
| |
|
| |
|
| |
|
| |
|
| |
|
| |
| Net income | | | 1.20 | | | 1.20 | | | 1.20 | | | 1.06 | | | 1.24 | | | 1.15 | | | 1.19 | | | 1.14 | |
| Basic | | | | | | | | | | | | | | | | | | | | | | | | | |
| | Income before extraordinary items | | | 1.21 | | | 1.21 | | | 1.22 | | | 1.07 | | | 1.17 | | | 1.17 | | | 1.27 | | | 1.16 | |
| | Extraordinary gain (loss),net of taxes | | | — | | | — | | | — | | | — | | | 0.08 | | | — | | | (0.06 | ) | | — | |
| | |
|
| |
|
| |
|
| |
|
| |
|
| |
|
| |
|
| |
|
| |
| | Net income | | | 1.21 | | | 1.21 | | | 1.22 | | | 1.07 | | | 1.25 | | | 1.17 | | | 1.21 | | | 1.16 | |
| Dividends declared | | | 0.43 | | | 0.43 | | | 0.43 | | | 0.43 | | | 0.40 | | | 0.40 | | | 0.40 | | | 0.40 | |
| Book value | | | 31.04 | | | 31.04 | | | 31.41 | | | 29.97 | | | 28.97 | | | 28.40 | | | 27.29 | | | 26.83 | |
| Market Price: | | | | | | | | | | | | | | | | | | | | | | | | | |
| | High | | | 63.25 | | | 69.12 | | | 70.20 | | | 68.47 | | | 67.93 | | | 72.35 | | | 66.38 | | | 68.07 | |
| | Low | | | 51.48 | | | 55.90 | | | 65.10 | | | 58.32 | | | 58.10 | | | 60.10 | | | 59.25 | | | 57.29 | |
| | Close | | | 56.92 | | | 61.48 | | | 67.72 | | | 66.73 | | | 62.70 | | | 66.60 | | | 64.78 | | | 64.80 | |
Selected Average Balances | | | | | | | | | | | | | | | | | | | | | | | | | |
| Total assets | | $ | 114,827.5 | | $ | 107,845.9 | | $ | 106,492.0 | | $ | 104,796.1 | | $ | 103,882.0 | | $ | 101,246.0 | | $ | 103,194.2 | | $ | 103,225.4 | |
| Earning assets | | | 101,895.5 | | | 95,562.2 | | | 94,740.5 | | | 93,198.1 | | | 92,440.9 | | | 90,588.0 | | | 92,570.8 | | | 92,553.9 | |
| Loans | | | 72,668.8 | | | 71,695.6 | | | 70,985.1 | | | 69,694.6 | | | 69,547.1 | | | 69,024.0 | | | 69,900.5 | | | 71,654.4 | |
| Consumer and commercial deposits | | | 67,829.7 | | | 66,141.3 | | | 65,466.3 | | | 62,211.5 | | | 59,085.8 | | | 57,081.1 | | | 56,343.6 | | | 54,538.6 | |
| Brokered and foreign deposits | | | 7,329.4 | | | 4,956.7 | | | 5,179.8 | | | 5,432.4 | | | 6,268.1 | | | 6,086.6 | | | 8,017.1 | | | 10,870.0 | |
| Realized shareholders’ equity | | | 7,204.8 | | | 7,095.9 | | | 6,901.5 | | | 6,729.8 | | | 6,530.6 | | | 6,305.4 | | | 6,208.8 | | | 6,264.6 | |
| Total shareholders’ equity | | | 8,823.3 | | | 8,943.3 | | | 8,743.1 | | | 8,385.9 | | | 8,334.5 | | | 7,996.1 | | | 7,873.4 | | | 8,089.2 | |
| Common shares – diluted (thousands) | | | 283,595 | | | 285,991 | | | 287,288 | | | 287,375 | | | 289,319 | | | 289,601 | | | 291,677 | | | 295,832 | |
| Common shares – basic (thousands) | | | 280,364 | | | 282,310 | | | 283,293 | | | 284,055 | | | 285,645 | | | 285,570 | | | 287,878 | | | 291,805 | |
Financial Ratios (Annualized) | | | | | | | | | | | | | | | | | | | | | | | | | |
| Return on average assets less net unrealized gains on securities | | | 1.20 | % | | 1.30 | % | | 1.33 | % | | 1.21 | % | | 1.40 | % | | 1.34 | % | | 1.38 | % | | 1.36 | % |
| Return on average total assets | | | 1.18 | | | 1.26 | | | 1.29 | | | 1.18 | | | 1.36 | | | 1.31 | | | 1.35 | | | 1.33 | |
| Return on average realized shareholders’ equity | | | 18.74 | | | 19.18 | | | 19.97 | | | 18.37 | | | 21.67 | | | 21.02 | | | 22.43 | | | 21.85 | |
| Return on average total shareholders’ equity | | | 15.30 | | | 15.22 | | | 15.77 | | | 14.74 | | | 16.98 | | | 16.58 | | | 17.68 | | | 16.92 | |
| Net interest margin | | | 3.26 | | | 3.38 | | | 3.48 | | | 3.51 | | | 3.56 | | | 3.56 | | | 3.61 | | | 3.57 | |
| | |
|
| |
|
| |
|
| |
|
| |
|
| |
|
| |
|
| |
|
| |
1 | Includes securities gains of $39.5, $45.8, $55.7 and $63.5 million for the fourth, third, second and first quarters of 2002, respectively, and $32.1, $36.2, $27.7 and $4.2 million for the fourth, third, second and first quarters of 2001, respectively, related to the Company’s securities portfolio repositioning. An additional $52.9 million security gain was recorded in the first quarter of 2001 on the sale of Star Systems, Inc. |
2 | Includes enhancements to customer-based systems of $11.7, $18.3, $9.4 and $16.8 for the fourth, third, second and first quarters of 2002, respectively, and $15.5, $17.5, $14.7 and $7.0 million for the fourth, third, second and first quarters of 2001, respectively, related to the One Bank initiative. |
3 | Includes merger-related expenses of $16.0 million for the first quarter of 2002 related to the acquisition of Huntington-Florida. |
4 | Includes Wachovia proposal expenses of $32.0 million for the third quarter of 2001. |
5 | Represents the gain on the Company’s early extinguishment of long-term debt during the fourth quarter of 2001, net of $13.0 million in taxes, and the loss on the Company’s early extinguishment of long-term debt during the second quarter of 2001, net of $9.6 million in taxes. |
management’s discussion | 44 | SunTrust 2002 Annual Report |
TABLE 23 Consolidated Daily Average Balances, Income/Expense And Average Yields Earned And Rates Paid
| | Quarters Ended | |
| |
| |
| | December 31, 2002 | | December 31, 2001 | |
| |
| |
| |
(Dollars in millions;
yields on taxable-equivalent basis) | | Average
Balances | | Income/
Expense | | Yields/
Rates | | Average
Balances | | Income/
Expense | | Yields/
Rates | |
| |
| |
| |
| |
| |
| |
| |
Assets | | | | | | | | | | | | | | | | | | | |
Loans1 | | | | | | | | | | | | | | | | | | | |
| | Taxable | | $ | 71,277.2 | | $ | 961.1 | | | 5.35 | % | $ | 68,348.8 | | $ | 1,057.0 | | | 6.14 | % |
| | Tax-exempt2 | | | 1,391.6 | | | 18.1 | | | 5.16 | | | 1,198.3 | | | 18.6 | | | 6.16 | |
| | |
|
| |
|
| |
|
| |
|
| |
|
| |
|
| |
| | Total loans | | | 72,668.8 | | | 979.2 | | | 5.35 | | | 69,547.1 | | | 1,075.6 | | | 6.14 | |
| Securities available for sale | | | | | | | | | | | | | | | | | | | |
| | Taxable | | | 18,891.3 | | | 193.4 | | | 4.10 | | | 15,798.9 | | | 236.8 | | | 6.00 | |
| | Tax-exempt2 | | | 399.5 | | | 6.7 | | | 6.67 | | | 441.7 | | | 7.8 | | | 7.05 | |
| | |
|
| |
|
| |
|
| |
|
| |
|
| |
|
| |
| | Total securities available for sale | | | 19,290.8 | | | 200.1 | | | 4.15 | | | 16,240.6 | | | 244.6 | | | 6.02 | |
| Funds sold and securities purchased under agreements to resell | | | 1,488.1 | | | 6.0 | | | 1.58 | | | 1,193.8 | | | 7.3 | | | 2.38 | |
| Loans held for sale | | | 6,228.4 | | | 92.2 | | | 5.92 | | | 3,777.0 | | | 65.5 | | | 6.94 | |
| Interest-bearing deposits | | | 557.8 | | | 2.3 | | | 1.61 | | | 233.5 | | | 1.2 | | | 2.17 | |
| Trading assets | | | 1,661.6 | | | 5.3 | | | 1.26 | | | 1,448.9 | | | 7.0 | | | 1.91 | |
| | |
|
| |
|
| |
|
| |
|
| |
|
| |
|
| |
| | Total earning assets | | | 101,895.5 | | | 1,285.1 | | | 5.00 | | | 92,440.9 | | | 1,401.2 | | | 6.01 | |
| Allowance for loan losses | | | (930.4 | ) | | | | | | | | (867.0 | ) | | | | | | |
| Cash and due from banks | | | 3,558.8 | | | | | | | | | 3,521.6 | | | | | | | |
| Premises and equipment | | | 1,617.0 | | | | | | | | | 1,586.4 | | | | | | | |
| Other assets | | | 6,133.7 | | | | | | | | | 4,430.0 | | | | | | | |
| Unrealized gains on securities available for sale | | | 2,552.9 | | | | | | | | | 2,770.1 | | | | | | | |
| | |
|
| |
|
| |
|
| |
|
| |
|
| |
|
| |
| | Total assets | | $ | 114,827.5 | | $ | | | | | | | 103,882.0 | | | | | | | |
| | |
|
| |
|
| |
|
| |
|
| |
|
| |
|
| |
Liabilities and Shareholders’ Equity | | | | | | | | | | | | | | | | | | | |
| Interest-bearing deposits | | | | | | | | | | | | | | | | | | | |
| | NOW accounts | | $ | 11,012.5 | | $ | 18.6 | | | 0.67 | % | $ | 8,921.1 | | $ | 20.2 | | | 0.90 | % |
| | Money Market accounts | | | 21,451.2 | | | 75.6 | | | 1.40 | | | 18,004.0 | | | 101.6 | | | 2.24 | |
| | Savings | | | 6,230.3 | | | 17.7 | | | 1.13 | | | 5,989.3 | | | 28.4 | | | 1.88 | |
| | Consumer time | | | 9,161.2 | | | 78.2 | | | 3.39 | | | 8,556.8 | | | 97.6 | | | 4.53 | |
| | Other time | | | 3,745.2 | | | 22.0 | | | 2.33 | | | 3,457.0 | | | 38.5 | | | 4.42 | |
| | |
|
| |
|
| |
|
| |
|
| |
|
| |
|
| |
| | Total interest-bearing consumer and commercial deposits | | | 51,600.4 | | | 212.1 | | | 1.63 | | | 44,928.2 | | | 286.3 | | | 2.53 | |
| | Brokered deposits | | | 2,713.3 | | | 30.8 | | | 4.44 | | | 2,910.8 | | | 21.3 | | | 2.86 | |
| | Foreign deposits | | | 4,616.1 | | | 16.4 | | | 1.39 | | | 3,357.3 | | | 18.3 | | | 2.13 | |
| | |
|
| |
|
| |
|
| |
|
| |
|
| |
|
| |
| | Total interest bearing deposits | | | 58,929.8 | | | 259.3 | | | 1.75 | | | 51,196.3 | | | 325.9 | | | 2.53 | |
| Funds purchased and securities sold under agreements to repurchase | | | 11,984.8 | | | 36.6 | | | 1.19 | | | 10,339.0 | | | 47.1 | | | 1.78 | |
| Other short-term borrowings | | | 789.1 | | | 2.4 | | | 1.23 | | | 1,582.2 | | | 8.8 | | | 2.19 | |
| Long-term debt | | | 11,733.2 | | | 149.5 | | | 5.06 | | | 12,870.5 | | | 189.3 | | | 5.84 | |
| | |
|
| |
|
| |
|
| |
|
| |
|
| |
|
| |
| | Total interest-bearing liabilities | | | 83,436.9 | | | 447.8 | | | 2.13 | | | 75,988.0 | | | 571.1 | | | 2.98 | |
| Noninterest-bearing deposits | | | 16,229.3 | | | | | | | | | 14,157.6 | | | | | | | |
| Other liabilities | | | 6,338.0 | | | | | | | | | 5,401.9 | | | | | | | |
| Realized shareholders’ equity | | | 7,204.8 | | | | | | | | | 6,530.6 | | | | | | | |
| Accumulated other comprehensive income | | | 1,618.5 | | | | | | | | | 1,803.9 | | | | | | | |
| | |
|
| |
|
| |
|
| |
|
| |
|
| |
|
| |
| | Total liabilities and shareholders’ equity | | $ | 114,827.5 | | | | | | | | $ | 103,882.0 | | | | | | | |
| | |
|
| |
|
| |
|
| |
|
| |
|
| |
|
| |
Interest Rate Spread | | | | | | | | | 2.87 | % | | | | | | | | 3.03 | % |
| | |
|
| |
|
| |
|
| |
|
| |
|
| |
|
| |
Net Interest Income | | | | | $ | 837.3 | | | | | | | | $ | 830.1 | | | | |
| | |
|
| |
|
| |
|
| |
|
| |
|
| |
|
| |
Net Interest Margin3 | | | | | | | | | 3.26 | % | | | | | | | | 3.56 | % |
| | |
|
| |
|
| |
|
| |
|
| |
|
| |
|
| |
| | | | | | | | | | | | | | | | | | | | | | | | | | |
1 | Interest income includes loan fees of $32.1 million and $40.2 million in the quarters ended December 31, 2002 and 2001, respectively. Nonaccrual loans are included in average balances and income on such loans, if recognized, is recorded on a cash basis. |
2 | Interest income includes the effects of taxable-equivalent adjustments using a federal income tax rate of 35% and, where applicable, state income taxes to increase tax-exempt interest income to a taxable-equivalent basis. The net taxable-equivalent adjustment amounts included in the above table aggregated $10.2 million and $10.1 million in the quarters ended December 31, 2002 and 2001, respectively. |
3 | Derivative instruments used to help balance the Company’s interest-sensitivity position decreased net interest income by $5.9 million and $16.8 million in the fourth quarter of 2002 and 2001, respectively. Without these derivative instruments, the net interest margin would have been 3.28% and 3.63% in 2002 and 2001, respectively. |
SunTrust 2002 Annual Report | 45 | management’s discussion |
management’s discussion
TABLE 24 Quarterly Noninterest Income And Expense
| | Quarters | |
| |
| |
| | 2002 | | 2001 | |
| |
| |
| |
(In millions) | | 4 | | 3 | | 2 | | 1 | | 4 | | 3 | | 2 | | 1 | |
| |
| |
| |
| |
| |
| |
| |
| |
| |
Noninterest Income | | | | | | | | | | | | | | | | | | | | | | | | | |
| Service charges on deposit accounts | | $ | 156.2 | | $ | 157.0 | | $ | 153.8 | | $ | 146.0 | | $ | 135.5 | | $ | 129.1 | | $ | 125.6 | | $ | 120.0 | |
| Trust and investment management income | | | 119.4 | | | 123.9 | | | 132.2 | | | 129.1 | | | 117.2 | | | 119.8 | | | 124.8 | | | 124.3 | |
| Retail investment services | | | 33.0 | | | 35.1 | | | 37.3 | | | 31.3 | | | 28.9 | | | 26.8 | | | 27.3 | | | 24.8 | |
| Mortgage production | | | 103.3 | | | 54.3 | | | 27.1 | | | 30.6 | | | 58.4 | | | 43.1 | | | 53.0 | | | 31.7 | |
| Mortgage servicing | | | (68.1 | ) | | (36.5 | ) | | 0.8 | | | (6.3 | ) | | (10.9 | ) | | 0.8 | | | (2.7 | ) | | 6.7 | |
| Other charges and fees | | | 74.3 | | | 76.6 | | | 75.6 | | | 70.4 | | | 65.9 | | | 61.3 | | | 57.5 | | | 55.6 | |
| Investment banking income | | | 39.5 | | | 39.8 | | | 52.8 | | | 44.8 | | | 41.6 | | | 33.4 | | | 19.4 | | | 14.1 | |
| Trading account profits and commissions | | | 29.7 | | | 23.6 | | | 24.2 | | | 25.7 | | | 11.0 | | | 30.0 | | | 24.9 | | | 29.7 | |
Securities gains1, 2 | | | 39.5 | | | 45.8 | | | 55.7 | | | 63.5 | | | 32.1 | | | 36.2 | | | 27.7 | | | 57.1 | |
| Credit card and other fees | | | 29.9 | | | 27.4 | | | 31.4 | | | 31.2 | | | 29.4 | | | 28.7 | | | 30.0 | | | 25.6 | |
| Other income | | | 13.0 | | | 33.9 | | | 34.9 | | | 49.0 | | | 48.6 | | | 41.2 | | | 34.3 | | | 36.3 | |
| | |
|
| |
|
| |
|
| |
|
| |
|
| |
|
| |
|
| |
|
| |
| | Total noninterest income | | $ | 569.7 | | $ | 580.9 | | $ | 625.8 | | $ | 615.3 | | $ | 557.7 | | $ | 550.4 | | $ | 521.8 | | $ | 525.9 | |
| | |
|
| |
|
| |
|
| |
|
| |
|
| |
|
| |
|
| |
|
| |
Noninterest Expense | | | | | | | | | | | | | | | | | | | | | | | | | |
| Salaries | | $ | 312.5 | | $ | 308.1 | | $ | 321.7 | | $ | 315.1 | | $ | 301.3 | | $ | 293.3 | | $ | 285.8 | | $ | 286.0 | |
| Other compensation | | | 114.7 | | | 87.1 | | | 96.7 | | | 79.1 | | | 125.8 | | | 108.5 | | | 97.3 | | | 90.3 | |
| Employee benefits | | | 71.0 | | | 72.2 | | | 72.5 | | | 90.8 | | | 42.4 | | | 45.5 | | | 48.4 | | | 56.7 | |
| | |
|
| |
|
| |
|
| |
|
| |
|
| |
|
| |
|
| |
|
| |
| | Total personnel expense | | | 498.2 | | | 467.4 | | | 490.9 | | | 485.0 | | | 469.5 | | | 447.3 | | | 431.5 | | | 433.0 | |
| Net occupancy expense | | | 61.7 | | | 57.6 | | | 55.9 | | | 54.0 | | | 53.6 | | | 55.1 | | | 51.8 | | | 50.0 | |
| Outside processing and software | | | 57.0 | | | 59.9 | | | 54.0 | | | 54.3 | | | 57.0 | | | 51.6 | | | 45.3 | | | 45.1 | |
| Equipment expense | | | 45.1 | | | 42.8 | | | 43.2 | | | 43.7 | | | 51.0 | | | 49.9 | | | 44.3 | | | 44.5 | |
| Consulting and legal | | | 25.0 | | | 21.6 | | | 21.8 | | | 22.6 | | | 32.4 | | | 25.0 | | | 20.6 | | | 9.7 | |
| Marketing and customer development | | | 20.8 | | | 15.7 | | | 18.2 | | | 25.2 | | | 32.7 | | | 25.3 | | | 23.0 | | | 23.0 | |
| Postage and delivery | | | 18.3 | | | 17.0 | | | 17.5 | | | 16.6 | | | 16.7 | | | 15.3 | | | 15.8 | | | 16.2 | |
| Amortization of intangible assets | | | 17.5 | | | 17.5 | | | 17.5 | | | 6.5 | | | 8.6 | | | 8.4 | | | 21.0 | | | 8.3 | |
| Credit and collection services | | | 15.9 | | | 14.2 | | | 16.2 | | | 18.3 | | | 22.4 | | | 20.6 | | | 18.0 | | | 13.6 | |
| Communications | | | 14.1 | | | 16.6 | | | 17.5 | | | 16.7 | | | 16.8 | | | 15.0 | | | 14.1 | | | 13.3 | |
| Other staff expense | | | 13.8 | | | 12.2 | | | 12.1 | | | 13.9 | | | 17.4 | | | 15.3 | | | 15.0 | | | 10.8 | |
| Operating supplies | | | 11.2 | | | 10.3 | | | 12.9 | | | 12.4 | | | 13.3 | | | 12.3 | | | 11.4 | | | 11.3 | |
| FDIC premiums | | | 4.2 | | | 4.4 | | | 4.6 | | | 4.1 | | | 4.3 | | | 3.9 | | | 3.9 | | | 3.9 | |
| Other real estate expense (income) | | | 0.3 | | | (0.1 | ) | | (0.4 | ) | | — | | | (0.4 | ) | | 0.1 | | | (3.1 | ) | | (0.7 | ) |
| Merger-related expenses | | | — | | | — | | | — | | | 16.0 | | | — | | | — | | | — | | | — | |
Other expense3 | | | 75.3 | | | 51.0 | | | 36.2 | | | 48.3 | | | 34.9 | | | 31.7 | | | 51.2 | | | 60.7 | |
| | |
|
| |
|
| |
|
| |
|
| |
|
| |
|
| |
|
| |
|
| |
| | Total noninterest expense | | $ | 878.4 | | $ | 808.1 | | $ | 818.1 | | $ | 837.6 | | $ | 830.2 | | $ | 776.8 | | $ | 763.8 | | $ | 742.7 | |
| | |
|
| |
|
| |
|
| |
|
| |
|
| |
|
| |
|
| |
|
| |
1 | Includes $52.9 million gain on the sale of Star Systems, Inc. in the first quarter of 2001. |
2 | Includes securities gains of $39.5, $45.8, $55.7 and $63.5 million in the fourth, third, second and first quarters of 2002, respectively, $32.1, $36.2, $27.7 and $4.2 million in the fourth, third, second and first quarters of 2001, respectively, related to the securities portfolio repositioning. |
3 | Includes expenses of $32.0 million in the third quarter of 2001 for the proposal to acquire the former Wachovia Corporation. |
management’s discussion | 46 | SunTrust 2002 Annual Report |
TABLE 25 Summary Of Loan Loss Experience, Nonperforming Assets And Accruing Loans Past Due 90 Days Or More
| | Quarters | |
| |
| |
| | 2002 | | 2001 | |
| |
| |
| |
(Dollars in millions) | | 4 | | 3 | | 2 | | 1 | | 4 | | 3 | | 2 | | 1 | |
| |
| |
| |
| |
| |
| |
| |
| |
| |
Allowance for Loan Losses | | | | | | | | | | | | | | | | | | | | | | | | | |
| Balance – beginning of quarter | | $ | 929.3 | | $ | 928.9 | | $ | 927.6 | | $ | 867.1 | | $ | 866.4 | | $ | 866.1 | | $ | 872.0 | | $ | 874.5 | |
| Allowance from acquisitions, dispositions and other activity – net | | | — | | | — | | | — | | | 15.5 | | | — | | | — | | | (6.7 | ) | | (3.5 | ) |
| Provision for loan losses | | | 96.5 | | | 98.7 | | | 111.0 | | | 163.6 | | | 88.1 | | | 80.2 | | | 39.6 | | | 67.3 | |
| Charge-offs | | | (115.2 | ) | | (114.5 | ) | | (124.3 | ) | | (136.1 | ) | | (101.5 | ) | | (92.0 | ) | | (53.2 | ) | | (79.4 | ) |
| Recoveries | | | 19.5 | | | 16.2 | | | 14.6 | | | 17.5 | | | 14.1 | | | 12.1 | | | 14.4 | | | 13.1 | |
| | |
|
| |
|
| |
|
| |
|
| |
|
| |
|
| |
|
| |
|
| |
| Balance – end of quarter | | $ | 930.1 | | $ | 929.3 | | $ | 928.9 | | $ | 927.6 | | $ | 867.1 | | $ | 866.4 | | $ | 866.1 | | $ | 872.0 | |
| | |
|
| |
|
| |
|
| |
|
| |
|
| |
|
| |
|
| |
|
| |
Ratios | | | | | | | | | | | | | | | | | | | | | | | | | |
| Allowance to quarter-end loans | | | 1.27 | % | | 1.28 | % | | 1.29 | % | | 1.31 | % | | 1.26 | % | | 1.24 | % | | 1.26 | % | | 1.24 | % |
| Allowance to nonaccrual loans | | | 182.0 | | | 167.8 | | | 194.0 | | | 173.6 | | | 155.4 | | | 176.7 | | | 210.6 | | | 250.1 | |
| Net loan charge-offs to average loans (annualized) | | | 0.52 | | | 0.54 | | | 0.62 | | | 0.69 | | | 0.50 | | | 0.46 | | | 0.22 | | | 0.38 | |
| Provision to average loans (annualized) | | | 0.53 | | | 0.55 | | | 0.63 | | | 0.95 | | | 0.50 | | | 0.46 | | | 0.23 | | | 0.38 | |
Nonperforming Assets | | | | | | | | | | | | | | | | | | | | | | | | | |
| Nonaccrual loans | | $ | 511.0 | | $ | 553.8 | | $ | 479.0 | | $ | 534.2 | | $ | 558.1 | | $ | 490.2 | | $ | 411.1 | | $ | 348.7 | |
| Other real estate owned | | | 18.0 | | | 15.0 | | | 18.2 | | | 18.5 | | | 20.7 | | | 18.9 | | | 20.3 | | | 20.6 | |
| Other repossessed assets | | | 13.0 | | | 25.9 | | | 21.3 | | | 23.6 | | | 21.0 | | | 14.3 | | | 11.8 | | | 11.3 | |
| | |
|
| |
|
| |
|
| |
|
| |
|
| |
|
| |
|
| |
|
| |
| Total nonperforming assets | | $ | 542.0 | | $ | 594.7 | | $ | 518.5 | | $ | 576.3 | | $ | 599.8 | | $ | 523.4 | | $ | 443.2 | | $ | 380.6 | |
| | |
|
| |
|
| |
|
| |
|
| |
|
| |
|
| |
|
| |
|
| |
Ratios | | | | | | | | | | | | | | | | | | | | | | | | | |
| Nonaccrual loans to total loans | | | 0.70 | % | | 0.76 | % | | 0.67 | % | | 0.75 | % | | 0.81 | % | | 0.70 | % | | 0.60 | % | | 0.50 | % |
| Nonperforming assets to total loans plus OREO and other repossessed assets | | | 0.74 | | | 0.82 | | | 0.72 | | | 0.81 | | | 0.87 | | | 0.75 | | | 0.64 | | | 0.54 | |
Accruing Loans Past Due 90 Days or More | | $ | 177.9 | | $ | 185.8 | | $ | 175.8 | | $ | 175.5 | | $ | 185.5 | | $ | 177.0 | | $ | 211.8 | | $ | 223.7 | |
| | |
|
| |
|
| |
|
| |
|
| |
|
| |
|
| |
|
| |
|
| |
TABLE 26 Quarterly Line of Business Results
| | Retail | |
| |
| |
| | 2002 | | 2001 | |
| |
| |
| |
| | 4 | | 3 | | 2 | | 1 | | 4 | | 3 | | 2 | | 1 | |
| |
| |
| |
| |
| |
| |
| |
| |
| |
| Average total assets | | $ | 24,601.7 | | $ | 23,809.0 | | $ | 23,350.8 | | $ | 21,549.4 | | $ | 20,446.1 | | $ | 19,935.1 | | $ | 19,562.2 | | $ | 19,553.4 | |
| Average total liabilities | | | 52,594.1 | | | 52,207.7 | | | 52,417.6 | | | 49,652.4 | | | 46,959.3 | | | 46,095.2 | | | 45,457.2 | | | 44,405.9 | |
| Average total equity | | | — | | | — | | | — | | | — | | | — | | | — | | | — | | | — | |
| | |
|
| |
|
| |
|
| |
|
| |
|
| |
|
| |
|
| |
|
| |
| Net interest income (FTE) | | | 341.4 | | | 340.6 | | | 374.8 | | | 331.2 | | | 409.2 | | | 344.0 | | | 375.0 | | | 344.3 | |
| Provision for loan losses | | | 27.5 | | | 26.6 | | | 25.2 | | | 23.5 | | | 13.0 | | | 12.8 | | | 12.2 | | | 11.6 | |
| | |
|
| |
|
| |
|
| |
|
| |
|
| |
|
| |
|
| |
|
| |
| Net interest revenue | | | 313.9 | | | 314.0 | | | 349.6 | | | 307.7 | | | 396.2 | | | 331.2 | | | 362.8 | | | 332.7 | |
| Noninterest revenue | | | 183.5 | | | 182.6 | | | 189.8 | | | 176.2 | | | 158.9 | | | 162.5 | | | 150.5 | | | 145.5 | |
| Noninterest expense | | | 294.6 | | | 305.7 | | | 321.7 | | | 325.1 | | | 296.9 | | | 296.5 | | | 287.0 | | | 284.6 | |
| | |
|
| |
|
| |
|
| |
|
| |
|
| |
|
| |
|
| |
|
| |
| Total contribution before taxes and extraordinary items | | | 202.8 | | | 190.9 | | | 217.7 | | | 158.8 | | | 258.2 | | | 197.2 | | | 226.3 | | | 193.6 | |
| Provision for income taxes | | | — | | | — | | | — | | | — | | | — | | | — | | | — | | | — | |
| | |
|
| |
|
| |
|
| |
|
| |
|
| |
|
| |
|
| |
|
| |
| Income before extraordinary items | | | 202.8 | | | 190.9 | | | 217.7 | | | 158.8 | | | 258.2 | | | 197.2 | | | 226.3 | | | 193.6 | |
| Extraordinary items, net of tax | | | — | | | — | | | — | | | — | | | — | | | — | | | — | | | — | |
| | |
|
| |
|
| |
|
| |
|
| |
|
| |
|
| |
|
| |
|
| |
| Net income | | $ | 202.8 | | $ | 190.9 | | $ | 217.7 | | $ | 158.8 | | $ | 258.2 | | $ | 197.2 | | $ | 226.3 | | $ | 193.6 | |
| | |
|
| |
|
| |
|
| |
|
| |
|
| |
|
| |
|
| |
|
| |
SunTrust 2002 Annual Report | 47 | management’s discussion |
management’s discussion
| | Commercial | |
| |
| |
| | 2002 | | 2001 | |
| |
| |
| |
| | 4 | | 3 | | 2 | | 1 | | 4 | | 3 | | 2 | | 1 | |
| |
| |
| |
| |
| |
| |
| |
| |
| |
| Average total assets | | $ | 23,110.7 | | $ | 22,446.8 | | $ | 22,289.4 | | $ | 21,454.5 | | $ | 21,408.3 | | $ | 20,589.3 | | $ | 20,498.4 | | $ | 20,008.6 | |
| Average total liabilities | | | 11,098.8 | | | 10,076.2 | | | 9,369.2 | | | 9,076.2 | | | 9,177.6 | | | 8,409.1 | | | 8,306.4 | | | 8,462.4 | |
| Average total equity | | | — | | | — | | | — | | | — | | | — | | | — | | | — | | | — | |
| | |
|
| |
|
| |
|
| |
|
| |
|
| |
|
| |
|
| |
|
| |
| Net interest income (FTE) | | | 145.5 | | | 140.4 | | | 139.8 | | | 134.3 | | | 142.6 | | | 135.6 | | | 140.2 | | | 139.6 | |
| Provision for loan losses | | | 12.0 | | | 8.9 | | | 13.3 | | | 11.0 | | | 9.8 | | | 11.1 | | | 8.5 | | | 8.1 | |
| | |
|
| |
|
| |
|
| |
|
| |
|
| |
|
| |
|
| |
|
| |
| Net interest revenue | | | 133.5 | | | 131.5 | | | 126.5 | | | 123.3 | | | 132.8 | | | 124.5 | | | 131.7 | | | 131.5 | |
| Noninterest revenue | | | 81.1 | | | 74.6 | | | 72.9 | | | 75.9 | | | 79.0 | | | 63.1 | | | 64.1 | | | 57.0 | |
| Noninterest expense | | | 101.2 | | | 80.7 | | | 88.4 | | | 101.5 | | | 99.3 | | | 92.2 | | | 95.4 | | | 94.9 | |
| | |
|
| |
|
| |
|
| |
|
| |
|
| |
|
| |
|
| |
|
| |
Total contribution before taxes
and extraordinary items | | | 113.4 | | | 125.4 | | | 111.0 | | | 97.7 | | | 112.5 | | | 95.4 | | | 100.4 | | | 93.6 | |
| Provision for income taxes | | | — | | | — | | | — | | | — | | | — | | | — | | | — | | | — | |
| | |
|
| |
|
| |
|
| |
|
| |
|
| |
|
| |
|
| |
|
| |
| Income before extraordinary items | | | 113.4 | | | 125.4 | | | 111.0 | | | 97.7 | | | 112.5 | | | 95.4 | | | 100.4 | | | 93.6 | |
| Extraordinary items, net of tax | | | — | | | — | | | — | | | — | | | — | | | — | | | — | | | — | |
| | |
|
| |
|
| |
|
| |
|
| |
|
| |
|
| |
|
| |
|
| |
| Net income | | $ | 113.4 | | $ | 125.4 | | $ | 111.0 | | $ | 97.7 | | $ | 112.5 | | $ | 95.4 | | $ | 100.4 | | $ | 93.6 | |
| | |
|
| |
|
| |
|
| |
|
| |
|
| |
|
| |
|
| |
|
| |
| | Corporate & Investment Banking | |
| |
| |
| | 2002 | | 2001 | |
| |
| |
| |
| | 4 | | 3 | | 2 | | 1 | | 4 | | 3 | | 2 | | 1 | |
| |
| |
| |
| |
| |
| |
| |
| |
| |
| Average total assets | | $ | 21,021.3 | | $ | 20,059.7 | | $ | 19,702.0 | | $ | 20,538.1 | | $ | 20,756.5 | | $ | 20,598.2 | | $ | 22,346.6 | | $ | 23,117.2 | |
| Average total liabilities | | | 6,050.3 | | | 5,162.0 | | | 4,798.8 | | | 4,993.6 | | | 4,819.4 | | | 4,307.6 | | | 4,538.4 | | | 4,305.4 | |
| Average total equity | | | — | | | — | | | — | | | — | | | — | | | — | | | — | | | — | |
| | |
|
| |
|
| |
|
| |
|
| |
|
| |
|
| |
|
| |
|
| |
| Net interest income (FTE) | | | 56.3 | | | 54.9 | | | 56.5 | | | 67.4 | | | 80.3 | | | 77.7 | | | 77.7 | | | 76.8 | |
| Provision for loan losses | | | 44.9 | | | 45.0 | | | 46.0 | | | 84.4 | | | 46.7 | | | 37.6 | | | 17.3 | | | 38.8 | |
| | |
|
| |
|
| |
|
| |
|
| |
|
| |
|
| |
|
| |
|
| |
| Net interest revenue | | | 11.4 | | | 9.9 | | | 10.5 | | | (17.0 | ) | | 33.6 | | | 40.1 | | | 60.4 | | | 38.0 | |
| Noninterest revenue | | | 130.2 | | | 124.1 | | | 137.5 | | | 122.5 | | | 108.0 | | | 111.6 | | | 93.4 | | | 90.9 | |
| Noninterest expense | | | 76.8 | | | 78.9 | | | 86.9 | | | 100.6 | | | 88.9 | | | 104.2 | | | 101.3 | | | 87.0 | |
| | |
|
| |
|
| |
|
| |
|
| |
|
| |
|
| |
|
| |
|
| |
| Total contribution before taxes and extraordinary items | | | 64.8 | | | 55.1 | | | 61.1 | | | 4.9 | | | 52.7 | | | 47.5 | | | 52.5 | | | 41.9 | |
| Provision for income taxes | | | — | | | — | | | — | | | — | | | — | | | — | | | — | | | — | |
| | |
|
| |
|
| |
|
| |
|
| |
|
| |
|
| |
|
| |
|
| |
| Income before extraordinary items | | | 64.8 | | | 55.1 | | | 61.1 | | | 4.9 | | | 52.7 | | | 47.5 | | | 52.5 | | | 41.9 | |
| Extraordinary items, net of tax | | | — | | | — | | | — | | | — | | | — | | | — | | | — | | | — | |
| | |
|
| |
|
| |
|
| |
|
| |
|
| |
|
| |
|
| |
|
| |
| Net income | | $ | 64.8 | | $ | 55.1 | | $ | 61.1 | | $ | 4.9 | | $ | 52.7 | | $ | 47.5 | | $ | 52.5 | | $ | 41.9 | |
| | |
|
| |
|
| |
|
| |
|
| |
|
| |
|
| |
|
| |
|
| |
| | Mortgage | |
| |
| |
| | 2002 | | 2001 | |
| |
| |
| |
| | 4 | | 3 | | 2 | | 1 | | 4 | | 3 | | 2 | | 1 | |
| |
| |
| |
| |
| |
| |
| |
| |
| |
| Average total assets | | $ | 20,531.2 | | $ | 18,568.9 | | $ | 18,562.3 | | $ | 19,259.9 | | $ | 19,422.1 | | $ | 19,209.1 | | $ | 19,408.0 | | $ | 19,407.1 | |
| Average total liabilities | | | 1,573.4 | | | 1,202.4 | | | 1,201.5 | | | 1,186.2 | | | 1,250.5 | | | 1,088.0 | | | 1,093.7 | | | 747.3 | |
| Average total equity | | | — | | | — | | | — | | | — | | | — | | | — | | | — | | | — | |
| | |
|
| |
|
| |
|
| |
|
| |
|
| |
|
| |
|
| |
|
| |
| Net interest income (FTE) | | | 112.1 | | | 85.8 | | | 86.9 | | | 91.6 | | | 81.7 | | | 66.5 | | | 55.3 | | | 39.9 | |
| Provision for loan losses | | | 1.6 | | | 1.6 | | | 1.6 | | | 1.7 | | | 1.6 | | | 1.7 | | | 1.7 | | | 1.9 | |
| | |
|
| |
|
| |
|
| |
|
| |
|
| |
|
| |
|
| |
|
| |
| Net interest revenue | | | 110.5 | | | 84.2 | | | 85.3 | | | 89.9 | | | 80.1 | | | 64.8 | | | 53.6 | | | 38.0 | |
| Noninterest revenue | | | 47.1 | | | 25.5 | | | 35.4 | | | 32.1 | | | 56.6 | | | 51.1 | | | 48.5 | | | 53.7 | |
| Noninterest expense | | | 106.9 | | | 77.3 | | | 77.8 | | | 86.5 | | | 94.9 | | | 82.2 | | | 74.0 | | | 72.1 | |
| | |
|
| |
|
| |
|
| |
|
| |
|
| |
|
| |
|
| |
|
| |
Total contribution before taxes and extraordinary
items | | | 50.7 | | | 32.4 | | | 42.9 | | | 35.5 | | | 41.8 | | | 33.7 | | | 28.1 | | | 19.6 | |
| Provision for income taxes | | | — | | | — | | | — | | | — | | | — | | | — | | | — | | | — | |
| | |
|
| |
|
| |
|
| |
|
| |
|
| |
|
| |
|
| |
|
| |
| Income before extraordinary items | | | 50.7 | | | 32.4 | | | 42.9 | | | 35.5 | | | 41.8 | | | 33.7 | | | 28.1 | | | 19.6 | |
| Extraordinary items, net of tax | | | — | | | — | | | — | | | — | | | — | | | — | | | — | | | — | |
| | |
|
| |
|
| |
|
| |
|
| |
|
| |
|
| |
|
| |
|
| |
| Net income | | $ | 50.7 | | $ | 32.4 | | $ | 42.9 | | $ | 35.5 | | $ | 41.8 | | $ | 33.7 | | $ | 28.1 | | $ | 19.6 | |
| | |
|
| |
|
| |
|
| |
|
| |
|
| |
|
| |
|
| |
|
| |
management’s discussion | 48 | SunTrust 2002 Annual Report |
| | Private Client Services | |
| |
| |
| | 2002 | | 2001 | |
| |
| |
| |
| | 4 | | 3 | | 2 | | 1 | | 4 | | 3 | | 2 | | 1 | |
| |
| |
| |
| |
| |
| |
| |
| |
| |
| Average total assets | | $ | 1,874.4 | | $ | 1,730.8 | | $ | 1,725.9 | | $ | 1,713.9 | | $ | 1,562.4 | | $ | 1,518.9 | | $ | 1,425.4 | | $ | 1,281.6 | |
| Average total liabilities | | | 1,587.1 | | | 1,532.0 | | | 1,583.3 | | | 1,543.9 | | | 1,376.3 | | | 1,300.2 | | | 1,271.6 | | | 1,514.9 | |
| Average total equity | | | — | | | — | | | — | | | — | | | — | | | — | | | — | | | — | |
| | |
|
| |
|
| |
|
| |
|
| |
|
| |
|
| |
|
| |
|
| |
| Net interest income (FTE) | | | 10.0 | | | 9.9 | | | 10.2 | | | 10.1 | | | 12.1 | | | 10.3 | | | 11.5 | | | 10.4 | |
| Provision for loan losses | | | 0.6 | | | 0.5 | | | 0.6 | | | 0.6 | | | 0.5 | | | 0.4 | | | 0.4 | | | 0.3 | |
| | |
|
| |
|
| |
|
| |
|
| |
|
| |
|
| |
|
| |
|
| |
| Net interest revenue | | | 9.4 | | | 9.4 | | | 9.6 | | | 9.5 | | | 11.6 | | | 9.9 | | | 11.1 | | | 10.1 | |
| Noninterest revenue | | | 153.0 | | | 160.3 | | | 172.0 | | | 161.0 | | | 147.1 | | | 147.2 | | | 147.9 | | | 150.9 | |
| Noninterest expense | | | 119.3 | | | 115.1 | | | 118.2 | | | 119.1 | | | 109.4 | | | 98.9 | | | 99.2 | | | 100.4 | |
| | |
|
| |
|
| |
|
| |
|
| |
|
| |
|
| |
|
| |
|
| |
| Total contribution before taxes and extraordinary items | | | 43.1 | | | 54.6 | | | 63.4 | | | 51.4 | | | 49.3 | | | 58.2 | | | 59.8 | | | 60.6 | |
| Provision for income taxes | | | — | | | — | | | — | | | — | | | — | | | — | | | — | | | — | |
| | |
|
| |
|
| |
|
| |
|
| |
|
| |
|
| |
|
| |
|
| |
| Income before extraordinary items | | | 43.1 | | | 54.6 | | | 63.4 | | | 51.4 | | | 49.3 | | | 58.2 | | | 59.8 | | | 60.6 | |
| Extraordinary items, net of tax | | | — | | | — | | | — | | | — | | | — | | | — | | | — | | | — | |
| | |
|
| |
|
| |
|
| |
|
| |
|
| |
|
| |
|
| |
|
| |
| Net income | | $ | 43.1 | | $ | 54.6 | | $ | 63.4 | | $ | 51.4 | | $ | 49.3 | | $ | 58.2 | | $ | 59.8 | | $ | 60.6 | |
| | |
|
| |
|
| |
|
| |
|
| |
|
| |
|
| |
|
| |
|
| |
| | Corporate/Other | |
| |
| |
| | 2002 | | 2001 | |
| |
| |
| |
| | 4 | | 3 | | 2 | | 1 | | 4 | | 3 | | 2 | | 1 | |
| |
| |
| |
| |
| |
| |
| |
| |
| |
| Average total assets | | $ | 23,688.3 | | $ | 21,230.7 | | $ | 20,861.6 | | $ | 20,280.3 | | $ | 20,286.7 | | $ | 19,395.4 | | $ | 19,953.6 | | $ | 19,857.5 | |
| Average total liabilities | | | 33,100.7 | | | 28,722.4 | | | 28,378.4 | | | 29,958.0 | | | 31,964.4 | | | 32,049.9 | | | 34,653.6 | | | 35,700.2 | |
| Average total equity | | | 8,823.3 | | | 8,943.3 | | | 8,743.2 | | | 8,385.9 | | | 8,334.5 | | | 7,996.1 | | | 7,873.4 | | | 8,089.2 | |
| | |
|
| |
|
| |
|
| |
|
| |
|
| |
|
| |
|
| |
|
| |
| Net interest income (FTE) | | | 172.1 | | | 183.6 | | | 155.0 | | | 172.9 | | | 104.2 | | | 179.7 | | | 174.5 | | | 204.1 | |
| Provision for loan losses | | | 9.9 | | | 16.1 | | | 24.4 | | | 42.3 | | | 16.5 | | | 16.5 | | | (0.6 | ) | | 6.5 | |
| | |
|
| |
|
| |
|
| |
|
| |
|
| |
|
| |
|
| |
|
| |
| Net interest revenue | | | 162.2 | | | 167.5 | | | 130.6 | | | 130.6 | | | 87.7 | | | 163.2 | | | 175.1 | | | 197.6 | |
| Noninterest revenue | | | (25.2 | ) | | 13.8 | | | 18.2 | | | 47.6 | | | 8.1 | | | 14.9 | | | 17.4 | | | 28.0 | |
| Noninterest expense | | | 179.7 | | | 150.5 | | | 125.0 | | | 104.8 | | | 137.3 | | | 102.7 | | | 107.2 | | | 107.2 | |
| | |
|
| |
|
| |
|
| |
|
| |
|
| |
|
| |
|
| |
|
| |
| Total contribution before taxes and extraordinary items | | | (42.7 | ) | | 30.8 | | | 23.8 | | | 73.4 | | | (41.5 | ) | | 75.4 | | | 85.3 | | | 118.4 | |
| Provision for income taxes | | | 91.9 | | | 146.2 | | | 176.1 | | | 116.8 | | | 140.3 | | | 173.2 | | | 187.5 | | | 190.2 | |
| | |
|
| |
|
| |
|
| |
|
| |
|
| |
|
| |
|
| |
|
| |
| Income before extraordinary items | | | (134.6 | ) | | (115.4 | ) | | (152.3 | ) | | (43.4 | ) | | (181.8 | ) | | (97.8 | ) | | (102.2 | ) | | (71.8 | ) |
| Extraordinary items, net of tax | | | — | | | — | | | — | | | — | | | 24.1 | | | — | | | (17.8 | ) | | — | |
| | |
|
| |
|
| |
|
| |
|
| |
|
| |
|
| |
|
| |
|
| |
| Net income | | $ | (134.6 | ) | $ | (115.4 | ) | $ | (152.3 | ) | $ | (43.4 | ) | $ | (157.7 | ) | $ | (97.8 | ) | $ | (120.0 | ) | $ | (71.8 | ) |
| | |
|
| |
|
| |
|
| |
|
| |
|
| |
|
| |
|
| |
|
| |
SunTrust 2002 Annual Report | 49 | management’s discussion |
management’s discussion
Supervision And Regulation
As a bank holding company and a financial holding company, the Company is subject to the regulation and supervision of the Board of Governors of the Federal Reserve System (the “Federal Reserve”). As of December 31, 1999, the Company had 29 bank subsidiaries which were subject to supervision and regulation by applicable state and federal banking agencies, including the Federal Reserve, the Office of the Comptroller of the Currency (the “Comptroller”) and the Federal Deposit Insurance Corporation (the “FDIC”). Effective January 1, 2000, 27 of these bank subsidiaries merged into SunTrust Bank, Atlanta, which changed its name to SunTrust Bank. SunTrust Bank (the “Bank”) is a Georgia state bank which now has branches in Georgia, Florida, Tennessee, Alabama, Virginia, Maryland, and the District of Columbia. The Bank is a member of the Federal Reserve System, and is regulated by the Federal Reserve and the Georgia Department of Banking and Finance.
The Bank is subject to various requirements and restrictions under federal and state law, including requirements to maintain reserves against deposits, restrictions on the types and amounts of loans that may be made and the interest that may be charged thereon, and limitations on the types of investments that may be made and the types of services that may be offered. Various consumer laws and regulations also affect the operations of the Bank. In addition to the impact of regulation, commercial banks are affected significantly by the actions of the Federal Reserve as it attempts to control the money supply and credit availability in order to influence the economy.
Pursuant to the Riegle-Neal Interstate Banking and Branching Efficiency Act of 1994, bank holding companies from any state may acquire banks located in any other state, subject to certain conditions, including concentration limits. In addition, a bank may establish branches across state lines by merging with a bank in another state, subject to certain restrictions.
There are a number of obligations and restrictions imposed on bank holding companies and their depository institution subsidiaries by federal law and regulatory policy that are designed to reduce potential loss exposure to the depositors of such depository institutions and to the FDIC insurance fund in the event the depository institution becomes in danger of default or is in default. For example, under a policy of the Federal Reserve with respect to bank holding company operations, a bank holding company is required to serve as a source of financial strength to its subsidiary depository institutions and commit resources to support such institutions in circumstances where it might not do so absent such policy. In addition, the “cross-guarantee” provisions of federal law require insured depository institutions under common control to reimburse the FDIC for any loss suffered or reasonably anticipated as a result of the default of a commonly controlled insured depository institution or for any assistance provided by the FDIC to a commonly controlled insured depository institution in danger of default.
The federal banking agencies have broad powers under current federal law to take prompt corrective action to resolve problems of insured depository institutions. The extent of these powers depends upon whether the institutions in question are “well capitalized,” “adequately capitalized,” “undercapitalized,” “significantly undercapitalized” or “critically undercapitalized” as such terms are defined under regulations issued by each of the federal banking agencies.
There are various legal and regulatory limits on the extent to which the Bank may pay dividends or otherwise supply funds to the Company. In addition, federal and state bank regulatory agencies also have the authority to prevent a bank or bank holding company from paying a dividend or engaging in any other activity that, in the opinion of the agency, would constitute an unsafe or unsound practice.
FDIC regulations require that management report annually on its responsibility for preparing its institution’s financial statements, and establishing and maintaining an internal control structure and procedures for financial reporting, and compliance with designated laws and regulations concerning safety and soundness.
The Company’s nonbanking subsidiaries are regulated and supervised by various regulatory bodies. For example, SunTrust Capital Markets, Inc. is a broker-dealer and investment adviser registered with the Securities and Exchange Commission (“SEC”) and a member of the New York Stock Exchange, Inc. and the National Association of Securities Dealers, Inc. (“NASD”). SunTrust Securities, Inc. is also a broker-dealer and investment adviser registered with the SEC and a member of the NASD. Trusco Capital Management, Inc. is an investment adviser registered with the SEC. The Company also has one limited purpose national bank subsidiary, SunTrust BankCard, N.A., which is regulated by the Comptroller.
On November 12, 1999, financial modernization legislation known as the Gramm-Leach-Bliley Act (the “Act”) was signed into law. Under the Act, a bank holding company which elects to become a financial holding company may engage in expanded securities activities, insurance sales and underwriting activities, and other financial activities, and may also acquire securities firms and insurance companies, subject in each case to certain conditions. The Company has elected to become a financial holding company under the Act.
In addition to the Act, there have been a number of legislative and regulatory proposals that would have an impact on the operation of bank/financial holding companies and their bank and nonbank subsidiaries. It is impossible to predict whether or in what form these proposals may be adopted in the future and, if adopted, what their effect will be on the Company.
Corporate Governance
Sarbanes-Oxley Act of 2002 – Overview
On July 30, 2002, President George W. Bush signed into law the Sarbanes-Oxley Act of 2002 which reforms the oversight of public company auditing, improves the quality and transparency of financial reporting by those companies and strengthens the independence of auditors.
The new legislation requires CEOs and CFOs to certify that company financial statements fairly present the company’s financial condition. The legislation also requires public companies to report certain off-balance-sheet transactions, as well as to present any pro forma disclosures in a way that is not misleading and is in accordance with requirements to be established by the Securities Exchange Commission (SEC). The new legislation also accelerates the required reporting of insider stock transactions, which now generally must be reported by the end of the second business day following a covered transaction; requires that annual reports filed with the SEC include a statement by management asserting that it is responsible for creating and maintaining
management’s discussion | 50 | SunTrust 2002 Annual Report |
adequate internal controls and assessing the effectiveness of those controls; and requires companies to disclose whether or not they have adopted an ethics code for senior financial officers, and, if not, why not, and whether the audit committee includes at least one “audit committee financial expert.” SunTrust believes it is in compliance with each of the foregoing requirements.
SunTrust Corporate Responsibility
Responses and Initiatives
As a regulated financial services corporation, prior to the implementation of Sarbanes-Oxley, SunTrust already had internal controls in place to promote accurate disclosures in its financial reports. In the wake of the recent corporate scandals, resulting legislation and various proposed rules and regulations by the SEC and the New York Stock Exchange, SunTrust has endeavored to document in greater detail its existing controls and procedures and, where advisable, to implement additional corporate governance measures in order to provide greater assurance to SunTrust’s shareholders that SunTrust is committed to sound and ethical business practices.
The first such measure was the adoption of the SunTrust Corporate Governance Guidelines by the Board of Directors on November 12, 2002. The guidelines are to be considered along with the Bylaws of SunTrust and can be found on the Corporate Governance webpage in the “About SunTrust” subsection on SunTrust’s corporate website at www.suntrust.com.
Another measure was the creation of the Compensation and Governance Committee. The Compensation and Governance Committee was created on November 12, 2002. Its charter can be found on the Corporate Governance webpage in the “About SunTrust” subsection on SunTrust’s corporate website at www.suntrust.com.
A third measure was the creation of the Financial Disclosure Committee on November 12, 2002. The charter for the Financial Disclosure Committee can be found on the Corporate Governance webpage in the “About SunTrust” subsection on SunTrust’s corporate website at www.suntrust.com.
In addition, SunTrust has adopted a Code of Ethics for its senior financial officers, which applies to the Company’s principal financial officer and controller as well as SunTrust’s other senior financial officers. SunTrust’s principal executive officer has executed an affirmation whereby he agreed to abide by all provisions and requirements stated in the Code of Ethics. The full text of the Code of Ethics can be found on the Corporate Governance webpage in the “About SunTrust” subsection on SunTrust’s corporate website at www.suntrust.com.
A Warning About Forward-Looking Information
This Annual Report contains forward-looking statements. The Company may also make written forward-looking statements in periodic reports to the Securities and Exchange Commission, proxy statements, offering circulars and prospectuses, press releases and other written materials and oral statements made by SunTrust’s officers, directors or employees to third parties. Statements that are not historical facts, including statements about the Company’s beliefs and expectations, are forward-looking statements. These statements are based on beliefs and assumptions of SunTrust’s management, and on information currently available to such management. The forward-looking statements are intended to be subject to the safe harbor protection provided by Section 27A of the Securities Act of 1933 and Section 21E of the Securities Exchange Act of 1934. Forward-looking statements include statements preceded by, followed by or that include the words “believes,” “expects,” “anticipates,” “plans,” “estimates” or similar expressions.
Forward-looking statements speak only as of the date they are made, and the Company undertakes no obligation to update publicly any of them in light of new information or future events.
Forward-looking statements involve inherent risks and uncertainties. Management cautions the readers that a number of important factors could cause actual results to differ materially from those contained in any forward-looking statement. Such factors include, but are not limited to, the following: (i) competitive pressures among depository and other financial institutions may increase significantly; (ii) changes in the interest rate environment may reduce margins; (iii) general economic or business conditions in the geographic regions and industries in which SunTrust operates as well as the risk of domestic or international military or terrorist activities or conflicts, may lead to a deterioration in credit quality or a reduced demand for credit; (iv) legislative or regulatory changes, including changes in accounting standards, may adversely affect the business in which SunTrust is engaged; (v) changes may occur in the securities markets; and (vi) competitors of SunTrust may have greater financial resources and develop products that enable such competitors to compete more successfully than SunTrust.
Other factors that may cause actual results to differ from the forward-looking statements include the following: (i) the timely development of competitive new products and services by the Company and the acceptance of such products and services by customers; (ii) changes in consumer spending and saving habits; (iii) the effects of competitors’ pricing policies; (iv) the Company’s success in managing the costs associated with the expansion of existing distribution channels and developing new ones, and in realizing increased revenues from such distribution channels, including cross-selling initiatives and electronic commerce-based efforts; and (v) the effect of corporate restructurings, mergers, acquisitions and/or dispositions and their integration into the Company, the actual restructuring and other charges related thereto and management’s ability to manage these and other risks, including achieving the expected revenue growth and/or expense savings from such corporate restructurings, mergers, acquisitions and/or dispositions.
Management of SunTrust believes these forward-looking statements are reasonable; however, undue reliance should not be placed on such forward-looking statements, which are based on current expectations. SunTrust cautions that the foregoing list of important factors is not inclusive.
Forward-looking statements are not guarantees of performance. They involve risks, uncertainties and assumptions. The future results and shareholder values of SunTrust may differ materially from those expressed in the forward-looking statements contained in this annual report. Many of the factors that will determine these results and values are beyond SunTrust’s ability to control or predict.
SunTrust 2002 Annual Report | 51 | management’s discussion |
Community Reinvestment
A hallmark of SunTrust’s traditional success and key element in future strategy is the Company’s local market orientation. During 2002, the Company intensified local market focus by expanding the number of primary customer-focused banking units. This change has placed more executives in local markets.
As a result, the Company’s ongoing commitment to community involvement and reinvestment initiatives has been strengthened even further and continues to be driven at the local level. Experience has shown that no one knows the unique needs of each individual community SunTrust serves better than the people who live and work there. Local leaders are charged with supporting the overall Company reinvestment initiative by identifying opportunities and achieving lending, investment and service goals to ensure that the Company is doing the right things in the right places.
Overall policy direction and oversight is led by a senior level CRA committee, consisting of line-of-business heads and geographic group level executives and led by Executive Management.
SunTrust’s financial support for building communities through its extensive lending activities, investments and corporate contributions continued to grow in 2002. The opportunity for achieving the American dream of home ownership across all economic levels is necessary for a healthy and growing community. In 2002, the Company approved nearly 29,000 loans totaling approximately $3.1 billion to provide housing in low- to moderate-income areas. In addition, more than 73,000 loans totaling $6.5 billion were approved for families with low- to moderate income to purchase or rehabilitate their homes. Once again, these figures represent continuing growth in the volume of SunTrust’s housing-related lending to low- and moderate-income communities.
In addition to housing, businesses of every size play a vital role in the lifeblood of a community. In 2002, businesses located in low- to moderate-income communities received over 10,000 loans from SunTrust totaling $1.2 billion. SunTrust also made more than 39,000 small business loans (or 76% of its total) with an original principal balance of $100,000 or less. Also in 2002, SunTrust made 30,600 loans totaling over $2.2 billion to small businesses with annual revenues of $1 million or less.
The primary businesses of most rural areas, small farms, received support with almost 1,200 loans, totaling nearly $90 million. Seventy-eight percent of these loans were for $100,000 or less.
As a major participant in community development for the areas we serve, SunTrust provided $464.7 million in community development loans in 2002. The Company continued to play a very active role in providing funding for affordable housing projects through membership in the Federal Home Loan Bank as one of the leading lenders through its Affordable Housing Program and Community Investment Program.
SunTrust continues to create quality housing for families and seniors of modest means through its SunTrust Community Development Corporation which helps them build better lives and preserve and enhance the quality and character of their surrounding communities. Through these entities and our investments in low income housing tax credits, SunTrust now has provided equity financing of $479 million that has created 23,000 units of affordable housing throughout the Southeast.
In addition to these investments, SunTrust supports the communities it serves with funding for local and regional groups, providing affordable housing or promoting small business development and targeted mortgage-backed securities. SunTrust also has bond investments that help finance community development initiatives such as public housing and school construction. The Company’s combined investment in community development projects and organizations now totals more than $647.9 million.
Controls And Procedures
A review and evaluation was performed by the Company’s management, including the Company’s Chief Executive Officer (the “CEO”) and Chief Financial Officer (the “CFO”), of the effectiveness of the design and operation of the Company’s disclosure controls and procedures as of a date within 90 days prior to the filing of this Annual Report. Based on that review and evaluation, the CEO and CFO have concluded that the Company’s current disclosure controls and procedures, as designed and implemented, were effective. There have been no significant changes in the Company’s internal controls or in other factors that could significantly affect the Company’s internal controls subsequent to the date of their evaluation. There were no significant material weaknesses identified in the course of such review and evaluation and, therefore, no corrective measures were taken by the Company.
Legal Proceedings
The Company and its subsidiaries are parties to numerous claims and lawsuits arising in the course of their normal business activities, some of which involve claims for substantial amounts. Although the ultimate outcome of these suits cannot be ascertained at this time, it is the opinion of management that none of these matters, when resolved, will have a material effect on the Company’s consolidated results of operations or financial position.
Competition
All aspects of the Company’s business are highly competitive. The Company faces aggressive competition from other domestic and foreign lending institutions and from numerous other providers of financial services. The ability of nonbanking financial institutions to provide services previously reserved for commercial banks has intensified competition. Because nonbanking financial institutions are not subject to the same regulatory restrictions as banks and bank holding companies, they can often operate with greater flexibility and lower cost structures. Securities firms and insurance companies that elect to become financial holding companies may acquire banks and other financial institutions. This may significantly change the competitive environment in which the Company and its subsidiaries conduct business.
Properties
The Company’s headquarters are located in Atlanta, Georgia. As of December 31, 2002, SunTrust Bank owned 728 of its 1,184 full-service banking offices, and leased the remaining banking offices. (See Note 9 to the Consolidated Financial Statements.)
management’s discussion | 52 | SunTrust 2002 Annual Report |
management’s statement of responsibility for financial information
Financial statements and information in this Annual Report were prepared in conformity with generally accepted accounting principles. Management is responsible for the integrity and objectivity of the financial statements and related information. Accordingly, it maintains an extensive system of internal controls and accounting policies and procedures to provide reasonable assurance of the accountability and safeguarding of Company assets, and of the accuracy of financial information. These procedures include management evaluations of asset quality and the impact of economic events, organizational arrangements that provide an appropriate division of responsibility and a program of internal audits to evaluate independently the adequacy and application of financial and operating controls and compliance with Company policies and procedures.
The Company’s independent public accountants, PricewaterhouseCoopers LLP, express their opinion as to the fairness of the financial statements presented. Their opinion is based on an audit conducted in accordance with generally accepted auditing standards as described in the second paragraph of their report.
The Board of Directors, through its Audit Committee, is responsible for ensuring that both management and the independent public accountants fulfill their respective responsibilities with regard to the financial statements. The Audit Committee, composed entirely of directors who are not officers or employees of the Company, meets periodically with both management and the independent public accountants to ensure that each is carrying out its responsibilities. The independent public accountants have full and free access to the Audit Committee and meet with it, with and without management present, to discuss auditing and financial reporting matters.
The Company assessed its internal control system as of December 31, 2002, in relation to criteria for effective internal control over consolidated financial reporting described in “Internal Control — Integrated Framework” issued by the Committee of Sponsoring Organizations of the Treadway Commission. Based on this assessment, the Company believes that, as of December 31, 2002, its system of internal controls over consolidated financial reporting met those criteria.
L. PHILLIP HUMANN | |
| |
Chairman of the Board of Directors,
President and Chief Executive Officer | |
| |
JOHN W. SPIEGEL | |
| |
Vice Chairman
and Chief Financial Officer | |
| |
JORGE ARRIETA | |
| |
Senior Vice President
and Controller | |
Abbreviations | |
Within the Consolidated Financial Statements and the notes thereto, the following references will be used: | |
| SunTrust Banks, Inc. – Company or SunTrust | |
| SunTrust Bank Holding Company – Bank Parent Company | |
| SunTrust Bank – Bank | |
| | |
Index To Consolidated Financial Statements | |
| | Page |
| |
|
| Consolidated Statements Of Income | 55 |
| Consolidated Balance Sheets | 56 |
| Consolidated Statements Of Shareholders’ Equity | 57 |
| Consolidated Statements Of Cash Flow | 58 |
| Notes To Consolidated Financial Statements | 59 |
SunTrust 2002 Annual Report | 53 | management’s statement of responsibility for financial information |
report of independent accountants
To the Board of Directors and Shareholders of SunTrust Banks, Inc.:
In our opinion, the accompanying consolidated balance sheets and the related consolidated statements of income, shareholders’ equity and cash flows present fairly, in all material respects, the financial position of SunTrust Banks, Inc. and its subsidiaries at December 31, 2002 and 2001, and the results of their operations and their cash flows for each of the three years in the period ended December 31, 2002 in conformity with accounting principles generally accepted in the United States of America. These financial statements are the responsibility of the Company’s management; our responsibility is to express an opinion on these financial statements based on our audits. We conducted our audits of these statements in accordance with auditing standards generally accepted in the United States of America, which require that we plan and perform the audit to obtain reasonable assurance about whether the financial statements are free of material misstatement. An audit includes examining, on a test basis, evidence supporting the amounts and disclosures in the financial statements, assessing the accounting principles used and significant estimates made by management, and evaluating the overall financial statement presentation. We believe that our audits provide a reasonable basis for our opinion.
As discussed in Note 1 to the Consolidated Financial Statements, during 2002 the Corporation changed its method of accounting for goodwill and intangible assets.
/s/ PRICEWATERHOUSE COOPERS LLP | |
| |
Atlanta, Georgia
January 24, 2003 | |
Report of independent public accounts | 54 | SunTrust 2002 Annual Report |
consolidated statements of income
| | Year Ended December 31 | |
| |
| |
(Dollars in thousands except per share data) | | 2002 | | 2001 | | 2000 | |
| |
| |
| |
| |
Interest Income | | | | | | | | | | |
| Interest and fees on loans | | $ | 3,959,041 | | $ | 4,908,775 | | $ | 5,605,320 | |
| Interest and fees on loans held for sale | | | 280,353 | | | 211,471 | | | 110,563 | |
| Interest and dividends on securities available for sale | | | | | | | | | | |
| | Taxable interest | | | 755,664 | | | 965,694 | | | 916,573 | |
| | Tax-exempt interest | | | 21,267 | | | 27,669 | | | 25,794 | |
| | Dividends1 | | | 62,967 | | | 68,207 | | | 64,885 | |
| Interest on funds sold | | | 24,475 | | | 51,164 | | | 92,782 | |
| Interest on deposits in other banks | | | 7,018 | | | 5,743 | | | 865 | |
| Other interest | | | 24,412 | | | 40,851 | | | 28,637 | |
| | |
|
| |
|
| |
|
| |
| | Total interest income | | | 5,135,197 | | | 6,279,574 | | | 6,845,419 | |
| | | |
|
| |
|
| |
|
| |
Interest Expense | | | | | | | | | | |
| Interest on deposits | | | 1,117,296 | | | 1,812,385 | | | 2,452,919 | |
| Interest on funds purchased | | | 140,463 | | | 412,218 | | | 651,235 | |
| Interest on other short-term borrowings | | | 14,062 | | | 63,359 | | | 97,903 | |
| Interest on long-term debt | | | 619,667 | | | 739,012 | | | 534,924 | |
| | |
|
| |
|
| |
|
| |
| | Total interest expense | | | 1,891,488 | | | 3,026,974 | | | 3,736,981 | |
| | | |
|
| |
|
| |
|
| |
Net Interest Income | | | 3,243,709 | | | 3,252,600 | | | 3,108,438 | |
| Provision for loan losses – Note 8 | | | 469,792 | | | 275,165 | | | 133,974 | |
| | |
|
| |
|
| |
|
| |
| Net interest income after provision for loan losses | | | 2,773,917 | | | 2,977,435 | | | 2,974,464 | |
| | |
|
| |
|
| |
|
| |
Noninterest Income | | | | | | | | | | |
| Trust and investment management income | | | 504,548 | | | 486,116 | | | 493,929 | |
| Fees and other charges – Note 25 | | | 730,461 | | | 570,168 | | | 525,920 | |
| Service charges on deposit accounts | | | 612,918 | | | 510,249 | | | 459,653 | |
| Mortgage production | | | 215,166 | | | 186,114 | | | 90,061 | |
| Mortgage servicing | | | (110,088 | ) | | (6,073 | ) | | 32,832 | |
| Other noninterest income – Note 25 | | | 234,123 | | | 256,169 | | | 164,614 | |
| Securities gains – Note 6 | | | 204,547 | | | 153,080 | | | 6,616 | |
| | |
|
| |
|
| |
|
| |
| | Total noninterest income | | | 2,391,675 | | | 2,155,823 | | | 1,773,625 | |
| | | |
|
| |
|
| |
|
| |
Noninterest Expense | | | | | | | | | | |
| Salaries and other compensation – Note 17 | | | 1,634,965 | | | 1,588,431 | | | 1,468,967 | |
| Employee benefits – Note 17 | | | 306,415 | | | 192,969 | | | 175,035 | |
| Equipment expense | | | 174,809 | | | 189,763 | | | 193,709 | |
| Net occupancy expense | | | 229,258 | | | 210,436 | | | 202,608 | |
| Marketing and customer development | | | 79,987 | | | 103,998 | | | 106,215 | |
| Merger-related expenses | | | 15,998 | | | — | | | 42,444 | |
| Other noninterest expense – Note 26 | | | 900,836 | | | 827,941 | | | 639,555 | |
| | |
|
| |
|
| |
|
| |
| Total noninterest expense | | | 3,342,268 | | | 3,113,538 | | | 2,828,533 | |
| | |
|
| |
|
| |
|
| |
| Income before provision for income taxes and extraordinary gain | | | 1,823,324 | | | 2,019,720 | | | 1,919,556 | |
| Provision for income taxes – Note 16 | | | 491,515 | | | 650,501 | | | 625,456 | |
| | |
|
| |
|
| |
|
| |
| Income before extraordinary gain | | | 1,331,809 | | | 1,369,219 | | | 1,294,100 | |
| Extraordinary gain, net of taxes – Notes 3 and 16 | | | — | | | 6,318 | | | — | |
| | |
|
| |
|
| |
|
| |
| | Net Income | | $ | 1,331,809 | | $ | 1,375,537 | | $ | 1,294,100 | |
| | | |
|
| |
|
| |
|
| |
| Net income per average common share – Note 15: | | | | | | | | | | |
| | Diluted | | | | | | | | | | |
| | Income before extraordinary gain | | $ | 4.66 | | $ | 4.70 | | $ | 4.30 | |
| | Extraordinary gain | | | — | | | 0.02 | | | — | |
| | | |
|
| |
|
| |
|
| |
| | Net income | | $ | 4.66 | | $ | 4.72 | | $ | 4.30 | |
| | | |
|
| |
|
| |
|
| |
| | Basic | | | | | | | | | | |
| | Income before extraordinary gain | | $ | 4.71 | | $ | 4.76 | | $ | 4.35 | |
| | Extraordinary gain | | | — | | | 0.02 | | | — | |
| | | |
|
| |
|
| |
|
| |
| | Net income | | $ | 4.71 | | $ | 4.78 | | $ | 4.35 | |
| | | |
|
| |
|
| |
|
| |
| Average common shares – diluted | | | 286,052 | | | 291,584 | | | 300,956 | |
| Average common shares – basic | | | 282,495 | | | 287,702 | | | 297,834 | |
1 Includes dividends on 48,266,496 shares of common stock of The Coca-Cola Company | | $ | 38,613 | | $ | 34,752 | | $ | 32,821 | |
| | |
|
| |
|
| |
|
| |
| | | | | | | | | | | | |
See notes to Consolidated Financial Statements.
SunTrust 2002 Annual Report | 55 | consolidated statements of income |
consolidated balance sheets
| | At December 31 | |
| |
| |
(Dollars in thousands) | | 2002 | | 2001 | |
| |
| |
| |
Assets | | | | | | | |
| Cash and due from banks | | $ | 4,455,776 | | $ | 4,229,074 | |
| Interest-bearing deposits in other banks | | | 10,238 | | | 185,861 | |
| Funds sold and securities purchased under agreements to resell – Note 4 | | | 1,092,281 | | | 1,495,109 | |
| Trading assets – Note 5 | | | 1,717,774 | | | 1,343,602 | |
Securities available for sale1 – Note 6 | | | 23,445,182 | | | 19,656,391 | |
| Loans held for sale – Note 19 | | | 7,747,793 | | | 4,319,594 | |
| Loans – Notes 7, 18, 19 and 20 | | | 73,167,935 | | | 68,959,222 | |
| Allowance for loan losses – Note 8 | | | (930,114 | ) | | (867,059 | ) |
| | |
|
| |
|
| |
| | Net loans | | | 72,237,821 | | | 68,092,163 | |
| Premises and equipment – Note 9 | | | 1,607,200 | | | 1,584,869 | |
| Goodwill – Note 10 | | | 963,761 | | | 440,497 | |
| Other intangible assets – Note 10 | | | 612,158 | | | 370,779 | |
| Customers’ acceptance liability | | | 45,594 | | | 55,171 | |
| Other assets – Note 17 | | | 3,386,945 | | | 2,967,534 | |
| | |
|
| |
|
| |
| | Total assets | | $ | 117,322,523 | | $ | 104,740,644 | |
| | |
|
| |
|
| |
Liabilities and Shareholders’ Equity | | | | | | | |
| Noninterest-bearing consumer and commercial deposits | | $ | 18,080,496 | | $ | 16,369,823 | |
| Interest-bearing consumer and commercial deposits | | | 52,146,314 | | | 45,911,419 | |
| | |
|
| |
|
| |
| | Total consumer and commercial deposits | | | 70,226,810 | | | 62,281,242 | |
| Brokered deposits | | | 3,169,826 | | | 2,829,687 | |
| Foreign deposits | | | 6,309,992 | | | 2,425,493 | |
| | |
|
| |
|
| |
| | Total deposits | | | 79,706,628 | | | 67,536,422 | |
Funds purchased and securities sold under
agreements to repurchase – Note 11 | | | 10,402,536 | | | 10,104,287 | |
| Other short-term borrowings – Note 12 | | | 1,368,425 | | | 1,651,639 | |
| Long-term debt - Note 14 | | | 10,229,820 | | | 11,010,580 | |
| Guaranteed preferred beneficial interests in debentures – Note 14 | | | 1,650,000 | | | 1,650,000 | |
| Acceptances outstanding | | | 45,594 | | | 55,171 | |
| Trading liabilities – Note 5 | | | 930,645 | | | 512,052 | |
| Other liabilities – Note 16 | | | 4,219,379 | | | 3,860,925 | |
| | |
|
| |
|
| |
| | Total liabilities | | | 108,553,027 | | | 96,381,076 | |
| | |
|
| |
|
| |
| Commitments and contingencies – Notes 9, 14, 18, 19 and 22 | | | | | | | |
| Preferred stock, no par value; 50,000,000 shares authorized; none issued | | | — | | | — | |
| Common stock, $1.00 par value | | | 294,163 | | | 294,163 | |
| Additional paid in capital | | | 1,276,110 | | | 1,259,609 | |
| Retained earnings | | | 6,322,217 | | | 5,479,951 | |
| Treasury stock and other | | | (632,464 | ) | | (329,408 | ) |
| | |
|
| |
|
| |
| | Realized shareholders’ equity | | | 7,260,026 | | | 6,704,315 | |
| Accumulated other comprehensive income – Notes 6 and 24 | | | 1,509,470 | | | 1,655,253 | |
| | |
|
| |
|
| |
| | Total shareholders’ equity | | | 8,769,496 | | | 8,359,568 | |
| | | |
|
| |
|
| |
| | Total liabilities and shareholders’ equity | | $ | 117,322,523 | | $ | 104,740,644 | |
| | |
|
| |
|
| |
| Common shares outstanding | | | 282,504,571 | | | 288,601,607 | |
| Common shares authorized | | | 750,000,000 | | | 750,000,000 | |
| Treasury shares of common stock | | | 11,658,186 | | | 5,561,150 | |
1Includes net unrealized gains on securities available for sale | | $ | 2,421,562 | | $ | 2,632,266 | |
| | |
|
| |
|
| |
| | | | | | | | | |
See notes to Consolidated Financial Statements.
consolidated balance sheets | 56 | SunTrust 2002 Annual Report |
consolidated statements of shareholders’ equity
(In thousands) | | Common
Stock | | Additional
Paid in
Capital | | Retained
Earnings | | Treasury
Stock and
Other1 | | Accumulated
Other
Comprehensive
Income | | Total | |
| |
| |
| |
| |
| |
| |
| |
Balance, January 1, 2000 | | $ | 323,163 | | $ | 1,293,387 | | $ | 5,461,351 | | $ | (1,013,861 | ) | $ | 1,562,822 | | $ | 7,626,862 | |
| Net income | | | — | | | — | | | 1,294,100 | | | — | | | — | | | 1,294,100 | |
| Other comprehensive income: | | | | | | | | | | | | | | | | | | | |
| Change in unrealized gains (losses) on securities, net of taxes | | | — | | | — | | | — | | | — | | | 379,952 | | | 379,952 | |
| | | | | | | | | | | | | | | | | |
|
| |
| Total comprehensive income | | | | | | | | | | | | | | | | | | 1,674,052 | |
| Cash dividends declared, $1.48 per share | | | — | | | — | | | (443,407 | ) | | — | | | — | | | (443,407 | ) |
| Exercise of stock options | | | — | | | (11,767 | ) | | — | | | 29,672 | | | — | | | 17,905 | |
| Acquisition of treasury stock | | | — | | | — | | | — | | | (668,391 | ) | | — | | | (668,391 | ) |
| Restricted stock activity | | | — | | | (795 | ) | | — | | | 795 | | | — | | | — | |
| Amortization of compensation element of restricted stock | | | — | | | — | | | — | | | 9,408 | | | — | | | 9,408 | |
| Issuance of stock for employee benefit plans | | | — | | | (6,409 | ) | | — | | | 29,188 | | | — | | | 22,779 | |
| | |
|
| |
|
| |
|
| |
|
| |
|
| |
|
| |
Balance, December 31, 2000 | | | 323,163 | | | 1,274,416 | | | 6,312,044 | | | (1,613,189 | ) | | 1,942,774 | | | 8,239,208 | |
| Net income | | | — | | | — | | | 1,375,537 | | | — | | | — | | | 1,375,537 | |
| Other comprehensive income: | | | | | | | | | | | | | | | | | | | |
| Adoption of SFAS No. 133 | | | — | | | — | | | — | | | — | | | (10,560 | ) | | (10,560 | ) |
| Change in unrealized gains (losses) on derivatives, net of taxes | | | — | | | — | | | — | | | — | | | (45,169 | ) | | (45,169 | ) |
| Change in unrealized gains (losses) on securities, net of taxes | | | — | | | — | | | — | | | — | | | (231,792 | ) | | (231,792 | ) |
| | | | | | | | | | | | | | | | | |
|
| |
| Total comprehensive income | | | | | | | | | | | | | | | | | | 1,088,016 | |
| Cash dividends declared, $1.60 per share | | | — | | | — | | | (463,529 | ) | | — | | | — | | | (463,529 | ) |
| Exercise of stock options | | | — | | | (15,771 | ) | | — | | | 34,784 | | | — | | | 19,013 | |
| Acquisition of treasury stock | | | — | | | — | | | — | | | (551,485 | ) | | — | | | (551,485 | ) |
| Retirement of treasury stock | | | (29,000 | ) | | — | | | (1,744,101 | ) | | 1,773,101 | | | — | | | — | |
| Restricted stock activity | | | — | | | 103 | | | — | | | (103 | ) | | — | | | — | |
| Amortization of compensation element of restricted stock | | | — | | | — | | | — | | | 6,110 | | | — | | | 6,110 | |
| Issuance of stock for employee benefit plans | | | — | | | 861 | | | — | | | 21,374 | | | — | | | 22,235 | |
| | |
|
| |
|
| |
|
| |
|
| |
|
| |
|
| |
Balance, December 31, 2001 | | | 294,163 | | | 1,259,609 | | | 5,479,951 | | | (329,408 | ) | | 1,655,253 | | | 8,359,568 | |
| Net income | | | — | | | — | | | 1,331,809 | | | — | | | — | | | 1,331,809 | |
| Other comprehensive income: | | | | | | | | | | | | | | | | | | | |
| Change in unrealized gains (losses) on derivatives, net of taxes | | | — | | | — | | | — | | | — | | | 8,984 | | | 8,984 | |
| Change in unrealized gains (losses) on securities, net of taxes | | | — | | | — | | | — | | | — | | | (126,891 | ) | | (126,891 | ) |
| Accumulated other comprehensive income related to retirement plans | | | — | | | — | | | — | | | — | | | (27,876 | ) | | (27,876 | ) |
| | | | | | | | | | | | | | | | | |
|
| |
| Total comprehensive income | | | | | | | | | | | | | | | | | | 1,186,026 | |
| Cash dividends declared, $1.72 per share | | | — | | | — | | | (489,543 | ) | | — | | | — | | | (489,543 | ) |
| Exercise of stock options and stock compensation element | | | — | | | (6,801 | ) | | — | | | 19,625 | | | — | | | 12,824 | |
| Acquisition of treasury stock | | | — | | | — | | | — | | | (340,656 | ) | | — | | | (340,656 | ) |
| Restricted stock activity | | | — | | | 17,236 | | | — | | | (19,842 | ) | | — | | | (2,606 | ) |
| Amortization of compensation element of restricted stock | | | — | | | — | | | — | | | 3,074 | | | — | | | 3,074 | |
| Issuance of stock for employee benefit plans | | | — | | | 6,066 | | | — | | | 34,743 | | | — | | | 40,809 | |
| | |
|
| |
|
| |
|
| |
|
| |
|
| |
|
| |
Balance, December 31, 2002 | | $ | 294,163 | | $ | 1,276,110 | | $ | 6,322,217 | | $ | (632,464 | ) | $ | 1,509,470 | | $ | 8,769,496 | |
| | |
|
| |
|
| |
|
| |
|
| |
|
| |
|
| |
1 Balance at December 31, 2002 includes $603,602 for treasury stock and $28,862 for compensation element of restricted stock.
See notes to Consolidated Financial Statements.
SunTrust 2002 Annual Report | 57 | consolidated statements of shareholder’s equity |
consolidated statements of cash flow
| | Year Ended December 31 | |
| |
| |
(Dollars in thousands) | | 2002 | | 2001 | | 2000 | |
| |
| |
| |
| |
Cash Flows from Operating Activities | | | | | | | | | | |
| Net income | | $ | 1,331,809 | | $ | 1,375,537 | | $ | 1,294,100 | |
| Adjustments to reconcile net income to net cash (used in) provided by operating activities: | | | | | | | | | | |
| | Extraordinary gain, net of taxes | | | — | | | (6,318 | ) | | — | |
| | Depreciation, amortization and accretion | | | 619,965 | | | 357,371 | | | 299,957 | |
| | Origination of mortgage servicing rights | | | (194,563 | ) | | (122,970 | ) | | (71,784 | ) |
| | Provisions for loan losses and foreclosed property | | | 470,730 | | | 275,541 | | | 134,353 | |
| | Deferred income tax provision | | | 146,326 | | | 42,035 | | | 190,103 | |
| | Amortization of compensation element of restricted stock | | | 3,074 | | | 6,110 | | | 9,408 | |
| | Securities gains | | | (204,547 | ) | | (153,080 | ) | | (6,616 | ) |
| | Net gain on sale of assets | | | (16,030 | ) | | (8,467 | ) | | (9,777 | ) |
| | Originated loans held for sale | | | (28,954,686 | ) | | (21,455,760 | ) | | (9,947,904 | ) |
| | Sales of loans held for sale | | | 25,526,486 | | | 18,895,447 | | | 9,720,410 | |
| | Net increase in accrued interest receivable, prepaid expenses and other assets | | | (935,377 | ) | | (715,448 | ) | | (1,382,175 | ) |
| | Net increase in accrued interest payable, accrued expenses and other liabilities | | | 643,203 | | | 359,155 | | | 323,302 | |
| | | |
|
| |
|
| |
|
| |
| | Net cash (used in) provided by operating activities | | | (1,563,610 | ) | | (1,150,847 | ) | | 553,377 | |
| | | |
|
| |
|
| |
|
| |
Cash Flows from Investing Activities | | | | | | | | | | |
| Proceeds from maturities of securities available for sale | | | 5,217,479 | | | 3,114,827 | | | 2,195,575 | |
| Proceeds from sales of securities available for sale | | | 5,626,929 | | | 5,419,095 | | | 1,365,509 | |
| Purchases of securities available for sale | | | (14,687,010 | ) | | (7,754,258 | ) | | (2,620,549 | ) |
| Net (increase) decrease in loans | | | (2,812,465 | ) | | 278,445 | | | (7,638,602 | ) |
| Proceeds from sale of loans | | | 721,195 | | | 762,405 | | | 286,527 | |
| Capital expenditures | | | (123,245 | ) | | (89,224 | ) | | (145,821 | ) |
| Proceeds from the sale of other assets | | | 29,599 | | | 35,889 | | | 40,234 | |
| Loan recoveries | | | 67,849 | | | 53,576 | | | 58,956 | |
| Acquisition of Huntington-Florida | | | 1,160,333 | | | — | | | — | |
| | |
|
| |
|
| |
|
| |
| | Net cash (used in) provided by investing activities | | | (4,799,336 | ) | | 1,820,755 | | | (6,458,171 | ) |
| | | |
|
| |
|
| |
|
| |
Cash Flows from Financing Activities | | | | | | | | | | |
| Net increase in consumer and commercial deposits | | | 3,481,945 | | | 5,644,915 | | | 983,457 | |
| Net increase (decrease) in foreign and brokered deposits | | | 4,224,638 | | | (7,641,830 | ) | | 8,449,351 | |
| Net increase in funds purchased and other short-term borrowings | | | (131,681 | ) | | (902,003 | ) | | (5,512,998 | ) |
| Proceeds from the issuance of long-term debt | | | 1,451,692 | | | 7,114,068 | | | 4,191,114 | |
| Repayment of long-term debt | | | (2,236,225 | ) | | (3,392,600 | ) | | (1,263,030 | ) |
| Proceeds from the exercise of stock options and stock compensation expense | | | 12,824 | | | 19,013 | | | 17,905 | |
| Proceeds from stock issuance | | | 40,809 | | | 22,235 | | | 22,779 | |
| Acquisition of treasury stock | | | (340,656 | ) | | (551,485 | ) | | (668,391 | ) |
| Restricted stock activity | | | (2,606 | ) | | — | | | — | |
| Dividends paid | | | (489,543 | ) | | (463,529 | ) | | (443,407 | ) |
| | |
|
| |
|
| |
|
| |
| | Net cash provided by (used in) financing activities | | | 6,011,197 | | | (151,216 | ) | | 5,776,780 | |
| | | |
|
| |
|
| |
|
| |
| Net (decrease) increase in cash and cash equivalents | | | (351,749 | ) | | 518,692 | | | (128,014 | ) |
| Cash and cash equivalents at beginning of year | | | 5,910,044 | | | 5,391,352 | | | 5,519,366 | |
| | |
|
| |
|
| |
|
| |
| Cash and cash equivalents at end of period | | $ | 5,558,295 | | $ | 5,910,044 | | $ | 5,391,352 | |
| | |
|
| |
|
| |
|
| |
Supplemental Disclosure | | | | | | | | | | |
| Interest paid | | $ | 1,926,320 | | $ | 3,118,383 | | $ | 3,618,302 | |
| Income taxes paid | | | 440,518 | | | 446,814 | | | 540,212 | |
| Non-cash impact of securitizing loans | | | — | | | 1,903,518 | | | 925,380 | |
| Non-cash impact of STAR Systems Inc. sale | | | — | | | 52,919 | | | — | |
| | |
|
| |
|
| |
|
| |
| | | | | | | | | | | | | |
See notes to Consolidated Financial Statements.
consolidated statements of cash flows | 58 | SunTrust 2002 Annual Report |
notes to consolidated financial statements
NOTE 1 Accounting Policies
General
The Consolidated Financial Statements include the accounts of the Company and its subsidiaries. All significant intercompany accounts and transactions have been eliminated. Results of operations of companies purchased are included from the dates of acquisition. Assets and liabilities of purchased companies are stated at estimated fair values at the date of acquisition.
The preparation of financial statements in conformity with accounting principles generally accepted in the United States requires management to make estimates and assumptions that affect the reported amounts of assets and liabilities, the disclosure of contingent assets and liabilities at the date of the financial statements and the reported amounts of revenues and expenses during the reporting period. Actual results could vary from these estimates; however, in the opinion of management, such variances would not be material. Certain reclassifications have been made to prior year amounts to conform to the 2002 presentation.
Securities
Securities in the investment portfolio are classified as securities available for sale and are carried at market value with unrealized gains and losses, net of any tax effect, included in accumulated other comprehensive income and added to or deducted from realized shareholders’ equity to determine total shareholders’ equity. Realized gains and losses on the securities portfolio are determined using the specific identification method, recognized currently in the Consolidated Statements of Income.
Trading account securities are carried at market value with the gains and losses determined using the specific identification method, recognized currently in the Consolidated Statements of Income. Included in noninterest income are realized and unrealized gains and losses resulting from such market value adjustments of trading account securities and from recording the results of sales.
Loans Held For Sale
Loans held for sale that are not documented as the hedged item in a fair value hedge are carried at the lower of aggregate cost or market value. Adjustments to reflect market value and realized gains and losses upon ultimate sale of the loans are classified as other noninterest income.
Loans held for sale that are documented as the hedged item in a fair value hedge, are carried at fair value. Fair value is based on the contract prices at which the mortgage loans will be sold, or if the loans are not committed for sale, the current market price.
The Company classifies certain residential mortgage loans and student loans as Loans Held for Sale. Upon transfer to Loans Held for Sale, any losses are recorded through the Allowance for Loan Losses with subsequent losses recorded as a component of noninterest expense.
Loans
Interest income on all types of loans is accrued based upon the outstanding principal amounts, except those classified as nonaccrual loans. Interest accrual is discontinued when it appears that future collection of principal or interest according to the contractual terms may be doubtful. Interest income on nonaccrual loans is recognized on a cash basis if there is no doubt of future collection of principal. Loans classified as nonaccrual, except for smaller balance homogenous loans, which include consumer and residential loans, meet the criteria to be considered impaired loans. The Company classifies a loan as nonaccrual with the occurrence of one of the following events: (i) interest or principal has been in default 90 days or more, unless the loan is well-secured and in the process of collection; (ii) collection of recorded interest or principal is not anticipated; or (iii) income for the loan is recognized on a cash basis due to the deterioration in the financial condition of the debtor. Consumer and residential mortgage loans are typically placed on nonaccrual when payments have been in default for 90 days or more. (See Allowance for Loan Losses section of this Note for further discussion of impaired loans.)
Fees and incremental direct costs associated with the loan origination and pricing process are deferred and amortized as level yield adjustments over the respective loan terms. Fees received for providing loan commitments and letter of credit facilities that result in loans are deferred and then recognized over the term of the loan as an adjustment of the yield. Fees on commitments and letters of credit that are not expected to be funded are amortized into noninterest income by the straight-line method over the commitment period.
SunTrust 2002 Annual Report | 59 | notes to consolidated financial statements |
notes to consolidated financial statements
Allowance For Loan Losses
The Company’s allowance for loan losses is that amount considered adequate to absorb inherent losses in the portfolio based on management’s evaluations of the size and current risk characteristics of the loan portfolio. Such evaluations consider the level of problem loans, prior loan loss experience, as well as the impact of current economic conditions, portfolio concentrations and other risk factors. Specific allowances for loan losses are established for individual impaired loans as required per SFAS Nos. 114 and 118. In addition to specific allowances on impaired loans, SunTrust’s methodology estimates specific reserves on loans that have internal credit risk ratings below a predetermined classification and credit exposure above a specified dollar threshold. The specific allowance established for these loans is based on a careful analysis of the most probable source of repayment, including the present value of the loan’s expected future cash flow, the loan’s estimated market value or the estimated fair value of the underlying collateral. General allowances are established for loans that can be grouped into pools based on similar characteristics as outlined in SFAS No. 5. In this process, general allowance factors are based on the results of a statistical loss migration analysis and other analyses of recent and historical charge-off experience and are typically applied to the portfolio in terms of loan type and internal credit risk ratings. Economic conditions, concentrations and other risk factors are based on national economic indicators, concentrations of credit risk and administrative factors that are not otherwise addressed and have a bearing on the collectibility of loans.
Premises and Equipment
Premises and equipment are stated at cost less accumulated depreciation and amortization. Depreciation has been calculated primarily using the straight-line method over the assets’ estimated useful lives. Certain leases are capitalized as assets for financial reporting purposes. Such capitalized assets are amortized, using the straight-line method, over the terms of the leases. Maintenance and repairs are charged to expense and betterments are capitalized.
Goodwill and Other Intangible Assets
Goodwill represents the excess of purchase price over the fair value of identifiable net assets of acquired companies. Goodwill was amortized using the straight-line method over various periods ranging from 25 to 40 years through December 31, 2001. Year-to-date December 31, 2001 earnings included net-of-tax amortization of goodwill totaling $36.1 million. On January 1, 2002, SunTrust adopted SFAS No. 142, “Goodwill and Other Intangible Assets.” Under SFAS No. 142, goodwill, including that acquired before initial application of the standard, is no longer amortized but is tested for impairment at least annually. Based on impairment tests performed, the Company determined there was no impairment of goodwill as of December 31, 2002.
All other identified, finite-lived intangible assets are amortized over their useful lives and evaluated for impairment whenever events or changes in circumstances indicate the carrying amount of the assets may not be recoverable.
Mortgage Servicing Rights
The Company recognizes as assets the rights to service mortgage loans for others whether the servicing rights are acquired through purchase or loan origination. Purchased mortgage servicing rights (“MSRs”) are capitalized at cost. The carrying value of MSRs is maintained on the balance sheet in intangible assets. For loans originated and sold where the servicing rights have been retained, the Company allocates the cost of the loan and the servicing rights based on their relative fair market values. Fair value is determined through a review of valuation assumptions that are supported by market and economic data collected from various outside sources. The Company records amortization of the MSRs based on two components; first, the Company amortizes fully the remaining balance of all MSRs for loans paid-in-full in recognition of the termination of future cash flow streams; and second, normal amortization (amortization of the surviving MSRs) is recorded based on the current market cash flows. The current market cash flows are calculated and updated monthly by applying market-driven prepayment speed assumptions.
Impairment for MSRs is determined based on the fair value of the rights, stratified according to interest rate and type of related loan. Impairment, if any, is recognized through a valuation allowance with a corresponding charge recorded in the income statement.
SunTrust 2002 Annual Report | 60 | notes to consolidated financial statements |
Loan Sales and Securitizations
The Company sells residential mortgages and other loans and has securitized mortgage loans. Retained interests in securitized assets, including debt securities, are initially recorded at their allocated carrying amounts based on the relative fair value of assets sold and retained. Retained interests are subsequently carried at fair value, which is generally estimated based on the present value of expected cash flows, calculated using management’s best estimates of key assumptions, including credit losses, loan repayment speeds and discount rates commensurate with the risks involved. Gains or losses on sales and servicing fees are recorded in noninterest income.
Income Taxes
Deferred income tax assets and liabilities result from temporary differences between the tax bases of assets and liabilities and their reported amounts in the financial statements that will result in taxable or deductible amounts in future years.
Earnings Per Share
Basic earnings per share are based on the weighted average number of common shares outstanding during each period. Diluted earnings per share are based on the weighted average number of common shares outstanding during each period, plus common shares calculated for stock options and performance restricted stock outstanding using the treasury stock method.
Cash Flows
For purposes of reporting cash flows, cash and cash equivalents include cash and due from banks, interest-bearing deposits in other banks and funds sold and securities purchased under agreements to resell (only those items with an original maturity of three months or less).
Derivative Financial Instruments
It is the policy of the Company to record all derivative financial instruments at fair value in the financial statements. The Company uses derivative instruments to hedge interest rate exposure by modifying the characteristics of the related balance sheet instruments. Derivatives that do not qualify as hedges are carried at their current market value on the balance sheet and changes in their fair value are recorded as trading income in the current period.
The Company adopted SFAS No. 133 on January 1, 2001. Accordingly, all derivatives were recognized on the balance sheet at their fair value on this date. In accordance with the transition provisions of SFAS No. 133, the Company recorded certain transition adjustments. The impact of such transition adjustments to net income was a gain of $1.6 million and a net transition loss of $10.6 million included in Other Comprehensive Income on January 1, 2001. Under the provisions of SFAS No. 133, on the date that a derivative contract is entered into, the Company designates the derivative as (1) a hedge of the fair value of a recognized asset or liability or of an unrecognized firm commitment (“fair value” hedge); (2) a hedge of a forecasted transaction or of the variability of cash flows to be received or paid related to a recognized asset or liability (“cash flow” hedge); (3) a foreign-currency fair-value or cash-flow hedge (“foreign currency” hedge); or (4) held for trading (“trading instruments”). Changes in the fair value of a derivative that is highly effective, and that has been designated and qualifies as a fair-value hedge, along with the loss or gain on the hedged asset or liability that is attributable to the hedged risk (including losses or gains on firm commitments), are recorded in current-period earnings. Changes in the fair value of a derivative that is highly effective, and that is designated and qualifies as a cash flow hedge, are recorded in other comprehensive income, with any ineffective portion recorded in current-period earnings. Changes in the fair value of derivative trading instruments are reported in current-period earnings.
Stock-Based Compensation
The Company sponsors a stock-based employee compensation plan, which is described more fully in Note 17. Prior to 2002, the Company accounted for the plan under the recognition and measurement provisions of APB Opinion No. 25, “Accounting for Stock Issued to Employees,” and related Interpretations. No stock-based employee compensation cost is reflected in prior years’ net income since all options granted had an exercise price equal to market value on the date of grant. Effective January 1, 2002, the Company adopted the fair-value recognition provisions of SFAS No. 123, “Accounting for Stock-Based Compensation,” prospectively, to all awards granted after January 1, 2002. Awards under the Company’s plan typically vest over three years. The cost related to stock-based employee compensation included in the determination of net income for 2002 is less than that which would have been recognized if the fair-value based method had been applied to all awards since the original effective date of SFAS No. 123. The effect on net income and earnings per share if the fair-value based method had been applied to all awards in each period is included in Note 17.
Off-Balance Sheet Entities
The Company has a commercial paper conduit relationship with a special purpose entity (“SPE”), Three Pillars Funding Corporation (“Three Pillars”). See Note 18 for further discussion of Three Pillars. As of December 31, 2002, the Company was not required to consolidate Three Pillars based on the requirements of SFAS No. 140, “Accounting for Transfers and Servicing of Financial Assets and Extinguishments of Liabilities,” Accounting Research Bulletin (“ARB”) 51, “Consolidated Financial Statements,” SFAS No. 94, “Consolidation of All Majority-Owned Subsidiaries,” EITF D-14, “Transactions involving Special-Purpose Entities,” and other generally accepted accounting principles.
SunTrust 2002 Annual Report | 61 | notes to consolidated financial statements |
notes to consolidated financial statements
In determining when to consolidate an SPE, the Company considered whether a third party has made a substantive equity investment in the SPE; which parties have voting rights, if any; who makes decisions about the assets and liabilities in the SPE; and who is at risk for loss. Considering these factors, the SPE is consolidated if the Company retains or acquires control over the risks and rewards of the assets in the SPE.
In January 2003, FASB issued Interpretation (“FIN”) No. 46, “Consolidation of Variable Interest Entities,” an Interpretation of ARB 51 that addresses consolidation by business enterprises of variable interest entities. FIN No. 46 also nullifies the consensus reached in EITFD-14 and modifies or nullifies various other EITF issues. Beginning in 2003, the Company is applying the guidance issued in FIN No. 46 to determine whether to consolidate variable interest entities.
Recent Accounting Developments
SFAS No. 144, “Accounting for the Impairment or Disposal of Long-Lived Assets,” was issued during the third quarter of 2001. SFAS No. 144 supercedes both SFAS No. 121, “Accounting for the Impairment of Long-Lived Assets and for Long-Lived Assets to Be Disposed Of,” which previously governed impairment of long-lived assets, and the portions of Accounting Practice Bulletin (“APB”) Opinion No. 30, “Reporting the Results of Operations — Reporting the Effects of Disposal of a Segment of a Business, and Extraordinary, Unusual and Infrequently Occurring Events and Transactions,” which addressed the disposal of a business segment. This Statement improves financial reporting by requiring one accounting model be used for long-lived assets to be disposed of by sale and by broadening the presentation of discontinued operations to include more disposal transactions. The Company adopted SFAS No. 144 effective January 1, 2002, and it did not have a material impact on the Company’s financial position or results of operations.
In May of 2002, the FASB issued SFAS No. 145, “Rescission of FASB Statements No. 4, 44, and 64, Amendment of FASB Statement No. 13, and Technical Corrections as of April 2002.” This Statement rescinds SFAS No. 4 and 64, “Reporting Gains and Losses from Extinguishment of Debt” and “Extinguishments of Debt Made to Satisfy Sinking-Fund Requirements,” respectively, and restricts the classification of early extinguishment of debt as an extraordinary item to the provisions of APB Opinion No. 30. The Statement also rescinds SFAS No. 44, “Accounting for Intangible Assets of Motor Carriers,” which is no longer necessary because the transition to the provisions of the Motor Carrier Act of 1980 is complete. The Statement also amends SFAS No. 13, “Accounting for Leases,” to eliminate an inconsistency between the required accounting for sale-leaseback transactions and the required accounting for certain lease modifications that have economic effects that are similar to sale-leaseback transactions. Finally, the Statement makes various technical corrections to existing pronouncements, which are not considered substantive.
The provisions of this Statement relating to the rescission of SFAS No. 4 and 64 are effective for fiscal years beginning after May 15, 2002. The provisions relating to amendments of SFAS No. 13 are effective for transactions initiated after May 15, 2002, and all other provisions are effective for financial statements issued after May 15, 2002. Additionally, there is retroactive application for any gain or loss on extinguishment of debt that was classified as extraordinary in a prior period that does not meet the criteria in APB Opinion No. 30, requiring reclassification of this gain or loss. With the exception of the rescission of SFAS No. 4 and 64, the Company adopted the provisions of this Statement, and it did not have a material impact on the Company’s financial position or results of operations. The provisions relating to the rescission of SFAS No. 4 and 64, which will eliminate the requirement that extinguishment of debt be accounted for as an extraordinary item, will be adopted effective January 1, 2003. The Company does not expect the remaining provisions of this Statement to have a material impact on the Company’s financial position or results of operations.
In June 2002, the FASB issued SFAS No. 146, “Accounting for Costs Associated with Exit or Disposal Activities.” SFAS No. 146 provides guidance on the recognition and measurement of liabilities for costs associated with exit or disposal activities. SFAS No. 146 is effective for exit or disposal activities that are initiated after December 31, 2002. The adoption of this Statement is not expected to have a material impact on the Company’s financial position or results of operations.
SFAS No. 147, “Acquisitions of Certain Financial Institutions, an amendment of FASB Statements No. 72 and 144, and Interpretation No. 9,” was issued in July 2002. Except for transactions between two or more mutual enterprises, this Statement removes financial institutions from the scope of both Statement No. 72, “Accounting for Certain Acquisitions of Banking or Thrift Institutions” and Interpretation No. 9, “Applying APB Opinion No. 16 and 17 When a Savings and Loan Association or a Similar Institution Is Acquired in a Business Combination Accounted for by the Purchase Method,” and requires that those transactions be accounted for in accordance with SFAS Nos. 141 and 142. Additionally, this Statement amends SFAS No. 144 to include in its scope long-term customer-relationship intangible assets of financial institutions. The Company adopted this Statement effective October 1, 2002, and it did not have a material impact on the Company’s financial position or results of operations.
notes to consolidated financial statements | 62 | SunTrust 2002 Annual Report |
In November 2002, FASB issued FIN No. 45, “Guarantor’s Accounting and Disclosure Requirements for Guarantees, Including Indirect Guarantees of Indebtedness of Others, an interpretation of FASB Statements No. 5, 57, and 107 and Rescission of FIN No. 34.” FIN 45 details the disclosures that should be made by a guarantor in its interim and annual financial statements about its obligations under certain guarantees that it has issued. The Interpretation also requires a company to record a liability for certain guarantees that have been issued. The disclosure provisions are effective for interim or annual periods ending after December 15, 2002. The recognition requirements of the Interpretation are effective for all guarantees issued or modified subsequent to December 31, 2002. The Company has incorporated the necessary disclosures in Note 19 to the Consolidated Financial Statements. The Company is currently assessing the potential impact of the recognition requirements, which will result in additional liabilities recorded for guarantees that fall within the scope of the Interpretation. The Company does not expect the adoption of this Interpretation to have a material impact on the Company’s financial position or results of operations.
In December 2002, the FASB issued SFAS No. 148, “Accounting for Stock-Based Compensation-Transition and Disclosure.” SFAS No.148 amends SFAS No. 123, “Accounting for Stock-Based Compensation,” to provide three alternative methods of transition to SFAS 123’s fair-value method of accounting for stock-based compensation. The Statement also amends disclosure provisions of SFAS No. 123 and APB Opinion No. 28, “Interim Financial Reporting,” to require additional disclosures in annual and interim financial statements. The Statement is effective for fiscal years ending after December 15, 2002. The amendment of the disclosure requirements of Opinion 28 is effective for interim financial reports beginning after December 15, 2002. Effective January 1, 2002, the Company adopted the fair-value method using the prospective method of transition. The prospective method required the Company to apply the provisions of SFAS No. 123 to new stock awards granted from the beginning of the year of adoption and going forward. Note 17 displays the financial statement impact that adoption of SFAS No. 148 had to the Company in the current year.
In January 2003, the FASB issued FIN No. 46, “Consolidation of Variable Interest Entities.” FIN 46 is an Interpretation of ARB No. 51 and addresses consolidation by business enterprises of variable interest entities (“VIEs”). The Interpretation is based on the theory that an enterprise controlling another entity through interests other than voting interests should consolidate the controlled entity. Business enterprises are required under the provisions of the Interpretation to identify VIEs, based on specified characteristics, and then determine whether they should be consolidated. An enterprise that holds a majority of the variable interests is considered the primary beneficiary, the enterprise that should consolidate the VIE. The primary beneficiary of a VIE is also required to include various disclosures in interim and annual financial statements. Additionally, an enterprise that holds a significant variable interest in a VIE, but that is not the primary beneficiary, is also required to make certain disclosures.
The Interpretation is effective for all enterprises with variable interests in VIEs created after January 31, 2003. A public entity with variable interests in a VIE created before February 1, 2003, is required to apply the provisions of this Interpretation to that entity by the end of the first interim or annual reporting period beginning after June 15, 2003.
The Company has identified various VIEs and has assessed whether it holds any variable interests in VIEs which would require consolidation or disclosure. The application of the provisions of the Interpretation will impact the Company’s financial position and results of operations; however, the total dollar impact will not be known until an evaluation of all variable interests has been completed. For any variable interest where it is reasonably possible that the Company may consolidate a VIE or where the Company has a significant variable interest in a VIE, the Company has included the required disclosures in Note 18 to the Consolidated Financial Statements.
NOTE 2 Acquisitions
The Company completed the acquisition of Huntington Bancshares, Inc.’s Florida franchise (“Huntington-Florida”) on February 15, 2002. This acquisition expanded the Company’s position in the growth markets of eastern and western Florida and enhanced its presence as a leading financial services provider in the state of Florida.
The Consolidated Statement of Income includes the results of operations for Huntington-Florida from the February 15, 2002 acquisition date. The transaction resulted in $524 million of goodwill, $255 million of core deposit intangibles and $13 million of other intangibles, all of which are deductible for tax purposes. The amount allocated to core deposit intangible was determined by an independent valuation and is being amortized over the estimated useful life of seven years using the sum-of-years-digits method. The amount allocated to other intangibles represents the identifiable intangible assets for trust and brokerage customer lists. These intangible assets are being amortized over the estimated useful life of seven years using the straight-line method.
SunTrust 2002 Annual Report | 63 | notes to consolidated financial statements |
notes to consolidated financial statements
The following condensed balance sheet of Huntington-Florida discloses the amounts assigned to each major asset and liability caption at the acquisition date, net of amounts sold (divested) to FloridaFirst Bancorp, Inc.:
(Dollars in thousands) | | | | |
| |
| |
Assets | | | | |
| | Cash and due from banks | | $ | 1,160,333 | |
| | Loans | | | 2,684,384 | |
| | Allowance for loan losses | | | (15,531 | ) |
| | | |
|
| |
| | Net loans | | | 2,668,853 | |
| | Goodwill | | | 523,694 | |
| | Intangible assets | | | 267,559 | |
| | Other assets | | | 73,927 | |
| | | |
|
| |
| | Total assets | | $ | 4,694,366 | |
| | | |
|
| |
Liabilities | | | | |
| | Total deposits | | $ | 4,495,210 | |
| | Short-term borrowings | | | 146,716 | |
| | Other liabilities | | | 52,440 | |
| | | |
|
| |
| | Total liabilities | | $ | 4,694,366 | |
| | | |
|
| |
| | | | | | | |
The following condensed income statement discloses the pro forma results of the Company as though the Huntington-Florida acquisition had occurred at the beginning of the respective periods:
| | Twelve Months Ended December 31, 2002 | |
| | |
| |
(Dollars in thousands) | | SunTrust
Banks, Inc.1 | | Huntington-Florida2 | | Pro Forma
Adjustments3 | | Pro Forma
Combined | |
| |
|
| |
|
| |
|
| |
|
| |
| Interest and dividend income | | $ | 5,135,197 | | $ | 27,369 | | $ | (1,731 | ) | $ | 5,160,835 | |
| Interest expense | | | 1,891,488 | | | 15,002 | | | (6,317 | ) | | 1,900,173 | |
| | |
|
| |
|
| |
|
| |
|
| |
| Net interest income | | | 3,243,709 | | | 12,367 | | | 4,586 | | | 3,260,662 | |
| Provision for loan losses | | | 469,792 | | | 1,723 | | | — | | | 471,515 | |
| | |
|
| |
|
| |
|
| |
|
| |
| Net interest income after provision for loan losses | | | 2,773,917 | | | 10,644 | | | 4,586 | | | 2,789,147 | |
| | | | | | | | | | | | | | |
| Noninterest income | | | 2,391,675 | | | 5,522 | | | — | | | 2,397,197 | |
| Noninterest expense | | | 3,342,268 | | | 14,714 | | | 10,924 | | | 3,367,906 | |
| | |
|
| |
|
| |
|
| |
|
| |
| Income before provision for income taxes | | | 1,823,324 | | | 1,452 | | | (6,338 | ) | | 1,818,438 | |
| Provision for income taxes | | | 491,515 | | | 465 | | | (2,218 | ) | | 489,762 | |
| | |
|
| |
|
| |
|
| |
|
| |
| | Net income | | $ | 1,331,809 | | $ | 987 | | $ | (4,120 | ) | $ | 1,328,676 | |
| | |
|
| |
|
| |
|
| |
|
| |
| Net income per average common share: | | | | | | | | | | | | | |
| | Diluted | | $ | 4.66 | | | | | | | | $ | 4.64 | |
| | Basic | | | 4.71 | | | | | | | | | 4.70 | |
| | |
|
| |
|
| |
|
| |
|
| |
| | | | | | | | | | | | | | | |
1 | The reported results of SunTrust Banks, Inc. for the twelve months ended December 31, 2002 include the results of the acquired Florida franchise of Huntington-Florida from the February 15, 2002 acquisition date. Also included is provision for loan losses of $45.3 million related to Huntington-Florida. |
2 | The estimated results of Huntington-Florida from January 1, 2002 through February 14, 2002. |
3 | Pro forma adjustments include the following items: amortization of core deposit and other intangibles of $10.9 million, amortization of loan purchase accounting adjustment of $1.7 million, and accretion of time deposit purchase accounting adjustment of $6.3 million. |
notes to consolidated financial statements | 64 | SunTrust 2002 Annual Report |
| | Twelve Months Ended December 31, 2001 | |
| | |
| |
(Dollars in thousands) | | SunTrust
Banks, Inc.1 | | Huntington-Florida2 | | Pro Forma
Adjustments3 | | Pro Forma
Combined | |
| |
|
| |
|
| |
|
| |
|
| |
| Interest and dividend income | | $ | 6,279,574 | | $ | 258,041 | | $ | (10,388 | ) | $ | 6,527,227 | |
| Interest expense | | | 3,026,974 | | | 166,319 | | | (37,912 | ) | | 3,155,381 | |
| | |
|
| |
|
| |
|
| |
|
| |
| Net interest income | | | 3,252,600 | | | 91,722 | | | 27,524 | | | 3,371,846 | |
| Provision for loan losses | | | 275,165 | | | 17,330 | | | — | | | 292,495 | |
| | |
|
| |
|
| |
|
| |
|
| |
| Net interest income after provision for loan losses | | | 2,977,435 | | | 74,392 | | | 27,524 | | | 3,079,351 | |
| Noninterest income | | | 2,155,823 | | | 48,326 | | | — | | | 2,204,149 | |
| Noninterest expense | | | 3,113,538 | | | 109,854 | | | 81,542 | | | 3,304,934 | |
| | |
|
| |
|
| |
|
| |
|
| |
| Income before provision for income taxes and extraordinary gain | | | 2,019,720 | | | 12,864 | | | (54,018 | ) | | 1,978,566 | |
| Provision for income taxes | | | 650,501 | | | 4,116 | | | (18,906 | ) | | 635,711 | |
| | |
|
| |
|
| |
|
| |
|
| |
| Income before extraordinary gain | | | 1,369,219 | | | 8,748 | | | (35,112 | ) | | 1,342,855 | |
| Extraordinary gain, net of taxes | | | 6,318 | | | — | | | — | | | 6,318 | |
| | |
|
| |
|
| |
|
| |
|
| |
| | Net income | | $ | 1,375,537 | | $ | 8,748 | | $ | (35,112 | ) | $ | 1,349,173 | |
| | |
|
| |
|
| |
|
| |
|
| |
| Net income per average common share: | | | | | | | | | | | | | |
| | Diluted | | $ | 4.72 | | | | | | | | $ | 4.63 | |
| | Basic | | | 4.78 | | | | | | | | | 4.69 | |
| | | |
|
| |
|
| |
|
| |
|
| |
| | | | | | | | | | | | | | | |
1 | The reported results of SunTrust Banks, Inc. for the twelve months ended December 31, 2001. |
2 | The estimated results of the acquired Florida franchise of Huntington-Florida for the twelve months ended December 31, 2001. |
3 | Pro forma adjustments include the following items: merger-related expenses of $ 16.0 million, amortization of core deposit and other intangibles of $65.5 million, amortization of loan purchase accounting adjustment of $ 10.4 million, and accretion of time deposit purchase accounting adjustment of $37.9 million. |
On January 22, 2003, SunTrust entered into a purchase agreement under which SunTrust will acquire Lighthouse Financial Services, Inc. based in Hilton Head Island, South Carolina. It is anticipated the Company will acquire approximately $577 million in assets and $200 million in core customer deposits. In addition, the agreement calls for a payment of approximately $130 million in a combination of cash and SunTrust stock. This transaction is expected to close in the summer of 2003, at which time the final purchase price will be determined.
During the three-year period ended December 31, 2002, the Company has consummated the following acquisitions that were accounted for as purchases and individually did not have a material effect on the Consolidated Financial Statements.
Date | | Entity | | Consideration | | Assets Acquired | |
| |
| |
| |
| |
| 7/01 | | The institutional business of Robinson-Humphrey Co., LLC
(Atlanta, Georgia) | | $ | 10.4 million in cash | | $ | 25.4 million | |
| 3/01 | | Asset Management Advisors Holdings, Inc.
(Jupiter, Florida) | | $ | 22.0 million in cash | | $ | 2.5 million | |
NOTE 3 Extraordinary Gain
During the fourth quarter of 2001, the Company recorded an extraordinary gain of $24.1 million, net of taxes of $13.0 million, for the early extinguishment of $1.0 billion in long-term debt. During the second quarter of 2001, the Company recorded an extraordinary loss of $17.8 million, net of taxes of $9.6 million, for the early extinguishment of $1.3 billion in long-term debt.
NOTE 4 Funds Sold And Securities Purchased Under Agreements To Resell
Funds sold and securities purchased under agreements to resell at December 31 were as follows:
(Dollars in thousands) | | 2002 | | 2001 | |
| |
|
| |
|
| |
| Federal funds | | $ | 300,217 | | $ | 324,100 | |
| Repurchase agreements | | | 792,064 | | | 1,171,009 | |
| | |
|
| |
|
| |
| | Total funds sold and securities purchased under agreements to resell | | $ | 1,092,281 | | $ | 1,495,109 | |
| | |
|
| |
|
| |
| | | | | | | | |
SunTrust 2002 Annual Report | 65 | notes to consolidated financial statements |
notes to consolidated financial statements
Securities purchased under agreement to resell are collateralized by U.S. government or agency securities and are carried at the amounts at which securities will be subsequently resold. The Company takes possession of all securities purchased under agreements to resell and performs the appropriate margin evaluation on the acquisition date and based on market volatility, as necessary. The Company requires collateral between 100% to 105% of the underlying securities. The total market value of the collateral held was $812.1 and $1,192.2 million at December 31, 2002 and 2001, of which $687.1 and $715.2 million was repledged, respectively.
NOTE 5 Trading Assets And Liabilities
The fair values of the components of trading account assets and liabilities at December 31 were as follows:
(Dollars in thousands) | | 2002 | | 2001 | |
| |
|
| |
|
| |
Trading Assets | | | | | | | |
| U.S. government and agency securities | | $ | 480,584 | | $ | 598,464 | |
| Corporate and other debt securities | | | 82,844 | | | 29,746 | |
| Equity securities | | | 563 | | | 2,363 | |
| Mortgage-backed securities | | | 38,391 | | | 16,902 | |
| Derivative contracts | | | 1,062,815 | | | 622,303 | |
| Other | | | 52,577 | | | 73,824 | |
| | |
|
| |
|
| |
| | Total trading assets | | | 1,717,774 | | | 1,343,602 | |
| | | |
|
| |
|
| |
Trading Liabilities | | | | | | | |
| Derivative contracts | | | 929,380 | | | 495,809 | |
| Other | | | 1,265 | | | 16,243 | |
| | |
|
| |
|
| |
| | Total trading liabilities | | $ | 930,645 | | $ | 512,052 | |
| | | |
|
| |
|
| |
NOTE 6 Securities Available For Sale
Securities available for sale at December 31 were as follows:
| | 2002 | |
| |
| |
(In thousands) | | Amortized
Cost | | Unrealized
Gains | | Unrealized
Losses | | Fair
Value | |
| |
|
| |
|
| |
|
| |
|
| |
| U.S. Treasury and other U.S. government agencies and corporations | | $ | 3,601,544 | | $ | 82,828 | | $ | 360 | | $ | 3,684,012 | |
| States and political subdivisions | | | 398,640 | | | 20,877 | | | 407 | | | 419,110 | |
| Asset-backed securities | | | 4,478,169 | | | 44,961 | | | 4,986 | | | 4,518,144 | |
| Mortgage-backed securities | | | 9,467,150 | | | 155,660 | | | 727 | | | 9,622,083 | |
| Corporate bonds | | | 1,923,471 | | | 64,681 | | | 58,415 | | | 1,929,737 | |
| Common stock of The Coca-Cola Company | | | 110 | | | 2,110,584 | | | — | | | 2,110,694 | |
| Other securities | | | 1,154,536 | | | 6,866 | | | — | | | 1,161,402 | |
| | |
|
| |
|
| |
|
| |
|
| |
| | Total securities available for sale | | $ | 21,023,620 | | $ | 2,486,457 | | $ | 64,895 | | $ | 23,445,182 | |
| | | |
|
| |
|
| |
|
| |
|
| |
| | 2001 | |
| |
| |
(In thousands) | | Amortized
Cost | | Unrealized
Gains | | Unrealized
Losses | | Fair
Value | |
| |
|
| |
|
| |
|
| |
|
| |
| U.S. Treasury and other U.S. government agencies and corporations | | $ | 2,229,547 | | $ | 111,242 | | $ | 544 | | $ | 2,340,245 | |
| States and political subdivisions | | | 434,053 | | | 11,074 | | | 1,437 | | | 443,690 | |
| Asset-backed securities | | | 3,508,416 | | | 45,455 | | | 9,770 | | | 3,544,101 | |
| Mortgage-backed securities | | | 8,142,467 | | | 163,220 | | | 14,044 | | | 8,291,643 | |
| Corporate bonds | | | 1,969,544 | | | 62,612 | | | 48,667 | | | 1,983,489 | |
| Common stock of The Coca-Cola Company | | | 110 | | | 2,275,655 | | | — | | | 2,275,765 | |
| Other securities | | | 739,988 | | | 37,470 | | | — | | | 777,458 | |
| | |
|
| |
|
| |
|
| |
|
| |
| | Total securities available for sale | | $ | 17,024,125 | | $ | 2,706,728 | | $ | 74,462 | | $ | 19,656,391 | |
| | | |
|
| |
|
| |
|
| |
|
| |
| | | | | | | | | | | | | | | | | | |
notes to consolidated financial statements | 66 | SunTrust 2002 Annual Report |
The amortized cost and fair value of investments in debt securities at December 31, 2002 by contractual maturities are shown below. Expected maturities will differ from contractual maturities because borrowers may have the right to call or prepay obligations with or without call or prepayment penalties.
(In thousands) | | Amortized
Cost | | Fair
Value | |
| |
| |
| |
| Due in one year or less | | $ | 440,693 | | $ | 446,242 | |
| Due in one year through five years | | | 5,554,049 | | | 5,699,338 | |
| Due after five years through ten years | | | 2,883,494 | | | 2,954,594 | |
| After ten years | | | 10,990,738 | | | 11,072,912 | |
| | |
|
| |
|
| |
| | Total | | $ | 19,868,974 | | $ | 20,173,086 | |
| | | |
|
| |
|
| |
Proceeds from the sale of investments in debt securities were $5.6 billion, $5.4 billion, and $1.4 billion in 2002, 2001 and 2000. Gross realized gains were $206.5, $166.8, and $63.0 million and gross realized losses on such sales were $2.0, $13.7, and $56.4 million in 2002, 2001, and 2000.
Securities available for sale that were pledged to secure public deposits, trust and other funds had fair values of $14.2, $12.9, and $12.2 billion at December 31, 2002, 2001, and 2000.
NOTE 7 Loans
The composition of the Company’s loan portfolio at December 31 is shown in the following table:
(In thousands) | | 2002 | | 2001 | |
| |
| |
| |
| Commercial | | $ | 28,693,616 | | $ | 28,945,880 | |
| Real estate | | | | | | | |
| | Construction | | | 4,002,439 | | | 3,627,312 | |
| | Residential mortgages | | | 19,443,445 | | | 17,297,055 | |
| | Other | | | 9,101,801 | | | 8,152,029 | |
| Business credit card | | | 111,255 | | | 91,996 | |
| Consumer loans | | | 11,815,379 | | | 10,844,950 | |
| | |
|
| |
|
| |
| | Total loans | | $ | 73,167,935 | | $ | 68,959,222 | |
| | | |
|
| |
|
| |
| | | | | | | | | |
Total nonaccrual loans at December 31, 2002 and 2001 were $511.0 and $558.1 million, respectively. The gross amounts of interest income that would have been recorded in 2002, 2001, and 2000 on nonaccrual loans at December 31 of each year, if all such loans had been accruing interest at their contractual rates, were $45.2, $45.6, and $35.9 million, while interest income actually recognized totaled $15.6, $15.8 and $17.8 million, respectively.
In the normal course of business, the Company’s banking subsidiary has made loans at prevailing interest rates and terms to directors and executive officers of the Company and its subsidiaries, and to their related interests. The aggregate dollar amount was $409.8 million at December 31, 2002 and $440.2 million at December 31, 2001. During 2002, $208.6 million of such loans were made and repayments totaled $239.0 million. None of these loans have been restructured in accordance with SFAS No. 15, nor were any related party loans charged off during 2002 and 2001.
At December 31, 2002 and 2001, impaired loans amounted to $399.3 and $444.4 million, respectively. Included in the allowance for loan losses was $121.7 million related to $399.3 million of impaired loans at December 31, 2002, and $147.8 million related to $444.4 million of impaired loans at December 31, 2001. For the years ended December 31, 2002 and 2001, the average recorded investment in impaired loans was $424.6 and $342.6 million, respectively; and $10.6 million and $12.2 million, respectively, of interest income was recognized on loans while they were impaired.
SunTrust 2002 Annual Report | 67 | notes to consolidated financial statements |
notes to consolidated financial statements
NOTE 8 Allowance For Loan Losses
Activity in the allowance for loan losses is summarized in the table below:
(In thousands) | | 2002 | | 2001 | | 2000 | |
| |
| |
| |
| |
| Balance at beginning of year | | $ | 867,059 | | $ | 874,547 | | $ | 871,323 | |
| Allowance from acquisitions, dispositions and other activity – net | | | 15,531 | | | (10,210 | ) | | — | |
| Provisions | | | 469,792 | | | 275,165 | | | 133,974 | |
| Loan charge-offs | | | (490,117 | ) | | (326,019 | ) | | (189,706 | ) |
| Loan recoveries | | | 67,849 | | | 53,576 | | | 58,956 | |
| | |
|
| |
|
| |
|
| |
| Balance at end of year | | $ | 930,114 | | $ | 867,059 | | $ | 874,547 | |
| | |
|
| |
|
| |
|
| |
NOTE 9 Premises And Equipment
Premises and equipment at December 31 were as follows:
(In thousands) | | Useful Life | | 2002 | | 2001 | |
| |
| |
| |
| |
| Land | | | | | $ | 368,876 | | $ | 348,220 | |
| Buildings and improvements | | | 5 – 40 years | | | 1,367,298 | | | 1,343,242 | |
| Leasehold improvements | | | 1 – 30 years | | | 279,263 | | | 256,136 | |
| Furniture and equipment | | | 3 – 20 years | | | 1,236,609 | | | 1,143,017 | |
| Construction in progress | | | | | | 81,068 | | | 88,972 | |
| | |
|
| |
|
| |
|
| |
| | | | | | | 3,333,114 | | | 3,179,587 | |
| Less accumulated depreciation and amortization | | | | | | 1,725,914 | | | 1,594,718 | |
| | |
|
| |
|
| |
|
| |
| | Total premises and equipment | | | | | $ | 1,607,200 | | $ | 1,584,869 | |
| | |
|
| |
|
| |
|
| |
| | | | | | | | | | | |
The carrying amounts of premises and equipment subject to mortgage indebtedness (included in long-term debt) were not significant at December 31, 2002 and 2001.
Various Company facilities and equipment are leased under both capital and noncancelable operating leases with initial remaining terms in excess of one year. Minimum payments, by year and in aggregate, as of December 31, 2002 were as follows:
(In thousands) | | Operating
Leases | | Capital
Leases | |
| |
| |
| |
| 2003 | | $ | 94,321 | | $ | 3,133 | |
| 2004 | | | 85,729 | | | 3,109 | |
| 2005 | | | 67,210 | | | 2,254 | |
| 2006 | | | 55,095 | | | 1,982 | |
| 2007 | | | 39,152 | | | 1,877 | |
| Thereafter | | | 129,900 | | | 31,768 | |
| | |
|
| |
|
| |
| | Total minimum lease payments | | | 471,407 | | | 44,123 | |
| | | |
|
| |
|
| |
| Amounts representing interest | | | | | | 25,847 | |
| | |
|
| |
|
| |
| Present value of net minimum lease payments | | | | | $ | 18,276 | |
| | |
|
| |
|
| |
Net premises and equipment include $12.5 million and $13.5 million at December 31, 2002 and 2001, respectively, related to capital leases.
Aggregate rent expense for all operating leases (including contingent rental expense) amounted to $122.5, $117.0, and $120.4 million for 2002, 2001, and 2000, respectively.
notes to consolidated financial statements | 68 | SunTrust 2002 Annual Report |
NOTE 10 Intangible Assets
Under the provisions of SFAS No. 142, goodwill is tested for impairment on an annual basis and as events or circumstances change that would more likely than not reduce fair value of a reporting unit below its carrying amount. The Company completed its annual review as of December 31, 2002, and determined there was no impairment of goodwill as of this date. The changes in the carrying amount of goodwill by reportable segment for the twelve months ended December 31, 2001 and 2002 are as follows:
(Dollars in thousands) | | Retail | | Commercial | | Corporate and
Investment Banking | | Mortgage | | Private Client
Services | | Corporate/
Other | | Total | |
| |
| |
| |
| |
| |
| |
| |
| |
Balance, January 1, 2001 | | $ | 337,283 | | $ | 16,951 | | $ | 118,180 | | $ | 2,014 | | $ | — | | $ | — | | $ | 474,428 | |
| Amortization | | | (34,641 | ) | | (969 | ) | | (5,367 | ) | | (155 | ) | | (610 | ) | | — | | | (41,742 | ) |
| AMA Holdings, Inc. acquisition | | | — | | | — | | | — | | | — | | | 26,839 | | | — | | | 26,839 | |
| Robinson-Humphrey acquisition | | | — | | | — | | | 5,903 | | | — | | | — | | | — | | | 5,903 | |
| Purchase price adjustment | | | — | | | — | | | (25,274 | ) | | — | | | (1,798 | ) | | — | | | (27,072 | ) |
| Contingent consideration | | | — | | | 4,799 | | | — | | | — | | | — | | | — | | | 4,799 | |
| Reclassification | | | (2,658 | ) | | — | | | — | | | — | | | — | | | — | | | (2,658 | ) |
| | |
|
| |
|
| |
|
| |
|
| |
|
| |
|
| |
|
| |
Balance, December 31, 2001 | | | 299,984 | | | 20,781 | | | 93,442 | | | 1,859 | | | 24,431 | | | — | | | 440,497 | |
| Huntington-Florida acquisition | | | 395,412 | | | 68,730 | | | — | | | 14,650 | | | 44,902 | | | — | | | 523,694 | |
| Reallocation | | | 744 | | | — | | | — | | | (744 | ) | | — | | | — | | | — | |
| Contingent consideration | | | — | | | 7,115 | | | — | | | — | | | — | | | — | | | 7,115 | |
| Purchase price adjustment | | | (8,955 | ) | | — | | | 1,410 | | | — | | | — | | | — | | | (7,545 | ) |
| | |
|
| |
|
| |
|
| |
|
| |
|
| |
|
| |
|
| |
Balance, December 31, 2002 | | $ | 687,185 | | $ | 96,626 | | $ | 94,852 | | $ | 15,765 | | $ | 69,333 | | $ | — | | $ | 963,761 | |
| | |
|
| |
|
| |
|
| |
|
| |
|
| |
|
| |
|
| |
The Company adopted SFAS No. 142, in its entirety, effective January 1, 2002. The following presents the net income that would have been reported had SFAS No. 142 been implemented January 1, 2000.
(Dollars in thousands) | | 2002 | | 2001 | | 2000 | |
| |
| |
| |
| |
| Reported net income | | $ | 1,331,809 | | $ | 1,375,537 | | $ | 1,294,100 | |
| Goodwill amortization, net of taxes | | | — | | | 36,115 | | | 27,922 | |
| | |
|
| |
|
| |
|
| |
| Adjusted net income | | $ | 1,331,809 | | $ | 1,411,652 | | $ | 1,322,022 | |
| | |
|
| |
|
| |
|
| |
| Reported diluted earnings per share | | $ | 4.66 | | $ | 4.72 | | $ | 4.30 | |
| Goodwill amortization, net of taxes | | | — | | | 0.12 | | | 0.09 | |
| | |
|
| |
|
| |
|
| |
| Adjusted diluted earnings per share | | $ | 4.66 | | $ | 4.84 | | $ | 4.39 | |
| | |
|
| |
|
| |
|
| |
| Reported basic earnings per share | | $ | 4.71 | | $ | 4.78 | | $ | 4.35 | |
| Goodwill amortization, net of taxes | | | — | | | 0.13 | | | 0.09 | |
| | |
|
| |
|
| |
|
| |
| Adjusted basic earnings per share | | $ | 4.71 | | $ | 4.91 | | $ | 4.44 | |
| | |
|
| |
|
| |
|
| |
SunTrust 2002 Annual Report | 69 | notes to consolidated financial statements |
notes to consolidated financial statements
The changes in the carrying amounts of other intangible assets for the twelve months ended December 31, 2001 and 2002 are as follows:
(Dollars in thousands) | | Core Deposit
Intangible | | Mortgage Servicing Rights | | Other | | Total | |
| |
| |
| |
| |
| |
Balance, January 1, 2001 | | $ | 20,878 | | $ | 314,996 | | $ | 558 | | $ | 336,432 | |
| Amortization | | | (4,378 | ) | | (123,074 | ) | | (137 | ) | | (127,589 | ) |
| Servicing rights acquired | | | — | | | 36,308 | | | — | | | 36,308 | |
| Servicing rights originated | | | — | | | 122,970 | | | — | | | 122,970 | |
| Reclassification | | | 2,658 | | | — | | | — | | | 2,658 | |
| | |
|
| |
|
| |
|
| |
|
| |
Balance, December 31, 2001 | | | 19,158 | | | 351,200 | | | 421 | | | 370,779 | |
| Amortization | | | (57,262 | ) | | (244,625 | ) | | (1,636 | ) | | (303,523 | ) |
| Servicing rights acquired | | | — | | | 82,779 | | | — | | | 82,779 | |
| Servicing rights originated | | | — | | | 194,564 | | | — | | | 194,564 | |
| Huntington-Florida acquisition | | | 254,959 | | | — | | | 12,600 | | | 267,559 | |
| | |
|
| |
|
| |
|
| |
|
| |
Balance, December 31, 2002 | | $ | 216,855 | | $ | 383,918 | | $ | 11,385 | | $ | 612,158 | |
| | |
|
| |
|
| |
|
| |
|
| |
The estimated amortization expense for intangible assets, excluding amortization of mortgage servicing rights, for the subsequent five years is as follows:
(Dollars in thousands) | | Core Deposit
Intangible | | Other | | Total | |
| |
| |
| |
| |
| 2003 | | $ | 60,287 | | $ | 1,937 | | $ | 62,224 | |
| 2004 | | | 50,432 | | | 1,920 | | | 52,352 | |
| 2005 | | | 39,948 | | | 1,827 | | | 41,775 | |
| 2006 | | | 30,618 | | | 1,800 | | | 32,418 | |
| 2007 | | | 21,515 | | | 1,800 | | | 23,315 | |
| Thereafter | | | 14,055 | | | 2,101 | | | 16,156 | |
| | |
|
| |
|
| |
|
| |
| | Total | | $ | 216,855 | | $ | 11,385 | | $ | 228,240 | |
| | | |
|
| |
|
| |
|
| |
NOTE 11 Funds Purchased And Securities Sold Under Agreements To Repurchase
Funds purchased and securities sold under agreements to repurchase at December 31 were as follows:
(Dollars in thousands) | | 2002 | | 2001 | |
| |
| |
| |
| Federal funds | | $ | 5,114,850 | | $ | 4,144,008 | |
| Repurchase agreements | | | 5,287,686 | | | 5,960,279 | |
| | |
|
| |
|
| |
| | Total funds purchased and securities sold under agreements to repurchase | | $ | 10,402,536 | | $ | 10,104,287 | |
| | | |
|
| |
|
| |
NOTE 12 Other Short-Term Borrowings
Other short-term borrowings at December 31 includes:
| | 2002 | | 2001 | |
| |
| |
| |
(In thousands) | | Balance | | Rates | | Balance | | Rates | |
| |
| |
| |
| |
| |
| Commercial paper | | $ | 50,000 | | | 1.25 | % | $ | — | | | — | |
| Federal funds purchased maturing in over one day | | | 41,000 | | | 1.12% – 1.72 | % | | — | | | — | |
| Master notes | | | 308,945 | | | 0.75 | % | | 340,929 | | | 1.20 | % |
| U.S. Treasury demand notes | | | 849,346 | | | 0.99 | % | | 1,249,996 | | | 1.40 | % |
| Other | | | 119,134 | | | various | | | 60,714 | | | various | |
| | |
|
| |
|
| |
|
| |
|
| |
| | Total other short-term borrowings | | $ | 1,368,425 | | | | | $ | 1,651,639 | | | | |
| | |
|
| |
|
| |
|
| |
|
| |
| | | | | | | | | | | | | | |
notes to consolidated financial statements | 70 | SunTrust 2002 Annual Report |
At December 31, 2002, $315 million of unused borrowings under unsecured lines of credit from non-affiliated banks were available to the Parent Company to support outstanding commercial paper and provide for general liquidity needs. The average balances of short-term borrowings for the years ended December 31, 2002, 2001 and 2000, were $0.9, $1.6, and $1.6 billion, respectively, while the maximum amount outstanding at any month-end during the years ended December 31, 2002, 2001 and 2000, was $1.6, $2.9 and $2.0 billion, respectively.
NOTE 13 Mortgage Servicing Rights
The following is an analysis of capitalized mortgage servicing rights included in intangible assets in the Consolidated Balance Sheets:
(In thousands) | | 2002 | | 2001 | | 2000 | |
| |
| |
| |
| |
| Balance at beginning of year | | $ | 351,200 | | $ | 314,996 | | $ | 273,526 | |
| Rights acquired | | | 82,779 | | | 36,308 | | | 33,826 | |
| Rights originated | | | 194,564 | | | 122,970 | | | 71,785 | |
| Rights sold | | | — | | | — | | | (15,677 | ) |
Amortization1 | | | (244,625 | ) | | (123,074 | ) | | (48,464 | ) |
| | |
|
| |
|
| |
|
| |
| Balance at end of year | | $ | 383,918 | | $ | 351,200 | | $ | 314,996 | |
| | |
|
| |
|
| |
|
| |
1 Includes $97.2, $67.6 and $19.4 million for the years ended December 31, 2002, 2001 and 2000, respectively, on loans that have paid-in-full and loans that have been foreclosed.
No valuation allowances were required at December 31, 2002, 2001 and 2000 for the Company’s mortgage servicing rights.
The Company retained the servicing rights for all of its securitized single-family mortgages. The carrying value of the retained servicing rights is maintained on the balance sheet in intangible assets. Key economic assumptions used to measure total mortgage servicing rights as of December 31, 2002 were as follows:
2002 | | | | |
| |
| |
| Payment rate | | | 17.9% annual | |
| Weighted-average life | | | 5.67 years | |
| Discount rate | | | 9.6 | % |
| Weighted-average coupon | | | 6.7 | % |
| | |
|
| |
At December 31, 2002, key economic assumptions and the sensitivity of the current fair value on retained servicing rights to immediate 10% and 20% adverse changes in those assumptions follow:
(Dollars in millions) | | | | |
| |
| |
| Fair value of retained servicing rights | | $ | 442.7 | |
| Weighted-average life (in years) | | | 5.67 | |
| | |
|
| |
Prepayment speed assumption (annual rate) | | | 17.9 | % |
| Decline in fair value of 10% adverse change | | $ | 29.1 | |
| Decline in fair value of 20% adverse change | | | 55.5 | |
Residual cash flows discount rate (annual rate) | | | 9.6 | % |
| Decline in fair value of 10% adverse change | | $ | 13.4 | |
| Decline in fair value of 20% adverse change | | | 26.0 | |
| | |
|
| |
These sensitivities are hypothetical and should be used with caution. As the figures indicate, changes in fair value based on a 10% variation in assumptions generally cannot be extrapolated because the relationship of the change in assumption to the change in fair value may not be linear. Also, the effect of a variation in a particular assumption on the fair value of the retained servicing right is calculated without changing any other assumption; in reality, changes in one factor may result in changes in another (for example, increases in market interest rates may result in lower prepayments and increased credit losses), which might magnify or counteract the sensitivities.
Sensitivity analyses were not performed on the retained securities or the retained reserve for probable recourse exposure. The securities, less securities sold, resulting from the securitizations had a market and book value of $880.3 million as of December 31, 2002. If quoted market prices were to increase 10 percent, then there would be an exact corresponding effect on the value of those securities. The total reserve representing management’s estimate of loss on securitized loans had a balance of $2.3 million as of December 31, 2002.
SunTrust 2002 Annual Report | 71 | notes to consolidated financial statements |
notes to consolidated financial statements
NOTE 14 Long-Term Debt And Guaranteed Preferred Beneficial Interests In Debentures
Long-term debt and guaranteed preferred beneficial interests in debentures at December 31 consisted of the following:
(In thousands) | | 2002 | | 2001 | |
| |
| |
| |
Parent Company Only | | | | | | | |
| Floating rate notes due 2002 | | $ | — | | $ | 250,000 | |
| 7.375% notes due 2002 | | | — | | | 200,000 | |
| 6.125% notes due 2004 | | | 200,000 | | | 200,000 | |
| 7.375% notes due 2006 | | | 200,000 | | | 200,000 | |
| Floating rate notes due 2007 | | | 300,000 | | | — | |
| 6.25% notes due 2008 | | | 294,250 | | | 294,250 | |
| 7.75% notes due 2010 | | | 300,000 | | | 300,000 | |
| Floating rate notes due 2019 | | | 50,563 | | | 50,563 | |
| 6.00% notes due 2026 | | | 200,000 | | | 200,000 | |
| SunTrust Capital I, floating rate due 2027 | | | 350,000 | | | 350,000 | |
| SunTrust Capital II, 7.90% notes due 2027 | | | 250,000 | | | 250,000 | |
| SunTrust Capital III, floating rate due 2028 | | | 250,000 | | | 250,000 | |
| 6.00% notes due 2028 | | | 222,925 | | | 222,925 | |
| SunTrust Capital IV, 7.125% 2031 | | | 300,000 | | | 300,000 | |
| SunTrust Capital V, 7.05% 2031 | | | 300,000 | | | 300,000 | |
| Capital lease obligations | | | 1,977 | | | 2,770 | |
| Other | | | (12,237 | ) | | (4,680 | ) |
| | |
|
| |
|
| |
| | Total Parent Company (excluding intercompany of $176,456 in 2002 and $154,235 in 2001) | | | 3,207,478 | | | 3,365,828 | |
| | |
|
| |
|
| |
Subsidiaries | | | | | | | |
| 8.25% notes due 2002 | | | — | | | 125,000 | |
| 8.75% notes due 2004 | | | 149,927 | | | 149,888 | |
| 7.25% notes due 2006 | | | 249,528 | | | 249,401 | |
| 6.90% notes due 2007 | | | 99,676 | | | 99,603 | |
| 6.375% notes due 2011 | | | 1,001,076 | | | 1,001,205 | |
| 5.45% notes due 2017 | | | 498,885 | | | — | |
| 6.50% notes due 2018 | | | 141,393 | | | 141,667 | |
| Crestar Capital Trust I, 8.16% notes due 2026 | | | 200,000 | | | 200,000 | |
| Capital lease obligations | | | 16,299 | | | 16,671 | |
| FHLB advances (2002: 0.50 – 8.79%, 2001: 0.50 – 8.79%) | | | 6,274,240 | | | 7,211,556 | |
| Other | | | 41,318 | | | 99,761 | |
| | |
|
| |
|
| |
| | Total subsidiaries | | | 8,672,342 | | | 9,294,752 | |
| | | |
|
| |
|
| |
| | Total long-term debt and guaranteed preferred beneficial interests in debentures | | $ | 11,879,820 | | $ | 12,660,580 | |
| | |
|
| |
|
| |
notes to consolidated financial statements | 72 | SunTrust 2002 Annual Report |
Principal amounts due for the next five years on long-term debt at December 31, 2002 are: 2003 – $214.7 million; 2004 – $635.2 million; 2005 – $160.4 million; 2006 – $457.0 million; and 2007 – $404.9 million.
Restrictive provisions of several long-term debt agreements prevent the Company from creating liens on, disposing of, or issuing (except to related parties) voting stock of subsidiaries. Further, there are restrictions on mergers, consolidations, certain leases, sales or transfers of assets, minimum shareholders’ equity, and maximum borrowings by the Company. As of December 31, 2002, the Company was in compliance with all covenants and provisions of long-term debt agreements.
In 2002 and 2001, $1,650.0 million of long-term debt qualifies as Tier 1 capital. As currently defined by Federal bank regulators, $2,560.8 million in 2002 and $2,242.0 million in 2001 qualifies as Tier 2 capital.
SunTrust has established special purpose trusts, which have collectively issued $1,650.0 million in trust preferred securities. The proceeds from these issuances, together with the proceeds of the related issuances of common securities of the trusts, were invested in junior subordinated deferrable interest debentures of the Parent Company and Bank Parent Company. The sole assets of these special purpose trusts are the debentures. These debentures rank junior to the senior and subordinated debt of the issuing company. The Parent Company and Bank Parent Company own all of the common securities of the special purpose trusts. The preferred securities issued by the trusts rank senior to the trusts’ common securities. The obligations of the Parent Company and Bank Parent Company under the debentures, the indentures, the relevant trust agreements and the guarantees, in the aggregate, constitute a full and unconditional guarantee by the Parent Company and Bank Parent Company of the obligations of the trusts under the trust preferred securities and rank subordinate and junior in right of payment to all liabilities of the Parent Company and Bank Parent Company. The trust preferred securities may be called prior to maturity at the option of the Parent Company or Bank Parent Company.
NOTE 15 Capital
The Company is subject to various regulatory capital requirements which involve quantitative measures of the Company’s assets, liabilities and certain off-balance sheet items. The Company’s capital requirements and classification are ultimately subject to qualitative judgments by the regulators about components, risk weightings and other factors. The Company and its subsidiary banks are subject to a minimum Tier 1 capital ratio (Tier 1 capital to risk-weighted assets) of 4%, total capital ratio (Tier 1 plus Tier 2 to risk-weighted assets) of 8% and Tier 1 leverage ratio (Tier 1 to average quarterly assets) of 3%. To be considered a “well capitalized” institution, the Tier 1 capital ratio, the total capital ratio, and the Tier 1 leverage ratio must equal or exceed 6%, 10% and 5%, respectively. SunTrust is committed to remaining well capitalized. Included in Tier 1 capital is $450 million of preferred shares issued by real estate investment trust subsidiaries. These amounts are included in other liabilities in the Consolidated Balance Sheets. Management believes, as of December 31, 2002, that the Company meets all capital adequacy requirements to which it is subject. A summary of Tier 1 and Total capital and the Tier 1 leverage ratio for the Company and its principal subsidiary as of December 31 is as follows:
| | 2002 | | 2001 | |
| |
| |
| |
(Dollars in millions) | | Amount | | Ratio | | Amount | | Ratio | |
| |
| |
| |
| |
| |
| SunTrust Banks, Inc. | | | | | | | | | | | | | |
| | Tier 1 capital | | $ | 8,106 | | | 7.47 | % | $ | 7,994 | | | 8.02 | % |
| | Total capital | | | 12,610 | | | 11.62 | | | 12,144 | | | 12.18 | |
| | Tier 1 leverage | | | | | | 7.30 | | | | | | 7.94 | |
| SunTrust Bank | | | | | | | | | | | | | |
| | Tier 1 capital | | | 8,153 | | | 7.75 | | | 7,654 | | | 7.83 | |
| | Total capital | | | 11,474 | | | 10.91 | | | 10,752 | | | 11.0 | |
| | Tier 1 leverage | | | | | | 7.52 | | | | | | 7.81 | |
| | |
|
| |
|
| |
|
| |
|
| |
SunTrust 2002 Annual Report | 73 | notes to consolidated financial statements |
notes to consolidated financial statements
Substantially all the Company’s retained earnings are undistributed earnings of the Bank, which is restricted by various regulations administered by federal and state bank regulatory authorities. Retained earnings of the Bank available for payment of cash dividends to the Bank Parent Company under these regulations totaled approximately $687 million at December 31, 2002.
In the calculation of basic and diluted EPS, net income is identical. Shares of 8.9 million and 6.6 million for the years ended December 31, 2002 and 2001, respectively, were excluded in the computation of average shares because they would have been antidilutive. Below is a reconciliation for the three years ended December 31, 2002, of the difference between average basic common shares outstanding and average diluted common shares outstanding.
(In thousands) | | 2002 | | 2001 | | 2000 | |
| |
| |
| |
| |
| Average common shares – basic | | | 282,495 | | | 287,702 | | | 297,834 | |
| Effect of dilutive securities | | | | | | | | | | |
| | Stock options | | | 1,681 | | | 1,971 | | | 1,312 | |
| | Performance restricted stock | | | 1,876 | | | 1,911 | | | 1,810 | |
| | | |
|
| |
|
| |
|
| |
| Average common shares – diluted | | | 286,052 | | | 291,584 | | | 300,956 | |
| | |
|
| |
|
| |
|
| |
NOTE 16 Income Taxes
The provision for income taxes for the three years ended December 31, 2002 consisted of the following:
(In thousands) | | 2002 | | 2001 | | 2000 | |
| |
| |
| |
| |
| Provision for federal income taxes | | | | | | | | | | |
| | Current | | $ | 360,851 | | $ | 579,773 | | $ | 400,679 | |
| | Deferred | | | 121,319 | | | 41,741 | | | 182,312 | |
| | | |
|
| |
|
| |
|
| |
| | Provision for federal income taxes | | | 482,170 | | | 621,514 | | | 582,991 | |
| | | |
|
| |
|
| |
|
| |
| Provision (benefit) for state income taxes | | | | | | | | | | |
| | Current | | | (15,662 | ) | | 28,693 | | | 34,674 | |
| | Deferred | | | 25,007 | | | 294 | | | 7,791 | |
| | | |
|
| |
|
| |
|
| |
| | Provision for state income taxes | | | 9,345 | | | 28,987 | | | 42,465 | |
| | | |
|
| |
|
| |
|
| |
| | Provision for income taxes | | | 491,515 | | | 650,501 | | | 625,456 | |
| | | |
|
| |
|
| |
|
| |
| Current provision for federal income taxes on extraordinary gain | | | — | | | 3,112 | | | — | |
| Current provision for state income taxes on extraordinary gain | | | — | | | 290 | | | — | |
| | |
|
| |
|
| |
|
| |
| | Provision for income taxes on extraordinary gain | | | — | | | 3,402 | | | — | |
| | | |
|
| |
|
| |
|
| |
| Total provision for income taxes | | $ | 491,515 | | $ | 653,903 | | $ | 625,456 | |
| | |
|
| |
|
| |
|
| |
| | | | | | | | | | | | | |
The Company’s income from international operations, before provision for income taxes, was not significant.
notes to consolidated financial statements | 74 | SunTrust 2002 Annual Report |
The Company’s provisions for income taxes for the three years ended December 31, 2002, which exclude the effects of the extraordinary gain, differ from the amounts computed by applying the statutory federal income tax rate of 35% to income before income taxes. A reconciliation of this difference is as follows:
(In thousands) | | 2002 | | 2001 | | 2000 | |
| |
| |
| |
| |
| Tax provision at federal statutory rate | | $ | 638,163 | | $ | 706,902 | | $ | 671,845 | |
| (Decrease) increase resulting from | | | | | | | | | | |
| | Tax-exempt interest | | | (29,366 | ) | | (29,848 | ) | | (30,087 | ) |
| | Income tax credits, net | | | (51,243 | ) | | (17,320 | ) | | (18,126 | ) |
| | State income taxes, net of federal benefit | | | 6,074 | | | 13,943 | | | 27,602 | |
| | Dividends on subsidiary preferred stock | | | (25,530 | ) | | — | | | — | |
| | Sale of subsidiary preferred stock | | | — | | | — | | | (44,613 | ) |
| | Reversal of deferred liability | | | (25,000 | ) | | — | | | — | |
| | Other | | | (21,583 | ) | | (23,176 | ) | | 18,835 | |
| | | |
|
| |
|
| |
|
| |
| | Provision for income taxes | | $ | 491,515 | | $ | 650,501 | | $ | 625,456 | |
| | | |
|
| |
|
| |
|
| |
| | | | | | | | | | | | | |
Temporary differences create deferred tax assets and liabilities that are detailed below as of December 31, 2002 and 2001:
| | Deferred Tax Assets (Liabilities) | |
| |
| |
(In thousands) | | 2002 | | 2001 | |
| |
| |
| |
| Allowance for loan losses | | $ | 321,491 | | $ | 325,065 | |
| Employee benefits | | | (150,675 | ) | | (96,761 | ) |
| Fixed assets | | | (34,402 | ) | | (7,540 | ) |
| Loans | | | (27,863 | ) | | (21,282 | ) |
| Mortgage | | | (80,797 | ) | | (94,068 | ) |
| Leasing | | | (562,171 | ) | | (435,289 | ) |
| Accrued expenses | | | 83,003 | | | 113,933 | |
| Unrealized gains on securities available for sale | | | (779,274 | ) | | (891,264 | ) |
| Other | | | 54,664 | | | 49,540 | |
| | |
|
| |
|
| |
| Net deferred tax liability | | $ | (1,176,024 | ) | $ | (1,057,666 | ) |
| | |
|
| |
|
| |
SunTrust 2002 Annual Report | 75 | notes to consolidated financial statements |
notes to consolidated financial statements
SunTrust and its subsidiaries file consolidated income tax returns where permissible. Each subsidiary remits current taxes to or receives current refunds from the Parent Company based on what would be required had the subsidiary filed an income tax return as a separate entity. The Company’s federal and state income tax returns are subject to review and examination by government authorities. Various such examinations are now in progress. In the opinion of management, any adjustments which may result from these examinations will not have a material effect on the Company’s Consolidated Financial Statements.
NOTE 17 Employee Benefit Plans
SunTrust sponsors various incentive plans for eligible employees. The nonqualified Performance Bonus Plan has the broadest participation among employees. This plan rewards employees based on the employees’ compensation and the company’s earnings performance. The Performance Bonus Plan was discontinued as of January 1, 2003. The Management Incentive Plan for key executives provides for annual cash awards, if any, based on the attainment of STI profit plan and revenue goals, and the achievement of business unit, as well as individual performance objectives. The Performance Unit Plan for key executives provides awards, if any, based on multi-year earnings performance in relation to earnings goals established by the Compensation and Governance Committee (Committee) of the Company’s Board of Directors.
The Company also sponsors an Executive Stock Plan (Stock Plan) under which the Committee has the authority to grant stock options, restricted stock and performance based restricted stock (performance stock) to key employees of the Company. The Company reserved 14 million shares of common stock for issuance under the plan, of which no more than 4 million shares may be issued as restricted stock. Options granted are at no less than the fair market value of a share of stock on the grant date and may be either tax-qualified incentive stock options or nonqualified options. Prior to 2002, the Company did not record expense as a result of the grant or exercise of any of the stock options. Effective January 1, 2002, the Company adopted the fair-value recognition provision of SFAS No. 123, “Accounting for Stock-Based Compensation,” prospectively and began expensing the cost of stock options granted after January 1, 2002.
With respect to performance stock, awards are vested on the earliest of (i) fifteen years after the date shares are awarded to participants; (ii) the participant attaining age 64; (iii) death or disability of a participant; or (iv) a change in control of the Company as defined in the stock plan. Dividends are paid on awarded but unvested performance stock, and participants may exercise voting privileges on such shares.
The compensation element for performance stock (which is deferred and shown as a reduction of shareholder’s equity) is equal to the fair market value of the shares at the date of the award and is amortized to compensation expense over the period from the award date to age 64 or the 15th anniversary of the award date, whichever comes first. Approximately 40% of performance stock was awarded fully vested on February 10, 2000, and is no longer subject to the forfeiture condition set forth in the agreements. This early vested performance stock was converted into an equal number of “phantom stock units” as of that date. Payment of phantom stock units will be made to participants in shares of SunTrust stock upon the earlier of (1) the date on which the participant would have vested in his or her performance stock, or (2) the date of a change in control. Dividend equivalents will be paid at the same rate as the shares of performance stock; however, these units will not carry voting privileges.
Compensation expense related to the incentive plans for the three years ended December 31 were as follows:
(In thousands) | | 2002 | | 2001 | | 2000 | |
| |
| |
| |
| |
| 401(k) Plan, Performance Bonus Plan, and Thrift Plan | | $ | 43,670 | | $ | 52,184 | | $ | 47,184 | |
| Management Incentive Plan and Performance Unit Plan | | | (5,664 | ) | | 28,618 | | | 13,047 | |
| Performance Stock | | | 3,074 | | | 6,110 | | | 9,408 | |
| | |
|
| |
|
| |
|
| |
notes to consolidated financial statements | 76 | SunTrust 2002 Annual Report |
The following table presents information on Stock Options and Performance Stock:
| | Stock Options | | Performance Stock | |
| |
| |
| |
(Dollars in thousands
except per share data) | | Shares | | Price
Range | | Weighted-
Average
Exercise Price | | Shares | | Deferred
Compensation | | Weighted-
Average
Grant Price | |
| |
| |
| |
| |
| |
| |
| |
Balance, January 1, 2000 | | | 8,104,788 | | $ | 3.46 – 76.50 | | $ | 52.54 | | | 3,258,780 | | $ | 56,449 | | $ | — | |
Granted | | | 2,849,425 | | | 48.56 – 56.13 | | | 51.12 | | | 18,220 | | | 1,023 | | | 56.13 | |
Exercised/Vested | | | (507,866 | ) | | 3.46 – 58.11 | | | 24.20 | | | (67,326 | ) | | — | | | — | |
Canceled/Expired/Forfeited | | | (444,694 | ) | | 46.63 – 73.06 | | | 69.34 | | | (81,200 | ) | | (3,667 | ) | | — | |
Amortization of compensation for Performance Stock | | | — | | | — | | | — | | | — | | | (9,408 | ) | | — | |
| |
|
| |
|
| |
|
| |
|
| |
|
| |
|
| |
Balance, December 31, 2000 | | | 10,001,653 | | | 3.46 – 76.50 | | | 52.83 | | | 3,128,474 | | | 44,397 | | | — | |
Granted | | | 3,231,025 | | | 64.40 – 69.38 | | | 64.59 | | | 49,896 | | | 3,436 | | | 68.87 | |
Exercised/Vested | | | (627,840 | ) | | 9.23 – 70.81 | | | 28.96 | | | (105,399 | ) | | — | | | — | |
Canceled/Expired/Forfeited | | | (474,542 | ) | | 17.88 – 73.06 | | | 64.46 | | | (101,374 | ) | | (4,206 | ) | | — | |
Amortization of compensation for Performance Stock | | | — | | | — | | | — | | | — | | | (6,110 | ) | | — | |
| |
|
| |
|
| |
|
| |
|
| |
|
| |
|
| |
Balance, December 31, 2001 | | | 12,130,296 | | | 11.13 – 76.50 | | | 56.70 | | | 2,971,597 | | | 37,517 | | | — | |
Granted | | | 478,191 | | | 58.21 – 67.98 | | | 62.78 | | | 19,523 | | | 1,261 | | | 64.62 | |
Exercised/Vested | | | (415,634 | ) | | 11.13 – 65.25 | | | 33.14 | | | (145,913 | ) | | — | | | — | |
Canceled/Expired/Forfeited | | | (449,945 | ) | | 11.13 – 73.06 | | | 63.96 | | | (157,715 | ) | | (6,842 | ) | | — | |
Amortization of compensation for Performance Stock | | | — | | | — | | | — | | | — | | | (3,074 | ) | | — | |
| |
|
| |
|
| |
|
| |
|
| |
|
| |
|
| |
Balance, December 31, 2002 | | | 11,742,908 | | $ | 13.96 – 76.50 | | $ | 57.56 | | | 2,687,492 | | $ | 28,862 | | $ | — | |
| |
|
| |
|
| |
|
| |
|
| |
|
| |
|
| |
Exercisable, December 31, 2002 | | | 5,738,749 | | | | | $ | 56.12 | | | | | | | | | | |
| |
|
| |
|
| |
|
| |
|
| |
|
| |
|
| |
Available for Additional Grant, December 31, 2002 | | | 7,832,342 | | | | | | | | | | | | | | | | |
| |
|
| | | | | | | | | | | | | | | | |
The following table presents information on Stock Options by ranges of exercise price:
| | Options Outstanding | | Options Exercisable | |
| |
| |
| |
| | Number Outstanding at
December 31, 2002 | | Weighted Average
Exercise Price | | Weighted Average Remaining Contractual
Life(Years) | | Number Exercisable at December 31, 2002 | | Weighted Average
Exercise Price | |
| |
| |
| |
| |
| |
| |
| $13.96 – 49.61 | | | 2,024,837 | | $ | 32.90 | | | 3.0 | | | 2,024,837 | | $ | 32.90 | |
| $50.10 – 64.57 | | | 6,395,578 | | | 58.39 | | | 8.2 | | | 535,729 | | | 54.98 | |
| $65.19 – 76.50 | | | 3,322,493 | | | 70.99 | | | 6.4 | | | 3,178,183 | | | 71.11 | |
| | |
|
| |
|
| |
|
| |
|
| |
|
| |
| | | | 11,742,908 | | $ | 57.56 | | | 6.8 | | | 5,738,749 | | $ | 56.12 | |
| | |
|
| |
|
| |
|
| |
|
| |
|
| |
Effective January 1, 2002, the Company adopted the fair-value recognition provision of SFAS No. 123 prospectively to all awards granted after January 1, 2002. The effect on net income and earnings per share if the fair-value-based method had been applied to all outstanding awards in each period is as follows:
(In millions, except per share amounts) | | 2002 | | 2001 | | 2000 | |
| |
| |
| |
| |
| Net income, as reported | | $ | 1,331.8 | | $ | 1,375.5 | | $ | 1,294.1 | |
| Stock-based employee compensation expense included in reported net income, net of related tax effects | | | 0.5 | | | — | | | — | |
| Total stock-based employee compensation expense determined under fair-value-based method for all awards, net of related tax effects | | | (19.3 | ) | | (17.5 | ) | | (16.3 | ) |
| | |
|
| |
|
| |
|
| |
| Net Income, pro forma | | $ | 1,313.0 | | $ | 1,358.0 | | $ | 1,277.8 | |
| | |
|
| |
|
| |
|
| |
| Earnings per share: | | | | | | | | | | |
| | Diluted – as reported | | $ | 4.66 | | $ | 4.72 | | $ | 4.30 | |
| | Diluted – pro forma | | | 4.59 | | | 4.66 | | | 4.25 | |
| | Basic – as reported | | | 4.71 | | | 4.78 | | | 4.35 | |
| | Basic – pro forma | | | 4.64 | | | 4.72 | | | 4.30 | |
| | | |
|
| |
|
| |
|
| |
SunTrust 2002 Annual Report | 77 | notes to consolidated financial statements |
notes to consolidated financial statements
The weighted average fair values of options granted during 2002, 2001 and 2000 were $9.71, $10.73 and $9.83 per share, respectively. The fair value of each option grant is estimated on the date of grant using the Black-Scholes option-pricing model with the following assumptions:
| | | | 2002 | | | 2001 | | | 2000 | |
| | | |
| | |
| | |
| |
| Expected dividend yield | | | 2.66 | % | | 2.47 | % | | 2.89 | % |
| Expected stock price volatility | | | 14.68 | % | | 15.84 | % | | 15.67 | % |
| Risk-free interest rate | | | 4.05 | % | | 3.90 | % | | 5.63 | % |
| Expected life of options | | | 6 years | | | 6 years | | | 6 years | |
| | | |
| | |
| | |
| |
SunTrust maintains a defined contribution plan that offers a dollar for dollar match on the first 3% and $.50 cents on each dollar for the 4th and 5th percents. There is a maximum match of 4% of eligible wages for contributions of 5% or more in the SunTrust Banks, Inc. 401(k) Plan.
SunTrust maintains a noncontributory qualified retirement plan covering all employees meeting certain service requirements. The plan provides benefits based on salary and years of service. SunTrust performed a benefits study in 2002 to determine the long-term costs and competitive position of this plan. This study resulted in the decision by SunTrust to reduce future benefits effective January 31, 2003. This change will reduce SunTrust’s long-term costs for the plan. In addition to managing cost levels, SunTrust contributed $115.9 million to this plan in 2002 to maintain a well-funded position. On January 2, 2003, SunTrust made an additional $200.0 million contribution to the plan and will continue to review the funded status of the plan and make additional contributions as permitted by law. The SunTrust benefits plan committee establishes investment policies and strategies and regularly monitors the performance of the funds and portfolio managers. As of December 31, 2002, the Plan’s assets included 58,789 shares of SunTrust Banks, Inc. common stock.
SunTrust also maintains nonqualified supplemental retirement plans that cover key executives of the Company. SunTrust’s obligations for these plans are shown in the table below under the “Supplemental Retirement Benefits” section.
Although not under contractual obligation, SunTrust provides certain health care and life insurance benefits to retired employees (“Other Postretirement Benefits” in the table below). At the option of SunTrust, retirees may continue certain health and life insurance benefits if they meet age and service requirements for postretirement welfare benefits while working for the Company. As part of the benefit study performed in 2002, SunTrust realigned the cost sharing of these plans with retirees and will be eliminating postretirement life insurance benefits for employees who retire after December 31, 2003. Certain retiree health benefits are funded in a Retiree Health Trust. In addition, certain retiree life insurance benefits are funded in a Voluntary Employees’ Beneficiary Association (VEBA). As of December 31, 2002, the assets of both trusts consist of common trust funds, mutual funds, municipal and corporate bonds and a cash equivalent cash reserve fund. Components of the net periodic benefit cost for the various plans for the three year period ending December 31, were as follows:
| | Retirement Benefits | | Supplemental
Retirement Plans | | Other
Postretirement Benefits | |
| |
| |
| |
| |
(In thousands) | | 2002 | | 2001 | | 2000 | | 2002 | | 2001 | | 2000 | | 2002 | | 2001 | | 2000 | |
| |
| |
| |
| |
| |
| |
| |
| |
| |
| |
| Service cost | | $ | 42,530 | | $ | 39,506 | | $ | 36,243 | | $ | 823 | | $ | 773 | | $ | 755 | | $ | 4,146 | | $ | 3,905 | | $ | 3,795 | |
| Interest cost | | | 69,067 | | | 62,976 | | | 56,156 | | | 4,995 | | | 4,678 | | | 4,396 | | | 11,052 | | | 11,643 | | | 11,146 | |
| Expected return on assets | | | (112,670 | ) | | (103,451 | ) | | (96,845 | ) | | — | | | — | | | — | | | (8,218 | ) | | (9,124 | ) | | (7,089 | ) |
| Prior service cost amortization | | | (443 | ) | | (1,422 | ) | | (4,429 | ) | | 2,201 | | | 2,446 | | | 1,462 | | | — | | | — | | | 173 | |
| Actuarial loss | | | 16,657 | | | — | | | — | | | 3,180 | | | 2,581 | | | 2,522 | | | 3,372 | | | 2,443 | | | 982 | |
| Transition amount amortization | | | — | | | (510 | ) | | (4,917 | ) | | 44 | | | 275 | | | 417 | | | 3,809 | | | 3,809 | | | 3,963 | |
| | |
|
| |
|
| |
|
| |
|
| |
|
| |
|
| |
|
| |
|
| |
|
| |
| Net periodic benefit cost (income) | | $ | 15,141 | | $ | (2,901 | ) | $ | (13,792 | ) | $ | 11,243 | | $ | 10,753 | | $ | 9,552 | | $ | 14,161 | | $ | 12,676 | | $ | 12,970 | |
| | |
|
| |
|
| |
|
| |
|
| |
|
| |
|
| |
|
| |
|
| |
|
| |
notes to consolidated financial statements | 78 | SunTrust 2002 Annual Report |
Assumed healthcare cost trend rates have a significant effect on the amounts reported for the postretirement healthcare plans. As of December 31, 2002, SunTrust assumed that healthcare costs will increase at an initial rate of 12% per year. SunTrust’s medical plans are managed carefully and retirees share a large portion of the medical cost. Therefore, SunTrust expects this annual cost increase to decrease over time to be 5.25% per year. Due to changing medical inflation, it is important to understand the effect of a one-percent point change in assumed healthcare cost trend rates. These amounts are shown below:
(In thousands) | | 1 % Increase | | 1 % Decrease | |
| |
| |
| |
| Effect on total of service and interest cost components | | $ | 616 | | $ | (435 | ) |
| Effect on postretirement benefit obligation | | | 7,009 | | | (6,174 | ) |
| | |
|
| |
|
| |
The funded status of the plans at December 31 was as follows:
| | Retirement Benefits | | Supplemental
Retirement Plans | | Other
Postretirement Benefits | |
| |
| |
| |
| |
(Dollars in thousands) | | 2002 | | 2001 | | 2002 | | 2001 | | 2002 | | 2001 | |
| |
| |
| |
| |
| |
| |
| |
Change in Benefit Obligation | | | | | | | | | | | | | | | | | | | |
| Benefit obligation | | $ | 914,090 | | $ | 780,035 | | $ | 64,680 | | $ | 60,388 | | $ | 164,055 | | $ | 151,608 | |
| Service cost | | | 42,530 | | | 39,506 | | | 823 | | | 773 | | | 4,146 | | | 3,905 | |
| Interest cost | | | 69,067 | | | 62,976 | | | 4,995 | | | 4,678 | | | 11,052 | | | 11,643 | |
| Plan participants’ contributions | | | — | | | — | | | — | | | — | | | 8,216 | | | 6,993 | |
| Plan amendments | | | — | | | 5,210 | | | 2,882 | | | 5,927 | | | (14,873 | ) | | — | |
| Actuarial loss (gain) | | | 83,304 | | | 75,886 | | | 19,006 | | | (1,113 | ) | | 9,343 | | | 11,542 | |
| Benefits paid | | | (62,731 | ) | | (49,523 | ) | | (3,081 | ) | | (5,973 | ) | | (23,738 | ) | | (21,636 | ) |
| | |
|
| |
|
| |
|
| |
|
| |
|
| |
|
| |
| Benefit obligation | | | 1,046,260 | | | 914,090 | | | 89,305 | | | 64,680 | | | 158,201 | | | 164,055 | |
| | |
|
| |
|
| |
|
| |
|
| |
|
| |
|
| |
Change in Plan Assets | | | | | | | | | | | | | | | | | | | |
| Fair value of plan assets | | | 1,096,878 | | | 1,072,576 | | | — | | | — | | | 122,794 | | | 135,399 | |
| Actual return on plan assets | | | (124,174 | ) | | 17,404 | | | — | | | — | | | (6,983 | ) | | (1,711 | ) |
| Company contribution | | | 115,900 | | | 56,421 | | | — | | | — | | | 40,380 | | | 3,749 | |
| Plan participants’ contributions | | | — | | | — | | | — | | | — | | | 8,216 | | | 6,993 | |
| Benefits paid | | | (62,731 | ) | | (49,523 | ) | | — | | | — | | | (23,738 | ) | | (21,636 | ) |
| | |
|
| |
|
| |
|
| |
|
| |
|
| |
|
| |
| Fair value of plan assets | | | 1,025,873 | | | 1,096,878 | | | — | | | — | | | 140,669 | | | 122,794 | |
| | |
|
| |
|
| |
|
| |
|
| |
|
| |
|
| |
| Funded status of plan | | | (20,387 | ) | | 182,788 | | | (89,305 | ) | | (64,680 | ) | | (17,532 | ) | | (41,261 | ) |
| Unrecognized actuarial loss | | | 527,525 | | | 224,034 | | | 39,795 | | | 23,969 | | | 77,534 | | | 56,839 | |
| Unrecognized prior service cost | | | 2,208 | | | 1,765 | | | 12,852 | | | 12,171 | | | — | | | — | |
| Unrecognized net transition obligation | | | — | | | — | | | 44 | | | 88 | | | 23,216 | | | 41,898 | |
| | |
|
| |
|
| |
|
| |
|
| |
|
| |
|
| |
| Net amount recognized | | $ | 509,346 | | $ | 408,587 | | $ | (36,614 | ) | $ | (28,452 | ) | $ | 83,218 | | $ | 57,476 | |
| | |
|
| |
|
| |
|
| |
|
| |
|
| |
|
| |
Weighted-average Assumptions: | | | | | | | | | | | | | | | | | | | |
| Discount rate | | | 6.75 | % | | 7.25 | % | | 6.75 | % | | 7.25 | % | | 6.75 | % | | 7.25 | % |
| Expected long-term return on plan assets | | | 9.50 | | | 9.50 | | | — | | | — | | | 7.00 | | | 7.00 | |
| Rate of compensation increase | | | 3.50 | | | 4.00 | | | 3.50 | | | 4.00 | | | 4.00 | | | 4.00 | |
| | |
|
| |
|
| |
|
| |
|
| |
|
| |
|
| |
Based on the decline in the capital markets and expectations for the future, SunTrust has reduced the expected long-term return on asset assumption to 8.75% as of January 1, 2003. In addition, SunTrust sets pension asset values equal to their market value, in contrast to the use of a smoothed asset value that incorporates gains and losses over a period of years. The poor economic environment over the past three years may have led to inflated asset values in cases where a smoothed asset value is used. Utilization of market value of assets provides a more realistic economic measure of the plan’s funded status and cost. Assumed discount rates and expected returns on plan assets impact the amounts reported. A 25 basis point adverse change to the discount rate or other expected long-term return on plan assets would increase the net periodic cost approximately $8 and $3 million, respectively.
SunTrust 2002 Annual Report | 79 | notes to consolidated financial statements |
notes to consolidated financial statements
NOTE 18 Derivatives And Off-Balance Sheet Arrangements
In the normal course of business, the Company utilizes various financial instruments to meet the needs of customers and to manage the Company’s exposure to interest rate and other market risks. These financial instruments, which consist of derivatives contracts and credit-related arrangements, involve, to varying degrees, elements of credit and market risk in excess of the amount recorded on the balance sheet in accordance with generally accepted accounting principles.
Credit risk represents the potential loss that may occur because a party to a transaction fails to perform according to the terms of the contract. Market risk is the possibility that a change in market prices may cause the value of a financial instrument to decrease or become more costly to settle. The contract/notional amounts of financial instruments, which are not included in the Consolidated Balance Sheets, do not necessarily represent credit or market risk. However, they can be used to measure the extent of involvement in various types of financial instruments.
The Company manages the credit risk of its derivatives and unfunded commitments by limiting the total amount of arrangements outstanding by individual counterparty; by monitoring the size and maturity structure of the portfolio; by obtaining collateral based on management’s credit assessment of the counterparty; and by applying uniform credit standards maintained for all activities with credit risk. Collateral held varies but may include marketable securities, accounts receivable, inventory, property, plant and equipment, and income-producing commercial properties. Collateral may cover the entire expected exposure for transactions or may be called for when credit exposure exceeds defined thresholds or credit risk. In addition, the Company enters into master netting agreements which incorporate the right of set-off to provide for the net settlement of covered contracts with the same counterparty in the event of default or other termination of the agreement.
| | At December 31, 2002 | | At December 31, 2001 | |
| |
| |
| |
| | Contract or
Notional Amount | | | | Contract or
Notional Amount | | | |
| |
| | |
| | |
(In millions) | | End User | | For
Customers1 | | Credit Risk
Amount | | End User | | For
Customers1 | | Credit Risk
Amount | |
| |
| |
| |
| |
| |
| |
| |
Derivatives Contracts | | | | | | | | | | | | | | | | | | | |
| Interest rate contracts | | | | | | | | | | | | | | | | | | | |
| | Swaps | | $ | 4,919 | | $ | 32,344 | | $ | 266 | | $ | 4,392 | | $ | 31,339 | | $ | 271 | |
| | Futures and forwards | | | 8,746 | | | 6,708 | | | — | | | 5,924 | | | 7,525 | | | — | |
| | Caps/Floors | | | — | | | 6,254 | | | — | | | 500 | | | 6,889 | | | — | |
| | | |
|
| |
|
| |
|
| |
|
| |
|
| |
|
| |
| | Total interest rate contracts | | | 13,665 | | | 45,306 | | | 266 | | | 10,816 | | | 45,753 | | | 271 | |
| Foreign exchange rate contracts | | | — | | | 3,803 | | | 50 | | | — | | | 2,548 | | | 41 | |
| Interest rate lock commitments | | | 5,489 | | | — | | | — | | | 2,522 | | | — | | | — | |
| Commodity and other contracts | | | 236 | | | 2 | | | 59 | | | 206 | | | 4 | | | 38 | |
| | |
|
| |
|
| |
|
| |
|
| |
|
| |
|
| |
| | Total derivatives contracts | | $ | 19,390 | | $ | 49,111 | | $ | 375 | | $ | 13,544 | | $ | 48,305 | | $ | 350 | |
| | | |
|
| |
|
| |
|
| |
|
| |
|
| |
|
| |
Credit-related Arrangements | | | | | | | | | | | | | | | | | | | |
| Commitments to extend credit | | $ | 49,557 | | | | | $ | 49,557 | | $ | 45,312 | | | | | $ | 45,312 | |
| Standby letters of credit and similar arrangements | | | 9,362 | | | | | | 9,362 | | | 7,798 | | | | | | 7,798 | |
| | |
|
| |
|
| |
|
| |
|
| |
|
| |
|
| |
| | Total credit-related arrangements | | $ | 58,919 | | | | | $ | 58,919 | | $ | 53,110 | | | | | $ | 53,110 | |
| | | |
|
| |
|
| |
|
| |
|
| |
|
| |
|
| |
Total Credit Risk Amount | | | | | | | | $ | 59,294 | | | | | | | | $ | 53,460 | |
| | |
|
| |
|
| |
|
| |
|
| |
|
| |
|
| |
| | | | | | | | | | | | | | | | | | | | | |
1 Includes both long and short derivative contracts.
notes to consolidated financial statements | 80 | SunTrust 2002 Annual Report |
Derivatives
The Company enters into various derivative contracts both in a dealer capacity, to facilitate customer transactions, and also as a risk management tool. Where contracts have been created for customers, the Company generally enters into offsetting positions to eliminate the risk exposure. Derivatives, which are used for risk management, hedge the Company’s exposure to changes in interest rates or other defined market risks.
Interest rate swaps are contracts in which a series of interest rate cash flows, based on a specific notional amount and a fixed and floating interest rate, are exchanged over a prescribed period. Caps and floors are contracts that transfer, modify or reduce interest rate risk in exchange for the payment of a premium when the contract is issued. The true measure of credit exposure is the replacement cost of contracts that have become favorable to the Company.
Futures and forwards are contracts for the delayed delivery of securities or money market instruments in which the seller agrees to deliver on a specified future date, a specified instrument, at a specified price or yield. The credit risk inherent in futures is the risk that the exchange party may default. Futures contracts settle in cash daily; therefore, there is minimal credit risk to the Company. The credit risk inherent in forwards arises from the potential inability of counterparties to meet the terms of their contracts. Both futures and forwards are also subject to the risk of movements in interest rates or the value of the underlying securities or instruments.
Derivative instruments expose the Company to credit and market risk. If the counterparty fails to perform, the credit risk is equal to the fair value gain of the derivative. When the fair value of a derivative contract is positive, this indicates the counterparty owes the Company, and therefore, creates a repayment risk for the Company. When the fair value of a derivative contract is negative, the Company owes the counterparty and has no repayment risk. The Company minimizes the credit or repayment risk in derivative instruments by entering into transactions with high quality counterparties that are reviewed periodically by the Company’s credit committee. The Company also maintains a policy of requiring that all derivative contracts be governed by an International Swaps and Derivatives Associations Master Agreement; depending on the nature of the derivative transactions, bilateral collateral agreements may be required as well. When the Company has more than one outstanding derivative transaction with a single counterparty, and there exists a legally enforceable master netting agreement with the counterparty, the mark to market exposure is the net of the positive and negative exposures with the same counterparty. When there is a net negative exposure, the Company considers its exposure to the counterparty to be zero. The net mark to market position with a particular counterparty represents a reasonable measure of credit risk when there is a legally enforceable master netting agreement, including a legal right of setoff of receivable and payable derivative contracts between the Company and a counterparty.
Market risk is the adverse effect that a change in interest rates, currency or implied volatility rates has on the value of a financial instrument. The Company manages the market risk associated with interest rate and foreign exchange contracts by establishing and monitoring limits on the types and degree of risk that may be undertaken. The Company continually measures this risk by using a value-at-risk methodology.
Fair Value Hedges
The Company enters into interest rate swaps to convert its commercial loan and fixed rate funding exposure to a floating rate. For the years ended December 31, 2002 and 2001, the Company recognized additional income in the net interest margin of $49.9 and $13.4 million, respectively, related to cash payments from net settlements and income accrued for interest rate swaps accounted for as fair value hedges. This hedging strategy resulted in $1.4 million in ineffectiveness being recorded in the financial statements at December 31, 2002.
The Company maintains a risk management program to protect and manage interest rate risk and pricing risk associated with its mortgage loan inventory and pipeline. The following derivative instruments are recorded in the financial statements at fair value and are used to offset changes in value of the mortgage inventory due to changes in market interest rates: forward contracts, interest rate lock commitments and option contracts. A portion of the forward contracts have been documented as fair value hedges of specific pools of loans that meet the similar assets test as described in SFAS No. 133. The pools of hedged loans are recorded in the financial statements at their fair value, resulting in a partial offset of the market value adjustments on the forward contracts. The pools of loans are matched with a certain portion of a forward contract so that the expected changes in market value will inversely offset within a range of 80% to 125%. This hedging strategy resulted in $72.7 million in ineffectiveness being recorded in the financial statements at December 31, 2002.
Cash Flow Hedges
The Company uses various interest rate swaps to convert floating rate funding to fixed rates. Specific types of funding and principal amounts hedged were determined based on prevailing market conditions and the current shape of the yield curve. The terms and notional amounts of the swaps are determined based on management’s assessment of future interest rates, as well as on other factors.
For the years ended December 31, 2002 and 2001, the Company recognized expense in the net interest margin of $100.3 million and $50.9 million, respectively, related to cash payments and expense accrued for interest rate swaps accounted for as cash flow hedges.
Gains and losses on derivative contracts that are reclassified from accumulated other comprehensive income to current period earnings are included as an adjustment to the cost of funding in the net interest margin. As of December 31, 2002, $37.8 million of the deferred net losses on derivative instruments that are recorded in accumulated other comprehensive income are expected to be reclassified to interest expense in the next twelve months as derivatives mature or as payments are made.
SunTrust 2002 Annual Report | 81 | notes to consolidated financial statements |
notes to consolidated financial statements
Trading Activities
The Company enters into various derivative contracts as part of its trading activities on behalf of its clients and for its own trading account. These trading positions primarily include interest rate swaps, foreign currency contracts and credit default swaps. The Company maintains positions in interest rate swaps for its own trading account as part of its overall interest rate risk management strategy. Foreign exchange derivative contracts are used to manage the Company’s foreign currency exchange risk and to provide derivative products to customers. The Company does not have any hedges of foreign currency exposure within the guidelines of SFAS No.133. The Company buys and sells credit protection to customers and dealers using credit default swaps. These derivative instruments allow the Company to pay or receive a stream of payments in return for receiving or providing protection in the event of default. These derivatives are accounted for as trading assets and any gain or loss in market value is recorded in trading income. As of December 31, 2002 and 2001, referenced assets covered by these agreements totaled $180 and $150 million, respectively.
Credit-Related Arrangements
In meeting the financing needs of its customers, the Company already issues commitments to extend credit, standby and other letters of credit and guarantees. For additional information regarding guarantees, which includes standby and other letters of credit, see Note 19. The Company also provides securities lending services. For these instruments, the contractual amount of the financial instrument represents the maximum potential credit risk if the counterparty does not perform according to the terms of the contract. A large majority of these contracts expire without being drawn upon. As a result, total contractual amounts do not represent actual future credit exposure or liquidity requirements.
Commitments to extend credit are agreements to lend to a customer who has complied with predetermined contractual conditions. Commitments generally have fixed expiration dates and are subjected to the Company’s credit policy standards. As of December 31, 2002, the Company had outstanding commitments to extend credit to its customers totaling $49.6 billion.
The Company services mortgage loans other than those included in the accompanying Consolidated Financial Statements and, in some cases, accepts a recourse liability on the serviced loans. The Company’s exposure to credit loss in the event of nonperformance by the other party to these recourse loans is approximately $4.2 billion. In addition to the value of the property serving as collateral, approximately $3.1 billion of the balance of these loans serviced with recourse as of December 31, 2002, is insured by governmental agencies and private mortgage insurance firms.
When-Issued Securities
The Company enters into transactions involving “when-issued securities.” When-issued securities are commitments to purchase or sell securities authorized for issuance but not yet actually issued. Accordingly, they are not recorded on the balance sheet until issued. Risks arise from the possible inability of counterparties to meet the terms of their contracts and from movements in securities values and interest rates. As of December 31, 2002, the Company did not have any commitments to purchase or sell when-issued securities.
Other Off-Balance Sheet Arrangements
SunTrust Bank assists in providing liquidity to select corporate customers by directing them to a third-party-owned commercial paper conduit. SunTrust’s conduit relationship is with Three Pillars Funding Corporation (Three Pillars). Three Pillars provides financing for or direct purchases of financial assets originated and serviced by SunTrust Bank’s corporate customers. Three Pillars finances this activity by issuing A-1/P-1 rated commercial paper. The result is a favorable funding arrangement for these SunTrust Bank customers.
Three Pillars had assets and liabilities, not included in the Consolidated Balance Sheet, of approximately $2.8 and $2.2 billion as of December 31, 2002 and 2001, respectively, which primarily consisted of secured loans, marketable asset-backed securities and short-term commercial paper liabilities. For the years ended December 31, 2002 and 2001, activities related to the Three Pillars relationship generated approximately $16.4 million and $11.1 million in fee revenue for SunTrust Bank. These activities include: client referrals and investment recommendations to Three Pillars; the issuing of a letter-of-credit, which provides partial credit protection to commercial paper holders; and providing a majority of the temporary liquidity arrangements that would provide funding to Three Pillars in the event that it can no longer issue commercial paper. As of December 31, 2002, the liquidity commitments and other credit enhancement SunTrust Bank had to Three Pillars totaled $3.9 billion and $346.6 million, respectively, which represents the Company’s maximum exposure to potential loss. The Company manages the credit risk associated with these commitments by subjecting them to the Company’s normal credit approval and monitoring processes. Currently, the Company believes it is unlikely it would be required to fund under these arrangements.
notes to consolidated financial statements | 82 | SunTrust 2002 Annual Report |
In January 2003, the FASB issued FIN No. 46, “Consolidation of Variable Interest Entities,” which addresses the criteria for consolidation of entities similar to Three Pillars. SunTrust believes that Three Pillars, as currently structured, would be consolidated. If consolidated, Three Pillars would not have a material impact on the results of operations of the Company and would have an estimated 19 basis points and 29 basis points impact on Tier 1 and total capital, respectively. The Company is in the process of reviewing Three Pillars’ current operations to determine the most optimal operating structure given these new rules.
As part of its community reinvestment initiatives, the Company invests in multi-family low income housing throughout its footprint as a limited partner in various properties which are currently not included in the Consolidated Financial Statements. These investments are currently accounted for under the equity method. The Company is in the process of evaluating the impact of FIN No. 46, as described in Note 1; however, based on an initial assessment, it appears reasonably possible that the Company will be required to consolidate the partnerships when the consolidation requirements become effective July 1, 2003. As of December 31, 2002, approximately $833.5 million of assets are included in the partnerships and the Company’s maximum potential exposure to loss relative to these partnerships is $408.8 million, consisting of the limited partnership investments plus unfunded commitments. The Company receives affordable housing federal and state tax credits for these limited partnership investments.
NOTE 19 Guarantees
The Company has undertaken certain guarantee obligations in the ordinary course of business. In following the provisions of FIN 45, as addressed in Note 1, the Company must consider guarantees that have any of the following four characteristics: (i) contracts that contingently require the guarantor to make payments to a guaranteed party based on changes in an underlying factor that is related to an asset, a liability or an equity security of the guaranteed party; (ii) contracts that contingently require the guarantor to make payments to a guaranteed party based on another entity’s failure to perform under an obligating agreement; (iii) indemnification agreements that contingently require the indemnifying party to make payments to an indemnified party based on changes in an underlying factor that is related to an asset, a liability or an equity security of the indemnified party; and (iv) indirect guarantees of the indebtedness of others.
The issuance of a guarantee imposes an obligation to stand ready to perform, and should certain triggering events occur, it also imposes an obligation to make future payments. Payments may be in the form of cash, financial instruments, other assets, shares of the Company’s stock or provisions of its services. The following is a discussion of the guarantees that the Company has issued as of December 31, 2002, which have characteristics as specified by FIN 45.
Letters of Credit
Letters of credit are conditional commitments issued by the Company generally to guarantee the performance of a customer to a third party in borrowing arrangements, such as commercial paper, bond financing and similar transactions. The credit risk involved in issuing letters of credit is essentially the same as that involved in extending loan facilities to customers and may be reduced by selling participations to third parties. The Company issues letters of credit that are classified as either financial standby, performance standby or commercial letters of credit. Commercial letters of credit are specifically excluded from the disclosure and recognition requirements of FIN 45.
As of December 31, 2002, the maximum potential amount of the Company’s obligation was $9.2 billion for financial and performance standby letters of credit. The Company has recorded $4.6 million in other liabilities for unearned fees related to these letters of credit. The Company’s outstanding letters of credit generally have a term of less than one year. If a letter of credit is drawn upon, the Company may seek recourse through the customer’s underlying line of credit. If the customer’s line of credit is also in default, the Company may take possession of the collateral securing the line of credit.
Sales of Loans and Mortgage Servicing Rights
SunTrust Mortgage, Inc. (STM), a subsidiary of SunTrust, originates residential mortgage loans, which are sold to outside investors in the normal course of business on a non-recourse basis. When mortgage loans are sold in the secondary market, representations and warranties regarding certain attributes of the loans sold are made to the third party purchaser. These representations and warranties extend through the life of the mortgage loan, generally 15 to 30 years; however, the expected life of a mortgage loan is approximately 6 years. Subsequent to the sale, if inadvertent underwriting deficiencies or defects are discovered in individual mortgage loans, STM may be obligated to repurchase the respective mortgage loan if such deficiencies or defects cannot be cured by STM within the 90 day period following discovery.
Mortgage loans sold to outside investors for the years ended December 31, 2002, 2001 and 2000 were $25.5, $18.9 and $9.7 billion, respectively. In the event that STM repurchases a mortgage loan, STM will record the mortgage loan as an asset and continue to collect principal and interest from the mortgagee. In the event that the mortgage loan goes into default, STM may take possession of the property securing the mortgage loan and remarket the property to offset any potential losses.
Additionally, STM sells mortgage servicing rights and transfers the servicing obligation to the buyer in the ordinary course of business. STM has warranted and represented to the buyer that the underlying loans meet certain attributes and criteria. If, subsequent to the sale and transfer of the servicing rights, inadvertent underwriting deficiencies or defects are discovered in individual underlying loans, STM may be obligated to repurchase the respective mortgage loan or reimburse the buyer for any related loss if these defects and deficiencies cannot be cured. As of December 31, 2002, STM’s estimated liability was $5.4 million, which is included in other liabilities.
SunTrust 2002 Annual Report | 83 | notes to consolidated financial statements |
notes to consolidated financial statements
The Company sells loans from its student loan portfolio in the ordinary course of business. Subsequent to the sale, if a breach of the warranties and representations is discovered, the Company may be obligated to repurchase the loan, at which time the Company would recognize the loan as an asset and continue to collect the principal and interest due for the remaining life of the loan. Student loan sales for the years ended December 31, 2002, 2001 and 2000 were $510.5, $123.5 and $567.1 million, respectively.
If a repurchased loan should later go into default, student loans are subject to the federal student loan guarantee through the Department of Education as administered by various guarantee agencies. This program guarantees that, in the event of default, the various guarantee agencies will repurchase the loan at 98% of the outstanding principal and interest due at the time of default. However, if the deficiency or defect resulting in the Company’s repurchase of the loan is such that the loan loses its eligible loan status under the various federal student lending programs, then the various guarantee agencies will not repurchase the loan in the event of default. This risk is mitigated by the fact that the Company originates and services its student loans through various third parties. The third parties are contractually obligated to indemnify the Company through repurchase of the loan if the loan’s guarantee claim with the various guarantee agencies is rejected due to an act or omission by such third party.
Securitizations
During 2001, the Company transferred a total of $1.9 billion of single-family mortgages to securities available for sale in two securitization transactions. These securities, less securities sold, are maintained in the Company’s securities available for sale portfolio.
The first securitization of $0.5 billion was recorded in February 2001. The securitization was guaranteed by Fannie Mae with the Company maintaining one-percent recourse on the losses incurred in the securitized loan portfolio. A second securitization of $1.4 billion was recorded in March 2001. This was a private securitization. SunTrust repurchased substantially all of the securities issued by the trust and as a result maintained credit risk on the securitized loan portfolio. Securitized loans held for investment were $880.3 and $1,667.5 million as of December 31, 2002 and 2001, respectively. Securitized mortgage loans past due 60 days or more were $3.8 and $3.6 million as of December 31, 2002 and 2001, respectively. There have been no charge-offs related to these loans in 2002 and 2001.
At the time of securitization, a reserve was established on the balance sheet in other liabilities representing management’s estimate of loss on securitized loans. The reserve was established based on management’s evaluation of the size and risk characteristics of the securitized loan portfolio. The reserve is periodically evaluated by Management for adequacy, with consideration given to the balance of problem loans, prior loan loss experience, current economic conditions, value of collateral and other risk factors. As of December 31, 2002, the reserve balance was $2.3 million.
Other
Regency Development Associates, Inc., a SunTrust Community Development Corporation (CDC) subsidiary, has issued indemnifications to general partners in low income housing limited partnership investments where CDC is a limited partner. The indemnifications cover potential losses allocated to the general partner as a result of operating losses incurred by the low income housing partnerships. Given the nature of these indemnifications, it is not possible to estimate a maximum potential dollar amount for this liability, as future losses are not expected or estimable. The Company is in the process of reviewing potential alternatives to these indemnification agreements.
Third party investors hold Series B Preferred Stock in STB Real Estate Holdings, Inc. (STBREH), a subsidiary of SunTrust. The contract between STBREH and third party investors contains an automatic exchange clause which, under certain circumstances, requires the Series B preferred shares to be automatically exchanged for guaranteed preferred beneficial interest in debentures of the Company. The guaranteed preferred beneficial interest in debentures are guaranteed to have a liquidation value at least equal to the sum of the issue price, $350 million, and the issue yield, 8.5% per annum. Currently, $382.4 million is accrued in other liabilities for the principal and one year of interest. This exchange agreement remains in effect as long as any shares of Series B Preferred Stock are owned by third party investors, not to exceed 30 years.
SunTrust 2002 Annual Report | 84 | notes to consolidated financial statements |
SunTrust Securities, Inc. (STS) and SunTrust Capital Markets, Inc. (STCM), broker-dealer affiliates of SunTrust, use a common third party clearing broker to clear and execute their customers’ securities transactions and to hold customer accounts. Under their respective agreements, STS and STCM agree to indemnify the clearing broker for its services. If a customer initiates a purchase but does not have the funds to settle the trade within the three day settlement cycle, then STS or STCM will indemnify the broker for amounts paid to purchase the security. The maximum potential liability could be equal to the aggregate trading volume of their respective customers’ transactions for three consecutive days’ trading volumes; however, this cannot be estimated due to the volatility in daily trading volumes. The liability is minimized by the fact that, in the event of nonperformance by the customer, the underlying security would be transferred to STS or STCM who would in turn immediately liquidate the position, limiting the loss exposure to the market fluctuation in the underlying price of the security. Additionally, the affiliate may seek recourse from the customer by reimbursing itself from any cash or securities in the defaulting customers’ account. For the year ended December 31, 2002, STS and STCM experienced minimal net losses as a result of the indemnity. The clearing agreements expire in 2004 for STS and 2005 for STCM.
SunTrust Bank has guarantees associated with credit default swaps, an agreement in which the buyer of protection pays a premium to the seller of the credit default swap for protection against an event of default. Events constituting default under such agreements that would result in the Company making a guaranteed payment to a counterparty may include (i) default of the referenced asset; (ii) bankruptcy of the customer; or (iii) restructuring or reorganization by the customer. The notional amount outstanding at December 31, 2002 is $175.0 million, with $110.0 million expiring in 2003, $25.0 million in 2004 and $40.0 million in 2007. In the event of default under the contract, the Company would make a cash payment to the holder of credit protection and would take delivery of the referenced asset from which the Company may recover a portion of the credit loss. As of December 31, 2002, a net liability of $1.1 million is recorded in other liabilities, representing the fair value of these derivatives.
As previously discussed in Note 18, SunTrust Bank assists in providing liquidity to select corporate customers by directing them to a third-party-owned commercial paper conduit, Three Pillars. In the event that Three Pillars is no longer able to issue commercial paper, SunTrust Bank will be required to provide necessary temporary liquidity to Three Pillars. SunTrust Bank has never had to fund under this liquidity arrangement. As of December 31, 2002, the maximum potential amount of the Company’s obligation under the arrangement is $3.9 billion; however, SunTrust Bank’s commitment is supported by a portfolio of financial assets sufficient to significantly limit any potential loss. The guarantees expire at various times over a period of one year.
NOTE 20 Concentrations Of Credit Risk
Credit risk represents the maximum accounting loss that would be recognized at the reporting date if borrowers failed to perform as contracted and any collateral or security proved to be of no value. Concentrations of credit risk (whether on- or off-balance sheet) arising from financial instruments can exist in relation to individual borrowers or groups of borrowers, certain types of collateral, certain types of industries or certain regions of the country. Credit risk associated with these concentrations could arise when a significant amount of loans, related by similar characteristics, are simultaneously impacted by changes in economic or other conditions that cause their probability of repayment to be adversely affected. The Company does not have a significant concentration to any individual client except for the U.S. government and its agencies. The major concentrations of credit risk for the Company arise by collateral type in relation to loans and credit commitments. The only significant concentration that exists is in loans secured by residential real estate. At December 31, 2002, the Company had $19.4 billion in residential real estate loans, representing 26.6% of total loans, and an additional $5.7 billion in commitments to extend credit on such loans. A geographic concentration arises because the Company operates primarily in the Southeastern and Mid-Atlantic regions of the United States.
SunTrust engages in limited international banking activities. The Company’s total cross-border outstandings were $366.2 million as of December 31, 2002.
SunTrust 2002 Annual Report | 85 | notes to consolidated financial statements |
notes to consolidated financial statements
NOTE 21 Fair Values Of Financial Instruments
The following table presents the carrying amounts and fair values of the Company’s financial instruments at December 31, 2002 and 2001:
| | 2002 | | 2001 | |
| |
| |
| |
(In thousands) | | Carrying
Amount | | Fair
Value | | Carrying
Amount | | Fair
Value | |
| |
| |
| |
| |
| |
| Financial assets | | | | | | | | | | | | | |
| | Cash and short-term investments | | $ | 5,558,295 | | $ | 5,558,295 | | $ | 5,910,044 | | $ | 5,910,044 | |
| | Trading assets | | | 1,717,774 | | | 1,717,774 | | | 1,343,602 | | | 1,343,602 | |
| | Securities available for sale | | | 23,445,182 | | | 23,445,182 | | | 19,656,391 | | | 19,656,391 | |
| | Loans held for sale | | | 7,747,793 | | | 7,752,689 | | | 4,319,594 | | | 4,321,983 | |
| | Loans | | | 72,237,821 | | | 73,858,294 | | | 68,092,163 | | | 68,808,789 | |
| | Mortgage servicing rights | | | 383,918 | | | 442,701 | | | 351,200 | | | 426,948 | |
| Financial liabilities | | | | | | | | | | | | | |
| | Consumer and commercial deposits | | | 70,226,810 | | | 70,491,118 | | | 62,281,242 | | | 62,482,209 | |
| | Brokered deposits | | | 3,169,826 | | | 3,170,267 | | | 2,829,687 | | | 2,824,428 | |
| | Foreign deposits | | | 6,309,992 | | | 6,309,992 | | | 2,425,493 | | | 2,425,493 | |
| | Short-term borrowings | | | 11,770,961 | | | 11,770,961 | | | 11,755,926 | | | 11,755,926 | |
| | Long-term debt and guaranteed preferred beneficial interests in debentures | | | 11,879,820 | | | 12,795,905 | | | 12,660,580 | | | 13,139,444 | |
| | Trading liabilities | | | 930,645 | | | 930,645 | | | 512,052 | | | 512,052 | |
| Other financial instruments | | | | | | | | | | | | | |
| | Commitments to extend credit | | | | | | 58,184 | | | | | | 58,685 | |
| | Standby letters of credit | | | | | | 4,674 | | | | | | 5,491 | |
| | | |
|
| |
|
| |
|
| |
|
| |
The following methods and assumptions were used by the Company in estimating the fair value of financial instruments:
• | Short-term financial instruments are valued at their carrying amounts reported in the balance sheet, which are reasonable estimates of fair value due to the relatively short period to maturity of the instruments. This approach applies to cash and cash equivalents, short-term investments, short-term borrowings and certain other assets and liabilities. |
• | Trading assets and liabilities are substantially valued at quoted market prices. If quoted market prices are not available, fair values are based on quoted market prices of comparable instruments except in the case of certain options and swaps where pricing models are used. |
• | Securities available for sale are substantially valued at quoted market prices. |
• | Loans held for sale are valued based on quoted market prices in the secondary market. |
• | Loans are valued on the basis of estimated future receipts of principal and interest, discounted at rates currently being offered for loans with similar terms and credit quality. Loan prepayments are used to adjust future cash flows based on historical patterns. The carrying amount of accrued interest approximates its fair value. |
• | Mortgage servicing rights are valued through a review of valuation assumptions that are supported by market and economic data collected from various sources. |
• | Deposit liabilities with no defined maturity such as demand deposits, NOW/money market accounts and savings accounts have a fair value equal to the amount payable on demand at the reporting date, i.e., their carrying amounts. Fair values for certificates of deposit are estimated using a discounted cash flow calculation that applies current interest rates to a schedule of aggregated expected maturities. The intangible value of long-term relationships with depositors is not taken into account in estimating fair values. |
• | Fair values for long-term debt and guaranteed preferred beneficial interests in debentures are based on quoted market prices for similar instruments or estimated using discounted cash flow analysis and the Company’s current incremental borrowing rates for similar types of instruments. |
• | Fair values for derivatives and unfunded commitments (futures, swaps, forwards, options, guarantees, and lending commitments) are based on quoted market prices, current settlement values, pricing models or other formulas. |
notes to consolidated financial statements | 86 | SunTrust 2002 Annual Report |
NOTE 22 Contingencies
The Company and its subsidiaries are parties to numerous claims and lawsuits arising in the course of their normal business activities, some of which involve claims for substantial amounts. Although the ultimate outcome of these suits cannot be ascertained at this time, it is the opinion of management that none of these matters, when resolved, will have a material effect on the Company’s consolidated results of operations or financial position.
NOTE 23 Business Segment Reporting
Unlike financial accounting, there is no comprehensive authoritative body of guidance for management accounting practices equivalent to generally accepted accounting principles. Therefore, the disclosure of business segment performance is not necessarily comparable with similar information presented by any other financial institution.
The Company utilizes a matched maturity funds transfer pricing methodology to transfer interest rate risk of all assets and liabilities to the Corporate Treasury area which manages the interest rate risk of the Company. Differences in the aggregate amounts of transfer priced funds charges and credits are reflected in the Corporate/Other line of business segment. A system of internal credit transfers is utilized to recognize supportive business services across lines of business. The net results of these credits are reflected in each line of business segment. The cost of operating office premises is charged to the lines of business by use of an internal cost transfer process. Allocations of certain administrative support expenses and customer transaction processing expenses are also reflected in each line of business segment. The offset to these expense allocations, as well as the amount of any unallocated expenses, is reported in the Corporate/Other line of business segment.
The Company also utilizes an internal credit risk transfer methodology (the “credit risk premium”) which creates a current period financial charge against interest income to each line of business based on the estimated credit risk-adjusted return on loans. The offset to the aggregate credit risk premium charges is matched against the Company’s current provision for loan losses with any difference reported in the Corporate/Other line of business segment. The provision for income taxes is also reported in the Corporate/Other line of business segment.
The Company continues to build and implement further enhancements to its internal management reporting system that are expected to be implemented throughout 2003 and beyond. Once complete, the items reported for each line of business segment are expected to include: assets, liabilities and attributed economic capital; matched maturity funds transfer priced net interest revenue, net of credit risk premiums; direct noninterest income; internal credit transfers between lines of business for supportive business services; and fully absorbed expenses. The internal management reporting system and the business segment disclosures for each line of business do not currently include attributed economic capital, nor fully absorbed expenses. Any amounts not currently reported in each line of business segment are reported in the Corporate/Other line of business segment. The implementation of these enhancements to the internal management reporting system is expected to materially affect the net income disclosed for each segment. Whenever significant changes to management reporting methodologies take place, the impact of these changes is quantified and prior period information is restated when possible.
The tables on page 88 disclose selected financial information for SunTrust’s reportable business segments for the twelve months ended December 31, 2002 and 2001.
SunTrust 2002 Annual Report | 87 | notes to consolidated financial statements |
notes to consolidated financial statements
| | Twelve Months Ended December 31, 2002 | |
| |
| |
(In thousands) | | Retail | | Commercial | | Corporate &
Investment
Banking | | Mortgage | | Private
Client
Services | | Corporate/
Other | | Consolidated | |
| |
| |
| |
| |
| |
| |
| |
| |
Average total assets | | $ | 23,337,413 | | $ | 22,330,224 | | $ | 20,330,853 | | $ | 19,232,253 | | $ | 1,761,595 | | $ | 21,523,758 | | $ | 108,516,096 | |
Average total liabilities | | | 51,727,342 | | | 9,911,088 | | | 5,253,804 | | | 1,291,695 | | | 1,561,602 | | | 30,044,858 | | | 99,790,389 | |
Average total equity | | | — | | | — | | | — | | | — | | | — | | | 8,725,707 | | | 8,725,707 | |
| | |
|
| |
|
| |
|
| |
|
| |
|
| |
|
| |
|
| |
Net interest income (FTE)1 | | | 1,387,926 | | | 560,129 | | | 235,098 | | | 376,302 | | | 40,264 | | | 683,511 | | | 3,283,230 | |
Provision for loan losses2 | | | 102,820 | | | 45,264 | | | 220,305 | | | 6,477 | | | 2,343 | | | 92,583 | | | 469,792 | |
| | |
|
| |
|
| |
|
| |
|
| |
|
| |
|
| |
|
| |
| Net interest revenue | | | 1,285,106 | | | 514,865 | | | 14,793 | | | 369,825 | | | 37,921 | | | 590,928 | | | 2,813,438 | |
| Noninterest revenue | | | 732,138 | | | 304,457 | | | 514,274 | | | 140,118 | | | 646,383 | | | 54,305 | | | 2,391,675 | |
| Noninterest expense | | | 1,247,127 | | | 371,775 | | | 343,188 | | | 348,492 | | | 471,769 | | | 559,916 | | | 3,342,267 | |
| | |
|
| |
|
| |
|
| |
|
| |
|
| |
|
| |
|
| |
| Total contribution before taxes and extraordinary items | | | 770,117 | | | 447,547 | | | 185,879 | | | 161,451 | | | 212,535 | | | 85,317 | | | 1,862,846 | |
Provision for income taxes3 | | | — | | | — | | | — | | | — | | | — | | | 531,037 | | | 531,037 | |
| | |
|
| |
|
| |
|
| |
|
| |
|
| |
|
| |
|
| |
| Income before extraordinary items | | | 770,117 | | | 447,547 | | | 185,879 | | | 161,451 | | | 212,535 | | | (445,720 | ) | | 1,331,809 | |
| Extraordinary items, net of tax | | | — | | | — | | | — | | | — | | | — | | | — | | | — | |
| | |
|
| |
|
| |
|
| |
|
| |
|
| |
|
| |
|
| |
Net income | | $ | 770,117 | | $ | 447,547 | | $ | 185,879 | | $ | 161,451 | | $ | 212,535 | | $ | (445,720 | ) | $ | 1,331,809 | |
| | |
|
| |
|
| |
|
| |
|
| |
|
| |
|
| |
|
| |
| | Twelve Months Ended December 31, 2001 | |
| |
| |
| | Retail | | Commercial | | Corporate &
Investment
Banking | | Mortgage | | Private
Client
Services | | Corporate/
Other | | Consolidated | |
| |
| |
| |
| |
| |
| |
| |
| |
Average total assets | | $ | 19,876,808 | | $ | 20,629,889 | | $ | 21,695,108 | | $ | 19,361,208 | | $ | 1,448,018 | | $ | 19,873,177 | | $ | 102,884,208 | |
Average total liabilities | | | 45,737,382 | | | 8,590,342 | | | 4,493,613 | | | 1,046,382 | | | 1,365,184 | | | 33,577,545 | | | 94,810,448 | |
Average total equity | | | — | | | — | | | — | | | — | | | — | | | 8,073,760 | | | 8,073,760 | |
| | |
|
| |
|
| |
|
| |
|
| |
|
| |
|
| |
|
| |
Net interest income (FTE)1 | | | 1,472,521 | | | 557,901 | | | 312,578 | | | 243,593 | | | 44,182 | | | 662,589 | | | 3,293,364 | |
Provision for loan losses2 | | | 49,702 | | | 37,520 | | | 140,459 | | | 7,025 | | | 1,516 | | | 38,944 | | | 275,166 | |
| | |
|
| |
|
| |
|
| |
|
| |
|
| |
|
| |
|
| |
| Net interest revenue | | | 1,422,819 | | | 520,381 | | | 172,119 | | | 236,568 | | | 42,666 | | | 623,645 | | | 3,018,198 | |
| Noninterest revenue | | | 617,346 | | | 263,261 | | | 403,850 | | | 209,866 | | | 593,176 | | | 68,324 | | | 2,155,823 | |
| Noninterest expense | | | 1,164,945 | | | 381,751 | | | 381,364 | | | 323,193 | | | 407,961 | | | 454,324 | | | 3,113,538 | |
| | |
|
| |
|
| |
|
| |
|
| |
|
| |
|
| |
|
| |
| Total contribution before taxes and extraordinary items | | | 875,220 | | | 401,891 | | | 194,605 | | | 123,241 | | | 227,881 | | | 237,645 | | | 2,060,483 | |
Provision for income taxes3 | | | — | | | — | | | — | | | — | | | — | | | 691,264 | | | 691,264 | |
| | |
|
| |
|
| |
|
| |
|
| |
|
| |
|
| |
|
| |
| Income before extraordinary items | | | 875,220 | | | 401,891 | | | 194,605 | | | 123,241 | | | 227,881 | | | (453,619 | ) | | 1,369,219 | |
| Extraordinary items, net of tax | | | — | | | — | | | — | | | — | | | — | | | 6,318 | | | 6,318 | |
| | |
|
| |
|
| |
|
| |
|
| |
|
| |
|
| |
|
| |
Net income | | $ | 875,220 | | $ | 401,891 | | $ | 194,605 | | $ | 123,241 | | $ | 227,881 | | $ | (447,301 | ) | $ | 1,375,537 | |
| | |
|
| |
|
| |
|
| |
|
| |
|
| |
|
| |
|
| |
1 | Net interest income is fully taxable equivalent (based on a 35% tax rate) and is presented on a matched maturity funds transfer price basis for the line of business. |
2 | Provision for loan losses includes a credit risk premium charge for the lines of business. |
3 | Includes regular income tax provision and taxable-equivalent income adjustment reversal of $39,522 and $40,764 for the twelve months ended December 31, 2002 and 2001, respectively. |
notes to consolidated financial statements | 88 | SunTrust 2002 Annual Report |
NOTE 24 Comprehensive Income
The Company’s comprehensive income, which includes certain transactions and other economic events that bypass the income statement, consists of net income and unrealized gains and losses on securities available for sale, and derivatives net of income taxes and other comprehensive income related to retirement plans.
Comprehensive income for the years ended December 31, 2002, 2001, and 2000 is calculated as follows:
(In thousands) | | 2002 | | 2001 | | 2000 | |
| |
| |
| |
| |
| Unrealized (loss) gain on available for sale securities, net, recognized in other comprehensive income: | | | | | | | | | | |
| | Before income tax | | $ | (195,217 | ) | $ | (356,603 | ) | $ | 621,853 | |
| | Income tax | | | (68,326 | ) | | (124,811 | ) | | 241,901 | |
| | |
|
| |
|
| |
|
| |
| | Net of income tax | | | (126,891 | ) | | (231,792 | ) | | 379,952 | |
| | |
|
| |
|
| |
|
| |
| Amounts reported in net income: | | | | | | | | | | |
| | Gain on sale of securities | | | 204,547 | | | 153,080 | | | 6,616 | |
| | Net amortization (accretion) | | | 47,654 | | | (11,633 | ) | | (15,942 | ) |
| | |
|
| |
|
| |
|
| |
| | Reclassification adjustment | | | 252,201 | | | 141,447 | | | (9,326 | ) |
| | Income tax | | | (88,270 | ) | | (49,506 | ) | | 3,264 | |
| | |
|
| |
|
| |
|
| |
| | Reclassification adjustment, net of tax | | | 163,931 | | | 91,941 | | | (6,062 | ) |
| | |
|
| |
|
| |
|
| |
| | Unrealized gain (loss) on available for sale securities arising during period, net of tax | | | 37,040 | | | (139,851 | ) | | 373,890 | |
| | Reclassification adjustment, net of tax | | | (163,931 | ) | | (91,941 | ) | | 6,062 | |
| | |
|
| |
|
| |
|
| |
| | Net unrealized (loss) gain on available for sale securities recognized in other comprehensive income | | | (126,891 | ) | | (231,792 | ) | | 379,952 | |
| | |
|
| |
|
| |
|
| |
| Unrealized gain (loss) on derivative financial instruments, net, recognized in other comprehensive income: | | | | | | | | | | |
| | Before income tax | | | 13,822 | | | (85,737 | ) | | — | |
| | Income tax | | | (4,838 | ) | | 30,008 | | | — | |
| | |
|
| |
|
| |
|
| |
| | Net of income tax | | | 8,984 | | | (55,729 | ) | | — | |
| | |
|
| |
|
| |
|
| |
| Cumulative effect of change in accounting principle | | | — | | | (16,246 | ) | | — | |
| | Income tax benefit | | | — | | | 5,686 | | | — | |
| | |
|
| |
|
| |
|
| |
| | Cumulative effect of change in accounting principle, net of tax | | | — | | | (10,560 | ) | | — | |
| | |
|
| |
|
| |
|
| |
| | Reclassification of losses from other comprehensive income to earnings | | | 4,786 | | | 11,460 | | | — | |
| | Income tax expense | | | (1,675 | ) | | (4,011 | ) | | — | |
| | |
|
| |
|
| |
|
| |
| | Reclassification adjustment, net of tax | | | 3,111 | | | 7,449 | | | — | |
| | |
|
| |
|
| |
|
| |
| Unrealized gain (loss) on derivative financial instruments arising during period, net of tax | | | 5,873 | | | (52,618 | ) | | — | |
| Reclassification adjustment, net of tax | | | 3,111 | | | 7,449 | | | — | |
| | |
|
| |
|
| |
|
| |
| | Net unrealized gain (loss) on derivative instruments recognized in other comprehensive income | | | 8,984 | | | (45,169 | ) | | — | |
| | |
|
| |
|
| |
|
| |
| Accumulated other comprehensive income related to retirement plans | | | (27,876 | ) | | — | | | — | |
| | |
|
| |
|
| |
|
| |
| Total unrealized (losses) gains recognized in other comprehensive income | | | (145,783 | ) | | (287,521 | ) | | 379,952 | |
| Net income | | | 1,331,809 | | | 1,375,537 | | | 1,294,100 | |
| | |
|
| |
|
| |
|
| |
| Total comprehensive income | | $ | 1,186,026 | | $ | 1,088,016 | | $ | 1,674,052 | |
| | |
|
| |
|
| |
|
| |
| | | | | | | | | | | | |
SunTrust 2002 Annual Report | 89 | notes to consolidated financial statements |
notes to consolidated financial statements
On January 1, 2001, an unrealized loss of $10.6 million, net of tax, was recorded as a transition adjustment to other comprehensive income for the current value of cash flow hedges that were not required to be marked to market prior to the adoption SFAS No. 133. $3.1 million and $7.5 million of this transition adjustment were reclassified from other comprehensive income as an expense in 2002 and 2001, respectively. As of December 31, 2002, all of the transition adjustment had been reclassified to income. Fair value adjustments to accumulated other comprehensive income for cash flow hedges this year amounted to $5.9 million, net of tax.
Other comprehensive income on December 31, 2002 included an unrealized loss of $46.7 million. In the next 12 months, $37.8 million of these losses are expected to be reclassified from other comprehensive income to the net interest margin.
NOTE 25 Other Noninterest Income And Fees And Other Charges
Other noninterest income in the Consolidated Statements of Income includes:
| | | Year Ended December 31 | |
| | |
| |
(In thousands) | | 2002 | | 2001 | | 2000 | |
| |
| |
| |
| |
| Trading account profits and commissions | | $ | 103,170 | | $ | 95,683 | | $ | 31,749 | |
| Other income | | | 130,953 | | | 160,486 | | | 132,865 | |
| | |
|
| |
|
| |
|
| |
| | Total other noninterest income | | | 234,123 | | | 256,169 | | | 164,614 | |
| | |
|
| |
|
| |
|
| |
| Fees and other charges in the Consolidated Statements of Income include: | | | | | | | | | | |
| Other charges and fees | | | 296,860 | | | 240,284 | | | 210,793 | |
| Investment banking income | | | 176,960 | | | 108,486 | | | 111,273 | |
| Retail investment services | | | 136,659 | | | 107,758 | | | 108,203 | |
| Credit card and other fees | | | 119,982 | | | 113,640 | | | 95,651 | |
| | |
|
| |
|
| |
|
| |
| | Total fees and other charges | | $ | 730,461 | | $ | 570,168 | | $ | 525,920 | |
| | |
|
| |
|
| |
|
| |
NOTE 26 Other Noninterest Expense
Other noninterest expense in the Consolidated Statements of Income includes:
| | | Year Ended December 31 | |
| | |
| |
(In thousands) | | 2002 | | 2001 | | 2000 | |
| |
| |
| |
| |
| Outside processing and software | | $ | 225,169 | | $ | 199,093 | | $ | 172,263 | |
| Consulting and legal | | | 91,067 | | | 87,704 | | | 59,560 | |
| Postage and delivery | | | 69,377 | | | 63,991 | | | 63,335 | |
| Communications | | | 64,845 | | | 59,232 | | | 59,797 | |
| Credit and collection services | | | 64,601 | | | 74,642 | | | 56,887 | |
| Amortization of intangible assets | | | 58,898 | | | 46,258 | | | 35,452 | |
| Other staff expense | | | 51,975 | | | 58,546 | | | 51,509 | |
| Operating supplies | | | 46,795 | | | 48,297 | | | 47,279 | |
| FDIC premiums | | | 17,352 | | | 15,985 | | | 13,504 | |
| Other real estate income | | | (122 | ) | | (4,231 | ) | | (3,809 | ) |
| Other expense | | | 210,879 | | | 178,424 | | | 83,778 | |
| | |
|
| |
|
| |
|
| |
| Total other noninterest expense | | $ | 900,836 | | $ | 827,941 | | $ | 639,555 | |
| | |
|
| |
|
| |
|
| |
notes to consolidated financial statements | 90 | SunTrust 2002 Annual Report |
NOTE 27 | SunTrust Banks, Inc. (Parent Company Only) Financial Information
Statements of Income — Parent Company Only |
| | Year Ended December 31 | |
| |
| |
(In thousands) | | 2002 | | 2001 | | 2000 | |
| |
| |
| |
| |
Operating Income | | | | | | | | | | |
| From subsidiaries: | | | | | | | | | | |
| | Dividends – substantially all from the Bank | | $ | 1,765,179 | | $ | 1,318,300 | | $ | 1,486,922 | |
| | Service fees | | | — | | | 156,870 | | | 140,012 | |
| | Interest on loans | | | 13,374 | | | 23,231 | | | 46,766 | |
| | Other income | | | 3 | | | 18 | | | 5 | |
| Other operating income | | | 57,128 | | | 53,336 | | | 70,531 | |
| | |
|
| |
|
| |
|
| |
| | Total operating income | | | 1,835,684 | | | 1,551,755 | | | 1,744,236 | |
| | |
|
| |
|
| |
|
| |
Operating Expense | | | | | | | | | | |
| Interest on short-term borrowings | | | 6,424 | | | 32,734 | | | 57,361 | |
| Interest on long-term debt | | | 156,833 | | | 170,868 | | | 183,732 | |
| Salaries and employee benefits | | | 23,095 | | | 84,320 | | | 52,845 | |
| Amortization of intangible assets | | | — | | | 7,644 | | | 7,644 | |
| Service fees to subsidiaries | | | 10,018 | | | 30,859 | | | 60,887 | |
| Other operating expense | | | 66,996 | | | 123,582 | | | 85,403 | |
| | |
|
| |
|
| |
|
| |
| | Total operating expense | | | 263,366 | | | 450,007 | | | 447,872 | |
| | |
|
| |
|
| |
|
| |
| Income before income taxes and equity in undistributed income of subsidiaries | | | 1,572,318 | | | 1,101,748 | | | 1,296,364 | |
| Income tax benefit | | | 32,396 | | | 116,836 | | | 21,010 | |
| | |
|
| |
|
| |
|
| |
| Income before equity in undistributed income of subsidiaries | | | 1,604,714 | | | 1,218,584 | | | 1,317,374 | |
| Extraordinary gain, net of taxes | | | — | | | 6,318 | | | — | |
| Equity in undistributed income of subsidiaries, net of extraordinary gain | | | (272,905 | ) | | 150,635 | | | (23,274 | ) |
| | |
|
| |
|
| |
|
| |
| | Net Income | | $ | 1,331,809 | | $ | 1,375,537 | | $ | 1,294,100 | |
| | | |
|
| |
|
| |
|
| |
SunTrust 2002 Annual Report | 91 | notes to consolidated financial statements |
notes to consolidated financial statements
Balance Sheets — Parent Company Only
| | December 31 | |
| |
| |
(In thousands) | | 2002 | | 2001 | |
| |
| |
| |
Assets | | | | | | | |
| Cash in subsidiary banks | | $ | 71,922 | | $ | 3,819 | |
| Interest-bearing deposits in banks | | | 6,490 | | | 4,273 | |
| Funds sold and securities purchased under agreements to resell | | | — | | | 278,477 | |
| Securities available for sale | | | 334,455 | | | 341,269 | |
| Loans to subsidiaries | | | 867,182 | | | 685,234 | |
| Investment in capital stock of subsidiaries stated on the basis of the Company’s equity in subsidiaries’ capital accounts | | | | | | | |
| | Banking subsidiaries | | | 9,512,749 | | | 9,631,634 | |
| | Nonbanking and holding company subsidiaries | | | 1,547,862 | | | 1,259,480 | |
| Premises and equipment | | | 51,175 | | | 24,216 | |
| Intangible assets | | | 76,587 | | | 76,587 | |
| Other assets | | | 1,031,695 | | | 940,916 | |
| | |
|
| |
|
| |
| | Total assets | | $ | 13,500,117 | | $ | 13,245,905 | |
| | |
|
| |
|
| |
Liabilities and Shareholders’ Equity | | | | | | | |
| Short-term borrowings from | | | | | | | |
| | Subsidiaries | | $ | 119,230 | | $ | 230,850 | |
| | Non-affiliated companies | | | 358,945 | | | 340,929 | |
| Long-term debt – Note 14 | | | 3,383,934 | | | 3,520,063 | |
| Other liabilities | | | 868,512 | | | 794,495 | |
| | |
|
| |
|
| |
| | Total liabilities | | | 4,730,621 | | | 4,886,337 | |
| | |
|
| |
|
| |
| Preferred stock, no par value; 50,000,000 shares authorized; none issued | | | — | | | — | |
| Common stock, $1.00 par value | | | 294,163 | | | 294,163 | |
| Additional paid in capital | | | 1,276,110 | | | 1,259,609 | |
| Retained earnings | | | 6,322,217 | | | 5,479,951 | |
| Treasury stock and other | | | (632,464 | ) | | (329,408 | ) |
| | |
|
| |
|
| |
| | Realized shareholders’ equity | | | 7,260,026 | | | 6,704,315 | |
| Accumulated other comprehensive income | | | 1,509,470 | | | 1,655,253 | |
| | |
|
| |
|
| |
| | Total shareholders’ equity | | | 8,769,496 | | | 8,359,568 | |
| | | |
|
| |
|
| |
| | Total liabilities and shareholders’ equity | | $ | 13,500,117 | | $ | 13,245,905 | |
| | |
|
| |
|
|
|
| Common shares outstanding | | | 282,504,571 | | | 288,601,607 | |
| Common shares authorized | | | 750,000,000 | | | 750,000,000 | |
| Treasury shares of common stock | | | 11,658,186 | | | 5,561,150 | |
| | |
|
| |
|
| |
| | | | | | | | | |
notes to consolidated financial statements | 92 | SunTrust 2002 Annual Report |
Statements Of Cash Flow — Parent Company Only
| | Year Ended December 31 | |
| |
| |
(In thousands) | | 2002 | | 2001 | | 2000 | |
| |
| |
| |
| |
Cash Flow from Operating Activities: | | | | | | | | | | |
| Net income | | $ | 1,331,809 | | $ | 1,375,537 | | $ | 1,294,100 | |
| Adjustments to reconcile net income to net cash provided by operating activities: | | | | | | | | | | |
| | Extraordinary gain, net of taxes | | | — | | | (6,318 | ) | | — | |
| | Equity in undistributed income of subsidiaries | | | 272,905 | | | (150,635 | ) | | 23,274 | |
| | Depreciation and amortization | | | 6,016 | | | 8,703 | | | 12,912 | |
| | Amortization of compensation element of restricted stock | | | 3,074 | | | 6,110 | | | 9,408 | |
| | Securities gains | | | (4,326 | ) | | (224 | ) | | (10,993 | ) |
| | Deferred income tax provision (benefit) | | | 2,184 | | | (7,800 | ) | | 15,271 | |
| | Net increase in accrued interest receivable, prepaid expenses and other assets | | | (94,951 | ) | | (232,957 | ) | | (203,163 | ) |
| | Net increase in accrued interest payable, accrued expenses and other liabilities | | | 76,108 | | | 30,869 | | | 72,135 | |
| | |
|
| |
|
| |
|
| |
| | Net cash provided by operating activities | | | 1,592,819 | | | 1,023,285 | | | 1,212,944 | |
| | |
|
| |
|
| |
|
| |
Cash Flow from Investing Activities: | | | | | | | | | | |
| Proceeds from sales and maturities of securities available for sale | | | 117,638 | | | 5,370 | | | 63,053 | |
| Purchase of securities available for sale | | | (118,919 | ) | | (46,411 | ) | | (20,136 | ) |
| Net change in loans to subsidiaries | | | (181,948 | ) | | 161,750 | | | 77,662 | |
| Capital expenditures | | | — | | | (6,131 | ) | | (9,103 | ) |
| Proceeds from sale of assets | | | 759 | | | — | | | — | |
| Capital contributions to subsidiaries | | | (543,227 | ) | | (74,303 | ) | | (79,250 | ) |
| Other, net | | | (67,351 | ) | | (3,799 | ) | | (301 | ) |
| | |
|
| |
|
| |
|
| |
| | Net cash (used in) provided by investing activities | | | (793,048 | ) | | 36,476 | | | 31,925 | |
| | |
|
| |
|
| |
|
| |
Cash Flow from Financing Activities: | | | | | | | | | | |
| Net change in short-term borrowings | | | (93,604 | ) | | (427,047 | ) | | (443,268 | ) |
| Proceeds from issuance of long-term debt | | | 316,456 | | | 600,000 | | | 300,000 | |
| Repayment of long-term debt | | | (451,608 | ) | | (22,161 | ) | | (65,773 | ) |
| Proceeds from the exercise of stock options | | | 12,824 | | | 19,013 | | | 17,905 | |
| Proceeds from stock issuance | | | 40,809 | | | 22,235 | | | 22,779 | |
| Proceeds used in acquisition and retirement of stock | | | (340,656 | ) | | (551,485 | ) | | (668,391 | ) |
| Dividends paid | | | (489,543 | ) | | (463,529 | ) | | (443,407 | ) |
| Restricted stock activity | | | (2,606 | ) | | — | | | — | |
| | |
|
| |
|
| |
|
| |
| | Net cash used in financing activities | | | (1,007,928 | ) | | (822,974 | ) | | (1,280,155 | ) |
| | |
|
| |
|
| |
|
| |
| Net (decrease) increase in cash and cash equivalents | | | (208,157 | ) | | 236,787 | | | (35,286 | ) |
| Cash and cash equivalents at beginning of year | | | 286,569 | | | 49,782 | | | 85,068 | |
| | |
|
| |
|
| |
|
| |
| Cash and cash equivalents at end of year | | $ | 78,412 | | $ | 286,569 | | $ | 49,782 | |
| | |
|
| |
|
| |
|
| |
Supplemental Disclosure | | | | | | | | | | |
| Income taxes received from subsidiaries | | $ | 495,194 | | $ | 558,887 | | $ | 591,326 | |
| Income taxes paid by Parent Company | | | (433,341 | ) | | (444,758 | ) | | (535,346 | ) |
| | |
|
| |
|
| |
|
| |
| Net income taxes received by Parent Company | | $ | 61,853 | | $ | 114,129 | | $ | 55,980 | |
| | |
|
| |
|
| |
|
| |
| Interest paid | | $ | 163,805 | | $ | 222,785 | | $ | 236,214 | |
| Net non-cash contribution of premises and equipment from subsidiaries | | | 24,234 | | | — | | | — | |
| | |
|
| |
|
| |
|
| |
| | | | | | | | | | | | |
SunTrust 2002 Annual Report | 93 | notes to consolidated financial statements |
board of directors
L. Phillip Humann1 | |
Director since 1991 | |
| Chairman of the Board, | |
| President and | |
| Chief Executive Officer | |
| | |
J. Hyatt Brown1 | |
Director since 1984 | |
| Chairman of the Board and | |
| Chief Executive Officer, | |
| Brown & Brown, Inc. | |
| Daytona Beach, Florida | |
| | |
Alston D. Correll3 | |
Director since 1997 | |
| Chairman of the Board and | |
| Chief Executive Officer, | |
| Georgia-Pacific Corporation | |
| Atlanta, Georgia | |
| | |
Douglas N. Daft1 | |
Director since 2000 | |
| Chairman of the Board and | |
| Chief Executive Officer, | |
| The Coca-Cola Company | |
| Atlanta, Georgia | |
| | |
A.W. Dahlberg3 | |
Director since 1996 | |
| Chairman of the Board, | |
| Mirant Corporation | |
| Atlanta, Georgia | |
| | |
Patricia C. Frist2 | |
Director since 2000 | |
| Partner in Frist Capital Partners, | |
| President, Frisco, Inc. and | |
| President, Patricia C. Frist and | |
| Thomas F. Frist, Jr. Foundation | |
| Nashville, Tennessee | |
| | |
David H. Hughes1 | |
Director since 1984 | |
| Chairman of the Board and | |
| Chief Executive Officer, | |
| Hughes Supply, Inc. | |
| Orlando, Florida | |
| | |
M. Douglas Ivester2 | |
Director since 1998 | |
| (Retired) Chairman of the Board | |
| and Chief Executive Officer, | |
| The Coca-Cola Company | |
| Atlanta, Georgia | |
| | |
Summerfield K. Johnston, Jr.1 | |
Director since 1997 | |
| Chairman of the | |
| Executive Committee, | |
| Coca-Cola Enterprises, Inc. | |
| Atlanta, Georgia | |
| | |
G. Gilmer Minor, III3 | |
Director since 1998 | |
| Chairman of the Board and | |
| Chief Executive Officer, | |
| Owens & Minor, Inc. | |
| Richmond, Virginia | |
| | |
Larry L. Prince3 | |
Director since 1996 | |
| Chairman of the Board and | |
| Chief Executive Officer, | |
| Genuine Parts Company | |
| Atlanta, Georgia | |
| | |
R.Randall Rollins2 | |
Director since 1995 | |
| Chairman of the Board, | |
| Rollins, Inc. and | |
| Chairman of the Board and | |
| Chief Executive Officer, | |
| RPC, Inc. | |
| Atlanta, Georgia | |
| | |
Frank S. Royal, M.D.2 | |
Director since 1998 | |
| President, | |
| Frank S. Royal, M.D., | |
| PC. Richmond, Virginia | |
| | |
James B. Williams1 | |
Director since 1984 | |
| Chairman of the | |
| Executive Committee, | |
| SunTrust Banks, Inc. | |
| Atlanta, Georgia | |
| | |
Karen Hastie Williams2 | |
Director since 2002 | |
| Partner, | |
| Crowell& Moring, LLP | |
| Washington, D.C. | |
| | |
Committees of the Board | |
1 | Executive Committee: | |
| James B. Williams, Chair | |
| | |
2 | Audit Committee | |
| M. Douglas Ivester, Chair | |
| Audit Committee Financial Expert | |
| | |
3 | Compensation and Governance Committee: | |
| A.W. Dahlberg, Chair | |
| | | |
board of directors | 94 | SunTrust 2002 Annual Report |
L. Phillip Humann | |
Chairman, President and Chief Executive Officer | |
| SunTrust Banks, Inc. | |
| 34 years of service. | |
| | |
John W. Clay, Jr. | |
Vice Chairman | |
| Geographic Banking, Corporate and | |
| Investment Banking Line of Business | |
| 36 years of service | |
| | |
Theodore J. Hoepner | |
Vice Chairman and Chief Risk Officer. | |
| Human Resources, Asset Quality, | |
| Legal and Regulatory Affairs, Audit | |
| and Efficiency and Quality Initiatives | |
| 35 years of service | |
| | |
John W. Spiegel | |
Vice Chairman and Chief Financial Officer | |
| Accounting, Funds Management, | |
| Risk Management, Strategic Finance & | |
| Taxes, Investor Relations and Treasury | |
| 38 years of service. | |
| | |
James M. Wells III | |
Vice Chairman | |
| Commercial, Retail, Mortgage, Private | |
| Client Services Lines of Business; | |
| Technology & Operations, Corporate | |
| Strategy and Marketing | |
| 35 years of service. | |
| | |
Robert H. Coords | |
Executive Vice President | |
| Chief Efficiency and Quality Officer | |
| 30 years of service. | |
| | |
Donald S. Downing | |
Executive Vice President | |
| Chief Strategy Officer | |
| 35 years of service. | |
| | |
Sterling Edmunds | |
Executive Vice President | |
| Mortgage Banking Line of Business | |
| 16 years of service. | |
| | |
C.T. Hill | |
Chairman, President and Chief Executive Officer | |
| Mid-Atlantic Banking Group | |
| 33 years of service. | |
| | |
Sandra Jansky | |
Executive Vice President | |
| Chief Credit Officer | |
| 22 years of service. | |
| | |
Craig J. Kelly | |
Executive Vice President | |
| Chief Marketing Officer | |
| 6 years of service. | |
| | |
C. Eugene Kirby | |
Executive Vice President | |
| Retail Banking Line of Business | |
| 18 years of service. | |
| | |
George W. Koehn | |
Chairman, President and Chief Executive Officer | |
| Florida Banking Group | |
| 24 years of service. | |
| | |
Carl F. Mentzer | |
Executive Vice President | |
| Commercial Banking Line of Business | |
| 25 years of service. | |
| | |
Dennis M. Patterson | |
Executive Vice President | |
| Sales and Corporate Administration | |
| 34 years of service. | |
William H. Rogers, Jr. | |
Executive Vice President | |
| Private Client Services Line of Business | |
| 22 years of service. | |
| | |
R. Charles Shufeldt | |
Executive Vice President | |
| Corporate and Investment Banking | |
| Line of Business | |
| 19 years of service. | |
| | |
Mary T. Steele | |
Senior Vice President | |
| Director of Human Resources | |
| 24 years of service. | |
| | |
Timothy E. Sullivan | |
Executive Vice President | |
| Chief Information Officer | |
| Joined SunTrust January, 2003. | |
| | |
E. Jenner Wood, III | |
Chairman, President and Chief Executive Officer | |
| Central Banking Group | |
| 28 years of service. | |
SunTrust 2002 Annual Report | 95 | management committee |
banks
Delivering Big Bank Capabilities with a Local Market Focus.
Geographic Area | | | Location | | | Key Executive(s) | | | Deposits | | | Branches | |
| | |
| | |
| |
|
| | |
| |
Central Group | | | Atlanta | | | E. Jenner Wood, III | | $ | 18.3 billion | | | 379 | |
| Atlanta Region | | | Atlanta | | | E. Jenner Wood, III | | $ | 7.9 billion | | | 161 | |
| | | | | | | J. Scott Wilfong | | | | | | | |
• | SunTrust Bank, Atlanta | | | Atlanta | | | E. Jenner Wood, III | | | 7.3 billion | | | 143 | |
| | | | | | | J. Scott Wilfong | | | | | | | |
• | SunTrust Bank, Gainesville | | | Gainesville | | | Lana D. Nix | | | 247 million | | | 9 | |
• | SunTrust Bank, Athens | | | Athens | | | Peter Hodgson, Jr. | | | 314 million | | | 9 | |
| | | | | | | | | | | | | | |
| Chattanooga Region | | | Chattanooga | | | Margaret Lynch Callihan | | $ | 2.4 billion | | | 60 | |
| | | | | | | | | | | | | | |
• | SunTrust Bank, Chattanooga | | | Chattanooga | | | Margaret Lynch Callihan | | | 1.3 billion | | | 31 | |
• | SunTrust Bank, Northwest Georgia | | | Rome | | | Edmond H. Wilson | | | 348 million | | | 11 | |
• | SunTrust Bank, Tennessee Valley | | | Florence, Ala. | | | W. David Jones | | | 731 million | | | 18 | |
| | | | | | | | | | | | | | |
| East Tennessee Region | | | Knoxville | | | Larry D. Mauldin | | $ | 1.8 billion | | | 42 | |
• | SunTrust Bank, East Tennessee | | | Knoxville | | | Larry D. Mauldin | | | 1.4 billion | | | 33 | |
• | SunTrust Bank, Northeast Tennessee | | | Johnson City | | | R. Odie Major | | | 400 million | | | 9 | |
| | | | | | | | | | | | | | |
| Georgia Region | | | Savannah | | | William B. Haile | | $ | 3.0 billion | | | 77 | |
• | SunTrust Bank, Augusta | | | Augusta | | | William R. Thompson | | | 463 million | | | 12 | |
• | SunTrust Bank, Middle Georgia | | | Macon | | | Mardie R. Herndon, Jr. | | | 556 million | | | 17 | |
• | SunTrust Bank, Savannah | | | Savannah | | | Gerald L. Rainey | | | 600 million | | | 13 | |
• | SunTrust Bank, Southeast Georgia | | | Brunswick | | | Jack E. Hartman | | | 447 million | | | 11 | |
• | SunTrust Bank, West Georgia | | | Columbus | | | Frank S. Etheridge, III | | | 461 million | | | 11 | |
• | SunTrust Bank, South Georgia | | | Albany | | | D. Michael Marz | | | 509 million | | | 13 | |
| | | | | | | | | | | | | | |
| Nashville Region | | | Nashville | | | Samuel O. Franklin, III | | $ | 3.2 billion | | | 39 | |
| | | | | | | Warren W. Woodring | | | | | | | |
| | | | | | | | | | | | | | |
• | SunTrust Bank, Nashville | | | Nashville | | | Samuel O. Franklin, III | | | 3.2 billion | | | 39 | |
| | | | | | | Warren W. Woodring | | | | | | | |
Florida Group | | | Orlando | | | George W. Koehn | | $ | 28.2 billion | | | 425 | |
| Central Florida Region | | | Orlando | | | Thomas H. Yochum | | $ | 8.3 billion | | | 117 | |
• | SunTrust Bank, Central Florida | | | Orlando | | | Thomas H. Yochum | | | 4.0 billion | | | 40 | |
• | SunTrust Bank, Mid-Florida | | | Lakeland | | | Charles W. McPherson | | | 1.3 billion | | | 27 | |
• | SunTrust Bank, East Central Florida | | | Daytona Beach | | | William H. Davison | | | 1.4 billion | | | 26 | |
• | SunTrust Bank, Brevard Co. | | | Melbourne | | | Julia Dunn Hammer | | | 839 million | | | 13 | |
• | SunTrust Bank, Lake Co. | | | Leesburg | | | Bradley L. White | | | 736 million | | | 11 | |
| | | | | | | | | | | | | | | |
| North Florida Region | | | Jacksonville | | | John R. Schmitt | | $ | 3.4 billion | | | 58 | |
• | SunTrust Bank, North Florida | | | Jacksonville | | | John R. Schmitt | | | 1.0 billion | | | 15 | |
• | SunTrust Bank, North Central Florida | | | Ocala | | | William H. Evans | | | 719 million | | | 12 | |
• | SunTrust Bank, Northwest Florida | | | Tallahassee | | | David B. Ramsay | | | 696 million | | | 14 | |
• | SunTrust Bank, Pensacola | | | Pensacola | | | Henry E. Gonzales, Jr. | | | 474 million | | | 6 | |
• | SunTrust Bank, Gainesville | | | Gainesville | | | Dick D. Mahaffey, Jr. | | | 263 million | | | 6 | |
• | SunTrust Bank, Panama City | | | Panama City | | | Jan E. Shadburn | | | 194 million | | | 5 | |
banks | 96 | SunTrust 2002 Annual Report |
Geographic Area | | | Location | | | Key Executive(s) | | | Deposits | | | Branches | |
| | |
| | |
| | |
| | |
| |
| South Florida Region | | | Ft. Lauderdale | | | Thomas G. Kuntz | | $ | 7.3 billion | | | 91 | |
• | SunTrust Bank, South Florida | | | Ft. Lauderdale | | | Thomas G. Kuntz
Robert M. Strickland | | | 3.9 billion | | | 66 | |
| | | | | | | | | | | | | | |
• | SunTrust Bank, Miami | | | Miami | | | Thomas M. Cornish | | | 3.4 billion | | | 25 | |
| | | | | | | | | | | | | | |
| Southwest Florida Region | | | Sarasota | | | Ray L. Sandhagen | | $ | 3.9 billion | | | 61 | |
• | SunTrust Bank, Gulf Coast | | | Sarasota | | | Ray L. Sandhagen | | | 2.4 billion | | | 34 | |
• | SunTrust Bank, Fort Myers | | | Fort Myers | | | Bruce A. Schultz | | | 902 million | | | 15 | |
• | SunTrust Bank, Naples | | | Naples | | | Daniel G. Waetjen | | | 539 million | | | 12 | |
| | | | | | | | | | | | | | |
| Tampa Region | | | Tampa | | | Daniel W. Mahurin
James H. Kimbrough | | $ | 5.3 billion | | | 98 | |
• | SunTrust Bank, Tampa | | | Tampa | | | Daniel W. Mahurin | | | 1.9 billion | | | 30 | |
• | Sun Trust Bank,
North Pinellas Co./Clearwater | | |
Clearwater
| | | Kendel M. Jensen | | | 681 million | | | 15 | |
• | SunTrust Bank,
South Pinellas Co./St. Petersburg | | | St. Petersburg | | | Roy A. Binger | | | 617 million | | | 16 | |
• | SunTrust Bank, Nature Coast | | | Brooksville | | | James H. Kimbrough | | | 2.1 billion | | | 37 | |
| | | | | | | | | | | | | | |
Mid-Atlantic Group | | | Richmond | | | C.T. Hill | | $ | 17.6 billion | | | 385 | |
| Central Virginia Region | | | Richmond | | | A. Dale Cannady | | $ | 2.1 billion | | | 48 | |
• | SunTrust Bank, Central Virginia | | | Richmond | | | A. Dale Cannady | | | 2.1 billion | | | 48 | |
| | | | | | | | | | | | | | |
| Greater Washington Region | | | Washington, DC | | | Peter F. Nostrand | | $ | 9.5 billion | | | 170 | |
• | SunTrust Bank, Greater Washington | | | Washington, DC | | | Peter F. Nostrand | | | 9.5 billion | | | 170 | |
| | | | | | | | | | | | | | |
| Hampton Roads Region | | | Norfolk | | | William K. Butler II | | $ | 1.9 billion | | | 46 | |
• | SunTrust Bank, Hampton Roads | | | Norfolk | | | William K. Butler II | | | 1.0 billion | | | 25 | |
• | SunTrust Bank, Newport News | | | Newport News | | | Jerome F. Clark | | | 472 million | | | 11 | |
• | SunTrust Bank, Williamsburg | | | Williamsburg | | | Bernard H. Ngo | | | 413 million | | | 10 | |
| | | | | | | | | | | | | | |
| Maryland Region | | | Baltimore | | | Donald P. Hutchinson | | $ | 1.9 billion | | | 59 | |
• | SunTrust Bank, Maryland | | | Baltimore | | | Donald P. Hutchinson | | | 1.9 billion | | | 59 | |
| | | | | | | | | | | | | | |
| Western Virginia Region | | | Roanoke | | | Robert C. Lawson, Jr. | | $ | 2.2 billion | | | 62 | |
• | SunTrust Bank, Roanoke | | | Roanoke | | | Robert C. Lawson, Jr. | | | 543 million | | | 15 | |
• | SunTrust Bank, Charlottesville | | | Charlottesville | | | Steven C. Krohn | | | 373 million | | | 10 | |
• | SunTrust Bank, Harrisonburg | | | Harrisonburg | | | Gerald A. Hopkins | | | 282 million | | | 11 | |
• | SunTrust Bank, Lynchburg | | | Lynchburg | | | Stuart C. Fauber | | | 264 million | | | 8 | |
• | SunTrust Bank, Martinsville | | | Martinsville | | | James R. Austin | | | 437 million | | | 8 | |
• | SunTrust Bank, Radford | | | Radford | | | David W. DeHart | | | 91 million | | | 4 | |
• | SunTrust Bank, Staunton | | | Staunton | | | Robert G. Knowles | | | 177 million | | | 6 | |
SunTrust 2002 Annual Report | 97 | banks |
key subsidiaries
| Chief Executive |
|
|
Asset Management Advisors, L.L.C. | Henry A. Perry |
| Provides comprehensive financial, investment advisory and family wealth management services. | |
| | |
Premium Assignment Corporation | Peter Kugelmann |
| Provides insurance premium financing primarily to small businesses. | |
| | |
SunTrust BankCard, N.A. | Ronald W. Eastburn |
Offers credit card services to commercial and corporate clients. | |
| |
SunTrust Capital Markets, Inc. | R. Charles Shufeldt |
| SunTrust’s investment banking subsidiary. Includes SunTrust Robinson Humphrey Capital Markets, which offers securities underwriting and investment advisory capabilities to corporate, institutional and public entities, as well as Alexander Key Investments, a full-service brokerage serving the needs of wealthy investors. | |
| |
SunTrust Community Development Corporation | William H. Pridgen |
| Manages the Company’s investments in affordable housing. | |
| | |
SunTrust Delaware Trust Company | Barbara B. O’Donnell |
| A limited purpose trust company providing specialized investment-related services for high-net-worth clients. | |
| | |
SunTrust Insurance Company | Michael A. Kinsey |
| Re-insures credit life as well as accident and health insurance policies. | |
| |
SunTrust Leasing Corporation | Daniel E. McKew |
| Provides equipment-related lease financing to businesses. | |
| |
SunTrust Mortgage, Inc. | Sterling Edmunds, Jr. |
| One of the nation’s largest bank-owned mortgage companies. Originates, purchases, sells and services mortgage loans. | |
| |
SunTrust Securities, Inc. | Peter Bielan |
| Provides full-service brokerage and investment advisory services primarily to retail investors. | |
| |
Trusco Capital Management, Inc. | Douglas S. Phillips |
| An SEC-registered investment advisor that manages assets for institutional clients. Includes the STI Classic Funds, SunTrust’s mutual fund family. | |
key subsidiaries | 98 | SunTrust 2002 Annual Report |
general information
Corporate Headquarters
SunTrust Banks, Inc.
303 Peachtree Street, NE
Atlanta, GA 30308
404/588-7711
Corporate Mailing Address
SunTrust Banks, Inc.
P.O. Box 4418
Center 645
Atlanta, GA 30302-4418
Notice Of Annual Meeting
The Annual Meeting of Shareholders will be held on Tuesday, April 15, 2003 at 9:30 a.m. in Suite 225 of the Garden Offices at 303 Peachtree Center Avenue in Atlanta.
Stock Trading
SunTrust Banks, Inc. common stock is traded on the New York Stock Exchange under the symbol “STI.”
Quarterly Common Stock Prices And Dividends
The quarterly high, low and close prices of SunTrust’s common stock for each quarter of 2002 and 2001 and the dividends paid per share are shown below.
Quarter Ended | | Market Price | | Dividends
Paid | |
|
| | |
| High | | Low | | Close | | |
| |
| |
| |
| |
| |
2002 | | | | | | | | | | | | | |
December 31 | | | 63.25 | | | 51.48 | | | 56.92 | | $ | 0.43 | |
September 30 | | | 69.12 | | | 55.90 | | | 61.48 | | | 0.43 | |
June 30 | | | 70.20 | | | 65.10 | | | 67.72 | | | 0.43 | |
March 31 | | | 68.47 | | | 58.32 | | | 66.73 | | | 0.43 | |
| | |
|
| |
|
| |
|
| |
|
| |
| 2001 | | | | | | | | | | | | | |
| December 31 | | | 67.93 | | | 58.10 | | | 62.70 | | $ | 0.40 | |
| September 30 | | | 72.35 | | | 60.10 | | | 66.60 | | | 0.40 | |
| June 30 | | | 66.38 | | | 59.25 | | | 64.78 | | | 0.40 | |
| March 31 | | | 68.07 | | | 57.29 | | | 64.80 | | | 0.40 | |
| | |
|
| |
|
| |
|
| |
|
| |
Debt Ratings
Ratings as of December 31, 2002.
| | Moody’s
Investors | | Standard &
Poor’s | | Fitch/IBCA | |
| |
| |
| |
| |
Corporate Ratings | | | | | | | | | | |
| | Long Term Debt Ratings | | | | | | | | | | |
| | Senior Debt | | | Aa3 | | | A+ | | | AA- | |
| | Subordinated Debt | | | A1 | | | A | | | A+ | |
| | | |
|
| |
|
| |
|
| |
| | Short Term | | | | | | | | | | |
| | Commercial Paper | | | P-1 | | | A-1 | | | F1+ | |
| | | |
|
| |
|
| |
|
| |
Bank Ratings | | | | | | | | | | |
| | Long Term Debt Ratings | | | | | | | | | | |
| | Senior Debt | | | Aa2 | | | AA- | | | AA- | |
| | Subordinated Debt | | | Aa3 | | | A+ | | | — | |
| | | |
|
| |
|
| |
|
| |
| | Short Term | | | P-1 | | | A-1+ | | | F1+ | |
| | | |
|
| |
|
| |
|
| |
| | | | | | | | | | | | |
Number of Shareholders
As of December 31, 2002 36,443 Registered Shareholders (Shareholders of Record) Approximately 70,000 Street Name Shareholders Approximately 27,500 Employee Shareholders There could be overlapping shareholders among the three shareholder groups.
Shareholder Services
Shareholders who wish to change the name, address or ownership of stock, to report lost certificates or to consolidate accounts should contact the Transfer Agent:
| SunTrust Bank |
| P.O. Box 4625 |
| Atlanta, GA 30302-4625 |
| 404/588-7815 |
| 800/568-3476 |
Dividend Reinvestment
SunTrust offers a Dividend Reinvestment Plan that provides automatic reinvestment of dividends in additional shares of SunTrust common stock. For more information, contact:
| Stock Transfer Department |
| SunTrust Bank |
| P.O. Box 4625 |
| Atlanta, GA 30302-4625 |
| 404/588-7822 |
Financial Information
To obtain information on SunTrust, contact:
| Gary Peacock, Jr. |
| Director of Investor Relations and Corporate Communications |
| 404/658-4879 |
For information online, visit www.suntrust.com:
| • | 2002 Annual Report (including select information translated in Spanish) |
| • | Quarterly earnings releases |
| • | Press releases |
Website Access to United States Securities and Exchange Commission Filings
All reports filed electronically by SunTrust Banks, Inc. with the United States Securities and Exchange Commission, including the annual report on Form 10-K, quarterly reports on Form 10-Q, and current event reports on Form 8-K and amendments to those reports filed or furnished pursuant to Section 13(a) or 15(d) of the Exchange Act are accessible as soon as reasonably practicable at no cost in the Investor Relations section of the corporate website at www.suntrust.com.
SunTrust 2002 Annual Report | 99 | general information |
[GRAPHICS APPEARS HERE]
SunTrust Banks, Inc.
303 Peachtree Street
Atlanta, GA 30308