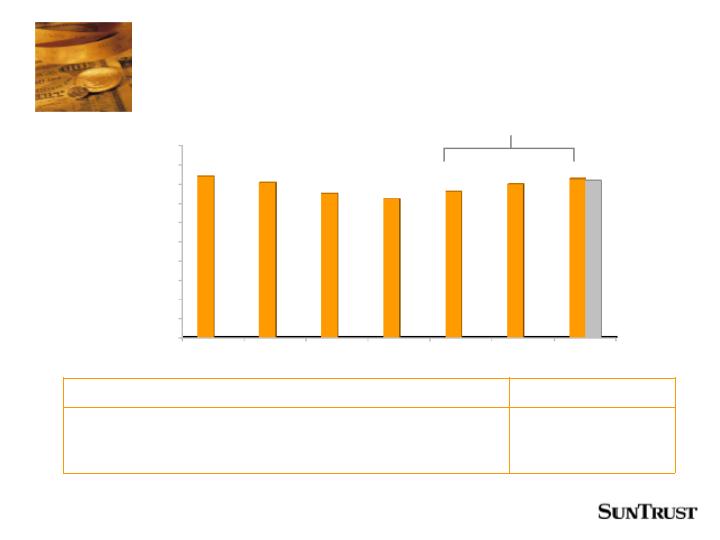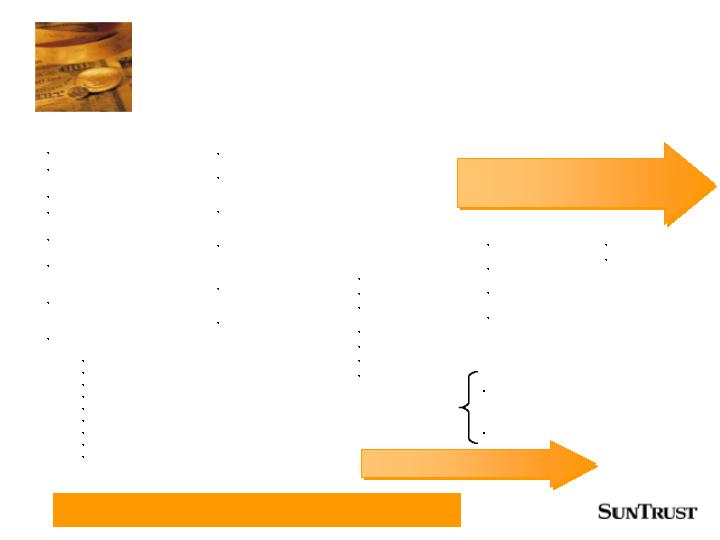
INTEGRATION TIMELINE SUMMARY
To date, we’ve successfully completed more than 44 % of the merger
integration milestones (812 of 1,865 total integration milestones).
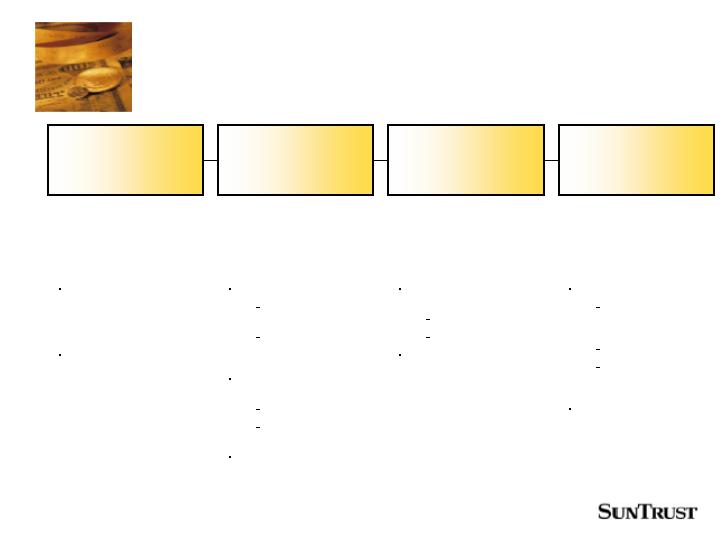
Regulatory Approval (8/04-9/04)
Change control process installed
(9/04)
Shareholder Approval (9/15/04)
Customer and employee impacts
cataloged
Leadership positions identified
8/31/04, 9/22/04
Added five new banking regions
Memphis, South Carolina, Triad,
Triangle, Mecklenburg) 7/19/04
NCF Consumer and Small
Business checking product rolled
out to SunTrust legacy footprint
Established and communicated
management positions:
Group LOBs
Region Presidents
Region LOBs
Market Presidents
Group Functional support
Commercial Team leads
Region Credit and Marketing
Operations unit managers
All revenue producing
relationships
Legal Closing
10/1/04
Procurement rollout 10/6/04
(anticipate $10MM in savings
by 2006)
Divestiture of deposits of $65
million and 3 branches
12/10/04
Migration to common pricing
begins (anticipate $25MM
incremental revenue by
2006)
Mitigation plans developed
for all customer and
employee impacts
Network connectivity and
infrastructure
Sequenced
Systems
Conversions
Begins
Completed Systems
Conversions:
Fixed Assets
Treasury
PCS Brokerage &
Insurance
Payroll/Benefits
Accounts Payable
Officer Knowledge
General Ledger
Non-Systems
Conversion
Begins
NCF ATM/Debit
Card Release
Buddy Bankers
Onsite
Store signage
installation
Complete Core
conversion
Trust Conversion
Bank Operations
Standard
Operational
Authorities
implementation
Branch consolidations
begin 4/22/05
Data center consolidation
3Q04
4Q04
1Q05
2Q05
3Q05
Ongoing Employee
Communications
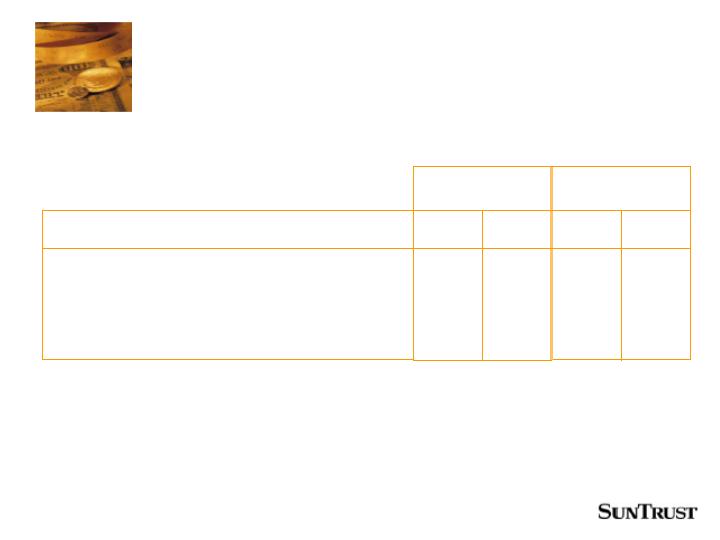
FOCUSED ON RETAINING CUSTOMERS
Three-phase customer analysis
identifying effects of integration
on the customer so mitigation
activities can be planned to
promote retention and client
satisfaction
Phase I complete – over
one million households
analyzed with 80%
showing minimal or no
impact.
Phases II and III include
additional analysis, action
plan development and
special analysis in support
of conversion weekend
Comprehensive
communications program
designed to inform customers
of merger-related events or
changes.
Recent customer mailings:
Over one million
welcome letters
Securities letters and
other early conversion
communications
Upcoming major mailings
include:
Branch consolidations
Product/pricing letters
in March
Customer remediation plans
include phone follow-up,
employee communication,
training, and scripting.
Retention teams in all LOBs
are developing programs based
on results of the customers
profile analysis.
A Service Quality Excellence
Scorecard is produced monthly
that monitors 49 key service
measures across all lines of
business and major corporate
functions.
Activities scheduled in
planned waves
Special promotions
Sales opportunities
Client retention tracking
underway; will continue for
12-month period
Examples of key measures:
Telephone banking
average speed of
answer (ASA)
ATM availability
Mortgage client
satisfaction survey
scores
Action plans are in place to
ensure service quality is
maintained in all critical
areas
Customer Impact
Assessment
Communications
Retention
Implementation
Measurement and
Monitoring

BUILDING WITH PROVEN TALENT
Key Accomplishments
Key NCF Managers named in combined organization:
Bill Reed, former CEO of NCF, named vice chairman and head of Geographic
Banking(Florida, Central, Mid Atlantic, and the Carolinas) and Sales Administration.
Richard Furr, former chief operating officer at NCF, was named chairman, president and
CEO of the Carolinas Group.
Scott Edwards, former NCF chief administrative officer, was named Carolinas Group
credit officer
David Popwell, former executive vice president for Financial Enterprises at NCF, was
named chairman and CEO of the Memphis Region and Executive for specialty
businesses.
Integrated NCF organizational structure, major business lines and support functions into the
overall SunTrust organization.
Placed more than 160 NCF managers within in a geography, a business line or a support area
Mapped all NCF revenue producers to SunTrust position (over 3,200 positions)
Guaranteed positions to all branch personnel.
Created an Employee Experience team comprised of NCF and STI employees across lines of
business, functions and geographies focused on employee communications, retention, morale,
and merger readiness.

TRANSLATING POTENTIAL INTO PERFORMANCE
Potential
Revenue and earnings momentum
Industry-leading credit quality
Strong LOB & sales results
Performance
High growth geographic footprint
Distinctive operating model
Sales and revenue focus
Investments for the future

APPENDIX
SunTrust presents a return on average assets and return on average realized equity which exclude realized and unrealized securities gains/losses and dividends from The Coca-
Cola Company. The foregoing numbers reflect primarily adjustments to remove the effects of the Company's securities portfolio which includes the ownership by the Company of
48.3 million shares of The Coca-Cola Company. The Company uses this information internally to gauge its actual performance in the industry. The Company believes that the
return on average assets less the net unrealized securities gains is more indicative of the Company's return on assets because it more accurately reflects the return on the assets
that are related to the Company's core businesses which are primarily customer relationship and customer transaction driven. The Company also believes that the return on
average realized equity is more indicative of the Company's return on equity because the excluded equity relates primarily to a long term holding of a specific security
Annualized
SunTrust presents selected financial data on an operating basis that excludes merger charges. The Company believes the exclusion of the merger charges, which represent
incremental costs to integrate NCF’s operations, is more reflective of normalized operations
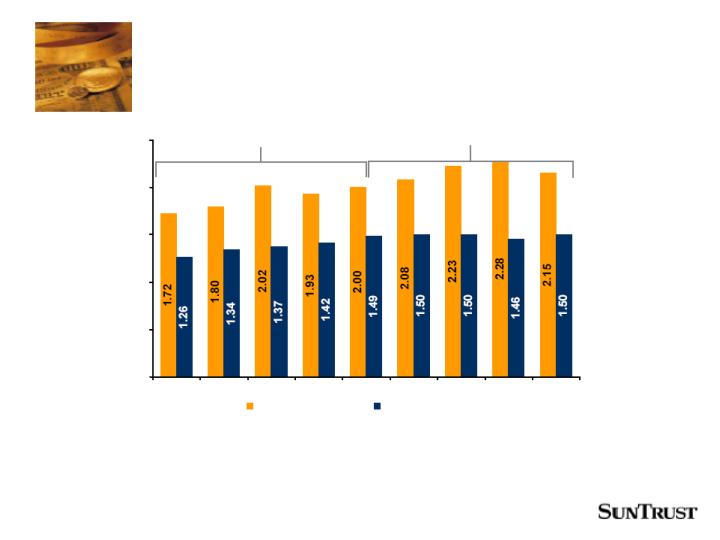
EARNINGS MOMENTUM
(442) b.p.
(348) b.p.
16.02
16.96
12.54
Return on Avg.
Realized Equity(1)
(275) b.p.
(247) b.p.
(322)b.p.
(294) b.p.
14.40
14.68
11.46
Return on Avg. Equity
flat
14 b.p.
1.04
1.18
1.18
Return on Avg. Assets less net
realized securities gains(1)
5 b.p.
11 b.p.
1 b.p.
7 b.p.
1.09
1.15
1.16
Return on Avg. Assets
3%(2)
8%
(12)%(2)
4%
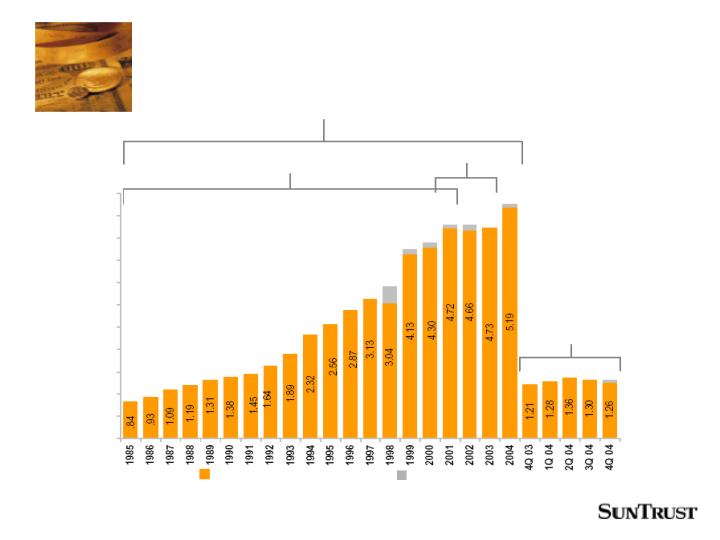
1.21
1.30
1.26
Earnings per Share
114%(2)
38%
94%(2)
33%
$342.5
$368.8
$455.7
Net Income
4Q04 : 3Q04
Sequential
Change(3)
4Q04 : 4Q03
Change(3)
4Q04 : 3Q04
Sequential
Change
4Q04 : 4Q03
Change
4Q 2003
3Q 2004
4Q 2004
($ in millions except per share data)
(1)
(3)
(2)

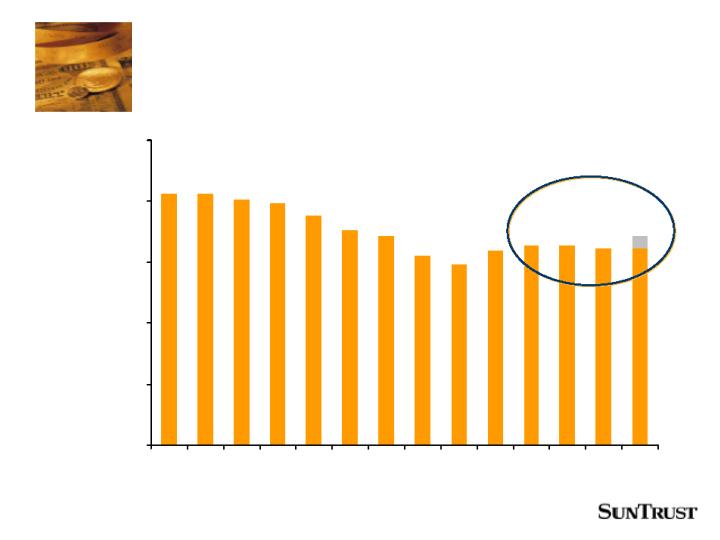
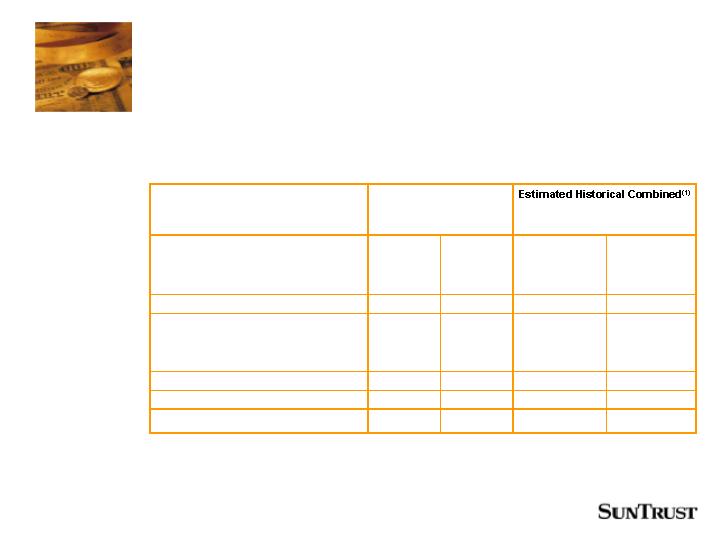
FEE INCOME GROWTH
Estimated Historical
Combined(1)
4%
10%
78%
30%
273.6
298.3
356.8
Deposits and Other Fees
79%
12%
161%
32%
120.1
113.3
159.9
Broker Dealer Revenue
(12)%
10%
29%
24%
$129.6
$149.7
$160.5
Trust and Investment Mgmt.
4Q04:3Q04
(Annualized)
4Q2004:
4Q2003
4Q04:3Q04
(Annualized)
4Q2004:
4Q2003
4Q 2003
3Q 2004
4Q 2004
($ in millions)
Fee income growth momentum continuing
(1) See appendix for reconciliations
LOAN GROWTH
Driven by targeted sales initiatives
($ in millions)
8%
8%
78%
26/30%
79,370.1
83,753.2
100,137.5
Total Loans
28%
32%
135%
63%
6,740.7
8,238.6
11,016.4
Real Estate Equity
(3)%
4%
90%
28%
12,035.0
12,549.7
15,368.5
Consumer
(10)%
3%
8,435.0
8,882.9
8,661.6
Indirect
332%
86%
3,600.0
3,666.8
6,706.9
Direct
10%
24%
34%
31%
17,117.4
20,722.7
22,461.0
Mortgages
11%
7%
125%
36%
13,650.9
14,169.7
18,601.8
RE Comm. &Const
366%
108%
4,364.4
4,727.8
9,054.6
RE Construction
5%
3%
9,286.5
9,441.9
9,547.2
RE Commercial
5%
(3)%
66%
10/19%
$29,289.1
$27,630.5
$32,223.1
Commercial
4Q04:3Q04
(Annualized)
4Q2004:
4Q2003
4Q04:3Q04
(Annualized)
4Q2004:
4Q2003
4Q 2003
3Q 2004
4Q 2004
(1)
See appendix for reconciliations
(2)
The addition of direct and indirect
(3)
Higher growth rate adjusted for consolidation of Three Pillars
(3)
(2)
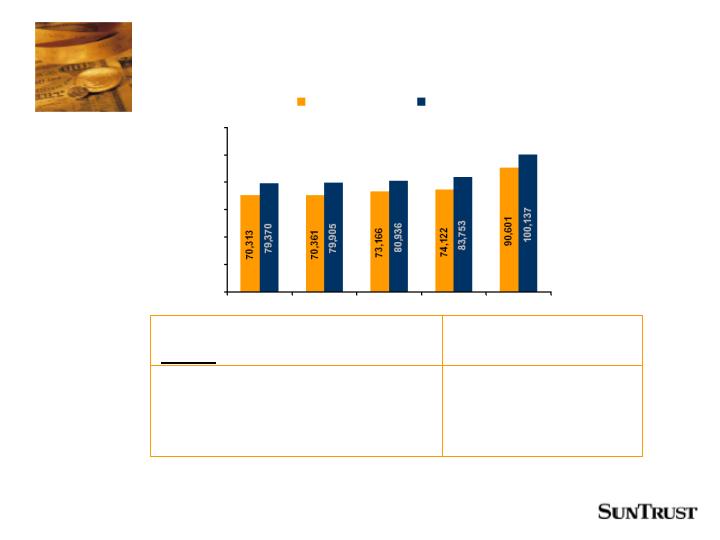
CUSTOMER DEPOSIT GROWTH
($ in millions)
13%
14%
82%
33%
36,937.3
40,914.4
49,261.7
Total low cost
deposits(2)
12%
8%
89%
29%
70,312.6
74,121.8
90,601.4
TOTAL(1)
21%
4%
225%
52%
11,101.5
10,773.0
16,832.7
CDs
(42)%
2%
39%
30%
6,248.9
7,424.7
8,139.3
SAV
5%
1%
37%
10%
22,273.8
22,434.4
24,507.0
MMA
42%
20%
121%
40%
12,102.3
12,999.5
16,940.7
NOW
16%
14%
72%
30%
$18,586.1
$20,490.2
$24,181.7
DDA
4Q04:3Q04
(Annualized)
4Q2004:
4Q2003
4Q04:3Q04
(Annualized)
4Q2004:
4Q2003
4Q 2003
3Q 2004
4Q 2004
Estimated Historical Combined(3)
(1)
Average quarterly Consumer and Commercial Deposits (excludes Broker & Foreign Deposits)
(2)
Total of DDA, NOW, Savings
(3)
See appendix for reconciliations
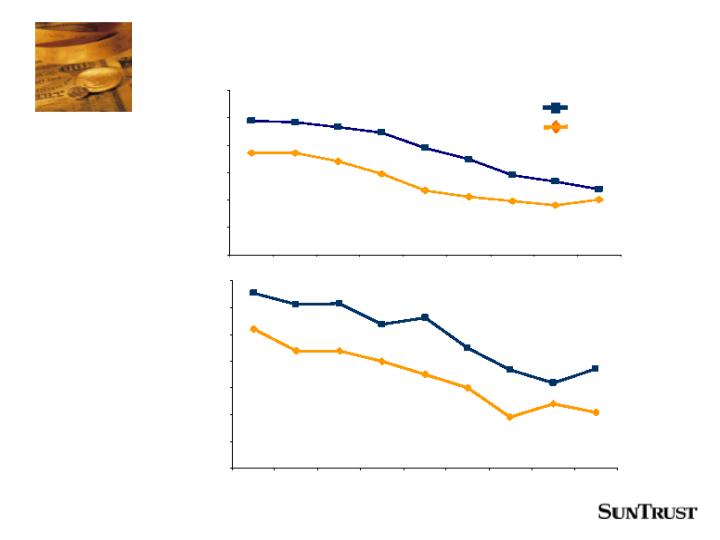
STRONG CREDIT QUALITY
3.4
4.0
6.0
4.4
4.9
Allowance to Charge-
offs (Years Coverage)
268.1%
309.7%
299.7%
315.7%
281.3%
Allowance to Non-
performing loans
$941,922
$936,972
$902,243
$892,974
$1,050,024
Allowance for loan
losses
0.47%
0.42%
0.39%
0.36%
0.40%
NPAs to
Loans/OREO/Other repo
$378,097
$331,912
$324,420
$304,216
$410,658
NPAs
0.35%
0.30%
0.19%
0.24%
0.21%
Net Charge-offs to Avg.
Loans
$69,787
$58,787
$37,556
$51,043
$53,893
Net Charge-offs
4Q2003
1Q2004
2Q2004
3Q2004
4Q2004
($ in thousands)
Average Diluted Shares
Outstanding
Fee Income excluding securities
gains and losses
Fee Income excluding securities
RECONCILIATIONS APPENDIX
1,879,268
1,539,580
1,516,779
1,454,063
1,442,072
1,387,768
1,375,969
1,338,633
1,325,518
Core Revenue*
19,377
18,193
9,048
(4,927)
(19,501)
(31,098)
(31,238)
(42,039)
(39,547)
Securities losses/(gains)
1,859,891
1,521,387
1,507,731
1,458,990
1,461,573
1,418,866
1,407,207
1,380,672
1,365,065
Total Revenue
1,100,888
893,695
885,066
863,904
877,501
844,388
810,415
833,013
837,341
Net Interest Income-FTE
16,684
16,821
12,637
12,256
11,981
11,588
10,902
10,543
10,240
FTE adjustment
778,380
645,885
631,713
590,159
564,571
543,380
565,554
505,620
488,177
19,377
18,193
9,048
(4,927)
(19,501)
(31,098)
(31,238)
(42,039)
(39,547)
Securities losses/(gains)
759,003
627,692
622,665
595,086
584,072
574,478
596,792
547,659
527,724
Fee Income
1,084,204
876,874
872,429
851,648
865,520
832,800
799,513
822,470
827,101
Net Interest Income
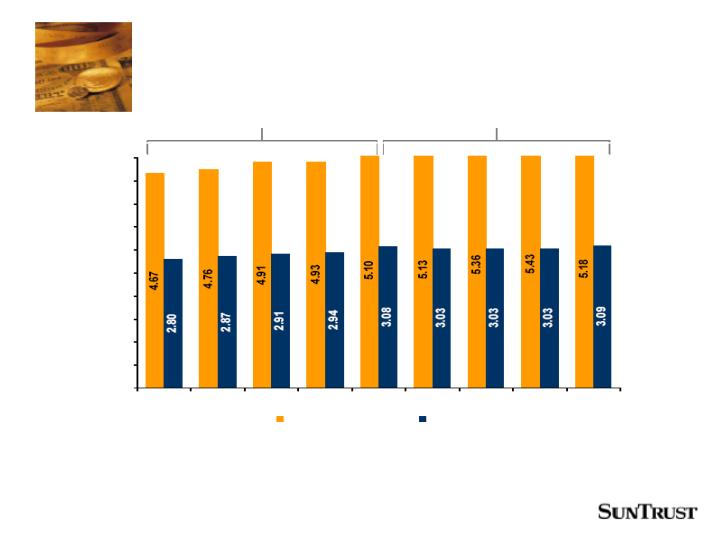
5.18
5.43
5.36
5.13
5.10
4.93
4.91
4.76
4.67
Core Revenue Per Share
362,661
283,502
283,116
283,523
282,537
281,567
280,287
281,330
283,595
1,879,268
1,539,580
1,516,779
1,454,063
1,442,072
1,387,768
1,375,969
1,338,633
1,325,518
Core Revenue*
1,100,888
893,695
885,066
863,904
877,501
844,388
810,415
833,013
837,341
Net Interest Income-FTE
$778,380
$645,885
$631,713
$590,159
$564,571
$543,380
$565,554
$505,620
$488,177
4Q 04
3Q 04
2Q 04
1Q 04
4Q 03
3Q 03
2Q 03
1Q 03
4Q 02
(Dollars and shares in thousands except per share amounts)
* Also known as total revenue excluding securities gains and losses
gains and losses

RECONCILIATIONS APPENDIX
* Also known as total revenue excluding securities gains and losses
6,389.7
5,544.4
5,347.5
5,192.2
4,915.4
4,923.0
4,619.2
Core Revenue*
6,389.7
5,544.4
5,347.5
5,192.2
4,915.4
4,923.0
4,619.2
Core Revenue*
41.7
(123.9)
(204.5)
(153.1)
(6.6)
109.1
(8.2)
Securities losses/(gains)
6,348.0
5,668.3
5,552.0
5,345.3
4,922.0
4,813.9
4,627.4
Total Revenue
58.4
45.0
39.5
40.8
39.9
42.5
44.4
FTE Adjustment
3,685.2
3,320.3
3,243.7
3,252.6
3,108.5
3,145.5
2,929.1
Net Interest Income
41.7
(123.9)
(204.5)
(153.1)
(6.6)
109.1
(8.2)
Securities losses/(gains)
$2,604.4
$2,303.0
$2,268.8
$2,051.9
$1,773.6
$1,625.9
$1,653.9
Fee Income
2004
2003
2002
2001
2000
1999
1998
(Dollars in millions)

RECONCILIATIONS APPENDIX
Quarter - to - Quarter Comparison | | | YTD Comparison | | |
| | 4th Quarter
2004 | | | 3rd Quarter
2004 | | | 2nd Quarter
2004 | | | 1st Quarter
2004 | | | 4th Quarter
2003 | | | | December 31 | | |
2004 | | | | 2003 |
NON-GAAP MEASURES | | | | | | | | | | | | | | | | | | | | | | | | | | | | | |
(Dollars in thousands) | | | | | | | | | | | | | | | | | | | | | | | | | | | | | |
| | | | | | | | | | | | | | | | | | | | | | | | | | | | | |
Net income | | $ | 455,729 | | | $ | 368,766 | | | $ | 386,571 | | | $ | 361,835 | | | $ | 342,507 | | | $ | 1,572,901 | | | $ | 1,332,297 | | |
Securities losses/(gains), net of tax | | | 12,595 | | | | 11,825 | | | | 5,881 | | | | (3,203 | ) | | | (12,676 | ) | | | 27,099 | | | | (80,519 | ) | |
Net income excluding securities gains and losses | | | 468,324 | | | | 380,591 | | | | 392,452 | | | | 358,632 | | | | 329,831 | | | | 1,600,000 | | | | 1,251,778 | | |
The Coca-Cola Company dividend, net of tax | | | (10,739 | ) | | | (10,740 | ) | | | (10,739 | ) | | | (10,740 | ) | | | (9,451 | ) | | | (42,957 | ) | | | (37,803 | ) | |
Net income excluding securities gains and losses and The Coca-Cola Company dividend | | $ | 457,585 | | | $ | 369,851 | | | $ | 381,713 | | | $ | 347,892 | | | $ | 320,380 | | | $ | 1,557,043 | | | $ | 1,213,975 | | |
| | | | | | | | | | | | | | | | | | | | | | | | | | | | | |
Total average assets | | $ | 156,570,092 | | | $ | 127,127,968 | | | $ | 127,287,458 | | | $ | 123,853,747 | | | $ | 124,756,099 | | | $ | 133,754,293 | | | $ | 122,325,361 | | |
Average net unrealized securities gains | | | (2,056,737 | ) | | | (2,054,978 | ) | | | (2,803,917 | ) | | | (2,580,304 | ) | | | (2,363,948 | ) | | | (2,372,246 | ) | | | (2,343,015 | ) | |
Average assets less net unrealized securities gains | | $ | 154,513,355 | | | $ | 125,072,990 | | | $ | 124,483,541 | | | $ | 121,273,443 | | | $ | 122,392,151 | | | $ | 131,382,047 | | | $ | 119,982,346 | | |
| | | | | | | | | | | | | | | | | | | | | | | | | | | | | |
Total average equity | | $ | 15,818,968 | | | $ | 9,992,905 | | | $ | 10,194,201 | | | $ | 9,840,282 | | | $ | 9,435,794 | | | $ | 11,469,482 | | | $ | 9,083,026 | | |
Average other comprehensive income | | | (1,304,553 | ) | | | (1,318,332 | ) | | | (1,804,833 | ) | | | (1,645,712 | ) | | | (1,503,355 | ) | | | (1,517,227 | ) | | | (1,486,125 | ) | |
Total average realized equity | | $ | 14,514,415 | | | $ | 8,674,573 | | | $ | 8,389,368 | | | $ | 8,194,570 | | | $ | 7,932,439 | | | $ | 9,952,255 | | | $ | 7,596,901 | | |
| | | | | | | | | | | | | | | | | | | | | | | | | | | | | |
Return on average total assets | | | 1.16 | | % | | 1.15 | | % | | 1.22 | | % | | 1.18 | | % | | 1.09 | | % | | 1.18 | | % | | 1.09 | | % |
Impact of excluding net realized and unrealized securities gains/losses and The Coca-Cola Company dividend | | | 0.02 | | | | 0.03 | | | | 0.01 | | | | (0.03 | ) | | | (0.05 | ) | | | 0.01 | | | | (0.08 | ) | |
| | | | | | | | | | | | | | | | | | | | | | | | | | | | | |
Return on average total assets less net realized and unrealized securities gains/losses and The Coca-Cola Company dividend1 | | | 1.18 | | % | | 1.18 | | % | | 1.23 | | % | | 1.15 | | % | | 1.04 | | % | | 1.19 | | % | | 1.01 | | % |
| | | | | | | | | | | | | | | | | | | | | | | | | | | | | |
Return on average total shareholders’ equity | | | 11.46 | | % | | 14.68 | | % | | 15.25 | | % | | 14.79 | | % | | 14.40 | | % | | 13.71 | | % | | 14.67 | | % |
Impact of excluding net unrealized securities gains | | | 1.08 | | | | 2.28 | | | | 3.05 | | | | 2.28 | | | | 1.62 | | | | 1.94 | | | | 1.31 | | |
Return on average realized shareholders’ equity2 | | | 12.54 | | % | | 16.96 | | % | | 18.30 | | % | | 17.07 | | % | | 16.02 | | % | | 15.65 | | % | | 15.98 | | % |
Net interest income | | $ | 1,084,204 | | | $ | 876,874 | | | $ | 872,429 | | | $ | 851,648 | | | $ | 865,520 | | | $ | 3,685,155 | | | $ | 3,320,303 | | |
FTE adjustment | | | 16,684 | | | | 16,821 | | | | 12,637 | | | | 12,256 | | | | 11,981 | | | | 58,398 | | | | 45,014 | | |
Net interest income - FTE | | | 1,100,888 | | | | 893,695 | | | | 885,066 | | | | 863,904 | | | | 877,501 | | | | 3,743,553 | | | | 3,365,317 | | |
Noninterest income | | | 759,003 | | | | 627,692 | | | | 622,665 | | | | 595,086 | | | | 584,072 | | | | 2,604,446 | | | | 2,303,001 | | |
Total revenue | | | 1,859,891 | | | | 1,521,387 | | | | 1,507,731 | | | | 1,458,990 | | | | 1,461,573 | | | | 6,347,999 | | | | 5,668,318 | | |
Securities losses/(gains) | | | 19,377 | | | | 18,193 | | | | 9,048 | | | | (4,927 | ) | | | (19,501 | ) | | | 41,691 | | | | (123,876 | ) | |
Total revenue excluding securities gains and losses | | $ | 1,879,268 | | | $ | 1,539,580 | | | $ | 1,516,779 | | | $ | 1,454,063 | | | $ | 1,442,072 | | | $ | 6,389,690 | | | $ | 5,544,442 | | |
1 | Computed by dividing annualized net income, excluding securities gains/losses and The Coca-Cola Company dividend, by average assets less net unrealized securities gains. |
2 | Computed by dividing annualized net income, excluding securities gains/losses and The Coca-Cola Company dividend, by average realized shareholders’ equity. |

RECONCILIATIONS APPENDIX
| | 4th Quarter
2004 | | | | YTD
December 31
2004 | | |
SELECTED NON-GAAP OPERATING MEASURES3 | | | | | | | | | | | | |
(Dollars in thousands) | | | | | | | | | | | | |
| | | | | | | | | | | | |
Net income | | | $ | 455,729 | | | | | $ | 1,572,901 | | |
Merger expense, net of tax | | | | 18,461 | | | | | | 18,461 | | |
Operating net income | | | | 474,190 | | | | | | 1,591,362 | | |
Securities losses/(gains), net of tax | | | | 12,595 | | | | | | 27,099 | | |
The Coca-Cola Company dividend, net of tax | | | | (10,739 | ) | | | | | (42,957 | ) | |
Operating net income excluding securities gains/ | | | | | | | | | | | | |
losses and The Coca-Cola Company dividend | | | $ | 476,046 | | | | | $ | 1,575,504 | | |
| | | | | | | | | | | | |
Noninterest expense | | | $ | 1,148,992 | | | | | $ | 3,897,038 | | |
Merger expense | | | | (28,401 | ) | | | | | (28,401 | ) | |
Noninterest expense excluding merger expense | | | $ | 1,120,591 | | | | | $ | 3,868,637 | | |
| | | | | | | | | | | | |
Return on average total assets | | | | 1.16 | | % | | | | 1.18 | | % |
Impact of excluding merger expense | | | | 0.04 | | | | | | 0.01 | | |
Operating return on average total assets4 | | | | 1.20 | | % | | | | 1.19 | | % |
| | | | | | | | | | | | |
Return on average total shareholders’ equity | | | | 11.46 | | % | | | | 13.71 | | % |
Impact of excluding merger expense | | | | 0.47 | | | | | | 0.16 | | |
Operating return on average total shareholders’ equity5 | | | | 11.93 | | % | | | | 13.87 | | % |
| | | | | | | | | | | | |
Efficiency ratio | | | | 61.78 | | % | | | | 61.39 | | % |
Impact of excluding merger expense | | | | (1.53 | ) | | | | | (0.45 | ) | |
Operating efficiency ratio | | | | 60.25 | | % | | | | 60.94 | | % |
| | | | | | | | | | | | |
Diluted earnings per share | | | $ | 1.26 | | | | | $ | 5.19 | | |
Impact of excluding merger expense | | | | 0.05 | | | | | | 0.06 | | |
Operating diluted earnings per share | | | $ | 1.31 | | | | | $ | 5.25 | | |
| 3 | SunTrust presents selected financial data on an operating basis that excludes merger charges. The Company believes the exclusion of the merger charges, which represent incremental costs to integrate NCF's operations, is more reflective of normalized operations. |
| 4 | Computed by dividing annualized operating net income by average total assets. |
| 5 | Computed by dividing annualized operating net income by average total shareholders' equity. |
RECONCILIATIONS APPENDIX
Quarter - to - Quarter Comparison |
| | | 4th Quarter
2004 | | | | 4th Quarter
2003 | | | Change
% | |
| NON-GAAP DISCLOSURES FOR IMPACTS OF THREE | | | | | | | | | | | | |
| PILLARS1 | | | | | | | | | | | | |
| (Dollars in millions) | | | | | | | | | | | | |
| Average loans - reported | | $ | 100,137 | | | | $ | 79,370 | | | 26.2 | |
| Impact of Three Pillars | | | - | | | | | (2,243 | ) | | | |
| Average loans excluding Three Pillars | | $ | 100,137 | | | | $ | 77,127 | | | 29.8 | |
| Average earning assets - reported | | $ | 136,450 | | | | $ | 112,730 | | | 21.0 | |
| Impact of Three Pillars | | | - | | | | | (2,699 | ) | | | |
| Average earning assets excluding Three Pillars | | $ | 136,450 | | | | $ | 110,031 | | | 24.0 | |
| Average commercial loans - reported | | $ | 32,223 | | | | $ | 29,289 | | | 10.0 | |
| Impact of Three Pillars | | | - | | | | | (2,243 | ) | | | |
| Average commercial loans excluding Three Pillars | | $ | 32,223 | | | | $ | 27,046 | | | 19.1 | |
| Average commercial loan yield - reported | | | 4.45 | | % | | | 3.58 | | % | 24.3 | |
| Impact of Three Pillars | | | - | | | | | 0.11 | | | | |
| Average commercial loan yield excluding Three Pillars | | | 4.45 | | % | | | 3.69 | | % | 20.6 | |
| Net interest margin - reported | | | 3.21 | | % | | | 3.09 | | % | 3.9 | |
| Impact of Three Pillars | | | - | | | | | 0.06 | | | | |
| Net interest margin excluding Three Pillars | | | 3.21 | | % | | | 3.15 | | % | 1.9 | |
Quarter - to - Quarter Comparison |
| | 4th Quarter
2004 | | 3rd Quarter
2004 | | Change %2 | | | 4th Quarter
2004 | | | 4th Quarter
2004 | | Change % |
REVENUE GROWTH RATE | | | | | | | | | | | | | | | | |
(Dollars in thousands) | | | | | | | | | | | | | | | | |
Total revenue excluding securities gains and losses | | $ | 1,879,268 | | $ | 1,539,580 | | 22.1 | | $ | 1,879,268 | | $ | 1,442,072 | | 30.3 |
AVERAGE LOW COST CONSUMER AND COMMERCIAL DEPOSIT RECONCILEMENT | | | | | | | | | | | | | |
(Dollars in thousands) | | | | | | | | | | | | | | | | |
Demand deposits | | $ | 24,181,729 | | $ | 20,490,191 | | 18.0 | | $ | 24,181,729 | | $ | 18,586,159 | | 30.1 |
NOW accounts | | | 16,940,751 | | | 12,999,444 | | 30.3 | | | 16,940,751 | | | 12,102,292 | | 40.0 |
Savings | | | 8,139,263 | | | 7,424,698 | | 9.6 | | | 8,139,263 | | | 6,248,917 | | 30.3 |
Total average low cost consumer and commercial deposits | | $ | 49,261,743 | | $ | 40,914,333 | | 20.4 | | $ | 49,261,743 | | $ | 36,937,368 | | 33.4 |
| 1 | Under the provisions of FASB Interpretation No. 46, SunTrust consolidated its commercial paper conduit, Three Pillars, effective July 1, 2003.
As of March 1, 2004, Three Pillars was restructured and deconsolidated. Adjustments were made to reported figures for comparability purposes. |
| 2 | Multiply by 4 to calculate sequential annualized growth or reductions discussed in the earnings call. |
RECONCILIATIONS APPENDIX
| | Quarter - to - Quarter Comparison | | Quarter - to - Quarter Comparison | |
| | 4th Quarter
2004 | | 3rd Quarter
2004 | | Increase/(Decrease) | | 4th Quarter
2004 | | 4th Quarter
2003 | | Increase/(Decrease) | |
| | | | Amount | | % | | | Amount | | % | |
| | | | | | | | | | | | | | | | | | | | | | | |
STATEMENTS OF INCOME (Dollars in thousands) | | | | | | | | | | | | | | | | | | | | | | | |
| | | | | | | | | | | | | | | | | | | | | | | |
NET INTEREST INCOME | | $ | 1,084,204 | | $ | 1,071,689 | | $ | 12,515 | | 1.2 | %4 | $ | 1,084,204 | | $ | 1,060,948 | | $ | 23,256 | | 2.2 | |
| | | | | | | | | | | | | | | | | | | | | | | |
Provision for loan losses | | | 37,099 | | | 60,818 | | | (23,719) | | (39.0 | ) | | 37,099 | | | 82,668 | | | (45,569) | | (55.1 | ) |
NET INTEREST INCOME AFTER PROVISION FOR LOAN LOSSES | | | 1,047,105 | | | 1,010,871 | | | 36,234 | | 3.6 | | | 1,047,105 | | | 978,280 | | | 68,825 | | 7.0 | |
| | | | | | | | | | | | | | | | | | | | | | | |
NONINTEREST INCOME | | | | | | | | | | | | | | | | | | | | | | | |
| | | | | | | | | | | | | | | | | | | | | | | |
Deposit and other fees1 | | | 356,777 | | | 353,573 | | | 3,204 | | 0.9 | | | 356,777 | | | 323,081 | | | 33,696 | | 10.4 | |
Trust and investment management income | | | 160,526 | | | 165,603 | | | (5,077) | | (3.1 | ) | | 160,526 | | | 145,856 | | | 14,670 | | 10.1 | |
Broker / dealer revenue2 | | | 158,888 | | | 132,650 | | | 26,238 | | 19.8 | | | 158,888 | | | 141,677 | | | 17,211 | | 12.1 | |
Other noninterest income | | | 102,189 | | | 106,550 | | | (4,361) | | (4.1 | ) | | 102,189 | | | 62,324 | | | 39,865 | | 64.0 | |
Noninterest income before securities (losses)/gains | | | 778,380 | | | 758,376 | | | 20,004 | | 2.6 | | | 778,380 | | | 672,938 | | | 105,442 | | 15.7 | |
Securities (losses)/gains | | | (19,377) | | | (16,565) | | | (2,812) | | (17.0 | ) | | (19,377) | | | 22,839 | | | (42,216) | | (184.8 | ) |
Total noninterest income | | | 759,003 | | | 741,811 | | | 17,192 | | 2.3 | | | 759,003 | | | 695,777 | | | 63,226 | | 9.1 | |
| | | | | | | | | | | | | | | | | | | | | | | |
NONINTEREST EXPENSE | | | | | | | | | | | | | | | | | | | | | | | |
| | | | | | | | | | | | | | | | | | | | | | | |
Personnel expense | | | 612,861 | | | 605,325 | | | 7,536 | | 1.2 | | | 612,861 | | | 591,575 | | | 21,286 | | 3.6 | |
Net occupancy expense | | | 78,218 | | | 79,875 | | | (1,657) | | (2.1 | ) | | 78,218 | | | 73,766 | | | 4,452 | | 6.0 | |
Outside processing and software | | | 81,368 | | | 75,449 | | | 5,919 | | 7.8 | | | 81,368 | | | 69,871 | | | 11,497 | | 16.5 | |
Equipment expense | | | 50,765 | | | 50,904 | | | (139) | | (0.3 | ) | | 50,765 | | | 52,926 | | | (2,161) | | (4.1 | ) |
Marketing and customer development | | | 34,389 | | | 34,975 | | | (586) | | (1.7 | ) | | 34,389 | | | 27,574 | | | 6,815 | | 24.7 | |
Other noninterest expense | | | 231,231 | | | 242,693 | | | (11,462) | | (4.7 | ) | | 231,231 | | | 200,602 | | | 30,629 | | 15.3 | |
Noninterest expense before amortization of intangible assets and merger expense | | | 1,088,832 | | | 1,089,221 | | | (389) | | (0.0 | ) | | 1,088,832 | | | 1,016,314 | | | 72,518 | | 7.1 | |
Amortization of intangible assets | | | 31,759 | | | 28,132 | | | 3,627 | | 12.9 | | | 31,759 | | | 30,716 | | | 1,043 | | 3.4 | |
Merger expense | | | 28,401 | | | - | | | 28,401 | | 100.0 | | | 28,401 | | | - | | | 28,401 | | 100.0 | |
Total noninterest expense | | | 1,148,992 | | | 1,117,353 | | | 31,639 | | 2.8 | | | 1,148,992 | | | 1,047,030 | | | 101,962 | | 9.7 | |
| | | | | | | | | | | | | | | | | | | | | | | |
INCOME BEFORE INCOME TAXES | | | 657,116 | | | 635,329 | | | 21,787 | | 3.4 | | | 657,116 | | | 627,027 | | | 30,089 | | 4.8 | |
Provision for income taxes | | | 201,387 | | | 198,926 | | | 2,461 | | 1.2 | | | 201,387 | | | 195,019 | | | 6,368 | | 3.3 | |
NET INCOME FROM CONTINUING OPERATIONS | | | 455,729 | | | 436,403 | | | 19,326 | | 4.4 | | | 455,729 | | | 432,008 | | | 23,721 | | 5.5 | |
Income from discontinued operations, net of tax | | | - | | | - | | | - | | - | | | - | | | 767 | | | (767) | | (100.0 | ) |
NET INCOME | | | 455,729 | | | 436,403 | | | 19,326 | | 4.4 | | | 455,729 | | | 432,775 | | | 22,954 | | 5.3 | |
Merger expense, net of tax | | | 18,461 | | | - | | | 18,461 | | 100.0 | | | 18,461 | | | - | | | 18,461 | | 100.0 | |
OPERATING NET INCOME | | $ | 474,190 | | $ | 436,403 | | $ | 37,787 | | 8.7 | % | $ | 474,190 | | $ | 432,775 | | $ | 41,415 | | 9.6 | |
| | | | | | | | | | | | | | | | | | | | | | | |
REVENUE (Dollars in thousands) | | | | | | | | | | | | | | | | | | | | | | | |
| | | | | | | | | | | | | | | | | | | | | | | |
Net interest income | | $ | 1,084,204 | | $ | 1,071,689 | | $ | 12,515 | | 1.2 | % | $ | 1,084,204 | | $ | 1,060,948 | | $ | 23,256 | | 2.2 | |
FTE adjustment3 | | | 16,684 | | | 19,063 | | | (2,379) | | (12.5 | ) | | 16,684 | | | 14,027 | | | 2,657 | | 18.9 | |
Net interest income – FTE | | | 1,100,888 | | | 1,090,752 | | | 10,136 | | 0.9 | | | 1,100,888 | | | 1,074,975 | | | 25,913 | | 2.4 | |
Noninterest income | | | 759,003 | | | 741,811 | | | 17,192 | | 2.3 | | | 759,003 | | | 695,777 | | | 63,226 | | 9.1 | |
Total revenue | | | 1,859,891 | | | 1,832,563 | | | 27,328 | | 1.5 | | | 1,859,891 | | | 1,770,752 | | | 89,139 | | 5.0 | |
Securities losses/(gains) | | | 19,377 | | | 16,565 | | | 2,812 | | 17.0 | | | 19,377 | | | (22,839) | | | 42,216 | | 184.8 | |
Total revenue excluding securities gains and losses | | $ | 1,879,268 | | $ | 1,849,128 | | $ | 30,140 | | 1.6 | % | $ | 1,879,268 | | $ | 1,747,913 | | $ | 131,355 | | 7.5 | |
1 | Includes service charges on deposit, cards and other charges and fees. |
| 2 | Includes retail investment services, investment banking income and trading account profits and commissions. |
| 3 | NCF's FTE adjustments where reduced $4,001 from the third quarter 2004 and $4,917 from the fourth quarter of 2003 to confirm to SunTrust's methodology. |
| 4 | Multiply by 4 to calculate sequential annualized growth or reductions |
RECONCILIATIONS APPENDIX
| | Quarter - to - Quarter Comparison | | Quarter - to - Quarter Comparison | |
| | 4th Quarter
2004 | | 3rd Quarter
2004 | | Increase/(Decrease) | | 4th Quarter
2004 | | 4th Quarter
2003 | | Increase/(Decrease) | |
| | | Amount | | % | | | | Amount | | % | |
SELECTED AVERAGE BALANCES (Dollars in millions) | | | | | | | | | | | | | | | | | | | | | | | |
Average Loans4 | | | | | | | | | | | | | | | | | | | | | | | |
Commercial5 | | $ | 32,343 | | $ | 31,977 | | $ | 366 | | 1.1 | %7 | $ | 32,343 | | $ | 33,344 | | $ | (1,001 | ) | (3.0) | % |
Real estate 1-4 family | | | 22,535 | | | 21,963 | | | 572 | | 2.6 | | | 22,535 | | | 18,213 | | | 4,322 | | 23.7 | |
Real estate commercial and construction | | | 18,660 | | | 18,155 | | | 505 | | 2.8 | | | 18,660 | | | 17,489 | | | 1,171 | | 6.7 | |
Real estate equity | | | 11,016 | | | 10,295 | | | 721 | | 7.0 | | | 11,016 | | | 8,350 | | | 2,666 | | 31.9 | |
Consumer6 | | | 15,390 | | | 15,520 | | | (130 | ) | (0.8 | ) | | 15,390 | | | 14,812 | | | 578 | | 3.9 | |
Credit cards | | | 193 | | | 175 | | | 18 | | 10.3 | | | 193 | | | 155 | | | 38 | | 24.5 | |
Total loans | | $ | 100,137 | | $ | 98,085 | | $ | 2,052 | | 2.1 | % | $ | 100,137 | | $ | 92,363 | | $ | 7,774 | | 8.4 | % |
| | | | | | | | | | | | | | | | | | | | | | | |
Average deposits | | | | | | | | | | | | | | | | | | | | | | | |
Noninterest bearing deposits | | $ | 24,182 | | $ | 23,239 | | $ | 943 | | 4.1 | % | $ | 24,182 | | $ | 21,141 | | $ | 3,041 | | 14.4 | % |
NOW accounts | | | 16,941 | | | 15,335 | | | 1,606 | | 10.5 | | | 16,941 | | | 14,139 | | | 2,802 | | 19.8 | |
Money market accounts | | | 24,507 | | | 24,211 | | | 296 | | 1.2 | | | 24,507 | | | 24,304 | | | 203 | | 0.8 | |
Savings | | | 8,139 | | | 9,099 | | | (960 | ) | (10.6 | ) | | 8,139 | | | 7,982 | | | 157 | | 2.0 | |
Consumer time | | | 12,084 | | | 11,882 | | | 202 | | 1.7 | | | 12,084 | | | 12,390 | | | (306 | ) | (2.5 | ) |
Other time | | | 4,748 | | | 4,112 | | | 636 | | 15.5 | | | 4,748 | | | 3,833 | | | 915 | | 23.9 | |
Total consumer and commercial deposits | | | 90,601 | | | 87,878 | | | 2,723 | | 3.1 | | | 90,601 | | | 83,789 | | | 6,812 | | 8.1 | |
Brokered and foreign deposits | | | 10,671 | | | 11,496 | | | (825 | ) | (7.2 | ) | | 10,671 | | | 12,645 | | | (1,974 | ) | (15.6 | ) |
Total deposits | | $ | 101,272 | | $ | 99,374 | | $ | 1,898 | | 1.9 | % | $ | 101,272 | | $ | 96,434 | | $ | 4,838 | | 5.0 | % |
| | | | | | | | | | | | | | | | | | | | | | | |
SELECTED CREDIT DATA (Dollars in thousands) | | | | | | | | | | | | | | | | | | | | | | | |
Nonaccrual loans | | $ | 354,241 | | $ | 329,340 | | $ | 24,901 | | 7.6 | % | $ | 354,241 | | $ | 367,276 | | $ | (13,035 | ) | (3.5) | % |
Restructured loans | | | 19,049 | | | 19,724 | | | (675 | ) | (3.4 | ) | | 19,049 | | | 14,782 | | | 4,267 | | 28.9 | |
Total nonperforming loans | | | 373,290 | | | 349,064 | | | 24,226 | | 6.9 | | | 373,290 | | | 382,058 | | | (8,768 | ) | (2.3 | ) |
Other real estate owned (OREO) | | | 28,619 | | | 27,126 | | | 1,493 | | 5.5 | | | 28,619 | | | 44,654 | | | (16,035 | ) | (35.9 | ) |
Other repossessed assets | | | 8,749 | | | 15,082 | | | (6,333 | ) | (42.0 | ) | | 8,749 | | | 14,908 | | | (6,159 | ) | (41.3 | ) |
Total nonperforming assets | | $ | 410,658 | | $ | 391,272 | | $ | 19,386 | | 5.0 | % | $ | 410,658 | | $ | 441,620 | | $ | (30,962 | ) | (7.0) | % |
| 4 | SunTrust's average nonaccrual and restructured loans are included in the respective categories to conform to the NCF presentation. |
| 5 | The historical combined 4th quarter 2003 includes $2,243 related to the consolidation of SunTrust's commercial paper conduit, Three Pillars. |
| 6 | Includes consumer direct and consumer indirect loans. |
| 7 | Multiply by 4 to calculate sequential annualized growth or reductions |
RECONCILIATIONS APPENDIX
| | 3rd Quarter
2004 | | | 4th Quarter
2003 |
| | SunTrust | | | NCF | | | Historical
Combined | | | SunTrust | | | NCF | | | Historical
Combined |
STATEMENTS OF INCOME (Dollars in thousands) | | | | | | | | | | | | | | | | | | | | | | | | |
| | | | | | | | | | | | | | | | | | | | | | | | |
NET INTEREST INCOME | | $ | 876,874 | | | $ | 194,815 | | | $ | 1,071,689 | | | $ | 865,520 | | | $ | 195,428 | | | $ | 1,060,948 | |
Provision for loan losses | | | 41,774 | | | | 19,044 | | | | 60,818 | | | | 70,286 | | | | 12,382 | | | | 82,668 | |
NET INTEREST INCOME AFTER PROVISION
FOR LOAN LOSSES | | | 835,100 | | | | 175,771 | | | | 1,010,871 | | | | 795,234 | | | | 183,046 | | | | 978,280 | |
| | | | | | | | | | | | | | | | | | | | | | | | |
NONINTEREST INCOME | | | | | | | | | | | | | | | | | | | | | | | | |
| | | | | | | | | | | | | | | | | | | | | | | | |
Deposit and other fees1 | | | 298,328 | | | | 55,245 | | | | 353,573 | | | | 273,567 | | | | 49,514 | | | | 323,081 | |
Trust and investment management income | | | 149,673 | | | | 15,930 | | | | 165,603 | | | | 129,622 | | | | 16,234 | | | | 145,856 | |
Broker / dealer revenue2 | | | 113,308 | | | | 19,342 | | | | 132,650 | | | | 120,117 | | | | 21,560 | | | | 141,677 | |
Other noninterest income | | | 84,576 | | | | 21,974 | | | | 106,550 | | | | 41,265 | | | | 21,059 | | | | 62,324 | |
Noninterest income before securities (losses)/gains | | | 645,885 | | | | 112,491 | | | | 758,376 | | | | 564,571 | | | | 108,367 | | | | 672,938 | |
Securities (losses)/gains | | | (18,193 | ) | | | 1,628 | | | | (16,565 | ) | | | 19,501 | | | | 3,338 | | | | 22,839 | |
Total noninterest income | | | 627,692 | | | | 114,119 | | | | 741,811 | | | | 584,072 | | | | 111,705 | | | | 695,777 | |
| | | | | | | | | | | | | | | | | | | | | | | | |
NONINTEREST EXPENSE | | | | | | | | | | | | | | | | | | | | | | | | |
| | | | | | | | | | | | | | | | | | | | | | | | |
Personnel expense | | | 527,734 | | | | 77,591 | | | | 605,325 | | | | 516,171 | | | | 75,404 | | | | 591,575 | |
Net occupancy expense | | | 66,542 | | | | 13,333 | | | | 79,875 | | | | 60,522 | | | | 13,244 | | | | 73,766 | |
Outside processing and software | | | 68,657 | | | | 6,792 | | | | 75,449 | | | | 63,176 | | | | 6,695 | | | | 69,871 | |
Equipment expense | | | 43,275 | | | | 7,629 | | | | 50,904 | | | | 45,527 | | | | 7,399 | | | | 52,926 | |
Marketing and customer development | | | 32,028 | | | | 2,947 | | | | 34,975 | | | | 24,830 | | | | 2,744 | | | | 27,574 | |
Other noninterest expense | | | 176,020 | | | | 66,673 | | | | 242,693 | | | | 158,189 | | | | 42,413 | | | | 200,602 | |
Noninterest expense before amortization of | | | | | | | | | | | | | | | | | | | | | | | | |
intangible assets | | | 914,256 | | | | 174,965 | | | | 1,089,221 | | | | 868,415 | | | | 147,899 | | | | 1,016,314 | |
Amortization of intangible assets | | | 15,593 | | | | 12,539 | | | | 28,132 | | | | 16,379 | | | | 14,337 | | | | 30,716 | |
Total noninterest expense | | | 929,849 | | | | 187,504 | | | | 1,117,353 | | | | 884,794 | | | | 162,236 | | | | 1,047,030 | |
| | | | | | | | | | | | | | | | | | | | | | | | |
INCOME BEFORE INCOME TAXES | | | 532,943 | | | | 102,386 | | | | 635,329 | | | | 494,512 | | | | 132,515 | | | | 627,027 | |
Provision for income taxes | | | 164,177 | | | | 34,749 | | | | 198,926 | | | | 152,005 | | | | 43,014 | | | | 195,019 | |
NET INCOME FROM CONTINUING OPERATIONS | | | 368,766 | | | | 67,637 | | | | 436,403 | | | | 342,507 | | | | 89,501 | | | | 432,008 | |
Income from discontinued operations, net of tax | | | - | | | | - | | | | - | | | | - | | | | 767 | | | | 767 | |
NET INCOME | | $ | 368,766 | | | $ | 67,637 | | | $ | 436,403 | | | $ | 342,507 | | | $ | 90,268 | | | $ | 432,775 | |
| | | | | | | | | | | | | | | | | | | | | | | | |
REVENUE (Dollars in thousands) | | | | | | | | | | | | | | | | | | | | | | | | |
Net interest income | | $ | 876,874 | | | $ | 194,815 | | | $ | 1,071,689 | | | $ | 865,520 | | | $ | 195,428 | | | $ | 1,060,948 | |
FTE adjustment3 | | | 16,821 | | | | 2,242 | | | | 19,063 | | | | 11,981 | | | | 2,046 | | | | 14,027 | |
Net interest income – FTE | | | 893,695 | | | | 197,057 | | | | 1,090,752 | | | | 877,501 | | | | 197,474 | | | | 1,074,975 | |
Noninterest income | | | 627,692 | | | | 114,119 | | | | 741,811 | | | | 584,072 | | | | 111,705 | | | | 695,777 | |
Total revenue | | | 1,521,387 | | | | 311,176 | | | | 1,832,563 | | | | 1,461,573 | | | | 309,179 | | | | 1,770,752 | |
Securities losses/(gains) | | | 18,193 | | | | (1,628 | ) | | | 16,565 | | | | (19,501 | ) | | | (3,338 | ) | | | (22,839 | ) |
Total revenue excluding securities gains and losses | | $ | 1,539,580 | | | $ | 309,548 | | | $ | 1,849,128 | | | $ | 1,442,072 | | | $ | 305,841 | | | $ | 1,747,913 | |
| 1 | Includes service charges on deposits, card and other charges and fees. |
| 2 | Includes retail investment services, investment banking income and trading account profits and commissions. |
| 3 | NCF’s FTE adjustments were reduced $4,001 from the third quarter 2004 and $4,917 from the fourth quarter of 2003 to conform to SunTrust’s methodology. |
RECONCILIATIONS APPENDIX
| | 3rd Quarter
2004 | | 4th Quarter
2003 | |
| | SunTrust | | NCF | | Historical
Combined | | SunTrust | | NCF | | Historical
Combined | |
SELECTED AVERAGE BALANCES (Dollars in millions) | | | | | | | | | | | | | | | | |
| | | | | | | | | | | | | | | | | | | |
Average Loans4 | | | | | | | | | | | | | | | | | | | |
Commercial5 | | $ | 27,753 | | $ | 4,224 | | $ | 31,977 | | $ | 29,484 | | $ | 3,860 | | $ | 33,344 | |
Real estate 1-4 family | | | 20,798 | | | 1,165 | | | 21,963 | | | 17,218 | | | 995 | | | 18,213 | |
Real estate commercial and construction | | | 14,231 | | | 3,924 | | | 18,155 | | | 13,713 | | | 3,776 | | | 17,489 | |
Real estate equity | | | 8,239 | | | 2,056 | | | 10,295 | | | 6,741 | | | 1,609 | | | 8,350 | |
Consumer6 | | | 12,574 | | | 2,946 | | | 15,520 | | | 12,074 | | | 2,738 | | | 14,812 | |
Credit cards | | | 158 | | | 17 | | | 175 | | | 140 | | | 15 | | | 155 | |
Total loans | | $ | 83,753 | | $ | 14,332 | | $ | 98,085 | | $ | 79,370 | | $ | 12,993 | | $ | 92,363 | |
| | | | | | | | | | | | | | | | | | | |
Average deposits | | | | | | | | | | | | | | | | | | | |
Noninterest bearing deposits | | $ | 20,490 | | $ | 2,749 | | $ | 23,239 | | $ | 18,586 | | $ | 2,555 | | $ | 21,141 | |
NOW accounts | | | 13,000 | | | 2,335 | | | 15,335 | | | 12,102 | | | 2,037 | �� | | 14,139 | |
Money market accounts | | | 22,434 | | | 1,777 | | | 24,211 | | | 22,274 | | | 2,030 | | | 24,304 | |
Savings | | | 7,425 | | | 1,674 | | | 9,099 | | | 6,249 | | | 1,733 | | | 7,982 | |
Consumer time | | | 6,967 | | | 4,915 | | | 11,882 | | | 7,601 | | | 4,789 | | | 12,390 | |
Other time | | | 3,806 | | | 306 | | | 4,112 | | | 3,501 | | | 332 | | | 3,833 | |
Total consumer and commercial deposits | | | 74,122 | | | 13,756 | | | 87,878 | | | 70,313 | | | 13,476 | | | 83,789 | |
Brokered and foreign deposits | | | 9,341 | | | 2,155 | | | 11,496 | | | 10,769 | | | 1,876 | | | 12,645 | |
Total deposits | | $ | 83,463 | | $ | 15,911 | | $ | 99,374 | | $ | 81,082 | | $ | 15,352 | | $ | 96,434 | |
| | | | | | | | | | | | | | | | | | | |
SELECTED CREDIT DATA (Dollars in thousands) | | | | | | | | | | | | | | | | | | | |
Nonaccrual loans | | $ | 263,127 | | $ | 66,213 | | $ | 329,340 | | $ | 336,587 | | $ | 30,689 | | $ | 367,276 | |
Restructured loans | | | 19,724 | | | - | | | 19,724 | | | 14,782 | | | - | | | 14,782 | |
Total nonperforming loans | | | 282,851 | | | 66,213 | | | 349,064 | | | 351,369 | | | 30,689 | | | 382,058 | |
Other real estate owned (OREO) | | | 10,934 | | | 16,192 | | | 27,126 | | | 16,458 | | | 28,196 | | | 44,654 | |
Other repossessed assets | | | 10,431 | | | 4,651 | | | 15,082 | | | 10,270 | | | 4,638 | | | 14,908 | |
Total nonperforming assets | | $ | 304,216 | | $ | 87,056 | | $ | 391,272 | | $ | 378,097 | | $ | 63,523 | | $ | 441,620 | |
| 4 | SunTrust's average nonaccrual and restructured loans are included in the respective categories to conform to the NCF presentation. |
| 5 | SunTrust's 4th quarter 2003 includes $2,243 related to the consolidation of its commercial paper conduit, Three Pillars. |
| 6 | Includes consumer direct and consumer indirect loans. |

L. Phillip Humann
Chairman and CEO
Smith Barney Citigroup
Financial Services Conference
January 2005