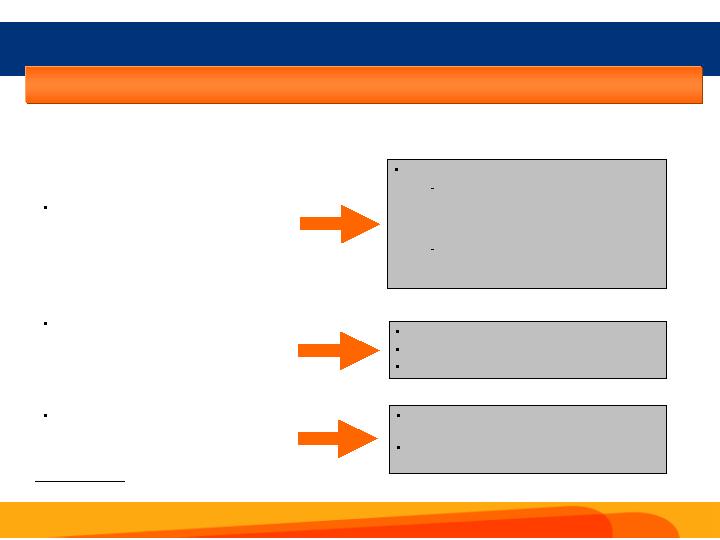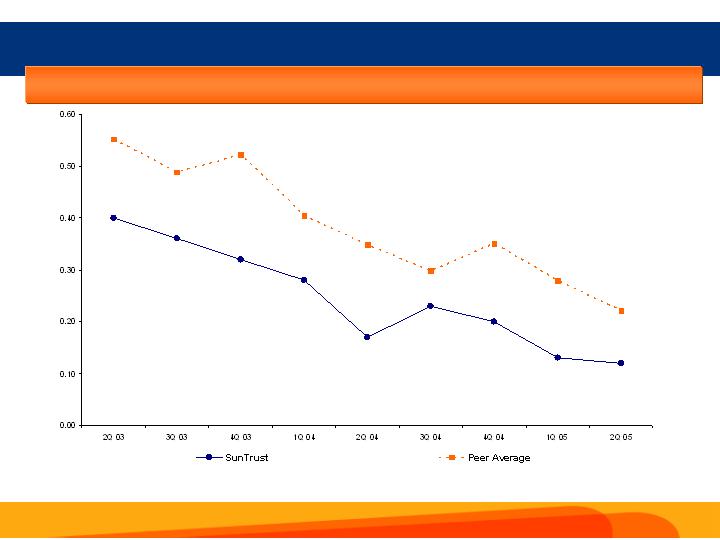
Strong Credit Quality
Net Charge-offs
Net Charge-offs to Avg.
Loans
NPAs
NPAs to
Loans/OREO/Other Repo
Allowance for Loan
Losses
Allowance to Non-
Performing Loans
Allowance to Charge-Offs
(Years Coverage)
3Q 04
4Q 04
2Q 04
$37,556
0.19%
$324,421
0.39%
$902,243
299.7%
6.0
$51,043
0.24%
$304,217
0.36%
$892,974
315.7%
4.4
$53,893
0.21%
$410,658
0.40%
$1,050,024
281.3%
4.9
$35,384
0.13%
$380,303
0.35%
$1,036,173
296.7%
7.3
2Q 05
($ in thousands)
1Q 05
$36,834
0.14%
$392,345
0.37%
$1,023,746
286.7%
6.9
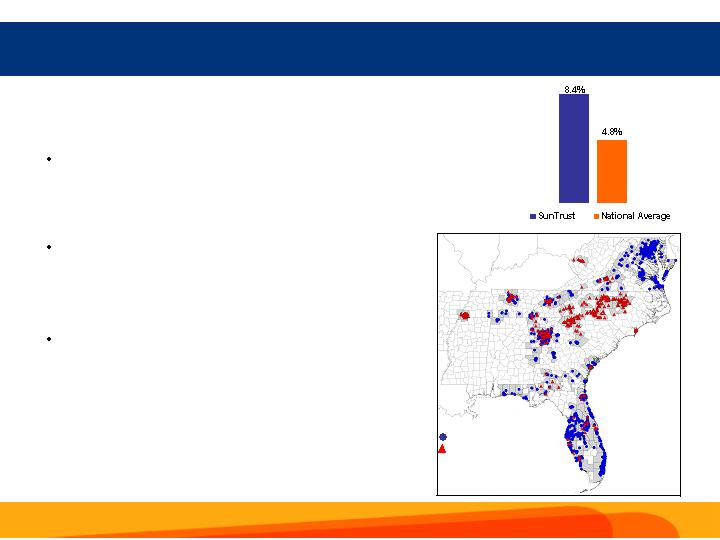
Improving consumer and commercial credit quality trends have resulted in near historical low NCO
and NPA levels
29
SUNTRUST BANKS, INC. AND SUBSIDIARIES
RECONCILEMENT OF NON-GAAP MEASURES
APPENDIX A TO THE PRESS RELEASE
<TABLE>
-------------------------------------------------------------------------
THREE MONTHS ENDED
-------------------------------------------------------------------------
JUNE 30 MARCH 31 DECEMBER 31 SEPTEMBER 30 JUNE 30
2005 2005 2004 2004 2004
-------------------------------------------------------------------------
NON-GAAP MEASURES PRESENTED IN THE PRESS RELEASE
- ------------------------------------------------
(Dollars in thousands)
Net income $465,700 $492,294 $455,729 $368,766 $386,571
Securities losses/(gains), net of tax 17 3,509 12,595 11,825 5,881
------------- ------------- ------------- ------------- -------------
Net income excluding securities gains and losses 465,717 495,803 468,324 380,591 392,452
The Coca-Cola Company dividend, net of tax (12,027) (12,028) (10,739) (10,740) (10,739)
------------- ------------- ------------- ------------- -------------
Net income excluding securities gains and losses and
The Coca-Cola Company dividend $453,690 $483,775 $457,585 $369,851 $381,713
============= ============= ============= ============= =============
Total average assets $165,253,589 $161,218,222 $156,570,092 $127,127,968 $127,287,458
Average net unrealized securities gains (1,791,566) (2,032,787) (2,056,737) (2,054,978) (2,803,917)
------------- ------------- ------------- ------------- -------------
Average assets less net unrealized securities gains $163,462,023 $159,185,435 $154,513,355 $125,072,990 $124,483,541
============= ============= ============= ============= =============
Total average equity $16,275,567 $16,119,430 $15,818,968 $9,992,905 $10,194,201
Average accumulated other comprehensive income (1,139,477) (1,285,278) (1,304,553) (1,318,332) (1,804,833)
------------- ------------- ------------- ------------- -------------
Total average realized equity $15,136,090 $14,834,152 $14,514,415 $8,674,573 $8,389,368
============= ============= ============= ============= =============
Return on average total assets 1.13% 1.24% 1.16% 1.15% 1.22%
Impact of excluding net realized and
unrealized securities gains/losses and
The Coca-Cola Company dividend (0.02) (0.01) 0.02 0.03 0.01
------------- ------------- ------------- ------------- -------------
Return on average total assets less net unrealized
securities gains(1) 1.11% 1.23% 1.18% 1.18% 1.23%
============= ============= ============= ============= =============
Return on average total shareholders' equity 11.48% 12.39% 11.46% 14.68% 15.25%
Impact of excluding net unrealized securities gains 0.54 0.84 1.08 2.28 3.05
------------- ------------- ------------- ------------- -------------
Return on average realized shareholders' equity(2) 12.02% 13.23% 12.54% 16.96% 18.30%
============= ============= ============= ============= =============
Noninterest income $770,909 $753,814 $759,003 $627,692 $622,665
Securities losses/(gains) 27 5,659 19,377 18,193 9,048
Gain on sale of RCM assets, net of related expenses - (19,874) - - -
------------- ------------- ------------- ------------- -------------
Total noninterest income excluding securities
gains and losses and net gain
on sale of RCM assets(3) $770,936 $739,599 $778,380 $645,885 $631,713
============= ============= ============= ============= =============
Net interest income $1,123,709 $1,111,560 $1,084,204 $876,874 $872,429
FTE adjustment 18,720 17,666 16,684 16,821 12,637
------------- ------------- ------------- ------------- -------------
Net interest income - FTE 1,142,429 1,129,226 1,100,888 893,695 885,066
Noninterest income 770,909 753,814 759,003 627,692 622,665
------------- ------------- ------------- ------------- -------------
Total revenue 1,913,338 1,883,040 1,859,891 1,521,387 1,507,731
Securities losses/(gains) 27 5,659 19,377 18,193 9,048
Gain on sale of RCM assets, net of related expenses - (19,874) - - -
------------- ------------- ------------- ------------- -------------
Total revenue excluding securities gains and losses
and net gain on sale of RCM assets(3) $1,913,365 $1,868,825 $1,879,268 $1,539,580 $1,516,779
============= ============= ============= ============= =============
</TABLE>
<TABLE>
----------------------------
SIX MONTHS ENDED
----------------------------
JUNE 30
2005 2004
----------------------------
NON-GAAP MEASURES PRESENTED IN THE PRESS RELEASE
(Dollars in thousands)
Net income $957,994 $748,406
Securities losses/(gains), net of tax 3,525 2,679
------------- -------------
Net income excluding securities gains and losses 961,519 751,085
The Coca-Cola Company dividend, net of tax (24,056) (21,478)
------------- -------------
Net income excluding securities gains and losses and
The Coca-Cola Company dividend $937,463 $729,607
============= =============
Total average assets $163,247,052 $125,570,602
Average net unrealized securities gains (1,911,510) (2,692,110)
------------- -------------
Average assets less net unrealized securities gains $161,335,542 $122,878,492
============= =============
Total average equity $16,197,929 $10,017,242
Average accumulated other comprehensive income (1,211,975) (1,725,273)
------------- -------------
Total average realized equity $14,985,954 $8,291,969
============= =============
Return on average total assets 1.18% 1.20%
Impact of excluding net realized and unrealized securities
gains/losses and The Coca-Cola Company dividend (0.01) (0.01)
------------- -------------
Return on average total assets less net unrealized
securities gains(1) 1.17% 1.19%
============= =============
Return on average total shareholders' equity 11.93% 15.02%
Impact of excluding net unrealized securities gains 0.68 2.67
------------- -------------
Return on average realized shareholders' equity(2) 12.61% 17.69%
============= =============
Noninterest income $1,524,723 $1,217,751
Securities losses/(gains) 5,686 4,121
Gain on sale of RCM assets, net of related expenses (19,874) -
------------- -------------
Total noninterest income excluding securities gains and losses
and net gain on sale of RCM assets(3) $1,510,535 $1,221,872
============= =============
Net interest income $2,235,269 $1,724,077
FTE adjustment 36,386 24,893
------------- -------------
Net interest income - FTE 2,271,655 1,748,970
Noninterest income 1,524,723 1,217,751
------------- -------------
Total revenue 3,796,378 2,966,721
Securities losses/(gains) 5,686 4,121
Gain on sale of RCM assets, net of related expenses (19,874) -
------------- -------------
Total revenue excluding securities gains and losses
and net gain on sale of RCM assets(3) $3,782,190 $2,970,842
============= =============
</TABLE>
<TABLE>
----------------------------------------------------------------------------------------
THREE MONTHS ENDED
----------------------------------------------------------------------------------------
JUNE 30 MARCH 31 CHANGE JUNE 30 JUNE 30 CHANGE
2005 2005 %(4) 2005 2004 %
----------------------------------------------------------------------------------------
AVERAGE LOW COST CONSUMER AND COMMERCIAL DEPOSIT RECONCILEMENT
- --------------------------------------------------------------
(Dollars in thousands)
Noninterest bearing deposits $24,309,721 $23,723,080 2.5 $24,309,721 $20,591,615 18.1
NOW accounts 17,519,608 17,479,848 0.2 17,519,608 12,811,554 36.7
Savings 6,462,425 7,506,923 (13.9) 6,462,425 6,990,929 (7.6)
------------ ------------ ------------ ------------
Total average low cost consumer
and commercial deposits $48,291,754 $48,709,851 (0.9) $48,291,754 $40,394,098 19.6
============ ============ ============ ============
</TABLE>
- --------------------------------------------------------------------------------
(1) SunTrust presents a return on average assets less net unrealized gains on
securities. The foregoing numbers reflect primarily adjustments to remove
the effects of the Company's securities portfolio which includes the
ownership by the Company of 48.3 million shares of The Coca-Cola Company.
The Company uses this information internally to gauge its actual
performance in the industry. The Company believes that the return on
average assets less the net unrealized securities gains is more indicative
of the Company's return on assets because it more accurately reflects the
return on the assets that are related to the Company's core businesses
which are primarily customer relationship and customer transaction driven.
The return on average assets less net unrealized gains on securities is
computed by dividing annualized net income, excluding securities
gains/losses and The Coca-Cola Company dividend, by average assets less net
unrealized securities gains.
(2) The Company also believes that the return on average realized equity is
more indicative of the Company's return on equity because the excluded
equity relates primarily to a long term holding of a specific security. The
return on average realized shareholders' equity is computed by dividing
annualized net income, excluding securities gains/losses and The Coca-Cola
Company dividend, by average realized shareholders' equity.
(3) SunTrust presents total noninterest income and total revenue excluding
realized securities gains and losses and the net gain on the sale of RCM
assets. The Company believes total noninterest income and total revenue
without securities gains and losses is more indicative of the Company's
performance because it isolates income that is primarily customer
relationship and customer transaction driven. SunTrust further excludes the
net gain on the sale of RCM assets because the Company believes the
exclusion of the net gain is more indicative of normalized operations.
(4) Multiply by 4 to calculate sequential annualized growth or reductions
discussed in the earnings call.
SUNTRUST BANKS, INC. AND SUBSIDIARIES
RECONCILEMENT OF NON-GAAP MEASURES
APPENDIX A TO THE PRESS RELEASE, CONTINUED
<TABLE>
------------------------------------------
SIX
THREE MONTHS ENDED MONTHS ENDED
------------------------------------------
June 30 March 31 June 30
2005 2005 2005
------------------------------------------
SELECTED NON-GAAP OPERATING MEASURES AND ADJUSTED
- -------------------------------------------------
OPERATING MEASURES PRESENTED IN THE PRESS RELEASE(1)
- ----------------------------------------------------
(Dollars in thousands)
Net income $465,700 $492,294 $957,994
Merger expense, net of tax 33,642 15,958 49,600
------------ ------------ ------------
Operating net income 499,342 $508,252 1,007,594
Net gain on sale of RCM assets, net of tax - (12,322) (12,322)
------------ ------------ ------------
Adjusted operating net income $499,342 $495,930 $995,272
============ ============ ============
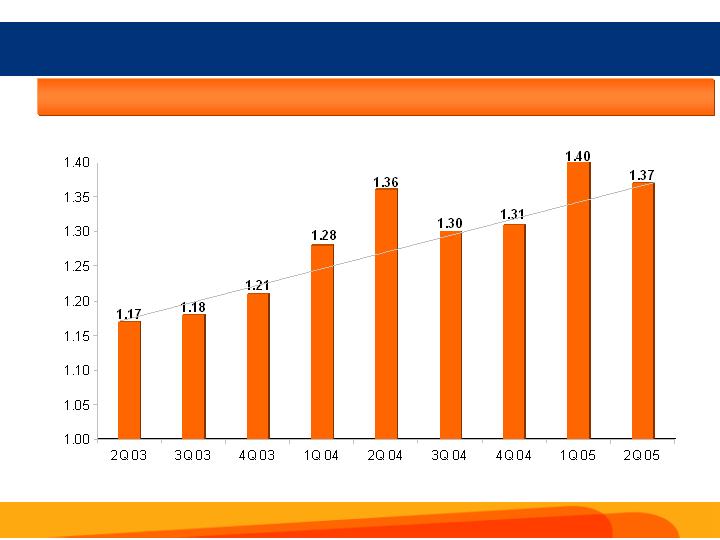
Diluted earnings per share $1.28 $1.36 $2.64
Impact of excluding merger expense 0.09 0.04 0.13
------------ ------------ ------------
Operating diluted earnings per share 1.37 1.40 2.77
Impact of net gain on sale of RCM assets - (0.03) (0.03)
------------ ------------ ------------
Adjusted operating diluted earnings per share $1.37 $1.37 $2.74
============ ============ ============
Total revenue $1,913,338 $1,883,040 $3,796,378
Securities losses 27 5,659 5,686
Net gain on sale of RCM assets - (19,874) (19,874)
------------ ------------ ------------
Adjusted total revenue $1,913,365 $1,868,825 $3,782,190
============ ============ ============
Noninterest income $770,909 $753,814 $1,524,723
Net gain on sale of RCM assets - (19,874) (19,874)
------------ ------------ ------------
Noninterest income excluding net gain on sale of RCM assets $770,909 $733,940 $1,504,849
============ ============ ============
Noninterest expense $1,172,825 $1,133,906 $2,306,731
Merger expense (54,262) (25,738) (80,000)
------------ ------------ ------------
Noninterest expense excluding merger expense $1,118,563 $1,108,168 $2,226,731
============ ============ ============
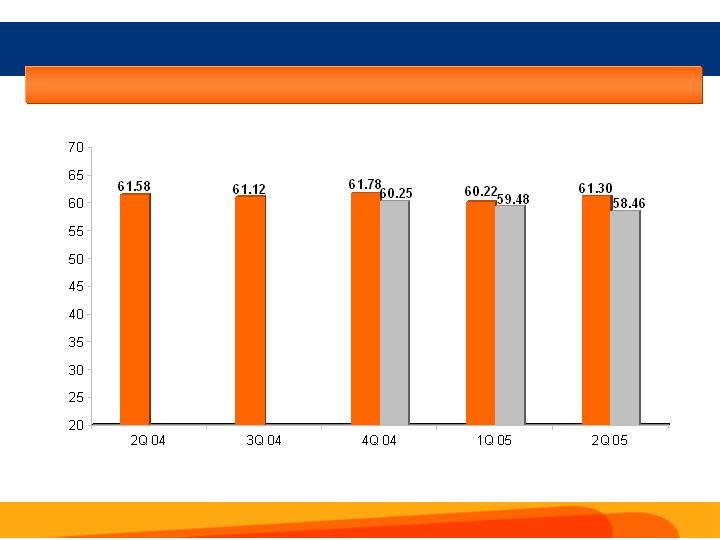
Efficiency ratio 61.30% 60.22% 60.76%
Impact of excluding merger expense (2.84) (1.37) (2.11)
------------ ------------ ------------
Operating efficiency ratio 58.46% 58.85% 58.65%
Impact of net gain on sale of RCM assets - 0.63 0.31
------------ ------------ ------------
Adjusted operating efficiency ratio 58.46% 59.48% 58.96%
============ ============ ============
Return on average total assets 1.13% 1.24% 1.18%
Impact of excluding merger expense 0.08 0.04 0.06
------------ ------------ ------------
Operating return on average total assets(2) 1.21% 1.28% 1.24%
============ ============ ============
Return on average total shareholders' equity 11.48% 12.39% 11.93%
Impact of excluding merger expense 0.83 0.40 0.61
------------ ------------ ------------
Operating return on average total shareholders' equity(3) 12.31% 12.79% 12.54%
============ ============ ============
</TABLE>
- --------------------------------------------------------------------------------
(1) SunTrust presents selected financial data on an operating basis that
excludes merger charges, which represent incremental costs to integrate
NCF's operations. The Company also presents selected financial data on an
adjusted operating basis, which further excludes the net gain related to
the sale of RCM assets. The Company believes the exclusion of these two
measures is more reflective of normalized operations.
(2) Computed by dividing annualized operating net income by average total
assets.
(3) Computed by dividing annualized operating net income by average total
shareholders' equity.
SUNTRUST BANKS, INC. AND SUBSIDIARIES
QUARTER-TO-QUARTER COMPARISON - ACTUAL
APPENDIX B TO THE PRESS RELEASE
<TABLE>
---------------------------------------------------------------
THREE MONTHS ENDED
---------------------------------------------------------------
SEQUENTIAL
JUNE 30 MARCH 31 INCREASE/(DECREASE) ANNUALIZED(1)
2005 2005 AMOUNT % %
---------------------------------------------------------------
STATEMENTS OF INCOME (DOLLARS IN THOUSANDS)
NET INTEREST INCOME $1,123,709 $1,111,560 $12,149 1.1% 4.4%
Provision for loan losses 47,811 10,556 37,255 352.9 1,411.7
------------ ------------- ---------
NET INTEREST INCOME AFTER PROVISION
FOR LOAN LOSSES 1,075,898 1,101,004 (25,106) (2.3) (9.1)
------------ ------------- ---------
NONINTEREST INCOME
Deposit and other fees(2) 357,545 343,634 13,911 4.0 16.2
Trust and investment management income 167,503 164,515 2,988 1.8 7.3
Broker / dealer revenue(3) 138,149 149,196 (11,047) (7.4) (29.6)
Other noninterest income 107,739 82,254 25,485 31.0 123.9
------------ ------------- ---------
Noninterest income before securities (losses)/gains
and net gain on sale of RCM assets4 770,936 739,599 31,337 4.2 16.9
Gain on sale of RCM assets, net of related expenses - 19,874 (19,874) (100.0) (400.0)
------------ ------------- ---------
Noninterest income before securities (losses)/gains 770,936 759,473 11,463 1.5 6.0
Securities (losses)/gains (27) (5,659) 5,632 (99.5) (398.1)
------------ ------------- ---------
Total noninterest income 770,909 753,814 17,095 2.3 9.1
------------ ------------- ---------
NONINTEREST EXPENSE
Personnel expense 623,284 634,793 (11,509) (1.8) (7.3)
Net occupancy expense 73,483 75,851 (2,368) (3.1) (12.5)
Outside processing and software 89,282 82,848 6,434 7.8 31.1
Equipment expense 51,579 52,882 (1,303) (2.5) (9.9)
Marketing and customer development 36,298 31,629 4,669 14.8 59.0
Other noninterest expense 214,819 198,948 15,871 8.0 31.9
------------ ------------- ---------
Noninterest expense before amortization of
intangible assets and merger expense(5) 1,088,745 1,076,951 11,794 1.1 4.4
Amortization of intangible assets 29,818 31,217 (1,399) (4.5) (17.9)
Merger expense 54,262 25,738 28,524 110.8 443.3
------------ ------------- ---------
Total noninterest expense 1,172,825 1,133,906 38,919 3.4 13.7
------------ ------------- ---------
INCOME BEFORE INCOME TAXES 673,982 720,912 (46,930) (6.5) (26.0)
Provision for income taxes 208,282 228,618 (20,336) (8.9) (35.6)
------------ ------------- ---------
NET INCOME 465,700 492,294 (26,594) (5.4) (21.6)
Merger expense, net of tax 33,642 15,958 17,684 110.8 443.3
------------ ------------- ---------
OPERATING NET INCOME 499,342 508,252 (8,910) (1.8) (7.0)
Net gain on sale of RCM assets, net of tax - (12,322) 12,322 (100.0) (400.0)
------------ ------------- ---------
ADJUSTED OPERATING NET INCOME $499,342 $495,930 $3,412 0.7% 2.8%
============ ============= =========
REVENUE (DOLLARS IN THOUSANDS)
Net interest income $1,123,709 $1,111,560 $12,149 1.1% 4.4%
FTE adjustment 18,720 17,666 1,054 6.0 23.9
------------ ------------- ---------
Net interest income - FTE 1,142,429 1,129,226 13,203 1.2 4.7
Noninterest income 770,909 753,814 17,095 2.3 9.1
------------ ------------- ---------
Total revenue 1,913,338 1,883,040 30,298 1.6 6.4
Securities losses/(gains) 27 5,659 (5,632) (99.5) (398.1)
Net gain on sale of RCM assets - (19,874) 19,874 (100.0) (400.0)
Total revenue excluding securities gains and losses
------------ ------------- ---------
and net gain on sale of RCM assets $1,913,365 $1,868,825 $44,540 2.4% 9.5%
============ ============= =========
SELECTED AVERAGE BALANCES (DOLLARS IN MILLIONS)
Average Loans(6, 8)
Commercial $32,508 $33,518 ($1,010) (3.0)% (12.1)%
Real estate 1-4 family 26,324 23,527 2,797 11.9 47.6
Real estate commercial and construction 21,496 19,224 2,272 11.8 47.3
Real estate equity 12,135 11,574 561 4.8 19.4
Consumer(7) 14,291 15,175 (884) (5.8) (23.3)
Credit cards 213 198 15 7.6 30.3
------------ ------------- ---------
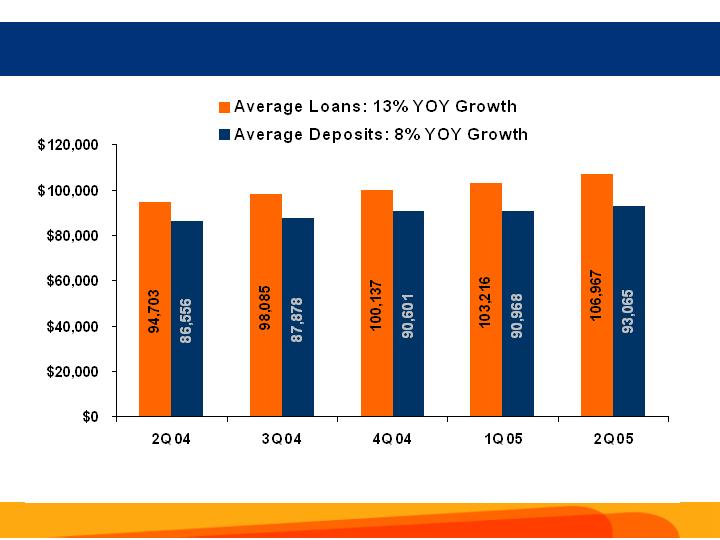
Total loans $106,967 $103,216 $3,751 3.6% 14.5%
============ ============= =========
Average deposits(8)
Noninterest bearing deposits $24,310 $23,723 $587 2.5% 9.9%
NOW accounts 17,520 17,480 40 0.2 0.9
Money market accounts 25,473 24,767 706 2.9 11.4
Savings 6,462 7,507 (1,045) (13.9) (55.7)
Consumer and other time 19,300 17,491 1,809 10.3 41.4
------------ ------------- ---------
Total consumer and commercial deposits 93,065 90,968 2,097 2.3 9.2
Brokered and foreign deposits 15,709 13,424 2,285 17.0 68.1
------------ ------------- ---------
Total deposits $108,774 $104,392 $4,382 4.2% 16.8%
============ ============= =========
SELECTED CREDIT DATA (DOLLARS IN THOUSANDS)
Nonaccrual loans $328,018 $337,057 ($9,039) (2.7)% (10.7)%
Restructured loans 21,236 20,071 1,165 5.8 23.2
------------ ------------- ---------
Total nonperforming loans 349,254 357,128 (7,874) (2.2) (8.8)
Other real estate owned (OREO) 25,263 27,555 (2,292) (8.3) (33.3)
Other repossessed assets 5,786 7,662 (1,876) (24.5) (97.9)
------------ ------------- ---------
Total nonperforming assets $380,303 $392,345 ($12,042) (3.1)% (12.3)%
============ ============= =========
Allowance for loan and lease losses $1,036,173 $1,023,746 $12,427 1.2% 4.9%
============ ============= =========
</TABLE>
- --------------------------------------------------------------------------------
(1) Multiply percentage change by 4 to calculate sequential annualized change.
Any sequential annualized change over 100 percent is labeled as "NM". Those
changes over 100 percent were not considered to be meaningful.
(2) Includes service charges on deposits, card and other charges and fees.
(3) Includes retail investment services, investment banking income and trading
account profits and commissions.
(4) SunTrust presents noninterest income before securities (losses)/gains and
the net gain on the sale of RCM assets. The Company believes noninterest
income before securities gains and losses is more indicative of the
Company's performance because it isolates income that is primarily customer
relationship and customer transaction driven. SunTrust further excludes the
net gain on the sale of RCM assets because the Company believes the
exclusion of the net gain provides better comparability and is more
indicative of normalized operations.
(5) The Company presents noninterest expense before amortization of intangible
assets and merger expense. The Company believes the exclusion of these
measures provides better comparability and is more reflective of normalized
operations.
(6) SunTrust's average nonaccrual and restructured loans are included in the
respective categories to conform to the NCF presentation.
(7) Includes consumer direct and consumer indirect loans.
(8) See Appendix C for the impact of the estimated reclassification adjustments
resulting from the April 22, 2005 NCF systems conversion.
SUNTRUST BANKS, INC. AND SUBSIDIARIES
QUARTER-TO-QUARTER COMPARISON - HISTORICAL COMBINED GROWTH
APPENDIX B TO THE PRESS RELEASE, CONTINUED
The 2nd quarter and year-to-date 2004 figures represent SunTrust and NCF on a
historical combined basis. See following page for a reconcilement of these
historical combined amounts.
<TABLE>
--------------------------------------------------
HISTORICAL COMBINED
--------------------------------------------------
THREE MONTHS ENDED
JUNE 30 INCREASE/(DECREASE)
2005 2004 AMOUNT %
--------------------------------------------------
STATEMENTS OF INCOME (DOLLARS IN THOUSANDS)
NET INTEREST INCOME $1,123,709 $1,066,415 $57,294 5.4%
Provision for loan losses 47,811 15,672 32,139 205.1
---------- ---------- ----------
NET INTEREST INCOME AFTER PROVISION
FOR LOAN LOSSES 1,075,898 1,050,743 25,155 2.4
---------- ---------- ----------
NONINTEREST INCOME
Deposit and other fees(1) 357,545 355,631 1,914 0.5
Trust and investment management income 167,503 156,352 11,151 7.1
Broker / dealer revenue(2) 138,149 161,914 (23,765) (14.7)
Other noninterest income 107,739 81,998 25,741 31.4
---------- ---------- ----------
Noninterest income before securities (losses)/gains
and net gain on sale of RCM assets(3) 770,936 755,895 15,041 2.0
Gain on sale of RCM assets, net of related expenses - - - -
---------- ---------- ----------
Noninterest income before securities (losses)/gains 770,936 755,895 15,041 2.0
Securities (losses)/gains (27) (8,982) 8,955 (99.7)
---------- ---------- ----------
Total noninterest income 770,909 746,913 23,996 3.2
---------- ---------- ----------
NONINTEREST EXPENSE
Personnel expense 623,284 598,729 24,555 4.1
Net occupancy expense 73,483 75,042 (1,559) (2.1)
Outside processing and software 89,282 77,680 11,602 14.9
Equipment expense 51,579 52,934 (1,355) (2.6)
Marketing and customer development 36,298 35,788 510 1.4
Other noninterest expense 214,819 235,442 (20,623) (8.8)
---------- ---------- ----------
Noninterest expense before amortization of
intangible assets and merger expense(4) 1,088,745 1,075,615 13,130 1.2
Amortization of intangible assets 29,818 27,491 2,327 8.5
Merger expense 54,262 - 54,262 100.0
---------- ---------- ----------
Total noninterest expense 1,172,825 1,103,106 69,719 6.3
---------- ---------- ----------
INCOME BEFORE INCOME TAXES 673,982 694,550 (20,568) (3.0)
Provision for income taxes 208,282 222,888 (14,606) (6.6)
---------- ---------- ----------
NET INCOME 465,700 471,662 (5,962) (1.3)
Merger expense, net of tax 33,642 - 33,642 100.0
---------- ---------- ----------
OPERATING NET INCOME 499,342 471,662 27,680 5.9
Net gain on sale of RCM assets, net of tax - - - -
---------- ---------- ----------
ADJUSTED OPERATING NET INCOME $499,342 $471,662 $27,680 5.9%
========== ========== ==========
REVENUE (DOLLARS IN THOUSANDS)
Net interest income $1,123,709 $1,066,415 $57,294 5.4
FTE adjustment(5) 18,720 15,017 3,703 24.7
---------- ---------- ----------
Net interest income - FTE 1,142,429 1,081,432 60,997 5.6
Noninterest income 770,909 746,913 23,996 3.2
---------- ---------- ----------
Total revenue 1,913,338 1,828,345 84,993 4.6
Securities losses/(gains) 27 8,982 (8,955) (99.7)
Net gain on sale of RCM assets - - - -
---------- ---------- ----------
Total revenue excluding securities gains and losses
and net gain on sale of RCM assets $1,913,365 $1,837,327 $76,038 4.1%
========== ========== ==========
SELECTED AVERAGE BALANCES (DOLLARS IN MILLIONS)
Average Loans(6)
Commercial $32,508 $31,775 $733 2.3%
Real estate 1-4 family 26,324 20,018 6,306 31.5
Real estate commercial and construction 21,496 17,864 3,632 20.3
Real estate equity 12,135 9,497 2,638 27.8
Consumer(7) 14,291 15,382 (1,091) (7.1)
Credit cards 213 167 46 27.5
---------- ---------- ----------
Total loans $106,967 $94,703 $12,264 12.9%
========== ========== ==========
Average deposits
Noninterest bearing deposits $24,310 $23,292 $1,018 4.4%
NOW accounts 17,520 15,090 2,430 16.1
Money market accounts 25,473 24,207 1,266 5.2
Savings 6,462 8,697 (2,235) (25.7)
Consumer and other time 19,300 15,270 4,030 26.4
---------- ---------- ----------
Total consumer and commercial deposits 93,065 86,556 6,509 7.5
Brokered and foreign deposits 15,709 12,677 3,032 23.9
---------- ---------- ----------
Total deposits $108,774 $99,233 $9,541 9.6%
========== ========== ==========
SELECTED CREDIT DATA (DOLLARS IN THOUSANDS)
Nonaccrual loans $328,018 $320,548 $7,470 2.3%
Restructured loans 21,236 18,189 3,047 16.8
---------- ---------- ----------
Total nonperforming loans 349,254 338,737 10,517 3.1
Other real estate owned (OREO) 25,263 36,865 (11,602) (31.5)
Other repossessed assets 5,786 14,201 (8,415) (59.3)
---------- ---------- ----------
Total nonperforming assets $380,303 $389,803 ($9,500) (2.4)%
========== ========== ==========
Allowance for loan and lease losses $1,036,173 $1,080,681 ($44,508) (4.1)%
========== ========== ==========
</TABLE>
<TABLE>
-------------------------------------------------
HISTORICAL COMBINED
-------------------------------------------------
SIX MONTHS ENDED
JUNE 30 INCREASE/(DECREASE)
2005 2004 AMOUNT %
-------------------------------------------------
STATEMENTS OF INCOME (DOLLARS IN THOUSANDS)
NET INTEREST INCOME $2,235,269 $2,109,134 $126,135 6.0%
Provision for loan losses 58,367 81,597 (23,230) (28.5)
---------- ---------- ----------
NET INTEREST INCOME AFTER PROVISION
FOR LOAN LOSSES 2,176,902 2,027,537 149,365 7.4
---------- ---------- ----------
NONINTEREST INCOME
Deposit and other fees(1) 701,179 692,753 8,426 1.2
Trust and investment management income 332,018 309,068 22,950 7.4
Broker / dealer revenue(2) 287,345 307,617 (20,272) (6.6)
Other noninterest income 189,993 145,636 44,357 30.5
---------- ---------- ----------
Noninterest income before securities (losses)/gains
and net gain on sale of RCM assets(3) 1,510,535 1,455,074 55,461 3.8
Gain on sale of RCM assets, net of related expenses 19,874 - 19,874 100.0
---------- ---------- ----------
Noninterest income before securities (losses)/gains 1,530,409 1,455,074 75,335 5.2
Securities (losses)/gains (5,686) 6,863 (12,549) (182.9)
---------- ---------- ----------
Total noninterest income 1,524,723 1,461,937 62,786 4.3
---------- ---------- ----------
NONINTEREST EXPENSE
Personnel expense 1,258,077 1,184,646 73,431 6.2
Net occupancy expense 149,334 150,308 (974) (0.6)
Outside processing and software 172,130 149,895 22,235 14.8
Equipment expense 104,461 105,252 (791) (0.8)
Marketing and customer development 67,927 69,036 (1,109) (1.6)
Other noninterest expense 413,767 440,673 (26,906) (6.1)
---------- ---------- ----------
Noninterest expense before amortization of
intangible assets and merger expense(4) 2,165,696 2,099,810 65,886 3.1
Amortization of intangible assets 61,035 56,770 4,265 7.5
Merger expense 80,000 - 80,000 100.0
---------- ---------- ----------
Total noninterest expense 2,306,731 2,156,580 150,151 7.0
---------- ---------- ----------
INCOME BEFORE INCOME TAXES 1,394,894 1,332,894 62,000 4.7
Provision for income taxes 436,900 409,153 27,747 6.8
---------- ---------- ----------
NET INCOME 957,994 923,741 34,253 3.7
Merger expense, net of tax 49,600 - 49,600 100.0
---------- ---------- ----------
OPERATING NET INCOME 1,007,594 923,741 83,853 9.1
Net gain on sale of RCM assets, net of tax (12,322) - (12,322) (100.0)
---------- ---------- ----------
ADJUSTED OPERATING NET INCOME $995,272 $923,741 $71,531 7.7%
========== ========== ==========
REVENUE (DOLLARS IN THOUSANDS)
Net interest income $2,235,269 $2,109,134 $126,135 6.0%
FTE adjustment(5) 36,386 29,378 7,008 23.9
---------- ---------- ----------
Net interest income - FTE 2,271,655 2,138,512 133,143 6.2
Noninterest income 1,524,723 1,461,937 62,786 4.3
---------- ---------- ----------
Total revenue 3,796,378 3,600,449 195,929 5.4
Securities losses/(gains) 5,686 (6,863) 12,549 182.9
Net gain on sale of RCM assets (19,874) - (19,874) (100.0)
---------- ---------- ----------
Total revenue excluding securities gains and losses
and net gain on sale of RCM assets $3,782,190 $3,593,586 $188,604 5.2%
========== ========== ==========
SELECTED AVERAGE BALANCES (DOLLARS IN MILLIONS)
Average Loans(6)
Commercial $33,011 $32,202 $809 2.5%
Real estate 1-4 family 24,931 19,402 5,529 28.5
Real estate commercial and construction 20,370 17,767 2,603 14.7
Real estate equity 11,856 9,170 2,686 29.3
Consumer(7) 14,729 15,222 (493) (3.2)
Credit cards 205 161 44 27.3
---------- ---------- ----------
Total loans $105,102 $93,924 $11,178 11.9%
========== ========== ==========
Average deposits
Noninterest bearing deposits $24,018 $22,352 $1,666 7.5%
NOW accounts 17,500 14,792 2,708 18.3
Money market accounts 25,122 24,139 983 4.1
Savings 6,982 8,376 (1,394) (16.6)
Consumer and other time 18,400 15,422 2,978 19.3
---------- ---------- ----------
Total consumer and commercial deposits 92,022 85,081 6,941 8.2
Brokered and foreign deposits 14,573 12,484 2,089 16.7
---------- ---------- ----------
Total deposits $106,595 $97,565 $9,030 9.3%
========== ========== ==========
SELECTED CREDIT DATA (DOLLARS IN THOUSANDS)
Nonaccrual loans
Restructured loans
Total nonperforming loans
Other real estate owned (OREO)
Other repossessed assets
Total nonperforming assets
Allowance for loan and lease losses
</TABLE>
- --------------------------------------------------------------------------------
(1) Includes service charges on deposits, card and other charges and fees.
(2) Includes retail investment services, investment banking income and trading
account profits and commissions.
(3) SunTrust presents noninterest income before securities (losses)/gains and
the net gain on the sale of RCM assets. The Company believes noninterest
income before securities gains and losses is more indicative of the
Company's performance because it isolates income that is primarily customer
relationship and customer transaction driven. SunTrust further excludes the
net gain on the sale of RCM assets because the Company believes the
exclusion of the net gain provides better comparability and is more
indicative of normalized operations.
(4) The Company presents noninterest expense before amortization of intangible
assets and merger expense. The Company believes the exclusion of these
measures provides better comparability and is more reflective of normalized
operations.
(5) NCF's FTE adjustments were reduced $4.4 million and $9.1 million from the
second quarter and first six months of 2004, respectively, to conform to
SunTrust's methodology.
(6) SunTrust's average nonaccrual and restructured loans are included in the
respective categories to conform to the NCF presentation.
(7) Includes consumer direct and consumer indirect loans.
SUNTRUST BANKS, INC. AND SUBSIDIARIES
SUNTRUST / NCF - SELECTED HISTORICAL FINANCIAL DATA
APPENDIX B TO THE PRESS RELEASE, CONTINUED
<TABLE>
--------------------------------------------------------------------------
THREE MONTHS ENDED SIX MONTHS ENDED
--------------------------------------------------------------------------
JUNE 30, 2004 JUNE 30, 2004
-------------------------------------- -----------------------------------
HISTORICAL HISTORICAL
SUNTRUST NCF COMBINED SUNTRUST NCF COMBINED
--------------------------------------------------------------------------
STATEMENTS OF INCOME (Dollars in thousands)
NET INTEREST INCOME $872,429 $193,986 $1,066,415 $1,724,077 $385,057 $2,109,134
Provision for loan losses 2,827 12,845 15,672 56,664 24,933 81,597
---------- ---------- ---------- ---------- ---------- -----------
NET INTEREST INCOME AFTER PROVISION
FOR LOAN LOSSES 869,602 181,141 1,050,743 1,667,413 360,124 2,027,537
---------- ---------- ---------- ---------- ---------- -----------
NONINTEREST INCOME
Deposit and other fees (1) 301,191 54,440 355,631 588,850 103,903 692,753
Trust and investment management income 140,366 15,986 156,352 276,584 32,484 309,068
Broker / dealer revenue (2) 135,203 26,711 161,914 255,144 52,473 307,617
Other noninterest income 54,953 27,045 81,998 101,294 44,342 145,636
---------- ---------- ---------- ---------- ---------- -----------
Noninterest income before securities (losses)/gains 631,713 124,182 755,895 1,221,872 233,202 1,455,074
Securities (losses)/gains (9,048) 66 (8,982) (4,121) 10,984 6,863
---------- ---------- ---------- ---------- ---------- -----------
Total noninterest income 622,665 124,248 746,913 1,217,751 244,186 1,461,937
---------- ---------- ---------- ---------- ---------- -----------
NONINTEREST EXPENSE
Personnel expense 520,922 77,807 598,729 1,027,718 156,928 1,184,646
Net occupancy expense 61,629 13,413 75,042 123,488 26,820 150,308
Outside processing and software 70,619 7,061 77,680 136,245 13,650 149,895
Equipment expense 45,740 7,194 52,934 90,825 14,427 105,252
Marketing and customer development 31,655 4,133 35,788 61,874 7,162 69,036
Other noninterest expense 183,294 52,148 235,442 347,817 92,856 440,673
---------- ---------- ---------- ---------- ---------- -----------
Noninterest expense before amortization of
intangible assets 913,859 161,756 1,075,615 1,787,967 311,843 2,099,810
Amortization of intangible assets 14,590 12,901 27,491 30,230 26,540 56,770
---------- ---------- ---------- ---------- ---------- -----------
Total noninterest expense 928,449 174,657 1,103,106 1,818,197 338,383 2,156,580
---------- ---------- ---------- ---------- ---------- -----------
INCOME BEFORE INCOME TAXES 563,818 130,732 694,550 1,066,967 265,927 1,332,894
Provision for income taxes 177,247 45,641 222,888 318,561 90,592 409,153
---------- ---------- ---------- ---------- ---------- -----------
NET INCOME $386,571 $85,091 $471,662 $748,406 $175,335 $923,741
========== ========== ========== ========== ========== ===========
REVENUE (DOLLARS IN THOUSANDS)
Net interest income $872,429 $193,986 $1,066,415 $1,724,077 $385,057 $2,109,134
FTE adjustment (3) 12,637 2,380 15,017 24,893 4,485 29,378
---------- ---------- ---------- ---------- ---------- -----------
Net interest income - FTE 885,066 196,366 1,081,432 1,748,970 389,542 2,138,512
Noninterest income 622,665 124,248 746,913 1,217,751 244,186 1,461,937
---------- ---------- ---------- ---------- ---------- -----------
Total revenue 1,507,731 320,614 1,828,345 2,966,721 633,728 3,600,449
Securities losses/(gains) 9,048 (66) 8,982 4,121 (10,984) (6,863)
---------- ---------- ---------- ---------- ---------- -----------
Total revenue excluding securities gains and losses $1,516,779 $320,548 $1,837,327 $2,970,842 $622,744 $3,593,586
========== ========== ========== ========== ========== ===========
SELECTED AVERAGE BALANCES (DOLLARS IN MILLIONS)
Average Loans (4)
Commercial $27,654 $4,121 $31,775 $28,143 $4,059 $32,202
Real estate 1-4 family 18,934 1,084 20,018 18,383 1,019 19,402
Real estate commercial and construction 14,043 3,821 17,864 13,976 3,791 17,767
Real estate equity 7,619 1,878 9,497 7,365 1,805 9,170
Consumer (5) 12,535 2,847 15,382 12,409 2,813 15,222
Credit cards 151 16 167 145 16 161
---------- ---------- ---------- ---------- ---------- -----------
Total loans $80,936 $13,767 $94,703 $80,421 $13,503 $93,924
========== ========== ========== ========== ========== ===========
Average deposits
Noninterest bearing deposits $20,591 $2,701 $23,292 $19,744 $2,608 $22,352
NOW accounts 12,812 2,278 15,090 12,572 2,220 14,792
Money market accounts 22,367 1,840 24,207 22,252 1,887 24,139
Savings 6,991 1,706 8,697 6,663 1,713 8,376
Consumer and other time 10,405 4,865 15,270 10,533 4,889 15,422
---------- ---------- ---------- ---------- ---------- -----------
Total consumer and commercial deposits 73,166 13,390 86,556 71,764 13,317 85,081
Brokered and foreign deposits 10,154 2,523 12,677 10,077 2,407 12,484
---------- ---------- ---------- ---------- ---------- -----------
Total deposits $83,32 $15,91 $99,233 $81,841 $15,724 $97,565
========== ========== ========== ========== ========== ===========
SELECTED CREDIT DATA (DOLLARS IN THOUSANDS)
Nonaccrual loans $282,910 $37,638 $320,548
Restructured loans 18,189 - 18,189
---------- ---------- ----------
Total nonperforming loans 301,099 37,638 338,737
Other real estate owned (OREO) 14,246 22,619 36,865
Other repossessed assets 9,076 5,125 14,201
---------- ---------- ----------
Total nonperforming assets $324,421 $65,382 $389,803
========== ========== ==========
Allowance for loan and lease losses $902,243 $178,438 $1,080,681
========== ========== ==========
</TABLE>
- -------------------------------------------------------------------------------
(1) Includes service charges on deposits, card and other charges and fees.
(2) Includes retail investment services, investment banking income and trading
account profits and commissions.
(3) NCF's FTE adjustments were reduced $4.4 million and $9.1 million from the
second quarter and first six months of 2004, respectively, to conform to
SunTrust methodology.
(4) SunTrust's average nonaccrual and restructured loans are included in the
respective categories to conform to the NCF presentation.
(5) Includes consumer direct and consumer indirect loans.
SUNTRUST BANKS, INC. AND SUBSIDIARIES
CONSOLIDATED DAILY AVERAGE BALANCES - ADJUSTED(1)
APPENDIX C TO THE PRESS RELEASE
(DOLLARS IN MILLIONS)
      -------------------------------------------------------------------------
                            THREE MONTHS ENDED
      -------------------------------------------------------------------------
           JUNE 30                                          MARCH 31
             2005                                             2005
      -------------------------------------------------------------------------

<TABLE>


                                                Average                                                Average
                                               Balances-           Estimated                          Balances-        Estimated
                                                Reported       Reclassification     As Adjusted       Reported     Reclassification
                                               -----------  --------------------  --------------  --------------  ------------------

LOANS:
Real estate 1-4 family                           $26,224.1            $528.8           $26,752.9       $23,435.7        $2,163.4
Real estate construction                           9,196.9            (234.5)            8,962.4         9,621.2          (959.3)
Real estate equity                                12,134.7            (104.4)           12,030.3        11,573.7          (427.1)
Real estate commercial                            12,214.5             827.8            13,042.3         9,537.0         3,386.1
Commercial                                        32,393.4            (762.7)           31,630.7        33,423.9        (3,120.0)
Business credit card                                 213.1                 -               213.1           197.7               -
Consumer - direct                                  5,404.7            (467.7)            4,937.0         6,767.2        (1,913.4)
Consumer - indirect                                8,861.1             197.4             9,058.5         8,384.4           807.6
Nonaccrual and restructured                          324.2              15.3               339.5           275.0            62.7
                                               -------------------------------------------------------------------------------------
    Total loans                                 $106,966.7            $ -             $106,966.7      $103,215.8          $ -
                                               =====================================================================================


DEPOSITS:
Noninterest-bearing deposits                     $24,309.7             $15.0           $24,324.7       $23,723.1           $61.4
NOW accounts                                      17,519.6              (4.6)           17,515.0        17,479.8           (18.8)
Money Market accounts                             25,472.9             205.4            25,678.3        24,767.4           840.2
Savings                                            6,462.4            (215.8)            6,246.6         7,506.9          (882.8)
Consumer time                                     12,122.0            (565.5)           11,556.5        12,324.0        (2,313.4)
Other time                                         7,177.9             565.5             7,743.4         5,166.6         2,313.4
                                               -------------------------------------------------------------------------------------
    Total consumer and commercial deposits        93,064.5                 -            93,064.5        90,967.8             $ -
Brokered deposits                                  9,580.3                 -             9,580.3         6,462.1               -
Foreign deposits                                   6,128.9                 -             6,128.9         6,962.3               -
                                               -------------------------------------------------------------------------------------
    Total deposits                              $108,773.7               $ -          $108,773.7      $104,392.2             $ -
                                               =====================================================================================


                                                                                                 Adjusted
                                                                                 Adjusted       Sequential
                                                                     Adjusted     Growth        Annualized
                                                  As Adjusted         Growth       Rate       Growth Rate(2)
                                                ---------------   -------------  ---------   ---------------

LOANS:
Real estate 1-4 family                             $25,599.1         $1,153.8       4.5 %         18.0 %
Real estate construction                             8,661.9            300.5       3.5           13.9
Real estate equity                                  11,146.6            883.7       7.9           31.7
Real estate commercial                              12,923.1            119.2       0.9            3.7
Commercial                                          30,303.9          1,326.8       4.4           17.5
Business credit card                                   197.7             15.4       7.8           31.2
Consumer - direct                                    4,853.8             83.2       1.7            6.9
Consumer - indirect                                  9,192.0           (133.5)     (1.5)          (5.8)
Nonaccrual and restructured                            337.7              1.8       0.5            2.1
                                              --------------------------------
    Total loans                                   $103,215.8         $3,750.9       3.6           14.5
                                              ================================


DEPOSITS:
Noninterest-bearing deposits                       $23,784.5           $540.2       2.3 %          9.1 %
NOW accounts                                        17,461.0             54.0       0.3            1.2
Money Market accounts                               25,607.6             70.7       0.3            1.1
Savings                                              6,624.1           (377.5)     (5.7)         (22.8)
Consumer time                                       10,010.6          1,545.9      15.4           61.8
Other time                                           7,480.0            263.4       3.5           14.1
                                              --------------------------------
    Total consumer and commercial deposits          90,967.8          2,096.7       2.3            9.2
Brokered deposits                                    6,462.1          3,118.2      48.3          193.0
Foreign deposits                                     6,962.3           (833.4)    (12.0)         (47.9)
                                              --------------------------------
    Total deposits                                $104,392.2         $4,381.5       4.2           16.8
                                              ================================
</TABLE>

- -------------------------------------------------------------------------------

(1)  As a result of the NCF systems conversion on April 22, 2005, SunTrust
     presents consolidated average balances on an adjusted basis for both loans
     and deposits. The Company believes these adjusted measures provide a better
     comparison between reporting periods and are more indicative of true loan
     and deposit fluctuations. The adjustments represent reclassifications due
     to account mapping changes resulting from the systems conversion.

(2)  Multiply percentage change by 4 to calculate sequential annualized change.
     Any sequential annualized change over 100 percent is labeled as "NM". Those
     changes over 100 percent were not considered to be meaningful.
SUNTRUST BANKS, INC. AND SUBSIDIARIES
ESTIMATES OF HISTORICAL COMBINED GROWTH
APPENDIX B TO THE PRESS RELEASE
The 3rd Quarter 2004 and 4th Quarter 2003 figures represent SunTrust and NCF on
a pro forma combined basis. See following page for a reconcilement of these
historical combined amounts.
<TABLE>
--------------------------------------------------------
QUARTER - TO - QUARTER COMPARISON
--------------------------------------------------------
4TH QUARTER 3RD QUARTER INCREASE/(DECREASE)
2004 2004 AMOUNT %
--------------------------------------------------------
STATEMENTS OF INCOME (DOLLARS IN THOUSANDS)
NET INTEREST INCOME $ 1,084,204 $ 1,071,689 $ 12,515 1.2 %
Provision for loan losses 37,099 60,818 (23,719) (39.0)
----------- ----------- -----------
NET INTEREST INCOME AFTER PROVISION
FOR LOAN LOSSES 1,047,105 1,010,871 36,234 3.6
----------- ----------- -----------
NONINTEREST INCOME
Deposit and other fees (1) 356,777 353,573 3,204 0.9
Trust and investment management income 160,526 165,603 (5,077) (3.1)
Broker / dealer revenue (2) 158,888 132,650 26,238 19.8
Other noninterest income 102,189 106,550 (4,361) (4.1)
----------- ----------- -----------
Noninterest income before securities (losses)/gains 778,380 758,376 20,004 2.6
Securities (losses)/gains (19,377) (16,565) (2,812) (17.0)
----------- ----------- -----------
Total noninterest income 759,003 741,811 17,192 2.3
----------- ----------- -----------
NONINTEREST EXPENSE
Personnel expense 612,861 605,325 7,536 1.2
Net occupancy expense 78,218 79,875 (1,657) (2.1)
Outside processing and software 81,368 75,449 5,919 7.8
Equipment expense 50,765 50,904 (139) (0.3)
Marketing and customer development 34,389 34,975 (586) (1.7)
Other noninterest expense 231,231 242,693 (11,462) (4.7)
----------- ----------- -----------
Noninterest expense before amortization of
intangible assets and merger expense 1,088,832 1,089,221 (389) (0.0)
Amortization of intangible assets 31,759 28,132 3,627 12.9
Merger expense 28,401 -- 28,401 100.0
----------- ----------- -----------
Total noninterest expense 1,148,992 1,117,353 31,639 2.8
----------- ----------- -----------
INCOME BEFORE INCOME TAXES 657,116 635,329 21,787 3.4
Provision for income taxes 201,387 198,926 2,461 1.2
----------- ----------- -----------
NET INCOME FROM CONTINUING OPERATIONS 455,729 436,403 19,326 4.4
Income from discontinued operations, net of tax -- -- -- --
----------- ----------- -----------
NET INCOME 455,729 436,403 19,326 4.4
Merger expense, net of tax 18,461 -- 18,461 100.0
----------- ----------- -----------
OPERATING NET INCOME $ 474,190 $ 436,403 $ 37,787 8.7 %
=========== =========== ===========
REVENUE (DOLLARS IN THOUSANDS)
Net interest income $ 1,084,204 $ 1,071,689 $ 12,515 1.2 %
FTE adjustment (3) 16,684 19,063 (2,379) (12.5)
----------- ----------- -----------
Net interest income - FTE 1,100,888 1,090,752 10,136 0.9
Noninterest income 759,003 741,811 17,192 2.3
----------- ----------- -----------
Total revenue 1,859,891 1,832,563 27,328 1.5
Securities losses/(gains) 19,377 16,565 2,812 17.0
----------- ----------- -----------
Total revenue excluding securities gains and losses $ 1,879,268 $ 1,849,128 $ 30,140 1.6 %
=========== =========== ===========
SELECTED AVERAGE BALANCES (DOLLARS IN MILLIONS)
Average Loans (4)
Commercial (5) $ 32,343 $ 31,977 $ 366 1.1 %
Real estate 1-4 family 22,535 21,963 572 2.6
Real estate commercial and construction 18,660 18,155 505 2.8
Real estate equity 11,016 10,295 721 7.0
Consumer (6) 15,390 15,520 (130) (0.8)
Credit cards 193 175 18 10.3
----------- ----------- -----------
Total loans $ 100,137 $ 98,085 $ 2,052 2.1 %
=========== =========== ===========
Average deposits
Noninterest bearing deposits $ 24,182 $ 23,239 $ 943 4.1 %
NOW accounts 16,941 15,335 1,606 10.5
Money market accounts 24,507 24,211 296 1.2
Savings 8,139 9,099 (960) (10.6)
Consumer time 12,084 11,882 202 1.7
Other time 4,748 4,112 636 15.5
----------- ----------- -----------
Total consumer and commercial deposits 90,601 87,878 2,723 3.1
Brokered and foreign deposits 10,671 11,496 (825) (7.2)
----------- ----------- -----------
Total deposits $ 101,272 $ 99,374 $ 1,898 1.9 %
=========== =========== ===========
SELECTED CREDIT DATA (DOLLARS IN THOUSANDS)
Nonaccrual loans $ 354,241 $ 329,340 $ 24,901 7.6 %
Restructured loans 19,049 19,724 (675) (3.4)
----------- ----------- -----------
Total nonperforming loans 373,290 349,064 24,226 6.9
Other real estate owned (OREO) 28,619 27,126 1,493 5.5
Other repossessed assets 8,749 15,082 (6,333) (42.0)
----------- ----------- -----------
Total nonperforming assets $ 410,658 $ 391,272 $ 19,386 5.0 %
=========== =========== ===========
------------------------------------------------------
QUARTER - TO - QUARTER COMPARISON
------------------------------------------------------
4TH QUARTER 4TH QUARTER INCREASE/(DECREASE)
2004 2003 AMOUNT %
------------------------------------------------------
STATEMENTS OF INCOME (DOLLARS IN THOUSANDS)
NET INTEREST INCOME $ 1,084,204 $ 1,060,948 $ 23,256 2.2 %
Provision for loan losses 37,099 82,668 (45,569) (55.1)
----------- ----------- -----------
NET INTEREST INCOME AFTER PROVISION
FOR LOAN LOSSES 1,047,105 978,280 68,825 7.0
----------- ----------- -----------
NONINTEREST INCOME
Deposit and other fees (1) 356,777 323,081 33,696 10.4
Trust and investment management income 160,526 145,856 14,670 10.1
Broker / dealer revenue (2) 158,888 141,677 17,211 12.1
Other noninterest income 102,189 62,324 39,865 64.0
----------- ----------- -----------
Noninterest income before securities (losses)/gains 778,380 672,938 105,442 15.7
Securities (losses)/gains (19,377) 22,839 (42,216) (184.8)
----------- ----------- -----------
Total noninterest income 759,003 695,777 63,226 9.1
----------- ----------- -----------
NONINTEREST EXPENSE
Personnel expense 612,861 591,575 21,286 3.6
Net occupancy expense 78,218 73,766 4,452 6.0
Outside processing and software 81,368 69,871 11,497 16.5
Equipment expense 50,765 52,926 (2,161) (4.1)
Marketing and customer development 34,389 27,574 6,815 24.7
Other noninterest expense 231,231 200,602 30,629 15.3
----------- ----------- -----------
Noninterest expense before amortization of
intangible assets and merger expense 1,088,832 1,016,314 72,518 7.1
Amortization of intangible assets 31,759 30,716 1,043 3.4
Merger expense 28,401 -- 28,401 100.0
----------- ----------- -----------
Total noninterest expense 1,148,992 1,047,030 101,962 9.7
----------- ----------- -----------
INCOME BEFORE INCOME TAXES 657,116 627,027 30,089 4.8
Provision for income taxes 201,387 195,019 6,368 3.3
----------- ----------- -----------
NET INCOME FROM CONTINUING OPERATIONS 455,729 432,008 23,721 5.5
Income from discontinued operations, net of tax -- 767 (767) (100.0)
----------- ----------- -----------
NET INCOME 455,729 432,775 22,954 5.3
Merger expense, net of tax 18,461 -- 18,461 100.0
----------- ----------- -----------
OPERATING NET INCOME $ 474,190 $ 432,775 $ 41,415 9.6 %
=========== =========== ===========
REVENUE (DOLLARS IN THOUSANDS)
Net interest income $ 1,084,204 $ 1,060,948 $ 23,256 2.2 %
FTE adjustment (3) 16,684 14,027 2,657 18.9
----------- ----------- -----------
Net interest income - FTE 1,100,888 1,074,975 25,913 2.4
Noninterest income 759,003 695,777 63,226 9.1
----------- ----------- -----------
Total revenue 1,859,891 1,770,752 89,139 5.0
Securities losses/(gains) 19,377 (22,839) 42,216 184.8
----------- ----------- -----------
Total revenue excluding securities gains and losses $ 1,879,268 $ 1,747,913 $ 131,355 7.5 %
=========== =========== ===========
SELECTED AVERAGE BALANCES (DOLLARS IN MILLIONS)
Average Loans (4)
Commercial (5) $ 32,343 $ 33,344 ($ 1,001) (3.0)%
Real estate 1-4 family 22,535 18,213 4,322 23.7
Real estate commercial and construction 18,660 17,489 1,171 6.7
Real estate equity 11,016 8,350 2,666 31.9
Consumer (6) 15,390 14,812 578 3.9
Credit cards 193 155 38 24.5
----------- ----------- -----------
Total loans $ 100,137 $ 92,363 $ 7,774 8.4 %
=========== =========== ===========
Average deposits
Noninterest bearing deposits $ 24,182 $ 21,141 $ 3,041 14.4 %
NOW accounts 16,941 14,139 2,802 19.8
Money market accounts 24,507 24,304 203 0.8
Savings 8,139 7,982 157 2.0
Consumer time 12,084 12,390 (306) (2.5)
Other time 4,748 3,833 915 23.9
----------- ----------- -----------
Total consumer and commercial deposits 90,601 83,789 6,812 8.1
Brokered and foreign deposits 10,671 12,645 (1,974) (15.6)
----------- ----------- -----------
Total deposits $ 101,272 $ 96,434 $ 4,838 5.0 %
=========== =========== ===========
SELECTED CREDIT DATA (DOLLARS IN THOUSANDS)
Nonaccrual loans $ 354,241 $ 367,276 ($ 13,035) (3.5)%
Restructured loans 19,049 14,782 4,267 28.9
----------- ----------- -----------
Total nonperforming loans 373,290 382,058 (8,768) (2.3)
Other real estate owned (OREO) 28,619 44,654 (16,035) (35.9)
Other repossessed assets 8,749 14,908 (6,159) (41.3)
----------- ----------- -----------
Total nonperforming assets $ 410,658 $ 441,620 ($ 30,962) (7.0)%
=========== =========== ===========
</TABLE>
- --------------------------------------------------------------------------------
(1) Includes service charges on deposits, card and other charges and fees.
(2) Includes retail investment services, investment banking income and trading
account profits and commissions.
(3) NCF's FTE adjustments were reduced $4,001 from the third quarter 2004 and
$4,917 from the fourth quarter of 2003 to conform to SunTrust's
methodology.
(4) SunTrust's average nonaccrual and restructured loans are included in the
respective categories to conform to the NCF presentation.
(5) The pro forma combined 4th quarter 2003 includes $2,243 related to the
consolidation of SunTrust's commercial paper conduit, Three Pillars.
(6) Includes consumer direct and consumer indirect loans.
SUNTRUST BANKS, INC. AND SUBSIDIARIES
SUNTRUST / NCF - SELECTED PRO FORMA FINANCIAL DATA
APPENDIX B TO THE PRESS RELEASE, CONTINUED
<TABLE>
------------------------------------ -------------------------------------
3RD QUARTER 4TH QUARTER
2004 2003
------------------------------------ -------------------------------------
PRO FORMA PRO FORMA
SUNTRUST NCF COMBINED SUNTRUST NCF COMBINED
---------- -------- ---------- ---------- --------- -----------
STATEMENTS OF INCOME (Dollars in thousands)
NET INTEREST INCOME $ 876,874 $194,815 $1,071,689 $ 865,520 $ 195,428 $1,060,948
Provision for loan losses 41,774 19,044 60,818 70,286 12,382 82,668
---------- -------- ---------- ---------- --------- ----------
NET INTEREST INCOME AFTER PROVISION
FOR LOAN LOSSES 835,100 175,771 1,010,871 795,234 183,046 978,280
---------- -------- ---------- ---------- --------- ----------
NONINTEREST INCOME
Deposit and other fees (1) 298,328 55,245 353,573 273,567 49,514 323,081
Trust and investment management income 149,673 15,930 165,603 129,622 16,234 145,856
Broker / dealer revenue (2) 113,308 19,342 132,650 120,117 21,560 141,677
Other noninterest income 84,576 21,974 106,550 41,265 21,059 62,324
---------- -------- ---------- ---------- --------- ----------
Noninterest income before securities (losses)/gains 645,885 112,491 758,376 564,571 108,367 672,938
Securities (losses)/gains (18,193) 1,628 (16,565) 19,501 3,338 22,839
---------- -------- ---------- ---------- --------- ----------
Total noninterest income 627,692 114,119 741,811 584,072 111,705 695,777
---------- -------- ---------- ---------- --------- ----------
NONINTEREST EXPENSE
Personnel expense 527,734 77,591 605,325 516,171 75,404 591,575
Net occupancy expense 66,542 13,333 79,875 60,522 13,244 73,766
Outside processing and software 68,657 6,792 75,449 63,176 6,695 69,871
Equipment expense 43,275 7,629 50,904 45,527 7,399 52,926
Marketing and customer development 32,028 2,947 34,975 24,830 2,744 27,574
Other noninterest expense 176,020 66,673 242,693 158,189 42,413 200,602
---------- -------- ---------- ---------- --------- ----------
Noninterest expense before amortization of
intangible assets 914,256 174,965 1,089,221 868,415 147,899 1,016,314
Amortization of intangible assets 15,593 12,539 28,132 16,379 14,337 30,716
---------- -------- ---------- ---------- --------- ----------
Total noninterest expense 929,849 187,504 1,117,353 884,794 162,236 1,047,030
---------- -------- ---------- ---------- --------- ----------
INCOME BEFORE INCOME TAXES 532,943 102,386 635,329 494,512 132,515 627,027
Provision for income taxes 164,177 34,749 198,926 152,005 43,014 195,019
---------- -------- ---------- ---------- --------- ----------
NET INCOME FROM CONTINUING OPERATIONS 368,766 67,637 436,403 342,507 89,501 432,008
Income from discontinued operations, net of tax -- -- -- -- 767 767
---------- -------- ---------- ---------- --------- ----------
NET INCOME $ 368,766 $ 67,637 $ 436,403 $ 342,507 $ 90,268 $ 432,775
========== ======== ========== ========== ========= ==========
REVENUE (DOLLARS IN THOUSANDS)
Net interest income $ 876,874 $194,815 $1,071,689 $ 865,520 $ 195,428 $1,060,948
FTE adjustment (3) 16,821 2,242 19,063 11,981 2,046 14,027
---------- -------- ---------- ---------- --------- ----------
Net interest income - FTE 893,695 197,057 1,090,752 877,501 197,474 1,074,975
Noninterest income 627,692 114,119 741,811 584,072 111,705 695,777
---------- -------- ---------- ---------- --------- ----------
Total revenue 1,521,387 311,176 1,832,563 1,461,573 309,179 1,770,752
Securities losses/(gains) 18,193 (1,628) 16,565 (19,501) (3,338) (22,839)
---------- -------- ---------- ---------- --------- ----------
Total revenue excluding securities gains and losses $1,539,580 $309,548 $1,849,128 $1,442,072 $ 305,841 $1,747,913
========== ======== ========== ========== ========= ==========
SELECTED AVERAGE BALANCES (DOLLARS IN MILLIONS)
Average Loans (4)
Commercial (5) $ 27,753 $ 4,224 $ 31,977 $ 29,484 $ 3,860 $ 33,344
Real estate 1-4 family 20,798 1,165 21,963 17,218 995 18,213
Real estate commercial and construction 14,231 3,924 18,155 13,713 3,776 17,489
Real estate equity 8,239 2,056 10,295 6,741 1,609 8,350
Consumer (6) 12,574 2,946 15,520 12,074 2,738 14,812
Credit cards 158 17 175 140 15 155
---------- -------- ---------- ---------- --------- ----------
Total loans $ 83,753 $ 14,332 $ 98,085 $ 79,370 $ 12,993 $ 92,363
========== ======== ========== ========== ========= ==========
Average deposits
Noninterest bearing deposits $ 20,490 $ 2,749 $ 23,239 $ 18,586 $ 2,555 $ 21,141
NOW accounts 13,000 2,335 15,335 12,102 2,037 14,139
Money market accounts 22,434 1,777 24,211 22,274 2,030 24,304
Savings 7,425 1,674 9,099 6,249 1,733 7,982
Consumer time 6,967 4,915 11,882 7,601 4,789 12,390
Other time 3,806 306 4,112 3,501 332 3,833
---------- -------- ---------- ---------- --------- ----------
Total consumer and commercial deposits 74,122 13,756 87,878 70,313 13,476 83,789
Brokered and foreign deposits 9,341 2,155 11,496 10,769 1,876 12,645
---------- -------- ---------- ---------- --------- ----------
Total deposits $ 83,463 $ 15,911 $ 99,374 $ 81,082 $ 15,352 $ 96,434
========== ======== ========== ========== ========= ==========
SELECTED CREDIT DATA (DOLLARS IN THOUSANDS)
Nonaccrual loans $ 263,127 $ 66,213 $ 329,340 $ 336,587 $ 30,689 $ 367,276
Restructured loans 19,724 -- 19,724 14,782 -- 14,782
---------- -------- ---------- ---------- --------- ----------
Total nonperforming loans 282,851 66,213 349,064 351,369 30,689 382,058
Other real estate owned (OREO) 10,934 16,192 27,126 16,458 28,196 44,654
Other repossessed assets 10,431 4,651 15,082 10,270 4,638 14,908
---------- -------- ---------- ---------- --------- ----------
Total nonperforming assets $ 304,216 $ 87,056 $ 391,272 $ 378,097 $ 63,523 $ 441,620
========== ======== ========== ========== ========= ==========
</TABLE>
- --------------------------------------------------------------------------------
(1) Includes service charges on deposits, card and other charges and fees.
(2) Includes retail investment services, investment banking income and trading
account profits and commissions.
(3) NCF's FTE adjustments were reduced $4,001 from the third quarter 2004 and
$4,917 from the fourth quarter of 2003 to conform to SunTrust methodology.
(4) SunTrust's average nonaccrual and restructured loans are included in the
respective categories to conform to the NCF presentation.
(5) SunTrust's 4th quarter 2003 includes $2,243 related to the consolidation of
its commercial paper conduit, Three Pillars.
(6) Includes consumer direct and consumer indirect loans.
SUNTRUST BANKS, INC. AND SUBSIDIARIES
RECONCILEMENT OF NON-GAAP MEASURES
APPENDIX A TO THE PRESS RELEASE
<TABLE>
-----------------------------------------------------------------
QUARTER - TO - QUARTER COMPARISON
-----------------------------------------------------------------
4TH QUARTER 3RD QUARTER 2ND QUARTER 1ST QUARTER
2004 2004 2004 2004
-----------------------------------------------------------------
NON-GAAP MEASURES PRESENTED IN THE PRESS RELEASE
(Dollars in thousands)
Net income $455,729 $368,766 $386,571 $361,835
Securities losses/(gains), net of tax 12,595 11,825 5,881 (3,203)
-------------- -------------- -------------- --------------
Net income excluding securities gains and losses 468,324 380,591 392,452 358,632
The Coca-Cola Company dividend, net of tax (10,739) (10,740) (10,739) (10,740)
-------------- -------------- -------------- --------------
Net income excluding securities gains and losses and
The Coca-Cola Company dividend $457,585 $369,851 $381,713 $347,892
============== ============== ============== ==============
Total average assets $156,570,092 $127,127,968 $127,287,458 $123,853,747
Average net unrealized securities gains (2,056,737) (2,054,978) (2,803,917) (2,580,304)
-------------- -------------- -------------- --------------
Average assets less net unrealized securities gains $154,513,355 $125,072,990 $124,483,541 $121,273,443
============== ============== ============== ==============
Total average equity $15,818,968 $9,992,905 $10,194,201 $9,840,282
Average other comprehensive income (1,304,553) (1,318,332) (1,804,833) (1,645,712)
-------------- -------------- -------------- --------------
Total average realized equity $14,514,415 $8,674,573 $8,389,368 $8,194,570
============== ============== ============== ==============
Return on average total assets 1.16% 1.15% 1.22% 1.18%
Impact of excluding net realized and unrealized securities
gains/losses and The Coca-Cola Company dividend 0.02 0.03 0.01 (0.03)
-------------- -------------- -------------- --------------
Return on average total assets less net realized and unrealized
securities gains/1osses. and The Coca-Cola Company dividend (1) 1.18% 1.18% 1.23% 1.15%
============== ============== ============== ==============
Return on average total shareholders' equity 11.46% 14.68% 15.25% 14.79%
Impact of excluding net unrealized securities gains 1.08 2.28 3.05 2.28
-------------- -------------- -------------- --------------
Return on average realized shareholders' equity (2) 12.54% 16.96% 18.30% 17.07%
============== ============== ============== ==============
Net interest income $1,084,204 $876,874 $872,429 $851,648
FTE adjustment 16,684 16,821 12,637 12,256
-------------- -------------- -------------- --------------
Net interest income - FTE 1,100,888 893,695 885,066 863,904
Noninterest income 759,003 627,692 622,665 595,086
-------------- -------------- -------------- --------------
Total revenue 1,859,891 1,521,387 1,507,731 1,458,990
Securities losses/(gains) 19,377 18,193 9,048 (4,927)
-------------- -------------- -------------- --------------
Total revenue excluding securities gains and losses $1,879,268 $1,539,580 $1,516,779 $1,454,063
============== ============== ============== ==============
-------------------------------------------------------------------
QUARTER - TO - QUARTER COMPARISON YTD COMPARISON
-------------------------------------------------------------------
4TH QUARTER DECEMBER 31
2003 2004 2003
-------------------------------------------------------------------
NON-GAAP MEASURES PRESENTED IN THE PRESS RELEASE
(Dollars in thousands)
Net income $342,507 $1,572,901 $1,332,297
Securities losses/(gains), net of tax (12,676) 27,099 (80,519)
--------------- --------------- --------------
Net income excluding securities gains and losses 329,831 1,600,000 1,251,778
The Coca-Cola Company dividend, net of tax (9,451) (42,957) (37,803)
--------------- --------------- --------------
Net income excluding securities gains and losses and
The Coca-Cola Company dividend $320,380 $1,557,043 $1,213,975
=============== =============== ==============
Total average assets $124,756,099 $133,754,293 $122,325,361
Average net unrealized securities gains (2,363,948) (2,372,246) (2,343,015)
--------------- --------------- --------------
Average assets less net unrealized securities gains $122,392,151 $131,382,047 $119,982,346
=============== =============== ==============
Total average equity $9,435,794 $11,469,482 $9,083,026
Average other comprehensive income (1,503,355) (1,517,227) (1,486,125)
--------------- --------------- --------------
Total average realized equity $7,932,439 $9,952,255 $7,596,901
=============== =============== ==============
Return on average total assets 1.09% 1.18% 1.09%
Impact of excluding net realized and unrealized securities
gains/losses and The Coca-Cola Company dividend (0.05) 0.01 (0.08)
--------------- --------------- --------------
Return on average total assets less net realized and unrealized
securities gains/1osses. and The Coca-Cola Company dividend (1) 1.04% 1.19% 1.01%
=============== =============== ==============
Return on average total shareholders' equity 14.40% 13.71% 14.67%
Impact of excluding net unrealized securities gains 1.62 1.94 1.31
--------------- --------------- --------------
Return on average realized shareholders' equity (2) 16.02% 15.65% 15.98%
=============== =============== ==============
Net interest income $865,520 $3,685,155 $3,320,303
FTE adjustment 11,981 58,398 45,014
--------------- --------------- --------------
Net interest income - FTE 877,501 3,743,553 3,365,317
Noninterest income 584,072 2,604,446 2,303,001
--------------- --------------- --------------
Total revenue 1,461,573 6,347,999 5,668,318
Securities losses/(gains) (19,501) 41,691 (123,876)
--------------- --------------- --------------
Total revenue excluding securities gains and losses $1,442,072 $6,389,690 $5,544,442
=============== =============== ==============
</TABLE>
<TABLE>
-----------------------------------------
4TH QUARTER YTD
DECEMBER 31
2004 2004
-----------------------------------------
SELECTED NON-GAAP OPERATING MEASURES PRESENTED IN THE PRESS RELEASE (3)
- -----------------------------------------------------------------------
(Dollars in thousands)
Net income $455,729 $1,572,901
Merger expense, net of tax 18,461 18,461
------------------- -------------------
Operating net income 474,190 1,591,362
Securities losses/(gains), net of tax 12,595 27,099
The Coca-Cola Company dividend, net of tax (10,739) (42,957)
------------------- -------------------
Operating net income excluding securities gains/
losses and The Coca-Cola Company dividend $476,046 $1,575,504
=================== ===================
Noninterest expense $1,148,992 $3,897,038
Merger expense (28,401) (28,401)
------------------- -------------------
Noninterest expense excluding merger expense $1,120,591 $3,868,637
=================== ===================
Return on average total assets 1.16 % 1.18 %
Impact of excluding merger expense 0.04 0.01
------------------- -------------------
Operating return on average total assets (4) 1.20 % 1.19 %
=================== ===================
Return on average total shareholders' equity 11.46 % 13.71 %
Impact of excluding merger expense 0.47 0.16
------------------- -------------------
Operating return on average total shareholders' equity (5) 11.93 % 13.87 %
=================== ===================
Efficiency ratio 61.78 % 61.39 %
Impact of excluding merger expense (1.53) (0.45)
------------------- -------------------
Operating efficiency ratio 60.25 % 60.94 %
=================== ===================
Diluted earnings per share $1.26 $5.19
Impact of excluding merger expense 0.05 0.06
------------------- -------------------
Operating diluted earnings per share $1.31 $5.25
=================== ===================
</TABLE>
- --------------------------------------------------------------------------------
(1) Computed by dividing annualized net income, excluding securities
gains/losses and The Coca-Cola Company dividend, by average assets less net
unrealized securities gains.
(2) Computed by dividing annualized net income, excluding securities
gains/losses and The Coca-Cola Company dividend, by average realized
shareholders' equity.
(3) SunTrust presents selected financial data on an operating basis that
excludes merger charges. The Company believes the exclusion of the merger
charges, which represent incremental costs to integrate NCF's operations,
is more reflective of normalized operations.
(4) Computed by dividing annualized operating net income by average total
assets.
(5) Computed by dividing annualized operating net income by average total
shareholders' equity.