2005 LOB Accomplishments
Increased product specialists
Debt Capital Markets Revenue = $229MM, up
$52MM or30%
Corporate Banking’s twelve month trailingRAROC
has increased 1.7%
Corporate and Investment Banking
Results1
Key Initiatives
1 Includes only legacy SunTrust data for the first nine months of 2005 as compared to the first nine months of 2004
Drive the cross-sell of Capital
Markets products to the Commercial
and Wealth & Investment
Management LOBs
Invest in Debt Capital Markets
product capabilities, both new and
existing
Focused initiative to enhance risk
adjusted returnsof corporate
clients
Deliver‘best in class’ credit
performance
Capital Markets Revenue cross-sold to the
Commercial and Wealth & Investment Management
LOB’s = $60MM, up $27MM or84%
Corporate Banking total new business revenue up
19%
Criticized loans = $205.3MM,down $93.8MM or
31%. Represents 1.3% of total loans
Non-accrual loans = $31.1MM,down $32.2MM or
51%. Represents 0.2% of total loans
8
2005 LOB Accomplishments
Results1
Wealth and Investment Management
Key Initiatives
1 Includes only legacy SunTrust data for the first nine months of 2005 as compared to the first nine months of 2004
Rolled out and implemented new client
management operating model in Private
Wealth Management
Continue to ensure ourofferings of
products and services exceeds those of
ourcompetitors
Implemented initiatives whichincreased
penetration into existing STI client base
Integrated NCF and First Mercantile into
business units,expanding opportunities
for cross selling
Loans up13%
Deposits up18%
Institutional new trust business up56%
Capital Markets referral $ up175%
Discretionary assets under management
increased12%9/30/05 over 9/30/04
Brokerage assets increased20%9/30/05
over 9/30/04
Personal Trust retention improved by14%
9
2005 LOB Accomplishments
Key Initiatives
Results1
Total booked products up69%, an
increase of 28,000 products sold over
the same period in 2004
Mortgage
1 Includes only legacy SunTrust data for the first nine months of 2005 as compared to the first nine months of 2004
Grow Market Share
Grow purchase originations faster
than peer average
Increasedthe size of the mortgage
sales force
Opened 30 new offices toexpand
national footprint to 157 total
Retail offices and 17 total
Wholesale offices
Strongemphasis on Mortgage
cross-sell program
Focused on home equity,
deposit, credit/debit card and
other consumer products
Over $51 billion in total applications, up
44% over the same period in 2004
Nearly $31 billion in purchase
applications, up49%
Over $32 billion in total closings, up46%
Over $19 billion in purchase closings,
up51%
10
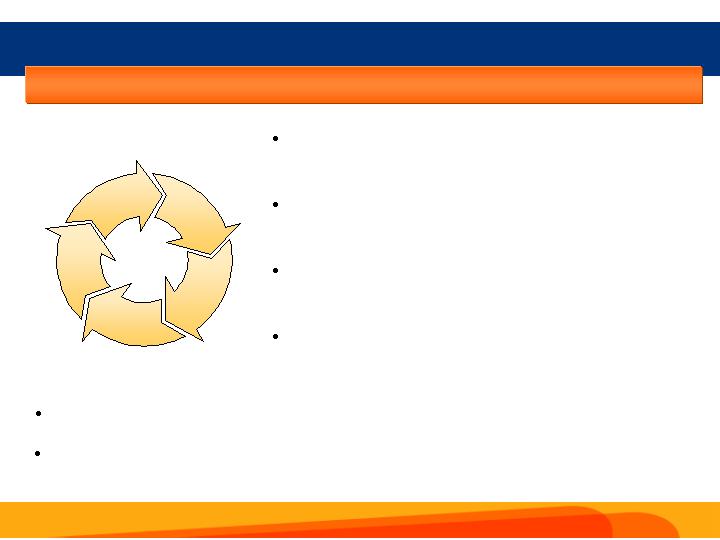
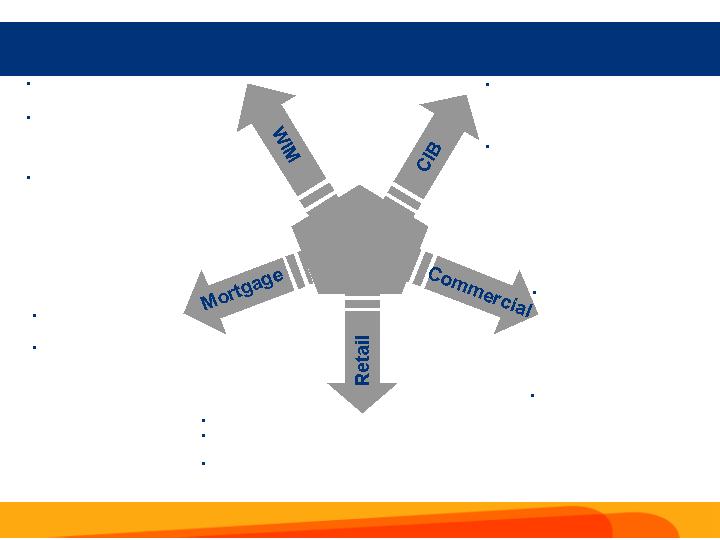
360o Relationship Focus
Cross-LOB Referrals Driving Revenue Growth
1STI legacy only vs September YTD last year
2 Includes NCF
Commercialgenerated$46 million in Capital Markets fees – up 74%2
CIB
Wlth
and
Invest.
Man.
Retail
Cmml
Mortgage
SunTrust
Customer
September 2005 YTD
Retail referred$2.7 billion in closed
Mortgages – up over 51%1
Retail made 59,000 qualified referrals to
Wealth and Investment Management1
Wealth and Investment Management
made 21,000 referrals to Retail2
Commercialproduced$3.1 million in
fees to Institutional Wealth and
Investment Management - up 41%2
Over 67,000 total products sold byMortgage – up 69%1
11

New Personal Checking Sales
New Business Checking Sales
New Direct Home Equity Production
New Business Banking Loan Production
Deposit Outstandings
Loan Outstandings
Capital Market Fees
Debt Capital Markets Revenue
CIB New Business Revenue
Institutional New Trust Business
Deposit Outstandings
Loan Outstandings
Purchase Mortgage Closings
# of Total Products Cross-Sold
New Check Cards
New Deposit Accounts
% Increase
Retail
SunTrust Call
Center
Wealth &
Investment
Management
CIB
Mortgage
2005 YTD Sales Results1
Commercial
15%
55%
29%
33%
11%
9%
79%
30%
19%
56%
18%
13%
51%
62%
44%
61%
1 Includes only legacy SunTrust data for the first nine months of 2005 as compared to the first nine months of 2004 (checking sales include both STI and NCF)
12

98,085
100,137
103,216
106,967
110,818
87,878
90,601
90,968
93,065
94,076
$0
$20,000
$40,000
$60,000
$80,000
$100,000
$120,000
3Q 04
4Q 04
1Q 05
2Q 05
3Q 05
Average Loans: 13% YOY Growth
Average Deposits: 7% YOY Growth
1 Deposits = Consumer and Commercial Deposits
2 3Q 04 is reported on an estimated historical combined basis
Loan and Deposit Growth1
($ in millions)
2
13
3.12%
2.98%
3.09%
3.13%
3.13%
3.11%
3.12%
3.21%
3.16%
1.5%
1.7%
1.9%
2.1%
2.3%
2.5%
2.7%
2.9%
3.1%
3.3%
3.5%
3Q 03
4Q 03
1Q 04
2Q 04
3Q 04
4Q 04
1Q 05
2Q 05
3Q 05
3.25%
1
1NCF added 9 b.p., organic margin improved 1 b.p. from 3Q 04.
2
3.21%
2 Day count added 4 b.p., organic margin was flat from 4Q 04.
14.
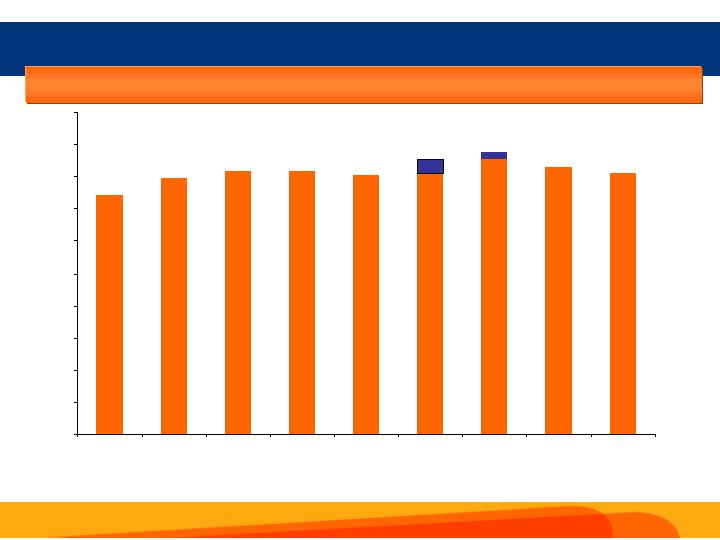
Net Interest Margin Trend
Net interest margin has been relatively stable to improving over a two-year horizon
14
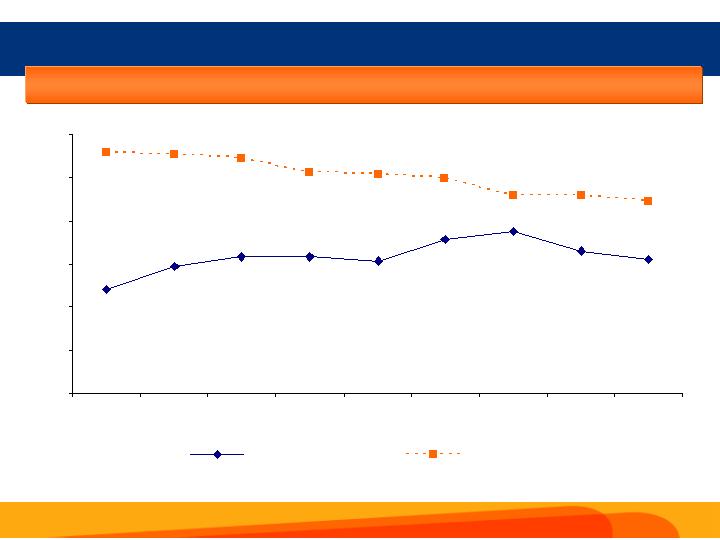
Net Interest Margin Compared to Peers
*
Source: SNL Financial
Stable to improving NIM over the two-year horizon has brought SunTrust closer to the peer group
average
2.50
2.70
2.90
3.10
3.30
3.50
3.70
3Q 03
4Q 03
1Q 04
2Q 04
3Q 04
4Q 04
1Q 05
2Q 05
3Q 05
SunTrust
Peer Average*
Peers include Amsouth, Bank of America, BB&T, Comerica, Fifth Third, First Horizon, Keycorp, M&T Bank, Mellon, National City, Northern Trust, PNC,
Regions, US Bancorp, Wachovia and Wells Fargo. Numbers presented for peers are averages
15
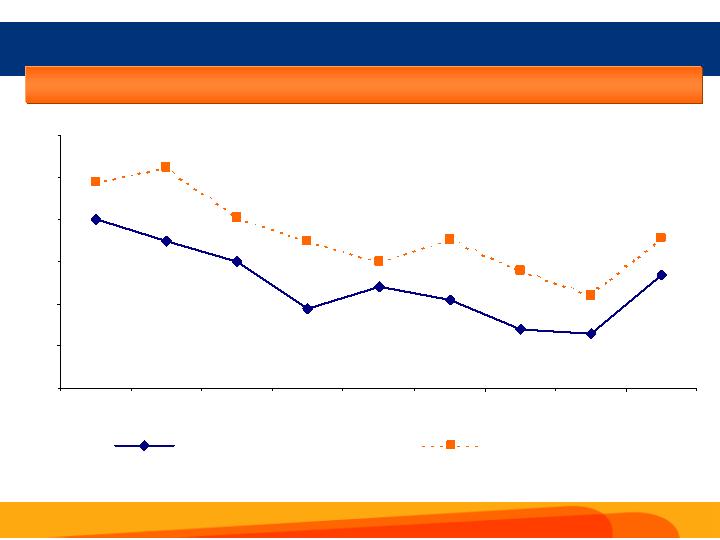
NCOs/Average Loans Compared to Peers
*
Source: SNL Financial
Net charge-offs continue to compare favorably vs. peer group average
3Q 03
4Q 03
1Q 04
2Q 04
3Q 04
4Q 04
1Q 05
2Q 05
3Q 05
0.00
0.10
0.20
0.30
0.40
0.50
0.60
SunTrust Banks, Inc.
Peer Average*
Peers include AmSouth, Bank of America, BB&T, Comerica, Fifth Third, First Horizon, Keycorp, M&T Bank, Mellon, National City, Northern Trust, PNC,
Regions, US Bancorp, Wachovia and Wells Fargo. Numbers presented for peers are averages
16

Trust and Investment Mgmt.
Broker Dealer Revenue
Deposits and Other Fees
Other Noninterest Income
Noninterest Income
($ in millions)
$168,802
147,184
368,613
146,360
$830,959
$167,503
138,149
357,545
107,739
$770,936
$1,299
9,035
11,068
38,621
$60,023
3.1%
26.2%
12.4%
143.2%
31.1%
3Q 2005
Growth
2Q 2005
Sequential
Annualized
Growth Rate
0.8%
6.5%
3.1%
35.8%
7.8%
Growth
Rate
Noninterest Income excludes securities (losses)/gains and net gain on sale of RCM assets.
1
2
Increase in other noninterest income mainly attributable to mortgage production income.
Total noninterest income increased 31% on a sequential annualized basis
Fee Income Growth
1
2
17

Based on estimated historical combined numbers
Improvement in Operating Leverage
Expense Growth
Revenue Growth
Core Revenue Growth
6%
flat
7
2
Sequential Annualized Growth Trends
5%
(4)
(2)
3
Concerted effort to improve operating leverage is paying off
1Q 05
4Q 04
6%
4
10
2Q 05
1
20%
8
20
3Q 05
SunTrust presents total revenue excluding realized securities gains/losses (and the net gain on sale of RCM assets for 1Q 05); the Company
believes total revenue without securities gains/losses and without the net gain on sale of RCM assets is more indicative of the Company’s
performance because this isolates income that is primarily customer relationship and customer transaction driven
Expense growth excludes merger related expenses and amortization of intangibles (and impairment charge on Affordable Housing Properties in
3Q 05)
1
2
3
18
1 Excluding merger related expenses (and the impact of net gain on sale of RCM assets for 1Q 05.
1
1
1
1
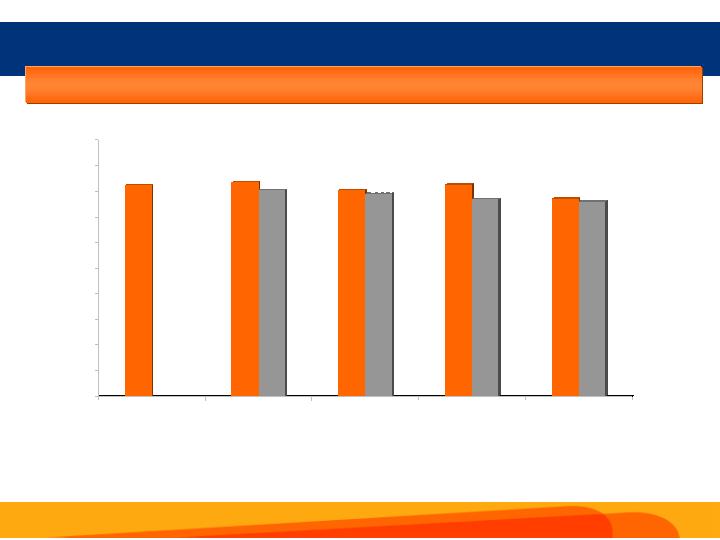
Focus on Efficiency
Positive operating leverage driving operating efficiency ratio improvement
61.12
61.78
60.25
60.22
59.48
61.30
58.46
58.62
58.01
20
25
30
35
40
45
50
55
60
65
70
3Q 04
4Q 04
1Q 05
2Q 05
3Q 05
19
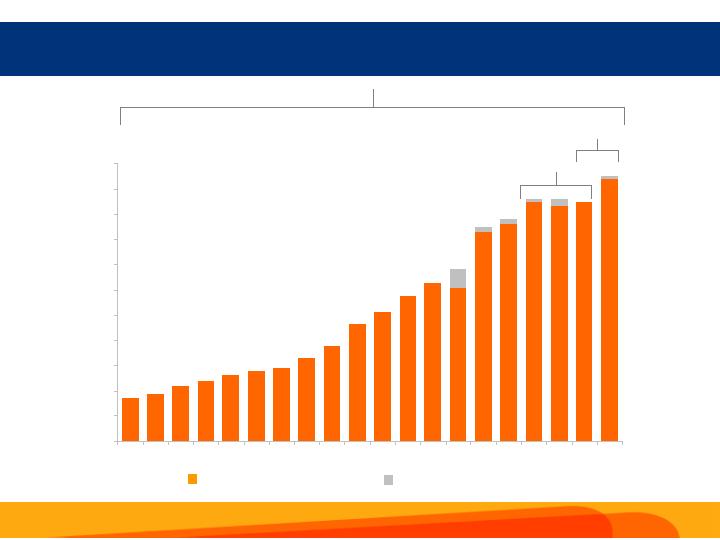
EPS Growth Back on Track in 2004
4.73
5.19
0.06
4.66
4.72
4.30
4.13
3.04
3.13
2.87
2.56
2.32
1.89
1.64
1.45
1.38
1.31
1.19
1.09
.93
.84
0.09
0.10
0.37
0.14
0.07
$0.00
$0.50
$1.00
$1.50
$2.00
$2.50
$3.00
$3.50
$4.00
$4.50
$5.00
$5.50
1985
1986
1987
1988
1989
1990
1991
1992
1993
1994
1995
1996
1997
1998
1999
2000
2001
2002
2003
2004
EPS1
1EPS as originally reported and adjusted for stock splits. There are no adjustments for merger pooling
2 CAGR and growth based on GAAP EPS excluding merger-related charges
GAAP EPS
Reduction in EPS due to merger-related charges
CAGR2 = 10.1%
CAGR2 = (0.6)%
Growth2 = 11.0%
20
Improving Operating EPS Trends1
Strong operating trends translating into quarterly EPS growth despite fluctuating provision
expense trends
1 Operating EPS excludes the after-tax impact of merger expenses. Reconcilement of reported EPS to operating EPS is contained in the appendix
1.18
1.21
1.28
1.36
1.30
1.31
1.40
1.37
1.42
1.00
1.05
1.10
1.15
1.20
1.25
1.30
1.35
1.40
3Q 03
4Q 03
1Q 04
2Q 04
3Q 04
4Q 04
1Q 05
2Q 05
3Q 05
21
Line of Business Goals
GOALS
Aggressivelyexpand and retain
share of emerging wealth segments
Integrate successful private
banking units into private
wealth management for a more
comprehensive approach
Integrate Alexander Key and SunTrust
Securities into SunTrust Investment
Services to leverage broker
platformand achieve efficiencies
Partner with Retail to
improve penetration
Continue tostrengthen
product offeringsand
distribution
capabilities
Leverage merger tocapture market share
Grow branch network,emphasis on in-store
opportunities
Improvepartnership between business banking and other
LOBs to ensure proper client segmentation, enhance
service and improve retention
Continue toenhance capital
markets sales into Commercial
and Wealth & Investment
Management client base
Invest indeveloping new and
existing Debt Capital Market
product capabilities
Make significant investments
in Treasury Management
products, sales and
service tocapture
emerging opportunities
in the payments
business
Capitalize on opportunities in
legacy NCF footprint to
grow diversified
commercial, auto dealer,
middle market and
institutional/government
segments
22
Long Term Growth Initiatives
8
-
10%
SunTrust
8
-
10%
8
-
10%
9
-
11%
12
-
14%
8
-
10%
Retail
Commercial
Corporate and Investment
Banking
Wealth & Investment
Management
Mortgage
Long Term Growth
Rate Target
Business Line
8
-
10%
SunTrust
8
-
10%
8
-
10%
9
-
11%
12
-
14%
8
-
10%
Retail
Commercial
Corporate and Investment
Banking
Wealth & Investment
Management
Mortgage
Long Term Growth
Rate Target
Business Line
23

NCF Merger on Track
SunTrust announced theNational Commerce Financial merger in May 2004, the transaction
was completed on Oct. 1, 2004 - systems successfully converted and enhanced product
capabilities in place
Cost saves are ahead of the original estimateof $76MM; now projecting $97MM for 2005,
one-time merger expensesare on trackto be $121MM, $4 MM better than the original
estimate
Key components of our sales organization are in place – sales leadership model, weekly
sales meetings, sales training, sales and referral goals, incentives and recognition
Customer retention remains atop priority
115,000 client calls completed by relationship managers across the footprint
Reached100% of key customers – Retail, Wealth & Investment Management,
Commercial and Treasury Management
Companywide retention metricsare being tracked monthly
Based on third party research, retention results to date indicate the Company isexceeding
prior average industry merger experience
24
SunTrust Today
Ourfoundation is firmlyin place:
Fully functioning operating model with clear allocation of responsibilities
Key components of sales organization in place: weekly sales meetings,
sales and referral goals and linked incentives
We haveclear strategy andfocused initiatives to drive performance:
Deliver “Big Bank” capabilities with local decision making and
responsiveness
Focus on customer acquisition and retention
Drive cross-LOB referrals
Keyinitiatives are generatingtangible results
Capitalizing on opportunitiesprovided by theNational Commerce
Financial merger
25

APPENDIX
26

Average Loan Growth
Mortgages
RE Construction
RE Equity
RE Commercial
Commercial
Business Credit Card
Consumer - Direct
Consumer - Indirect
Nonaccrual
Total Loans
2Q 2005
As Adjusted
($ in millions)
$1,497.6
553.3
618.3
(170.3)
971.0
10.4
236.0
121.3
14.1
$3,851.7
$26,752.9
8,962.4
12,030.3
13,042.3
31,630.7
213.1
4,937.0
9,058.5
339.5
$106,966.7
$28,250.5
9,515.7
12,648.6
12,872.0
32,601.7
223.5
5,173.0
9,179.8
353.6
$110,818.4
3Q 2005
22.4%
24.7%
20.6%
(5.2)%
12.3%
19.5%
19.1%
5.4%
16.6%
14.4%
1 As a result of the NCF systems conversion on April 22, 2005, SunTrust presents consolidated average balances on an adjusted basis for both loans and deposits.
The Company believes these adjusted measures provide a better comparison between reporting periods and are more indicative of true loan and deposit
fluctuations. The adjustments represent reclassifications due to account mapping changes resulting from the systems conversion.
Adjusted
Growth
Adjusted
Sequential
Annualized
Growth Rate
5.6%
6.2%
5.1%
(1.3)%
3.1%
4.9%
4.8%
1.3%
4.2%
3.6%
Adjusted
Growth Rate
1
Driven by targeted sales initiatives
27

Average Consumer and Commercial Deposit Growth
DDA
NOW
MMA
Savings
Consumer Time
Other Time
Total Consumer and
Commercial Deposits
2Q 2005
As Adjusted
($ in millions)
$196.7
(661.9)
621.4
(381.5)
862.8
373.7
$1,011.2
$24,324.7
17,515.0
25,678.3
6,246.6
11,556.5
7,743.4
$93,064.5
$24,521.4
16,853.1
26,299.7
5,865.1
12,419.3
8,117.1
$94,075.7
3Q 2005
3.2%
(15.1)%
9.7%
(24.4)%
29.9%
19.3%
4.3%
1As a result of the NCF systems conversion on April 22, 2005, SunTrust presents consolidated average balances on an adjusted basis for both loans and deposits.
The Company believes these adjusted measures provide a better comparison between reporting periods and are more indicative of true loan and deposit
fluctuations. The adjustments represent reclassifications due to account mapping changes resulting from the systems conversion.
Adjusted
Growth
Adjusted
Sequential
Annualized
Growth Rate
0.8%
(3.8)%
2.4%
(6.1)%
7.5%
4.8%
1.1%
Adjusted
Growth Rate
1
Driven by targeted sales initiatives
28
Strong Credit Quality
Net Charge-offs
Net Charge-offs to Avg.
Loans
NPAs
NPAs to
Loans/OREO/Other repo
Allowance for loan
losses
Allowance to Non-
performing loans
Allowance to Charge-
offs (Years Coverage)
3Q 2004
4Q 2004
3Q 2005
$76,711
0.27%
$362,737
0.32%
$1,029,855
312.4%
3.4
$51,043
0.24%
$304,216
0.36%
$892,974
315.7%
4.4
$53,893
0.21%
$410,658
0.40%
$1,050,024
281.3%
4.9
$35,384
0.13%
$380,303
0.35%
$1,036,173
296.7%
7.4
2Q 2005
($ in thousands)
1Q 2005
$36,834
0.14%
$392,345
0.37%
$1,023,746
286.7%
7.0
Excluding the effect of the Delta Airlines charge-off, credit quality trends continue to be better
than historical average
29