1 Based on estimated historical combined numbers
2SunTrust presents total revenue excluding realized securities gains/losses (and the net gain on sale of RCM assets for 1Q 05); the Company
believes total revenue without securities gains/losses and without the net gain on sale of RCM assets is more indicative of the Company's
performance because this isolates income that is primarily customer relationship and customer transaction driven
3Expense growth excludes merger related expenses and amortization of intangibles (and impairment charge on Affordable Housing Properties
in 3Q 05)
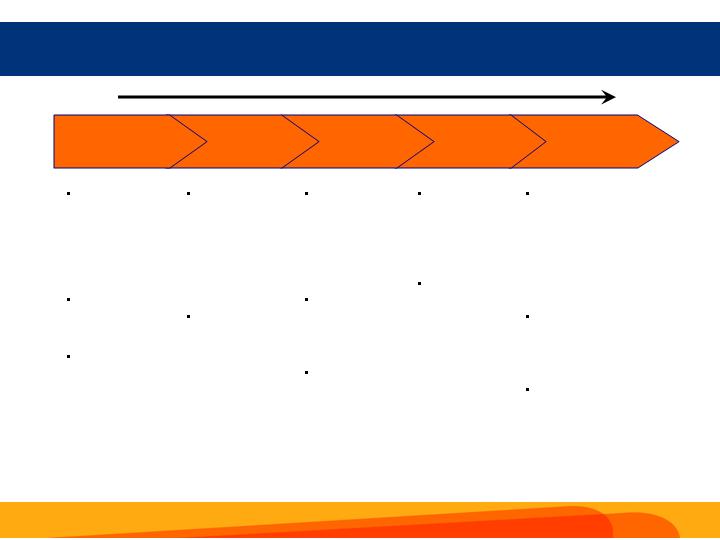
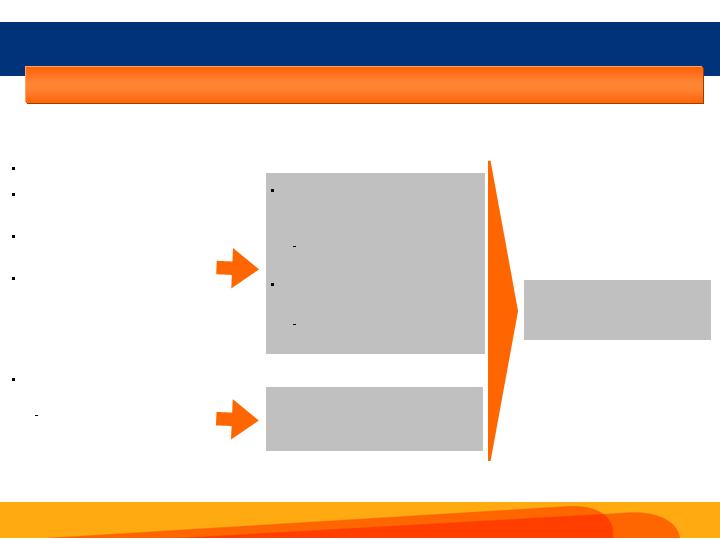
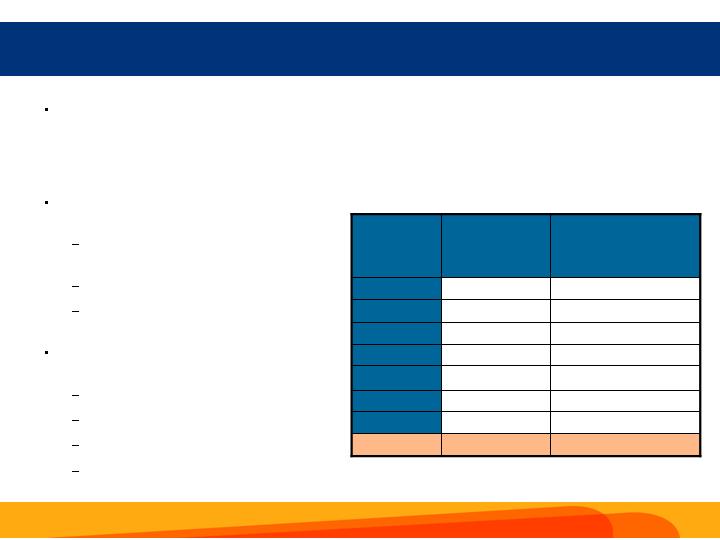
Improvement in Operating Leverage
Expense Growth
Revenue Growth
Core Revenue Growth
6%
flat
7
2
Sequential Annualized Growth Trends
5%
(4)
(2)
3
Concerted effort to improve operating leverage is paying off
1Q 05
4Q 04
6%
4
10
2Q 05
1
20%
8
20
3Q 05
29
SUNTRUST BANKS, INC. AND SUBSIDIARIES
RECONCILEMENT OF NON-GAAP MEASURES
APPENDIX A
(DOLLARS IN THOUSANDS)
- --------------------------------------------------------------------------------
THREE MONTHS ENDED
---------------------------------------------------------------------------
SEPTEMBER 30 JUNE 30 MARCH 31 DECEMBER 31 SEPTEMBER 30
2005 2005 2005 2004 2004
------------ ------------ ------------ ------------ ------------
NON-GAAP MEASURES PRESENTED
- ---------------------------
Net income $510,774 $465,700 $492,294 $455,729 $368,766
Securities losses, net 1,283 17 3,509 12,595 11,825
------------ ------------ ------------ ------------ ------------
Net income excluding securities gains and losses 512,057 465,717 495,803 468,324 380,591
The Coca-Cola Company dividend, net of tax (12,028) (12,027) (12,028) (10,739) (10,740)
------------ ------------ ------------ ------------ ------------
Net income excluding securities gains and
losses and The Coca-Cola Company dividend $500,029 $453,690 $483,775 $457,585 $369,851
============ ============ ============ ============ ============
Total average assets $169,933,960 $165,253,589 $161,218,222 $156,570,092 $127,127,968
Average net unrealized securities gains (2,102,257) (1,791,566) (2,032,787) (2,056,737) (2,054,978)
------------ ------------ ------------ ------------ ------------
Average assets less net unrealized securities gains $167,831,703 $163,462,023 $159,185,435 $154,513,355 $125,072,990
============ ============ ============ ============ ============
Total average equity $16,822,919 $16,275,567 $16,119,430 $15,818,968 $9,992,905
Average accumulated other comprehensive income (1,331,103) (1,139,477) (1,285,278) (1,304,553) (1,318,332)
------------ ------------ ------------ ------------ ------------
Total average realized equity $15,491,816 $15,136,090 $14,834,152 $14,514,415 $8,674,573
============ ============ ============ ============ ============
Return on average total assets 1.19% 1.13% 1.24% 1.16% 1.15%
Impact of excluding net realized and unrealized
securities gains/losses and The Coca-Cola Company
dividend (0.01) (0.02) (0.01) 0.02 0.03
------------ ------------ ------------ ------------ ------------
Return on average total assets less net unrealized
securities gains(1) 1.18% 1.11% 1.23% 1.18% 1.18%
============ ============ ============ ============ ============
Return on average total shareholders' equity 12.05% 11.48% 12.39% 11.46% 14.68%
Impact of excluding net realized and unrealized
securities gains/losses and The Coca-Cola Company
dividend 0.76 0.54 0.84 1.08 2.28
------------ ------------ ------------ ------------ ------------
Return on average realized shareholders' equity(2) 12.81% 12.02% 13.23% 12.54% 16.96%
============ ============ ============ ============ ============
Noninterest income $832,398 $770,909 $753,814 $759,003 $627,692
Securities losses, net 2,069 27 5,659 19,377 18,193
Gain on sale of RCM assets, net of related expenses (3,508) - (19,874) - -
------------ ------------ ------------ ------------ ------------
Total noninterest income excluding securities gains
and losses and net gain on sale of RCM assets(3) $830,959 $770,936 $739,599 $778,380 $645,885
============ ============ ============ ============ ============
Net interest income $1,156,661 $1,123,709 $1,111,560 $1,084,204 $876,874
FTE adjustment 19,081 18,720 17,666 16,684 16,821
------------ ------------ ------------ ------------ ------------
Net interest income - FTE 1,175,742 1,142,429 1,129,226 1,100,888 893,695
Noninterest income 832,398 770,909 753,814 759,003 627,692
------------ ------------ ------------ ------------ ------------
Total revenue 2,008,140 1,913,338 1,883,040 1,859,891 1,521,387
Securities losses, net 2,069 27 5,659 19,377 18,193
Gain on sale of RCM assets, net of related expenses (3,508) - (19,874) - -
------------ ------------ ------------ ------------ ------------
Total revenue excluding securities gains and losses
and net gain on sale of RCM assets(3) $2,006,701 $1,913,365 $1,868,825 $1,879,268 $1,539,580
============ ============ ============ ============ ============
NINE MONTHS ENDED
---------------------------------
SEPTEMBER 30
---------------------------------
2005 2004
------------ ------------
NON-GAAP MEASURES PRESENTED
- ---------------------------
Net income $1,468,768 $1,117,172
Securities losses, net 4,808 14,504
------------ ------------
Net income excluding securities gains and losses 1,473,576 1,131,676
The Coca-Cola Company dividend, net of tax (36,083) (32,218)
------------ ------------
Net income excluding securities gains and
losses and The Coca-Cola Company dividend $1,437,493 $1,099,459
============ ============
Total average assets $165,500,517 $126,093,513
Average net unrealized securities gains (1,975,791) (2,478,183)
------------ ------------
Average assets less net unrealized securities gains $163,524,726 $123,615,330
============ ============
Total average equity $16,408,550 $10,009,069
Average accumulated other comprehensive income (1,252,121) (1,588,635)
------------ ------------
Total average realized equity $15,156,429 $8,420,434
============ ============
Return on average total assets 1.19% 1.18%
Impact of excluding net realized and unrealized
securities gains/losses and The Coca-Cola Company
dividend (0.01) 0.01
------------ ------------
Return on average total assets less net unrealized
securities gains(1) 1.18% 1.19%
============ ============
Return on average total shareholders' equity 11.97% 14.91%
Impact of excluding net realized and unrealized
securities gains/losses and The Coca-Cola Company
dividend 0.71 2.53
------------ ------------
Return on average realized shareholders' equity(2) 12.68% 17.44%
============ ============
Noninterest income $2,357,121 $1,845,443
Securities losses, net 7,755 22,314
Gain on sale of RCM assets, net of related expenses (23,382) -
------------ ------------
Total noninterest income excluding securities gains
and losses and net gain on sale of RCM assets(3) $2,341,494 $1,867,757
============ ============
Net interest income $3,391,930 $2,600,951
FTE adjustment 55,467 41,714
------------ ------------
Net interest income - FTE 3,447,397 2,642,665
Noninterest income 2,357,121 1,845,443
------------ ------------
Total revenue 5,804,518 4,488,108
Securities losses, net 7,755 22,314
Gain on sale of RCM assets, net of related expenses (23,382) -
------------ ------------
Total revenue excluding securities gains and losses
and net gain on sale of RCM assets(3) $5,788,891 $4,510,422
============ ============
----------------------------------------------------------------------------------------------
THREE MONTHS ENDED
----------------------------------------------------------------------------------------------
SEPTEMBER 30 JUNE 30 %(4) SEPTEMBER 30 SEPTEMBER 30 %
2005 2005 CHANGE 2005 2004 CHANGE
-------------- -------------- -------------- -------------- -------------- --------------
AVERAGE LOW COST CONSUMER AND COMMERCIAL DEPOSIT RECONCILEMENT
- --------------------------------------------------------------
Noninterest bearing deposits $24,521,452 $24,309,721 0.9 $24,521,452 $20,490,191 19.7
NOW accounts 16,853,139 17,519,608 (3.8) 16,853,139 12,999,444 29.6
Savings 5,865,099 6,462,425 (9.2) 5,865,099 7,424,698 (21.0)
-------------- -------------- -------------- --------------
Total average low cost consumer and
commercial deposits $47,239,690 $48,291,754 (2.2) $47,239,690 $40,914,333 15.5
============== ============== ============== ==============
- --------------------------------------------------------------------------------
(1) SunTrust presents a return on average assets less net unrealized gains on
securities. The foregoing numbers reflect primarily adjustments to remove
the effects of the Company's securities portfolio which includes the
ownership by the Company of 48.3 million shares of The Coca-Cola Company.
The Company uses this information internally to gauge its actual
performance in the industry. The Company believes that the return on
average assets less the net unrealized securities gains is more indicative
of the Company's return on assets because it more accurately reflects the
return on the assets that are related to the Company's core businesses
which are primarily customer relationship and customer transaction driven.
The return on average assets less net unrealized gains on securities is
computed by dividing annualized net income, excluding securities
gains/losses and The Coca-Cola Company dividend, by average assets less net
unrealized securities gains.
(2) The Company also believes that the return on average realized equity is
more indicative of the Company's return on equity because the excluded
equity relates primarily to a long term holding of a specific security. The
return on average realized shareholders' equity is computed by dividing
annualized net income, excluding securities gains/losses and The Coca-Cola
Company dividend, by average realized shareholders' equity.
(3) SunTrust presents total noninterest income and total revenue excluding
realized securities gains and losses and the net gain on the sale of RCM
assets. The Company believes total noninterest income and total revenue
without securities gains and losses is more indicative of the Company's
performance because it isolates income that is primarily customer
relationship and customer transaction driven. SunTrust further excludes the
net gain on the sale of RCM assets because the Company believes the
exclusion of the net gain is more indicative of normalized operations.
(4) Multiply by 4 to calculate sequential annualized growth or reductions.
A-1
SUNTRUST BANKS, INC. AND SUBSIDIARIES
RECONCILEMENT OF NON-GAAP MEASURES
APPENDIX A, CONTINUED
(DOLLARS IN THOUSANDS)
- --------------------------------------------------------------------------------
THREE MONTHS ENDED NINE MONTHS ENDED
------------------------------------------- ----------------------
SEPTEMBER 30 JUNE 30 SEPTEMBER 30
2005 2005 2005
-------------------- -------------------- ----------------------
SELECTED NON-GAAP OPERATING MEASURES AND
ADJUSTED OPERATING MEASURES PRESENTED (1)
- -----------------------------------------
Net income $510,774 $465,700 $1,468,768
Merger expense, net of tax 7,505 33,642 57,105
-------------------- -------------------- ----------------------
Operating net income 518,279 499,342 1,525,873
Net gain on sale of RCM assets, net of tax (2,175) - (14,497)
-------------------- -------------------- ----------------------
Adjusted operating net income $516,104 $499,342 $1,511,376
==================== ==================== ======================
Diluted earnings per share $1.40 $1.28 $4.04
Impact of excluding merger expense 0.02 0.09 0.16
-------------------- -------------------- ----------------------
Operating diluted earnings per share 1.42 1.37 4.20
Impact of net gain on sale of RCM assets - - (0.04)
-------------------- -------------------- ----------------------
Adjusted operating diluted earnings per share $1.42 $1.37 $4.16
==================== ==================== ======================
Total revenue $2,008,140 $1,913,338 $5,804,518
Securities losses, net 2,069 27 7,755
Net gain on sale of RCM assets (3,508) - (23,382)
-------------------- -------------------- ----------------------
Adjusted total revenue $2,006,701 $1,913,365 $5,788,891
==================== ==================== ======================
Noninterest income $832,398 $770,909 $2,357,121
Net gain on sale of RCM assets (3,508) - (23,382)
-------------------- -------------------- ----------------------
Noninterest income excluding net gain on sale of RCM assets $828,890 $770,909 $2,333,739
==================== ==================== ======================
Noninterest expense $1,177,071 $1,172,825 $3,483,802
Merger expense (12,104) (54,262) (92,104)
-------------------- -------------------- ----------------------
Noninterest expense excluding merger expense $1,164,967 $1,118,563 $3,391,698
==================== ==================== ======================
Efficiency ratio 58.62% 61.30% 60.02%
Impact of excluding merger expense (0.61) (2.84) (1.59)
-------------------- -------------------- ----------------------
Operating efficiency ratio 58.01 58.46 58.43
Impact of net gain on sale of RCM assets 0.10 - 0.24
-------------------- -------------------- ----------------------
Adjusted operating efficiency ratio 58.11% 58.46% 58.67%
==================== ==================== ======================
Return on average total assets 1.19% 1.13% 1.19%
Impact of excluding merger expense 0.02 0.08 0.04
-------------------- -------------------- ----------------------
Operating return on average total assets (2) 1.21% 1.21% 1.23%
==================== ==================== ======================
Return on average total shareholders' equity 12.05% 11.48% 11.97%
Impact of excluding merger expense 0.17 0.83 0.46
-------------------- -------------------- ----------------------
Operating return on average total shareholders' equity (3) 12.22% 12.31% 12.43%
==================== ==================== ======================
- --------------------------------------------------------------------------------
(1) SunTrust presents selected financial data on an operating basis that
excludes merger charges, which represent incremental costs to integrate
NCF's operations. The Company also presents selected financial data on an
adjusted operating basis, which further excludes the net gain related to
the sale of RCM assets. The Company believes the exclusion of these two
measures is more reflective of normalized operations.
(2) Computed by dividing annualized operating net income by average total
assets.
(3) Computed by dividing annualized operating net income by average total
shareholders' equity.
A-2
SUNTRUST BANKS, INC. AND SUBSIDIARIES
QUARTER-TO-QUARTER COMPARISON - ACTUAL
APPENDIX B
- --------------------------------------------------------------------------------
THREE MONTHS ENDED
--------------------------------------------------------------------------------
INCREASE/(DECREASE) SEQUENTIAL
SEPTEMBER 30 JUNE 30 --------------------------- ANNUALIZED(1)
2005 2005 AMOUNT % %
----------------- ---------------- -------------- ----------- --------------
STATEMENTS OF INCOME (DOLLARS IN THOUSANDS)
NET INTEREST INCOME $1,156,661 $1,123,709 $32,952 2.9% 11.7%
Provision for loan losses 70,393 47,811 22,582 47.2 NM
----------------- ---------------- --------------
NET INTEREST INCOME AFTER PROVISION
FOR LOAN LOSSES 1,086,268 1,075,898 10,370 1.0 3.9
----------------- ---------------- --------------
NONINTEREST INCOME
Deposit and other fees(2) 368,613 357,545 11,068 3.1 12.4
Trust and investment management income 168,802 167,503 1,299 0.8 3.1
Broker/dealer revenue(3) 147,184 138,149 9,035 6.5 26.2
Other noninterest income 146,360 107,739 38,621 35.8 NM
----------------- ---------------- --------------
Noninterest income before securities losses, net
and net gain on sale of RCM assets(4) 830,959 770,936 60,023 7.8 31.1
Gain on sale of RCM assets, net of related expenses 3,508 - 3,508 100.0 NM
----------------- ---------------- --------------
Noninterest income before securities losses, net 834,467 770,936 63,531 8.2 33.0
Securities losses, net (2,069) (27) (2,042) 7,563.0 NM
----------------- ---------------- --------------
Total noninterest income 832,398 770,909 61,489 8.0 31.9
----------------- ---------------- --------------
NONINTEREST EXPENSE
Personnel expense 632,333 623,284 9,049 1.5 5.8
Net occupancy expense 79,519 73,483 6,036 8.2 32.9
Outside processing and software 92,952 89,282 3,670 4.1 16.4
Equipment expense 50,083 51,579 (1,496) (2.9) (11.6)
Marketing and customer development 38,651 36,298 2,353 6.5 25.9
Other noninterest expense 216,020 214,819 1,201 0.6 2.2
----------------- ---------------- --------------
Noninterest expense before Affordable Housing
impairment charge, amortization of intangible
assets and merger expense(5) 1,109,558 1,088,745 20,813 1.9 7.6
Impairment charge on Affordable Housing Properties 25,672 - 25,672 100.0 NM
Amortization of intangible assets 29,737 29,818 (81) (0.3) (1.1)
Merger expense 12,104 54,262 (42,158) (77.7) NM
----------------- ---------------- --------------
Total noninterest expense 1,177,071 1,172,825 4,246 0.4 1.4
----------------- ---------------- --------------
INCOME BEFORE INCOME TAXES 741,595 673,982 67,613 10.0 40.1
Provision for income taxes 230,821 208,282 22,539 10.8 43.3
----------------- ---------------- --------------
NET INCOME 510,774 465,700 45,074 9.7 38.7
Merger expense, net of tax 7,505 33,642 (26,137) (77.7) NM
----------------- ---------------- --------------
OPERATING NET INCOME 518,279 499,342 18,937 3.8 15.2
Net gain on sale of RCM assets, net of tax (2,175) - (2,175) 100.0 NM
----------------- ---------------- --------------
ADJUSTED OPERATING NET INCOME $516,104 $499,342 $16,762 3.4% 13.4%
================= ================ ==============
REVENUE (DOLLARS IN THOUSANDS)
Net interest income $1,156,661 $1,123,709 $32,952 2.9% 11.7%
FTE adjustment 19,081 18,720 361 1.9 7.7
----------------- ---------------- --------------
Net interest income - FTE 1,175,742 1,142,429 33,313 2.9 11.7
Noninterest income 832,398 770,909 61,489 8.0 31.9
----------------- ---------------- --------------
Total revenue 2,008,140 1,913,338 94,802 5.0 19.8
Securities losses, net 2,069 27 2,042 7,563.0 NM
Net gain on sale of RCM assets (3,508) - (3,508) 100.0 NM
----------------- ---------------- --------------
Total revenue excluding securities gains and losses
and net gain on sale of RCM assets $2,006,701 $1,913,365 $93,336 4.9% 19.5%
================= ================ ==============
SELECTED AVERAGE BALANCES (DOLLARS IN MILLIONS)
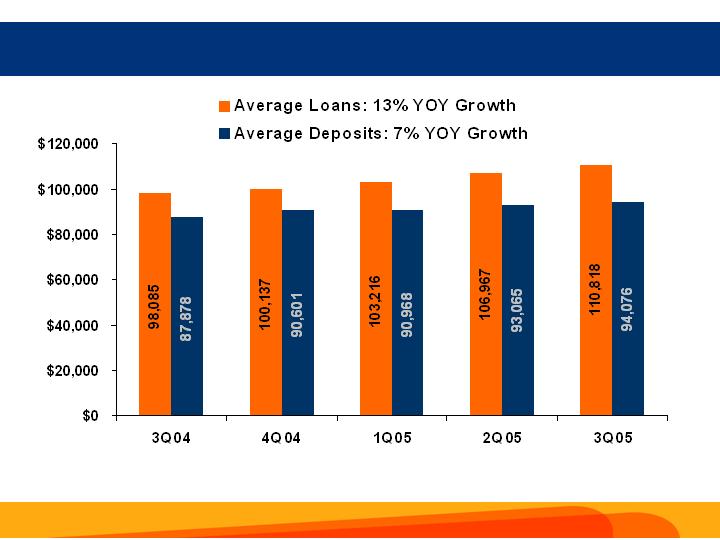
Average Loans(6),(8)
Commercial $32,713 $32,508 $205 0.6% 2.5%
Real estate 1-4 family 28,366 26,324 2,042 7.8 31.0
Real estate commercial and construction 22,484 21,496 988 4.6 18.4
Real estate equity 12,649 12,135 514 4.2 16.9
Consumer(7) 14,382 14,291 91 0.6 2.5
Credit cards 224 213 11 5.2 20.7
----------------- ---------------- --------------
Total loans $110,818 $106,967 $3,851 3.6% 14.4%
================= ================ ==============
Average deposits(8)
Noninterest bearing deposits $24,522 $24,310 $212 0.9% 3.5%
NOW accounts 16,853 17,520 (667) (3.8) (15.2)
Money market accounts 26,300 25,473 827 3.2 13.0
Savings 5,865 6,462 (597) (9.2) (37.0)
Consumer and other time 20,536 19,300 1,236 6.4 25.6
----------------- ---------------- --------------
Total consumer and commercial deposits 94,076 93,065 1,011 1.1 4.3
Brokered and foreign deposits 17,969 15,709 2,260 14.4 57.5
----------------- ---------------- --------------
Total deposits $112,045 $108,774 $3,271 3.0% 12.0%
================= ================ ==============
SELECTED CREDIT DATA (DOLLARS IN THOUSANDS)
Nonaccrual loans $307,788 $328,018 ($20,230) (6.2)% (24.7)%
Restructured loans 21,876 21,236 640 3.0 12.1
----------------- ---------------- --------------
Total nonperforming loans 329,664 349,254 (19,590) (5.6) (22.4)
Other real estate owned (OREO) 26,013 25,263 750 3.0 11.9
Other repossessed assets 7,060 5,786 1,274 22.0 88.1
----------------- ---------------- --------------
Total nonperforming assets $362,737 $380,303 ($17,566) (4.6)% (18.5)%
================= ================ ==============
Allowance for loan and lease losses $1,029,855 $1,036,173 ($6,318) (0.6)% (2.4)%
================= ================ ==============
- --------------------------------------------------------------------------------
(1) Multiply percentage change by 4 to calculate sequential annualized change.
Any sequential annualized change over 100 percent is labeled as "NM". Those
changes over 100 percent were not considered to be meaningful.
(2) Includes service charges on deposits, card and other charges and fees.
(3) Includes retail investment services, investment banking income and trading
account profits and commissions.
(4) SunTrust presents noninterest income before securities (losses)/gains and
the net gain on the sale of RCM assets. The Company believes noninterest
income before securities gains and losses is more indicative of the
Company's performance because it isolates income that is primarily customer
relationship and customer transaction driven. SunTrust further excludes the
net gain on the sale of RCM assets because the Company believes the
exclusion of the net gain provides better comparability and is more
indicative of normalized operations.
(5) The Company presents noninterest expense before an impairment charge on
Affordable Housing Properties, amortization of intangible assets and merger
expense. The Company believes the exclusion of these measures provides
better comparability and is more reflective of normalized operations.
(6) SunTrust's average nonaccrual and restructured loans are included in the
respective categories to conform to the NCF presentation.
(7) Includes consumer direct and consumer indirect loans.
(8) See Appendix C for the impact of the estimated reclassification adjustments
resulting from the April 22, 2005 NCF systems conversion.
B-1
SUNTRUST BANKS, INC. AND SUBSIDIARIES
QUARTER-TO-QUARTER COMPARISON - HISTORICAL COMBINED GROWTH
APPENDIX B, CONTINUED
The 3rd quarter and year-to-date 2004 figures represent SunTrust and NCF on a
historical combined basis. See following page for a reconcilement of these
historical combined amounts.
- --------------------------------------------------------------------------------
HISTORICAL COMBINED
------------------------------------------------------------------------
THREE MONTHS ENDED
------------------------------------------------------------------------
SEPTEMBER 30 INCREASE/(DECREASE)
----------------------------------- ----------------------------------
2005 2004 AMOUNT %
---------------- ----------------- --------------- ----------------
STATEMENTS OF INCOME (DOLLARS IN THOUSANDS)
NET INTEREST INCOME $1,156,661 $1,071,689 $84,972 7.9%
Provision for loan losses 70,393 60,818 9,575 15.7
---------------- ----------------- ---------------
NET INTEREST INCOME AFTER PROVISION
FOR LOAN LOSSES 1,086,268 1,010,871 75,397 7.5
---------------- ----------------- ---------------
NONINTEREST INCOME
Deposit and other fees(1) 368,613 353,573 15,040 4.3
Trust and investment management income 168,802 165,603 3,199 1.9
Broker/dealer revenue(2) 147,184 132,650 14,534 11.0
Other noninterest income 146,360 106,550 39,810 37.4
---------------- ----------------- ---------------
Noninterest income before securities losses, net
and net gain on sale of RCM assets(3) 830,959 758,376 72,583 9.6
Gain on sale of RCM assets, net of related expenses 3,508 - 3,508 100.0
---------------- ----------------- ---------------
Noninterest income before securities losses, net 834,467 758,376 76,091 10.0
Securities losses, net (2,069) (16,565) 14,496 (87.5)
---------------- ----------------- ---------------
Total noninterest income 832,398 741,811 90,587 12.2
---------------- ----------------- ---------------
NONINTEREST EXPENSE
Personnel expense 632,333 605,325 27,008 4.5
Net occupancy expense 79,519 79,875 (356) (0.4)
Outside processing and software 92,952 75,449 17,503 23.2
Equipment expense 50,083 50,904 (821) (1.6)
Marketing and customer development 38,651 34,975 3,676 10.5
Other noninterest expense 216,020 233,692 (17,672) (7.6)
---------------- ----------------- ---------------
Noninterest expense before Affordable Housing
impairment charge, amortization of intangible
assets and merger expense(4) 1,109,558 1,080,220 29,338 2.7
Impairment charge on Affordable Housing Properties 25,672 9,001 16,671 185.2
Amortization of intangible assets 29,737 28,132 1,605 5.7
Merger expense 12,104 - 12,104 100.0
---------------- ----------------- ---------------
Total noninterest expense 1,177,071 1,117,353 59,718 5.3
---------------- ----------------- ---------------
INCOME BEFORE INCOME TAXES 741,595 635,329 106,266 16.7
Provision for income taxes 230,821 198,926 31,895 16.0
---------------- ----------------- ---------------
NET INCOME 510,774 436,403 74,371 17.0
Merger expense, net of tax 7,505 - 7,505 100.0
---------------- ----------------- ---------------
OPERATING NET INCOME 518,279 436,403 81,876 18.8
Net gain on sale of RCM assets, net of tax (2,175) - (2,175) 100.0
---------------- ----------------- ---------------
ADJUSTED OPERATING NET INCOME $516,104 $436,403 $79,701 18.3%
================ ================= ===============
REVENUE (DOLLARS IN THOUSANDS)
Net interest income $1,156,661 $1,071,689 $84,972 7.9%
FTE adjustment(5) 19,081 19,063 18 0.1
---------------- ----------------- ---------------
Net interest income - FTE 1,175,742 1,090,752 84,990 7.8
Noninterest income 832,398 741,811 90,587 12.2
---------------- ----------------- ---------------
Total revenue 2,008,140 1,832,563 175,577 9.6
Securities losses, net 2,069 16,565 (14,496) (87.5)
Net gain on sale of RCM assets (3,508) - (3,508) 100.0
---------------- ----------------- ---------------
Total revenue excluding securities gains and losses
and net gain on sale of RCM assets $2,006,701 $1,849,128 $157,573 8.5%
================ ================= ===============
SELECTED AVERAGE BALANCES (DOLLARS IN MILLIONS)
Average Loans(6)
Commercial $32,713 $31,977 $736 2.3%
Real estate 1-4 family 28,366 21,963 6,403 29.2
Real estate commercial and construction 22,484 18,155 4,329 23.8
Real estate equity 12,649 10,295 2,354 22.9
Consumer(7) 14,382 15,520 (1,138) (7.3)
Credit cards 224 175 49 28.0
---------------- ----------------- ---------------
Total loans $110,818 $98,085 $12,733 13.0%
================ ================= ===============
Average deposits
Noninterest bearing deposits $24,522 $23,239 $1,283 5.5%
NOW accounts 16,853 15,335 1,518 9.9
Money market accounts 26,300 24,211 2,089 8.6
Savings 5,865 9,099 (3,234) (35.5)
Consumer and other time 20,536 15,994 4,542 28.4
---------------- ----------------- ---------------
Total consumer and commercial deposits 94,076 87,878 6,198 7.1
Brokered and foreign deposits 17,969 11,496 6,473 56.3
---------------- ----------------- ---------------
Total deposits $112,045 $99,374 $12,671 12.8%
================ ================= ===============
SELECTED CREDIT DATA (DOLLARS IN THOUSANDS)
Nonaccrual loans $307,788 $329,340 ($21,552) (6.5)%
Restructured loans 21,876 19,724 2,152 10.9
---------------- ----------------- ---------------
Total nonperforming loans 329,664 349,064 (19,400) (5.6)
Other real estate owned (OREO) 26,013 27,126 (1,113) (4.1)
Other repossessed assets 7,060 15,082 (8,021) (53.2)
---------------- ----------------- ---------------
Total nonperforming assets $362,737 $391,272 ($28,535) (7.3)%
================ ================= ===============
Allowance for loan and lease losses $1,029,855 $1,067,829 ($37,974) (3.6)%
================ ================= ===============
HISTORICAL COMBINED
--------------------------------------------------------------------
NINE MONTHS ENDED
--------------------------------------------------------------------
SEPTEMBER 30 INCREASE/(DECREASE)
------------------------------- ----------------------------------
2005 2004 AMOUNT %
-------------- -------------- ----------------- --------------
STATEMENTS OF INCOME (DOLLARS IN THOUSANDS)
NET INTEREST INCOME $3,391,930 $3,180,823 $211,107 6.6%
Provision for loan losses 128,760 142,415 (13,655) (9.6)
-------------- -------------- -----------------
NET INTEREST INCOME AFTER PROVISION
FOR LOAN LOSSES 3,263,170 3,038,408 224,762 7.4
-------------- -------------- -----------------
NONINTEREST INCOME
Deposit and other fees(1) 1,069,792 1,046,326 23,466 2.2
Trust and investment management income 500,820 474,671 26,149 5.5
Broker/dealer revenue(2) 434,529 440,267 (5,738) (1.3)
Other noninterest income 336,353 252,186 84,167 33.4
-------------- -------------- -----------------
Noninterest income before securities losses, net
and net gain on sale of RCM assets(3) 2,341,494 2,213,450 128,044 5.8
Gain on sale of RCM assets, net of related expenses 23,382 - 23,382 100.0
-------------- -------------- -----------------
Noninterest income before securities losses, net 2,364,876 2,213,450 151,426 6.8
Securities losses, net (7,755) (9,702) 1,947 (20.1)
-------------- -------------- -----------------
Total noninterest income 2,357,121 2,203,748 153,373 7.0
-------------- -------------- -----------------
NONINTEREST EXPENSE
Personnel expense 1,890,410 1,789,971 100,439 5.6
Net occupancy expense 228,853 230,183 (1,330) (0.6)
Outside processing and software 265,082 225,345 39,737 17.6
Equipment expense 154,544 156,156 (1,612) (1.0)
Marketing and customer development 106,578 104,011 2,567 2.5
Other noninterest expense 629,787 674,364 (44,577) (6.6)
-------------- -------------- -----------------
Noninterest expense before Affordable Housing
impairment charge, amortization of intangible
assets and merger expense(4) 3,275,254 3,180,030 95,224 3.0
Impairment charge on Affordable Housing Properties 25,672 9,001 16,671 185.2
Amortization of intangible assets 90,772 84,902 5,870 6.9
Merger expense 92,104 - 92,104 100.0
-------------- -------------- -----------------
Total noninterest expense 3,483,802 3,273,933 209,869 6.4
-------------- -------------- -----------------
INCOME BEFORE INCOME TAXES 2,136,489 1,968,223 168,266 8.5
Provision for income taxes 667,721 608,079 59,642 9.8
-------------- -------------- -----------------
NET INCOME 1,468,768 1,360,144 108,624 8.0
Merger expense, net of tax 57,105 - 57,105 100.0
-------------- -------------- -----------------
OPERATING NET INCOME 1,525,873 1,360,144 165,729 12.2
Net gain on sale of RCM assets, net of tax (14,497) - (14,497) (100.0)
-------------- -------------- -----------------
ADJUSTED OPERATING NET INCOME $1,511,376 $1,360,144 $151,232 11.1%
============== ============== =================
REVENUE (DOLLARS IN THOUSANDS)
Net interest income $3,391,930 $3,180,823 $211,107 6.6%
FTE adjustment(5) 55,467 48,441 7,026 14.5
-------------- -------------- -----------------
Net interest income - FTE 3,447,397 3,229,264 218,133 6.8
Noninterest income 2,357,121 2,203,748 153,373 7.0
-------------- -------------- -----------------
Total revenue 5,804,518 5,433,012 371,506 6.8
Securities losses, net 7,755 9,702 (1,947) 20.1
Net gain on sale of RCM assets (23,382) - (23,382) (100.0)
-------------- -------------- -----------------
Total revenue excluding securities gains and losses
and net gain on sale of RCM assets $5,788,891 $5,442,714 $346,177 6.4%
============== ============== =================
SELECTED AVERAGE BALANCES (DOLLARS IN MILLIONS)
Average Loans(6)
Commercial $32,903 $32,112 $791 2.5%
Real estate 1-4 family 26,092 20,270 5,822 28.7
Real estate commercial and construction 21,084 17,899 3,185 17.8
Real estate equity 12,123 9,548 2,575 27.0
Consumer(7) 14,614 15,326 (712) (4.6)
Credit cards 212 165 47 28.5
-------------- -------------- -----------------
Total loans $107,028 $95,320 $11,708 12.3%
============== ============== =================
Average deposits
Noninterest bearing deposits $24,188 $22,650 $1,538 6.8%
NOW accounts 17,282 14,974 2,308 15.4
Money market accounts 25,519 24,163 1,356 5.6
Savings 6,605 8,619 (2,014) (23.4)
Consumer and other time 19,120 15,512 3,608 23.3
-------------- -------------- -----------------
Total consumer and commercial deposits 92,714 85,918 6,796 7.9
Brokered and foreign deposits 15,718 12,255 3,463 28.3
-------------- -------------- -----------------
Total deposits $108,432 $98,173 $10,259 10.4%
============== ============== =================
SELECTED CREDIT DATA (DOLLARS IN THOUSANDS)
Nonaccrual loans
Restructured loans
Total nonperforming loans
Other real estate owned (OREO)
Other repossessed assets
Total nonperforming assets
Allowance for loan and lease losses
- --------------------------------------------------------------------------------
(1) Includes service charges on deposits, card and other charges and fees.
(2) Includes retail investment services, investment banking income and trading
account profits and commissions.
(3) SunTrust presents noninterest income before securities (losses)/gains and
the net gain on the sale of RCM assets. The Company believes noninterest
income before securities gains and losses is more indicative of the
Company's performance because it isolates income that is primarily customer
relationship and customer transaction driven. SunTrust further excludes the
net gain on the sale of RCM assets because the Company believes the
exclusion of the net gain provides better comparability and is more
indicative of normalized operations.
(4) The Company presents noninterest expense before an impairment charge on
Affordable Housing Properties, amortization of intangible assets and merger
expense. The Company believes the exclusion of these measures provides
better comparability and is more reflective of normalized operations.
(5) NCF's FTE adjustments were reduced $4.0 million and $13.1 million from the
third quarter and first nine months of 2004, respectively, to conform to
SunTrust's methodology.
(6) SunTrust's average nonaccrual and restructured loans are included in the
respective categories to conform to the NCF presentation.
(7) Includes consumer direct and consumer indirect loans.
B-2
SUNTRUST BANKS, INC. AND SUBSIDIARIES
SUNTRUST / NCF - SELECTED HISTORICAL FINANCIAL DATA
APPENDIX B, CONTINUED
- --------------------------------------------------------------------------------
THREE MONTHS ENDED NINE MONTHS ENDED
---------------------------------------- --------------------------------------
SEPTEMBER 30, 2004 SEPTEMBER 30, 2004
---------------------------------------- --------------------------------------
HISTORICAL HISTORICAL
SUNTRUST NCF COMBINED SUNTRUST NCF COMBINED
------------ ------------ ------------ ------------ ------------ ------------
STATEMENTS OF INCOME (Dollars in thousands)
NET INTEREST INCOME $876,874 $194,815 $1,071,689 $2,600,951 $579,872 $3,180,823
Provision for loan losses 41,774 19,044 60,818 98,438 43,977 142,415
------------ ------------ ------------ ------------ ------------ ------------
NET INTEREST INCOME AFTER PROVISION
FOR LOAN LOSSES 835,100 175,771 1,010,871 2,502,513 535,895 3,038,408
------------ ------------ ------------ ------------ ------------ ------------
NONINTEREST INCOME
Deposit and other fees(1) 298,328 55,245 353,573 887,178 159,148 1,046,326
Trust and investment management income 149,673 15,930 165,603 426,257 48,414 474,671
Broker/dealer revenue(2) 113,308 19,342 132,650 368,452 71,815 440,267
Other noninterest income 84,576 21,974 106,550 185,870 66,316 252,186
------------ ------------ ------------ ------------ ------------ ------------
Noninterest income before securities losses, net 645,885 112,491 758,376 1,867,757 345,693 2,213,450
Securities losses, net (18,193) 1,628 (16,565) (22,314) 12,612 (9,702)
------------ ------------ ------------ ------------ ------------ ------------
Total noninterest income 627,692 114,119 741,811 1,845,443 358,305 2,203,748
------------ ------------ ------------ ------------ ------------ ------------
NONINTEREST EXPENSE
Personnel expense 527,734 77,591 605,325 1,555,452 234,519 1,789,971
Net occupancy expense 66,542 13,333 79,875 190,030 40,153 230,183
Outside processing and software 68,657 6,792 75,449 204,902 20,443 225,345
Equipment expense 43,275 7,629 50,904 134,100 22,056 156,156
Marketing and customer development 32,028 2,947 34,975 93,902 10,109 104,011
Other noninterest expense 167,019 66,673 233,692 514,836 159,528 674,364
------------ ------------ ------------ ------------ ------------ ------------
Noninterest expense before Affordable Housing
impairment charge and amortization of
intangible assets 905,255 174,965 1,080,220 2,693,222 486,808 3,180,030
Impairment charge on Affordable Housing Properties 9,001 - 9,001 9,001 - 9,001
Amortization of intangible assets 15,593 12,539 28,132 45,823 39,079 84,902
------------ ------------ ------------ ------------ ------------ ------------
Total noninterest expense 929,849 187,504 1,117,353 2,748,046 525,887 3,273,933
------------ ------------ ------------ ------------ ------------ ------------
INCOME BEFORE INCOME TAXES 532,943 102,386 635,329 1,599,910 368,313 1,968,223
Provision for income taxes 164,177 34,749 198,926 482,738 125,341 608,079
------------ ------------ ------------ ------------ ------------ ------------
NET INCOME $368,766 $67,637 $436,403 $1,117,172 $242,972 $1,360,144
============ ============ ============ ============ ============ ============
REVENUE (DOLLARS IN THOUSANDS)
Net interest income $876,874 $194,815 $1,071,689 $2,600,951 $579,872 $3,180,823
FTE adjustment 3 16,821 2,242 19,063 41,714 6,727 48,441
------------ ------------ ------------ ------------ ------------ ------------
Net interest income - FTE 893,695 197,057 1,090,752 2,642,665 586,599 3,229,264
Noninterest income 627,692 114,119 741,811 1,845,443 358,305 2,203,748
------------ ------------ ------------ ------------ ------------ ------------
Total revenue 1,521,387 311,176 1,832,563 4,488,108 944,904 5,433,012
Securities losses, net 18,193 (1,628) 16,565 22,314 (12,612) 9,702
------------ ------------ ------------ ------------ ------------ ------------
Total revenue excluding securities gains and losses $1,539,580 $309,548 $1,849,128 $4,510,422 $932,292 $5,442,714
============ ============ ============ ============ ============ ============
SELECTED AVERAGE BALANCES (DOLLARS IN MILLIONS)
Average Loans (4)
Commercial $27,753 $4,224 $31,977 $27,998 $4,114 $32,112
Real estate 1-4 family 20,798 1,165 21,963 19,202 1,068 20,270
Real estate commercial and construction 14,231 3,924 18,155 14,064 3,835 17,899
Real estate equity 8,239 2,056 10,295 7,659 1,889 9,548
Consumer 5 12,574 2,946 15,520 12,468 2,858 15,326
Credit cards 158 17 175 149 16 165
------------ ------------ ------------ ------------ ------------ ------------
Total loans $83,753 $14,332 $98,085 $81,540 $13,780 $95,320
============ ============ ============ ============ ============ ============
Average deposits
Noninterest bearing deposits $20,490 $2,749 $23,239 $19,995 $2,655 $22,650
NOW accounts 13,000 2,335 15,335 12,715 2,259 14,974
Money market accounts 22,434 1,777 24,211 22,313 1,850 24,163
Savings 7,425 1,674 9,099 6,919 1,700 8,619
Consumer and other time 10,773 5,221 15,994 10,614 4,898 15,512
------------ ------------- ------------ ------------ ------------ -----------
Total consumer and commercial deposits 74,122 13,756 87,878 72,556 13,362 85,918
Brokered and foreign deposits 9,341 2,155 11,496 9,830 2,425 12,255
------------ ------------- ------------ ------------ ------------ -----------
Total deposits $83,463 $15,911 $99,374 $82,386 $15,787 $98,173
============ ============= ============ ============ ============ ===========
SELECTED CREDIT DATA (DOLLARS IN THOUSANDS)
Nonaccrual loans $263,127 $66,213 $329,340
Restructured loans 19,724 - 19,724
------------ ------------- ------------
Total nonperforming loans 282,851 66,213 349,064
Other real estate owned (OREO) 10,934 16,192 27,126
Other repossessed assets 10,431 4,651 15,082
------------ ------------- ------------
Total nonperforming assets $304,216 $87,056 $391,272
============ ============= ============
Allowance for loan and lease losses $892,974 $174,855 $1,067,829
============ ============= ============
- --------------------------------------------------------------------------------
(1) Includes service charges on deposits, card and other charges and fees.
(2) Includes retail investment services, investment banking income and trading
account profits and commissions.
(3) NCF's FTE adjustments were reduced $4.0 million and $13.1 million from the
third quarter and first nine months of 2004, respectively, to conform to
SunTrust methodology.
(4) SunTrust's average nonaccrual and restructured loans are included in the
respective categories to conform to the NCF presentation.
(5) Includes consumer direct and consumer indirect loans.
B-3
SUNTRUST BANKS, INC. AND SUBSIDIARIES
CONSOLIDATED DAILY AVERAGE BALANCES - ADJUSTED(1)
APPENDIX C
(DOLLARS IN MILLIONS)
- --------------------------------------------------------------------------------
THREE MONTHS ENDED
-------------------------------------------------------------
SEPTEMBER 30 JUNE 30
2005 2005
------------- ---------------------------------------------- Adjusted
Sequential
Average Average Annualized
Balances - Balances - Estimated Adjusted Adjusted Growth
Reported Reported Reclassification As Adjusted Growth Growth Rate Rate(2)
------------- -------------- ----------------- ------------- ------------ ----------- ----------
LOANS:
Real estate 1-4 family $28,250.5 $26,224.1 $528.8 $26,752.9 $1,497.6 5.6% 22.4%
Real estate construction 9,515.7 9,196.9 (234.5) 8,962.4 553.3 6.2 24.7
Real estate equity 12,648.6 12,134.7 (104.4) 12,030.3 618.3 5.1 20.6
Real estate commercial 12,872.0 12,214.5 827.8 13,042.3 (170.3) (1.3) (5.2)
Commercial 32,601.7 32,393.4 (762.7) 31,630.7 971.0 3.1 12.3
Business credit card 223.5 213.1 - 213.1 10.4 4.9 19.5
Consumer - direct 5,173.0 5,404.7 (467.7) 4,937.0 236.0 4.8 19.1
Consumer - indirect 9,179.8 8,861.1 197.4 9,058.5 121.3 1.3 5.4
Nonaccrual and restructured 353.6 324.2 15.3 339.5 14.1 4.2 16.6
------------- -------------- ----------------- ------------- ------------
Total loans $110,818.4 $106,966.7 $- $106,966.7 $3,851.7 3.6 14.4
============= ============== ================= ============= ============
DEPOSITS:
Noninterest-bearing deposits $24,521.4 $24,309.7 $15.0 $24,324.7 $196.7 0.8% 3.2%
NOW accounts 16,853.1 17,519.6 (4.6) 17,515.0 (661.9) (3.8) (15.1)
Money Market accounts 26,299.7 25,472.9 205.4 25,678.3 621.4 2.4 9.7
Savings 5,865.1 6,462.4 (215.8) 6,246.6 (381.5) (6.1) (24.4)
Consumer time 12,419.3 12,122.0 (565.5) 11,556.5 862.8 7.5 29.9
Other time 8,117.1 7,177.9 565.5 7,743.4 373.7 4.8 19.3
------------- -------------- ----------------- ------------- ------------
Total consumer and commercial
deposits 94,075.7 93,064.5 - 93,064.5 1,011.2 1.1 4.3
Brokered deposits 10,940.4 9,580.3 - 9,580.3 1,360.1 14.2 56.8
Foreign deposits 7,028.8 6,128.9 - 6,128.9 899.9 14.7 58.7
------------- -------------- ----------------- ------------- ------------
Total deposits $112,044.9 $108,773.7 $- $108,773.7 $3,271.2 3.0 12.0
============= ============== ================= ============= ============
- --------------------------------------------------------------------------------
(1) As a result of the NCF systems conversion on April 22, 2005, SunTrust
presents consolidated average balances on an adjusted basis for both loans
and deposits. The Company believes these adjusted measures provide a better
comparison between reporting periods and are more indicative of true loan
and deposit fluctuations. The adjustments represent reclassifications due
to account mapping changes resulting from the systems conversion.
(2) Multiply percentage change by 4 to calculate sequential annualized change.
C-1