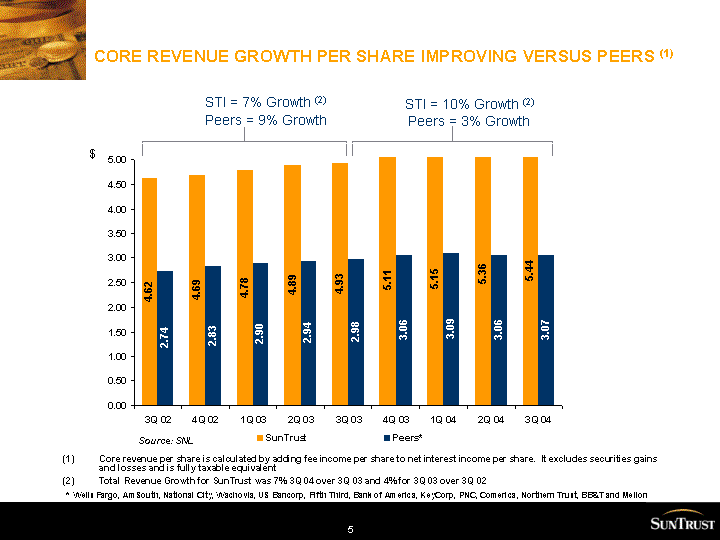
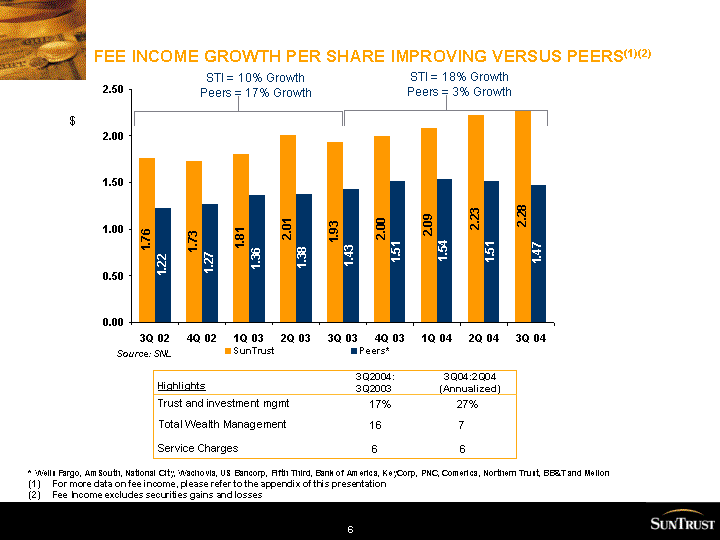
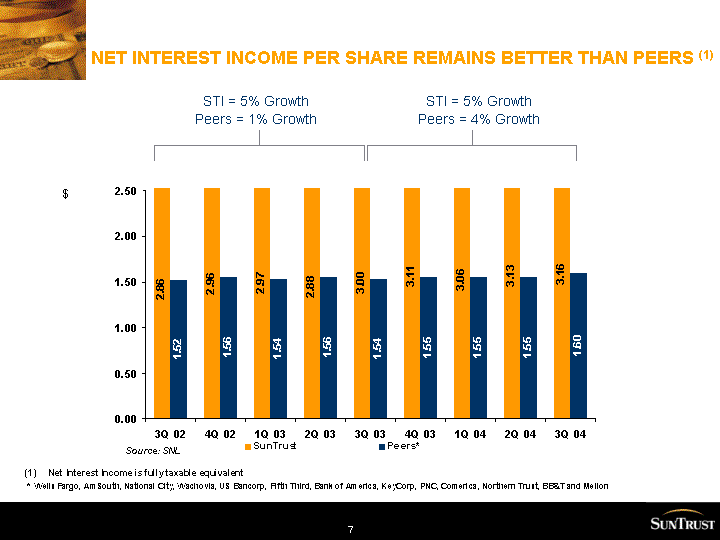
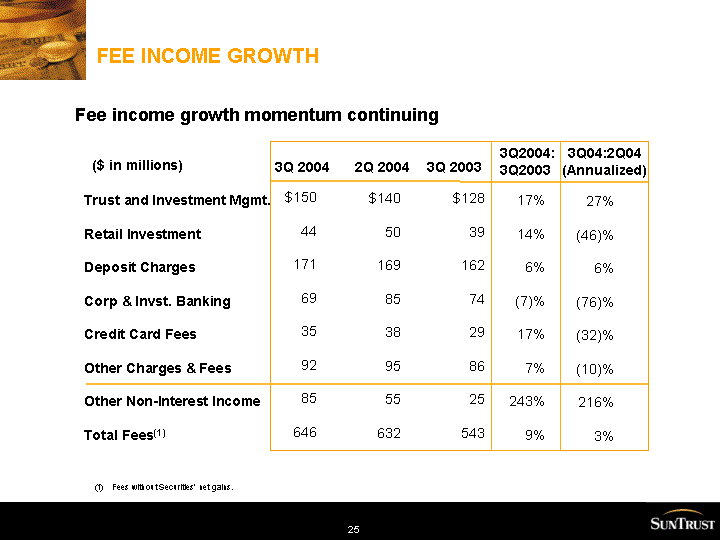
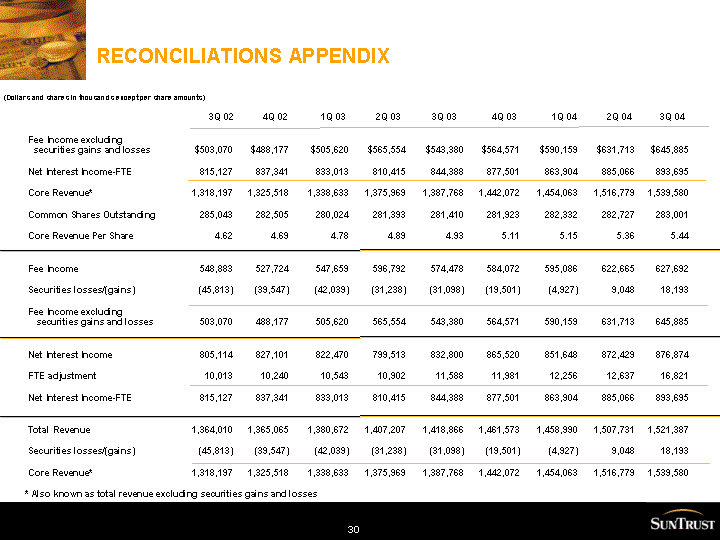
| RECONCILIATIONS APPENDIX Fee Income excluding securities gains and losses Net Interest Income-FTE Core Revenue* Common Shares Outstanding Core Revenue Per Share Fee Income Securities losses/(gains) Fee Income excluding securities gains and losses Net Interest Income FTE adjustment Net Interest Income-FTE Total Revenue Securities losses/(gains) Core Revenue* (Dollars and shares in thousands except per share amounts) (1) Multiply by 4 to calculate sequential annualized growth or reductions 3Q 04 4Q 02 4Q 03 3Q 02 1Q 04 3Q 03 2Q 03 1Q 03 $645,885 893,695 1,539,580 283,001 5.44 627,692 18,193 645,885 876,874 16,821 893,695 1,521,387 18,193 1,539,580 $503,070 815,127 1,318,197 285,043 4.62 548,883 (45,813) 503,070 805,114 10,013 815,127 1,364,010 (45,813) 1,318,197 $543,380 844,388 1,387,768 281,410 4.93 574,478 (31,098) 543,380 832,800 11,588 844,388 1,418,866 (31,098) 1,387,768 $488,177 837,341 1,325,518 282,505 4.69 527,724 (39,547) 488,177 827,101 10,240 837,341 1,365,065 (39,547) 1,325,518 $505,620 833,013 1,338,633 280,024 4.78 547,659 (42,039) 505,620 822,470 10,543 833,013 1,380,672 (42,039) 1,338,633 $565,554 810,415 1,375,969 281,393 4.89 596,792 (31,238) 565,554 799,513 10,902 810,415 1,407,207 (31,238) 1,375,969 $564,571 877,501 1,442,072 281,923 5.11 584,072 (19,501) 564,571 865,520 11,981 877,501 1,461,573 (19,501) 1,442,072 $590,159 863,904 1,454,063 282,332 5.15 595,086 (4,927) 590,159 851,648 12,256 863,904 1,458,990 (4,927) 1,454,063 2Q 04 $631,713 885,066 1,516,779 282,727 5.36 622,665 9,048 631,713 872,429 12,637 885,066 1,507,731 9,048 1,516,779 * Also known as total revenue excluding securities gains and losses 30 |
