Exhibit 99.1
Exhibit 99.1
BancAnalysts Association of Boston Conference
Aleem Gillani, Chief Financial Officer, SunTrust Banks, Inc.
November 7, 2013
Important Cautionary Statement About Forward-Looking Statements
The following should be read in conjunction with the financial statements, notes and other information contained in the Company’s 2012 Annual Report on Form 10-K, Quarterly Reports on Form 10-Q, and Current Reports on Form 8-K.
This presentation includes non-GAAP financial measures to describe SunTrust’s performance. The reconciliations of those measures to GAAP measures are provided within or in the appendix of this presentation. In this presentation, net interest income and net interest margin are presented on a fully taxable-equivalent (“FTE”) basis, and ratios are presented on an annualized basis. The FTE basis adjusts for the tax-favored status of income from certain loans and investments. The Company believes this measure to be the preferred industry measurement of net interest income and provides relevant comparison between taxable and non-taxable amounts.
This presentation may contain forward looking statements. Any statement that does not describe historical or current facts is a forward-looking statement. These statements often include the words “believes,” “expects,” “anticipates,” “estimates,” “intends,” “plans,” “goals,” “targets,” “initiatives,” “potential” or “potentially,” “probably,” “projects,” outlook or similar expressions or future conditional verbs such as “may,” “will,” “should,” “would,” and “could.” Such statements are based upon the current beliefs and expectations of management and on information currently available to management. Such statements speak as of the date hereof, and we do not assume any obligation to update these statements or to update the reasons why actual results could differ from those contained in such statements in light of new information or future events.
Forward-looking statements are subject to significant risks and uncertainties. Investors are cautioned against placing undue reliance on such statements. Actual results may differ materially from those set forth in the forward-looking statements. Factors that could cause actual results to differ materially from those described in the forward-looking statements can be found in Part I, “Item 1A. Risk Factors” in our 2012 Annual Report on Form 10-K and include risks discussed in other periodic reports that we file with the SEC. The estimated financial impact of legal and regulatory matters depends upon (1) the successful negotiation, execution, and delivery of definitive agreements in several matters, (2) the ultimate resolution of certain legal matters which are not yet complete, (3) management’s assumptions about the extent to which such amounts may be deducted for tax purposes, (4) the agreement of other necessary parties, and (5) our assumptions about the extent to which we can provide consumer relief to satisfy our financial obligations as contemplated by the agreements in principle with regulators. Additional factors include: our framework for managing risks may not be effective in mitigating risk and loss to us; as one of the largest lenders in the Southeast and Mid-Atlantic U.S. and a provider of financial products and services to consumers and businesses across the U.S., our financial results have been, and may continue to be, materially affected by general economic conditions, particularly unemployment levels and home prices in the U.S., and a deterioration of economic conditions or of the financial markets may materially adversely affect our lending and other businesses and our financial results and condition; legislation and regulation, including the Dodd-Frank Act, as well as future legislation and/or regulation, could require us to change certain of our business practices, reduce our revenue, impose additional costs on us, or otherwise adversely affect our business operations and/or competitive position; we are subject to capital adequacy and liquidity guidelines and, if we fail to meet these guidelines, our financial condition would be adversely affected; loss of customer deposits and market illiquidity could increase our funding costs; we rely on the mortgage secondary market and GSEs for some of our liquidity; we are subject to credit risk; our ALLL may not be adequate to cover our eventual losses; we may have more credit risk and higher credit losses to the extent our loans are concentrated by loan type, industry segment, borrower type, or location of the borrower or collateral; we will realize future losses if the proceeds we receive upon liquidation of non-performing assets are less than the carrying value of such assets; a downgrade in the U.S. government’s sovereign credit rating, or in the credit ratings of instruments issued, insured or guaranteed by related institutions, agencies or instrumentalities, could result in risks to us and general economic conditions that we are not able to predict; the failure of the European Union to stabilize the fiscal condition and creditworthiness of its weaker member economies could have international implications potentially impacting global financial institutions, the financial markets, and the economic recovery underway in the U.S.; weakness in the real estate market, including the secondary residential mortgage loan markets, has adversely affected us and may continue to adversely affect us; we are subject to certain risks related to originating and selling mortgages, and may be required to repurchase mortgage loans or indemnify mortgage loan purchasers as a result of breaches of representations and warranties, borrower fraud, or as a result of certain breaches of our servicing agreements, and this could harm our liquidity, results of operations, and financial condition; financial difficulties or credit downgrades of mortgage and bond insurers may adversely affect our servicing and investment portfolios; we may face certain risks as a servicer of loans, or also may be terminated as a servicer or master servicer, be required to repurchase a mortgage loan or reimburse investors for credit losses on a mortgage loan, or incur costs, liabilities, fines and other sanctions if we fail to satisfy our servicing obligations, including our obligations with respect to mortgage loan foreclosure actions; we are subject to risks related to delays in the foreclosure process; we may continue to suffer increased losses in our loan portfolio despite enhancement of our underwriting policies and practices; our mortgage production and servicing revenue can be volatile; as a financial services company, changes in general business or economic conditions could have a material adverse effect on our financial condition and results of operations; changes in market interest rates or capital markets could adversely affect our revenue and expense, the value of assets and obligations, and the availability and cost of capital and liquidity; changes in interest rates could also reduce the value of our MSRs and mortgages held for sale, reducing our earnings; changes which are being considered in the method for determining LIBOR may affect the value of debt securities and other financial obligations held or issued by SunTrust that are linked to LIBOR, or may affect the Company’s financial condition or results of operations; the fiscal and monetary policies of the federal government and its agencies could have a material adverse effect on our earnings; depressed market values for our stock may require us to write down goodwill; clients could pursue alternatives to bank deposits, causing us to lose a relatively inexpensive source of funding; consumers may decide not to use banks to complete their financial transactions, which could affect net income; we have businesses other than banking which subject us to a variety of risks; hurricanes and other disasters may adversely affect loan portfolios and operations and increase the cost of doing business; negative public opinion could damage our reputation and adversely impact business and revenues; we rely on other companies to provide key components of our business infrastructure; a failure in or breach of our operational or security systems or infrastructure, or those of our third party vendors and other service providers, including as a result of cyber attacks, could disrupt our businesses, result in the disclosure or misuse of confidential or proprietary information, damage our reputation, increase our costs and cause losses; the soundness of other financial institutions could adversely affect us; we depend on the accuracy and completeness of information about clients and counterparties; regulation by federal and state agencies could adversely affect the business, revenue, and profit margins; competition in the financial services industry is intense and could result in losing business or margin declines; maintaining or increasing market share depends on market acceptance and regulatory approval of new products and services; we might not pay dividends on your common stock; our ability to receive dividends from our subsidiaries could affect our liquidity and ability to pay dividends; disruptions in our ability to access global capital markets may adversely affect our capital resources and liquidity; any reduction in our credit rating could increase the cost of our funding from the capital markets; we have in the past and may in the future pursue acquisitions, which could affect costs and from which we may not be able to realize anticipated benefits; we are subject to certain litigation, and our expenses related to this litigation may adversely affect our results; we may incur fines, penalties and other negative consequences from regulatory violations, possibly even from inadvertent or unintentional violations; we depend on the expertise of key personnel, and if these individuals leave or change their roles without effective replacements, operations may suffer; we may not be able to hire or retain additional qualified personnel and recruiting and compensation costs may increase as a result of turnover, both of which may increase costs and reduce profitability and may adversely impact our ability to implement our business strategies; our accounting policies and processes are critical to how we report our financial condition and results of operations, and they require management to make estimates about matters that are uncertain; changes in our accounting policies or in accounting standards could materially affect how we report our financial results and condition; our stock price can be volatile; our disclosure controls and procedures may not prevent or detect all errors or acts of fraud; our financial instruments carried at fair value expose us to certain market risks; our revenues derived from our investment securities may be volatile and subject to a variety of risks; and we may enter into transactions with off-balance sheet affiliates or our subsidiaries. 2
|
|
Company Overview: A Strong Foundation
3
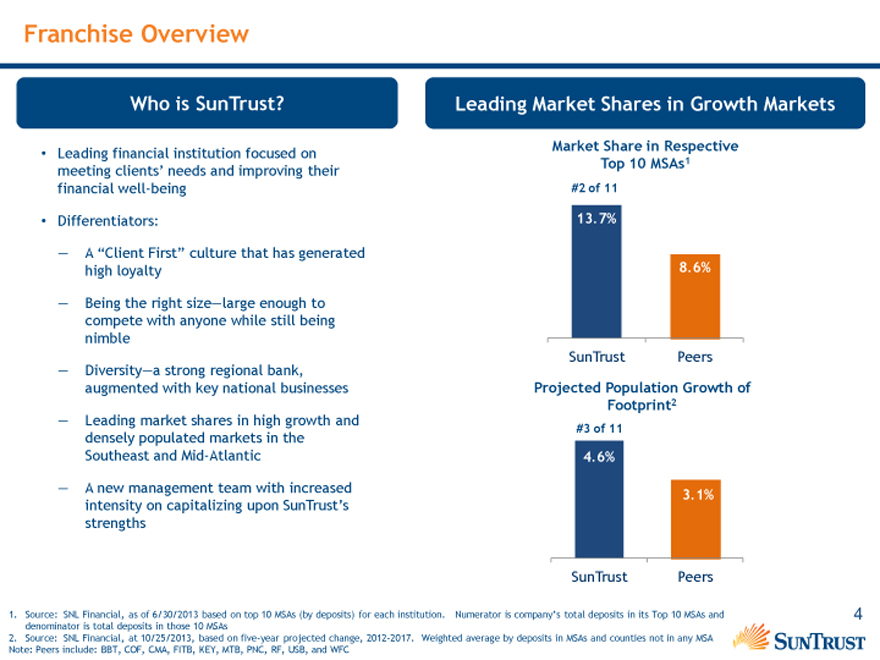
Franchise Overview
Who is SunTrust?
Leading financial institution focused on meeting clients’ needs and improving their financial well-being
Differentiators:
— A “Client First” culture that has generated high loyalty
— Being the right size—large enough to compete with anyone while still being nimble
— Diversity—a strong regional bank, augmented with key national businesses
— Leading market shares in high growth and densely populated markets in the Southeast and Mid-Atlantic
— A new management team with increased intensity on capitalizing upon SunTrust’s strengths
Leading Market Shares in Growth Markets
Market Share in Respective
Top 10 MSAs1
#2 of 11
13.7%
8.6%
SunTrust Peers
Projected Population Growth of
Footprint2
#3 of 11
4.6%
3.1%
SunTrust Peers
1. Source: SNL Financial, as of 6/30/2013 based on top 10 MSAs (by deposits) for each institution. Numerator is company’s total deposits in its Top 10 MSAs and denominator is total deposits in those 10 MSAs
2. Source: SNL Financial, at 10/25/2013, based on five-year projected change, 2012-2017. Weighted average by deposits in MSAs and counties not in any MSA
Note: Peers include: BBT, COF, CMA, FITB, KEY, MTB, PNC, RF, USB, and WFC
4
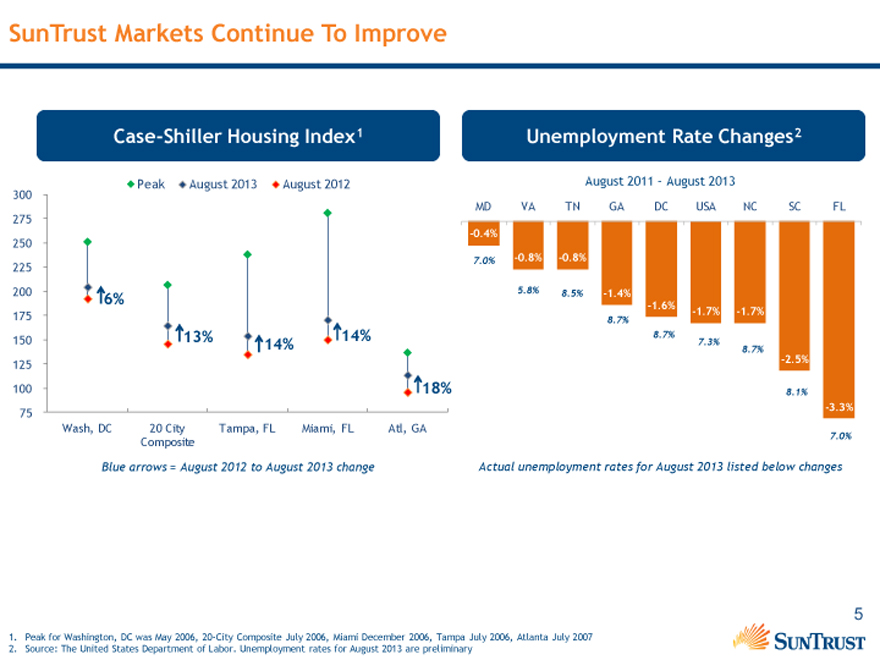
SunTrust Markets Continue To Improve
Case-Shiller Housing Index1
Peak August 2013 August 2012
300
275
250
225
200 6%
175
150 13% 14% 14%
125
100 18%
75
Wash, DC 20 City Tampa, FL Miami, FL Atl, GA
Composite
Blue arrows = August 2012 to August 2013 change
Unemployment Rate Changes2
August 2011 – August 2013
MD VA TN GA DC USA NC SC FL
-0.4%
7.0% -0.8% -0.8%
5.8% 8.5% -1.4%
-1.6% -1.7% -1.7%
8.7%
8.7%
7.3%
8.7%
-2.5%
8.1%
-3.3%
7.0%
Actual unemployment rates for August 2013 listed below changes
1. Peak for Washington, DC was May 2006, 20-City Composite July 2006, Miami December 2006, Tampa July 2006, Atlanta July 2007
2. Source: The United States Department of Labor. Unemployment rates for August 2013 are preliminary
5
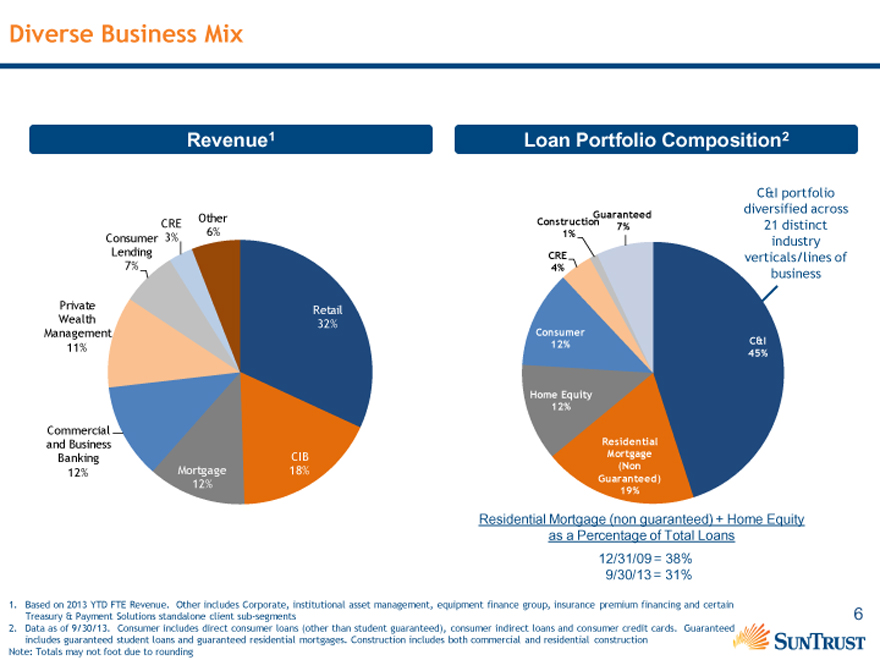
Diverse Business Mix
Revenue1
CRE Other
Consumer 3% 6%
Lending
7%
Private Retail
Wealth 32%
Management
11%
Commercial
and Business
Banking CIB
12% Mortgage 18%
12%
Loan Portfolio Composition2
C&I portfolio
Guaranteed diversified across
Construction 7% 21 distinct
1% industry
CRE verticals/lines of
4% business
Consumer
12% C&I
45%
Home Equity
12%
Residential
Mortgage
(Non
Guaranteed)
19%
Residential Mortgage (non guaranteed) + Home Equity
as a Percentage of Total Loans
12/31/09 = 38%
9/30/13 = 31%
1. Based on 2013 YTD FTE Revenue. Other includes Corporate, institutional asset management, equipment finance group, insurance premium financing and certain Treasury & Payment Solutions standalone client sub-segments
2. Data as of 9/30/13. Consumer includes direct consumer loans (other than student guaranteed), consumer indirect loans and consumer credit cards. Guaranteed includes guaranteed student loans and guaranteed residential mortgages. Construction includes both commercial and residential construction Note: Totals may not foot due to rounding
6
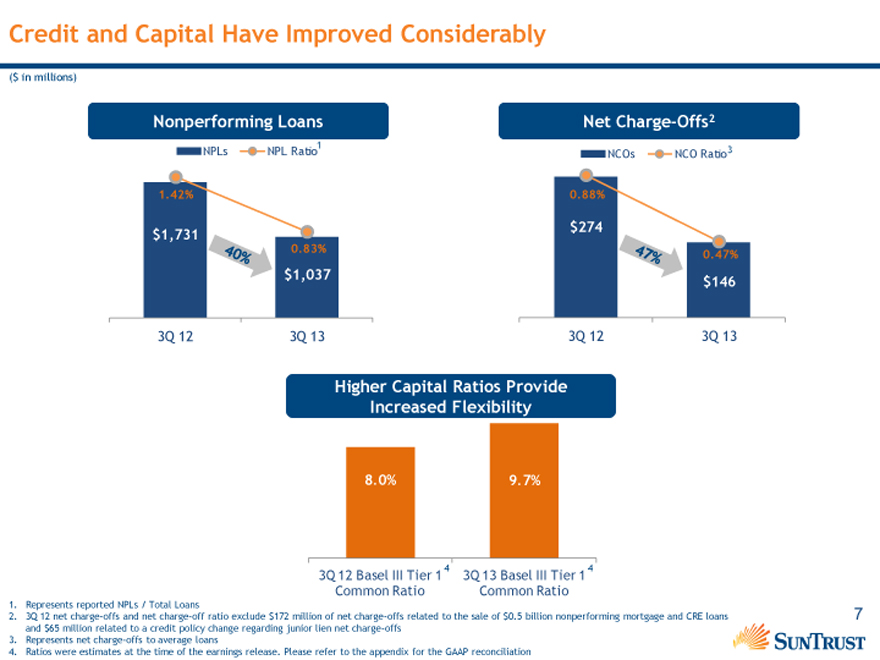
Credit and Capital Have Improved Considerably
($ in millions)
Nonperforming Loans
NPLs NPL Ratio1 40%
1.42%
$1,731
0.83%
$1,037
3Q 12 3Q 13
Net Charge-Offs2
NCOs NCO Ratio3 47%
0.88%
$274
0.47%
$146
3Q 12 3Q 13
Higher Capital Ratios Provide
Increased Flexibility
8.0% 9.7%
3Q 12 Basel III Tier 1 4 3Q 13 Basel III Tier 1 4
Common Ratio Common Ratio
1. Represents reported NPLs / Total Loans
2. 3Q 12 net charge-offs and net charge-off ratio exclude $172 million of net charge-offs related to the sale of $0.5 billion nonperforming mortgage and CRE loans and $65 million related to a credit policy change regarding junior lien net charge-offs
3. Represents net charge-offs to average loans
4. Ratios were estimates at the time of the earnings release. Please refer to the appendix for the GAAP reconciliation
7
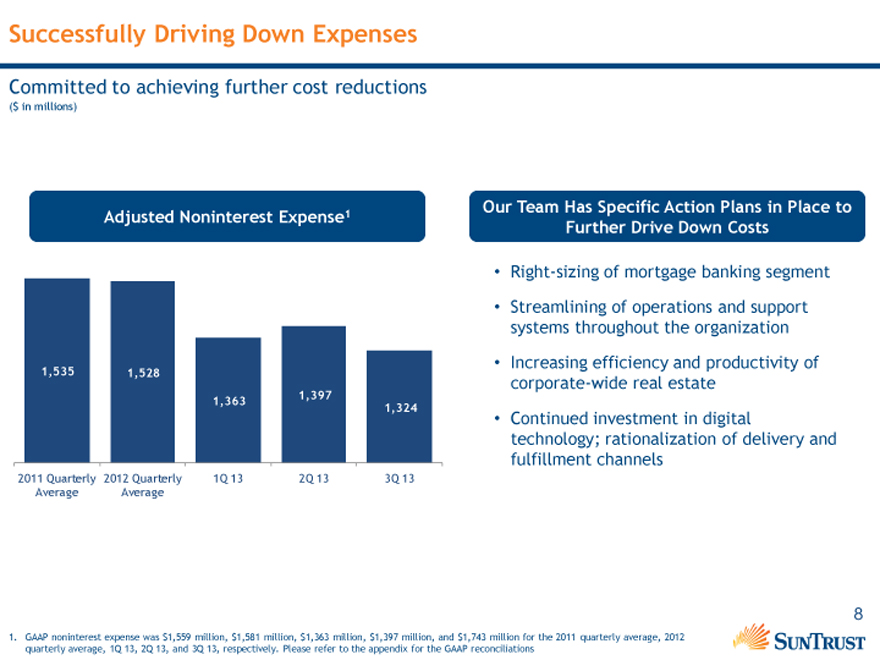
Successfully Driving Down Expenses
Committed to achieving further cost reductions
($ in millions)
Adjusted Noninterest Expense1
1,535 1,528
1,363 1,397
1,324
2011 Quarterly 2012 Quarterly 1Q 13 2Q 13 3Q 13
Average Average
Our Team Has Specific Action Plans in Place to Further Drive Down Costs
Right-sizing of mortgage banking segment
Streamlining of operations and support systems throughout the organization
Increasing efficiency and productivity of corporate-wide real estate
Continued investment in digital technology; rationalization of delivery and fulfillment channels
1. GAAP noninterest expense was $1,559 million, $1,581 million, $1,363 million, $1,397 million, and $1,743 million for the 2011 quarterly average, 2012 quarterly average, 1Q 13, 2Q 13, and 3Q 13, respectively. Please refer to the appendix for the GAAP reconciliations
8
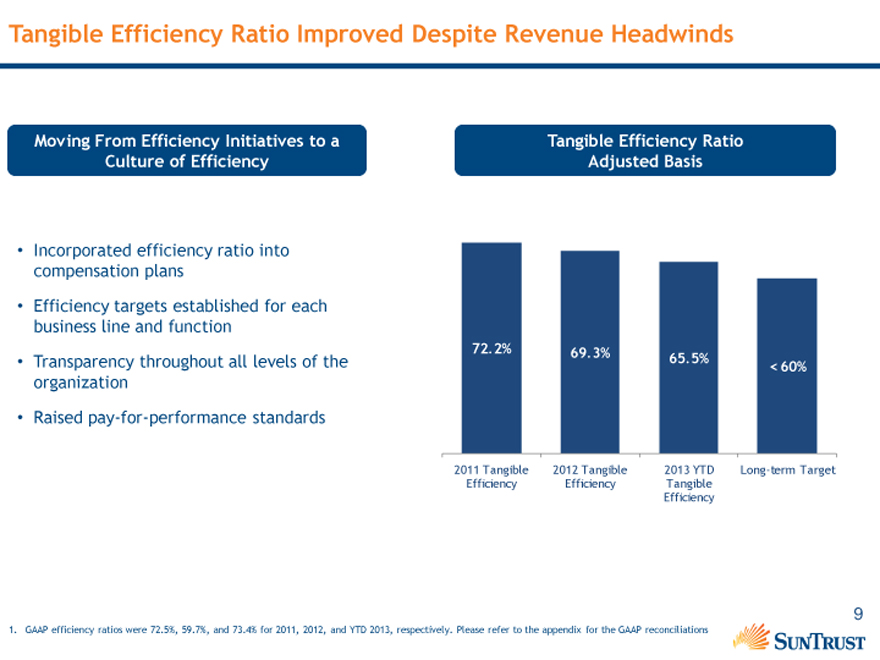
Tangible Efficiency Ratio Improved Despite Revenue Headwinds
Moving From Efficiency Initiatives to a Culture of Efficiency
Incorporated efficiency ratio into compensation plans
Efficiency targets established for each business line and function
Transparency throughout all levels of the organization
Raised pay-for-performance standards
Tangible Efficiency Ratio
Adjusted Basis
72.2% 69.3% 65.5%
< 60%
2011 Tangible 2012 Tangible 2013 YTD Long-term Target
Efficiency Efficiency Tangible
Efficiency
1. GAAP efficiency ratios were 72.5%, 59.7%, and 73.4% for 2011, 2012, and YTD 2013, respectively. Please refer to the appendix for the GAAP reconciliations
9
Revenue Initiatives
10
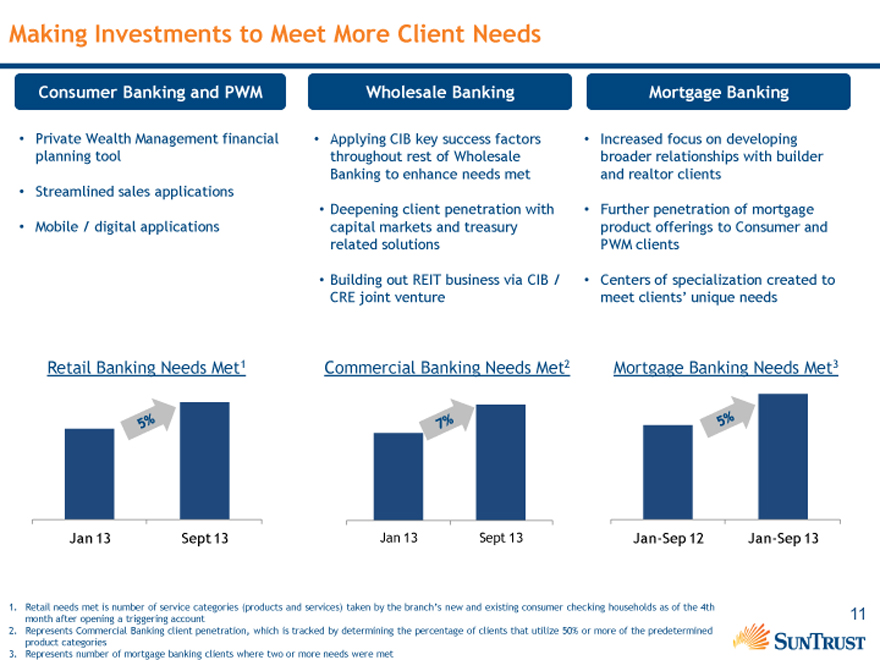
Making Investments to Meet More Client Needs
Consumer Banking and PWM
Private Wealth Management financial planning tool
Streamlined sales applications
Mobile / digital applications
Wholesale Banking
Applying CIB key success factors throughout rest of Wholesale Banking to enhance needs met
Deepening client penetration with capital markets and treasury related solutions
Building out REIT business via CIB / CRE joint venture
Mortgage Banking
Increased focus on developing broader relationships with builder and realtor clients
Further penetration of mortgage product offerings to Consumer and PWM clients
Centers of specialization created to meet clients’ unique needs
Retail Banking Needs Met1 5%
Jan 13 Sept 13
Commercial Banking Needs Met2 7%
Jan 13 Sept 13
Mortgage Banking Needs Met3 5%
Jan-Sep 12 Jan-Sep 13
1. Retail needs met is number of service categories (products and services) taken by the branch’s new and existing consumer checking households as of the 4th month after opening a triggering account
2. Represents Commercial Banking client penetration, which is tracked by determining the percentage of clients that utilize 50% or more of the predetermined product categories
3. Represents number of mortgage banking clients where two or more needs were met
11
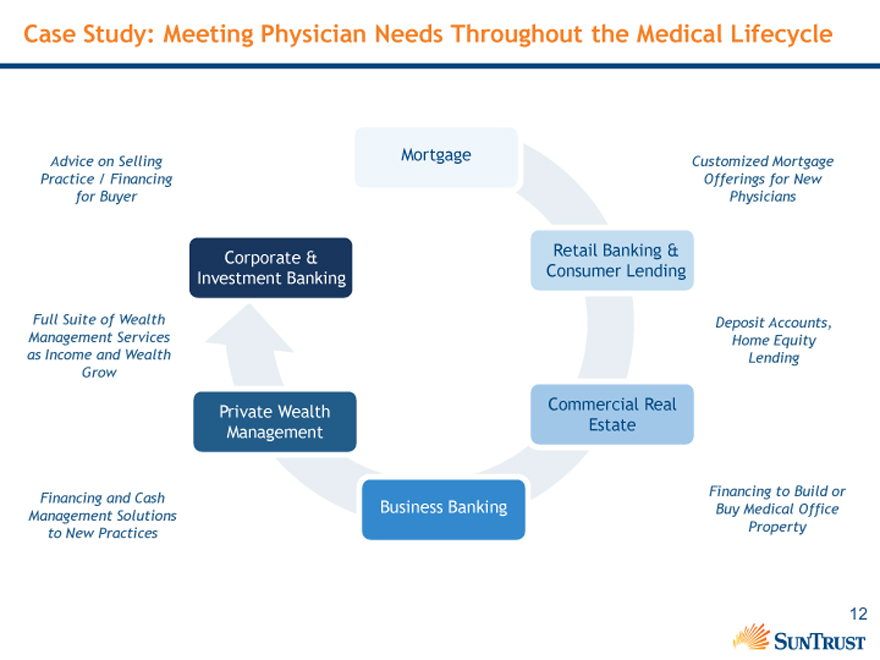
Case Study: Meeting Physician Needs Throughout the Medical Lifecycle
Advice on Selling Mortgage Customized Mortgage
Practice / Financing Offerings for New
for Buyer Physicians
Corporate & Retail Banking &
Investment Banking Consumer Lending
Full Suite of Wealth Deposit Accounts,
Management Services Home Equity
as Income and Wealth Lending
Grow
Private Wealth Commercial Real
Management Estate
Financing and Cash Financing to Build or
Management Solutions Business Banking Buy Medical Office
to New Practices Property
12
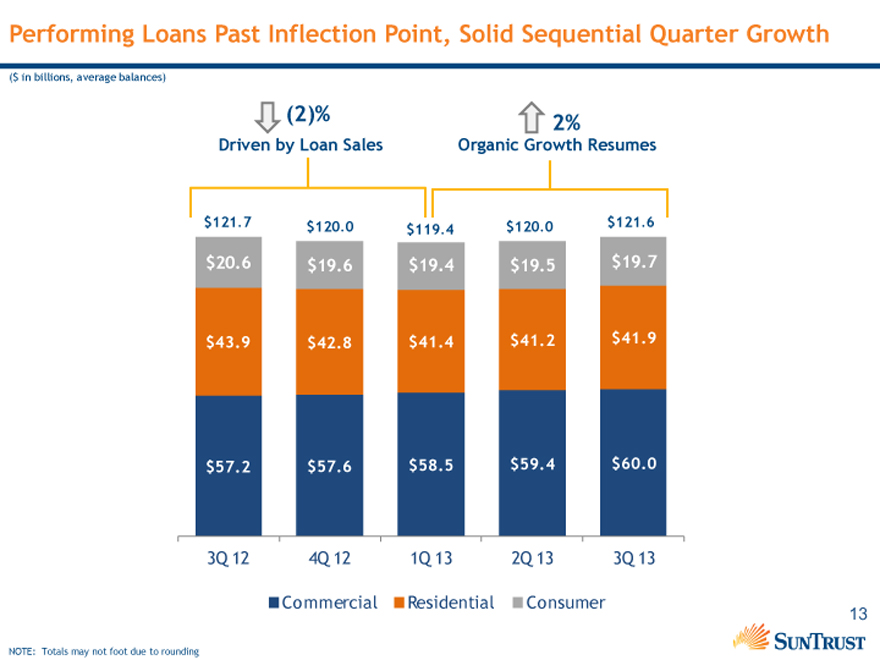
Performing Loans Past Inflection Point, Solid Sequential Quarter Growth
($ in billions, average balances)
(2)% 2%
Driven by Loan Sales Organic Growth Resumes
$121.7 $120.0 $119.4 $120.0 $121.6
$20.6 $19.6 $19.4 $19.5 $19.7
$43.9 $42.8 $41.4 $41.2 $41.9
$57.2 $57.6 $58.5 $59.4 $60.0
3Q 12 4Q 12 1Q 13 2Q 13 3Q 13
Commercial Residential Consumer
NOTE: Totals may not foot due to rounding
13
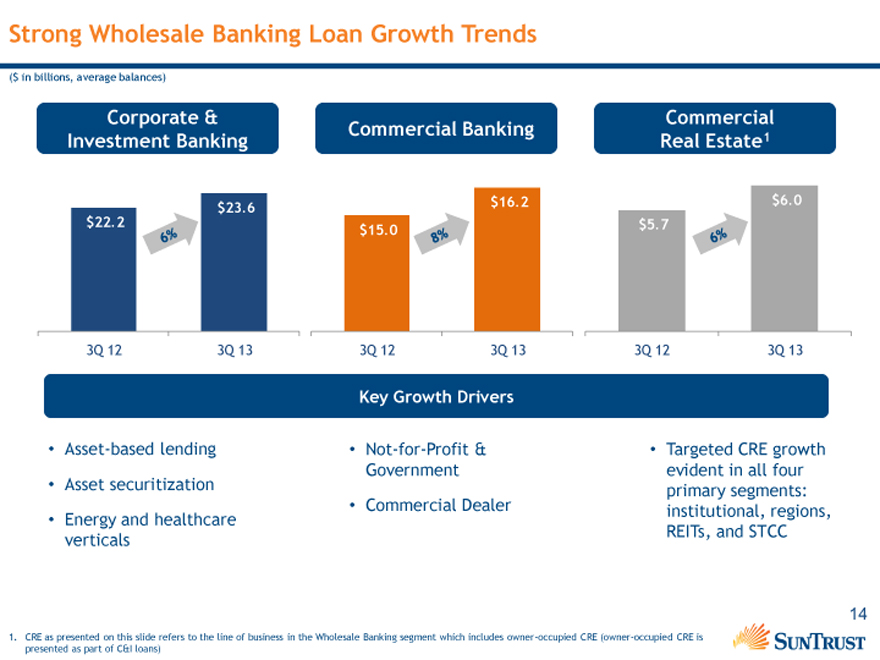
Strong Wholesale Banking Loan Growth Trends
($ in billions, average balances)
Corporate & Commercial
Commercial Banking
Investment Banking Real Estate1
$23.6 $16.2 $6.0 6% 8% 6%
$22.2 $15.0 $5.7
3Q 12 3Q 13 3Q 12 3Q 13 3Q 12 3Q 13
Key Growth Drivers
Asset-based lending Asset securitization Energy and healthcare verticals
Not-for-Profit & Government Commercial Dealer
Targeted CRE growth evident in all four primary segments: institutional, regions, REITs, and STCC
1. CRE as presented on this slide refers to the line of business in the Wholesale Banking segment which includes owner-occupied CRE (owner-occupied CRE is presented as part of C&I loans)
14
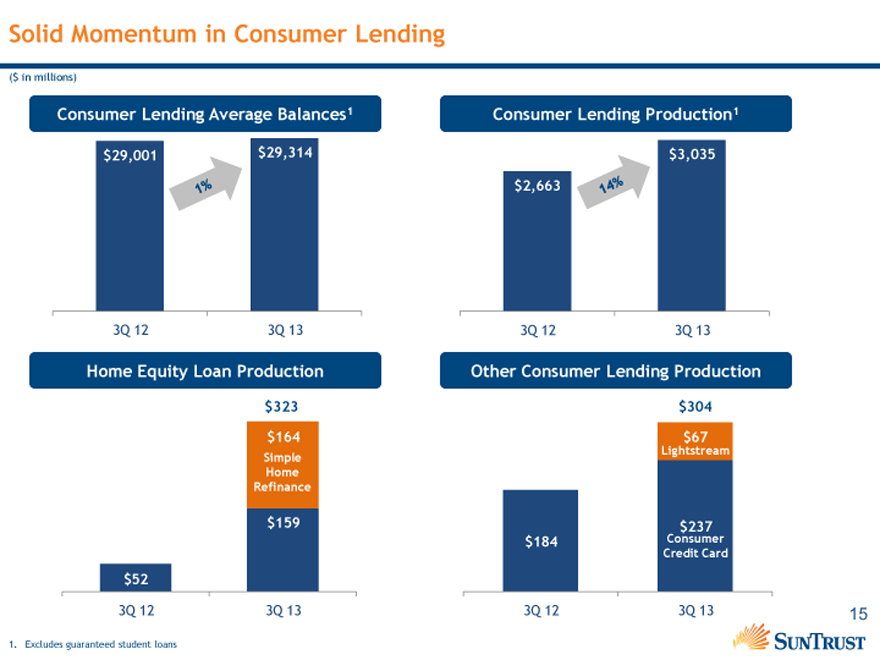
Solid Momentum in Consumer Lending
($ in millions)
Consumer Lending Average Balances1
$29,001 $29,314 1%
3Q 12 3Q 13
Home Equity Loan Production
$323
$164
Simple
Home
Refinance
$159
$52
3Q 12 3Q 13
Consumer Lending Production1
$3,035
$2,663 14%
3Q 12 3Q 13
Other Consumer Lending Production
$304
$67
Lightstream
$237
$184 Consumer
Credit Card
3Q 12 3Q 13
1. Excludes guaranteed student loans
15
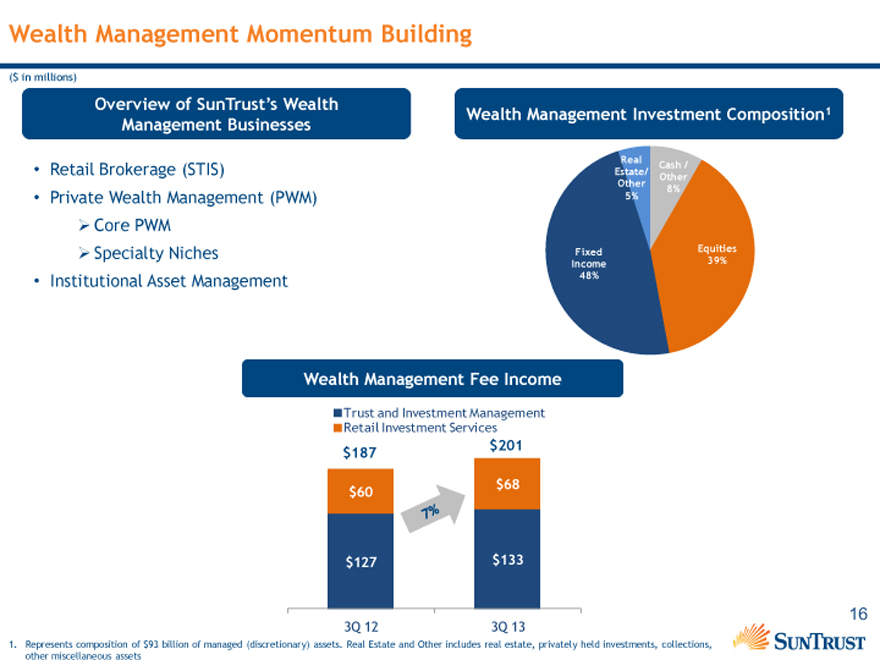
Wealth Management Momentum Building
($ in millions)
Overview of SunTrust’s Wealth
Management Businesses
Retail Brokerage (STIS)
Private Wealth Management (PWM) Core PWM
Specialty Niches
Institutional Asset Management
Wealth Management Investment Composition1
Real Cash /
Estate/ Other
Other 8%
5%
Fixed Equities
Income 39%
48%
Wealth Management Fee Income
Trust and Investment Management
Retail Investment Services
$187 $201
$60 $68
$127 $133
3Q 12 3Q 13
1. Represents composition of $93 billion of managed (discretionary) assets. Real Estate and Other includes real estate, privately held investments, collections, other miscellaneous assets
16
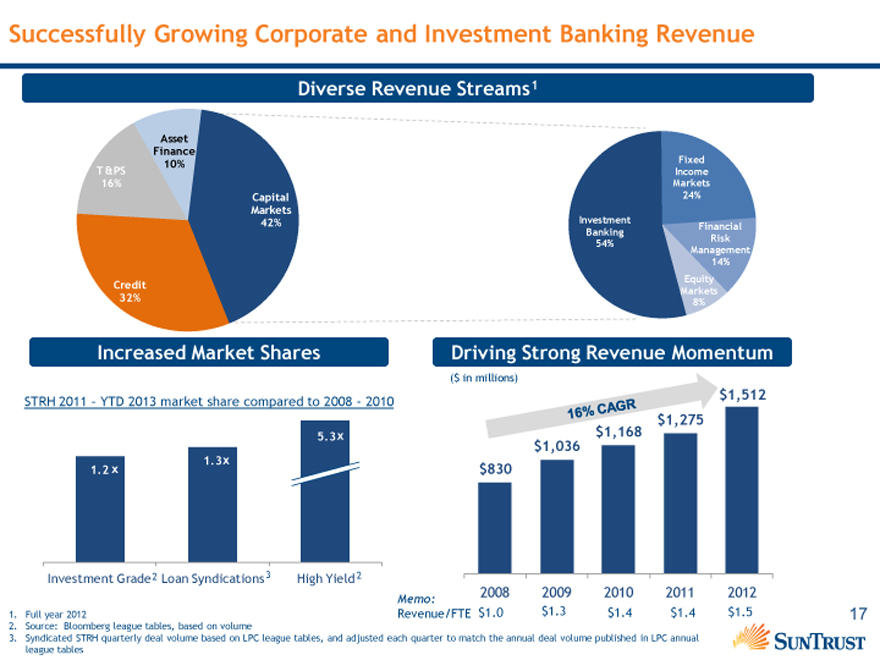
Successfully Growing Corporate and Investment Banking Revenue
Diverse Revenue Streams1
Asset
Finance
T &PS 10%
16%
Capital
Markets
42%
Credit
32%
Fixed
Income
Markets
24%
Investment
Banking Financial
54% Risk
Management
14%
Equity
Markets
8%
Increased Market Shares
STRH 2011 – YTD 2013 market share compared to 2008—2010
5.3 x
1.2 x 1.3x
Investment Grade 2 Loan Syndications 3 High Yield 2
Driving Strong Revenue Momentum
($ in millions)
$1,512
$1,275
$1,168
$1,036
$830
16% CAGR
Memo: 2008 2009 2010 2011 2012
Revenue/FTE $1.0 $1.3 $1.4 $1.4 $1.5
1. Full year 2012
2. Source: Bloomberg league tables, based on volume
3. Syndicated STRH quarterly deal volume based on LPC league tables, and adjusted each quarter to match the annual deal volume published in LPC annual league tables
17
Investment Thesis
Why sun Trust?
Attractive franchise with leading market shares, robust growth trajectory, and diverse revenue streams
Markets experiencing strong recovery
Demonstrated expense discipline; committed to long-term efficiency objectives
Further potential in improving overall return profile
18
Appendix
19
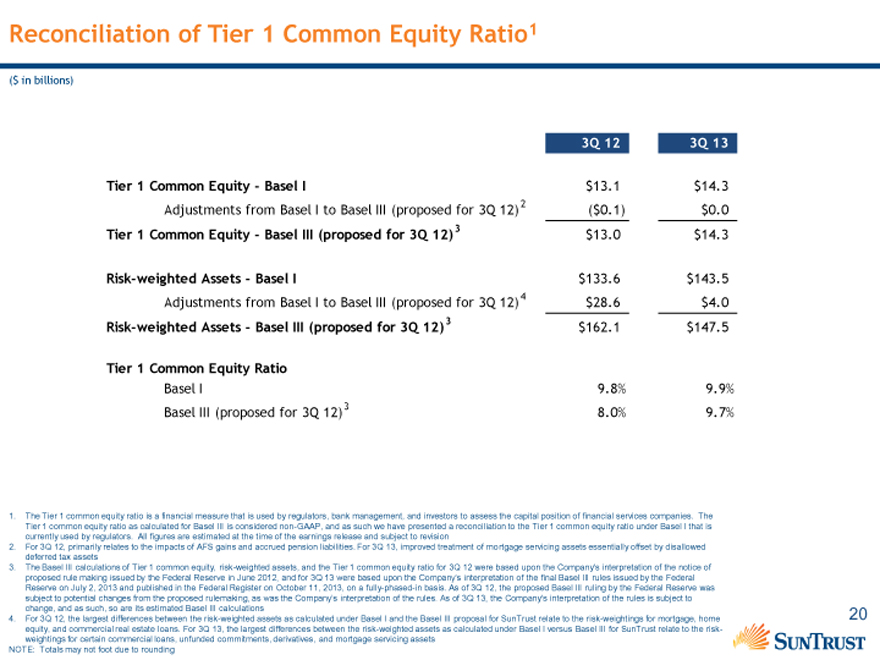
Reconciliation of Tier 1 Common Equity Ratio1
($ in billions)
3Q 12 3Q 13
Tier 1 Common Equity—Basel I $13.1 $14.3
Adjustments from Basel I to Basel III (proposed for 3Q 12) 2 ($0.1) $0.0
Tier 1 Common Equity—Basel III (proposed for 3Q 12) 3 $13.0 $14.3
Risk-weighted Assets—Basel I $133.6 $143.5
Adjustments from Basel I to Basel III (proposed for 3Q 12) 4 $28.6 $4.0
Risk-weighted Assets—Basel III (proposed for 3Q 12) 3 $162.1 $147.5
Tier 1 Common Equity Ratio
Basel I 9.8% 9.9%
Basel III (proposed for 3Q 12) 3 8.0% 9.7%
1. The Tier 1 common equity ratio is a financial measure that is used by regulators, bank management, and investors to assess the capital position of financial services companies. The Tier 1 common equity ratio as calculated for Basel III is considered non-GAAP, and as such we have presented a reconciliation to the Tier 1 common equity ratio under Basel I that is currently used by regulators. All figures are estimated at the time of the earnings release and subject to revision
2. For 3Q 12, primarily relates to the impacts of AFS gains and accrued pension liabilities. For 3Q 13, improved treatment of mortgage servicing assets essentially offset by disallowed deferred tax assets
3. The Basel III calculations of Tier 1 common equity, risk-weighted assets, and the Tier 1 common equity ratio for 3Q 12 were based upon the Company’s interpretation of the notice of proposed rule making issued by the Federal Reserve in June 2012, and for 3Q 13 were based upon the Company’s interpretation of the final Basel III rules issued by the Federal
Reserve on July 2, 2013 and published in the Federal Register on October 11, 2013, on a fully-phased-in basis. As of 3Q 12, the proposed Basel III ruling by the Federal Reserve was subject to potential changes from the proposed rulemaking, as was the Company’s interpretation of the rules. As of 3Q 13, the Company’s interpretation of the rules is subject to change, and as such, so are its estimated Basel III calculations
4. For 3Q 12, the largest differences between the risk-weighted assets as calculated under Basel I and the Basel III proposal for SunTrust relate to the risk-weightings for mortgage, home equity, and commercial real estate loans. For 3Q 13, the largest differences between the risk-weighted assets as calculated under Basel I versus Basel III for SunTrust relate to the risk-weightings for certain commercial loans, unfunded commitments, derivatives, and mortgage servicing assets NOTE: Totals may not foot due to rounding
20
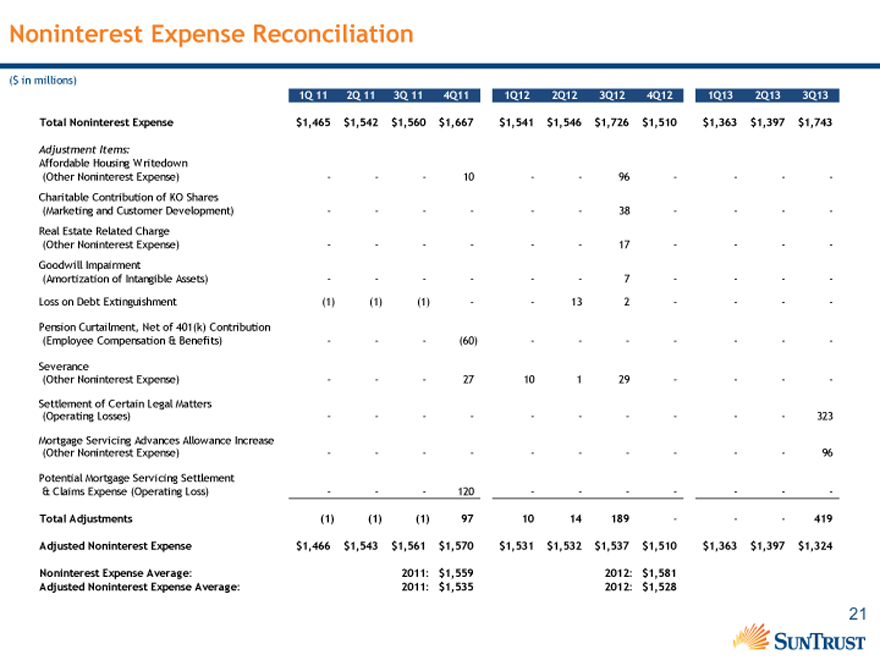
Noninterest Expense Reconciliation
($ in millions)
1Q 11 2Q 11 3Q 11 4Q11 1Q12 2Q12 3Q12 4Q12 1Q13 2Q13 3Q13
Total Noninterest Expense $1,465 $1,542 $1,560 $1,667 $1,541 $1,546 $1,726 $1,510 $1,363 $1,397 $1,743
Adjustment Items:
Affordable Housing Writedown
(Other Noninterest Expense) 10 96
Charitable Contribution of KO Shares
(Marketing and Customer Development) 38
Real Estate Related Charge
(Other Noninterest Expense) 17
Goodwill Impairment
(Amortization of Intangible Assets) 7
Loss on Debt Extinguishment (1) (1) (1) 13 2
Pension Curtailment, Net of 401(k) Contribution
(Employee Compensation & Benefits) (60)
Severance
(Other Noninterest Expense) 27 10 1 29
Settlement of Certain Legal Matters
(Operating Losses) 323
Mortgage Servicing Advances Allowance Increase
(Other Noninterest Expense) 96
Potential Mortgage Servicing Settlement
& Claims Expense (Operating Loss) 120
Total Adjustments (1) (1) (1) 97 10 14 189 419
Adjusted Noninterest Expense $1,466 $1,543 $1,561 $1,570 $1,531 $1,532 $1,537 $1,510 $1,363 $1,397 $1,324
Noninterest Expense Average: 2011: $1,559 2012: $1,581
Adjusted Noninterest Expense Average: 2011: $1,535 2012: $1,528
21
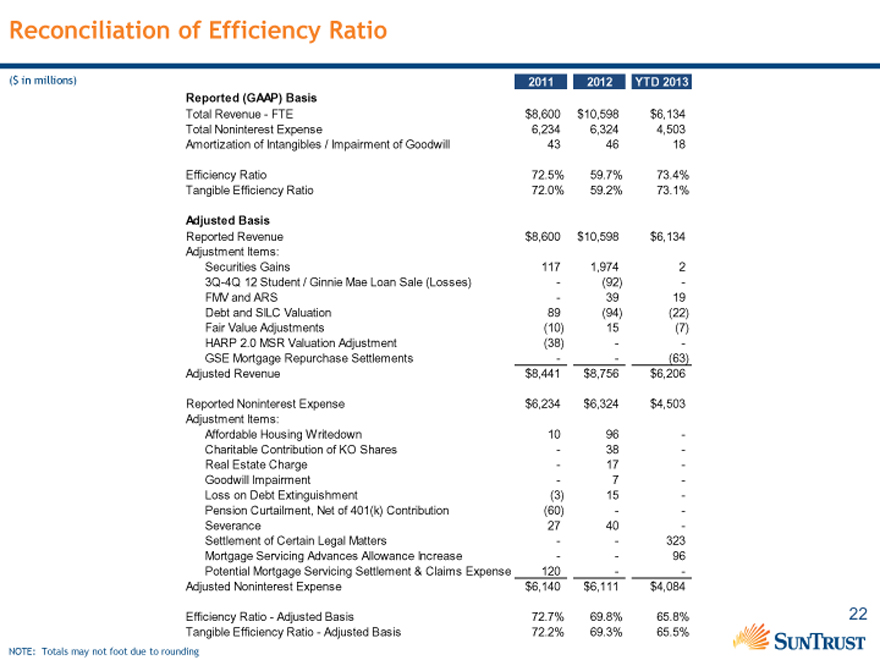
Reconciliation of Efficiency Ratio
($ in millions) 2011 2012 YTD 2013
Reported (GAAP) Basis
Total Revenue—FTE $8,600 $10,598 $6,134
Total Noninterest Expense 6,234 6,324 4,503
Amortization of Intangibles / Impairment of Goodwill 43 46 18
Efficiency Ratio 72.5% 59.7% 73.4%
Tangible Efficiency Ratio 72.0% 59.2% 73.1%
Adjusted Basis
Reported Revenue $8,600 $10,598 $6,134
Adjustment Items:
Securities Gains 117 1,974 2
3Q-4Q 12 Student / Ginnie Mae Loan Sale (Losses) (92)
FMV and ARS 39 19
Debt and SILC Valuation 89 (94) (22)
Fair Value Adjustments (10) 15 (7)
HARP 2.0 MSR Valuation Adjustment (38)
GSE Mortgage Repurchase Settlements (63)
Adjusted Revenue $8,441 $8,756 $6,206
Reported Noninterest Expense $6,234 $6,324 $4,503
Adjustment Items:
Affordable Housing Writedown 10 96
Charitable Contribution of KO Shares 38
Real Estate Charge 17
Goodwill Impairment 7
Loss on Debt Extinguishment (3) 15
Pension Curtailment, Net of 401(k) Contribution (60)
Severance 27 40
Settlement of Certain Legal Matters 323
Mortgage Servicing Advances Allowance Increase 96
Potential Mortgage Servicing Settlement & Claims Expense 120
Adjusted Noninterest Expense $6,140 $6,111 $4,084
Efficiency Ratio-Adjusted Basis 72.7% 69.8% 65.8%
Tangible Efficiency Ratio-Adjusted Basis 72.2% 69.3% 65.5%
NOTE: Totals may not foot due to rounding
22
BancAnalysts Association of Boston Conference
Aleem Gillani, Chief Financial Officer, SunTrust Banks, Inc.
November 7, 2013