QNB Corp. and Subsidiary 2001 Annual Report
A Message to Shareholders: Significant Milestones in 2001

As we begin the celebration of the Bank’s 125th Anniversary, it is my pleasure to present the 2001 Annual Report. The year 2001 represented the achievement of a major financial milestone for your company. A little over five years ago, in the fall of 1996, our Board of Directors and the Senior Management Team of QNB established a five-year financial plan. At that time, we established a goal of 10 percent compounded earnings per share growth, for five years, over the base year of 1996. It is with pride that I report the plan has been achieved. We were also able to achieve that financial goal while opening a new branch, entering new lines of business, investing in technology and operating in changing economic environments.
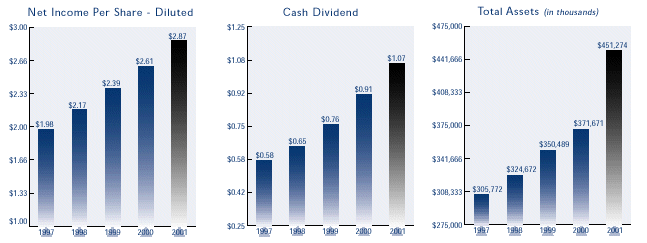
QNB Corp.’s financial performance remains strong — net income for 2001 was $4,436,000 or $2.87 per share diluted. These results represent the sixth consecutive year of record earnings. This converts to a return on average assets of 1.07 percent and a return on average equity of 13.54 percent.
We took several actions during the past year to enhance share value. We increased the cash dividend by 17.6 percent to $1.07 per share. This was the sixth consecutive year of cash dividend increases in excess of 10 percent per year. We also declared a five percent stock dividend for the second consecutive year. In addition, we continued repurchasing shares during the year to increase return on equity and earnings per share. Factoring in the cash dividend and the stock dividend, the annual equivalent total return in 2001 on a share of QNB Corp. stock was 23.43 percent.
The financial success of the company was made possible by the dedication and hard work of all of our employees. I want to thank them and you, our shareholders, for your continued support and confidence in QNB Corp.
The following sections represent highlights from 2001 as reported by the members of QNB’s management team.

Thomas J Bisko President
& CEO
Loans and Deposits — our core business...
Deposit generation was extremely strong, increasing seven percent in 2001 to $312 million. We attribute that growth to three factors: our new branch in Souderton, our innovative deposit products, and a second consecutive year of generally declining stock market values.
The opening of the Souderton Branch in January 2001 provided us with the opportunity to serve the financial needs of many new individuals, families and businesses in the Indian Valley area. The new branch reached the growth targets we established for that location.
Also during 2001, a team of employees met several times to analyze our various other markets in order to create strategies for continued solid growth in deposits. One of the recommendations from that team was to simplify and improve consumer checking. Based on their recommendations, we developed a Free Personal Checking account.
The popularity of that account, which was launched in the fourth quarter of the year, has already been noticed. Our new account openings tripled in volume, and close to 60 percent of the Free Personal Checking account customers are new to the Bank.
The lending area also had one of its best years. For the first time in history, total loans outstanding reached $200 million, ending the year at $202.2 million. This represents a 9.2 percent increase over loans outstanding at year-end 2000.
All loan categories experienced significant growth. Residential mortgage demand surged, requiring a team effort to meet this demand while continuing to provide a high level of customer service. Mortgage settlements totaled approximately $23 million, resulting in $195,000 of gains on sales of mortgages for the year. Commercial loan growth was solid, fueled in part by 37 new customer relationships. Consumer loan activity reached a level unprecedented in recent years, as total new loans increased almost 50 percent over the prior year.
During this year of activity and growth in the loan portfolio, asset quality remained intact. Delinquent loans, non-accrual loans, and non-performing loans remained within acceptable measures. Charged-off loans were minimal, and, for the second consecutive year, there was no provision for loan loss expense.
The investment portfolio continued to grow also as a result of the inflows of deposits. The portfolio ended the year at $211 million, an increase of 34.1% from last year. The yield on the securities portfolio is in the top quartile when compared to similar sized institutions.
QNB Corp. and Subsidiary 2001 Annual Report

Better service through Technology...
Electronic transaction processing experienced tremendous growth in popularity among our customers. Fully 40 percent of our transaction volume is now purely digital. Electronic transactions ensure customers the utmost in security, accuracy, and prompt processing. Direct Deposits of Payroll or Social Security Benefits, Direct Debits to pay phone or cable bills, ATM withdrawals, and customer-initiated Electronic Bill Payments are now handled at the speed of light entirely within the digital domain.
Our state-of-the-art information systems enable customers easy and quick access to account information:
| • | | Account Access, our 24-hour telephone banking system processes more than 23,000 phone calls per month on average — giving customers unlimited access to their account information from any touch-tone phone. |
| |
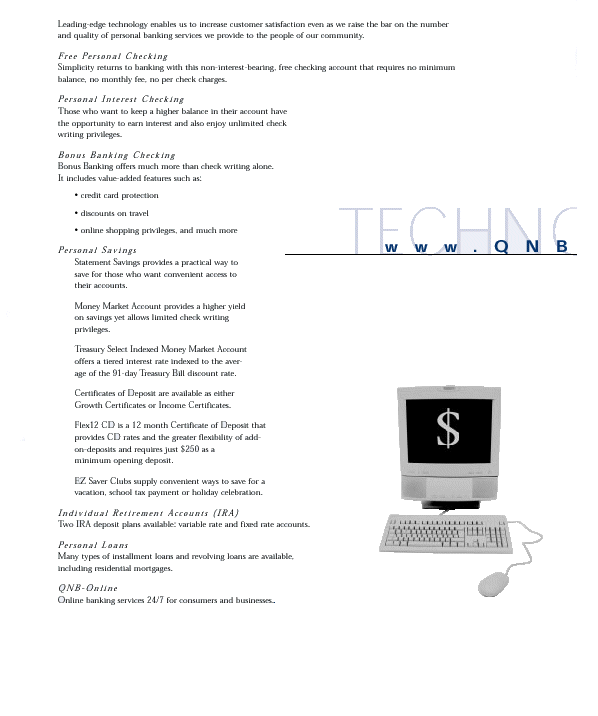
| • | | QNB-Online has been adopted by more than 18 percent of our deposit customer base since it was introduced in Spring of 1999. This makes it one of the most rapidly accepted delivery channels in Bank history. It is available around the clock, provides the most up-to-date online information, and dynamically interfaces with our ATMs, Teller Terminals, and Visa Check Card processors to provide customers the most current information. QNB-Online Bill Payment, an optional feature of our QNB-Online product, continues to grow in popularity. Eighteen percent of our on-line customers have elected this cost-effective and efficient method of paying their bills. |
| |
| • | | A centralized Customer Service Center (CSC) works to answer customers’ questions about any QNB product. In addition, CSC staff are able to assist customers with account questions, funds transfers, and new account openings by phone, email, or U.S. Mail. |
Sales and Service, a Strategic Initiative...
During 2001 our Strategic Planning Committee formalized the goal of creating a sales environment at QNB. The new sales initiative will reward employees for identifying potential customers for our products and services, and merging the needs of our existing customers with the right product. The sales initiative, while looking to increase product sales for the Bank, does not detract from our customer-centric mission of always doing what is “best” for the customer. 2001 was just the first year of what we expect to be a multi-year process of creating a vibrant sales culture at QNB.
The Strategic Planning Committee also reaffirmed our commitment to our customers with a new Statement of Values:“We will help you achieve your goals by providing a total financial relationship built upon exceptional personal service and a sincere interest in your success.”
While QNB has always scored high on customer service surveys and was recognized again last year, for the second year in a row, as the “Best Bank” in a local newspaper, we want to make sure we continue to offer “exceptional personal service”. Last year we established an internal service committee comprised of employees from various areas of the bank. It is their mission to challenge everything we do as it relates to customer service and to look for ways to continually improve on our already high standards for service. We want to distinguish ourselves from our competition based on that exceptional service, and are confident that the Service Quality Team will help us achieve that goal.
Ongoing sense of Community...
QNB has always prided itself not only in the financial aspects of what we do, but also on being a good corporate citizen. For example, Habitat for Humanity of Bucks County expanded into the Upper Bucks area in 2001. QNB is proud to be a part of Habitat’s mission: to make decent shelter a matter of conscience and action within our own community. We embraced the opportunity to participate in the financing and construction of their Emerald Hollow development, which when completed, will provide affordable housing for 25 families in our area.
This project is just one example of the many organizations we help in our area through donations and, maybe more importantly, the cumulative contribution of thousands of hours of volunteer time from our employees.
Donald T. Knauss retired in 2001 after 48 years of service on the Board of Directors. The vibrant leadership and service of Donald Knauss as a Director is very much appreciated and will never be forgotten.
1
QNB Corp. and Subsidiary 2001 Annual Report
2
QNB Corp. and Subsidiary 2001 Annual Report

3
QNB Corp. and Subsidiary 2001 Annual Report
We provide the tools and technology to enable our business customers to maintain the intense competitive edge required for success in a wired, global marketplace. More important, our experienced business banking
managers offer a comprehensive range of services in uniquely personal ways. As active members of our communities, they share a local perspective with their customers that is becoming increasingly uncommon in financial circles today.
Business Checking
An entire spectrum of checking accounts available: Small Business Checking,
Nonprofit Business Checking, Community Service Checking, and Business Interest Checking.
| | | |
Money Market Accounts
A Business Money Market Account provides a higher yield while
allowing limited check writing privileges. Treasury Select Indexed
Money Market Account offers a tiered interest rate indexed to
the average of the 91-day Treasury Bill discount rate.
Cash Management
Custom cash management services tailored to the needs
of your business help to maximize your money.
Commercial Loans
Various types of loans available to meet the
specific financing requirements of virtually any
enterprise: Term Loans, Lines of Credit, Letters
of Credit, Commercial Mortgages, Equipment
Loans, Working Capital Loans, and Loans for
Non-Profit Organizations.
QNB — Online for Business
Complete and secure access to your accounts
is yours along with comprehensive cash
management for your business. Check balances,
view histories, transfer funds, pay bills and payroll
online, originate ACH payments and receipts, initiate
wire transfers and EFT payments, and more!
Merchant Processing
Paper processing or electronic terminal
processing available.
ACH/Direct Deposit Payroll
Automated Clearing House (ACH) processing
comprises a nationwide electronic payments and
collection system used to save time and minimize
inconvenience to both employer and employee.
| |
 |

5
QNB Corp. and Subsidiary 2001 Annual Report
FINANCIAL HIGHLIGHTS
| | | | | | | | | | | | | | | | | | | | | |
| | | (in thousands, except per share data) |
| | |
|
| Year Ended December 31, | | 2001 | | 2000 | | 1999 | | 1998 | | 1997 |
| |
| |
| |
| |
| |
|
Financial Performance | | | | | | | | | | | | | | | | | | | | |
|
|
|
|
| Net interest income | | $ | 13,524 | | | $ | 12,691 | | | $ | 12,891 | | | $ | 12,621 | | | $ | 12,056 | |
|
|
|
|
| Provision for loan losses | | | – | | | | – | | | | 240 | | | | 400 | | | | 400 | |
|
|
|
|
| Non-interest income | | | 3,070 | | | | 2,791 | | | | 2,208 | | | | 2,149 | | | | 1,919 | |
|
|
|
|
| Non-interest expense | | | 11,080 | | | | 10,232 | | | | 9,884 | | | | 9,650 | | | | 9,191 | |
|
|
|
|
| Net income | | | 4,436 | | | | 4,106 | | | | 3,801 | | | | 3,448 | | | | 3,131 | |
|
|
|
|
| | | | | | | | | | | | | | | | | | | | | |
|
|
|
|
Per Share Data | | | | | | | | | | | | | | | | | | | | |
|
|
|
|
| Net income — basic* | | $ | 2.87 | | | $ | 2.61 | | | $ | 2.40 | | | $ | 2.18 | | | $ | 1.99 | |
|
|
|
|
| Net income — diluted* | | | 2.87 | | | | 2.61 | | | | 2.39 | | | | 2.17 | | | | 1.98 | |
|
|
|
|
| Book value* | | | 22.92 | | | | 20.41 | | | | 17.24 | | | | 17.84 | | | | 16.29 | |
|
|
|
|
| Cash dividends | | | 1.07 | | | | .91 | | | | .76 | | | | .65 | | | | .58 | |
|
|
|
|
| | | | | | | | | | | | | | | | | | | | | |
|
|
|
|
Selected Average Balances | | | | | | | | | | | | | | | | | | | | |
|
|
|
|
| Total assets | | $ | 412,899 | | | $ | 363,516 | | | $ | 344,543 | | | $ | 310,492 | | | $ | 288,698 | |
|
|
|
|
| Total earning assets | | | 387,650 | | | | 341,011 | | | | 322,363 | | | | 292,000 | | | | 272,226 | |
|
|
|
|
| Investment securities | | | 187,984 | | | | 158,389 | | | | 143,716 | | | | 116,241 | | | | 107,087 | |
|
|
|
|
| Loans, net of unearned income | | | 191,994 | | | | 178,881 | | | | 174,912 | | | | 169,800 | | | | 161,096 | |
|
|
|
|
| Deposits | | | 312,509 | | | | 292,273 | | | | 284,516 | | | | 271,690 | | | | 253,366 | |
|
|
|
|
| Borrowed funds | | | 64,337 | | | | 37,245 | | | | 27,827 | | | | 9,468 | | | | 8,911 | |
|
|
|
|
| Shareholders’ equity | | | 32,756 | | | | 30,991 | | | | 28,880 | | | | 26,323 | | | | 23,886 | |
|
|
|
|
| | | | | | | | | | | | | | | | | | | | | |
|
|
|
|
Balance Sheet Data | | | | | | | | | | | | | | | | | | | | |
|
|
|
|
| Total assets | | $ | 451,274 | | | $ | 371,671 | | | $ | 350,489 | | | $ | 324,672 | | | $ | 305,772 | |
|
|
|
|
| Investment securities available-for-sale | | | 168,102 | | | | 114,245 | | | | 97,609 | | | | 70,088 | | | | 75,920 | |
|
|
|
|
| Investment securities held-to-maturity | | | 42,798 | | | | 42,982 | | | | 48,302 | | | | 50,065 | | | | 40,400 | |
|
|
|
|
| Loans, net of unearned income | | | 202,211 | | | | 185,234 | | | | 173,764 | | | | 176,443 | | | | 167,720 | |
|
|
|
|
| Deposits | | | 344,731 | | | | 293,822 | | | | 286,166 | | | | 279,223 | | | | 267,166 | |
|
|
|
|
| Borrowed funds | | | 66,451 | | | | 42,819 | | | | 33,925 | | | | 14,491 | | | | 10,342 | |
|
|
|
|
| Shareholders’ equity | | | 35,219 | | | | 31,794 | | | | 27,462 | | | | 28,338 | | | | 25,832 | |
|
|
|
|
| | | | | | | | | | | | | | | | | | | | | |
|
|
|
|
Selected Ratios | | | | | | | | | | | | | | | | | | | | |
|
|
|
|
| Return on average assets | | | 1.07 | % | | | 1.13 | % | | | 1.10 | % | | | 1.11 | % | | | 1.08 | % |
|
|
|
|
| Return on average shareholders’ equity | | | 13.54 | | | | 13.25 | | | | 13.16 | | | | 13.10 | | | | 13.11 | |
|
|
|
|
| Net interest margin | | | 3.81 | | | | 4.02 | | | | 4.23 | | | | 4.51 | | | | 4.60 | |
|
|
|
|
| Average shareholders’ equity to average total assets | | | 7.93 | | | | 8.53 | | | | 8.38 | | | | 8.48 | | | | 8.27 | |
*Adjusted for 5% stock dividend issued June 29, 2001 and June 30, 2000
6
TABLE OF CONTENTS
QNB Corp. and Subsidiary 2001 Annual Report
| | | | | |
| Management’s Discussion and Analysis | | | 7 | |
|
|
|
|
| Consolidated Balance Sheets | | | 33 | |
|
|
|
|
| Consolidated Statements of Income | | | 34 | |
|
|
|
|
| Consolidated Statements of Shareholders’ Equity | | | 35 | |
|
|
|
|
| Consolidated Statements of Cash Flows | | | 36 | |
|
|
|
|
| Notes to Consolidated Financial Statements | | | 37 | |
|
|
|
|
| Independent Auditor’s Report | | | 50 | |
|
|
|
|
| Corporate Information | | | 51 | |
|
|
|
|
| Directors, Officers & Office Locations | | | 52 | |
MANAGEMENT’S DISCUSSION AND ANALYSIS
Average Balances, Rates, and Interest Income and Expense Summary(Tax-Equivalent Basis)
| | | | | | | | | | | | | | | | | | | | | | | | | | | | | | | | | | | | | | | |
| | | | | 2001 | | 2000 | | 1999 |
| | | | |
| |
| |
|
| | | | | Average | | Average | | | | | | Average | | Average | | | | | | Average | | Average | | | | |
| | | | | Balance | | Rate | | Interest | | Balance | | Rate | | Interest | | Balance | | Rate | | Interest |
| | | | |
| |
| |
| |
| |
| |
| |
| |
| |
|
Assets | | | | | | | | | | | | | | | | | | | | | | | | | | | | | | | | | | | | |
|
|
|
|
| Interest-bearing balances | | $ | 306 | | | | 4.49 | % | | $ | 14 | | | $ | 381 | | | | 5.40 | % | | $ | 21 | | | $ | 133 | | | | 3.52 | % | | $ | 5 | |
|
|
|
|
| Federal funds sold | | | 7,366 | | | | 3.83 | | | | 282 | | | | 3,360 | | | | 6.43 | | | | 216 | | | | 3,602 | | | | 5.20 | | | | 187 | |
|
|
|
|
| Investment securities available-for-sale: | | | | | | | | | | | | | | | | | | | | | | | | | | | | | | | | | | | | |
|
|
|
|
| | Taxable | | | 129,284 | | | | 6.51 | | | | 8,411 | | | | 103,715 | | | | 6.66 | | | | 6,908 | | | | 89,053 | | | | 6.46 | | | | 5,756 | |
|
|
|
|
| | Tax-exempt | | | 15,828 | | | | 7.36 | | | | 1,165 | | | | 8,772 | | | | 7.46 | | | | 654 | | | | 4,224 | | | | 7.18 | | | | 303 | |
|
|
|
|
| Investment securities held-to-maturity: | | | | | | | | | | | | | | | | | | | | | | | | | | | | | | | | | | | | |
|
|
|
|
| | Taxable | | | 24,197 | | | | 6.20 | | | | 1,500 | | | | 26,005 | | | | 6.43 | | | | 1,671 | | | | 32,231 | | | | 6.39 | | | | 2,058 | |
|
|
|
|
| | Tax-exempt | | | 18,675 | | | | 6.90 | | | | 1,288 | | | | 19,897 | | | | 6.93 | | | | 1,378 | | | | 18,208 | | | | 6.94 | | | | 1,264 | |
| | | |
| | | |
| | | |
| | | |
| | | |
| | | |
| | | |
| | | |
| | | |
| |
| | | Total investment securities | | | 187,984 | | | | 6.58 | | | | 12,364 | | | | 158,389 | | | | 6.70 | | | | 10,611 | | | | 143,716 | | | | 6.53 | | | | 9,381 | |
|
|
|
|
| Loans, net of unearned income | | | 191,994 | | | | 8.08 | | | | 15,512 | | | | 178,881 | | | | 8.30 | | | | 14,855 | | | | 174,912 | | | | 8.22 | | | | 14,380 | |
| | | |
| | | |
| | | |
| | | |
| | | |
| | | |
| | | |
| | | |
| | | |
| |
| | | Total earning assets | | | 387,650 | | | | 7.27 | | | | 28,172 | | | | 341,011 | | | | 7.54 | | | | 25,703 | | | | 322,363 | | | | 7.43 | | | | 23,953 | |
|
|
|
|
| Cash and due from banks | | | 12,882 | | | | | | | | | | | | 11,811 | | | | | | | | | | | | 12,137 | | | | | | | | | |
|
|
|
|
| Allowance for loan losses | | | (2,931 | ) | | | | | | | | | | | (3,096 | ) | | | | | | | | | | | (3,065 | ) | | | | | | | | |
|
|
|
|
| Other assets | | | 15,298 | | | | | | | | | | | | 13,790 | | | | | | | | | | | | 13,108 | | | | | | | | | |
| | | |
| | | | | | | | | | | |
| | | | | | | | | | | |
| | | | | | | | | |
| | | Total assets | | $ | 412,899 | | | | 6.82 | % | | | | | | $ | 363,516 | | | | 7.07 | % | | | | | | $ | 344,543 | | | | 6.95 | % | | | | |
| | | |
| | | |
| | | | | | | |
| | | |
| | | | | | | |
| | | |
| | | | | |
Liabilities and Shareholders’ Equity | | | | | | | | | | | | | | | | | | | | | | | | | | | | | | | | | | | | |
|
|
|
|
| Interest-bearing deposits | | | | | | | | | | | | | | | | | | | | | | | | | | | | | | | | | | | | |
|
|
|
|
| Interest-bearing demand accounts | | $ | 50,106 | | | | .91 | % | | | 455 | | | $ | 48,202 | | | | 1.37 | % | | | 659 | | | $ | 45,339 | | | | 1.06 | % | | | 481 | |
|
|
|
|
| Money market deposit accounts | | | 37,982 | | | | 2.78 | | | | 1,056 | | | | 36,273 | | | | 3.64 | | | | 1,320 | | | | 30,684 | | | | 2.58 | | | | 793 | |
|
|
|
|
| Savings accounts | | | 36,684 | | | | 1.63 | | | | 596 | | | | 36,310 | | | | 1.95 | | | | 709 | | | | 37,312 | | | | 1.86 | | | | 693 | |
|
|
|
|
| Time deposits | | | 126,629 | | | | 5.32 | | | | 6,731 | | | | 116,422 | | | | 5.45 | | | | 6,344 | | | | 112,109 | | | | 5.20 | | | | 5,830 | |
|
|
|
|
| Time deposits of $100,000 or more | | | 25,915 | | | | 5.10 | | | | 1,321 | | | | 19,680 | | | | 5.62 | | | | 1,107 | | | | 23,289 | | | | 5.33 | | | | 1,241 | |
| | | |
| | | |
| | | |
| | | |
| | | |
| | | |
| | | |
| | | |
| | | |
| |
| | | Total interest-bearing deposits | | | 277,316 | | | | 3.66 | | | | 10,159 | | | | 256,887 | | | | 3.95 | | | | 10,139 | | | | 248,733 | | | | 3.63 | | | | 9,038 | |
|
|
|
|
| Short-term borrowings | | | 16,195 | | | | 3.33 | | | | 539 | | | | 12,245 | | | | 4.21 | | | | 516 | | | | 10,813 | | | | 3.50 | | | | 378 | |
|
|
|
|
| Federal Home Loan Bank advances | | | 48,142 | | | | 5.62 | | | | 2,706 | | | | 25,000 | | | | 5.41 | | | | 1,352 | | | | 17,014 | | | | 5.22 | | | | 888 | |
| | | |
| | | |
| | | |
| | | |
| | | |
| | | |
| | | |
| | | |
| | | |
| |
| | | Total interest-bearing liabilities | | | 341,653 | | | | 3.92 | | | | 13,404 | | | | 294,132 | | | | 4.08 | | | | 12,007 | | | | 276,560 | | | | 3.73 | | | | 10,304 | |
| | | |
| | | |
| | | |
| | | |
| | | |
| | | |
| | | |
| | | |
| | | |
| |
| Non-interest-bearing deposits | | | 35,193 | | | | | | | | | | | | 35,386 | | | | | | | | | | | | 35,783 | | | | | | | | | |
|
|
|
|
| Other liabilities | | | 3,297 | | | | | | | | | | | | 3,007 | | | | | | | | | | | | 3,320 | | | | | | | | | |
|
|
|
|
| Shareholders’ equity | | | 32,756 | | | | | | | | | | | | 30,991 | | | | | | | | | | | | 28,880 | | | | | | | | | |
| | | |
| | | | | | | | | | | |
| | | | | | | | | | | |
| | | | | | | | | |
| | | Total liabilities and shareholders’ equity | | $ | 412,899 | | | | 3.25 | % | | | | | | $ | 363,516 | | | | 3.30 | % | | | | | | $ | 344,543 | | | | 2.99 | % | | | | |
| | | |
| | | |
| | | | | | | |
| | | |
| | | | | | | |
| | | |
| | | | | |
| Net interest rate spread | | | | | | | 3.35 | % | | | | | | | | | | | 3.46 | % | | | | | | | | | | | 3.70 | % | | | | |
| | | | | | | |
| | | | | | | | | | | |
| | | | | | | | | | | |
| | | | | |
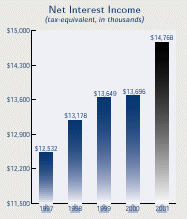
| Margin/net interest income | | | | | | | 3.81 | % | | $ | 14,768 | | | | | | | | 4.02 | % | | $ | 13,696 | | | | | | | | 4.23 | % | | $ | 13,649 | |
| | | | | | | |
| | | |
| | | | | | | |
| | | |
| | | | | | | |
| | | |
| |
Tax-exempt securities and loans were adjusted to a tax-equivalent basis and are based on the marginal Federal corporate tax rate of 34 percent.
Non-accrual loans are included in earning assets.
7
QNB Corp. and Subsidiary 2001 Annual Report
MANAGEMENT’S DISCUSSION AND ANALYSIS
Consolidated Financial Review
The intent of this section is to provide the reader with a better understanding of the consolidated results of operations and financial condition of QNB Corp. and its wholly owned subsidiary, The Quakertown National Bank, for the years 2001, 2000 and 1999. The results of operations and financial condition are presented on a consolidated basis and the consolidated entity is referred to as “QNB.” QNB’s consolidated financial condition and results of operations consist almost entirely of The Quakertown National Bank’s financial condition and results of operations. This section should be read in conjunction with the financial statements and notes beginning on page 33. Tabular information is presented in thousands, except share data. Share and per share data have been restated to reflect the 5 percent stock dividends issued June 29, 2001 and June 30, 2000.
QNB Corp. (the “Corporation”) is a bank holding company headquartered in Quakertown, Pennsylvania. The Corporation through its wholly owned subsidiary, The Quakertown National Bank (the “Bank”), has been serving the residents and businesses of Upper Bucks, Northern Montgomery and Southern Lehigh Counties in Pennsylvania since 1877. The Bank is a locally managed community bank that provides a full range of commercial banking, retail banking, and trust and investment management services.
Forward-Looking Statements
This report includes forward-looking statements within the meaning of the Private Securities Litigation Reform Act with respect to financial performance and other financial and business matters. Forward-looking statements are typically identified by words or phrases such as “believe,” “expect,” “anticipate,” “intend,” “estimate,” “position” and variations of such words and similar expressions, or future or conditional verbs such as “will,” “would,” “should,” “could,” “may” or similar expressions. The Corporation cautions that these forward-looking statements are subject to numerous assumptions, risks and uncertainties, all of which change over time, and the Corporation assumes no duty to update forward-looking statements. Actual results could differ materially from those anticipated in these forward-looking statements.
In addition to factors previously disclosed by the Corporation and those identified elsewhere herein, the following factors, among others, could cause actual results to differ materially from forward-looking statements: increased credit risk; the introduction, withdrawal, success and timing of business initiatives and strategies; changes in competitive conditions; the inability to sustain revenue and earnings growth; changes in economic conditions, interest rates and financial and capital markets; inflation; changes in investment performance; customer disintermediation; customer borrowing, repayment, investment and deposit practices; customer acceptance of QNB products and services; and the impact, extent and timing of technological changes, capital management activities, actions of the Federal Reserve Board and legislative and regulatory actions and reforms.
Results of Operations
QNB had its sixth consecutive year of record earnings in 2001. QNB’s earnings for 2001 were $4,436,000, an 8.0 percent increase from the $4,106,000 reported in 2000. This represents basic and diluted earnings per share of $2.87 for 2001, compared to $2.61 for 2000, an increase of 10.0 percent. The results for 2001 reflect a 6.6 percent increase in net interest income resulting from significant growth in both earning assets and funding sources as well as a 10.0 percent increase in non-interest income. These factors helped overcome a declining net interest margin as well as an 8.3 percent increase in non-interest expense. The difference in the growth in net income and earnings per share reflects the impact of the stock repurchase plan announced in March 2000. Net income for 1999 was $3,801,000 or $2.40 per share basic and $2.39 per share on a diluted basis.
The results for 2001 also represent the successful completion of QNB’s five-year plan. This plan called for a 10.0 percent annual increase in earnings per share using the results of 1996 as the baseline. In 1996, QNB reported net income of $2,801,000 or $1.77 diluted earnings per share. Over the five-year period, net income and diluted earnings per share increased 58.4 percent and 62.1 percent respectively. Also, during this period cash dividends increased from $.50 per share in 1996 to $1.07 per share in 2001, an increase of 112.5 percent. In addition, two five-percent stock dividends were paid during this period.
Two important measures of profitability in the banking industry are an institution’s return on average assets and return on average shareholders’ equity. Return on average assets and return on average shareholders’ equity were 1.07 percent and 13.54 percent, respectively, in 2001 compared with 1.13 percent and 13.25 percent in 2000 and 1.10 percent and 13.16 percent in 1999.
Net Interest Income
Net interest income is the primary source of operating income for QNB. Net interest income is interest income, dividends, and fees on earning assets, less interest expense incurred for funding sources. Earning assets primarily include loans, investment securities and Federal funds sold. Sources used to fund these assets include deposits, borrowed funds and shareholders’ equity. Net interest income is affected by changes in interest rates, the volume and mix of earning assets and interest-bearing liabilities, and the amount of earning assets funded by non-interest-bearing deposits.
For purposes of this discussion, interest income and the average yield earned on loans and investment securities is adjusted to a tax-equivalent basis as detailed in the table that appears on page 7. This adjustment to interest income is made for analysis purposes only. Interest income is increased by the amount of savings of Federal income taxes, which QNB realizes by investing in certain tax-exempt State and municipal securities and by making loans to certain tax-exempt organizations. In this way, the ultimate economic impact of earnings from various assets can be more easily compared.
8
QNB Corp. and Subsidiary 2001 Annual Report
MANAGEMENT’S DISCUSSION AND ANALYSIS
The net interest rate spread is the difference between average rates received on earning assets and average rates paid on interest-bearing liabilities, while the net interest rate margin includes interest-free sources of funds.
On a fully tax-equivalent basis, net interest income for 2001 increased $1,072,000 or 7.8 percent to $14,768,000. A 13.7 percent increase in average earning assets offset a decrease in the net interest margin. The net interest margin declined by 21 basis points, while the net interest rate spread declined by 11 basis points. The net interest rate spread decreased to 3.35 percent in 2001 from 3.46 percent in 2000, while the net interest rate margin decreased to 3.81 percent in 2001 from 4.02 percent in 2000. The growth in earning assets as well as the net interest rate spread and the net interest rate margin were impacted by two leverage transactions entered into during 2001.
During the first quarter of 2001, QNB entered into a leverage transaction in which it borrowed $25,000,000 from the Federal Home Loan Bank (FHLB) at an initial average rate of 5.71 percent. These funds were invested in securities with an average yield of 7.07 percent for an initial spread of 136 basis points. In the fourth quarter of 2001, QNB borrowed $3,000,000 from the FHLB that reprice with three-month LIBOR plus 9 basis points. These funds were invested in investment securities that also reprice with three-month LIBOR plus 183 basis points for a spread of 174 basis points. These transactions had the impact of increasing tax-equivalent net interest income by approximately $323,000 in 2001, but lowering the net interest rate spread and net interest rate margin. Excluding the impact of these transactions in 2001, the net interest rate spread would have been 3.48 percent in 2001, an increase of 2 basis points, while the net interest rate margin would have been 3.96 percent in 2001, a decline of only 6 basis points.
It is necessary to review the changes in market interest rates during the period 1999-2001 to understand the impact of changing interest rates on interest income and interest expense. A rapidly growing U.S. economy, potential inflation fears caused by tight labor markets, a stabilized global economy, and concerns about year-2000 computer disruptions caused interest rates to increase rapidly during 1999. In response to these events the Federal Reserve Bank increased the target rate three times from 4.75 percent to 5.50 percent as of December 31, 1999. The 30-year Treasury bond, which yielded 5.09 percent at the beginning of 1999, ended the year at 6.48 percent, while the two-year Treasury bond increased from 4.53 percent at the beginning of 1999, to 6.24 percent at December 31, 1999.
The fear of inflation caused by a rapidly expanding economy, continued tight labor markets and large increases in energy prices prompted the Federal Reserve Bank to raise the Federal funds rate three more times and 100 basis points to 6.50 percent by May 2000. Interest rates continued to increase during this period and the Treasury yield curve became inverted with short-term rates being higher than longer-term interest rates. During
Rate-Volume Analysis of Changes in Net Interest Income(Tax-Equivalent Basis)
| | | | | | | | | | | | | | | | | | | | | | | | | | | |
| | | | | 2001 vs. 2000 | | 2000 vs. 1999 |
| | | | |
| |
|
| | | | | Change due to | | Total | | Change due to | | Total |
| | | | | Volume | | Rate | | Change | | Volume | | Rate | | Change |
| | | | |
| |
| |
| |
| |
| |
|
| Interest income: | | | | | | | | | | | | | | | | | | | | | | | | |
|
|
|
|
| Interest-bearing balances | | $ | (4 | ) | | $ | (3 | ) | | $ | (7 | ) | | $ | 9 | | | $ | 7 | | | $ | 16 | |
|
|
|
|
| Federal funds sold | | | 257 | | | | (191 | ) | | | 66 | | | | (12 | ) | | | 41 | | | | 29 | |
|
|
|
|
| Investment securities available-for-sale: | | | | | | | | | | | | | | | | | | | | | | | | |
|
|
|
|
| | Taxable | | | 1,704 | | | | (201 | ) | | | 1,503 | | | | 948 | | | | 204 | | | | 1,152 | |
|
|
|
|
| | Tax-exempt | | | 526 | | | | (15 | ) | | | 511 | | | | 327 | | | | 24 | | | | 351 | |
|
|
|
|
| Investment securities held-to-maturity: | | | | | | | | | | | | | | | | | | | | | | | | |
|
|
|
|
| | Taxable | | | (117 | ) | | | (54 | ) | | | (171 | ) | | | (397 | ) | | | 10 | | | | (387 | ) |
|
|
|
|
| | Tax-exempt | | | (84 | ) | | | (6 | ) | | | (90 | ) | | | 117 | | | | (3 | ) | | | 114 | |
|
|
|
|
| Loans | | | 1,088 | | | | (431 | ) | | | 657 | | | | 326 | | | | 149 | | | | 475 | |
| | | |
| | | |
| | | |
| | | |
| | | |
| | | |
| |
| | | Total interest income | | | 3,370 | | | | (901 | ) | | | 2,469 | | | | 1,318 | | | | 432 | | | | 1,750 | |
| | | |
| | | |
| | | |
| | | |
| | | |
| | | |
| |
| Interest expense: | | | | | | | | | | | | | | | | | | | �� | | | | | |
|
|
|
|
| Interest-bearing demand accounts | | | 26 | | | | (230 | ) | | | (204 | ) | | | 31 | | | | 147 | | | | 178 | |
|
|
|
|
| Money market accounts | | | 62 | | | | (326 | ) | | | (264 | ) | | | 144 | | | | 383 | | | | 527 | |
|
|
|
|
| Savings | | | 7 | | | | (120 | ) | | | (113 | ) | | | (19 | ) | | | 35 | | | | 16 | |
|
|
|
|
| Time | | | 556 | | | | (169 | ) | | | 387 | | | | 225 | | | | 289 | | | | 514 | |
|
|
|
|
| Time over $100,000 | | | 351 | | | | (137 | ) | | | 214 | | | | (192 | ) | | | 58 | | | | (134 | ) |
|
|
|
|
| Short-term borrowings | | | 166 | | | | (143 | ) | | | 23 | | | | 51 | | | | 87 | | | | 138 | |
|
|
|
|
| Federal Home Loan Bank advances | | | 1,252 | | | | 102 | | | | 1,354 | | | | 417 | | | | 47 | | | | 464 | |
| | | |
| | | |
| | | |
| | | |
| | | |
| | | |
| |
| | | Total interest expense | | | 2,420 | | | | (1,023 | ) | | | 1,397 | | | | 657 | | | | 1,046 | | | | 1,703 | |
| | | |
| | | |
| | | |
| | | |
| | | |
| | | |
| |
| Net interest income | | $ | 950 | | | $ | 122 | | | $ | 1,072 | | | $ | 661 | | | $ | (614 | ) | | $ | 47 | |
| | | |
| | | |
| | | |
| | | |
| | | |
| | | |
| |
Variances which were not specifically attributed to volume or rate were allocated proportionately between volume and rate. Tax-exempt securities and loans were adjusted to a tax-equivalent basis and are based on the marginal Federal corporate tax rate of 34 percent. Non-performing assets are treated as a change due to rate.
9
QNB Corp. and Subsidiary 2001 Annual Report
MANAGEMENT’S DISCUSSION AND ANALYSIS
Net Interest Income(continued)
this time the 30-year Treasury bond reached 6.75 percent while the two-year Treasury bond increased to 6.91 percent.
Then in July 2000, signs of a moderation in the growth of economic activity emerged. Economic indications that the expansion had moderated from its earlier rapid pace continued through the summer and into the fall. Over the last few months of 2000, growth slowed even more. Spending on business capital slowed abruptly in the fourth quarter, while manufacturers reduced production to prevent a buildup of inventory. Consumer confidence deteriorated as concern over slower growth, worker layoffs and a plunging stock market reduced consumer spending. The falling stock market combined with the slowdown in the economy caused interest rates to decline rapidly during the third and fourth quarters of 2000. The 30-year Treasury bond ended the year at 5.46 percent, a decline of 129 basis points from its high, while the two-year Treasury bond ended 2000 at 5.09 percent, a decline of 182 basis points. The 10-year Treasury bond, the rate on which many mortgage loans are based, declined 168 basis points from its high during 2000 to finish the year at 5.11 percent.
The year 2001 presented many unexpected events starting with a surprise .50 percent cut in the Federal funds target rate on January 3, 2001. This would be the first of 11 rate cuts by the Federal Reserve Board during 2001. The Federal funds rate declined 475 basis points during the year to 1.75 percent, its lowest level in 40 years. The economy that had slowed during the end of 2000 and early 2001 showed signs of bottoming in the spring. In response, bond yields, which had fallen sharply through late March, rose in April and May to the point that five-year and longer yields were higher than at year-end 2000. During the summer, however, it became evident that the economy was still struggling, and the U.S. economy was in recession. The Federal Reserve resumed its aggressive easing which was made possible by the absence of inflationary pressures. In early September bond yields were at their lowest of the year. Then the tragic events of September 11 occurred, and the already fragile economy was hit hard. Unemployment, which had been historically low, rose sharply. The Federal Reserve continued to cut rates and interest rates declined sharply with the two-year Treasury, 10-year Treasury and 30-year bond hitting lows of 2.29 percent, 4.18 percent and 4.80 percent, respectively in early November. The sharp decline in the 10-year Treasury rate ignited a record refinancing boom of residential mortgage loans. By the end of 2001, the economic data showed signs of improvement. Consumer confidence, employment and manufacturing appeared to be stabilizing. As a result interest rates in the 10-year and longer part of the curve increased. This created a very steep yield curve with shorter-term interest rates remaining well below end of 2000 levels but 10-year and longer rates were nearly unchanged from where they were at the end of 2000. The two-year Treasury, 10-year Treasury and 30 year bond ended 2001 at 3.06 percent, 5.03 percent and 5.47 percent, respectively.
The Rate-Volume Analysis table on page 9 highlights the impact of changing rates and volumes on total interest income and interest expense. Total interest income increased $2,469,000 or 9.6 percent in 2001 to $28,172,000. Growth in earning assets contributed $3,370,000 to the increase in interest income, with higher securities volume accounting for $2,029,000 of the increase and higher loan volume accounting for $1,088,000 of the increase. Average investment securities increased $29,595,000 or 18.7 percent, while average loans increased $13,113,000 or 7.3 percent. Approximately 78.2 percent of the increase in average investment securities relates to the leverage transactions discussed earlier. Those transactions had an incremental impact on interest income of approximately $1,660,000 when comparing 2001 to 2000. A $4,006,000 increase in average Federal funds sold increased interest income by approximately $257,000 in 2001. Management increased its balances of Federal funds sold in order to keep a higher level of liquidity in light of the increase in short-term time deposits, particularly those with balances over $100,000.
The impact of declining interest rates during 2001 had a negative impact on interest income and the yield on earning assets during 2001. However, due to the fixed rate nature of many of QNB’s loans and investment securities, interest income and the yield on earning assets did not decrease to the same degree as market interest rates. The decrease in interest income resulting from lower yields on earning assets was $901,000 during 2001, with loans and investment securities accounting for $431,000 and $276,000 of the decrease. The impact of the 11 Federal Reserve rate cuts reduced interest on Federal funds sold by approximately $191,000.
The prime rate on loans also dropped 11 times during 2001 from 9.50 percent to 4.75 percent. The average prime rate when comparing 2001 to 2000 decreased 232 basis points, from 9.23 percent for 2000 to 6.91 percent in 2001. The yield on earning assets decreased 27 basis points to 7.27 percent with the average rate on loans decreasing 22 basis points during 2001. The average yield on loans decreased from 8.30 percent in 2000 to 8.08 percent in 2001. While QNB was negatively impacted in 2001 from the decline in prime rate, the overall yield on the loan portfolio did not decrease proportionately, since only a small percentage of the loan portfolio reprices immediately with changes in the prime rate. A greater
10
QNB Corp. and Subsidiary 2001 Annual Report
MANAGEMENT’S DISCUSSION AND ANALYSIS
contributor to the decline in the yield on the loan portfolio was the impact of the refinancing of residential mortgage and commercial loans into lower yielding loans. The yield on the loan portfolio may continue to decline in 2002 as fixed rate loans are refinanced at lower rates, adjustable rate loans reprice down as they reach their reset date and new loans are booked at the current lower rates.
Non-accrual loans of $280,000 in 2001 and $205,000 in 2000 resulted in the non-recognition of $21,000 and $40,000 in interest income for the respective periods. The impact of non-accrual loans is included in the amount of change due to rate.
The yield on the total investment portfolio was 6.58 percent for 2001 and 6.70 percent in 2000. With the decline in interest rates, cash flow from callable agency bonds, mortgage-backed securities and CMOs increased. These funds as well as new funds from deposit growth were reinvested in lower-yielding securities. The yield on the investment portfolio is expected to continue to decline as higher yielding securities are replaced at lower rates. The yield on the portfolio as of December 31, 2001, was 6.29 percent, a decrease of 43 basis points from the portfolio yield of 6.72 percent at December 31, 2000.
Total interest expense increased $1,397,000 or 11.6 percent in 2001 to $13,404,000. Growth in deposits and borrowed money contributed $2,420,000 to the increase in total expense. Interest expense on the new borrowings from the FHLB contributed $1,338,000 to the total increase in interest expense. An 8.0 percent increase in average interest-bearing deposits resulted in an increase in interest expense of $1,002,000. This increase was primarily in the area of time deposits. Average balances on time deposits increased by 12.1 percent contributing $907,000 to the increase in interest expense. One result of the recession and stock market downturn has been a strong flow of deposits into banks. Investors have appeared to take a more conservative profile in light of the stock market downturn and the events of September 11, 2001. For customers, time deposits, particularly those with maturities of one year or less, have provided relative value compared to rates on money market and savings accounts. One such time deposit is the “Flex 12” certificate of deposit. This product has a twelve month maturity, allows for one no-penalty withdrawal, enables the holder to add funds to the account, and pays a competitive interest rate. Balances in this product have increased from $18,561,000 at December 31, 2000, to $50,342,000 at December 31, 2001.
The average rates paid on deposit accounts and short-term borrowings decreased in 2001. As a result of lower interest rates, interest expense on deposit accounts and short-term borrowings decreased $1,125,000 in 2001. Interest expense on FHLB advances increased $102,000 as the rate paid on the new advances booked during the first quarter of 2001 were higher than the rates on the existing borrowed funds. In the current interest rate environment, $50,000,000 of these borrowings are considered fixed rate. The rate paid on total interest-bearing liabilities, including the borrowings from the FHLB, decreased to 3.92 percent in 2001 from 4.08 percent in 2000. The rate paid on interest-bearing deposit accounts decreased to 3.66 percent in 2001 from 3.95 percent in 2000. Excluding the impact of the new borrowings from the FHLB, the yield on interest-bearing liabilities would have declined to 3.79 percent in 2001.
Lower rates paid on interest-bearing demand accounts, money market accounts, savings accounts and time deposits decreased interest expense by $230,000, $326,000, $120,000 and $306,000, respectively in 2001. The average rate paid on money market accounts was impacted the most by the decline in interest rates. The yield on money market accounts declined 86 basis points from 3.64 percent in 2000 to 2.78 percent in 2001. Contributing to the decline in the yield on money market accounts was the sharp decline in the yield on the Treasury Select Money Market Account. This product, introduced at the end of the first quarter of 2000, is a variable rate account, indexed to the monthly average of the 91-day Treasury bill based on balances in the account. This product paid a guaranteed promotional rate of 6.00 percent on balances over $25,000 through December 31, 2000. The end of the promotional rate and the sharp decline in the 91-day Treasury rate resulted in significantly lower rates on this product as compared to 2000.
The yield on interest-bearing demand accounts decreased from 1.37 percent in 2000 to .91 percent in 2001. Included in this type of account are the deposits of several municipalities that have rates that are tied to the Federal funds target rate. The average rate paid on savings accounts decreased from 1.95 percent in 2000 to 1.63 percent in 2001 while the average rate paid on time deposits decreased from 5.47 percent in 2000 to 5.28 percent in 2001. Like fixed-rate loans, certificates of deposits reprice over time and therefore have less of an immediate impact on yield in either a rising or falling rate environment. The yield on the time deposit portfolio should continue to decline in 2002 as these deposits mature and reprice at lower rates. However, the yield on non-maturity interest-bearing deposits, which reprice immediately when their rates are changed, will not likely decline significantly as they have reached levels where only minimal reduction in rates is possible.
When comparing 2000 to 1999, net interest income on a fully tax-equivalent basis increased $47,000 or .3 percent to $13,696,000. A 5.8 percent increase in average earning assets offset a decrease in the net interest margin. The net interest margin declined by 21 basis points, while the net interest rate spread declined by 24 basis points. The net interest rate spread decreased to 3.46 percent in 2000 from 3.70 percent in 1999, while the net interest rate margin decreased to 4.02 percent in 2000 from 4.23 percent in 1999. Both the spread and the margin were impacted by several factors, including the leverage transaction entered into during the second quarter of 1999 and the increased cost of funds. The cost of acquiring and retaining deposits and short-term borrowings increased to a greater degree than the rates earned on loans and investments. The increased cost of funds was principally the result of a higher promotional rate paid during the introduction of our new money market product, the Treasury Select Money Market account, and the competitive nature of the local market for certificates of deposit.
11
QNB Corp. and Subsidiary 2001 Annual Report
MANAGEMENT’S DISCUSSION AND ANALYSIS
Net Interest Income(continued)
During the second quarter of 1999, QNB entered into a leverage transaction in which it borrowed $25,000,000 from the Federal Home Loan Bank (FHLB) at an initial average rate of 5.15 percent. These funds were invested in investment securities with an average yield of 6.52 percent for an initial spread of 137 basis points. This transaction had the impact of increasing tax-equivalent net interest income by approximately $299,000 and $222,000 in 2000 and 1999, but lowering the net interest rate spread and net interest rate margin. Excluding the impact of this transaction in both 2000 and 1999, the net interest rate spread would have been 3.68 percent in 2000 and 3.85 percent in 1999, a decrease of 17 basis points, while the net interest rate margin would have been 4.24 percent in 2000 and 4.40 percent in 1999, a decline of 16 basis points.
Total interest income increased $1,750,000 in 2000 to $25,703,000. Growth in earning assets contributed $1,318,000 to the increase in interest income, with higher securities volume accounting for $995,000 of the increase and higher loan volume accounting for $326,000 of the increase. Average investments increased $14,673,000 or 10.2 percent, while average loans increased $3,969,000 or 2.3 percent. Approximately half of the increase in average investment securities relates to the leverage transaction entered into in April 1999. That transaction had an incremental impact on interest income of approximately $459,000 when comparing 2000 to 1999.
The impact of increasing interest rates during 1999 and early 2000 had a positive result on interest income and the yield on earning assets during 2000. However, due to the fixed rate nature of many of QNB’s loans and investment securities, interest income and the yield on earning assets did not increase to the same degree as market interest rates. The increase in interest income resulting from higher yields on earning assets was $432,000 during 2000, with loans and investment securities accounting for $149,000 and $235,000 of the increase. The yield on earning assets increased 11 basis points to 7.54 percent with the average rate on loans increasing 8 basis points during 2000. The average yield on loans increased from 8.22 percent in 1999 to 8.30 percent in 2000. However, from the end of the second quarter of 1999 through May of 2000, the prime rate on loans increased 175 basis points from 7.75 percent to 9.50 percent. The average prime rate when comparing 2000 to 1999 increased 123 basis points, from 8.00 percent for 1999 to 9.23 percent in 2000. While QNB did see some benefit in 2000 from these prime rate increases, the overall yield on the loan portfolio did not increase proportionately, since only approximately 13 percent of the portfolio repriced immediately with changes in the prime rate. The yield on loans continued to be negatively impacted by the decline in rates that occurred in 1998. As rates hit historically low levels during 1998, many borrowers, including commercial and consumer, selected fixed rate rather than variable rate loans. Therefore, the loan portfolio has yielded minimal benefit from rising rates during 1999 and early 2000. Another factor in limiting the increase on the yield on loans was the competitive environment for loans, both commercial and consumer, from both banks and non-banks, which had prevented the rates from increasing to the degree that Treasury rates and the Prime rate had increased.
The yield on the total investment portfolio was 6.70 percent for 2000 and 6.53 percent in 1999. The yield on the portfolio increased both as a result of the investment of new funds and cashflow from existing securities into higher yielding securities as rates increased and through the active management of the portfolio during various interest rate environments. For example, with the rise in rates in 1999, cash flow from mortgage-backed securities and callable agency securities declined, resulting in fewer dollars being reinvested at these higher rates. To take advantage of the higher interest rate environment, QNB, during the third and fourth quarters of 1999, sold, at a loss of $256,000, approximately $9,500,000 of securities yielding 6.25 percent. The proceeds were reinvested in securities yielding 7.50 percent. This transaction benefited QNB in 2000 by increasing interest income and the yield on the total portfolio. During the fourth quarter of 2000, QNB sold approximately $8,500,000 of agency issued mortgage-backed securities, callable agency securities and municipal securities. The proceeds of these funds were reinvested in non-agency issued mortgage-backed securities, corporate bonds and municipal securities. This transaction resulted in a gain of $94,000 and an increase in the yield between the securities purchased versus those sold. To accomplish this, QNB increased its weighted average maturity and credit risk in the portfolio to a small degree.
Total interest expense increased $1,703,000 or 16.5 percent in 2000 to $12,007,000. Growth in deposits and borrowed money contributed $657,000 to the increase in total expense. Interest expense on the borrowings from the FHLB contributed $464,000 to the total increase in interest expense. A 3.3 percent increase in average interest-bearing deposits resulted in an increase in interest expense of $189,000. This increase was primarily in the area of money market accounts. Average balances on money markets increased by 18.2 percent contributing $144,000 to the increase in interest expense. The Treasury Select Indexed Money Market account, introduced at the end of the first quarter of 2000, was the primary reason for the growth in money market balances. A 6.3 percent increase in interest bearing demand accounts contributed approximately $31,000 to the increase in interest expense.
The average rates paid on deposit accounts and short-term borrowings, which had lagged the rate increases in Treasury rates during 1999, increased in 2000. As a result, interest expense increased $1,046,000 in 2000. The rate paid on total interest-bearing liabilities, including the borrowings from the FHLB, increased to 4.08 percent in 2000 from 3.73 percent in 1999. The rate paid on interest-bearing deposit accounts increased to 3.95 percent in 2000 from 3.63 percent in 1999.
Higher rates paid on money market accounts, time deposits and interest-bearing demand accounts increased interest expense by $383,000, $347,000 and $147,000 in 2000. The average rate paid on money market accounts increased from 2.58 percent in 1999 to 3.64 percent in 2000. The guaranteed promotional rate of 6.00 percent on balances over $25,000 in the Treasury Select Money Market account was the reason for
12
QNB Corp. and Subsidiary 2001 Annual Report
MANAGEMENT’S DISCUSSION AND ANALYSIS
the increase. This guaranteed promotional yield ended at the end of 2000. The average rate paid on time deposits was 5.47 percent in 2000 compared to 5.22 percent in 1999. The increase in the rate paid on time deposit accounts is a result of the competitive interest rate environment for deposits, especially time deposits, and the repricing of lower rate time deposits at higher rates upon renewal. Even with the decline in interest rates during the third and fourth quarters of 2000, the competitive environment for deposits kept rates on time deposits high. The yield on interest-bearing demand accounts increased from 1.06 percent in 1999 to 1.37 percent in 2000. Included in this type of account are the deposits of several municipalities that have rates that are tied to the Federal funds target rate that increased by 175 basis points during 1999 and 2000.
The yield on short-term borrowings increased 71 basis points in 2000 to 4.21 percent while the yield on Federal Home Loan Bank borrowings increased 19 basis points from 5.22 percent in 1999 to 5.41 percent in 2000. The increase in the yield on short-term borrowings is a result of higher rates paid on cash management accounts, reflecting the higher rate environment in 1999 and 2000. The increase in the rate paid on Federal Home Loan Bank advances was a result of the repricing on $5,000,000 of the borrowings in April of 2000, from 4.60 percent to 5.86 percent. This also reflects the higher interest rate environment at the time the borrowing was scheduled to reprice.
Management expects net interest income to increase in 2002 as a result of the growth in earning assets. The net interest margin should stabilize and possibly increase in 2002, which would also have a positive impact on net interest income. The yield on earning assets will continue to decline as loans and investment securities reprice at lower rates. However, this should be offset by a decline in the rates paid on time deposits, as these reprice lower over the year. As discussed in the Interest Rate Sensitivity section, a large increase in rates will have a negative impact on net interest income, as interest-bearing liabilities will reprice faster than earning assets.
Provision For Loan Losses
The provision for loan losses represents management’s determination of the amount necessary to be charged to operations to bring the allowance for loan losses to a level which represents management’s best estimate of the known and inherent losses in the loan portfolio. Actual loan losses, net of recoveries, serve to reduce the allowance. QNB’s management determined no provision for loan losses was necessary in either 2001 or 2000 as charged off loans, non-performing assets and delinquent loans remained at low levels relative to the allowance for loan losses. The provision for loan losses was $240,000 in 1999. Net charge-offs were $105,000 and $246,000 in 2001 and 2000. Approximately $83,000 of the total loans charged off in 2001 and $154,000 of the total loans charged-off in 2000 represents a loan to one borrower in each year. Net recoveries were $5,000 for 1999. Net charge-offs in 2001 and 2000 represent .05 percent and .14 percent of average loans. QNB anticipates no provision for loan losses will be necessary in 2002 as long as credit quality remains high with non-performing assets, delinquent loans and charge-offs remaining low. These factors could be negatively impacted if the economy is slow to recover in 2002. Strong growth in the loan portfolio could also impact the need for a provision for loan losses in 2002.
Significant estimates are made by management in determining the allowance for loan losses. Consideration is given to a variety of factors in establishing these estimates including: current economic conditions, diversification of the loan portfolio, delinquency statistics, results of loan reviews, borrowers’ perceived financial and managerial strengths, the adequacy of underlying collateral if collateral dependent, or the present value of future cash flows. Since the allowance for loan losses is dependent, to a great extent, on conditions that may be beyond QNB’s control, it is at least reasonably possible that management’s estimates of the allowance for loan losses and actual results could differ in the near term.
Non-Interest Income
QNB, through its core banking business, generates various fees and service charges. Total non-interest income is composed of service charges on deposit accounts, ATM and debit card income, income on bank owned life insurance, mortgage servicing fees, gains or losses on the sale of investment securities, gains on the sale of residential mortgage loans and student loans, and other miscellaneous fee income. QNB reviews all service charges and fee schedules related to its products and services on an annual basis. Except for an increase in overdraft fees during 1999 and the implementation of an ATM surcharge in 2000, QNB has not materially changed these fee schedules during 2001, 2000 or 1999. In December 2001, QNB implemented “Free Checking” for personal non-interest bearing checking accounts. Total non-interest income was $3,070,000 in 2001 compared to $2,791,000 in 2000, an increase of 10.0 percent. Excluding the gains and losses on the sale of investment securities and loans in both 2001 and 2000 non-interest income increased 5.4 percent. The increase in non-interest income in 2001 followed a 26.4 percent increase when comparing the $2,791,000 reported in 2000 to the $2,208,000 recorded in 1999. Excluding gains and losses on the sale of securities and loans, non-interest income increased 10.9 percent between 1999 and 2000.
Fees for services to customers are primarily comprised of service charges on deposit accounts. These fees increased $144,000 or 11.1 percent during 2001 to $1,437,000. An increase in overdraft fee income resulting from a higher volume of overdrafts was the principal reason for the increase in service charge income in 2001. A $23,000 decline in monthly maintenance fees on personal non-interest bearing and interest bearing checking accounts were offset by increases in service charges on business checking accounts, sweep fees from deposit accounts and online bill pay fees. Fees for services to customers increased $91,000 or 7.6 percent to $1,293,000 when comparing 2000 to 1999. Higher overdraft income, resulting from an increase in both the volume of overdrafts and the fee, accounts for most of the overall increase in service charge income. During the first quarter of 1999, QNB increased its fee for overdrafts by 12.0 percent.
13
QNB Corp. and Subsidiary 2001 Annual Report
MANAGEMENT’S DISCUSSION AND ANALYSIS
Non-Interest Income(continued)
The introduction of “Free Checking” for personal non-interest bearing checking accounts will result in a reduction of service charge income in 2002. These fees amounted to $70,000 in 2001. Management believes that the loss of this income will be offset by an increase in low costing deposit balances. Also positively impacting service charge income in 2002 is the introduction of “No-Bounce”, an overdraft protection service that will pay overdrafts up to a predetermined level on all eligible checking accounts.
ATM and debit card income is primarily comprised of interchange income on debit cards and ATM surcharge income for the use of QNB ATM machines by non-QNB customers. ATM and debit card income was $469,000 for 2001, an increase of $85,000 or 22.1 percent from the amount recorded in 2000. This followed an increase of $116,000 or 43.3 percent between 1999 and 2000. Debit card income increased $63,000 or 26.6 percent to $299,000 in 2001. Debit card income was $236,000 in 2000 and $166,000 in 1999. The increase in debit card income during the past three years is a result of increased acceptance by consumers as a means of paying for goods and services. ATM transaction surcharge income was $139,000 in 2001, an increase of $64,000 or 85.3 percent from 2000. This charge was implemented during the second quarter of 2000 at $1.00 per transaction and was increased to $1.50 per transaction during the second quarter of 2001.
Partially offsetting the higher debit card and ATM surcharge income in 2001 was a reduction in ATM interchange income and the income derived from the annual card fee. ATM interchange income represents the net fees paid to QNB by other financial institutions for non-QNB customers using QNB machines and fees charged to QNB by other financial institutions for use of their machines by QNB customers. ATM interchange income was $54,000 in 1999 and $24,000 in 2000. In 2001 interchange fees was an expense of $11,000. The decline in interchange income over the three-year period is a direct result of the implementation of the ATM surcharge in 2000. Non-QNB customers are performing fewer transactions at QNB machines. Annual card fee income declined from $49,000 in 2000 to $42,000 in 2001. This decline is a result of the simplification of deposit products over the past few years resulting in this fee being eliminated for many customers.
When QNB sells its residential mortgages in the secondary market, it retains servicing rights. A normal servicing fee is retained on all loans sold and serviced. Mortgage servicing fees decreased $76,000 or 67.9 percent in 2001, to $36,000. This followed a decrease of $13,000 or 10.4 percent in 2000, to $112,000. Netted against the income in 2001 was a charge of $48,000 for a valuation allowance for the impairment of mortgage servicing rights resulting from the decline in interest rates and the increase in mortgage prepayment speeds during 2001. Excluding the impairment charge, mortgage-servicing fees decreased $28,000 or 25.0 percent in 2001. The decline in mortgage servicing fees in 2001 is the result of servicing fewer mortgage loans and an increase in the amortization of the mortgage-servicing asset booked at the time the loan is sold. The decline in mortgage servicing fees in 2000 is primarily the result of servicing fewer mortgage loans. QNB recognizes its obligation to service financial assets that are retained in a transfer of assets in the form of a servicing asset. The servicing asset is amortized in proportion to and over the period of net servicing income or loss. Servicing assets are assessed for impairment based on their fair value. The impact of amortization of the mortgage-servicing asset was $62,000 in 2001 and $50,000 in both 2000 and 1999.
The volume of mortgages serviced as well as the timing of mortgage payments and the level of delinquent mortgages also impacts the amount of servicing fees recorded. The level of mortgages serviced increased $2,859,000 or 4.7 percent to $63,525,000 at December 31, 2001. However, the average balance of mortgages serviced for others decreased 4.9 percent in 2001 to $59,812,000. This followed a decrease of 7.0 percent in 2000 to $62,876,000. The increase in interest rates during the second half of 1999 and early 2000 and the related slowdown in mortgage refinancing activity significantly reduced the amount of loans originated and sold in both 2000 and 1999. This trend turned in 2001 as mortgage rates declined and refinancing activity hit record levels during the fourth quarter of 2001. QNB sold $8,866,000 in mortgage loans during the fourth quarter of 2001 and $15,598,000 during all of 2001. The sales activity in the fourth quarter of 2001 accounts for the year-end to year-end increase in balances of mortgages sold and serviced for others.
Net gains on the sale of investment securities were $292,000 in 2001. Included in the net gains in 2001 is a loss of $683,000 related to the write down of marketable equity securities which declined in market value below cost and deemed to be other than temporary. These individual securities were written down to a new cost basis and the $683,000 was accounted for as a realized loss. Several of these securities were subsequently sold during the fourth quarter of 2001.
| | | | | | | | | | | | | | | | | | | | | | | | | | | | | | |
| | | | | | | | | | | | | | | | Change from Prior Year |
| | | | | | | | | | | | | | | |
|
| Non-Interest Income Comparison | | | | | | | | | | | | | | 2001 | | 2000 |
| | | | | | | | | | | | | |
| |
|
| | | | 2001 | | 2000 | | 1999 | | Amount | | Percent | | Amount | | Percent |
| | | |
| |
| |
| |
| |
| |
| |
|
| Fees for services to customers | | $ | 1,437 | | | $ | 1,293 | | | $ | 1,202 | | | $ | 144 | | | | 11.1 | % | | $ | 91 | | | | 7.6 | % |
|
|
|
|
| ATM and debit card income | | | 469 | | | | 384 | | | | 268 | | | | 85 | | | | 22.1 | | | | 116 | | | | 43.3 | |
|
|
|
|
| Income on cash surrender value of insurance | | | 206 | | | | 175 | | | | 162 | | | | 31 | | | | 17.7 | | | | 13 | | | | 8.0 | |
|
|
|
|
| Mortgage servicing fees | | | 36 | | | | 112 | | | | 125 | | | | (76 | ) | | | (67.9 | ) | | | (13 | ) | | | (10.4 | ) |
|
|
|
|
| Net gain (loss) on investment securities | | | 292 | | | | 310 | | | | (139 | ) | | | (18 | ) | | | (5.8 | ) | | | 449 | | | | 323.0 | |
|
|
|
|
| Net gain on sale of loans | | | 244 | | | | 76 | | | | 178 | | | | 168 | | | | 221.1 | | | | (102 | ) | | | (57.3 | ) |
|
|
|
|
| Other operating income | | | 386 | | | | 441 | | | | 412 | | | | (55 | ) | | | (12.5 | ) | | | 29 | | | | 7.0 | |
| | | |
| | | |
| | | |
| | | |
| | | |
| | | |
| | | |
| |
| | Total | | $ | 3,070 | | | $ | 2,791 | | | $ | 2,208 | | | $ | 279 | | | | 10.0 | % | | $ | 583 | | | | 26.4 | % |
| | | |
| | | |
| | | |
| | | |
| | | |
| | | |
| | | |
| |
14
QNB Corp. and Subsidiary 2001 Annual Report
MANAGEMENT’S DISCUSSION AND ANALYSIS
Offsetting this loss were net gains on marketable equity securities of $613,000. In addition, QNB sold approximately $15,000,000 in callable agency securities and collateralized mortgage obligations (CMO) at a gain of $362,000. Mortgage-backed securities were purchased with the proceeds from this transaction. The purpose of this transaction was to reduce the exposure to callable agency securities and increased cash flow from the CMOs in a falling interest rate environment.
The net gain on the sale of investment securities was $310,000 in 2000. This compares to a loss on the sale of investment securities of $139,000 during 1999. During 2000, gains on the sale of marketable equity securities contributed $216,000. This compares to gains of $118,000 in 1999 on the sale of equity securities. During the fourth quarter of 2000, QNB sold approximately $8,500,000 of agency issued mortgage-backed securities, callable agency securities and municipal securities. The proceeds of these funds were reinvested in non-agency issued mortgage-backed securities, corporate bonds and municipal securities. This transaction resulted in a gain of $94,000 and an increase in the yield between the securities purchased versus those sold. To accomplish this, QNB increased its weighted average maturity and credit risk in the portfolio to a small degree. Net losses on the sale of debt securities were approximately $257,000 in 1999. During the third and fourth quarters of 1999, in response to rising interest rates, QNB sold approximately $9,500,000 of securities yielding 6.25 percent and reinvested the proceeds in securities yielding 7.50 percent.
Student and residential mortgage loans to be sold are identified at origination. The net gain on the sale of loans was $244,000, $76,000 and $178,000 in 2001, 2000 and 1999. Included within these amounts are gains on the sale of student loans of $49,000, $41,000 and $42,000, respectively. QNB sold approximately $2,680,000, $2,281,000 and $2,261,000 of loans to SallieMae during these three years. The amount of the gain depends upon the amount and type of student loans originated.
The net gain on residential mortgage sales is directly related to the volume of mortgages sold and the timing of the sales relative to the interest rate environment. Net gains on the sale of residential mortgages were $195,000 in 2001, $35,000 in 2000 and $136,000 in 1999. Included in the gains on the sale of residential mortgages in these years were $159,000, $20,000 and $112,000 related to the recognition of mortgage servicing assets. Also included in the net gain for 2001 was an unrealized loss of $24,000 for loans classified as held-for-sale as of December 31, 2001.
As discussed earlier, significant interest rate swings during the three years had a major impact on the volume of mortgages originated and the gains recorded on the sale of these mortgages. QNB sold approximately $15,598,000, $1,956,000 and $11,027,000 of residential mortgages in the secondary market in 2001, 2000 and 1999. QNB originated approximately $16,830,000 in mortgage loans held-for-sale in 2001 compared to $2,184,000 and $7,400,000 in 2000 and 1999. Selling into a falling interest rate market tends to increase the gains recorded while selling into a rising interest rate environment reduces the profitability of the sale.
As of December 31, 2001 and 2000, there were $1,146,000 and $198,000 of residential mortgage loans held-for-sale. As of December 31, 1999, there were no residential mortgage loans held-for sale. These loans are accounted for at lower of cost or market.
Other operating income was $386,000, $441,000 and $412,000 in 2001, 2000 and 1999. Other operating income in 2000 included $15,000 in rental income from other real estate owned, $16,000 from a Pennsylvania sales and use tax refund and $6,000 insurance refund for the repair of equipment. The other real estate property was disposed of in 2000. Also contributing to the decline in other income in 2001 was a $25,000 reduction in official check income. This decline is primarily related to the lower interest rate environment experienced in 2001. Commissions on mutual fund sales declined by $8,000 in 2001. This is a result of a transition to a new program in 2001 and a slowdown of funds into mutual funds as a result of poor stock market performance. Contributing to other operating income in 2001 were two new services; trust and investment management through QNB’s affiliation with The Trust Company of Lehigh Valley and title insurance through its partnership in Bankers Settlement Services of Eastern Pennsylvania. The development and growth of these areas, as well as the retail non-deposit program in affiliation with Raymond James Financial Services, Inc., should increase other operating income in 2002.
Financial service organizations, including QNB, are challenged to demonstrate that they can generate an increased contribution to revenue from non-interest sources. QNB will continue to analyze other opportunities and products that could enhance its fee-based businesses.
Non-Interest Expense
Non-interest expense is comprised of costs related to salaries and employee benefits, net occupancy, furniture and equipment, marketing, third party services and various other operating expenses. Total non-interest expense in 2001 increased $848,000 or 8.3 percent to $11,080,000. Included in total non-interest expense in 2000 were expenses of $240,000 related to the cost of conversion to and installation of a new computer system. Excluding these one-time costs, total non-interest expense increased 10.9 percent between 2000 and 2001. This followed an increase of 1.1 percent, excluding one-time costs, between 1999 and 2000. Total non-interest expense for 2000 and 1999 was $10,232,000 and $9,884,000, respectively. Despite the increase in non-interest expense, QNB’s overhead efficiency ratio, which represents non-interest expense divided by net operating revenue on a tax-equivalent basis, remained stable over the past three years at approximately 62.0 percent.
15
QNB Corp. and Subsidiary 2001 Annual Report
MANAGEMENT’S DISCUSSION AND ANALYSIS
Non-Interest Expense (continued)
Salaries and benefits expense is the largest component of non-interest expense. Salary and benefits expense for 2001 was $6,174,000, an increase of $421,000 or 7.3 percent over 2000. Salary expense for 2001 increased $345,000 or 7.3 percent to $5,049,000. Excluding the impact of incentive compensation expense in both 2001 and 2000, salary expense increased $190,000 or 4.2 percent. This increase in salary expense is related to both merit increases and the increase in the number of employees due in part to the addition of a new branch and the staffing of the Customer Service Center and the Trust and Investment Management departments. When comparing the two years, the average number of full-time equivalent employees increased by five.
Benefits expense increased by $76,000 or 7.2 percent to $1,125,000 in 2001. Medical and dental insurance premiums increased $98,000 between 2000 and 2001. Partially offsetting this increase was an increase in employee contributions to these plans of $45,000. An increase in payroll tax and retirement plan expense, resulting from the increase in salary expense also contributed to the higher benefits expense in 2001.
Salary and benefits expense for 2000 was $5,753,000, an increase of $57,000 or 1.0 percent over 1999 levels. Salary expense for 2000 increased $55,000 or 1.2 percent to $4,704,000. Excluding the impact of incentive compensation in both 2000 and 1999, salary expense increased $194,000 or 4.4 percent. Benefits expense increased by $2,000 or .2 percent to $1,049,000 in 2000. Lower state unemployment tax expense and lower life and disability insurance premiums offset higher medical insurance premiums and retirement plan expense when comparing 2000 to 1999.
Other events also had an impact on salary and benefit expense when comparing 2000 to 1999. The outsourcing of several functions, including internal audit, loan review and courier service reduced salary and benefit expense in 2000, while the startup of the customer service center, the additional hours worked during the computer conversion and the tight labor market during the year 2000 increased these expenses. QNB had to increase wages in certain areas of the bank to retain and attract employees.
Net occupancy expense was $854,000 in 2001 compared to $710,000 in 2000 and $669,000 in 1999. Costs of the new Souderton branch, including rent expense, depreciation of leasehold improvements, real estate taxes and utility expense contributed to the increase in net occupancy expense in 2001. Branch rent expense increased by $77,000 when comparing the two years. In addition to the rental expense at the Souderton branch, higher monthly rentals at two other branch locations contributed to this increase. Depreciation on leasehold improvements increased $20,000 while real estate taxes and utility expense increased $10,000 and $4,000, respectively. Also contributing to the increase in net occupancy expense in 2001 was a $42,000 increase in building repairs and maintenance expense primarily related to repairs and maintenance at two branch locations. An increase in cleaning costs also contributed to the increase in repairs and maintenance expense.
The increase in net occupancy expense between 1999 and 2000 is primarily the result of the expansion and renovation of the Country Square branch at the end of 1999. Rent expense increased $39,000 and depreciation expense on leasehold improvements increased $17,000. Utility costs increased $12,000 or 9.8 percent when comparing 2000 to 1999. Partially offsetting these increases were decreases in building security expense and building insurance expense.
Furniture and equipment expense was $1,008,000 in 2001, $976,000 in 2000 and $908,000 in 1999. QNB designed a technology plan in 1998 that called for an increased investment in technology. This plan began in 1998 with the implementation of the first three phases of a wide area network and the conversion to a new telephone system. The plan continued in 1999 with the implementation of a check imaging system and the next phases of the wide area network. During 2000, QNB enhanced its web site, QNB.com, with an exciting new look and the launching of QNB-Online, the Internet banking and online bill pay product. During the fourth quarter of 2000, QNB completed the installation and conversion to a new bank-wide computer system.
When comparing the $32,000 or 3.3 percent increase between 2000 and 2001, amortization of computer software increased $44,000. This is primarily the result of the installation of the new computer system. Also, contributing to the increase in furniture and equipment expense was a $12,000 loss on the disposal of equipment. Partially offsetting these increases was an $11,000, $9,000 and $4,000 reduction in equipment maintenance costs, equipment depreciation expense and disaster recovery costs, respectively.
| | | | | | | | | | | | | | | | | | | | | | | | | | | | | | |
| | | | | | | | | | | | | | | | Change from Prior Year |
| | | | | | | | | | | | | | | |
|
| Non-Interest Expense Comparison | | | | | | | | | | | | | | 2001 | | 2000 |
| | | | | | | | | | | | | |
| |
|
| | | | 2001 | | 2000 | | 1999 | | Amount | | Percent | | Amount | | Percent |
| | | |
| |
| |
| |
| |
| |
| |
|
| Salaries and employee benefits | | $ | 6,174 | | | $ | 5,753 | | | $ | 5,696 | | | $ | 421 | | | | 7.3 | % | | $ | 57 | | | | 1.0 | % |
|
|
|
|
| Net occupancy expense | | | 854 | | | | 710 | | | | 669 | | | | 144 | | | | 20.3 | | | | 41 | | | | 6.1 | |
|
|
|
|
| Furniture and equipment expense | | | 1,008 | | | | 976 | | | | 908 | | | | 32 | | | | 3.3 | | | | 68 | | | | 7.5 | |
|
|
|
|
| Marketing expense | | | 437 | | | | 361 | | | | 379 | | | | 76 | | | | 21.1 | | | | (18 | ) | | | (4.7 | ) |
|
|
|
|
| Third party services | | | 502 | | | | 339 | | | | 284 | | | | 163 | | | | 48.1 | | | | 55 | | | | 19.4 | |
|
|
|
|
| Telephone, postage and supplies | | | 525 | | | | 487 | | | | 534 | | | | 38 | | | | 7.8 | | | | (47 | ) | | | (8.8 | ) |
|
|
|
|
| State taxes | | | 294 | | | | 280 | | | | 268 | | | | 14 | | | | 5.0 | | | | 12 | | | | 4.5 | |
|
|
|
|
| Other expense | | | 1,286 | | | | 1,326 | | | | 1,146 | | | | (40 | ) | | | (3.0 | ) | | | 180 | | | | 15.7 | |
| | | |
| | | |
| | | |
| | | |
| | | |
| | | |
| | | |
| |
| | Total | | $ | 11,080 | | | $ | 10,232 | | | $ | 9,884 | | | $ | 848 | | | | 8.3 | % | | $ | 348 | | | | 3.5 | % |
| | | |
| | | |
| | | |
| | | |
| | | |
| | | |
| | | |
| |
16
QNB Corp. and Subsidiary 2001 Annual Report
MANAGEMENT’S DISCUSSION AND ANALYSIS
The $68,000 or 7.5 percent increase in furniture and equipment expense between 1999 and 2000 is primarily the result of the implementation of the technology plan mentioned above. These items contributed to a $62,000 increase in depreciation and amortization expense when comparing 2000 to 1999. Equipment maintenance costs increased $17,000 in 2000 and $25,000 in 1999 primarily as a result of maintenance contracts on these technologies.
Marketing expense increased $76,000 or 21.1 percent to $437,000 for 2001. Advertising expense increased $21,000 and sales promotion expense increased $42,000 when comparing the two years. The increase in advertising expense relates to the opening of the branch, the introduction of the Trust and Investment Management area and the use of television as an additional medium of advertising. The increase in sales promotion expense is primarily the result of an increase in promotional items and giveaways related to the Souderton branch and the Youth Trek product. Public relations and donation expense increased $14,000 as a result of an increase in contributions and sponsorships to clubs and community events in the local communities we serve. These expenses are anticipated to increase in 2002 as QNB increases its support of these local organizations and events.
Marketing expense for 2000 was $361,000, a decrease of $18,000 or 4.7 percent from 1999. Advertising expense increased $32,000 during 2000. The introduction of QNB-Online and the Treasury Select Money Market product, along with an increase in advertising of loan products and promotion of time deposit products contributed to the increase in advertising expense. Offsetting these increases were a reduction in costs related to promotional items as well as a decrease in contributions and sponsorships.
Third party services are comprised of professional services including legal, accounting and auditing, and consulting services as well as fees paid to outside vendors for support services of day to day operations. These include trust services, retail non-deposit services, correspondent banking services, investment security safekeeping and supply management services, to name a few. Third party services expense was $502,000 in 2001 compared to $339,000 in 2000 and $284,000 in 1999. Third party costs related to the startup and operation of the trust department was $47,000 and expense related to the operation of the retail brokerage area was $15,000 in 2001. Legal expense increased by $31,000 in 2001 while expenses related to correspondent banking activity increased by $29,000 in 2001. Supply procurement was outsourced in 2001. The fee for this service was $7,500 in 2001. The increase in third party services when comparing 2000 to 1999 primarily relates to the outsourcing of the internal audit and loan review function during the fourth quarter of 1999.
Total telephone, postage and supplies expense was $525,000 for 2001. This compares to $487,000 and $534,000 in 2000 and 1999. The opening of the new branch, a change in the method of printing reports, and the cost of new forms resulting from the computer conversion contributed to a $27,000 or 16.3 percent increase in supplies expense in 2001. Postage expense increased $19,000 or 11.8 percent in 2001. Contributing to this variance was a 3.0 percent increase in the postal rate and an increase in the volume of mailings as a result of an increase in the number of customers. The primary factor in the $47,000 or 8.8 percent decrease in expense when comparing 2000 to 1999 was a reduction in supplies expense of $42,000. Supplies expense in 1999 was higher as a result of preparing for potential Year 2000 concerns.
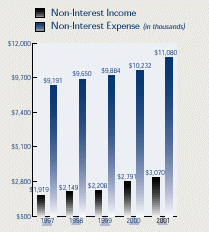
The major components of other expense are regulatory costs, insurance costs, membership fees, courier expense, ATM and debit card expense and directors fees. Other expense decreased $40,000 or 3.0 percent to $1,286,000 when comparing 2001 to 2000. Included in 2000 expense was a $240,000 one-time expense related to the installation, conversion and training for the new computer system. Excluding this expense, other expense increased $200,000 or 18.4 percent. Expenses related to the operation of the ATM and debit card programs increased $31,000 in 2001. This is a result of the increase in the number of transactions. Courier expense increased $16,000 in 2001. This is partially a result of the outsourcing of the courier function during 2000. Insurance expense increased $18,000 while the charge-off of deposit accounts increased by $29,000 in 2001. Expense related to a director deferred compensation plan increased $15,000 during 2001.
Other expense increased $180,000 or 15.7 percent in 2000 to $1,326,000. Excluding the $240,000 one-time charge mentioned above, other expense would have decreased by $60,000 or 5.2 percent. A reduction in the charge-off of deposit accounts decreased other expense by $61,000 in 2000.
17
QNB Corp. and Subsidiary 2001 Annual Report
MANAGEMENT’S DISCUSSION AND ANALYSIS
Income Taxes
QNB uses the asset and liability method to provide for income taxes. Deferred tax assets and liabilities are recognized for the future tax consequences attributable to differences between the financial statement carrying amounts of existing assets and liabilities and their respective tax bases. Deferred tax assets and liabilities are measured using enacted tax rates expected to apply to taxable income in the years in which those temporary differences are expected to be recovered or settled. The effect of a change in tax rates on deferred tax assets and liabilities is recognized in income in the period that includes the enactment date.
Applicable income taxes and effective tax rates were $1,078,000 or 19.6 percent for 2001 compared to $1,144,000 or 21.8 percent for 2000, and $1,174,000 or 23.6 percent for 1999. The reduction in the effective tax rate over the past three years is a result of an increase in income from tax-exempt municipal securities and loans, an increase in tax-exempt income from earnings on single premium life insurance and investment security dividend income subject to the 70% dividend exclusion.
Financial Condition
Financial service organizations today are challenged to demonstrate that they can generate sustainable and consistent earnings growth in an increasingly competitive and volatile environment. Managing the balance sheet in a dramatically declining interest rate environment was a major challenge during 2001 and will continue to have a major impact on earnings in 2002. In addition, competition for both loans and deposits remained strong during 2001. QNB’s primary competition in the banking segment of the financial services industry is comprised of a large super regional bank, several large community banks and a thrift institution. The consolidation of the banking industry that has taken place and the increased availability of loans from all types of companies in the financial services industry have led to increased price competition for both deposits and loans. Deposit growth was aided in 2001 by a second consecutive year of declines in the stock market as funds flowed out of stocks and mutual funds and flowed into deposits, particularly short-term time deposits. The tragic events of September 11 may have played a part as approximately 40.0 percent of the growth in deposits occurred during the fourth quarter of 2001. The challenge in 2002 will be to retain these deposits in a low interest rate environment particularly if the stock markets return to higher levels.
Total assets at year-end 2001 were $451,274,000, compared with $371,671,000 at December 31, 2000, an increase of $79,603,000 or 21.4 percent. This followed growth during 2000 of 6.0 percent. Advances from the Federal Home Loan Bank contributed $28,000,000 to the growth in 2001 as these borrowings were used to purchase investment securities. A $41,530,000 increase in time deposits referred to above also contributed to the growth in total assets.
Average total assets increased 13.6 percent or $49,383,000 in 2001 to $412,899,000 and 5.5 percent or $18,973,000 in 2000. Total loans at December 31, 2001 were $202,211,000, an increase of 9.2 percent from December 31, 2000. This followed a 6.6 percent increase from December 31, 1999 to December 31, 2000. Average total loans increased 7.3 percent in 2001 and 2.3 percent in 2000. Loan growth remains one of the primary goals of QNB. Funding sources, which include deposits and borrowed money, increased 22.1 percent from year-end 2000 to year-end 2001 and 5.2 percent from year-end 1999 to year-end 2000. Excluding the $28,000,000 in new borrowings from the FHLB, funding sources would have increased by 13.8 percent in 2001. Average funding sources increased 14.4 percent in 2001 and 5.5 percent in 2000. Excluding the borrowings from the FHLB, average funding sources would have increased by 7.9 percent and 3.1 percent in 2001 and 2000. The following discussion will further detail QNB’s financial condition during 2001 and 2000.
Investment Securities and Other Short-Term Investments
Investment policies, approved by QNB’s Board of Directors, include standards regarding permissible investment categories, credit quality, maturity intervals and investment concentrations. Total investment securities at December 31, 2001 and 2000 were $210,900,000 and $157,227,000. At December 31, 2001 and 2000, approximately 64.0 percent and 68.2 percent of QNB’s investment securities were either U.S. Government or U.S. Government agency debt securities, or U.S. Government agency issued mortgage-backed or collateralized mortgage obligation securities (CMO). During both 2001 and 2000, QNB increased its investments in non-agency issued CMOs, tax-exempt State and municipal securities, Corporate debt securities and U.S. Government agency equity securities.
As of December 31, 2001, QNB held one issue of a security (excluding the U.S. Government and its agencies) that was in excess of 10 percent of shareholders’ equity. This issue was a non-agency issued CMO and represented approximately 14.6 percent of shareholders’ equity as of December 31, 2001. In addition, Federal funds sold, which would be affected by the economic status of the banking industry, are short-term in nature and sold to banks with a minimum “A” rating at the date of the sale.
Average investment securities increased $29,595,000 or 18.7 percent to $187,984,000 in 2001 compared with a $14,673,000 or a 10.2 percent increase in 2000. The significant increase in the investment portfolio in 2001 is primarily the result of $28,000,000 in wholesale funding from the FHLB during 2001; $25,000,000 during the first quarter of 2001 and $3,000,000 during the fourth quarter of 2001. These funds were used to purchase investment securities with the intended result of increasing net interest income. These transactions had the impact of increasing average investment securities by approximately $23,142,000 in 2001. Contribut-
18
QNB Corp. and Subsidiary 2001 Annual Report
MANAGEMENT’S DISCUSSION AND ANALYSIS
ing to the increase in average investment securities in 2000 was the $25,000,000 wholesale funding transaction entered into with the FHLB during the second quarter of 1999. This transaction had the impact of increasing average investment securities by approximately $7,986,000 in 2000. The increase in the size of the investment portfolio in both 2001 and 2000 was also the result of average deposits and short-term borrowings growing at a faster rate than average loans.
Average Federal funds sold increased 119.2 percent in 2001 to $7,366,000, after decreasing 6.7 percent between 1999 and 2000. The increase in Federal funds sold in 2001 is a result of the desire to have more liquidity in light of the large increase in short-term time deposits during 2001. The lower balance of Federal funds sold during 2000 was a result of QNB having access to additional sources of liquidity with both the Federal Home Loan Bank and its correspondent bank. These sources are still available to QNB.

There was a significant amount of activity in the investment portfolio, during 2001. In addition to the $28,000,000 in funds to invest from the advances from the FHLB, declining interest rates increased the amount of prepayments on mortgage-backed securities and CMOs and increased the calls on agency securities. Proceeds from maturities and calls of investment securities provided $63,566,000 in funds to invest, while the sale of securities provided another $17,484,000. These funds along with the growth in deposits were used to purchase $132,719,000 in investment securities during 2001. In light of this activity but consistent with the strategy mentioned in the 2000 annual report, the composition of the portfolio changed significantly between 2000 and 2001. U.S. Government agency securities decreased to 13.9 percent of the portfolio at December 31, 2001 from 27.0 percent of the portfolio at December 31, 2000, while State and municipal securities decreased to 17.2 percent of the portfolio from 19.2 percent. Mortgage-backed securities and CMOs increased to 22.3 percent and 26.8 percent of the portfolio from 16.1 percent and 26.0 percent of the portfolio and Corporate debt securities increased to 9.7 percent from .7 percent of the portfolio at December 31, 2001 and 2000, respectively. The move from callable agency securities to mortgage-backed securities and CMOs reflects a desire to have more consistent cash flow to reinvest when interest rates increase. Corporate bonds with a rating of AAA and AA were purchased as part of the leverage transaction entered into during the first quarter of 2001. The maturity dates of these securities were matched with the maturity of the advances from the FHLB.
Management anticipates that investment portfolio activity, while remaining high, will slow during 2002 as interest rates stabilize, then increase during the year. These higher interest rates will likely result in a slow-down of prepayments on mortgage-backed securities and CMOs and a decrease in the likelihood of the securities with call features to be exercised. The anticipated strategy entering 2002 in light of the low interest rate environment is to continue to purchase mortgage-backed securities and CMOs with short average lives and duration. These will provide cash flow to reinvest as interest rates increase. QNB will also continue to purchase tax-exempt State and municipal securities with 10-to-15 year maturities because of the relative value of this sector. The declining interest rate environment experienced in 2001 has resulted in a decline in the yield on the investment portfolio. This will likely continue in 2002 as higher yielding bonds are replaced with ones having lower yields.
At December 31, 2001 and 2000, investment securities totaling $47,997,000 and $43,019,000 were pledged as collateral for repurchase agreements, public deposits and other deposits as provided by law.
QNB accounts for its investments by classifying its securities into three categories. Securities that QNB has the positive intent and ability to hold to maturity are classified as held-to-maturity securities and reported at amortized cost. Debt and equity securities that are bought and held principally for the purpose of selling them in the near term are classified as trading securities and reported at fair value, with unrealized gains and losses included in earnings. Debt and equity securities not classified as either held-to-maturity securities or trading securities are classified as available-for-sale securities and reported at fair value, with unrealized gains and losses, net of tax, excluded from earnings and reported as a separate component of shareholders’ equity. Management determines the appropriate classification of securities at the time of purchase. QNB has increased the percentage of securities classified as available-for-sale over the years as it provides more flexibility to manage the portfolio in different interest rate environments. QNB held no trading securities as of December 31, 2001 and 2000.
19
QNB Corp. and Subsidiary 2001 Annual Report
MANAGEMENT’S DISCUSSION AND ANALYSIS
Investments Available-For-Sale
Available-for-sale investment securities include securities that management intends to use as part of its asset/liability management strategy. These securities may be sold in response to changes in market interest rates and related changes in the securities prepayment risk or in response to the need for liquidity. The available-for-sale portfolio is primarily comprised of U.S. Treasuries and U.S. Government agencies due to their high degree of liquidity. Also included are mortgage-backed securities and certain CMOs to ensure QNB’s ability to react to changes in prepayment activity, Corporate debt securities to react to changes in credit quality and longer maturity State and municipal securities. At December 31, 2001, the fair value of investment securities available-for-sale was $168,102,000 or $1,666,000 above the amortized cost of $166,436,000. This compares to a fair value of $114,245,000 or $98,000 below the amortized cost of $114,343,000 at December 31, 2000. An unrealized holding gain of $1,099,000 was recorded as an increase to shareholders’ equity as of December 31, 2001, while an unrealized holding loss of $64,000 was recorded as a decrease to shareholders’ equity as of December 31, 2000. The available-for-sale portfolio had a weighted average maturity of approximately 5 years, 5 months at December 31, 2001, and 5 years, 4 months at December 31, 2000. The weighted average tax-equivalent yield was 6.29 percent and 6.73 percent at December 31, 2001 and 2000. Falling interest rates during 2001 had the impact of reducing the yield on the portfolio as higher yielding securities were replaced with lower yielding securities. The decline in interest rates also contributed to the unrealized holding gain in the portfolio.
The weighted average maturity is based on the stated contractual maturity of all securities except for mortgage-backed securities and CMOs, which are based on estimated average life. The maturity of the portfolio may be shorter because of call features in many of the debt securities and because of prepayments on mortgage-backed securities and CMOs. However, the estimated average life could be longer if rates were to increase and principal payments on mortgage-backed securities and CMOs would slow. The interest rate sensitivity analysis on page 30 reflects the repricing term of the securities portfolio based upon estimated call dates and anticipated cash flows assuming management’s most likely interest rate environment. The expected repricing term of the available-for-sale portfolio was 4 years at December 31, 2001, and 4 years, 2 months at December 31, 2000, based on these assumptions.
Investments Held-To-Maturity
Investment securities held-to-maturity are recorded at amortized cost. Included in this portfolio are State and municipal securities with original maturities primarily of 10 years or less and CMOs. They are designated as held-to-maturity as they are purchased with the intent and ability to hold to maturity. At December 31, 2001 and 2000, the amortized cost of investment securities held-to-maturity was $42,798,000 and $42,982,000, and the fair value was $43,048,000 and $42,815,000, respectively. The held-to-maturity portfolio had a weighted average maturity of approximately 3 years, 1 month at December 31, 2001, and 4 years, 8 months at December 31 2000. The weighted average tax-equivalent yield was 6.28 percent and 6.68 percent at December 31, 2001 and 2000. The decrease in the weighted average maturity is a result of the shortening of the average life of the CMO portfolio caused by falling interest rates during 2001.
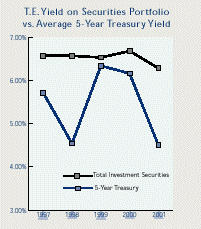
20
QNB Corp. and Subsidiary 2001 Annual Report
MANAGEMENT’S DISCUSSION AND ANALYSIS
Investment Portfolio History
| | | | | | | | | | | | | | |
| December 31, | | 2001 | | 2000 | | 1999 |
| |
| |
| |
|
Investment Securities Available-for-Sale | | | | | | | | | | | | |
|
|
|
|
| U.S. Treasuries | | $ | 6,693 | | | $ | 6,561 | | | $ | 6,499 | |
|
|
|
|
| U.S. Government agencies | | | 29,367 | | | | 42,469 | | | | 40,396 | |
|
|
|
|
| State and municipal securities | | | 17,751 | | | | 10,171 | | | | 6,371 | |
|
|
|
|
| Mortgage-backed securities | | | 49,055 | | | | 25,312 | | | | 24,639 | |
|
|
|
|
| Collateralized mortgage obligations (CMO) | | | 32,316 | | | | 17,929 | | | | 12,846 | |
|
|
|
|
| Other debt securities | | | 20,486 | | | | 1,024 | | | | 50 | |
|
|
|
|
| Equity securities | | | 12,434 | | | | 10,779 | | | | 6,808 | |
| | | |
| | | |
| | | |
| |
| | Total investment securities available-for-sale | | $ | 168,102 | | | $ | 114,245 | | | $ | 97,609 | |
| | | |
| | | |
| | | |
| |
| Investment Securities Held-to-Maturity | | | | | | | | | | | | |
| State and municipal securities | | $ | 18,629 | | | $ | 19,974 | | | $ | 19,346 | |
| Collateralized mortgage obligations (CMO) | | | 24,169 | | | | 23,008 | | | | 28,956 | |
| | | |
| | | |
| | | |
| |
| | Total investment securities held-to-maturity | | $ | 42,798 | | | $ | 42,982 | | | $ | 48,302 | |
| | | |
| | | |
| | | |
| |
| | Total investment securities | | $ | 210,900 | | | $ | 157,227 | | | $ | 145,911 | |
| | | |
| | | |
| | | |
| |
Investment Portfolio Weighted Average Yields
| | | | | | | | | | | | | | | | | | | | | | |
| | | | Under | | 1-5 | | 5-10 | | Over 10 | | | | |
| December 31, 2001 | | 1 Year | | Years | | Years | | Years | | Total |
| |
| |
| |
| |
| |
|
Investment Securities Available-for-Sale | | | | | | | | | | | | | | | | | | | | |
|
|
|
|
| U.S. Treasuries: | | | | | | | | | | | | | | | | | | | | |
|
|
|
|
| | Fair value | | $ | 3,594 | | | $ | 3,099 | | | | – | | | | – | | | $ | 6,693 | |
|
|
|
|
| | Weighted average yield | | | 6.29 | % | | | 3.88 | % | | | – | | | | – | | | | 5.17 | % |
|
|
|
|
| U.S. Government agencies: | | | | | | | | | | | | | | | | | | | | |
|
|
|
|
| | Fair value | | | – | | | $ | 12,169 | | | $ | 17,198 | | | | – | | | $ | 29,367 | |
|
|
|
|
| | Weighted average yield | | | – | | | | 5.22 | % | | | 5.99 | % | | | – | | | | 5.67 | % |
|
|
|
|
| State and municipal securities: | | | | | | | | | | | | | | | | | | | | |
|
|
|
|
| | Fair value | | | – | | | | – | | | $ | 428 | | | $ | 17,323 | | | $ | 17,751 | |
|
|
|
|
| | Weighted average yield | | | – | | | | – | | | | 7.78 | % | | | 6.93 | % | | | 6.95 | % |
|
|
|
|
| Mortgage-backed securities: | | | | | | | | | | | | | | | | | | | | |
|
|
|
|
| | Fair value | | | – | | | $ | 28,671 | | | $ | 20,384 | | | | – | | | $ | 49,055 | |
|
|
|
|
| | Weighted average yield | | | – | | | | 6.26 | % | | | 6.45 | % | | | – | | | | 6.34 | % |
|
|
|
|
| Collateralized mortgage obligations (CMO): | | | | | | | | | | | | | | | | | | | | |
|
|
|
|
| | Fair value | | $ | 2,634 | | | $ | 27,238 | | | $ | 2,444 | | | | – | | | $ | 32,316 | |
|
|
|
|
| | Weighted average yield | | | 7.69 | % | | | 6.51 | % | | | 6.34 | % | | | – | | | | 6.59 | % |
|
|
|
|
| Other debt securities: | | | | | | | | | | | | | | | | | | | | |
|
|
|
|
| | Fair value | | | – | | | | – | | | $ | 17,486 | | | $ | 3,000 | | | $ | 20,486 | |
|
|
|
|
| | Weighted average yield | | | – | | | | – | | | | 7.20 | % | | | 3.83 | % | | | 6.70 | % |
|
|
|
|
| Equity securities: | | | | | | | | | | | | | | | | | | | | |
|
|
|
|
| | Fair value | | | – | | | | – | | | | – | | | $ | 12,434 | | | $ | 12,434 | |
|
|
|
|
| | Weighted average yield | | | – | | | | – | | | | – | | | | 5.77 | % | | | 5.77 | % |
| | | | |
| | | |
| | | |
| | | |
| | | |
| |
| Total fair value | | $ | 6,228 | | | $ | 71,177 | | | $ | 57,940 | | | $ | 32,757 | | | $ | 168,102 | |
|
|
|
|
| Weighted average yield | | | 6.88 | % | | | 6.08 | % | | | 6.54 | % | | | 6.21 | % | | | 6.29 | % |
| | | | |
| | | |
| | | |
| | | |
| | | |
| |
Investment Securities Held-to-Maturity | | | | | | | | | | | | | | | | | | | | |
|
|
|
|
| State and municipal securities: | | | | | | | | | | | | | | | | | | | | |
|
|
|
|
| | Amortized cost | | $ | 406 | | | $ | 3,838 | | | $ | 10,924 | | | $ | 3,461 | | | $ | 18,629 | |
|
|
|
|
| | Weighted average yield | | | 7.20 | % | | | 6.91 | % | | | 6.26 | % | | | 6.71 | % | | | 6.50 | % |
|
|
|
|
| Collateralized mortgage obligations (CMO): | | | | | | | | | | | | | | | | | | | | |
|
|
|
|
| | Amortized cost | | $ | 2,929 | | | $ | 17,216 | | | $ | 4,024 | | | | – | | | $ | 24,169 | |
|
|
|
|
| | Weighted average yield | | | 6.27 | % | | | 6.16 | % | | | 5.80 | % | | | – | | | | 6.12 | % |
| | | | |
| | | |
| | | |
| | | |
| | | |
| |
| Total amortized cost | | $ | 3,335 | | | $ | 21,054 | | | $ | 14,948 | | | $ | 3,461 | | | $ | 42,798 | |
|
|
|
|
| Weighted average yield | | | 6.39 | % | | | 6.30 | % | | | 6.14 | % | | | 6.71 | % | | | 6.28 | % |
| | | | |
| | | |
| | | |
| | | |
| | | |
| |
Securities are assigned to categories based on stated contractual maturity except for mortgage-backed securities and CMOs which are based on anticipated payment periods. See interest rate sensitivity section for practical payment and repricing characteristics. Tax-exempt securities were adjusted to a tax-equivalent basis and are based on the marginal Federal corporate tax rate of 34 percent. Weighted average yields on investment securities available-for-sale are based on historical cost.
21
QNB Corp. and Subsidiary 2001 Annual Report
MANAGEMENT’S DISCUSSION AND ANALYSIS
Loans
QNB’s primary functions and responsibilities are to accept deposits and to make loans to meet the credit needs of the communities it serves. Loans are the most significant component of earning assets. Inherent within the lending function is the evaluation and acceptance of credit risk and interest rate risk along with the opportunity cost of alternative deployment of funds. QNB manages credit risk associated with its lending activities through portfolio diversification, underwriting policies and procedures, and loan monitoring practices.
QNB has comprehensive policies and procedures that define and govern both commercial and retail loan origination and management of risk. All loans are underwritten in a manner that emphasizes the borrowers’ capacity to pay. The measurement of capacity to pay delineates the potential risk of non-payment or default. The higher potential for default determines the need for and amount of collateral required. QNB makes unsecured loans when the capacity to pay is considered substantial. As capacity lessens, collateral is required to provide a secondary source of repayment and to mitigate the risk of loss. Various policies and procedures provide guidance to the lenders on such factors as amount, terms, price, maturity and appropriate collateral levels. Each risk factor is considered critical to assuring that QNB receives an adequate return for the risk undertaken, and that the risk of loss is minimized.
QNB effectively manages the risk associated with commercial loans, which generally have balances larger than retail loans, by having lenders work in tandem with credit underwriting personnel. In addition, a Loan Committee and a committee of the Board of Directors review certain loan requests on a weekly basis.
QNB’s commercial lending activity is focused on small businesses within the local community. Commercial and industrial loans represent commercial purpose loans that are either secured by collateral other than real estate or unsecured. Real estate commercial loans include commercial purpose loans collateralized at least in part by commercial real estate. These loans may not be for the express purpose of conducting commercial real estate transactions. Real estate residential loans include loans secured by one-to-four family units. These loans include home equity loans, loans to individuals for residential mortgages, and commercial purpose loans. Substantially all originations of loans to individuals for residential mortgages with maturities of 20 years or greater are sold in the secondary market. Included in real estate residential loans at December 31, 2001 and 2000 were $1,146,000 and $198,000 of residential mortgage loans held-for-sale. These loans were carried at the lower of aggregate cost or market.
As mentioned in last year’s annual report, the primary focus entering 2001 was deposit and loan growth. These objectives were to be achieved through the use of a business development and calling program encompassing lending personnel, branch personnel and executive management. The focus of this program is to both develop new lending and deposit relationships as well as strengthen existing relationships. QNB was successful on both fronts. Loans, net of unearned income, increased $16,977,000 or 9.2 percent to $202,211,000 at December 31, 2001. This followed growth of 6.6 percent in 2000. The addition of the new branch location and geographic market was key to the growth in loans. Commercial lending, residential mortgage lending and consumer lending all experienced growth during 2001. Commercial loans, both those secured by real estate or other collateral or unsecured, increased $11,528,000 or 9.6 percent to $131,151,000 at December 31, 2001. Residential mortgage loans increased by $2,650,000 or 10.4 percent to $28,093,000 and consumer loans, including home equity loans, increased by $2,799,000 or 7.0 percent to $42,967,000 at December 31, 2001.
The loan portfolio composition changed slightly from year-end 2000. Loans collateralized by commercial and residential properties increased to 73.8 percent of the portfolio at December 31, 2001, from 73.5 percent of the portfolio at December 31, 2000. Commercial and industrial loans decreased to 19.6 percent of the portfolio at year-end 2001 from 21.1 percent at December 31, 2000. Consumer loans decreased slightly from 3.6 percent at year-end 2000 to 3.3 percent at December 31, 2001. Construction loans showed the largest increase, going from .2 percent of the portfolio at December 31, 2000 to 2.0 percent of the portfolio at December 31, 2001.
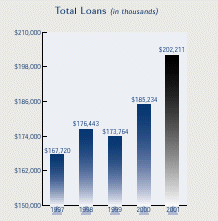
The commercial and industrial loan category increased $594,000 or 1.5 percent to end the year 2001 at $39,694,000. This minimal growth followed a year in which commercial and industrial loans increased by 22.2 percent or $7,097,000. Although a certain number of these loans are considered unsecured, the majority are secured by non-real estate collateral such as equipment, vehicles, accounts receivable and inventory. Loans secured by commercial real estate increased by $5,841,000 or 8.9 percent in 2001, following a .6 percent increase between December 31, 1999 and 2000. QNB’s commercial loans are not considered to be
22
QNB Corp. and Subsidiary 2001 Annual Report
MANAGEMENT’S DISCUSSION AND ANALYSIS
Loan Portfolio
| | | | | | | | | | | | | | | | | | | | | | |
| December 31, | | 2001 | | 2000 | | 1999 | | 1998 | | 1997 |
| |
| |
| |
| |
| |
|
| Commercial and industrial | | $ | 39,694 | | | $ | 39,100 | | | $ | 32,003 | | | $ | 35,003 | | | $ | 32,794 | |
|
|
|
|
| Agricultural | | | 2,622 | | | | 3,027 | | | | 1,935 | | | | 3,446 | | | | 2,845 | |
|
|
|
|
| Construction | | | 3,989 | | | | 380 | | | | 258 | | | | 782 | | | | 813 | |
|
|
|
|
| Real estate-commercial | | | 71,112 | | | | 65,271 | | | | 64,853 | | | | 60,708 | | | | 58,783 | |
|
|
|
|
| Real estate-residential | | | 78,419 | | | | 70,943 | | | | 68,945 | | | | 71,052 | | | | 67,621 | |
|
|
|
|
| Consumer | | | 6,645 | | | | 6,708 | | | | 6,005 | | | | 5,864 | | | | 5,312 | |
| | | |
| | | |
| | | |
| | | |
| | | |
| |
| | Total loans | | | 202,481 | | | | 185,429 | | | | 173,999 | | | | 176,855 | | | | 168,168 | |
|
|
|
|
| Less unearned income | | | 270 | | | | 195 | | | | 235 | | | | 412 | | | | 448 | |
| | | |
| | | |
| | | |
| | | |
| | | |
| |
| | Total loans, net of unearned income | | $ | 202,211 | | | $ | 185,234 | | | $ | 173,764 | | | $ | 176,443 | | | $ | 167,720 | |
| | | |
| | | |
| | | |
| | | |
| | | |
| |
Loan Maturities and Interest Sensitivity
| | | | | | | | | | | | | | | | | | |
| | | | Under | | 1-5 | | Over | | | | |
| December 31, 2001 | | 1 Year | | Years | | 5 Years | | Total |
| |
| |
| |
| |
|
| Commercial and industrial | | $ | 13,062 | | | $ | 19,012 | | | $ | 7,620 | | | $ | 39,694 | |
|
|
|
|
| Agricultural | | | 1,100 | | | | 17 | | | | 1,505 | | | | 2,622 | |
|
|
|
|
| Construction | | | 110 | | | | 3,879 | | | | — | | | | 3,989 | |
|
|
|
|
| Real estate-commercial | | | 4,071 | | | | 12,818 | | | | 54,223 | | | | 71,112 | |
|
|
|
|
| Real estate-residential | | | 8,560 | | | | 21,721 | | | | 48,138 | | | | 78,419 | |
|
|
|
|
| Consumer | | | 1,900 | | | | 4,538 | | | | 207 | | | | 6,645 | |
| | | |
| | | |
| | | |
| | | |
| |
| | Total | | $ | 28,803 | | | $ | 61,985 | | | $ | 111,693 | | | $ | 202,481 | |
| | | |
| | | |
| | | |
| | | |
| |
Demand loans, loans having no stated schedule of repayment and no stated maturity, are included in under one year.
The following shows the amount of loans due after one year that have fixed, variable or adjustable interest rates at December 31, 2001:
| | | |
| Loans with fixed predetermined interest rates | $84,650 | |
|
|
|
|
| Loans with variable or adjustable interest rates | $89,028 | |
Non-Performing Assets
| | | | | | | | | | | | | | | | | | | | | | | |
| December 31, | | 2001 | | 2000 | | 1999 | | 1998 | | 1997 |
| |
| |
| |
| |
| |
|
| Loans past due 90 days or more not on non-accrual status | | | | | | | | | | | | | | | | | | | | |
|
|
|
|
| | Commercial and industrial | | | – | | | | – | | | | – | | | | – | | | $ | 99 | |
|
|
|
|
| | Construction | | | – | | | | – | | | | – | | | | – | | | | – | |
|
|
|
|
| | Real estate-commercial | | | – | | | | – | | | | – | | | | – | | | | – | |
|
|
|
|
| | Real estate-residential | | $ | 305 | | | | – | | | $ | 33 | | | $ | 4 | | | | 60 | |
|
|
|
|
| | Consumer | | | 11 | | | $ | 4 | | | | 6 | | | | 1 | | | | – | |
| | | | |
| | | |
| | | |
| | | |
| | | |
| |
| | | Total loans past due 90 days or more and accruing | | | 316 | | | | 4 | | | | 39 | | | | 5 | | | | 159 | |
| |
| Loans accounted for on a non-accrual basis | | | | | | | | | | | | | | | | | | | | |
|
|
|
|
| | Commercial and industrial | | | – | | | | 42 | | | | 54 | | | | 9 | | | | 25 | |
|
|
|
|
| | Construction | | | – | | | | – | | | | – | | | | – | | | | – | |
|
|
|
|
| | Real estate-commercial | | | – | | | | – | | | | 171 | | | | 220 | | | | 744 | |
|
|
|
|
| | Real estate-residential | | | 280 | | | | 163 | | | | 259 | | | | 277 | | | | 440 | |
|
|
|
|
| | Consumer | | | – | | | | – | | | | – | | | | – | | | | – | |
| | | | |
| | | |
| | | |
| | | |
| | | |
| |
| | | Total non-accrual loans | | | 280 | | | | 205 | | | | 484 | | | | 506 | | | | 1,209 | |
| |
| Other real estate owned | | | – | | | | – | | | | 348 | | | | 696 | | | | 1,564 | |
| | | | |
| | | |
| | | |
| | | |
| | | |
| |
| | | Total non-performing assets | | $ | 596 | | | $ | 209 | | | $ | 871 | | | $ | 1,207 | | | $ | 2,932 | |
| | | | |
| | | |
| | | |
| | | |
| | | |
| |
| Total as a percent of total assets | | | .13 | % | | | .06 | % | | | .25 | % | | | .37 | % | | | .96 | % |
23
QNB Corp. and Subsidiary 2001 Annual Report
MANAGEMENT’S DISCUSSION AND ANALYSIS
Loans (continued)
concentrated, except those loans to real estate developers and investors which account for $26,167,000 or 12.9 percent of the loan portfolio at December 31, 2001. This represents an increase from the $23,685,000 or 12.8 percent at December 31, 2000. Concentration is based upon Standard Industrial Classification codes used for bank regulatory purposes and is considered to be 10 percent or more of total loans. Diversification is achieved through lending to various industries located within the market area. This diversification is believed to reduce risk associated with changes in economic conditions.
Residential real estate loans increased by $7,476,000 or 10.5 percent to $78,419,000 at December 31, 2001. This followed an increase of 2.9 percent between 1999 and 2000. Growth in home equity loans and residential mortgage loans accounts for $2,797,000 and $2,650,000 of the increase in 2001. These categories increased as a result of the lower interest rate environment experienced during 2001. Included in the balance as of December 31, 2001 and 2000 were $1,146,000 and $198,000 in residential mortgage loans held-for-sale. Contributing to the growth in home equity loans was aggressive fixed rate home equity loan promotions and pricing. The growth in the residential mortgage portfolio was also positively impacted by the decision to hold some 15-year mortgages in portfolio.
Loan growth continues to be a primary focus of management in 2002. The business development and calling program will be enhanced in 2002 with the development of a bank-wide sales initiative that will concentrate on sales training. In conjunction with this program is a service initiative that will work to enhance the exceptional personal service that our customers deserve.
Non-Performing Assets
Non-performing assets include accruing loans past due 90 days or more, non-accruing loans, restructured loans and other real estate owned. For the first time since 1992 non-performing assets increased when comparing year-end balances. The chart on page 23 shows the history of non-performing assets over the past five years. Total non-performing assets were $596,000 at December 31, 2001, or .13 percent of total assets. This represents an increase from the December 31, 2000 balance of $209,000. Non-performing assets at December 31, 2000 represented .06 percent of total assets. Despite the increase in 2001, non-performing assets remain at low levels historically and compared to peer groups.
Non-accrual loans are those on which the accrual of interest has ceased. Commercial loans are placed on non-accrual status immediately if, in the opinion of management, collection is doubtful, or when principal or interest is past due 90 days or more and collateral is insufficient to protect principal and interest. Interest accrued, but not collected at the date a loan is placed on non-accrual status, is reversed and charged against interest income. Subsequent cash receipts are applied either to the outstanding principal or recorded as interest income, depending on management’s assessment of ultimate collectibility of principal and interest. Loans are returned to an accrual status when the borrower’s ability to make periodic principal and interest payments has returned to normal (i.e. — brought current with respect to principal and interest or restructured) and the paying capacity of the borrower and/or the underlying collateral is deemed sufficient to protect principal and interest. Consumer loans are not automatically placed on non-accrual status when principal or interest payments are 90 days past due, but in most instances are charged-off when deemed uncollectible or after reaching 120 days past due.
Included in the loan portfolio are loans on non-accrual status of $280,000 and $205,000 at December 31, 2001 and 2000. If interest on non-accrual loans had been accrued throughout the period, interest income for the years ended December 31, 2001, 2000 and 1999 would have increased approximately $21,000, $40,000 and $55,000, respectively. The amount of interest income on these loans included in net income in 2001, 2000 and 1999 was $19,000, $0 and $21,000, respectively. There were no restructured loans as of December 31, 2001 or 2000, as defined in SFAS No. 15, “Accounting by Debtors and Creditors for Troubled Debt Restructurings,” that have not already been included in loans past due 90 days or more or non-accrual loans. There was no other real estate owned as of December 31, 2001 or 2000.
Loans not included in past due, non-accrual or restructured categories, but where known information about possible credit problems causes management to be uncertain as to the ability of the borrowers to comply with the present loan repayment terms, totaled $3,784,000 and $3,886,000 at December 31, 2001 and 2000, respectively.
As the year 2000 came to a close there were many economic indicators that the economy was slowing down and possibly heading into a recession. The indicators were correct as the economy continued to slow during 2001 and a minor recession did take hold. At the end of 2001, economic data was showing signs of improvement. Despite this positive data, the potential exists for an increase in non-performing loans depending on the strength and timing of the recovery.
Allowance For Loan Losses
The allowance for loan losses represents management’s best estimate of the know and inherent losses in the existing loan portfolio. Management uses various tools to assess the appropriateness of the allowance for loan losses. One tool is a model recommended by the Office of the Comptroller of the Currency. This model considers a number of relevant factors including: historical loan loss experience, the assigned risk rating of the credit, current and projected credit worthiness of the borrower, current value of the underlying collateral, levels of and trends in delinquencies and non-accrual loans, trends in volume and terms of loans, concentrations of credit, and national and local economic trends and conditions. This model is supplemented with another analysis that also incorporates exceptions to QNB’s loan policy and QNB’s portfolio exposure to borrowers with large dollar concentration, defined as exceeding 50% of QNB’s legal lending limit. Other tools include ratio analysis and peer group analysis.
24
QNB Corp. and Subsidiary 2001 Annual Report
MANAGEMENT’S DISCUSSION AND ANALYSIS
Allowance for Loan Loss Allocation
| | | | | | | | | | | | | | | | | | | | | | | | | | | | | | | | | | | | | | | | | | | |
| December 31, | | 2001 | | 2000 | | 1999 | | 1998 | | 1997 |
| |
| |
| |
| |
| |
|
| | | | | | | | | Percent | | | | | | Percent | | | | | | Percent | | | | | | Percent | | | | | | Percent |
| | | | | | | | | Gross | | | | | | Gross | | | | | | Gross | | | | | | Gross | | | | | | Gross |
| | | | | Amount | | Loans | | Amount | | Loans | | Amount | | Loans | | Amount | | Loans | | Amount | | Loans |
| | | | |
| |
| |
| |
| |
| |
| |
| |
| |
| |
|
| Balance at end of period applicable to: | | | | | | | | | | | | | | | | | | | | | | | | | | | | | | | | | | | | | | | | |
|
|
|
|
| | Commercial and industrial | | $ | 531 | | | | 19.6 | % | | $ | 892 | | | | 21.1 | % | | $ | 684 | | | | 18.4 | % | | $ | 269 | | | | 19.8 | % | | $ | 205 | | | | 19.5 | % |
|
|
|
|
| | Agricultural | | | 32 | | | | 1.3 | | | | 41 | | | | 1.6 | | | | 31 | | | | 1.1 | | | | 14 | | | | 2.0 | | | | 13 | | | | 1.7 | |
|
|
|
|
| | Construction | | | 62 | | | | 2.0 | | | | 10 | | | | .2 | | | | 42 | | | | .1 | | | | 3 | | | | .4 | | | | 3 | | | | .5 | |
|
|
|
|
| | Real estate-commercial | | | 1,148 | | | | 35.1 | | | | 975 | | | | 35.2 | | | | 902 | | | | 37.3 | | | | 262 | | | | 34.3 | | | | 354 | | | | 34.9 | |
|
|
|
|
| | Real estate-residential | | | 306 | | | | 38.7 | | | | 412 | | | | 38.3 | | | | 494 | | | | 39.6 | | | | 273 | | | | 40.2 | | | | 215 | | | | 40.2 | |
|
|
|
|
| | Consumer | | | 23 | | | | 3.3 | | | | 42 | | | | 3.6 | | | | 64 | | | | 3.5 | | | | 33 | | | | 3.3 | | | | 37 | | | | 3.2 | |
|
|
|
|
| | Unallocated | | | 743 | | | | | | | | 578 | | | | | | | | 979 | | | | | | | | 2,097 | | | | | | | | 1,843 | | | | | |
| | | | |
| | | | | | | |
| | | | | | | |
| | | | | | | |
| | | | | | | |
| | | | | |
| | | Total | | $ | 2,845 | | | | 100.0 | % | | $ | 2,950 | | | | 100.0 | % | | $ | 3,196 | | | | 100.0 | % | | $ | 2,951 | | | | 100.0 | % | | $ | 2,670 | | | | 100.0 | % |
| | | | |
| | | |
| | | |
| | | |
| | | |
| | | |
| | | |
| | | |
| | | |
| | | |
| |
Gross loans represent loans before unamortized net loan fees. Percent gross loans lists the percentage of each loan type to total loans.
Allowance for Loan Losses
| | | | | | | | | | | | | | | | | | | | | | |
| | | | 2001 | | 2000 | | 1999 | | 1998 | | 1997 |
| | | |
| |
| |
| |
| |
|
| Allowance for loan losses: | | | | | | | | | | | | | | | | | | | | |
|
|
|
|
| Balance, January 1 | | $ | 2,950 | | | $ | 3,196 | | | $ | 2,951 | | | $ | 2,670 | | | $ | 2,585 | |
| |
| Charge-offs | | | | | | | | | | | | | | | | | | | | |
|
|
|
|
| | Commercial and industrial | | | 86 | | | | 163 | | | | 3 | | | | 8 | | | | 16 | |
|
|
|
|
| | Construction | | | – | | | | – | | | | – | | | | – | | | | 10 | |
|
|
|
|
| | Real estate-commercial | | | – | | | | 67 | | | | – | | | | 50 | | | | 99 | |
|
|
|
|
| | Real estate-residential | | | 32 | | | | 27 | | | | 4 | | | | 81 | | | | 189 | |
|
|
|
|
| | Consumer | | | 31 | | | | 7 | | | | 15 | | | | 13 | | | | 30 | |
| | | |
| | | |
| | | |
| | | |
| | | |
| |
| | Total charge-offs | | | 149 | | | | 264 | | | | 22 | | | | 152 | | | | 344 | |
| |
| Recoveries | | | | | | | | | | | | | | | | | | | | |
|
|
|
|
| | Commercial and industrial | | | 6 | | | | 2 | | | | – | | | | 8 | | | | 7 | |
|
|
|
|
| | Construction | | | – | | | | – | | | | – | | | | – | | | | 1 | |
|
|
|
|
| | Real estate-commercial | | | 22 | | | | 10 | | | | 8 | | | | 6 | | | | – | |
|
|
|
|
| | Real estate-residential | | | 8 | | | | 4 | | | | 12 | | | | 10 | | | | 9 | |
|
|
|
|
| | Consumer | | | 8 | | | | 2 | | | | 7 | | | | 9 | | | | 12 | |
| | | |
| | | |
| | | |
| | | |
| | | |
| |
| | Total recoveries | | | 44 | | | | 18 | | | | 27 | | | | 33 | | | | 29 | |
| | | |
| | | |
| | | |
| | | |
| | | |
| |
| Net (charge-offs) recoveries | | | (105 | ) | | | (246 | ) | | | 5 | | | | (119 | ) | | | (315 | ) |
|
|
|
|
| Provision for loan losses | | | – | | | | – | | | | 240 | | | | 400 | | | | 400 | |
| | | |
| | | |
| | | |
| | | |
| | | |
| |
| Balance, December 31 | | $ | 2,845 | | | $ | 2,950 | | | $ | 3,196 | | | $ | 2,951 | | | $ | 2,670 | |
| | | |
| | | |
| | | |
| | | |
| | | |
| |
Total loans: | | | | | | | | | | | | | | | | | | | | |
|
|
|
|
| | Average | | $ | 191,994 | | | $ | 178,881 | | | $ | 174,912 | | | $ | 169,800 | | | $ | 161,096 | |
|
|
|
|
| | Year-end | | | 202,211 | | | | 185,234 | | | | 173,764 | | | | 176,443 | | | | 167,720 | |
| |
Ratios: | | | | | | | | | | | | | | | | | | | | |
|
|
|
|
| Net charge-offs (recoveries) to: | | | | | | | | | | | | | | | | | | | | |
|
|
|
|
| | Average loans | | | .05 | % | | | .14 | % | | | – | | | | .07 | % | | | .20 | % |
|
|
|
|
| | Loans at year-end | | | .05 | | | | .13 | | | | – | | | | .07 | | | | .19 | |
|
|
|
|
| | Allowance for loan losses | | | 3.69 | | | | 8.34 | | | | (.16 | )% | | | 4.03 | | | | 11.80 | |
|
|
|
|
| | Provision for loan losses | | | – | | | | – | | | | (2.08 | ) | | | 29.75 | | | | 78.75 | |
| |
| Allowance for loan losses to: | | | | | | | | | | | | | | | | | | | | |
|
|
|
|
| | Average loans | | | 1.48 | % | | | 1.65 | % | | | 1.83 | % | | | 1.74 | % | | | 1.66 | % |
|
|
|
|
| | Loans at year-end | | | 1.41 | | | | 1.59 | | | | 1.84 | | | | 1.67 | | | | 1.59 | |
|
|
|
|
| | Non-performing loans | | | 477.35 | | | | 1411.48 | | | | 611.09 | | | | 577.50 | | | | 195.20 | |
25
QNB Corp. and Subsidiary 2001 Annual Report
MANAGEMENT’S DISCUSSION AND ANALYSIS
Allowance For Loan Losses (continued)
QNB utilizes a risk weighting system that assigns a risk code to every commercial loan. This risk weighting system is supplemented with a program that encourages account officers to identify potentially deteriorating loan situations. The officer analysis program is used to complement the on-going analysis of the loan portfolio performed during the loan review function. In addition, QNB has a committee that meets quarterly to review the appropriateness of the allowance for loan losses based on the current and projected status of all relevant factors pertaining to the loan portfolio. In addition, regulatory authorities, as an integral part of their examinations, periodically review the allowance for loan losses. They may require additions to the allowance based upon their judgements using information available to them at the time of examination.
A loan is considered impaired, based on current information and events, if it is probable that QNB will be unable to collect the scheduled payments of principal or interest when due according to the contractual terms of the loan agreement. The measurement of impaired loans is generally based on the present value of expected future cash flows discounted at the effective interest rate, except that all collateral-dependent loans are measured for impairment based on the fair value of the collateral.
At December 31, 2001 and 2000, the recorded investment in loans for which impairment has been recognized totaled $233,000 and $145,000, of which $233,000 and $103,000 required no valuation allowance. As of December 31, 2001 and 2000, $0 and $42,000 of loans required a valuation allowance on the entire amount. Most of the loans identified as impaired are collateral-dependent. For the years ended December 31, 2001, 2000 and 1999, the average recorded investment in impaired loans was approximately $207,000, $397,000 and $323,000. QNB recognized $100,000, $67,000 and $67,000 of interest income on these loans in 2001, 2000 and 1999.
Net charge-offs were $105,000 and $246,000 in 2001 and 2000. Approximately $83,000 of the total loans charged off in 2001 and $154,000 of the total loans charged off in 2000 represents a loan to one borrower in each year. Net recoveries were $5,000 for 1999. Net charge-offs in 2001 and 2000 represent .05 percent and .14 percent of average loans.
The allowance for loan losses was $2,845,000 at December 31, 2001, which represents 1.41 percent of total loans, compared to $2,950,000 and 1.59 percent of total loans at December 31, 2000. QNB did not add to the allowance for loan losses, with a provision for loan losses, during either 2001 or 2000 because of the continued low levels of non-performing assets and charge-offs. While the allowance is allocated to specific loans or loan categories, the total allowance is considered available for losses in the entire loan portfolio. While QNB believes that its allowance is adequate to cover losses in the loan portfolio, inherent uncertainties remain regarding future economic events and their potential impact on asset quality.
Deposits
QNB primarily attracts deposits from within its market area by offering various deposit products including: demand deposits, interest-bearing demand accounts, money market accounts, savings accounts and certificates of deposit.
Total deposits increased $50,909,000 or 17.3 percent to $344,731,000 at December 31, 2001. Deposit growth was aided in 2001 by another year of declines in the stock market as funds flowed out of stocks and mutual funds and flowed into deposits, particularly short-term time deposits. The tragic events of September 11 may have played a part as approximately 40.0 percent of the growth in deposits occurred during the fourth quarter of 2001. Non-interest-bearing and interest-bearing deposit accounts increased $5,305,000 and $5,929,000, respectively to $40,078,000 and $55,083,000 at December 31, 2001. Savings accounts increased $1,772,000 to $37,160,000 at December 31, 2001. However, the majority of the increase was in time deposits, which have increased $41,530,000 or 30.7 percent during 2001 to $176,811,000. Time deposits over $100,000 accounted for $24,185,000 of this increase with balances reaching $41,844,000 at December 31, 2001. The “Flex 12” certificate of deposit has been particularly popular during this period providing an alternative to lower-rate money market and savings accounts. Balances in this product have increased from $18,561,000 at December 31, 2000, to $50,342,000 at December 31, 2001.
Total deposits increased 2.7 percent to $293,822,000 at December 31, 2000. In contrast to other years, where the growth was mainly in time deposits, growth during 2000 was mainly in money market accounts. Money market accounts increased $9,224,000 or 30.7 percent to finish 2000 at $39,226,000. The Treasury Select Indexed Money Market account introduced at the end of the first quarter of 2000 was the primary reason for the growth in money market balances. This product is a variable rate account indexed to the monthly average of the 91-day Treasury bill rate based on balances in the account. This product paid a minimum 6.00 percent yield through the end of 2000 for accounts with balances over $25,000. This product is intended to be competitive with brokerage money market products. This money market product with its guaranteed minimum rate and its liquidity feature replaced short-term time deposits as the preferred account for many customers. Non-interest bearing deposit accounts also increased 3.6 percent when comparing December 31, 2000 to December 31, 1999.
An analysis of the change in average deposits provides a more meaningful measure of deposit change. Average total deposits increased 6.9 percent in 2001 and 2.7 percent in 2000. Average non-interest-bearing deposits decreased .6 percent to $35,193,000 in 2001. This followed a 1.1 percent decrease in 2000. Average interest-bearing demand accounts increased 4.0 percent in 2001 to $50,106,000 and 6.3 percent in 2000 to $48,202,000. Non-interest-bearing and interest-bearing demand deposits are important sources of funds for QNB because they are low cost.
26
QNB Corp. and Subsidiary 2001 Annual Report
MANAGEMENT’S DISCUSSION AND ANALYSIS
Average Deposits by Major Classification
| | | | | | | | | | | | | | | | | | | | | | | | | | |
| | | | 2001 | | 2000 | | 1999 |
| | | |
| |
| |
|
| | | | Balance | | Rate | | Balance | | Rate | | Balance | | Rate |
| | | |
| |
| |
| |
| |
| |
|
| Non-interest-bearing deposits | | $ | 35,193 | | | | – | | | $ | 35,386 | | | | – | | | $ | 35,783 | | | | – | |
|
|
|
|
| Interest-bearing demand accounts | | | 50,106 | | | | .91 | % | | | 48,202 | | | | 1.37 | % | | | 45,339 | | | | 1.06 | % |
|
|
|
|
| Money market accounts | | | 37,982 | | | | 2.78 | | | | 36,273 | | | | 3.64 | | | | 30,684 | | | | 2.58 | |
|
|
|
|
| Savings | | | 36,684 | | | | 1.63 | | | | 36,310 | | | | 1.95 | | | | 37,312 | | | | 1.86 | |
|
|
|
|
| Time | | | 126,629 | | | | 5.32 | | | | 116,422 | | | | 5.45 | | | | 112,109 | | | | 5.20 | |
|
|
|
|
| Time deposits of $100,000 or more | | | 25,915 | | | | 5.10 | | | | 19,680 | | | | 5.62 | | | | 23,289 | | | | 5.33 | |
| | | | |
| | | |
| | | |
| | | |
| | | |
| | | |
| |
| | Total | | $ | 312,509 | | | | 3.25 | % | | $ | 292,273 | | | | 3.47 | % | | $ | 284,516 | | | | 3.18 | % |
| | | | |
| | | |
| | | |
| | | |
| | | |
| | | |
| |
Maturity of Time Deposits of $100,000 or More
| | | | | | | | | | | | | | |
| Year Ended December 31, | | 2001 | | 2000 | | 1999 |
| |
| |
| |
|
| Three months or less | | $ | 8,769 | | | $ | 3,624 | | | $ | 3,627 | |
|
|
|
|
| Over three months through six months | | | 8,845 | | | | 1,664 | | | | 2,859 | |
|
|
|
|
| Over six months through twelve months | | | 19,360 | | | | 3,404 | | | | 4,350 | |
|
|
|
|
| Over twelve months | | | 4,870 | | | | 8,967 | | | | 9,550 | |
| | | |
| | | |
| | | |
| |
| | Total | | $ | 41,844 | | | $ | 17,659 | | | $ | 20,386 | |
| | | |
| | | |
| | | |
| |
Average money market accounts increased 4.7 percent in 2001 and 18.2 percent when comparing 2000 to 1999. The large increase in average money market accounts in 2000 is a result of the Treasury Select Money Market account mentioned previously. This product had a direct impact on time deposits in 2000, as average time deposits increased by only .5 percent between 2000 and 1999. However, in 2001 average time deposits increased 12.1 percent to $152,544,000. For customers, time deposits, particularly those with maturities of one year or less, have provided relative value compared to money market and savings accounts.
Attracting deposits, while not a problem in 2001, will continue to be a major issue facing the banking industry. To continue to attract and retain deposits, QNB will have to be competitive with respect to rates and will have to continually develop new products that appeal to customers.
Liquidity
Liquidity represents an institution’s ability to generate cash or otherwise obtain funds at reasonable rates to satisfy commitments to borrowers and demands of depositors. QNB manages its mix of cash, Federal funds sold, investment securities and loans in order to match the volatility, seasonality, interest sensitivity and growth trends of its deposit funds. Liquidity is provided from asset sources through maturities and repayments of loans and investment securities, net interest income and fee income. The portfolio of investment securities available-for-sale and QNB’s policy of selling certain residential mortgage originations and student loans in the secondary market also provide sources of liquidity. Additional sources of liquidity are provided by the Bank’s membership in the Federal Home Loan Bank and a $5,000,000 unsecured Federal funds line granted by the Bank’s correspondent.
Cash and due from banks, Federal funds sold, available-for-sale securities and loans held-for-sale totaled $194,105,000 at December 31, 2001 and $133,031,000 at December 31, 2000. These sources were adequate to meet seasonal deposit withdrawals during the year 2001 and should be adequate to meet normal fluctuations in loan demand and deposit withdrawals. QNB has been able to fund the growth in earning assets during 2001 through increased deposits, short-term borrowings and advances from the FHLB. QNB used its Federal funds line on several occasions during 2001, but did not require any overnight borrowings from either the FHLB or the Federal Reserve discount window to fund loan growth or deposit withdrawals during 2001. Approximately $47,997,000 and $43,019,000 of available-for-sale securities at December 31, 2001 and 2000 were pledged as collateral for repurchase agreements and deposits of public funds as required by law.
The consolidated statements of cash flows present the changes in cash and cash equivalents from operating, investing and financing activities. QNB’s cash and cash equivalents increased $3,754,000 to $18,220,000 at December 31, 2001. This follows a decrease in 2000 of $4,886,000. The large decrease in cash in 2000 is a result of liquidity planning for potential Year 2000 demands. QNB increased cash at the end of 1999 as a contingency plan for any potential Year 2000 cash demands. This excess cash was reinvested in investment securities in January and February of 2000 after Year 2000 concerns passed.
After adjusting net income for non-cash transactions, operating activities provided $7,567,000 in cash flow in 2001, compared to $6,055,000 in 2000. Proceeds from the sale of student loans provided $2,680,000 and $2,281,000 in cash in 2001 and 2000. Net mortgage activity of $1,232,000 and $228,000 was a use of cash during 2001 and 2000 as
27
QNB Corp. and Subsidiary 2001 Annual Report
MANAGEMENT’S DISCUSSION AND ANALYSIS
Liquidity (continued)
originations of mortgage loans-held-for sale exceeded the proceeds of loans sold. An increase in accrued interest payable and other liabilities of $734,000 and $797,000, respectively, provided an increase in cash from operating activities in 2001.
Net cash used by investing activities was $76,180,000 in 2001 compared to $25,177,000 in 2000. The purchase of investment securities exceeded the maturity, call and sale of securities by $51,669,000 in 2001 and $7,105,000 in 2000. Federal Home Loan Bank advances provided $28,000,000 of cash for the purchase of investment securities in 2001. An increase in loans, excluding residential mortgage originations, of $18,286,000 and $13,693,000 was also a use of cash during 2001 and 2000. The purchase of $3,000,000 of Bank Owned Life Insurance was also a use of cash in 2001. An increase in Federal funds sold in both 2001 and 2000 of $2,983,000 and $2,678,000 were a use of cash. The purchase of fixed assets was a use of cash of $2,067,000 in 2000. The new computer system and the building of the new branch were the major fixed asset purchases in 2000.
Cash provided by financing activities was $72,367,000 in 2001. As mentioned previously, advances from the FHLB provided $28,000,000 in 2001. Increases in both non-interest-bearing and interest-bearing deposits provided $5,305,000 and $45,604,000 in cash during the year. One result of the recession and stock market downturn has been a strong flow of deposits into banks. Investors have appeared to take on a more conservative profile in light of the stock market downturn and the events of September 11, 2001. For customers, time deposits, particularly those with maturities of one year or less, have provided relative value compared to money market and savings accounts. Total time deposits have increased $41,530,000 during 2001 with time deposits over $100,000 accounting for $24,185,000 of this increase. The “Flex 12” certificate of deposit has been particularly popular during this period providing an alternative to money market and savings accounts. Balances in this product have increased from $18,561,000 at December 31, 2000 to $50,342,000 at December 31, 2001. Short-term borrowings, primarily cash management accounts, decreased $4,368,000 in 2001. The cash dividend of $1,655,000 and the purchase of $561,000 in treasury stock during the year were both uses of cash and reductions to shareholders’ equity in 2001.
Cash provided by financing activities was $14,236,000 during 2000. Increases in interest-bearing deposit accounts and short-term borrowings provided $8,393,000 and $8,894,000 in cash during the year. The increase in interest-bearing deposit accounts was primarily centered in the Treasury Select Money Market Account that was introduced in 2000. As of December 31, 2000, the balance in these accounts was $14,332,000. These accounts paid a higher promotional rate guaranteed through December 31, 2000. Interest-bearing demand accounts increased $1,706,000 during 2000, while time deposits over $100,000 decreased $2,727,000. The decrease in time deposits over $100,000 is partially a result of the competitive rate paid on the Treasury Select Money Market account. The balance in cash management accounts increased $9,371,000 during 2000 and account for the increase in short-term borrowings. The cash dividend of $1,426,000 and the purchase of $933,000 in treasury stock during the year were both uses of cash and reductions to shareholders’ equity.
A challenge in 2002 will be to retain the deposits acquired during 2001, particularly the time deposits over $100,000, especially if the stock markets return to higher levels. QNB is likely to maintain slightly higher levels of cash and Federal funds sold in preparation for potential deposit runoff during 2002.
Capital Adequacy
A strong capital position is fundamental to support continued growth and profitability, to serve the needs of depositors, and to yield an attractive return for shareholders. QNB’s shareholders’ equity at December 31, 2001 was $35,219,000 or 7.80 percent of total assets, compared to shareholders’ equity of $31,794,000 or 8.55 percent at December 31, 2000. At December 31, 2001, shareholders’ equity included a positive adjustment of $1,099,000 related to the unrealized holding gain, net of taxes, on investment securities available-for-sale, while shareholders’ equity at December 31, 2000 included a negative adjustment of $64,000. Without these adjustments, shareholders’ equity to total assets would have been 7.56 percent and 8.57 percent at December 31, 2001 and 2000, respectively. The decrease in the ratio is a result of the 21.4 percent growth in total assets between December 31, 2000 and December 31, 2001.
On March 30, 2000, the Board of Directors of QNB Corp. approved a plan to repurchase up to 4.99 percent or 79,180 shares of QNB Corp.’s outstanding common stock in open market and privately negotiated transactions. As of December 31, 2001 and 2000, 53,343 and 32,646 shares had been repurchased at an average cost of $28.01 and $28.58 per share, respectively. These shares are recorded as Treasury stock at cost and reduce total shareholders’ equity. During the second quarter of 2001 the Board of Directors declared a 5 percent stock dividend which was paid on June 29, 2001. Per share information has been adjusted to reflect the impact of the stock dividend.
Average shareholders’ equity and average total assets were $32,756,000 and $412,899,000 during 2001, an increase of 5.7 percent and 13.6 percent compared to 2000. The ratio of average total equity to average total assets decreased to 7.93 percent for 2001, compared to 8.53 percent for 2000. The decrease in the ratio is a result of the growth in average assets during 2001 outpacing the growth in shareholders’ equity.
28
QNB Corp. and Subsidiary 2001 Annual Report
MANAGEMENT’S DISCUSSION AND ANALYSIS
The Corporation is subject to restrictions on the payment of dividends to its stockholders pursuant to the Pennsylvania Business Corporation Law as amended (the “BCL”). The BCL operates generally to preclude dividend payments if the effect thereof would render the Corporation insolvent, as defined. As a practical matter, the Corporation’s payment of dividends is contingent upon its ability to obtain funding in the form of dividends from the Bank. Payment of dividends to the Corporation by the Bank is subject to the restrictions set forth in the National Bank Act. Generally, the National Bank Act would permit the Bank to declare dividends in 2002 of approximately $3,601,000, plus an amount equal to the net profits of the Bank in 2002 up to the date of any such dividend declaration. QNB Corp. paid dividends to its shareholders of $1.07 per share in 2001, an increase of 17.6 percent from the $.91 per share paid in 2000.
QNB is subject to various regulatory capital requirements as issued by Federal regulatory authorities. Regulatory capital is defined in terms of Tier I capital (shareholders’ equity excluding unrealized gains or losses on available-for-sale securities and intangible assets), Tier II capital which includes a portion of the allowance for loan losses, and total capital (Tier I plus Tier II). Risk-based capital ratios are expressed as a percentage of risk-weighted assets. Risk-weighted assets are determined by assigning various weights to all assets and off-balance sheet arrangements, such as letters of credit and loan commitments, based on associated risk. Regulators have also adopted minimum Tier I leverage ratio standards, which measure the ratio of Tier I capital to total average assets. The minimum regulatory capital ratios are 4.00 percent for Tier I, 8.00 percent for total risk-based capital and 4.00 percent for leverage.
Based on the requirements, QNB has a Tier I capital ratio of 12.37 percent and 13.99 percent, a total risk-based ratio of 13.42 percent and 15.24 percent, and a leverage ratio of 7.78 percent and 8.60 percent at December 31, 2001 and 2000, respectively. The decrease in both the Tier I and total risk-based capital ratios is primarily the result of the growth in total assets, particularly loans, Corporate bonds and non-agency issued mortgage-backed securities. These assets have a higher risk-weighting than U.S. Treasury or U.S. Government Agency issued debt securities. The decrease in the leverage ratio is a result of average assets increasing at a faster rate than Tier I capital.
The Federal Deposit Insurance Corporation Improvement Act of 1991 established five capital level designations ranging from “well capitalized” to “critically undercapitalized.” At December 31, 2001 and 2000, QNB met the “well capitalized” criteria, which requires minimum Tier I and total risk-based capital ratios of 6.00 percent and 10.00 percent, respectively, and a leverage ratio of 5.00 percent.
Capital Analysis
| | | | | | | | | |
| December 31, | | 2001 | | 2000 |
| |
| |
|
Tier I | | | | | | | | |
|
|
|
|
| Shareholders’ equity | | $ | 35,219 | | | $ | 31,794 | |
|
|
|
|
| Net unrealized securities (gains) losses | | | (1,099 | ) | | | 64 | |
|
|
|
|
| Net unrealized losses equity securities | | | – | | | | (26 | ) |
|
|
|
|
| Intangible assets | | | (311 | ) | | | (349 | ) |
| | | |
| | | |
| |
| Total Tier I risk-based capital | | | 33,809 | | | | 31,483 | |
| |
Tier II | | | | | | | | |
|
|
|
|
| Allowable portion of the allowance for loan losses | | | 2,845 | | | | 2,815 | |
|
|
|
|
| Unrealized gains on equity securities | | | 23 | | | | – | |
| | | |
| | | |
| |
| Total risk-based capital | | $ | 36,677 | | | $ | 34,298 | |
| | | |
| | | |
| |
| Risk-weighted assets | | $ | 273,342 | | | $ | 225,038 | |
| | | |
| | | |
| |
Capital Ratios
| | | | | | | | | |
| December 31, | | 2001 | | 2000 |
| |
| |
|
| Tier I capital/risk-weighted assets | | | 12.37 | % | | | 13.99 | % |
|
|
|
|
| Total risk-based capital/risk-weighted assets | | | 13.42 | | | | 15.24 | |
|
|
|
|
| Tier I capital/average assets (leverage ratio) | | | 7.78 | | | | 8.60 | |
29
QNB Corp. and Subsidiary 2001 Annual Report
MANAGEMENT’S DISCUSSION AND ANALYSIS
Interest Rate Sensitivity
Since the assets and liabilities of QNB have diverse repricing characteristics that influence net interest income, management analyzes interest sensitivity through the use of gap analysis and simulation models. Interest rate sensitivity management seeks to minimize the effect of interest rate changes on net interest margins and interest rate spreads and to provide growth in net interest income through periods of changing interest rates. The Asset/Liability Management Committee (ALCO) is responsible for managing interest rate risk and for evaluating the impact of changing interest rate conditions on net interest income.
Gap analysis measures the difference between volumes of rate-sensitive assets and liabilities and quantifies these repricing differences for various time intervals. Static gap analysis describes interest rate sensitivity at a point in time. However, it alone does not accurately measure the magnitude of changes in net interest income since changes in interest rates do not impact all categories of assets and liabilities equally or simultaneously. Interest rate sensitivity analysis also involves assumptions on certain categories of assets and deposits. For purposes of interest rate sensitivity analysis, assets and liabilities are stated at their contractual maturity, estimated likely call date, or earliest repricing opportunity. Mortgage-backed securities, CMOs and amortizing loans are scheduled based on their anticipated cash flow. Savings accounts, including passbook, statement savings, money market, and interest-bearing demand accounts, do not have a stated maturity or repricing term and can be withdrawn or repriced at any time. This may impact QNB’s margin if more expensive alternative sources of deposits are required to fund loans or deposit runoff. Management projects the repricing characteristics of these accounts based on historical performance and assumptions that it believes reflect their rate sensitivity. The Treasury Select Indexed Money Market account reprices monthly, based on a percentage of the average of the 91-day Treasury bill.
A positive gap results when the amount of interest rate sensitive assets exceeds interest rate sensitive liabilities. A negative gap results when the amount of interest rate sensitive liabilities exceeds interest rate sensitive assets.
QNB primarily focuses on the management of the one-year interest rate sensitivity gap. At December 31, 2001, interest-earning assets scheduled to mature or likely to be called, repriced or repaid in one year were $159,371,000. Interest-sensitive liabilities scheduled to mature or reprice within one year were $192,205,000. The one year cumulative gap, which reflects QNB’s interest sensitivity over a period of time, was a negative $32,834,000 at December 31, 2001. The cumulative one-year gap equals 7.74 percent of total rate-sensitive assets. This negative or liability-sensitive gap will generally benefit QNB in a falling interest rate environment, while rising interest rates could negatively impact QNB. The negative gap position is partially a result of the large increase in time deposits with a maturity of one year or less. As of December 31, 2001, $143,705,000 or 81.3 percent of time deposits mature or reprice within the next twelve months. This compares to $67,383,000 or 49.8 percent at December 31, 2000.
QNB also uses a simulation model to assess the impact of changes in
Interest Rate Sensitivity
| | | | | | | | | | | | | | | | | | | | | | | | | | | | | |
| | | Within | | 3 to 6 | | 6 months | | 1 to 3 | | 3 to 5 | | After | | | | |
| December 31, 2001 | | 3 months | | months | | to 1 year | | years | | years | | 5 years | | Total |
| |
| |
| |
| |
| |
| |
| |
|
Assets | | | | | | | | | | | | | | | | | | | | | | | | | | | | |
|
|
|
|
| Interest-bearing balances | | $ | 227 | | | | — | | | | — | | | | — | | | | — | | | | — | | | $ | 227 | |
|
|
|
|
| Federal funds sold | | | 5,661 | | | | — | | | | — | | | | — | | | | — | | | | — | | | | 5,661 | |
|
|
|
|
| Investment securities* | | | 16,379 | | | $ | 14,667 | | | $ | 23,355 | | | $ | 66,792 | | | $ | 23,261 | | | $ | 64,780 | | | | 209,234 | |
|
|
|
|
| Loans | | | 47,345 | | | | 15,504 | | | | 29,235 | | | | 72,458 | | | | 24,924 | | | | 12,745 | | | | 202,211 | |
|
|
|
|
| Cash surrender value of life insurance | | | — | | | | — | | | | 6,998 | | | | — | | | | — | | | | — | | | | 6,998 | |
| | | |
| | | |
| | | |
| | | |
| | | |
| | | |
| | | |
| |
| Total rate sensitive assets | | | 69,612 | | | | 30,171 | | | | 59,588 | | | | 139,250 | | | | 48,185 | | | | 77,525 | | | $ | 424,331 | |
|
|
|
|
| Total cumulative assets | | $ | 69,612 | | | $ | 99,783 | | | $ | 159,371 | | | $ | 298,621 | | | $ | 346,806 | | | $ | 424,331 | | | | | |
| | | |
| | | |
| | | |
| | | |
| | | |
| | | |
| | | |
| |
Liabilities | | | | | | | | | | | | | | | | | | | | | | | | | | | | |
|
|
|
|
| Interest-bearing non-maturing deposits | | $ | 25,104 | | | $ | 3,275 | | | $ | 3,670 | | | $ | 3,158 | | | $ | 3,735 | | | $ | 88,900 | | | $ | 127,842 | |
|
|
|
|
| Time deposits less than $100,000 | | | 25,233 | | | | 27,297 | | | | 54,082 | | | | 22,990 | | | | 5,365 | | | | — | | | | 134,967 | |
|
|
|
|
| Time deposits over $100,000 | | | 8,888 | | | | 8,845 | | | | 19,360 | | | | 4,173 | | | | 578 | | | | — | | | | 41,844 | |
|
|
|
|
| Short-term borrowings | | | 13,451 | | | | — | | | | — | | | | — | | | | — | | | | — | | | | 13,451 | |
|
|
|
|
| Federal Home Loan Bank advances | | | 3,000 | | | | — | | | | — | | | | — | | | | — | | | | 50,000 | | | | 53,000 | |
| | | |
| | | |
| | | |
| | | |
| | | |
| | | |
| | | |
| |
| Total rate sensitive liabilities | | | 75,676 | | | | 39,417 | | | | 77,112 | | | | 30,321 | | | | 9,678 | | | | 138,900 | | | $ | 371,104 | |
|
|
|
|
| Total cumulative liabilities | | $ | 75,676 | | | $ | 115,093 | | | $ | 192,205 | | | $ | 222,526 | | | $ | 232,204 | | | $ | 371,104 | | | | | |
| | | |
| | | |
| | | |
| | | |
| | | |
| | | |
| | | |
| |
| Gap during period | | $ | (6,064 | ) | | $ | (9,246 | ) | | $ | (17,524 | ) | | $ | 108,929 | | | $ | 38,507 | | | $ | (61,375 | ) | | $ | 53,227 | |
| | | |
| | | |
| | | |
| | | |
| | | |
| | | |
| | | |
| |
| Cumulative gap | | $ | (6,064 | ) | | $ | (15,310 | ) | | $ | (32,834 | ) | | $ | 76,095 | | | $ | 114,602 | | | $ | 53,227 | | | | | |
| | | |
| | | |
| | | |
| | | |
| | | |
| | | |
| | | |
| Cumulative gap/rate sensitive assets | | | (1.43 | )% | | | (3.61 | )% | | | (7.74 | )% | | | 17.93 | % | | | 27.01 | % | | | 12.54 | % | | | | |
| | | |
| | | |
| | | |
| | | |
| | | |
| | | |
| | | |
| Cumulative gap ratio | | | .92 | | | | .87 | | | | .83 | | | | 1.34 | | | | 1.49 | | | | 1.14 | | | | | |
| | | |
| | | |
| | | |
| | | |
| | | |
| | | |
| | | |
| * | | Excludes unrealized holding loss on available-for-sale securities of $1,666. |
30
QNB Corp. and Subsidiary 2001 Annual Report
MANAGEMENT’S DISCUSSION AND ANALYSIS
The table below summarizes estimated changes in net interest income over a twelve-month period, under various interest rate scenarios.
| | | | | | | | | | | | | |
| Change in Interest Rates | | Net Interest Income | | Dollar Change | | Percent Change |
| |
| |
| |
|
December 31, 2001 | | | | | | | | | | | | |
|
|
|
|
| +300 Basis Points | | $ | 14,355 | | | $ | (302 | ) | | | (2.06 | )% |
|
|
|
|
| +200 Basis Points | | | 14,614 | | | | (43 | ) | | | (0.29 | ) |
|
|
|
|
| +100 Basis Points | | | 14,806 | | | | 149 | | | | 1.02 | |
|
|
|
|
| FLAT RATE | | | 14,657 | | | | — | | | | — | |
|
|
|
|
| -100 Basis Points | | | 14,166 | | | | (491 | ) | | | (3.35 | ) |
|
|
|
|
| -200 Basis Points | | | 13,519 | | | | (1,138 | ) | | | (7.76 | ) |
|
|
|
|
| -300 Basis Points | | | 13,245 | | | | (1,412 | ) | | | (9.63 | ) |
| | | |
| | | |
| | | |
| |
December 31, 2000 | | | | | | | | | | | | |
|
|
|
|
| +300 Basis Points | | $ | 11,874 | | | $ | (648 | ) | | | (5.17 | )% |
|
|
|
|
| +200 Basis Points | | | 12,120 | | | | (402 | ) | | | (3.21 | ) |
|
|
|
|
| +100 Basis Points | | | 12,334 | | | | (188 | ) | | | (1.50 | ) |
|
|
|
|
| FLAT RATE | | | 12,522 | | | | — | | | | — | |
|
|
|
|
| -100 Basis Points | | | 12,360 | | | | (162 | ) | | | (1.29 | ) |
|
|
|
|
| -200 Basis Points | | | 11,949 | | | | (573 | ) | | | (4.58 | ) |
|
|
|
|
| -300 Basis Points | | | 11,442 | | | | (1,080 | ) | | | (8.62 | ) |
interest rates on net interest income. The model reflects management’s assumptions related to asset yields and rates paid on liabilities, deposit sensitivity, and the size, composition and maturity or repricing characteristics of the balance sheet. The assumptions are based on what management believes at that time to be the most likely interest rate environment. Management also evaluates the impact of higher and lower interest rates.
Actual results may differ from simulated results due to various factors including time, magnitude and frequency of interest rate changes, the relationship or spread between various rates, loan pricing and deposit sensitivity, and asset/liability strategies. Based on the simulation model, net interest income in 2002 is expected to increase compared to amounts reported in 2001. This is principally a result of an increase in earning assets. The net interest margin in the base case is anticipated to be close to 2001 levels.
If interest rates are 100 basis points higher than management’s most likely interest rate environment, the simulation model projects net interest income for the next twelve months to be slightly higher than the most likely scenario. If interest rates are 100 basis points lower than management’s most likely interest rate environment, the model projects net interest income for the next twelve months to be lower than the most likely scenario. These results are contrary to the results indicated by the gap analysis and show some of the inherent weaknesses of gap analysis. For example, gap analysis does not take into consideration interest rate floors on deposit accounts or optionality found in the investment and loan portfolios.
Management believes that the assumptions utilized in evaluating the vulnerability of QNB’s net interest income to changes in interest rates approximate actual experience. However, the interest rate sensitivity of QNB’s assets and liabilities, as well as the estimated effect of changes in interest rates on net interest income, could vary substantially if different assumptions are used or actual experience differs from the experience on which the assumptions were based.
In the event QNB should experience a mismatch in its desired gap ranges or an excessive decline in its net interest income subsequent to an immediate and sustained change in interest rates, it has a number of options that it could utilize to remedy such a mismatch. QNB could restructure its investment portfolio through the sale or purchase of securities with more favorable repricing attributes. It could also emphasize loan products with appropriate maturities or repricing attributes, or it could attract deposits or obtain borrowings with desired maturities.
The nature of QNB’s current operation is such that it is not subject to foreign currency exchange or commodity price risk. Additionally, neither the Corporation nor the Bank owns trading assets. At December 31, 2001, QNB did not have any hedging transactions in place such as interest rate swaps, caps or floors.
Other Items
Management is not aware of any current specific recommendations by regulatory authorities, or proposed legislation, which, if they were implemented, would have a material adverse effect upon the liquidity, capital resources, or results of operations; although, the general cost of compliance with numerous and multiple Federal and State laws and regulations does have, and in the future may have, a negative impact on QNB’s results of operations.
31
QNB Corp. and Subsidiary 2001 Annual Report
MANAGEMENT’S DISCUSSION AND ANALYSIS
Consolidated Quarterly Financial Data
| | | | | | | | | | | | | | | | | | | | | | | | | | | | | | | | | |
| | | Quarters Ended 2001 | | Quarters Ended 2000 |
| | |
| |
|
| | | March 31 | | June 30 | | Sept. 30 | | Dec. 31 | | March 31 | | June 30 | | Sept. 30 | | Dec. 31 |
| | |
| |
| |
| |
| |
| |
| |
| |
|
| Interest income | | $ | 6,460 | | | $ | 6,727 | | | $ | 6,836 | | | $ | 6,905 | | | $ | 5,907 | | | $ | 6,135 | | | $ | 6,375 | | | $ | 6,281 | |
|
|
|
|
| Interest expense | | | 3,302 | | | | 3,440 | | | | 3,394 | | | | 3,268 | | | | 2,741 | | | | 2,903 | | | | 3,200 | | | | 3,163 | |
| | | |
| | | |
| | | |
| | | |
| | | |
| | | |
| | | |
| | | |
| |
|
|
|
|
| Net interest income | | | 3,158 | | | | 3,287 | | | | 3,442 | | | | 3,637 | | | | 3,166 | | | | 3,232 | | | | 3,175 | | | | 3,118 | |
|
|
|
|
| Provision for loan losses | | | — | | | | — | | | | — | | | | — | | | | — | | | | — | | | | — | | | | — | |
|
|
|
|
| Non-interest income | | | 682 | | | | 906 | | | | 771 | | | | 711 | | | | 611 | | | | 684 | | | | 663 | | | | 833 | |
|
|
|
|
| Non-interest expense | | | 2,643 | | | | 2,684 | | | | 2,675 | | | | 3,078 | | | | 2,366 | | | | 2,499 | | | | 2,530 | | | | 2,837 | |
| | | |
| | | |
| | | |
| | | |
| | | |
| | | |
| | | |
| | | |
| |
|
|
|
|
| Income before income taxes | | | 1,197 | | | | 1,509 | | | | 1,538 | | | | 1,270 | | | | 1,411 | | | | 1,417 | | | | 1,308 | | | | 1,114 | |
|
|
|
|
| Provision for income taxes | | | 209 | | | | 325 | | | | 329 | | | | 215 | | | | 316 | | | | 332 | | | | 288 | | | | 208 | |
| | | |
| | | |
| | | |
| | | |
| | | |
| | | |
| | | |
| | | |
| |
|
|
|
|
Net Income | | $ | 988 | | | $ | 1,184 | | | $ | 1,209 | | | $ | 1,055 | | | $ | 1,095 | | | $ | 1,085 | | | $ | 1,020 | | | $ | 906 | |
| | | |
| | | |
| | | |
| | | |
| | | |
| | | |
| | | |
| | | |
| |
|
|
|
|
Net Income Per Share — basic | | $ | .64 | | | $ | .77 | | | $ | .78 | | | $ | .69 | | | $ | .68 | | | $ | .69 | | | $ | .65 | | | $ | .58 | |
| | | |
| | | |
| | | |
| | | |
| | | |
| | | |
| | | |
| | | |
| |
|
|
|
|
Net Income Per Share — diluted | | $ | .64 | | | $ | .76 | | | $ | .78 | | | $ | .68 | | | $ | .68 | | | $ | .68 | | | $ | .65 | | | $ | .58 | |
| | | |
| | | |
| | | |
| | | |
| | | |
| | | |
| | | |
| | | |
| |
Selected Financial and Other Data
| | | | | | | | | | | | | | | | | | | | | | |
| Year Ended December 31, | | 2001 | | 2000 | | 1999 | | 1998 | | 1997 |
| |
| |
| |
| |
| |
|
Income and Expense | | | | | | | | | | | | | | | | | | | | |
|
|
|
|
| Interest income | | $ | 26,928 | | | $ | 24,698 | | | $ | 23,195 | | | $ | 22,195 | | | $ | 21,122 | |
|
|
|
|
| Interest expense | | | 13,404 | | | | 12,007 | | | | 10,304 | | | | 9,574 | | | | 9,066 | |
| | | |
| | | |
| | | |
| | | |
| | | |
| |
| Net interest income | | | 13,524 | | | | 12,691 | | | | 12,891 | | | | 12,621 | | | | 12,056 | |
|
|
|
|
| Provision for loan losses | | | — | | | | — | | | | 240 | | | | 400 | | | | 400 | |
|
|
|
|
| Non-interest income | | | 3,070 | | | | 2,791 | | | | 2,208 | | | | 2,149 | | | | 1,919 | |
|
|
|
|
| Non-interest expense | | | 11,080 | | | | 10,232 | | | | 9,884 | | | | 9,650 | | | | 9,191 | |
| | | |
| | | |
| | | |
| | | |
| | | |
| |
| Income before income taxes | | | 5,514 | | | | 5,250 | | | | 4,975 | | | | 4,720 | | | | 4,384 | |
|
|
|
|
| Provision for income taxes | | | 1,078 | | | | 1,144 | | | | 1,174 | | | | 1,272 | | | | 1,253 | |
| | | |
| | | |
| | | |
| | | |
| | | |
| |
| Net income | | $ | 4,436 | | | $ | 4,106 | | | $ | 3,801 | | | $ | 3,448 | | | $ | 3,131 | |
| | | |
| | | |
| | | |
| | | |
| | | |
| |
Per Share Data | | | | | | | | | | | | | | | | | | | | |
|
|
|
|
| Net income — basic | | $ | 2.87 | | | $ | 2.61 | | | $ | 2.40 | | | $ | 2.18 | | | $ | 1.99 | |
|
|
|
|
| Net income — diluted | | | 2.87 | | | | 2.61 | | | | 2.39 | | | | 2.17 | | | | 1.98 | |
|
|
|
|
| Book value | | | 22.92 | | | | 20.41 | | | | 17.24 | | | | 17.84 | | | | 16.29 | |
|
|
|
|
| Cash dividends | | | 1.07 | | | | .91 | | | | .76 | | | | .65 | | | | .58 | |
|
|
|
|
| Average common shares outstanding — basic | | | 1,544,010 | | | | 1,573,321 | | | | 1,583,022 | | | | 1,578,475 | | | | 1,574,349 | |
|
|
|
|
| Average common shares outstanding — diluted | | | 1,547,368 | | | | 1,573,619 | | | | 1,588,787 | | | | 1,589,183 | | | | 1,580,922 | |
| |
Balance Sheet at Year-end | | | | | | | | | | | | | | | | | | | | |
|
|
|
|
| Loans, net of unearned income | | $ | 202,211 | | | $ | 185,234 | | | $ | 173,764 | | | $ | 176,443 | | | $ | 167,720 | |
|
|
|
|
| Investment securities available-for-sale | | | 168,102 | | | | 114,245 | | | | 97,609 | | | | 70,088 | | | | 75,920 | |
|
|
|
|
| Investment securities held-to-maturity | | | 42,798 | | | | 42,982 | | | | 48,302 | | | | 50,065 | | | | 40,400 | |
|
|
|
|
| Other earning assets | | | 5,888 | | | | 3,226 | | | | 281 | | | | 4,986 | | | | 2,151 | |
|
|
|
|
| Total assets | | | 451,274 | | | | 371,671 | | | | 350,489 | | | | 324,672 | | | | 305,772 | |
|
|
|
|
| Deposits | | | 344,731 | | | | 293,822 | | | | 286,166 | | | | 279,223 | | | | 267,166 | |
|
|
|
|
| Borrowed funds | | | 66,541 | | | | 42,819 | | | | 33,925 | | | | 14,491 | | | | 10,342 | |
|
|
|
|
| Shareholders’ equity | | | 35,219 | | | | 31,794 | | | | 27,462 | | | | 28,338 | | | | 25,832 | |
| |
Selected Financial Ratios | | | | | | | | | | | | | | | | | | | | |
|
|
|
|
| Net interest margin | | | 3.81 | % | | | 4.02 | % | | | 4.23 | % | | | 4.51 | % | | | 4.60 | % |
|
|
|
|
| Net income as a percentage of: | | | | | | | | | | | | | | | | | | | | |
|
|
|
|
| | Average total assets | | | 1.07 | | | | 1.13 | | | | 1.10 | | | | 1.11 | | | | 1.08 | |
|
|
|
|
| | Average shareholders’ equity | | | 13.54 | | | | 13.25 | | | | 13.16 | | | | 13.10 | | | | 13.11 | |
|
|
|
|
| Average shareholders’ equity to average total assets | | | 7.93 | | | | 8.53 | | | | 8.38 | | | | 8.48 | | | | 8.27 | |
|
|
|
|
| Dividend payout ratio | | | 37.32 | | | | 34.75 | | | | 31.74 | | | | 29.90 | | | | 29.22 | |
32
QNB Corp. and Subsidiary 2001 Annual Report
CONSOLIDATED BALANCE SHEETS
| | | | | | | | | | | |
| | | | | (in thousands) |
| December 31, | | 2001 | | 2000 |
| |
| |
|
Assets | | | | | | | | |
|
|
|
|
| Cash and due from banks | | $ | 18,220 | | | $ | 14,466 | |
|
|
|
|
| Federal funds sold | | | 5,661 | | | | 2,678 | |
|
|
|
|
| Investment securities | | | | | | | | |
|
|
|
|
| | Available-for-sale | | | 168,102 | | | | 114,245 | |
|
|
|
|
| | Held-to-maturity (market value $43,048 and $42,815) | | | 42,798 | | | | 42,982 | |
|
|
|
|
| Total loans, net of unearned income of $270 and $195 | | | 202,211 | | | | 185,234 | |
|
|
|
|
| | Allowance for loan losses | | | (2,845 | ) | | | (2,950 | ) |
| | | |
| | | |
| |
| | | Net loans | | | 199,366 | | | | 182,284 | |
|
|
|
|
| Cash surrender value of insurance | | | 6,998 | | | | 3,763 | |
|
|
|
|
| Premises and equipment, net | | | 5,614 | | | | 6,173 | |
|
|
|
|
| Accrued interest receivable | | | 2,497 | | | | 2,213 | |
|
|
|
|
| Other assets | | | 2,018 | | | | 2,867 | |
| | | |
| | | |
| |
| Total assets | | $ | 451,274 | | | $ | 371,671 | |
| | | |
| | | |
| |
Liabilities | | | | | | | | |
|
|
|
|
| Deposits | | | | | | | | |
|
|
|
|
| | Demand, non-interest-bearing | | $ | 40,078 | | | $ | 34,773 | |
|
|
|
|
| | Interest-bearing demand accounts | | | 55,083 | | | | 49,154 | |
|
|
|
|
| | Money market accounts | | | 35,599 | | | | 39,226 | |
|
|
|
|
| | Savings | | | 37,160 | | | | 35,388 | |
|
|
|
|
| | Time | | | 134,967 | | | | 117,622 | |
|
|
|
|
| | Time over $100,000 | | | 41,844 | | | | 17,659 | |
| | | |
| | | |
| |
| | | Total deposits | | | 344,731 | | | | 293,822 | |
|
|
|
|
| Short-term borrowings | | | 13,451 | | | | 17,819 | |
|
|
|
|
| Federal Home Loan Bank advances | | | 53,000 | | | | 25,000 | |
|
|
|
|
| Accrued interest payable | | | 2,143 | | | | 1,409 | |
|
|
|
|
| Other liabilities | | | 2,730 | | | | 1,827 | |
| | | |
| | | |
| |
| Total liabilities | | | 416,055 | | | | 339,877 | |
| | | |
| | | |
| |
| Commitments and contingencies | | | | | | | | |
| |
Shareholders’ Equity | | | | | | | | |
|
|
|
|
| Common stock, par value $1.25 per share; | | | | | | | | |
|
|
|
|
| | authorized 5,000,000 shares; 1,589,702 shares and 1,512,755 shares issued; | | | | | | | | |
|
|
|
|
| | 1,536,359 and 1,480,109 shares outstanding | | | 1,987 | | | | 1,891 | |
|
|
|
|
| Surplus | | | 8,681 | | | | 6,491 | |
|
|
|
|
| Retained earnings | | | 24,946 | | | | 24,409 | |
|
|
|
|
| Accumulated other comprehensive income (loss) | | | 1,099 | | | | (64 | ) |
|
|
|
|
| Treasury stock, at cost; 53,343 shares and 32,646 shares | | | (1,494 | ) | | | (933 | ) |
| | | |
| | | |
| |
| Total shareholders’ equity | | | 35,219 | | | | 31,794 | |
| | | |
| | | |
| |
| Total liabilities and shareholders’ equity | | $ | 451,274 | | | $ | 371,671 | |
| | | |
| | | |
| |
The accompanying notes are an integral part of the consolidated financial statements.
33
QNB Corp. and Subsidiary 2001 Annual Report
CONSOLIDATED STATEMENTS OF INCOME
| | | | | | | | | | | | | | | |
| | | | | (in thousands, except share data) |
| Year Ended December 31, | | 2001 | | 2000 | | 1999 |
| |
| |
| |
|
Interest Income | | | | | | | | | | | | |
|
|
|
|
| Interest and fees on loans | | $ | 15,250 | | | $ | 14,625 | | | $ | 14,154 | |
|
|
|
|
| Interest and dividends on investment securities: | | | | | | | | | | | | |
|
|
|
|
| | Taxable | | | 9,763 | | | | 8,495 | | | | 7,815 | |
|
|
|
|
| | Tax-exempt | | | 1,619 | | | | 1,341 | | | | 1,034 | |
|
|
|
|
| Interest on Federal funds sold | | | 282 | | | | 216 | | | | 187 | |
|
|
|
|
| Interest on interest-bearing balances | | | 14 | | | | 21 | | | | 5 | |
| | | |
| | | |
| | | |
| |
| | | Total interest income | | | 26,928 | | | | 24,698 | | | | 23,195 | |
| | | |
| | | |
| | | |
| |
Interest Expense | | | | | | | | | | | | |
|
|
|
|
| Interest on deposits | | | | | | | | | | | | |
|
|
|
|
| Interest-bearing demand accounts | | | 455 | | | | 659 | | | | 481 | |
|
|
|
|
| | Money market accounts | | | 1,056 | | | | 1,320 | | | | 793 | |
|
|
|
|
| | Savings | | | 596 | | | | 709 | | | | 693 | |
|
|
|
|
| | Time | | | 6,731 | | | | 6,344 | | | | 5,830 | |
|
|
|
|
| | Time over $100,000 | | | 1,321 | | | | 1,107 | | | | 1,241 | |
|
|
|
|
| Interest on short-term borrowings | | | 539 | | | | 516 | | | | 378 | |
|
|
|
|
| Interest on Federal Home Loan Bank advances | | | 2,706 | | | | 1,352 | | | | 888 | |
| | | |
| | | |
| | | |
| |
| | | Total interest expense | | | 13,404 | | | | 12,007 | | | | 10,304 | |
| | | |
| | | |
| | | |
| |
| | | Net interest income | | | 13,524 | | | | 12,691 | | | | 12,891 | |
|
|
|
|
| Provision for loan losses | | | — | | | | — | | | | 240 | |
| | | |
| | | |
| | | |
| |
| | | Net interest income after provision for loan losses | 13,524 | | | | 12,691 | | | | 12,651 | |
| | | |
| | | |
| | | |
| |
Non-Interest Income | | | | | | | | | | | | |
|
|
|
|
| Fees for services to customers | | | 1,437 | | | | 1,293 | | | | 1,202 | |
|
|
|
|
| ATM and debit card income | | | 469 | | | | 384 | | | | 268 | |
|
|
|
|
| Income on cash surrender value of insurance | | | 206 | | | | 175 | | | | 162 | |
|
|
|
|
| Mortgage servicing fees | | | 36 | | | | 112 | | | | 125 | |
|
|
|
|
| Net gain (loss) on investment securities available-for-sale | | | 292 | | | | 310 | | | | (139 | ) |
|
|
|
|
| Net gain on sale of loans | | | 244 | | | | 76 | | | | 178 | |
|
|
|
|
| Other operating income | | | 386 | | | | 441 | | | | 412 | |
| | | |
| | | |
| | | |
| |
| | | Total non-interest income | | | 3,070 | | | | 2,791 | | | | 2,208 | |
| | | |
| | | |
| | | |
| |
Non-Interest Expense | | | | | | | | | | | | |
|
|
|
|
| Salaries and employee benefits | | | 6,174 | | | | 5,753 | | | | 5,696 | |
|
|
|
|
| Net occupancy expense | | | 854 | | | | 710 | | | | 669 | |
|
|
|
|
| Furniture and equipment expense | | | 1,008 | | | | 976 | | | | 908 | |
|
|
|
|
| Marketing expense | | | 437 | | | | 361 | | | | 379 | |
|
|
|
|
| Third party services | | | 502 | | | | 339 | | | | 284 | |
|
|
|
|
| Telephone, postage and supplies expense | | | 525 | | | | 487 | | | | 534 | |
|
|
|
|
| State taxes | | | 294 | | | | 280 | | | | 268 | |
|
|
|
|
| Other expense | | | 1,286 | | | | 1,326 | | | | 1,146 | |
| | | |
| | | |
| | | |
| |
| | | Total non-interest expense | | | 11,080 | | | | 10,232 | | | | 9,884 | |
| | | |
| | | |
| | | |
| |
| | Income before income taxes | | | 5,514 | | | | 5,250 | | | | 4,975 | |
|
|
|
|
| Provision for income taxes | | | 1,078 | | | | 1,144 | | | | 1,174 | |
| | | |
| | | |
| | | |
| |
| | Net Income | | $ | 4,436 | | | $ | 4,106 | | | $ | 3,801 | |
| | | |
| | | |
| | | |
| |
| | Net Income Per Share — Basic | | $ | 2.87 | | | $ | 2.61 | | | $ | 2.40 | |
| | | |
| | | |
| | | |
| |
| | Net Income Per Share — Diluted | | $ | 2.87 | | | $ | 2.61 | | | $ | 2.39 | |
| | | |
| | | |
| | | |
| |
The accompanying notes are an integral part of the consolidated financial statements.
34
QNB Corp. and Subsidiary 2001 Annual Report
CONSOLIDATED STATEMENTS OF SHAREHOLDERS’ EQUITY
| | | | | | | | | | | | | | | | | | | | | | | | | | | | | | | | | | |
| | | | | | | | | | | | Accumulated
Other | | | | | | | | | | | | | | | | | | | | |
| | | | Number | | Comprehensive | | Comprehensive | | Common | | | | | | Retained | | Treasury | | | | |
| (in thousands, except share data) | | of Shares | | Income | | Income (loss) | | Stock | | Surplus | | Earnings | | Stock | | Total |
| |
| |
| |
| |
| |
| |
| |
| |
|
| Balance, December 31, 1998 | | | 1,433,066 | | | | — | | | $ | 916 | | | $ | 1,791 | | | $ | 4,413 | | | $ | 21,218 | | | | — | | | $ | 28,338 | |
| | | |
| | | |
| | | |
| | | |
| | | |
| | | |
| | | |
| | | |
| |
| Net income | | | — | | | $ | 3,801 | | | | — | | | | — | | | | — | | | | 3,801 | | | | — | | | | 3,801 | |
|
|
|
|
| Other comprehensive income, net of tax | | | | | | | | | | | | | | | | | | | | | | | | | | | | | | | | |
|
|
|
|
| | Unrealized holding (losses) on
investment securities available-for-sale | | | — | | | | (3,612 | ) | | | — | | | | — | | | | — | | | | — | | | | — | | | | — | |
|
|
|
|
| | Reclassification adjustment for
losses included in net income | | | — | | | | 92 | | | | | | | | | | | | | | | | | | | | | | | | | |
| | | | | | | |
| | | | | | | | | | | | | | | | | | | |
|
|
|
|
| | Other comprehensive loss | | | — | | | | (3,520 | ) | | | (3,520 | ) | | | — | | | | — | | | | — | | | | — | | | | (3,520 | ) |
| | | | | | | |
| | | | | | | | | | | | | | | | | | | |
|
|
|
|
| Comprehensive income | | | | | | $ | 281 | | | | | | | | | | | | | | | | | | | | | | | | | |
| | | | | | | |
| | | | | | | | | | | | | | | | | | | |
|
|
|
|
| Cash dividends paid |
| ($.76 per share) | | | — | | | | — | | | | — | | | | — | | | | — | | | | (1,207 | ) | | | — | | | | (1,207 | ) |
|
|
|
|
| Stock issue — Employee stock purchase plan | | | 1,493 | | | | — | | | | — | | | | 2 | | | | 46 | | | | — | | | | — | | | | 48 | |
|
|
|
|
| Stock issued for options exercised | | | 2,612 | | | | — | | | | — | | | | 3 | | | | (1 | ) | | | — | | | | — | | | | 2 | |
| | | |
| | | |
| | | |
| | | |
| | | |
| | | |
| | | |
| | | |
| |
| Balance, December 31, 1999 | | | 1,437,171 | | | | — | | | | (2,604 | ) | | | 1,796 | | | | 4,458 | | | | 23,812 | | | | — | | | | 27,462 | |
| | | |
| | | |
| | | |
| | | |
| | | |
| | | |
| | | |
| | | |
| |
| Net income | | | — | | | $ | 4,106 | | | | — | | | | — | | | | — | | | | 4,106 | | | | — | | | | 4,106 | |
|
|
|
|
| Other comprehensive income, net of tax | | | | | | | | | | | | | | | | | | | | | | | | | | | | | | | | |
|
|
|
|
| | Unrealized holding gains on
investment securities available-for-sale | | | — | | | | 2,744 | | | | — | | | | — | | | | — | | | | — | | | | — | | | | — | |
|
|
|
|
| | Reclassification adjustment for
gains included in net income | | | — | | | | (204 | ) | | | | | | | | | | | | | | | | | | | | | | | | |
| | | | | | | |
| | | | | | | | | | | | | | | | | | | |
|
|
|
|
| | Other comprehensive income | | | — | | | | 2,540 | | | | 2,540 | | | | — | | | | — | | | | — | | | | — | | | | 2,540 | |
| | | | | | | |
| | | | | | | | | | | | | | | | | | | |
|
|
|
|
| Comprehensive income | | | | | | $ | 6,646 | | | | | | | | | | | | | | | | | | | | | | | | | |
| | | | | | | |
| | | | | | | | | | | | | | | | | | | |
|
|
|
|
| Cash dividends paid |
| ($.91 per share) | | | — | | | | — | | | | — | | | | — | | | | — | | | | (1,426 | ) | | | — | | | | (1,426 | ) |
|
|
|
|
| Stock dividend 5% | | | 71,807 | | | | — | | | | — | | | | 90 | | | | 1,993 | | | | (2,083 | ) | | | — | | | | — | |
|
|
|
|
| Stock issue — Employee stock purchase plan | | | 1,675 | | | | — | | | | — | | | | 2 | | | | 43 | | | | — | | | | — | | | | 45 | |
|
|
|
|
| Stock issued for options exercised | | | 2,102 | | | | — | | | | — | | | | 3 | | | | (3 | ) | | | — | | | | — | | | | — | |
|
|
|
|
| Treasury stock purchased | | | (32,646 | ) | | | — | | | | — | | | | — | | | | — | | | | — | | | | (933 | ) | | | (933 | ) |
| | | |
| | | |
| | | |
| | | |
| | | |
| | | |
| | | |
| | | |
| |
| Balance, December 31, 2000 | | | 1,480,109 | | | | — | | | | (64 | ) | | | 1,891 | | | | 6,491 | | | | 24,409 | | | | (933 | ) | | | 31,794 | |
| | | |
| | | |
| | | |
| | | |
| | | |
| | | |
| | | |
| | | |
| |
| Net income | | | — | | | $ | 4,436 | | | | — | | | | — | | | | — | | | | 4,436 | | | | — | | | | 4,436 | |
|
|
|
|
| Other comprehensive income, net of tax | | | | | | | | | | | | | | | | | | | | | | | | | | | | | | | | |
|
|
|
|
| | Unrealized holding gains on
investment securities available-for-sale | | | — | | | | 1,356 | | | | — | | | | — | | | | — | | | | — | | | | — | | | | — | |
|
|
|
|
| | Reclassification adjustment for
gains included in net income | | | — | | | | (193 | ) | | | | | | | | | | | | | | | | | | | | | | | | |
| | | | | | | |
| | | | | | | | | | | | | | | | | | | |
|
|
|
|
| | Other comprehensive income | | | — | | | | 1,163 | | | | 1,163 | | | | — | | | | — | | | | — | | | | — | | | | 1,163 | |
| | | | | | | |
| | | | | | | | | | | | | | | | | | | |
|
|
|
|
| Comprehensive income | | | | | | $ | 5,599 | | | | | | | | | | | | | | | | | | | | | | | | | |
| | | | | | | |
| | | | | | | | | | | | | | | | | | | |
|
|
|
|
| Cash dividends paid |
| ($1.07 per share) | | | — | | | | — | | | | — | | | | — | | | | — | | | | (1,655 | ) | | | — | | | | (1,655 | ) |
|
|
|
|
| Stock dividend 5% | | | 75,364 | | | | — | | | | — | | | | 94 | | | | 2,150 | | | | (2,244 | ) | | | — | | | | — | |
|
|
|
|
| Stock issue — Employee stock purchase plan | | | 1,583 | | | | — | | | | — | | | | 2 | | | | 40 | | | | — | | | | — | | | | 42 | |
|
|
|
|
| Treasury stock purchased | | | (20,697 | ) | | | — | | | | — | | | | — | | | | — | | | | — | | | | (561 | ) | | | (561 | ) |
| | | |
| | | |
| | | |
| | | |
| | | |
| | | |
| | | |
| | | |
| |
| Balance, December 31, 2001 | | | 1,536,359 | | | | — | | | $ | 1,099 | | | $ | 1,987 | | | $ | 8,681 | | | $ | 24,946 | | | $ | (1,494 | ) | | $ | 35,219 | |
| | | |
| | | |
| | | |
| | | |
| | | |
| | | |
| | | |
| | | |
| |
The accompanying notes are an integral part of the consolidated financial statements.
35
\
QNB Corp. and Subsidiary 2001 Annual Report
CONSOLIDATED STATEMENTS OF CASH FLOWS
| | | | | | | | | | | | | | | | |
| | | | | | | | | | (in thousands) | | | | |
| Year Ended December 31, | | 2001 | | 2000 | | 1999 |
| |
| |
| |
|
Operating Activities | | | | | | | | | | | | |
|
|
|
|
| | Net income | | $ | 4,436 | | | $ | 4,106 | | | $ | 3,801 | |
|
|
|
|
| | Adjustments to reconcile net income to net cash provided by operating activities | | | | | | | | | | | | |
|
|
|
|
| | | Provision for loan losses | | | — | | | | — | | | | 240 | |
|
|
|
|
| | | Depreciation and amortization | | | 788 | | | | 735 | | | | 655 | |
|
|
|
|
| | | Securities (gains) losses | | | (292 | ) | | | (310 | ) | | | 139 | |
|
|
|
|
| | | Net gain on sale of loans | | | (244 | ) | | | (76 | ) | | | (178 | ) |
|
|
|
|
| | | Proceeds from sales of residential mortgages | | | 15,598 | | | | 1,956 | | | | 11,027 | |
|
|
|
|
| | | Originations of residential mortgages held-for-sale | | | (16,830 | ) | | | (2,184 | ) | | | (7,400 | ) |
|
|
|
|
| | | Proceeds from sales of student loans | | | 2,680 | | | | 2,281 | | | | 2,261 | |
|
|
|
|
| | | Loss on disposal of premises and equipment | | | 12 | | | | — | | | | 1 | |
|
|
|
|
| | | Writedowns, net of (gains) losses on sales of other real estate owned | | | — | | | | (18 | ) | | | (64 | ) |
|
|
|
|
| | | Income on cash surrender value of insurance | | | (206 | ) | | | (175 | ) | | | (162 | ) |
|
|
|
|
| | | Deferred income tax provision | | | 6 | | | | 149 | | | | (16 | ) |
|
|
|
|
| | | Change in income taxes payable | | | 125 | | | | 18 | | | | 3 | |
|
|
|
|
| | | Net increase in accrued interest receivable | | | (284 | ) | | | (168 | ) | | | (145 | ) |
|
|
|
|
| | | Net amortization of premiums and discounts | | | 211 | | | | (53 | ) | | | 5 | |
|
|
|
|
| | | Net increase (decrease) in accrued interest payable | | | 734 | | | | (11 | ) | | | 235 | |
|
|
|
|
| | | Decrease (increase) in other assets | | | 36 | | | | (506 | ) | | | (413 | ) |
|
|
|
|
| | | Increase in other liabilities | | | 797 | | | | 311 | | | | 81 | |
| | | | |
| | | |
| | | |
| |
| | | Net cash provided by operating activities | | | 7,567 | | | | 6,055 | | | | 10,070 | |
| | | | |
| | | |
| | | |
| |
Investing Activities | | | | | | | | | | | | |
|
|
|
|
| | Proceeds from maturities and calls of investment securities | | | | | | | | | | | | |
|
|
|
|
| | | available-for-sale | | | 47,809 | | | | 23,802 | | | | 22,548 | |
|
|
|
|
| | | held-to-maturity | | | 15,757 | | | | 5,998 | | | | 12,603 | |
|
|
|
|
| | Proceeds from sales of investment securities | | | | | | | | | | | | |
|
|
|
|
| | | available-for-sale | | | 17,484 | | | | 12,878 | | | | 17,976 | |
|
|
|
|
| | Purchase of investment securities | | | | | | | | | | | | |
|
|
|
|
| | | available-for-sale | | | (117,104 | ) | | | (49,097 | ) | | | (73,453 | ) |
|
|
|
|
| | | held-to-maturity | | | (15,615 | ) | | | (686 | ) | | | (10,909 | ) |
|
|
|
|
| | Net (increase) decrease in Federal funds sold | | | (2,983 | ) | | | (2,678 | ) | | | 4,869 | |
|
|
|
|
| | Net increase in loans | | | (18,286 | ) | | | (13,693 | ) | | | (3,026 | ) |
|
|
|
|
| | Net purchases of premises and equipment | | | (242 | ) | | | (2,067 | ) | | | (976 | ) |
|
|
|
|
| | Proceeds from the sale of other real estate owned | | | — | | | | 366 | | | | 412 | |
|
|
|
|
| | Purchase of single premium life insurance | | | (3,000 | ) | | | — | | | | — | |
| | | | |
| | | |
| | | |
| |
| | | | Net cash used by investing activities | | | (76,180 | ) | | | (25,177 | ) | | | (29,956 | ) |
| | | | |
| | | |
| | | |
| |
Financing Activities | | | | | | | | | | | | |
|
|
|
|
| | Net increase (decrease) in non-interest-bearing deposits | | | 5,305 | | | | (737 | ) | | | (3,573 | ) |
|
|
|
|
| | Net increase in interest-bearing deposits | | | 45,604 | | | | 8,393 | | | | 10,516 | |
|
|
|
|
| | Net (decrease) increase in short-term borrowings | | | (4,368 | ) | | | 8,894 | | | | (5,566 | ) |
|
|
|
|
| | Proceeds from Federal Home Loan Bank advances | | | 28,000 | | | | — | | | | 25,000 | |
|
|
|
|
| | Cash dividends paid | | | (1,655 | ) | | | (1,426 | ) | | | (1,207 | ) |
|
|
|
|
| | Proceeds from issuance of common stock | | | 42 | | | | 45 | | | | 48 | |
|
|
|
|
| | Purchases of treasury stock | | | (561 | ) | | | (933 | ) | | | — | |
| | | | |
| | | |
| | | |
| |
| | | Net cash provided by financing activities | | | 72,367 | | | | 14,236 | | | | 25,218 | |
| | | | |
| | | |
| | | |
| |
| | | Increase (decrease) in cash and cash equivalents | | | 3,754 | | | | (4,886 | ) | | | 5,332 | |
|
|
|
|
| | | Cash and cash equivalents at beginning of year | | | 14,466 | | | | 19,352 | | | | 14,020 | |
| | | | |
| | | |
| | | |
| |
| | | Cash and cash equivalents at end of year | | $ | 18,220 | | | $ | 14,466 | | | $ | 19,352 | |
| | | | |
| | | |
| | | |
| |
Supplemental Cash Flow Disclosures | | | | | | | | | | | | |
|
|
|
|
| | Interest paid | | $ | 12,670 | | | $ | 12,018 | | | $ | 10,069 | |
|
|
|
|
| | Income taxes paid | | | 930 | | | | 961 | | | | 1,170 | |
|
|
|
|
| | Non-Cash Transactions | | | | | | | | | | | | |
|
|
|
|
| | Change in net unrealized holding gains or losses, net of taxes, on investment securities | | | 1,163 | | | | 2,540 | | | | (3,520 | ) |
The accompanying notes are an integral part of the consolidated financial statements.
36
QNB Corp. and Subsidiary 2001 Annual Report
NOTES TO CONSOLIDATED FINANCIAL STATEMENTS
Note 1 — Summary of Significant Accounting Policies
Business
QNB Corp. (the “Corporation”), through its wholly-owned subsidiary, The Quakertown National Bank (the “Bank”), has been serving the residents and businesses of Upper Bucks, Northern Montgomery and Southern Lehigh Counties in Pennsylvania since 1877. The Bank is a locally managed community bank providing loan, deposit, and trust services from its seven branch locations. The Bank encounters vigorous competition for market share in the communities it serves from bank holding companies, other community banks, thrift institutions, credit unions and other non-bank financial organizations such as mutual fund companies, insurance companies and brokerage companies. QNB Corp. manages its business as a single operating segment.
The Corporation and the Bank are subject to regulations of certain state and federal agencies. These regulatory agencies periodically examine the Corporation and the Bank for adherence to laws and regulations.
Basis of Financial Statement Presentation
The consolidated financial statements include the accounts of QNB Corp. (the “Corporation”) and its wholly owned subsidiary, The Quakertown National Bank (the “Bank”). The consolidated entity is referred to herein as “QNB”. These statements conform to generally accepted accounting principles and predominant practices within the banking industry. All significant intercompany accounts and transactions have been eliminated in the consolidated financial statements. Tabular information other than share data is presented in thousands of dollars. Certain previously reported amounts have been reclassified to conform to current presentation standards. These reclassifications had no effect on net income.
Use of Estimates
In preparing the consolidated financial statements, management is required to make estimates and assumptions that affect the reported amounts of assets and liabilities at the date of the financial statements and the reported amounts of revenues and expenses during the reporting period. Actual results could differ from such estimates.
Investment Securities
Investment securities that QNB has the positive intent and ability to hold to maturity are classified as held-to-maturity securities and reported at amortized cost. Debt and equity securities that are bought and held principally for the purpose of selling in the near term are classified as trading securities and reported at fair value, with unrealized gains and losses included in earnings. Debt and equity securities not classified as either held-to-maturity securities or trading securities are classified as available-for-sale securities and reported at fair value, with unrealized gains and losses, net of tax, excluded from earnings and reported as a separate component of shareholders’ equity. Management determines the appropriate classification of securities at the time of purchase.
Available-for-sale securities include securities that management intends to use as part of its asset/liability management strategy and that may be sold in response to changes in market interest rates and related changes in the securities’ prepayment risk or to meet liquidity needs.
Premiums and discounts on debt securities are recognized in interest income using a constant yield method. Gains and losses on sales of investment securities are computed on the specific identification method and included in non-interest income.
Loans
Loans are stated at the principal amount outstanding, net of deferred loan fees and costs. Interest income is accrued on the principal amount outstanding. Loan origination and commitment fees and related direct costs are deferred and amortized to income over the term of the respective loan and loan commitment period as a yield adjustment.
Loans held-for-sale primarily consist of residential mortgage loans and student loans and are carried at the lower of aggregate cost or market value. Gains and losses on residential mortgages held-for-sale are included in non-interest income.
Non-Performing Assets
Non-performing assets are comprised of non-accrual loans and other real estate owned. Non-accrual loans are those on which the accrual of interest has ceased. Commercial loans are placed on non-accrual status immediately if, in the opinion of management, collection is doubtful, or when principal or interest is past due 90 days or more and collateral is insufficient to cover principal and interest. Interest accrued, but not collected at the date a loan is placed on non-accrual status, is reversed and charged against interest income. Subsequent cash receipts are applied either to the outstanding principal or recorded as interest income, depending on management’s assessment of ultimate collectibility of principal and interest. Loans are returned to an accrual status when the borrower’s ability to make periodic principal and interest payments has returned to normal (i.e. brought current with respect to principal or interest or restructured) and the paying capacity of the borrower and/or the underlying collateral is deemed sufficient to cover principal and interest. Consumer loans are not automatically placed on non-accrual status when principal or interest payments are 90 days past due, but in most instances, are charged-off when deemed uncollectible or after reaching 120 days past due.
Other real estate owned is comprised of properties acquired through foreclosure proceedings or acceptance of a deed in lieu of foreclosure. Other real estate owned is recorded at the lower of the carrying value of the loan or the fair value of the property less disposal costs. Loan losses arising from the acquisition of such properties are charged against the allowance for loan losses. Holding expenses related to the operation and maintenance of properties are expensed as incurred. Gains and losses upon disposition are reflected in earnings as realized.
37
QNB Corp. and Subsidiary 2001 Annual Report
NOTES TO CONSOLIDATED FINANCIAL STATEMENTS
Allowance for Loan Losses
The allowance for loan losses represents management’s best estimate of the know and inherent losses in the existing loan portfolio. Management’s judgement is based on the evaluation of individual loans, past experience, the assessment of current economic conditions, and other relevant factors. Loan losses are charged directly against the allowance for loan losses and recoveries on previously charged-off loans are added to the allowance.
Significant estimates are made by management in determining the allowance for loan losses. Consideration is given to a variety of factors in establishing these estimates including current economic conditions, diversification of the loan portfolio, delinquency statistics, results of loan reviews, borrowers’ perceived financial and managerial strengths, the adequacy of underlying collateral if collateral dependent, or the present value of future cash flows. Since the allowance for loan losses is dependent, to a great extent, on conditions that may be beyond QNB’s control, it is at least reasonably possible that management’s estimates of the allowance for loan losses and actual results could differ in the near term.
In addition, regulatory authorities, as an integral part of their examinations, periodically review the allowance for loan losses. They may require additions to the allowance based upon their judgements about information available to them at the time of examination.
Accounting for impairment in the performance of a loan is required when it is probable that all amounts, including both principal and interest, will not be collected in accordance with the loan agreement. Impaired loans are measured based on the present value of expected future cash flows discounted at the loan’s effective interest rate or, as a practical expedient, at the loan’s observable market price or the fair value of the collateral if the loans are collateral dependent. Impairment criteria are applied to the loan portfolio exclusive of smaller homogeneous loans such as residential mortgage and consumer loans which are evaluated collectively for impairment.
Transfers and Servicing of Financial Assets
QNB continues to carry servicing assets, relating to mortgage loans it has sold. Such servicing assets are recorded based on the relative fair values of the servicing assets and loans sold at the date of transfer. The servicing asset is amortized in proportion to and over the period of net servicing income. Servicing assets are assessed for impairment based on their disaggregated fair value.
Premises and Equipment
Premises and equipment are stated at cost, less accumulated depreciation and amortization. Depreciation and amortization are calculated principally on an accelerated or straight-line basis over the estimated useful lives of the assets as follows: buildings—10 to 40 years, and equipment—3 to 10 years. Expenditures for maintenance and repairs are charged to operations as incurred. Gains or losses upon disposition are reflected in earnings as realized.
Income Taxes
QNB Corp. and its subsidiary file a consolidated Federal income tax return and the amount of income tax expense or benefit is computed and allocated on a separate return basis. To provide for income taxes, QNB uses the asset and liability method under which deferred tax assets and liabilities are recognized for the future tax consequences attributable to the difference between the financial statement carrying amounts of existing assets and liabilities and their respective tax bases. Deferred tax assets and liabilities are measured using enacted tax rates expected to apply to taxable income in the years in which those temporary differences are expected to be recovered or settled. The effect of a change in tax rates on deferred tax assets and liabilities is recognized in income in the period which includes the enactment date.
Net Income Per Share
Basic earnings per share excludes any dilutive effects of options and is computed by dividing net income by the weighted average number of shares outstanding during the period. Diluted earnings per share gives effect to all dilutive potential common shares that were outstanding during the period. For the purpose of earnings per share, share and per share data, for all periods presented, have been restated to reflect the 5% stock dividends issued June 29, 2001 and June 30, 2000.
Comprehensive Income
Comprehensive income is defined as the change in equity of a business entity during a period from transactions and other events and circumstances, excluding those resulting from investments by and distributions to owners. For QNB, the primary component of other comprehensive income is the unrealized holding gains or losses on available-for-sale investment securities. Comprehensive income must be shown either in a separate statement or as part of a combined statement of income and comprehensive income in a full set of general-purpose financial statements.
38
QNB Corp. and Subsidiary 2001 Annual Report
NOTES TO CONSOLIDATED FINANCIAL STATEMENTS
Recent Accounting Pronouncements
Derivative Instruments and Hedging Activities
In June 1998, the Financial Accounting Standards Board (FASB) issued Statement No. 133, “Accounting for Derivative Instruments and Hedging Activities” (SFAS No. 133). This Statement, as amended, standardizes the accounting for derivative instruments, including certain derivative instruments imbedded in other contracts, and those used for hedging activities, by requiring that an entity recognize those items as assets or liabilities in the statement of financial position and measure them at fair value. The Statement categorizes derivatives used for hedging purposes as either fair value hedges, cash flow hedges, foreign currency fair value hedges, foreign currency cash flow hedges, or hedges of net investments in foreign operations. The Statement generally provides for matching of gain or loss recognition on the hedging instrument with the recognition of the changes in the fair value of the hedged asset or liability that are attributable to the hedged risk, so long as the hedge is effective. QNB adopted SFAS No. 133 on January 1, 2001. QNB typically has not used derivative instruments and currently holds no derivative positions. Therefore, there was no impact upon the adoption of SFAS No. 133 on earnings, financial condition or equity.
Transfers and Servicing of Financial Assets
In September 2000, FASB issued SFAS No. 140, “Accounting for Transfers and Servicing of Financial Assets and Extinguishments of Liabilities.” This statement supercedes and replaces the guidance in Statement No.125. It revises the standards for accounting for securitizations and other transfers of financial assets and collateral and requires certain disclosures, although it carries over most of Statement No.125’s provisions without reconsideration.
The Statement is effective for transfers and servicing of financial assets and extinguishments of liabilities occurring after March 31, 2001, and for recognition and reclassification of collateral and for disclosures relating to securitization transactions and collateral for fiscal years ending after December 15, 2000. This Statement is to be applied prospectively with certain exceptions. Other than those exceptions, earlier or retroactive application of its accounting provisions is not permitted. The adoption of this Statement did not have a material impact on the Corporation’s consolidated financial statements.
Business Combinations
In June 2001, the FASB issued Statement No. 141, “Business Combinations.” The Statement addresses financial accounting and reporting for business combinations and supersedes Accounting Principles Board (APB) Opinion No. 16, Business Combinations, and FASB Statement No. 38, “Accounting for Preacquisition Contingencies of Purchased Enterprises.” All business combinations in the scope of the Statement are to be accounted for using the purchase method.
The provisions of the Statement apply to all business combinations initiated after June 30, 2001. The Statement also applies to all business combinations accounted for using the purchase method for which the date of acquisition is July 1, 2001, or later. There was no impact on earnings, financial condition, or equity upon adoption of Statement No. 141.
Goodwill and Other Intangible Assets
In June 2001, the FASB issued Statement No. 142, “Goodwill and Other Intangible Assets.” The Statement addresses financial accounting and reporting for acquired goodwill and other intangible assets and supersedes APB Opinion No. 17, Intangible Assets. It addresses how intangible assets that are acquired individually or with a group of other assets (but not those acquired in a business combination) should be accounted for in financial statements upon their acquisition. The Statement also addresses how goodwill and other intangible assets should be accounted for after they have been initially recognized in the financial statements.
The provisions of the Statement are required to be applied starting with fiscal years beginning after December 15, 2001, except that goodwill and intangible assets acquired after June 30, 2001, will be subject immediately to the non-amortization and amortization provisions of the Statement. Early application is permitted for entities with fiscal years beginning after March 15, 2001, provided that the first interim financial statements have not previously been issued. The Statement is required to be applied at the beginning of an entity’s fiscal year and to be applied to all goodwill and other intangible assets recognized in its financial statements at that date. There is no expected impact on earnings, financial condition, or equity upon adoption of Statement No. 142.
Asset Retirement Obligations
In June 2001, the FASB issued Statement No. 143, “Accounting for Asset Retirement Obligations.” This Statement addresses financial accounting and reporting for obligations associated with the retirement of tangible long-lived assets and the associated asset retirement costs. It applies to legal obligations associated with the retirement of long-lived assets that result from the acquisition, construction, development and (or) the normal operation of a long-lived asset, except for certain obligations of lessees. As used in this Statement, a legal obligation is an obligation that a party is required to settle as a result of an existing or enacted law, statute, ordinance, or written or oral contract or by legal construction of a contract under the doctrine of promissory estoppel. This Statement requires that the fair value of a liability for an asset retirement obligation be recognized in the period in which it is incurred if a reasonable estimate of fair value can be made. The associated asset retirement costs are capitalized as part of the carrying amount of the long-lived asset.
39
QNB Corp. and Subsidiary 2001 Annual Report
NOTES TO CONSOLIDATED FINANCIAL STATEMENTS
This Statement amends FASB Statement No. 19, “Financial Accounting and Reporting by Oil and Gas Producing Companies,” and it applies to all entities. It is effective for financial statements issued for fiscal years beginning after June 15, 2002. Earlier application is encouraged. There is no expected impact on earnings, financial condition, or equity upon adoption of Statement No. 143.
Impairment or Disposal of Long-Lived Assets
In August 2001, the FASB issued Statement No. 144, “Accounting for the Impairment or Disposal of Long-Lived Assets.” This Statement addresses financial accounting and reporting for the impairment or disposal of long-lived assets and supersedes SFAS No. 121, Accounting for the Impairment of Long-Lived Assets and for Long-Lived Assets to Be Disposed Of. However, the Statement retains the fundamental provisions of Statement No. 121 for (a) recognition and measurement of the impairment of long-lived assets to be held and used and (b) measurement of long-lived assets to be disposed of by sale.
This Statement supersedes the accounting and reporting provisions of APB Opinion No. 30, Reporting the Results of Operations-Reporting the Effects of Disposal of a Segment of a Business, and Extraordinary, Unusual and Infrequently Occurring Events and Transactions, for the disposal of a segment of a business. However, this Statement retains the requirement of Opinion No. 30 to report discontinued operations separately from continuing operations and extends that reporting to a component of an entity that either has been disposed of (by sale, by abandonment, or in distribution to owners) or is classified as held for sale. This Statement also amends Accounting Research Bulletin (ARB) No. 51, Consolidated Financial Statements, to eliminate the exception to consolidation for a temporarily controlled subsidiary.
The provisions of this Statement are effective for financial statements issued for fiscal years beginning after December 15, 2001, and interim periods within those fiscal years, with earlier application encouraged. The provisions of this Statement generally are to be applied prospectively. There is no expected impact on earnings, financial condition, or equity upon adoption of Statement No. 144.
Statement of Cash Flows
Cash and cash equivalents for purposes of this statement consist of cash and due from banks.
Note 2 — Earnings Per Share
The following table sets forth the computation of basic and diluted earnings per share (share and per share data have been restated to reflect the 5% stock dividends issued June 29, 2001 and June 30, 2000 and are not in thousands):
| | | | | | | | | | | | | | | |
| | | | | 2001 | | 2000 | | 1999 |
| | | | |
| |
| |
|
| Numerator for basic and diluted earnings per share — net income | | $ | 4,436 | | | $ | 4,106 | | | $ | 3,801 | |
| | | | |
| | | |
| | | |
| |
|
|
|
|
| Denominator for basic earnings per share — weighted average shares outstanding | | | 1,544,010 | | | | 1,573,321 | | | | 1,583,022 | |
|
|
|
|
| Effect of dilutive securities - employee stock options | | | 3,358 | | | | 298 | | | | 5,765 | |
| | | | |
| | | |
| | | |
| |
|
|
|
|
| Denominator for diluted earnings per share — adjusted weighted average shares outstanding | | | 1,547,368 | | | | 1,573,619 | | | | 1,588,787 | |
| | | | |
| | | |
| | | |
| |
| Earnings per share — basic | | $ | 2.87 | | | $ | 2.61 | | | $ | 2.40 | |
|
|
|
|
| Earnings per share — diluted | | | 2.87 | | | | 2.61 | | | | 2.39 | |
| | | | |
| | | |
| | | |
| |
There were 27,445 and 42,459 stock options that were anti-dilutive as of December 31, 2001 and 2000, respectively.
Note 3 — Cash And Due From Banks
Included in cash and due from banks are reserves in the form of deposits with the Federal Reserve Bank of $2,736,000 and $2,074,000 to satisfy federal regulatory requirements as of December 31, 2001 and 2000.
Note 4 — Stock Repurchase Plan
In March of 2000, the Board of Directors of QNB Corp. authorized the repurchase of up to 4.99 percent or 79,180 shares of QNB Corp.’s outstanding common stock. Such repurchases may be made in open market or privately negotiated transactions. The repurchased shares will be held in treasury and will be available for general corporate purposes. As of December 31, 2001, QNB Corp. repurchased 53,343 shares at an average cost of $28.01 per share.
40
QNB Corp. and Subsidiary 2001 Annual Report
NOTES TO CONSOLIDATED FINANCIAL STATEMENTS
Note 5 — Investment Securities
Available-For-Sale
The amortized cost and estimated fair values of investment securities available-for-sale at December 31, 2001 and 2000 were as follows:
| | | | | | | | | | | | | | | | | | | | | | | | | | | | | | | | | | |
| December 31, | | 2001 | | 2000 |
| |
| |
|
| | | | | | | | Gross | | Gross | | | | | | | | | | Gross | | Gross | | | | |
| | | | Aggregate | | unrealized | | unrealized | | | | | | Aggregate | | unrealized | | unrealized | | | | |
| | | | fair | | holding | | holding | | Amortized | | fair | | holding | | holding | | Amortized |
| | | | value | | gains | | losses | | cost | | value | | gains | | losses | | cost |
| | | |
| |
| |
| |
| |
| |
| |
| |
|
| U.S. Treasury | | $ | 6,693 | | | $ | 149 | | | | — | | | $ | 6,544 | | | $ | 6,561 | | | $ | 66 | | | $ | 4 | | | $ | 6,499 | |
|
|
|
|
| U.S. Government agencies | | | 29,367 | | | | 426 | | | $ | 16 | | | | 28,957 | | | | 42,469 | | | | 131 | | | | 141 | | | | 42,479 | |
|
|
|
|
| State and municipal securities | | | 17,751 | | | | 127 | | | | 133 | | | | 17,757 | | | | 10,171 | | | | 140 | | | | 92 | | | | 10,123 | |
|
|
|
|
| Mortgage-backed securities | | | 49,055 | | | | 263 | | | | 194 | | | | 48,986 | | | | 25,312 | | | | 90 | | | | 255 | | | | 25,477 | |
|
|
|
|
| Collateralized mortgage obligations (CMOs) | | | 32,316 | | | | 670 | | | | 119 | | | | 31,765 | | | | 17,929 | | | | 130 | | | | 150 | | | | 17,949 | |
|
|
|
|
| Other debt securities | | | 20,486 | | | | 497 | | | | 55 | | | | 20,044 | | | | 1,024 | | | | 26 | | | | — | | | | 998 | |
|
|
|
|
| Equity securities | | | 12,434 | | | | 131 | | | | 80 | | | | 12,383 | | | | 10,779 | | | | 12 | | | | 51 | | | | 10,818 | |
| | | |
| | | |
| | | |
| | | |
| | | |
| | | |
| | | |
| | | |
| |
| Total investment securities available-for-sale | | $ | 168,102 | | | $ | 2,263 | | | $ | 597 | | | $ | 166,436 | | | $ | 114,245 | | | $ | 595 | | | $ | 693 | | | $ | 114,343 | |
| | | |
| | | |
| | | |
| | | |
| | | |
| | | |
| | | |
| | | |
| |
The amortized cost and estimated fair value of securities available-for-sale by contractual maturity at December 31, 2001 are shown in the following table. Expected maturities will differ from contractual maturities because borrowers may have the right to call or prepay obligations with or without call or prepayment penalties. Mortgage-backed securities and CMOs are shown separately due to the amortization and prepayment of principal occurring throughout the life of these instruments.
| | | | | | | | | |
| | | Aggregate | | | | |
| | | fair | | Amortized |
| December 31, 2001 | | value | | cost |
| |
| |
|
| Due in one year or less | | $ | 3,594 | | | $ | 3,496 | |
|
|
|
|
| Due after one year through five years | | | 15,268 | | | | 15,047 | |
|
|
|
|
| Due after five years through ten years | | | 35,112 | | | | 34,423 | |
|
|
|
|
| Due after ten years | | | 20,323 | | | | 20,336 | |
|
|
|
|
| Mortgage-backed securities and CMOs | | | 81,371 | | | | 80,751 | |
|
|
|
|
| Equity securities | | | 12,434 | | | | 12,383 | |
| | | |
| | | |
| |
| Total securities available-for-sale | | $ | 168,102 | | | $ | 166,436 | |
| | | |
| | | |
| |
Proceeds from sales of investment securities available-for-sale are as follows:
| | | | | | | | | | | | | |
| | | 2001 | | 2000 | | 1999 |
| | |
| |
| |
|
| Proceeds | | $ | 17,484 | | | $ | 12,878 | | | $ | 17,976 | |
|
|
|
|
| Gross gains | | | 979 | | | | 406 | | | | 192 | |
|
|
|
|
| Gross losses | | | 687 | | | | 96 | | | | 331 | |
Held-To-Maturity
The amortized cost and estimated fair values of investment securities held-to-maturity at December 31, 2001 and 2000 were as follows:
| | | | | | | | | | | | | | | | | | | | | | | | | | | | | | | | | |
| December 31, | | 2001 | | 2000 |
| |
| |
|
| | | | | | | Gross | | Gross | | | | | | | | | | Gross | | Gross | | | | |
| | | | | | | unrealized | | unrealized | | Aggregate | | | | | | unrealized | | unrealized | | Aggregate |
| | | Amortized | | holding | | holding | | fair | | Amortized | | holding | | holding | | fair |
| | | cost | | gains | | losses | | value | | cost | | gains | | losses | | value |
| | |
| |
| |
| |
| |
| |
| |
| |
|
| State and municipal securities | | $ | 18,629 | | | $ | 178 | | | $ | 71 | | | $ | 18,736 | | | $ | 19,974 | | | $ | 118 | | | $ | 42 | | | $ | 20,050 | |
|
|
|
|
| Collateralized mortgage obligations (CMOs) | | | 24,169 | | | | 271 | | | | 128 | | | | 24,312 | | | | 23,008 | | | | 26 | | | | 269 | | | | 22,765 | |
| | | |
| | | |
| | | |
| | | |
| | | |
| | | |
| | | |
| | | |
| |
| Total investment securities held-to-maturity | | $ | 42,798 | | | $ | 449 | | | $ | 199 | | | $ | 43,048 | | | $ | 42,982 | | | $ | 144 | | | $ | 311 | | | $ | 42,815 | |
| | | |
| | | |
| | | |
| | | |
| | | |
| | | |
| | | |
| | | |
| |
41
QNB Corp. and Subsidiary 2001 Annual Report
NOTES TO CONSOLIDATED FINANCIAL STATEMENTS
The amortized cost and estimated fair values of securities held-to-maturity by contractual maturity at December 31, 2001, are shown in the following table. Expected maturities will differ from contractual maturities because borrowers may have the right to call or prepay obligations with or without penalties. CMOs are shown separately due to the amortization and prepayment of principal occurring throughout the life of these instruments.
| | | | | | | | | |
| | | | | | | Aggregate |
| | | Amortized | | fair |
| December 31, 2001 | | cost | | value |
| |
| |
|
| Due in one year or less | | $ | 406 | | | $ | 415 | |
|
|
|
|
| Due after one year through five years | | | 3,838 | | | | 3,937 | |
|
|
|
|
| Due after five years through ten years | | | 10,924 | | | | 10,990 | |
|
|
|
|
| Due after ten years | | | 3,461 | | | | 3,394 | |
|
|
|
|
| Collateralized mortgage obligations (CMOs) | | | 24,169 | | | | 24,312 | |
| | | |
| | | |
| |
| Total securities held-to-maturity | | $ | 42,798 | | | $ | 43,048 | |
| | | |
| | | |
| |
There were no sales of investment securities classified as held-to-maturity during 2001, 2000 or 1999. At December 31, 2001 and 2000, investment securities totaling $47,997,000 and $43,019,000 were pledged as collateral for repurchase agreements and deposits of public funds as required by law.
Note 6 — Loans
| | | | | | | | | |
| December 31, | | 2001 | | 2000 |
| |
| |
|
| Commercial and industrial | | $ | 39,694 | | | $ | 39,100 | |
|
|
|
|
| Agricultural | | | 2,622 | | | | 3,027 | |
|
|
|
|
| Construction | | | 3,989 | | | | 380 | |
|
|
|
|
| Real estate-commercial | | | 71,112 | | | | 65,271 | |
|
|
|
|
| Real estate-residential | | | 78,419 | | | | 70,943 | |
|
|
|
|
| Consumer | | | 6,645 | | | | 6,708 | |
| | | |
| | | |
| |
| Total loans | | | 202,481 | | | | 185,429 | |
|
|
|
|
| Less unearned income | | | 270 | | | | 195 | |
| | | |
| | | |
| |
| Total loans, net of unearned income | | $ | 202,211 | | | $ | 185,234 | |
| | | |
| | | |
| |
Real estate commercial loans include all loans collateralized at least in part by commercial real estate. These loans may not be for the expressed purpose of conducting commercial real estate transactions.
Included in real estate residential loans at December 31, 2001 are $1,146,000 and $198,000 of residential mortgage loans held-for-sale. Included in consumer loans at December 31, 2001 and 2000 were $976,000 and $1,444,000 of student loans held-for-sale.
At December 31, 2001 and 2000, the recorded investment in loans for which impairment has been recognized totaled $233,000 and $145,000 of which $233,000 and $103,000 required no valuation allowance. As of December 31, 2001 and 2000, $0 and $42,000 of loans required a valuation allowance on the entire amount. Most of the loans identified as impaired are collateral-dependent. For the years ended December 31, 2001, 2000 and 1999, the average recorded investment in impaired loans was approximately $207,000, $397,000 and $323,000, respectively. QNB recognized $100,000, $67,000 and $67,000 of interest income on these loans in 2001, 2000 and 1999, respectively.
Included within the loan portfolio are loans on non-accrual status of $280,000 and $205,000 at December 31, 2001 and 2000, respectively. If interest on non-accrual loans had been accrued throughout the period, interest income for the years ended December 31, 2001, 2000 and 1999, would have increased approximately $21,000, $40,000 and $55,000, respectively. The amount of interest income on these loans that was included in net income in 2001, 2000 and 1999 was $19,000, $0 and $21,000, respectively.
QNB generally lends in its trade area which is comprised of Quakertown and surrounding communities. To a large extent QNB makes loans collateralized at least in part by real estate. Its lending activities could be affected by changes in the general economy, the regional economy, or real estate values. QNB’s commercial loans are not considered to be concentrated, except those loans to real estate developers and investors which account for $26,167,000 or 12.9 percent of the loan portfolio at December 31, 2001. This is a slight increase from 12.8 percent at December 31, 2000. Concentration is based upon Standard Industrial Classification codes used for bank regulatory purposes and is considered to be 10 percent or more of total loans.
Note 7 — Allowance For Loan Losses
Activity in the allowance for loan losses is shown below:
| | | | | | | | | | | | | |
| December 31, | | 2001 | | 2000 | | 1999 |
| |
| |
| |
|
| Balance at beginning of year | | $ | 2,950 | | | $ | 3,196 | | | $ | 2,951 | |
| | | |
| | | |
| | | |
| |
| Charge-offs | | | (149 | ) | | �� | (264 | ) | | | (22 | ) |
|
|
|
|
| Recoveries | | | 44 | | | | 18 | | | | 27 | |
| | | |
| | | |
| | | |
| |
| Net (charge-offs) recoveries | | | (105 | ) | | | (246 | ) | | | 5 | |
|
|
|
|
| Provision for loan losses | | | — | | | | — | | | | 240 | |
| | | |
| | | |
| | | |
| |
| Balance at end of year | | $ | 2,845 | | | $ | 2,950 | | | $ | 3,196 | |
| | | |
| | | |
| | | |
| |
Note 8 — Premises And Equipment
Premises and equipment, stated at cost less accumulated depreciation and amortization, are summarized below:
| | | | | | | | | | |
| December 31, | | 2001 | | 2000 |
| |
| |
|
| Land and buildings | | $ | 4,835 | | | $ | 4,835 | |
|
|
|
|
| Furniture and equipment | | | 6,283 | | | | 6,799 | |
|
|
|
|
| Leasehold improvements | | | 1,593 | | | | 1,709 | |
| | | |
| | | |
| |
| Book value | | | 12,711 | | | | 13,343 | |
|
|
|
|
| Accumulated depreciation | | | | | | | | |
| | and amortization | | | (7,097 | ) | | | (7,170 | ) |
| | | |
| | | |
| |
| Net book value | | $ | 5,614 | | | $ | 6,173 | |
| | | |
| | | |
| |
42
QNB Corp. and Subsidiary 2001 Annual Report
NOTES TO CONSOLIDATED FINANCIAL STATEMENTS
Depreciation and amortization expense on premises and equipment amounted to $788,000, $735,000 and $655,000, for the years ended December 31, 2001, 2000 and 1999, respectively.
Rental expense on operating leases amounted to approximately $250,000, $172,000 and $139,000 for the years ended December 31, 2001, 2000 and 1999, respectively. Most leases have options for renewal. Future minimum annual rental payments due on non-cancelable leases for each of the years 2002 through 2006 are approximately $233,000, $220,000, $218,000, $224,000 and $222,000, respectively.
Note 9 — Mortgage Servicing Rights
The changes in mortgage servicing assets are as follows:
| | | | | | | | | | | | | | |
| December 31, | | 2001 | | 2000 | | 1999 |
| |
| |
| |
|
| Balance, beginning of year | | $ | 191 | | | $ | 221 | | | $ | 159 | |
|
|
|
|
| Additions | | | 159 | | | | 20 | | | | 112 | |
|
|
|
|
| Less: amortization | | | (62 | ) | | | (50 | ) | | | (50 | ) |
|
|
|
|
| | valuation allowance | | | (48 | ) | | | — | | | | — | |
| | | |
| | | |
| | | |
| |
| Balance, end of year | | $ | 240 | | | $ | 191 | | | $ | 221 | |
| | | |
| | | |
| | | |
| |
Note 10 — Time Deposits
The aggregate amount of time deposits including deposits in denominations of $100,000 or more was $176,811,000 and $135,281,000 at December 31, 2001 and 2000, respectively. The scheduled maturities of time deposits as of December 31, 2001 for the years 2002 through 2006 and thereafter are approximately $142,176,000, $24,504,000, $4,174,000, $2,711,000, $3,237,000 and $9,000, respectively.
Note 11 — Short-Term Borrowings
| | | | | | | | | |
| | | Securities Sold under | | Other |
| | | Agreements | | Short-term |
| December 31, | | to Repurchase(a) | | Borrowings (b) |
| |
| |
|
| 2001 | | | | | | | | |
|
|
|
|
| Balance | | $ | 13,017 | | | $ | 434 | |
|
|
|
|
| Maximum indebtedness at any month end | | | 24,489 | | | | 600 | |
|
|
|
|
| Daily average indebtedness outstanding | | | 15,532 | | | | 663 | |
|
|
|
|
| Average rate paid for the year | | | 3.28 | % | | | 4.53 | % |
|
|
|
|
| Average rate on period-end borrowings | | | 2.07 | | | | 1.40 | |
| | | |
| | | |
| |
| 2000 | | | | | | | | |
|
|
|
|
| Balance | | $ | 17,219 | | | $ | 600 | |
|
|
|
|
| Maximum indebtedness at any month end | | | 17,219 | | | | 5,600 | |
|
|
|
|
| Daily average indebtedness outstanding | | | 10,977 | | | | 1,268 | |
|
|
|
|
| Average rate paid for the year | | | 3.94 | % | | | 6.54 | % |
|
|
|
|
| Average rate on period-end borrowings | | | 4.31 | | | | 5.72 | |
| | | |
| | | |
| |
| (a) | | Securities sold under agreements to repurchase mature within 30 days. The repurchase agreements were collateralized by U.S. Government agency securities and mortgage-backed securities with an amortized cost of $16,198,000 and $18,489,000 and a fair value of $16,437,000 and $18,502,000 at December 31, 2001 and 2000, respectively. These securities are safekept at the Federal Reserve Bank. |
|
|
|
|
| (b) | | Other short-term borrowings include Federal funds purchased and Treasury tax and loan notes. |
Note 12 — FHLB Advances
Under terms of its agreement with the FHLB, QNB maintains otherwise unencumbered qualifying assets (principally 1-4 family residential mortgage loans and U.S. Government and Agency notes, bonds, and mortgage-backed securities) in the amount of at least as much as its advances from the FHLB. QNB’s FHLB stock of $2,650,000 and $3,062,000 at December 31, 2001 and 2000 is also pledged to secure these advances.
At December 31, 2001 and 2000 there were $53,000,000 and $25,000,000 in outstanding advances with a weighted average rate of 5.35% and 5.40%, respectively. Advances are made pursuant to several different credit programs offered by the FHLB. At December 31, 2001, $35,000,000 of these advances are convertible, whereby the FHLB has the option at a predetermined time to convert the fixed interest rate to an adjustable rate tied to LIBOR. QNB then has the option to prepay these advances if the FHLB converts the interest rate.
Outstanding borrowings as of December 31, 2001 mature as follows:
| | | | | |
| 2002 | | $ | 3,000 | |
|
|
|
|
| 2003 | | | — | |
|
|
|
|
| 2004 | | | — | |
|
|
|
|
| 2005 | | | — | |
|
|
|
|
| 2006 | | | — | |
|
|
|
|
| Thereafter | | | 50,000 | |
| | | |
| |
| Total FHLB advances | | $ | 53,000 | |
| | | |
| |
43
QNB Corp. and Subsidiary 2001 Annual Report
NOTES TO CONSOLIDATED FINANCIAL STATEMENTS
Note 13 — Income Taxes
The components of the provision for income taxes are as follows:
| | | | | | | | | | | | | | |
| Year Ended December 31, | | 2001 | | 2000 | | 1999 |
| |
| |
| |
|
| Current: | | | | | | | | | | | | |
|
|
|
|
| | Federal income taxes | | $ | 1,064 | | | $ | 990 | | | $ | 1,190 | |
|
|
|
|
| | State income taxes | | | 8 | | | | 5 | | | | — | |
|
|
|
|
| Deferred Federal income taxes | | | 6 | | | | 149 | | | | (16 | ) |
| | | | |
| | | |
| | | |
| |
| Net provision | | $ | 1,078 | | | $ | 1,144 | | | $ | 1,174 | |
| | | | |
| | | |
| | | |
| |
At December 31, 2001 , 2000 and 1999, the tax effects of temporary differences that represent the significant portion of deferred tax assets and liabilities are as follows:
| | | | | | | | | | | | | | | | |
| Year Ended December 31, | | 2001 | | 2000 | | 1999 |
| |
| |
| |
|
Deferred tax assets | | | | | | | | | | | | |
|
|
|
|
| | Allowance for loan losses | | $ | 726 | | | $ | 761 | | | $ | 843 | |
|
|
|
|
| | Net unrealized holding losses on | | | | | | | | | | | | |
| | | investment securities available-for-sale | | | — | | | | 33 | | | | 1,342 | |
|
|
|
|
| | Impaired equity securities | | | 116 | | | | — | | | | — | |
|
|
|
|
| | Other real estate owned reserves | | | — | | | | — | | | | 41 | |
|
|
|
|
| | Deferred compensation | | | 191 | | | | 179 | | | | 174 | |
|
|
|
|
| | Deposit premium | | | 24 | | | | 18 | | | | 13 | |
|
|
|
|
| | Deferred loan fees | | | — | | | | 9 | | | | 14 | |
|
|
|
|
| | Other | | | 12 | | | | 13 | | | | 33 | |
| | | | |
| | | |
| | | |
| |
| | | Total deferred tax assets | | | 1,069 | | | | 1,013 | | | | 2,460 | |
|
|
|
|
Deferred tax liabilities | | | | | | | | | | | | |
|
|
|
|
| | Depreciation | | | 93 | | | | 10 | | | | — | |
|
|
|
|
| | Mortgage servicing rights | | | 82 | | | | 65 | | | | 75 | |
|
|
|
|
| | Net unrealized holding gains on investment securities available-for-sale | | | 567 | | | | — | | | | — | |
|
|
|
|
| | Other | | | 55 | | | | 61 | | | | 50 | |
| | | | |
| | | |
| | | |
| |
| | | Total deferred tax liabilities | | | 797 | | | | 136 | | | | 125 | |
| | | | |
| | | |
| | | |
| |
| | Net deferred tax asset | | $ | 272 | | | $ | 877 | | | $ | 2,335 | |
| | | | |
| | | |
| | | |
| |
The realizability of deferred tax assets is dependent upon a variety of factors, including the generation of future taxable income, the existence of taxes paid and recoverable, the reversal of deferred tax liabilities and tax planning strategies. Based upon these and other factors, management believes it is more likely than not that QNB will realize the benefits of these deferred tax assets. The net deferred tax asset is included in other assets on the consolidated balance sheet.
A reconciliation between the statutory and effective tax rate for net income was as follows:
| | | | | | | | | | | | | |
| Year Ended December 31, | | 2001 | | 2000 | | 1999 |
| |
| |
| |
|
| Provision at statutory rate | | $ | 1,875 | | | $ | 1,785 | | | $ | 1,692 | |
|
|
|
|
| Tax-exempt interest income | | | (724 | ) | | | (580 | ) | | | (459 | ) |
|
|
|
|
| Cash surrender value insurance | | | (70 | ) | | | (59 | ) | | | (55 | ) |
|
|
|
|
| Other | | | (3 | ) | | | (2 | ) | | | (4 | ) |
| | | |
| | | |
| | | |
| |
| Total provision | | $ | 1,078 | | | $ | 1,144 | | | $ | 1,174 | |
| | | |
| | | |
| | | |
| |
Note 14 — Employee Benefit Plans
QNB maintains a money purchase defined contribution plan which covers all employees who meet the age and service requirements. QNB makes contributions to the money purchase plan equivalent to 5 percent of total compensation (as defined by the plan). QNB contributed and expensed $215,639, $205,377 and $187,046 to this plan in 2001, 2000 and 1999, respectively. QNB also has a 401(k) profit sharing plan pursuant to the provisions of 401(k) of the Internal Revenue Code. The plan covers substantially all employees who meet the age and service requirements. The 401(k) plan provides for elective employee contributions up to 9 percent of compensation and a matching company contribution limited to 3 percent. QNB makes contributions to the profit sharing plan as directed by its Board of Directors. For 2001, 2000 and 1999, QNB contributed and expensed $113,798, $112,775 and $109,305, respectively, to the 401(k) profit sharing plan.
QNB’s Employee Stock Purchase Plan (the “1996 Plan”) offers eligible employees an opportunity to purchase from the Corporation shares of QNB Corp. Common Stock at a 5 percent discount from the lesser of fair market value on the first or last day of each offering period (as defined by the plan). The Plan authorizes the issuance of 26,250 shares. As of December 31, 2001, 6,511 shares were issued under the plan. Prior to 2000, the Plan was considered compensatory as defined by SFAS No. 123, “Accounting for Stock-Based Compensation,” and as such, a charge to earnings of approximately $2,000 was recorded for the difference between the purchase price and the fair value on the date of issue in 1999. No charge to earnings was recorded in 2001 and 2000. The 1996 Plan expired on June 1, 2001. In its place shareholders approved the 2001 Employee Stock Purchase Plan (the “2001 Plan”). This plan has essentially the same terms as the 1996 Plan, however it provides for a 10 percent discount. The 2001 Plan authorizes the issuance of 21,000 shares. As of December 31, 2001, 857 shares were issued under the plan. This plan is not considered compensatory.
Shares issued pursuant to the Plan, were as follows:
| | | | | | | | | |
| Year Ended Dec. 31, | | Shares | | Price per Share |
| |
| |
|
| 2001 | | | 1,583 | | $26.10 and $26.60 | |
|
|
|
|
| 2000 | | | 1,719 | | 26.17 and 26.60 | |
|
|
|
|
| 1999 | | | 1,567 | | 26.17 and 32.04 | |
| | | |
| | | |
| | | |
44
QNB Corp. and Subsidiary 2001 Annual Report
NOTES TO CONSOLIDATED FINANCIAL STATEMENTS
Note 15 — Stock Option Plan
QNB has two stock option plans (the “1988 Plan” and the “1998 Plan”) administered by a committee which consists of three or more members of QNB’s Board of Directors. Both the 1988 and 1998 Plans provide for the granting of either (i) Non-Qualified Stock Options (NQSOs) or (ii) Incentive Stock Options (ISOs). The exercise price of an option is the fair market value of QNB’s common stock at the date of grant, as defined by the plans.
The 1988 Plan authorizes the issuance of 90,405 shares. These options expire 5 years from the date of grant. The 1988 Plan expired on February 23, 1998. No additional shares may be granted under the 1988 Plan. As of December 31, 2001, there were 80,532 options granted and 22,321 options outstanding under the 1988 Plan. The 1998 Plan authorizes the issuance of 110,250 shares. The time period by which any option is exercisable under the 1998 Plan is determined by the Committee but shall not commence before the expiration of six months or continue beyond the expiration of ten years after the date the option is awarded. As of Decem-ber 31, 2001, there were 48,279 options granted and 46,659 options outstanding under the 1998 Plan.
Changes in total options outstanding during 2001, 2000 and 1999, were as follows:
| | | | | | | | | | | | | | |
| | | | Number | | Exercise Price | | Average |
| | | | of Options | | per Option | | Exercise Price |
| | | |
| |
| |
|
| December 31, 1998 | | | 47,846 | | | $ | 17.60 - $30.69 | | | $ | 25.94 | |
|
|
|
|
| | ISOs Exercised | | | (5,512 | ) | | | 17.60 | | | | 17.60 | |
|
|
|
|
| | ISOs Granted | | | 19,395 | | | | 26.17 - 33.39 | | | | 32.24 | |
| | | |
| | | |
| | | |
| |
| December 31, 1999 | | | 61,729 | | | | 18.95 - 33.39 | | | | 28.66 | |
|
|
|
|
| | ISOs Exercised | | | (8,050 | ) | | | 18.95 | | | | 18.95 | |
|
|
|
|
| | ISOs Granted | | | 13,229 | | | | 26.17 | | | | 26.17 | |
| | | |
| | | |
| | | |
| |
| December 31, 2000 | | | 66,908 | | | | 26.17 - 33.39 | | | | 29.34 | |
|
|
|
|
| | ISOs Expired | | | (13,614 | ) | | | 26.60 - 33.39 | | | | 27.57 | |
|
|
|
|
| | ISOs Granted | | | 15,686 | | | | 26.60 | | | | 26.60 | |
| | | |
| | | |
| | | |
| |
| December 31, 2001 | | | 68,980 | | | $ | 26.17 - $33.39 | | | $ | 29.06 | |
| | | |
| | | |
| | | |
| |
The following table summarizes information about stock options outstanding at December 31, 2001:
| | | | | | | | | | | | | | | |
| | | | | | | | | Exercisable | | | | |
| | | | | | | | |
| | | | |
| | | | | | | | | | | | | Average |
| Exercise Price Range | | Options | | Average Life(1) | | Exercise Price |
| |
| |
| |
|
| $26.17-$28.88 | | | 41,535 | | | | 6.45 | | | $ | 27.00 | |
|
|
|
|
| 30.69- 33.39 | | | 27,445 | | | | 4.43 | | | | 32.20 | |
| | | |
| | | |
| | | |
| |
| | | Total | | | 68,980 | | | | 5.65 | | | $ | 29.06 | |
| | | |
| | | |
| | | |
| |
| | | (1) Average contractual life remaining in years |
SFAS No. 123 provides an alternative method of accounting for stock-based compensation arrangements. This method is based on fair value of the stock-based compensation determined by an option pricing model utilizing various assumptions regarding the underlying attributes of the options and QNB’s stock, rather than the existing method of accounting for stock-based compensation which is provided in Accounting Principles Board Opinion No. 25 (APB No. 25), “Accounting for Stock Issued to Employees.” The Financial Accounting Standards Board encourages entities to adopt the fair value based method, but does not require the adoption of this method.
QNB applies APB No. 25 and related Interpretations in accounting for the Plan. The following table sets forth pro forma net income and earnings per share as if compensation expense was recognized for stock options in accordance with SFAS No. 123.
| | | | | | | | | | |
| | | | Reported | | Pro forma |
| | | |
| |
|
| Net income: 2001 | | $ | 4,436 | | | $ | 4,338 | |
|
|
|
|
| | 2000 | | | 4,106 | | | | 4,032 | |
|
|
|
|
| | 1999 | | | 3,801 | | | | 3,670 | |
|
|
|
|
| Basic earnings per share: 2001 | | $ | 2.87 | | | $ | 2.81 | |
|
|
|
|
| | 2000 | | | 2.61 | | | | 2.56 | |
|
|
|
|
| | 1999 | | | 2.40 | | | | 2.31 | |
|
|
|
|
| Diluted earnings per share: 2001 | | $ | 2.87 | | | $ | 2.80 | |
|
|
|
|
| | 2000 | | | 2.61 | | | | 2.56 | |
|
|
|
|
| | 1999 | | | 2.39 | | | | 2.30 | |
For purposes of computing pro forma results QNB estimated the fair value of stock options on the date of the grant using the Black-Scholes option pricing model. The model requires the use of numerous assumptions, many of which are highly subjective in nature. Therefore, the pro forma results are, of necessity, estimates of results of operations as if compensation expense had been recognized for all stock-based compensation plans and are not indicative of the impact on future periods. The following assumptions were used in the option pricing model for purposes of estimating pro forma results.
| | | | | | | | | | | | | |
| Year ended December 31, | | 2001 | | 2000 | | 1999 |
| |
| |
| |
|
| Risk free interest rate | | | 5.23 | % | | | 6.75 | % | | | 5.04 | % |
|
|
|
|
| Dividend yield | | | 3.50 | % | | | 3.48 | % | | | 2.44 | % |
|
|
|
|
| Volatility | | | .39 | | | | .29 | | | | .25 | |
|
|
|
|
| Expected life | | 10 yrs | | 10 yrs. | | 10 yrs. |
| | | |
| | | |
| | | |
| |
The weighted average fair value per share of options granted during 2001, 2000 and 1999 was $9.45, $8.85 and $11.27, respectively.
45
QNB Corp. and Subsidiary 2001 Annual Report
NOTES TO CONSOLIDATED FINANCIAL STATEMENTS
Note 16 — Related Party Transactions
The following table presents activity in the amounts due from directors, principal officers, and their related interests. All of these transactions were made in the ordinary course of business on substantially the same terms, including interest rates and collateral, as those prevailing at the time for comparable transactions with other persons. Also, they did not involve a more than normal risk of collectibility or present any other unfavorable features.
| | | | | |
| Balance, December 31, 2000 | | $ | 4,342 | |
|
|
|
|
| New loans | | | 9,317 | |
|
|
|
|
| Repayments and other changes | | | 8,294 | |
| | | |
| |
| Balance, December 31, 2001 | | $ | 5,365 | |
| | | |
| |
QNB allowed its directors to defer a portion of their compensation. The amount of deferred compensation accrued as of December 31, 2001 and 2000, was $562,000 and $528,000, respectively.
During 1999, QNB entered into an agreement, approved by the Board of Directors, with a director for the improvement and renovation of certain of the Bank’s offices. The total paid during 2000 and 1999 was $167,000 and $333,000, respectively.
Note 17 — Commitments And Contingencies
In the normal course of business there are various legal proceedings, commitments, and contingent liabilities which are not reflected in the financial statements. Management does not anticipate any material losses as a result of these transactions and activities. They include, among other things, commitments to extend credit and standby letters of credit. Outstanding standby letters of credit amounted to $3,389,000 and $751,000 and commitments to extend credit totaled $52,068,000 and $40,878,000 at December 31, 2001 and 2000, respectively. The maximum exposure to credit loss, which represents the possibility of sustaining a loss due to the failure of the other parties to a financial instrument to perform according to the terms of the contract, is represented by the contractual amount of these instruments. QNB uses the same lending standards and policies in making credit commitments as it does for on-balance sheet instruments. The activity is controlled through credit approvals, control limits, and monitoring procedures.
Commitments to extend credit are agreements to lend to a customer as long as there is no violation of any condition established in the contract. Commitments generally have fixed expiration dates or other termination clauses and may require the payment of a fee. Since many of the commitments are expected to expire without being drawn upon, the total commitment amounts do not necessarily represent future cash requirements. QNB evaluates each customer’s creditworthiness on a case-by-case basis.
Standby letters of credit are conditional commitments issued to guarantee the performance of a customer to a third party. The credit risk and collateral policy involved in issuing letters of credit are essentially the same as those involved in extending loan commitments.
The amount of collateral obtained for letters of credit and commitments to extend credit is based on management’s credit evaluation of the customer. Collateral varies but may include real estate, accounts receivable, marketable securities, pledged deposits, inventory or equipment.
Note 18 — Other Comprehensive Income
The tax effects allocated to each component of “Other Comprehensive Income” are as follows:
| | | | | | | | | | | | | | | | |
| | | | | | | | | | Tax | | | | |
| | | | | | Before-Tax | | (Expense) | | Net-of-Tax |
| | | | | | Amount | | Benefit | | Amount |
| | | | | |
| |
| |
|
Year Ended December 31, 2001 | | | | | | | | | | | | |
|
|
|
|
| Unrealized gains on securities | | | | | | | | | | | | |
|
|
|
|
| | Unrealized holding gains arising during the period | | $ | 2,055 | | | $ | (699 | ) | | $ | 1,356 | |
|
|
|
|
| | Reclassification adjustment for gains included in net income | | | (292 | ) | | | 99 | | | | (193 | ) |
| | | | | |
| | | |
| | | |
| |
| Other comprehensive income | | $ | 1,763 | | | $ | (600 | ) | | $ | 1,163 | |
| | | | | |
| | | |
| | | |
| |
Year Ended December 31, 2000 | | | | | | | | | | | | |
|
|
|
|
| Unrealized gains on securities | | | | | | | | | | | | |
|
|
|
|
| | Unrealized holding gains arising during the period | | $ | 4,159 | | | $ | (1,415 | ) | | $ | 2,744 | |
|
|
|
|
| | Reclassification adjustment for gains included in net income | | | (310 | ) | | | 106 | | | | (204 | ) |
| | | | | |
| | | |
| | | |
| |
| Other comprehensive income | | $ | 3,849 | | | $ | (1,309 | ) | | $ | 2,540 | |
| | | | | |
| | | |
| | | |
| |
Year Ended December 31, 1999 | | | | | | | | | | | | |
|
|
|
|
| Unrealized gains on securities | | | | | | | | | | | | |
|
|
|
|
| | Unrealized holding losses arising during the period | | $ | (5,473 | ) | | $ | 1,861 | | | $ | (3,612 | ) |
|
|
|
|
| | Reclassification adjustment for losses included in net income | | | 139 | | | | (47 | ) | | | 92 | |
| | | | | |
| | | |
| | | |
| |
| Other comprehensive income | | $ | (5,334 | ) | | $ | 1,814 | | | $ | (3,520 | ) |
| | | | | |
| | | |
| | | |
| |
46
QNB Corp. and Subsidiary 2001 Annual Report
NOTES TO CONSOLIDATED FINANCIAL STATEMENTS
Note 19 — Disclosures About Fair Value of Financial Instruments
All entities are required to disclose estimated fair values for their financial instruments, whether or not recognized in the balance sheet. For QNB, as for most financial institutions, substantially all of its assets and liabilities are considered financial instruments.
Estimates of fair value are made at a specific point in time, based upon, where available, relevant market prices and information about the financial instrument. Such estimates do not include any premium or discount that could result from offering for sale at one time the Company’s entire holdings of a particular financial instrument. For a substantial portion of the Company’s financial instruments, no quoted market exists. Therefore, estimates of fair value are necessarily based on a number of significant assumptions regarding the amount and timing of estimated future cash flows, which are discounted to reflect varying degrees of risk. Given the uncertainties surrounding these assumptions, the reported fair values may not represent actual values of financial instruments that could have been realized as of year-end or that will be realized in the future. Use of different assumptions or methodologies is likely to result in significantly different fair value estimates.
The fair value of non-interest bearing demand deposits, interest-bearing demand accounts, money market accounts and savings accounts is equal to the carrying amount because these deposits have no stated maturity. This approach to estimating fair value excludes the significant benefit that results from the low-cost funding provided by such deposit liabilities, as compared to alternative sources of funding. As a consequence, the amounts disclosed may distort the actual fair value of a banking organization that is a going concern.
The estimated fair values and carrying amounts are summarized as follows:
| | | | | | | | | | | | | | | | | | |
| December 31, | | 2001 | | 2000 |
| |
| |
|
| | | | Estimated | | Carrying | | Estimated | | Carrying |
| | | | Fair Value | | Amount | | Fair Value | | Amount |
| | | |
| |
| |
| |
|
| Financial Assets | | | | | | | | | | | | | | | | |
|
|
|
|
| | Cash and due from banks | | $ | 18,220 | | | $ | 18,220 | | | $ | 14,466 | | | $ | 14,466 | |
|
|
|
|
| | Federal funds sold | | | 5,661 | | | | 5,661 | | | | 2,678 | | | | 2,678 | |
|
|
|
|
| | Investment securities available-for-sale | | | 168,102 | | | | 168,102 | | | | 114,245 | | | | 114,245 | |
|
|
|
|
| | Investment securities held-to-maturity | | | 43,048 | | | | 42,798 | | | | 42,815 | | | | 42,982 | |
|
|
|
|
| | Net loans | | | 202,964 | | | | 199,366 | | | | 181,232 | | | | 182,284 | |
|
|
|
|
| | Accrued interest receivable | | | 2,497 | | | | 2,497 | | | | 2,213 | | | | 2,213 | |
| |
| Financial Liabilities | | | | | | | | | | | | | | | | |
|
|
|
|
| | Deposits with no stated maturities | | | 167,920 | | | | 167,920 | | | | 158,541 | | | | 158,541 | |
|
|
|
|
| | Deposits with stated maturities | | | 179,446 | | | | 176,811 | | | | 135,060 | | | | 135,281 | |
|
|
|
|
| | Short-term borrowings | | | 13,462 | | | | 13,451 | | | | 17,847 | | | | 17,819 | |
|
|
|
|
| | Federal Home Loan Bank advances | | | 58,848 | | | | 53,000 | | | | 24,162 | | | | 25,000 | |
|
|
|
|
| | Accrued interest payable | | | 2,143 | | | | 2,143 | | | | 1,409 | | | | 1,409 | |
The following methods and assumptions were used to estimate the fair value of each major classification of financial instruments at December 31, 2001 and 2000.
Cash and due from banks, Federal funds sold, accrued interest receivable and accrued interest payable:
Current carrying amounts approximate estimated fair value.
Investment securities:
Quoted market prices were used to determine fair value.
Loans:
Fair values were estimated using the present value of the estimated cash flows, using interest rates currently being offered for loans with similar terms to borrowers of similar credit quality.
Deposit liabilities:
The fair value of deposits with no stated maturity (e.g. demand deposits, interest-bearing demand accounts, money market accounts and savings accounts) are by definition, equal to the amount payable on demand at the reporting date (i.e. their carrying amounts). Deposits with a stated maturity (time deposits) have been valued using the present value of cash flows discounted at rates approximating the current market for similar deposits.
Short-term borrowings and Federal Home Loan Bank advances:
Short-term borrowings and advances from the Federal Home Loan Bank have been valued using the present value of cash flows discounted at rates approximating the current market for similar liabilities.
Off-balance-sheet instruments:
Off-balance-sheet instruments are primarily comprised of loan commitments which are generally priced at market at the time of funding. Fees on commitments to extend credit and standby letters of credit are deemed to be immaterial and these instruments are expected to be settled at face value or expire unused. It is impractical to assign any fair value to these instruments.
47
QNB Corp. and Subsidiary 2001 Annual Report
NOTES TO CONSOLIDATED FINANCIAL STATEMENTS
Note 20 — Parent Company Financial Information
Condensed financial statements of QNB Corp. only:
Balance Sheets
| | | | | | | | | |
| December 31, | | 2001 | | 2000 |
| |
| |
|
| Assets | | | | | | | | |
|
|
|
|
| Cash and due from banks | | $ | 1 | | | $ | 57 | |
|
|
|
|
| Investment securities available-for-sale | | | 3,262 | | | | 3,115 | |
|
|
|
|
| Investment in subsidiary | | | 31,997 | | | | 28,642 | |
|
|
|
|
| Other assets | | | 69 | | | | 15 | |
| | | |
| | | |
| |
| Total assets | | $ | 35,329 | | | $ | 31,829 | |
| | | |
| | | |
| |
| Liabilities | | | | | | | | |
|
|
|
|
| Other liabilities | | $ | 110 | | | $ | 35 | |
|
|
|
|
| Shareholders’ equity | | | | | | | | |
|
|
|
|
| Common stock | | | 1,987 | | | | 1,891 | |
|
|
|
|
| Surplus | | | 8,681 | | | | 6,491 | |
|
|
|
|
| Retained earnings | | | 24,946 | | | | 24,409 | |
|
|
|
|
| Accumulated other comprehensive income | | | 1,099 | | | | (64 | ) |
|
|
|
|
| Treasury stock | | | (1,494 | ) | | | (933 | ) |
| | | |
| | | |
| |
| Total liabilities and shareholders’ equity | | $ | 35,329 | | | $ | 31,829 | |
| | | |
| | | |
| |
Statements of Income
| | | | | | | | | | | | | | | |
| Year Ended December 31, | | 2001 | | 2000 | | 1999 |
| |
| |
| |
|
| Dividends from subsidiary | | $ | 2,275 | | | $ | 2,685 | | | $ | 1,506 | |
|
|
|
|
| Interest and dividend income | | | 49 | | | | 78 | | | | 78 | |
|
|
|
|
| Securities (losses) gains | | | (124 | ) | | | 216 | | | | 117 | |
|
|
|
|
| Other income | | | — | | | | — | | | | 4 | |
| | | |
| | | |
| | | |
| |
| | | Total income | | | 2,200 | | | | 2,979 | | | | 1,705 | |
|
|
|
|
| | | Expenses | | | 154 | | | | 138 | | | | 145 | |
| | | |
| | | |
| | | |
| |
| Income before applicable income taxes and equity in undistributed income of subsidiary | | | 2,046 | | | | 2,841 | | | | 1,560 | |
|
|
|
|
| Income taxes (benefit) | | | (89 | ) | | | 35 | | | | — | |
| | | |
| | | |
| | | |
| |
| Income before equity in undistributed income of subsidiary | | | 2,135 | | | | 2,806 | | | | 1,560 | |
|
|
|
|
| Equity in undistributed income of subsidiary | | | 2,301 | | | | 1,300 | | | | 2,241 | |
| | | |
| | | |
| | | |
| |
| | | Net income | | $ | 4,436 | | | $ | 4,106 | | | $ | 3,801 | |
| | | |
| | | |
| | | |
| |
Statements of Cash Flows
| | | | | | | | | | | | | | | | |
| Year Ended December 31, | | 2001 | | 2000 | | 1999 |
| |
| |
| |
|
| Operating Activities | | | | | | | | | | | | |
|
|
|
|
| | Net income | | $ | 4,436 | | | $ | 4,106 | | | $ | 3,801 | |
|
|
|
|
| | Adjustments to reconcile net income to net cash provided by operating activities: | | | | | | | | | | | | |
|
|
|
|
| | | Equity in undistributed income from subsidiary | | | (2,301 | ) | | | (1,300 | ) | | | (2,241 | ) |
|
|
|
|
| | | Securities (losses) gains | | | 124 | | | | (216 | ) | | | (117 | ) |
|
|
|
|
| | | Decrease in other assets | | | — | | | | — | | | | 46 | |
|
|
|
|
| | | Increase (decrease) in other liabilities | | | 75 | | | | (11 | ) | | | 46 | |
|
|
|
|
| | | Deferred income tax provision | | | (110 | ) | | | — | | | | — | |
| | | | |
| | | |
| | | |
| |
| | | | Net cash provided by operating activities | | | 2,224 | | | | 2,579 | | | | 1,535 | |
| | | | |
| | | |
| | | |
| |
| Investing Activities | | | | | | | | | | | | |
|
|
|
|
| | Purchase of investment securities | | | (1,886 | ) | | | (1,986 | ) | | | (1,200 | ) |
|
|
|
|
| | Proceeds from sale of investment securities | | | 1,780 | | | | 1,758 | | | | 747 | |
| | | | |
| | | |
| | | |
| |
| | | | Net cash used by investing activities | | | (106 | ) | | | (228 | ) | | | (453 | ) |
| | | | |
| | | |
| | | |
| |
| Financing Activities | | | | | | | | | | | | |
|
|
|
|
| | Cash dividends paid | | | (1,655 | ) | | | (1,426 | ) | | | (1,207 | ) |
|
|
|
|
| | Stock issue | | | 42 | | | | 45 | | | | 48 | |
|
|
|
|
| | Treasury stock purchased | | | (561 | ) | | | (933 | ) | | | — | |
| | | | |
| | | |
| | | |
| |
| | | | Net cash used by financing activities | | | (2,174 | ) | | | (2,314 | ) | | | (1,159 | ) |
| | | | |
| | | |
| | | |
| |
| | | | (Decrease) increase in cash and cash equivalents | | | (56 | ) | | | 37 | | | | (77 | ) |
|
|
|
|
| | | | Cash and cash equivalents at beginning of year | | | 57 | | | | 20 | | | | 97 | |
| | | | |
| | | |
| | | |
| |
| | | | Cash and cash equivalents at end of year | | $ | 1 | | | $ | 57 | | | $ | 20 | |
| | | | |
| | | |
| | | |
| |
| Supplemental Cash Flow Disclosure | | | | | | | | | | | | |
|
|
|
|
| | Non-Cash Transactions | | | | | | | | | | | | |
|
|
|
|
| | | Change in net unrealized holding gains or losses, net of taxes on investment securities | | $ | 109 | | | $ | 10 | | | $ | (404 | ) |
48
QNB Corp. and Subsidiary 2001 Annual Report
NOTES TO CONSOLIDATED FINANCIAL STATEMENTS
Note 21 — Regulatory Restrictions
Dividends payable by the Corporation and the Bank are subject to various limitations imposed by statutes, regulations and policies adopted by bank regulatory agencies. Under current regulations regarding dividend availability, the Bank may declare dividends in 2002 to the Corporation totaling $3,601,000, plus additional amounts equal to the net profit earned by the Bank for the period from January 1, 2002, through the date of declaration, less dividends previously declared in 2002.
Both the Corporation and the Bank are subject to regulatory capital requirements administered by Federal banking agencies. Failure to meet minimum capital requirements can initiate actions by regulators that could have an effect on the financial statements. Under the framework for prompt corrective action, both the Corporation and the Bank must meet capital guidelines that involve quantitative measures of their assets, liabilities, and certain off-balance-sheet items. The capital amounts and classification are also subject to qualitative judgements by the regulators. Management believes, as of December 31, 2001, that both the Corporation and the Bank meet all capital adequacy requirements to which it is subject.
As of the most recent notification, the Federal Reserve Bank and the Comptroller of the Currency considered the Corporation and the Bank to be “well capitalized” under the regulatory framework. There are no conditions or events since that notification that management believes have changed the classification. To be categorized as well capitalized, the Corporation and the Bank must maintain minimum ratios set forth in the table below. The Corporation and the Bank’s actual capital amounts and ratios are presented below:
| | | | | | | | | | | | | | | | | | | | | | | | | | |
| | | | | | | | | | | | | Capital Levels | | | | |
| | | |
|
| | | | Actual | | Adequately Capitalized | | Well Capitalized |
| | | |
| |
| |
|
| As of December 31, 2001 | | Amount | | Ratio | | Amount | | Ratio | | Amount | | Ratio |
| |
| |
| |
| |
| |
| |
|
Total risk-based capital (to risk weighted assets):1 | | | | | | | | | | | | | | | | | | | | | | | | |
|
|
|
|
| | Consolidated | | $ | 36,677 | | | | 13.42 | % | | $ | 21,867 | | | | 8.00 | % | | $ | 27,334 | | | | 10.00 | % |
|
|
|
|
| | Bank | | | 33,466 | | | | 12.39 | | | | 21,613 | | | | 8.00 | | | | 27,016 | | | | 10.00 | |
|
|
|
|
Tier I capital (to risk weighted assets):1 | | | | | | | | | | | | | | | | | | | | | | | | |
|
|
|
|
| | Consolidated | | | 33,809 | | | | 12.37 | | | | 10,934 | | | | 4.00 | | | | 16,401 | | | | 6.00 | |
|
|
|
|
| | Bank | | | 30,621 | | | | 11.33 | | | | 10,806 | | | | 4.00 | | | | 16,210 | | | | 6.00 | |
|
|
|
|
Tier I capital (to average assets):1 | | | | | | | | | | | | | | | | | | | | | | | | |
|
|
|
|
| | Consolidated | | | 33,809 | | | | 7.78 | | | | 17,375 | | | | 4.00 | | | | 21,719 | | | | 5.00 | |
|
|
|
|
| | Bank | | | 30,621 | | | | 7.10 | | | | 17,252 | | | | 4.00 | | | | 21,566 | | | | 5.00 | |
| | | | | | | | | | | | | | | | | | | | | | | | | | |
| | | | | | | | | | | | | Capital Levels | | | | |
| | | |
|
| | | | Actual | | Adequately Capitalized | | Well Capitalized |
| | | |
| |
| |
|
| As of December 31, 2000 | | Amount | | Ratio | | Amount | | Ratio | | Amount | | Ratio |
| |
| |
| |
| |
| |
| |
|
Total risk-based capital (to risk weighted assets):1 | | | | | | | | | | | | | | | | | | | | | | | | |
|
|
|
|
| | Consolidated | | $ | 34,298 | | | | 15.24 | % | | $ | 18,003 | | | | 8.00 | % | | $ | 22,504 | | | | 10.00 | % |
|
|
|
|
| | Bank | | | 31,106 | | | | 14.02 | | | | 17,748 | | | | 8.00 | | | | 22,185 | | | | 10.00 | |
|
|
|
|
Tier I capital (to risk weighted assets):1 | | | | | | | | | | | | | | | | | | | | | | | | |
|
|
|
|
| | Consolidated | | | 31,483 | | | | 13.99 | | | | 9,002 | | | | 4.00 | | | | 13,502 | | | | 6.00 | |
|
|
|
|
| | Bank | | | 28,328 | | | | 12.77 | | | | 8,874 | | | | 4.00 | | | | 13,311 | | | | 6.00 | |
|
|
|
|
Tier I capital (to average assets):1 | | | | | | | | | | | | | | | | | | | | | | | | |
|
|
|
|
| | Consolidated | | | 31,483 | | | | 8.60 | | | | 14,648 | | | | 4.00 | | | | 18,310 | | | | 5.00 | |
|
|
|
|
| | Bank | | | 28,328 | | | | 7.80 | | | | 14,524 | | | | 4.00 | | | | 18,155 | | | | 5.00 | |
| | | 1 As defined by the regulators |
49
QNB Corp. and Subsidiary 2001 Annual Report

INDEPENDENT AUDITORS’ REPORT
To the Board of Directors and Shareholders of QNB Corp:
We have audited the accompanying consolidated balance sheets of QNB Corp. and subsidiary as of December 31, 2001 and 2000, and the related consolidated statements of income, shareholders’ equity, and cash flows for each of the years in the three-year period ended Decem-ber 31, 2001. These consolidated financial statements are the responsibility of the Company’s management. Our responsibility is to express an opinion on these consolidated financial statements based on our audits.
We conducted our audits in accordance with auditing standards generally accepted in the United States of America. Those standards require that we plan and perform the audit to obtain reasonable assurance about whether the financial statements are free of material misstatement. An audit includes examining, on a test basis, evidence supporting the amounts and disclosures in the financial statements. An audit also includes assessing the accounting principles used and significant estimates made by management, as well as evaluating the overall financial statement presentation. We believe that our audits provide a reasonable basis for our opinion.
In our opinion, the consolidated financial statements referred to above present fairly, in all material respects, the financial position of QNB Corp. and subsidiary as of December 31, 2001 and 2000, and the results of their operations and their cash flows for each of the years in the three-year period ended December 31, 2001 in conformity with accounting principles generally accepted in the United States of America.

50
QNB Corp. and Subsidiary 2001 Annual Report
CORPORATE INFORMATION
Annual Meeting
The Annual Meeting of Shareholders of QNB Corp. will be held at the offices of The Quakertown National Bank, 320 West Broad Street, Quakertown, PA on May 21, 2002, at 11:00 a.m.
Market Makers
As of December 31, 2001, the following firms made a market in QNB Corp. common stock:
| | | |
| Legg Mason Wood Walker, Inc. | | Ryan, Beck & Company |
|
|
|
|
| Westfield, NJ 07091 | | Shrewsbury, NJ 07702 |
Monroe Securities, Inc.
Rochester, NY 14614
Transfer Agent
Registrar and Transfer Company
10 Commerce Drive
Cranford, NJ 07016-3572
800-368-5948
Form 10-K
A copy of QNB Corp.’s Annual Report on Form 10-K, as filed with the Securities and Exchange Commission, is available, without charge to shareholders, by writing Jean Scholl, QNB Corp., P.O. Box 9005, Quakertown, PA 18951-9005.
The Annual Report and other Company reports are also filed electronically through the Electronic Data Gathering, Analysis, and Retrieval System (“EDGAR”) which performs automated collection, validation, indexing, acceptance, and forwarding of submissions to the Securities and Exchange Commission (SEC) and are accessible by the public using the Internet athttp://www.sec.gov./edgar.shtml.
Auditors
KPMG LLP
1600 Market Street
Philadelphia, PA 19103
Stock Information
QNB Corp. common stock is traded in the over-the-counter market. Quotations for QNB Corp. common stock appear in the pink sheets published by the National Quotations Bureau, Inc.
The following table sets forth representative high and low bid and ask stock prices for QNB Corp. common stock on a quarterly basis during 2001 and 2000:
| | | | | | | | | | | | | | | | | | | | | |
| | | | | | | | | | | | | | | | | | | Cash |
| | | High | | Low | | Dividend |
| | | Bid | | Ask | | Bid | | Ask | | Per Share |
| 2001 | | | | | | | | | | | | | | | | | | | | |
|
|
|
|
| First Quarter | | $ | 26.67 | | | $ | 28.33 | | | $ | 26.43 | | | $ | 26.91 | | | $ | .27 | |
|
|
|
|
| Second Quarter | | | 29.00 | | | | 31.00 | | | | 26.67 | | | | 28.10 | | | | .27 | |
|
|
|
|
| Third Quarter | | | 29.50 | | | | 31.00 | | | | 28.00 | | | | 30.25 | | | | .27 | |
|
|
|
|
| Fourth Quarter | | | 32.25 | | | | 34.50 | | | | 28.50 | | | | 30.00 | | | | .27 | |
| |
| 2000 | | | | | | | | | | | | | | | | | | | | |
|
|
|
|
| First Quarter | | $ | 26.24 | | | $ | 27.14 | | | $ | 23.07 | | | $ | 25.11 | | | $ | .22 | |
|
|
|
|
| Second Quarter | | | 26.24 | | | | 32.78 | | | | 21.71 | | | | 23.30 | | | | .23 | |
|
|
|
|
| Third Quarter | | | 26.13 | | | | 28.03 | | | | 25.29 | | | | 26.36 | | | | .23 | |
|
|
|
|
| Fourth Quarter | | | 27.55 | | | | 28.50 | | | | 26.01 | | | | 26.60 | | | | .23 | |
Direct Deposit of Dividends
Shareholders of record may elect to have dividends deposited directly to a checking or savings account at their financial institutions. For additional information about Direct Deposit of Dividends, please write to: Jean Scholl, QNB Corp., P.O. Box 9005, Quakertown, PA 18951-9005.
51
QNB Corp. and Subsidiary 2001 Annual Report
DIRECTORS, OFFICERS & OFFICE LOCATIONS
Directors of QNB Corp. and
The Quakertown National Bank
Norman L. Baringer
Thomas J. Bisko
Kenneth F. Brown, Jr.
Dennis Helf
G. Arden Link
Charles M. Meredith, III
Gary S. Parzych
Henry L. Rosenberger
Edgar L. Stauffer
Officers of QNB Corp.
Thomas J. Bisko, President/Treasurer/CEO
Robert C. Werner, Vice President
Bret H. Krevolin, Chief Accounting Officer
Charles M. Meredith, III, Secretary
Jean M. Scholl, Assistant Secretary
Executive Management of
The Quakertown National Bank
Thomas J. Bisko, President/Chief Executive Officer
Robert C. Werner, Executive Vice President/Chief Operating Officer
Bret H. Krevolin, Executive Vice President/Chief Financial Officer/Cashier
Bryan S. Lebo, Senior Vice President/Senior Lending Officer
Mary Ann Smith, Senior Vice President/Chief Information Officer
Heather J. Gossler, Senior Vice President, Sales/Branch Administrator
Scott G. Orzehoski, Senior Vice President, Commercial Lending
Officers of The Quakertown National Bank
Stephen W. Bauder, Vice President, Commercial Lending
Robert D. Beck, Vice President, InformationTechnology
Jane S. Cygan, Loan Origination Officer
Paul T. Dotzman, Assistant Vice President, Commercial Lending
Michael J. Fina, Esq., Vice President
Lynn C. Geesaman, Assistant Vice President, Loan Services
Joseph C. Giacini, Programmer/Analyst, Technical Operations Supervisor
Linda A. Grawe, Vice President, Retail Lending
Scott W. Groner, Technical Services Director
Patrick D. Iampietro, Controller
Shari L. Jarrell, Mortgage Loan Originator
Deborah E. Keller, Banking Officer, IRA/Savings
Carl P. Kessler, Assistant Vice President, Security/Compliance
Thomas R. Klee, Assistant Vice President, Commercial Lending
Christine S. Knerr, Banking Officer, Electronic Banking
Stacy A. Moyer, Human Resources Administrator
Joseph J. Olenick, Senior Vice President, Trust & Investment Management
Lisa A. Otery, Banking Officer, Deposit Services
David W. Quinn, Assistant Vice President/Operations Analyst
Kenneth E. Remick, Credit Associate
Stephen M. Rick, Credit Associate
Brian K. Schaffer, Vice President, Marketing
Jean M. Scholl, Assistant Cashier, General Ledger
Connie S. Stepan, Vice President, Community Investment Center
Maryann S. Thompson, Commercial Documentation Supervisor
Robert S. Wehrheim, Facilities Director
Cameron B. Wentzel, Retail Loan Officer/Supervisor
Robert L. Wieand, Senior Vice President, Commercial Lending
Branch Locations
DOWNTOWN OFFICE
3rd & West Broad Streets, Quakertown
Carol J. Schroding, Assistant Vice President/Branch Manager
Denise R. Landis, Banking Officer
COUNTRY SQUARE OFFICE
Country Square Shopping Center, Quakertown
Sharon L. Rotenberger, Assistant Vice President/Branch Manager
Doreen L. Little, Banking Officer
DUBLIN VILLAGE OFFICE
Dublin Village Plaza, Dublin
April B. Donahue, Branch Manager
COOPERSBURG OFFICE
Route 309, Coopersburg
Gale L. Pendrak, Branch Manager
PENNSBURG OFFICE
Pennsburg Square Shopping Center, Pennsburg
Brian L. Heilman, Branch Manager
PERKASIE OFFICE
6th & Chestnut Streets, Perkasie
Deborah K. McDonald, Branch Manager
SOUDERTON OFFICE
Hilltown Plaza Shopping Center, Souderton
Bruce D. Kenworthy, Branch Manager
Ray C. Myers, Banking Officer
CUSTOMER SERVICE CENTER
215-538-5605 or 800-491-9070
QNB-ONLINE INTERNET BANKING
www.QNB.com
ACCOUNT ACCESS 24-HOUR TELEPHONE BANKING
215-538-5760 or 800-491-9070
| | | | | |
 | | 320 West Broad Street
P.O. Box 9005
Quakertown, PA 18951-9005
215-538-5600 or 800-491-9070
www.QNB.com | | Concept, design by R&D Communications
Photography by Sashane Photography |
52