UNITED STATES
SECURITIES AND EXCHANGE COMMISSION
Washington, D.C. 20549
FORM 10-K
| x | ANNUAL REPORT PURSUANT TO SECTION 13 OR 15(d) OF THE SECURITIES EXCHANGE ACT OF 1934 for the fiscal year ended December 31, 2006 |
| o | TRANSITION REPORT PURSUANT TO SECTION 13 OR 15(d) OF THE SECURITIES EXCHANGE ACT OF 1934 for the transition period from ____________________ to ____________________ |
Commission file number 0-17706
(Exact name of registrant as specified in its charter)
| Pennsylvania | | 23-2318082 |
| (State or other jurisdiction of | | (I.R.S. Employer Identification No.) |
| incorporation or organization) | | |
| 15 North Third Street, Quakertown, PA | | 18951-9005 |
| (Address of principal executive offices) | | (Zip Code) |
Registrant’s telephone number, including area code: (215) 538-5600
Securities registered pursuant to Section 12(b) of the Act: None.
Securities registered pursuant to Section 12(g) of the Act:
| Title of each class | | Name of each exchange on which registered |
| Common Stock, $.625 par value | | N/A |
Indicate by check mark if the registrant is a well-known seasoned issuer, as defined in Rule 405 of the Securites Act. YES o NO þ
Indicate by check mark if the registrant is not required to file reports pursuant to Section 13 or Section 15(d) of the Act. YES o NO þ
Note - Checking the box above will not relieve any registrant required to file reports pursuant to Section 13 or 15(d) of the Exchange Act from their obligations under those Sections.
Indicate by check mark whether the Registrant: (1) has filed all reports required to be filed by Section 13 or 15(d) of the Securities Exchange Act of 1934 during the preceding 12 months (or for such shorter period that the Registrant was required to file such reports), and (2) has been subject to such filing requirements for the past 90 days. YES þ NO o
Indicate by check mark if disclosure of delinquent filers pursuant to Item 405 of Regulation S-K is not contained herein, and will not be contained, to the best of Registrant’s knowledge, in definitive proxy or information statements incorporated by reference in Part III of this Form 10-K or any amendment to this Form 10-K. o
Indicate by check mark whether the Registrant is a large accelerated filer, an accelerated filer, or a non-accelerated filer. See definition of “accelerated filer and large accelerated filer” in Rule 12b-2 of the Exchange Act.
Large accelerated filer o Accelerated filer þ Non-accelerated filer o
Indicate by check mark whether the Registrant is a shell company (as defined in Rule 12b-2 of the Exchange Act). YES o NO þ
As of March 1, 2007, 3,128,598 shares of Common Stock of the Registrant were outstanding. As of June 30, 2006, the aggregate market value of the Common Stock of the Registrant held by nonaffiliates was approximately $72,223,588 based upon the average bid and ask price of the common stock as reported on the OTC BB.
DOCUMENTS INCORPORATED BY REFERENCE
Portions of Registrant’s Proxy Statement for the annual meeting of its shareholders to be held May 15, 2007 are incorporated by reference in Part III of this report.
| | PAGE |
| | 3 |
| | 7 |
| | 10 |
| | 10 |
| | 10 |
| | 10 |
| | | |
| | |
| | 11 |
| | 13 |
| | 13 |
| | 38 |
| | 41 |
| | 65 |
| | 65 |
| | 66 |
| | | |
| | |
| | 67 |
| | 67 |
| | 67 |
| | 67 |
| | 67 |
| | | |
| | |
| | 68 |
FORWARD-LOOKING STATEMENTS
In addition to historical information, this document contains forward-looking statements. Forward-looking statements are typically identified by words or phrases such as “believe,” “expect,” “anticipate,” “intend,” “estimate,” “project” and variations of such words and similar expressions, or future or conditional verbs such as “will,” “would,” “should,” “could,” “may” or similar expressions. The U.S. Private Securities Litigation Reform Act of 1995 provides a safe harbor in regard to the inclusion of forward-looking statements in this document and documents incorporated by reference.
Shareholders should note that many factors, some of which are discussed elsewhere in this document and in the documents that are incorporated by reference, could affect the future financial results of the Corporation and its subsidiary and could cause those results to differ materially from those expressed in the forward-looking statements contained or incorporated by reference in this document. These factors include, but are not limited, to the following:
| | • | Volatility in interest rates and shape of the yield curve; |
| | • | Operating, legal and regulatory risks; |
| | • | Economic, political and competitive forces affecting the Corporation’s line of business; and |
| | • | The risk that the analysis of these risks and forces could be incorrect, and/or that the strategies developed to address them could be unsuccessful. |
QNB Corp. (herein referred to as QNB) cautions that these forward-looking statements are subject to numerous assumptions, risks and uncertainties, all of which change over time, and QNB assumes no duty to update forward-looking statements. Management cautions readers not to place undue reliance on any forward-looking statements. These statements speak only as of the date made, and they advise readers that various factors, including those described above, could affect QNB’s financial performance and could cause actual results or circumstances for future periods to differ materially from those anticipated or projected. Except as required by law, QNB does not undertake, and specifically disclaims any obligation, to publicly release any revisions to any forward-looking statements to reflect the occurrence of anticipated or unanticipated events or circumstances after the date of such statements.
Overview
QNB was incorporated under the laws of the Commonwealth of Pennsylvania on June 4, 1984. QNB is registered with the Federal Reserve Board as a bank holding company under the Bank Holding Company Act of 1956 and conducts its business through its wholly-owned subsidiary, The Quakertown National Bank (the Bank).
The Bank is a national banking association organized in 1877. The Bank is chartered under the National Banking Act and is subject to federal and state laws applicable to commercial banks. The Bank’s principal office is located in Quakertown, Bucks County, Pennsylvania. The Bank also operates seven other full-service community banking offices in Bucks, Montgomery and Lehigh counties in southeastern Pennsylvania.
The Bank is engaged in the general commercial banking business and provides a full range of banking services to its customers. These banking services consist of, among other things, attracting deposits and using these funds in making commercial loans, residential mortgage loans, consumer loans, and purchasing investment securities. These deposits are in the form of time, demand and savings accounts. Such time deposits include certificates of deposit and individual retirement accounts. The Bank’s savings accounts include money market accounts, club accounts, interest-bearing demand accounts and traditional statement savings accounts.
At December 31, 2006, QNB had total assets of $614,539,000, total loans of $343,496,000, total deposits of $478,922,000 and total shareholders’ equity of $50,410,000. For the year ended December 31, 2006, QNB reported net income of $5,420,000 compared to net income for the year ended December 31, 2005 of $5,046,000, an increase of 7.4 percent.
At March 1, 2007, the Bank had 138 full-time employees and 34 part-time employees. The Bank’s employees have a customer-oriented philosophy, a strong commitment to service and a “sincere interest” in their customers’ success. They maintain close contact with both the residents and local business people in the communities in which they serve, responding to changes in market conditions and customer requests in a timely manner.
Competition and Market Area
The banking business is highly competitive, and the profitability of QNB depends principally upon the Bank’s ability to compete in its market area. QNB faces intense competition within its market, both in making loans and attracting deposits. The upper Bucks, southern Lehigh, and northern Montgomery areas have a high concentration of financial institutions, including large national and regional banks, community banks, savings institutions, credit unions and on-line banks. Some of QNB’s competitors offer products and services that QNB currently does not offer, such as traditional trust and full-service insurance. However, QNB has been able to compete effectively with other financial institutions by emphasizing the establishment of long-term relationships and customer loyalty. A strong focus on small-business solutions, providing fast local decision-making on loans, exceptional personal customer service and up-to-date technology solutions, including internet-banking and electronic bill pay, also enable QNB to compete successfully.
Competition for loans and deposits comes principally from commercial banks, savings institutions, credit unions and non-bank financial service providers. Factors in successfully competing for deposits include providing convenient locations and hours of operation, attractive rates, low fees, and alternative delivery systems. One such delivery system is a courier service offered to businesses to assist in their daily banking needs without having to leave their workplace. Successful loan origination tends to depend on being responsive and flexible to the customer’s needs, as well as the interest rate and terms of the loan. While many competitors within the Bank’s primary market have substantially higher legal lending limits, QNB often has the ability, through loan participations, to meet the larger lending needs of its customers.
QNB’s success is dependent to a significant degree on economic conditions in eastern Pennsylvania, especially upper Bucks, southern Lehigh and northern Montgomery counties, which it defines as its primary market. The banking industry is affected by general economic conditions, including the effects of inflation, recession, unemployment, real estate values and trends in the national and global economies, and other factors beyond QNB’s control.
SUPERVISION AND REGULATION
Bank holding companies and banks operate in a highly regulated environment and are regularly examined by federal and state regulatory authorities. Federal statutes that apply to QNB and its subsidiary include the Gramm-Leach-Bliley Act (GLBA), the Bank Holding Company Act of 1956 (BHCA), the Federal Reserve Act and the Federal Deposit Insurance Act (FDIA). In general, these statutes regulate the corporate governance of the Bank and eligible business activities of QNB, certain acquisition and merger restrictions, intercompany transactions, such as loans and dividends, and capital adequacy, among other restrictions. Other corporate governance requirements are imposed on QNB by federal laws, including the Sarbanes-Oxley Act, described later.
To the extent that the following information describes statutory or regulatory provisions, it is qualified in its entirety by references to the particular statutory, or regulatory, provisions themselves. Proposals to change banking laws and regulations are frequently introduced in Congress, the state legislatures, and before the various bank regulatory agencies. QNB cannot determine the likelihood of passage or timing of any such proposals or legislation or the impact they may have on QNB and its subsidiary. A change in law, regulations or regulatory policy may have a material effect on QNB and its subsidiary.
Bank Holding Company Regulation
QNB is registered as a bank holding company and is subject to the regulations of the Board of Governors of the Federal Reserve System (the Federal Reserve) under the BHCA. In addition, QNB Corp., as a Pennsylvania business corporation, is also subject to the provisions of Section 115 of the Pennsylvania Banking Code of 1965 and the Business Corporation Law of 1988, as amended.
Bank holding companies are required to file periodic reports with, and are subject to examination by, the Federal Reserve. The Federal Reserve’s regulations require a bank holding company to serve as a source of financial and managerial strength to its subsidiary banks. As a result, the Federal Reserve, pursuant to its “source of strength” regulations, may require QNB to commit its resources to provide adequate capital funds to the Bank during periods of financial distress or adversity.
Federal Reserve approval may be required before QNB may begin to engage in any non-banking activity and before any non-banking business may be acquired by QNB.
Dividend Restrictions
Federal and state laws regulate the payment of dividends by the Bank. Under the National Bank Act, the Bank is required to obtain the prior approval of the Office of the Comptroller of the Currency (OCC) for the payment of dividends, if the total of all dividends declared by it in one year would exceed its net profits for the current year plus its retained net profits for the two preceding years less any required transfers to surplus. In addition, the Bank may only pay dividends to the extent that its retained net profits (including the portion transferred to surplus) exceed statutory bad debts. Under the FDIA, the Bank is prohibited from paying any dividends, making other distributions or paying any management fees if, after such payment, it would fail to satisfy its minimum capital requirements. See also “Supervision and Regulation - Bank Regulation”.
Further, it is the policy of the Federal Reserve that bank holding companies should pay dividends only out of current earnings. Federal banking regulators also have the authority to prohibit banks and bank holding companies from paying a dividend if they should deem such payment to be an unsafe or unsound practice.
Capital Adequacy
Bank holding companies are required to comply with the Federal Reserve’s risk-based capital guidelines. The required minimum ratio of total capital to risk-weighted assets (including certain off-balance sheet activities, such as standby letters of credit) is 8 percent. At least half of total capital must be Tier 1 capital. Tier 1 capital consists principally of common shareholders’ equity, plus retained earnings, less certain intangible assets. The remainder of total capital may consist of the allowance for loan loss, which is considered Tier 2 capital. At December 31, 2006, QNB’s Tier 1 capital and total (Tier 1 and Tier 2 combined) capital ratios were 13.15 percent and 13.91 percent, respectively.
In addition to the risk-based capital guidelines, the Federal Reserve requires a bank holding company to maintain a minimum leverage ratio. This requires a minimum level of Tier 1 capital (as determined under the risk-based capital rules) to average total consolidated assets of 4 percent for those bank holding companies that have the highest regulatory examination ratings and are not contemplating or experiencing significant growth or expansion. The Federal Reserve expects all other bank holding companies to maintain a ratio of at least 1 percent to 2 percent above the stated minimum. At December 31, 2006, QNB’s leverage ratio was 8.42 percent.
Pursuant to the prompt corrective action provisions of the FDIA, the federal banking agencies have specified, by regulation, the levels at which an insured institution is considered well capitalized, adequately capitalized, undercapitalized, significantly undercapitalized, or critically undercapitalized. Under these regulations, an institution is considered well capitalized if it satisfies each of the following requirements:
| | • | Total risk-based capital ratio of 10 percent or more, |
| | • | Tier 1 risk-based capital ratio of 6 percent or more, |
| | • | Leverage ratio of 5 percent or more, and |
| | • | Not subject to any order or written directive to meet and maintain a specific capital level |
At December 31, 2006, QNB qualified as well capitalized under these regulatory standards. See Note 20 of the Notes to Consolidated Financial Statements included at Item 8 of this Report.
Bank Regulation
The operations of the Bank are subject to federal and state statutes applicable to banks chartered under the banking laws of the United States, including the National Bank Act, to members of the Federal Reserve System, and to banks whose deposits are insured by the Federal Deposit Insurance Corporation (FDIC). These operations are also subject to regulations of the OCC, the Federal Reserve, and the FDIC.
The OCC, which has primary supervisory authority over the Bank, regularly examines banks in such areas as loans and the allowance for loan losses, investments, management practices, regulatory compliance and other aspects of operations. These examinations are designed for the protection of depositors rather than QNB’s shareholders. The Bank must furnish annual and quarterly reports to the OCC, which has the authority under the Financial Institutions Supervisory Act and the FDIA, to prevent a national bank from engaging in an unsafe or unsound practice in conducting its business or from otherwise conducting activities in violation of the law.
Federal and state banking laws and regulations govern, among other things, the scope of a bank’s business, the investments a bank may make, the reserves against deposits a bank must maintain, the types and terms of loans a bank may make and the collateral it may take, the activities of a bank with respect to mergers and consolidations, and the establishment of branches. Pennsylvania law permits statewide branching.
As a subsidiary bank of a bank holding company, the Bank is subject to certain restrictions imposed by the Federal Reserve Act on extensions of credit to QNB on investments in the stock or other securities of QNB, and on taking such stock or securities as collateral for loans.
The Bank is a member of the Federal Reserve System and therefore, the policies and regulations of the Federal Reserve Board have a significant impact on many elements of the Bank’s operations including the ability to grow deposits and loans, the rate of interest earned and paid and levels of liquidity and required capital. Management cannot predict the effects of such policies and regulations upon the Bank’s business model and the corresponding impact they may have on future earnings.
FDIC Insurance Assessments
The Bank is subject to deposit insurance assessments by the FDIC based on the risk classification of the Bank. The Bank was not subject to any regular insurance assessments by the FDIC in 2006. In 2006, the FDIC approved the reinstatement of regular insurance assessments effective January 1, 2007. The assessments will be determined using a risk-based system. Using the information currently available, it is estimated that the assessment for the Bank will be approximately $.052 per $100 of deposits in 2007. The FDIC is providing a credit to institutions that paid assessments in the past which can be used to offset their regular insurance assessments in future years. The Bank has an estimated credit of $340,000 which should be sufficient to cover the 2007 assessment.
Insured deposits are also assessed to fund debt service on certain related federal government bonds. The total assessment paid by the Bank in 2006 to fund this debt service was $57,000.
Community Reinvestment Act (CRA)
Under the Community Reinvestment Act, as amended, the OCC is required to assess all financial institutions that it regulates to determine whether these institutions are meeting the credit needs of the community that they serve. The act focuses specifically on low- and moderate-income neighborhoods. The OCC takes an institution’s record into account in its evaluation of any application made by such institutions for, among other things:
| | • | Approval of a branch or other deposit facility; |
| | • | An office relocation or a merger; and |
| | • | Any acquisition of bank shares. |
The CRA, as amended, also requires that the OCC make publicly available the evaluation of the Bank’s record of meeting the credit needs of its entire community, including low- and moderate-income neighborhoods. This evaluation includes a descriptive rating of either outstanding, satisfactory, needs to improve, or substantial noncompliance, and a statement describing the basis for the rating. The Bank’s most recent CRA rating was satisfactory.
Monetary and Fiscal Policies
The financial services industry, including QNB and the Bank, is affected by the monetary and fiscal policies of government agencies, including the Federal Reserve. Through open market securities transactions and changes in its discount rate and reserve requirements, the Federal Reserve exerts considerable influence over the cost and availability of funds for lending and investment.
USA Patriot Act
The USA Patriot Act strengthens the anti-money laundering provisions of the Bank Secrecy Act. The Act requires financial institutions to establish certain procedures to be able to identify and verify the identity of its customers. Specifically the Bank must have procedures in place to:
| | • | Verify the identity of persons applying to open an account, |
| | • | Ensure adequate maintenance of the records used to verify a person’s identity, and |
| | • | Determine whether a person is on any U.S. governmental agency list of known or suspected terrorists or a terrorist organization |
The Bank has implemented the required internal controls to ensure proper compliance with the USA Patriot Act.
Sarbanes-Oxley Act of 2002
The Sarbanes-Oxley Act is intended to bolster public confidence in the nation’s capital markets by imposing new duties and penalties for non-compliance on public companies and their executives, directors, auditors, attorneys and securities analysts. Some of the more significant aspects of the Act include:
| | • | Corporate Responsibility for Financial Reports - requires Chief Executive Officers (CEOs) and Chief Financial Officers (CFOs) to personally certify and be accountable for their Company’s financial records and accounting and internal controls. |
| | • | Management Assessment of Internal Controls - requires auditors to certify the Company’s underlying controls and processes that are used to compile the financial results. |
| | • | Real-time Issuer Disclosures - requires that companies provide real-time disclosures of any events that may affect its stock price or financial performance, generally within a 48-hour period. |
| | • | Criminal Penalties for Altering Documents - provides severe penalties for “whoever knowingly alters, destroys, mutilates” any record or document with intent to impede an investigation. Penalties include monetary fines and prison time. |
The Act also imposes requirements for corporate governance, auditor independence, accounting standards, audit committee member independence and increased authority, executive compensation, insider loans and whistleblower protection. As a result of the Act, QNB adopted a Code of Business Conduct and Ethics applicable to its CEO, CFO and Controller, which meets the requirements of the Act, to supplement its long-standing Code of Ethics, which applies to all directors and employees.
QNB’s Code of Business Conduct and Ethics can be found on the Corporation’s website at www.qnb.com.
Additional Information
QNB’s principal executive offices are located at 15 North Third Street, Quakertown, Pennsylvania 18951. Its telephone number is (215) 538-5600.
This annual report, including the exhibits and schedules filed as part of the annual report on Form 10-K, may be inspected at the public reference facility maintained by the Securities and Exchange Commission (SEC) at its public reference room at 450 Fifth Street, NW, Washington, DC 20549 and copies of all, or any part thereof, may be obtained from that office upon payment of the prescribed fees. You may call the SEC at 1-800-SEC-0330 for further information on the operation of the public reference room and you can request copies of the documents upon payment of a duplicating fee, by writing to the SEC. In addition, the SEC maintains a website that contains reports, proxy and information statements and other information regarding registrants, including QNB, that file electronically with the SEC which can be accessed at www.sec.gov.
QNB also makes its periodic and current reports available, free of charge, on its website, www.qnb.com, as soon as reasonably practicable after such material is electronically filed with the SEC. Information available on the website is not a part of, and should not be incorporated into, this annual report on Form 10-K.
The following discusses risks that management believes are specific to our business and could have a negative impact on QNB’s financial performance. When analyzing an investment in QNB, the risks and uncertainties described below, together with all of the other information included or incorporated by reference in this report should be carefully considered. This list should not be viewed as comprehensive and may not include all risks that may affect the financial performance of QNB:
Interest Rate Risk
QNB’s profitability is largely a function of the spread between the interest rates earned on earning assets and the interest rates paid on deposits and other interest-bearing liabilities. Like most financial institutions, QNB’s net interest income and margin will be affected by general economic conditions and other factors, including fiscal and monetary policies of the federal government, that influence market interest rates and QNB’s ability to respond to changes in such rates. At any given time, QNB’s assets and liabilities may be such that they are affected differently by a change in interest rates. As a result, an increase or decrease in rates, the length of loan terms or the mix of adjustable- and fixed- rate loans or investment securities in QNB’s portfolio could have a positive or negative effect on its net income, capital and liquidity. Although management believes it has implemented strategies and guidelines to reduce the potential effects of adverse changes in interest rates on results of operations, any substantial and prolonged change in market interest rates could negatively affect operating results.
The yield curve for the various maturities of U. S. Treasury securities provides a fundamental barometer that gauges the prevailing interest rate profile and, simultaneously, acts as a guidepost for current loan and deposit pricing constraints. The slope of the yield curve is driven primarily by expectations for future interest rate increases and inflationary trends. A normal yield curve has a slope that reflects lower costs for shorter-term financial instruments, accompanied by increases in costs for longer term instruments all along the maturity continuum.
Short-term interest rates are highly influenced by the monetary policy of the Federal Reserve Bank. The Federal Open Market Committee, a committee of the Federal Reserve Bank, targets the federal funds rate, the overnight rate at which banks borrow or lend excess funds between financial institutions. This rate serves as a benchmark for the overnight money costs, and correspondingly influences the pricing of a significant portion of a bank’s deposit funding sources. Intermediate- and longer-term interest rates, unlike the federal funds rate, are more directly influenced by external market forces, including perceptions about future interest rates and inflation. These trends, in turn, influence the pricing on mid- and long-term loan commitments as well as deposits and bank borrowings that have scheduled maturities.
Generally speaking, a yield curve with a higher degree of slope provides more opportunity to increase the spread between earning asset yields and funding costs. It should be emphasized that while the yield curve is a critical benchmark in setting prices for various monetary assets and liabilities in banks, its influence is not exerted in a vacuum. Credit risk, market risk, competitive issues, and other factors must all be considered in the pricing of financial instruments.
A steep or highly-sloped yield curve may be a precursor of higher interest rates or elevated inflation in the future, while a flat yield curve may be characteristic of a Federal Reserve Bank policy designed to calm an overheated economy by tightening credit availability via increases in short-term rates. If other rates along the maturity spectrum do not rise correspondingly, the yield curve can be expected to flatten. This scenario may reflect an economic outlook that has little or no expectation of higher future interest rates or higher rates of inflation. For banks, the presence of a flat yield curve for a prolonged or sustained period could measurably lower expectations for expanding net interest income.
An inverted yield curve is the opposite of a normal yield curve and is characterized by short-term rates that are higher than longer-term rates. The presence of an inverted yield curve is considered to be an anomaly that is almost counterintuitive to the core business of banking. Inverted yield curves do not typically exist for more than a short period of time. In past economic cycles, the presence of an inverted yield curve has frequently foreshadowed a recession. The possibility of recession may suppress future asset growth trends and/or increase the influence of other forms of risk, such as credit risk, which could hamper opportunities for revenue expansion and earnings growth in the near term.
Credit Risk
As a lender, QNB is exposed to the risk that its borrowers may be unable to repay their loans and that any collateral securing the payment of their loans may not be sufficient to assure repayment in full. Credit losses are inherent in the lending business and could have a material adverse effect on the operating results of QNB. Adverse changes in the economy or business conditions, either nationally or in QNB’s market areas, could increase credit-related losses and expenses and/or limit growth. Substantially all of QNB’s loans are to businesses and individuals in its limited geographic area and any economic decline in this market could impact QNB adversely. QNB makes various assumptions and judgments about the collectibility of its loan portfolio and provides an allowance for loan losses based on a number of factors. If these assumptions are incorrect, the allowance for loan losses may not be sufficient to cover losses and may cause QNB to increase the allowance in the future by increasing the provision for loan losses, thereby having an adverse effect on operating results. QNB has adopted underwriting and credit monitoring procedures and credit policies that management believes are appropriate to control these risks, however, such policies and procedures may not prevent unexpected losses that could have a material adverse affect on QNB’s financial condition or results of operations.
Competition
The financial services industry is highly competitive with competition for attracting and retaining deposits and making loans coming from other banks and savings institutions, credit unions, mutual fund companies, insurance companies and other non-bank businesses. Many of QNB’s competitors are much larger in terms of total assets and market capitalization, have a higher lending limit, have greater access to capital and funding, and offer a broader array of financial products and services. In light of this, QNB’s ability to continue to compete effectively is dependent upon its ability to maintain and build relationships by delivering top quality service.
At December 31, 2006, our lending limit per borrower was approximately $7,500,000, or approximately 15 percent of our capital. Accordingly, the size of loans that we can offer to potential borrowers (without participation by other lenders) is less than the size of loans that many of our competitors with larger capitalization are able to offer. Our legal lending limit also impacts the efficiency of our lending operation because it tends to lower our average loan size, which means we have to generate a higher number of transactions to achieve the same portfolio volume. We may engage in loan participations with other banks for loans in excess of our legal lending limits. However, there can be no assurance that such participations will be available at all or on terms which are favorable to us and our customers.
Impairment Risk
QNB regularly purchases U.S. Government and U.S. Government agency debt securities, U.S. Government agency issued mortgage-backed securities or collateralized mortgage obligation securities (CMOs), corporate debt securities and equity securities. QNB is exposed to the risk that the issuers of these securities may experience significant deterioration in credit quality which could impact the market value of the issue. QNB periodically evaluates its investments to determine if market value declines are other-than-temporary. Once a decline is determined to be other-than-temporary, the value of the security is reduced and a corresponding charge to earnings is recognized.
Third Party Risk
Third parties provide key components of the business infrastructure such as internet connections and network access. Any disruption in internet, network access or other voice or data communication services provided by these third parties or any failure of these third parties to handle current or higher volumes of use could adversely affect the ability to deliver products and services to clients and otherwise to conduct business. Technological or financial difficulties of a third party service provider could adversely affect the business to the extent those difficulties result in the interruption or discontinuation of services provided by that party.
Technology Risk
The market for financial services is increasingly affected by advances in technology, including developments in telecommunications, data processing, computers, automation, Internet-based banking and telebanking. Our ability to compete successfully in our markets may depend on the extent to which we are able to exploit such technological changes. However, we can provide no assurance that we will be able properly or timely to anticipate or implement such technologies or properly train our staff to use such technologies. Any failure to adapt to new technologies could adversely affect our business, financial condition or operating results.
Changes in accounting standards
Our accounting policies and methods are fundamental to how we record and report our financial condition and results of operations. From time to time the Financial Accounting Standards Board (FASB) changes the financial accounting and reporting standards that govern the preparation of our financial statements. These changes can be hard to predict and can materially impact how we record and report our financial condition and results of operations. In some cases, we could be required to apply a new or revised standard retroactively, resulting in our restating prior period financial statements.
Government Regulation and Supervision
The banking industry is heavily regulated under both federal and state law. Banking regulations, designed primarily for the safety of depositors, may limit a financial institution’s growth and the return to its investors, by restricting such activities as the payment of dividends, mergers with or acquisitions by other institutions, expansion of branch offices and the offering of securities. QNB is also subject to capitalization guidelines established by federal law and could be subject to enforcement actions to the extent that its subsidiary bank is found, by regulatory examiners, to be undercapitalized. It is difficult to predict what changes, if any, will be made to existing federal and state legislation and regulations or the effect that such changes may have on QNB’s future business and earnings prospects. Any substantial changes to applicable laws or regulations could subject QNB to additional costs, limit the types of financial services and products it may offer, and inhibit its ability to compete with other financial service providers.
Internal and Controls and Procedures
Management diligently reviews and updates its internal controls, disclosure controls and procedures, and corporate governance policies and procedures. Our disclosure controls and procedures are designed to reasonably assure that information required to be disclosed by QNB in reports we file or submit under the Exchange Act is accumulated and communicated to management, and recorded, processed, summarized, and reported within the time periods specified in the SEC’s rules and forms. We believe that any disclosure controls and procedures or internal controls and procedures, no matter how well conceived and operated, can provide only reasonable, not absolute, assurance that the objectives of the control system are met. Any undetected circumvention of these controls could have a material adverse impact on QNB’s financial condition and results of operations.
These inherent limitations include the realities that judgments in decision-making can be faulty, and that breakdowns can occur because of simple error or mistake. Additionally, controls can be circumvented by the individual acts of some persons, by collusion of two or more people or by an unauthorized override of the controls. Accordingly, because of the inherent limitations in our control system, misstatements due to error or fraud may occur and not be detected.
Attracting and Retaining Skilled Personnel
Our success depends upon the ability to attract and retain highly motivated, well-qualified personnel. We face significant competition in the recruitment of qualified employees. Our ability to execute our business strategy and provide high quality service may suffer if we are unable to recruit or retain a sufficient number of qualified employees or if the costs of employee compensation or benefits increase substantially. QNB currently has employment agreements and change of control agreements with several of its senior officers.
None.
The Quakertown National Bank and QNB Corp.’s main office is located at 15 North Third Street, Quakertown, Pennsylvania. The Quakertown National Bank conducts business from its main office and seven other retail offices located in upper Bucks, southern Lehigh, and northern Montgomery counties. The Quakertown National Bank owns its main office, two retail locations, its operations facility and a computer facility. The Quakertown National Bank leases its remaining five retail properties. The leases on the properties generally contain renewal options. In management’s opinion, these properties are in good condition and are currently adequate for QNB’s purposes.
The following table details The Quakertown National Bank’s properties:
| Quakertown, Pa. | - Main Office | Owned |
| | 15 North Third Street | |
| | | |
| Quakertown, Pa. | - Towne Bank Center | Owned |
| | 320-322 West Broad Street | |
| | | |
| Quakertown, Pa. | - Computer Center | Owned |
| | 121 West Broad Street | |
| | | |
| Quakertown, Pa. | - Country Square Office | Leased |
| | 240 South West End Boulevard | |
| | | |
| Quakertown, Pa. | - Quakertown Commons Branch | Leased |
| | 901 South West End Boulevard | |
| | | |
| Dublin, Pa. | - Dublin Branch | Leased |
| | 161 North Main Street | |
| | | |
| Pennsburg, Pa. | - Pennsburg Square Branch | Leased |
| | 410-420 Pottstown Avenue | |
| | | |
| Coopersburg, Pa. | - Coopersburg Branch | Owned |
| | 51 South Third Street | |
| | | |
| Perkasie, Pa. | - Perkasie Branch | Owned |
| | 607 Chestnut Street | |
| | | |
| Souderton, Pa. | - Souderton Branch | Leased |
| | 750 Route 113 | |
Although there is currently no litigation to which QNB is the subject, future litigation that arises during the normal course of QNB’s business could be material and have a negative impact on QNB’s earnings. Future litigation also could adversely impact the reputation of QNB in the communities that it serves.
| ITEM 4. | SUBMISSION OF MATTERS TO A VOTE OF SECURITY HOLDERS |
None.
| ITEM 5. | MARKET FOR THE REGISTRANT’S COMMON EQUITY AND RELATED STOCKHOLDER MATTERS |
Stock Information
QNB common stock is traded in the over-the-counter (OTC) market. Quotations for QNB common stock appear in the pink sheets published by the National Quotations Bureau, Inc. QNB had approximately 1,160 shareholders of record as of March 1, 2007.
The following table sets forth the high and low bid and ask stock prices for QNB common stock on a quarterly basis during 2006 and 2005. These prices reflect inter-dealer prices, without retail mark-up, mark-down or commission and may not necessarily represent actual transactions.
| |
| | | | | | | | | | | Cash | |
| | | High | | Low | | Dividend | |
| | | Bid | | Ask | | Bid | | Ask | | Per Share | |
| | | | | | | | | | | | |
| 2006 | | | | | | | | | | | |
| First Quarter | | $ | 27.00 | | $ | 28.00 | | $ | 25.10 | | $ | 25.50 | | $ | .21 | |
| Second Quarter | | | 26.35 | | | 29.00 | | | 25.85 | | | 26.00 | | | .21 | |
| Third Quarter | | | 26.50 | | | 29.00 | | | 24.35 | | | 24.50 | | | .21 | |
| Fourth Quarter | | | 26.75 | | | 27.50 | | | 24.40 | | | 25.25 | | | .21 | |
| | | | | | | | | | | | | | | | | |
| 2005 | | | | | | | | | | | | | | | | |
| First Quarter | | $ | 32.35 | | $ | 33.25 | | $ | 31.00 | | $ | 31.45 | | $ | .195 | |
| Second Quarter | | | 31.25 | | | 31.80 | | | 30.50 | | | 30.70 | | | .195 | |
| Third Quarter | | | 30.50 | | | 31.40 | | | 28.00 | | | 28.05 | | | .195 | |
| Fourth Quarter | | | 28.00 | | | 28.75 | | | 27.00 | | | 27.60 | | | .195 | |
QNB has traditionally paid quarterly cash dividends on the last Friday of each quarter. The Corporation expects to continue the practice of paying quarterly cash dividends to its shareholders; however, future dividends are dependent upon future earnings. Certain laws restrict the amount of dividends that may be paid to shareholders in any given year. See “Capital Adequacy,” found on page 35 of this Form 10-K filing, and Note 20 of the Notes to Consolidated Financial Statements, found on page 63 of this Form 10-K filing, for the information that discusses and quantifies this regulatory restriction.
Stock Performance Graph
Set forth on the following page is a performance graph comparing the yearly cumulative total shareholder return on QNB’s common stock with:
| • | the yearly cumulative total shareholder return on stocks included in the NASDAQ Market Index, a broad market index, |
| • | the yearly cumulative total shareholder return on the SNL $500M to $1B Bank Index, a group encompassing 113 publicly traded banking companies trading on the NYSE, AMEX, or NASDAQ with assets between $500 million and $1 billion, |
| • | the yearly cumulative total shareholder return on the SNL Mid-Atlantic Bank Index, a group encompassing 94 publicly traded banking companies trading on the NYSE, AMEX, or NASDAQ headquartered in Delaware, District of Columbia, Maryland, New Jersey, New York, Pennsylvania, and Puerto Rico. |
All of these cumulative total returns are computed assuming the reinvestment of dividends at the frequency with which dividends were paid during the applicable years.
Comparison of Five Year Cumulative Total Shareholder Return
QNB Corp., SNL $500 M - $1B Bank Index & NASDAQ Market Index
| | | Period Ending | |
Index | | 12/31/01 | | 12/31/02 | | 12/31/03 | | 12/31/04 | | 12/31/05 | | 12/31/06 | |
| QNB Corp. | | | 100.00 | | | 141.79 | | | 219.75 | | | 218.27 | | | 183.31 | | | 178.71 | |
| NASDAQ Composite | | | 100.00 | | | 68.76 | | | 103.67 | | | 113.16 | | | 115.57 | | | 127.58 | |
| SNL $500M-$1B Bank Index | | | 100.00 | | | 127.67 | | | 184.09 | | | 208.62 | | | 217.57 | | | 247.44 | |
| SNL Mid-Atlantic Bank Index | | | 100.00 | | | 76.91 | | | 109.35 | | | 115.82 | | | 117.87 | | | 141.46 | |
| | | | | | | | | | | | | | | | | | | |
Source: SNL Financial L.C. Charlottesville, VA
Equity Compensation Plan Information
The following table summarizes QNB’s equity compensation plan information as of December 31, 2006. Information is included for both equity compensation plans approved by QNB shareholders and equity compensation plans not approved by QNB shareholders.
| |
| | | Number of shares | | Weighted-average | | available for future | |
| | | to be issued upon | | exercise price of | | issuance under equity | |
| | | exercise of | | outstanding | | compensation plans | |
| | | outstanding options, | | options, warrants | | [excluding securities | |
| Plan Category | | warrants and rights | | and rights | | reflected in column (a)] | |
| | | (a) | | (b) | | (c) | |
| Equity compensation plans approved by QNB shareholders | | | | | | | |
| 1998 Stock Option Plan | | | 180,423 | | $ | 19.85 | | | 5,436 | |
| 2005 Stock Option Plan | | | 8,900 | | | 26.00 | | | 191,100 | |
| 2006 Employee Stock Purchase Plan | | | | | | | | | 18,422 | |
| Equity compensation plans not approved by QNB shareholders | | | | | | | | | | |
| None | | | — | | | | | | | |
| Totals | | | 189,323 | | $ | 20.14 | | | 214,958 | |
| ITEM 6. | SELECTED FINANCIAL AND OTHER DATA (in thousands, except share and per share data) |
|
Year Ended December 31, | | 2006 | | 2005 | | 2004 | | 2003 | | 2002 | |
| | | | | | | | | | | | |
Income and Expense | | | | | | | | | | | |
| Interest income | | $ | 32,002 | | $ | 28,272 | | $ | 25,571 | | $ | 25,139 | | $ | 27,191 | |
| Interest expense | | | 15,906 | | | 11,988 | | | 9,506 | | | 9,754 | | | 12,076 | |
| Net interest income | | | 16,096 | | | 16,284 | | | 16,065 | | | 15,385 | | | 15,115 | |
| Provision for loan losses | | | 345 | | | — | | | | | | | | | | |
| Non-interest income | | | 3,937 | | | 3,262 | | | 4,685 | | | 4,198 | | | 2,987 | |
| Non-interest expense | | | 13,234 | | | 13,102 | | | 12,843 | | | 12,681 | | | 11,943 | |
| Income before income taxes | | | 6,454 | | | 6,444 | | | 7,907 | | | 6,902 | | | 6,159 | |
| Provision for income taxes | | | 1,034 | | | 1,398 | | | 1,704 | | | 1,254 | | | 1,204 | |
| Net income | | $ | 5,420 | | $ | 5,046 | | $ | 6,203 | | $ | 5,648 | | $ | 4,955 | |
| | | | | | | | | | | | | | | | | |
Share and Per Share Data* | | | | | | | | | | | | | | | | |
| Net income - basic | | $ | 1.73 | | $ | 1.63 | | $ | 2.00 | | $ | 1.83 | | $ | 1.61 | |
| Net income - diluted | | | 1.71 | | | 1.59 | | | 1.95 | | | 1.79 | | | 1.59 | |
| Book value | | | 16.11 | | | 15.00 | | | 14.78 | | | 14.03 | | | 13.28 | |
| Cash dividends | | | .84 | | | .78 | | | .74 | | | .66 | | | .60 | |
| Average common shares outstanding - basic | | | 3,124,724 | | | 3,101,754 | | | 3,096,360 | | | 3,091,640 | | | 3,078,550 | |
| Average common shares outstanding - diluted | | | 3,176,710 | | | 3,174,647 | | | 3,178,152 | | | 3,153,305 | | | 3,109,353 | |
| | | | | | | | | | | | | | | | | |
Balance Sheet at Year-end | | | | | | | | | | | | | | | | |
| Investment securities available-for-sale | | $ | 219,818 | | $ | 233,275 | | $ | 267,561 | | $ | 260,631 | | $ | 211,156 | |
| Investment securities held-to-maturity | | | 5,021 | | | 5,897 | | | 6,203 | | | 12,012 | | | 29,736 | |
| Non-marketable equity securities | | | 3,465 | | | 3,684 | | | 3,947 | | | 3,810 | | | 3,585 | |
| Loans held-for-sale | | | 170 | | | 134 | | | 312 | | | 1,439 | | | 4,159 | |
| Loans, net of unearned income | | | 343,496 | | | 301,349 | | | 268,048 | | | 232,127 | | | 212,691 | |
| Other earning assets | | | 778 | | | 1,018 | | | 4,140 | | | 5,381 | | | 10,310 | |
| Total assets | | | 614,539 | | | 582,205 | | | 583,644 | | | 550,831 | | | 503,430 | |
| Deposits | | | 478,922 | | | 458,670 | | | 466,488 | | | 438,639 | | | 388,913 | |
| Borrowed funds | | | 82,113 | | | 74,596 | | | 68,374 | | | 65,416 | | | 69,485 | |
| Shareholders’ equity | | | 50,410 | | | 46,564 | | | 45,775 | | | 43,440 | | | 40,914 | |
| | | | | | | | | | | | | | | | | |
Selected Financial Ratios | | | | | | | | | | | | | | | | |
| Net interest margin | | | 3.12 | % | | 3.24 | % | | 3.32 | % | | 3.40 | % | | 3.68 | % |
| Net income as a percentage of: | | | | | | | | | | | | | | | | |
| Average total assets | | | .91 | | | .86 | | | 1.10 | | | 1.07 | | | 1.03 | |
| Average shareholders’ equity | | | 10.89 | | | 10.83 | | | 14.43 | | | 14.38 | | | 13.88 | |
| Average shareholders’ equity to average total assets | | | 8.37 | | | 7.98 | | | 7.64 | | | 7.46 | | | 7.45 | |
| Dividend payout ratio | | | 48.45 | | | 47.96 | | | 36.95 | | | 36.15 | | | 37.29 | |
| * | Adjusted for October 14, 2003 two-for-one stock split distributed |
| ITEM 7. | MANAGEMENT’S DISCUSSION AND ANALYSIS OF FINANCIAL CONDITION AND RESULTS OF OPERATIONS |
Results of Operations - Overview
QNB Corp. (QNB) earns its net income primarily, through its subsidiary, The Quakertown National Bank (the Bank). Net interest income, or the spread between the interest, dividends and fees earned on loans and investment securities and the expense incurred on deposits and other interest-bearing liabilities, is the primary source of operating income for QNB. QNB seeks to achieve sustainable and consistent earnings growth while maintaining adequate levels of capital and liquidity and limiting its exposure to credit and interest rate risk to Board of Directors approved levels. Due to its limited geographic area, comprised principally of upper Bucks, southern Lehigh and northern Montgomery counties, growth is pursued through expansion of existing customer relationships and building new relationships by stressing a consistent high level of service at all points of contact.
Net income for the year ended December 31, 2006 was $5,420,000, a 7.4 percent increase from the $5,046,000 earned in 2005. In 2004, QNB reported net income of $6,203,000. These results represent basic net income per share of $1.73, $1.63 and $2.00 for the years 2006, 2005 and 2004, respectively. On a diluted basis, net income per share was $1.71, $1.59 and $1.95 for the same three years, respectively.
The results for 2005 were significantly impacted by a $1,253,000 pre-tax unrealized loss as an other-than-temporary impairment charge related to certain Fannie Mae (FNMA) and Freddie Mac (FHLMC) preferred stock issues recorded in accordance with U.S. generally accepted accounting principles (GAAP). On an after-tax basis, the charge was approximately $1,017,000, or $.32 per share diluted.
Two important measures of profitability in the banking industry are an institution’s return on average assets and return on average shareholders’ equity. Return on average assets and return on average shareholders’ equity were .91 percent and 10.89 percent, respectively, in 2006, compared with .86 percent and 10.83 percent, respectively, in 2005 and 1.10 percent and 14.43 percent, respectively, in 2004.
2006 versus 2005
In addition to the impairment charge recorded in 2005 as described above, the results for 2006 compared with 2005 included the following significant components:
Net interest income decreased $188,000, or 1.2 percent to $16,096,000.
| | • | The Federal Reserve Bank Board raised the federal funds target rate 4 more times, taking the rate from 4.25 percent to 5.25 percent at June 30, 2006. The target rate stayed at 5.25 percent for the remainder of 2006. Short-term rates increased more than mid- and long-term interest rates, resulting in a further inversion of the yield curve. |
| | • | The net interest margin declined 12 basis points to 3.12 percent. The shape of the yield curve, as well as rate competition for loans and deposits resulted in the cost of funds increasing at a faster pace than the rates earned on loans and investment securities. The structure of QNB’s balance sheet, which is comprised primarily of fixed-rate investments and loans and funding sources with relatively short-term repricing characteristics also contributed to the decline in the net interest margin. |
| | • | A 2.5 percent increase in average earning assets, along with the continued shift in the balance sheet from lower yielding investment securities to higher yielding loans helped offset the decline in net interest income and the net interest margin. |
| | • | Contributing to the increase in average earning assets was QNB’s ability, at the end of the second quarter of 2006, to reclassify some of its deposits for reserve calculation purposes. This reclassification enabled QNB to reduce its reserve requirements at the Federal Reserve Bank by approximately $8,500,000. These funds went from a non-earning asset into federal funds sold and investment securities, thereby increasing interest income. |
| | • | The average balance of loans increased by 16.2 percent while average investment securities decreased by 12.7 percent. Average deposits increased by .1 percent, while average short-term borrowings, primarily commercial sweep accounts, increased $6,827,000, or 46.6 percent. From December 31, 2005 to December 31, 2006, total deposits increased 4.4 percent, reflecting strong growth in the fourth quarter of 2006. |
QNB recorded a provision for loan losses of $345,000, its first provision in six years.
| | • | While asset quality remains excellent, continued strong growth in the loan portfolio, combined with small increases in net charge-offs, non-accrual loans and delinquent loans prompted the increase in the allowance for loan losses through a charge to the provision for loan losses. |
| | • | Total non-performing loans were $425,000, or .12 percent of total loans, at December 31, 2006, compared with $14,000, or .005 percent of total loans at December 31, 2005. |
Non-interest income increased $675,000, or 20.7 percent, to $3,937,000.
| | • | QNB reported a net gain on the sale of investment securities of $262,000 in 2006, compared to net gains of $526,000 in 2005, excluding the impairment loss. Included in net gains in 2006 were net gains of $366,000 on the sale of equity securities from QNB’s portfolio and net losses of $104,000 from the sale of debt and equity securities at the Bank. During the fourth quarter of 2006, QNB repositioned the fixed-income investment portfolio by selling some lower-yielding securities at a loss of $250,000 and reinvesting those proceeds into higher-yielding investment securities. The purpose of these transactions was to increase interest income in the future and improve the cash flow structure of the investment portfolio, thereby strengthening the balance sheet. |
| | • | Non-interest income in 2005 included the $1,253,000 impairment charge discussed above. |
| | • | Non-interest income in 2005 included a $210,000 gain on the liquidation of assets relinquished by a borrower in 2004, $62,000 in life insurance proceeds and $45,000 in a sales tax refund. |
| | • | Net gains on the sale of loans decreased by $81,000, to $64,000, reflecting a slow down in residential mortgage activity as rates increased and the housing market softened. |
| | • | Debit card income continued its strong growth increasing $67,000, or 13.6 percent, to $560,000, in 2006. |
Non-interest expense increased $132,000, or 1.0 percent, to $13,234,000.
| | • | Salary expense increased $9,000, or .2 percent, in 2006 to $5,902,000. Included in salary expense in 2006 was $118,000 of stock option expense associated with the adoption of FASB No. 123R and $59,000 in incentive compensation, while 2005 salary expense included $106,000 of severance costs. There was no incentive compensation paid in 2005. Excluding the impact of the stock option expense and incentive compensation in 2006 and the severance costs in 2005, salary expense decreased $62,000, or 1.1 percent. The number of full-time equivalent employees decreased by four when comparing 2006 to 2005. |
| | • | Net occupancy and furniture and fixture expense decreased $72,000, or 3.2 percent, as higher utility costs, building repairs and maintenance expense, building taxes and equipment maintenance costs were offset by a decrease in depreciation and amortization expense on furniture and equipment. During 2006, QNB opened its new loan center. |
| | • | Marketing expense increased $52,000, or 8.7 percent, in 2006 with advertising expenditures increasing $35,000 and donations increasing $21,000. |
The effective tax rate for 2006 was 16.0 percent, compared with 21.7 percent for 2005.
| | • | Included in 2006 was the reversal of a $209,000 tax valuation allowance recorded in 2005 related to impaired securities. Excluding the impact of the valuation allowance in both years, the effective tax rates were 19.3 percent and 18.5 percent for 2006 and 2005, respectively. |
2005 versus 2004
In addition to the impairment charge described above, the 2005 results compared to 2004 included the following significant components:
Net interest income increased $219,000, or 1.4 percent, to $16,284,000.
| | • | Contributing to the increase in net interest income was a 4.0 percent increase in average earning assets. The average balance of loans increased by 11.3 percent while average investment securities decreased by 2.2 percent. |
| | • | From December 31, 2004 to December 31, 2005, total assets declined by .2 percent, to $582,205,000, with total loans increasing by 12.4 percent, or $33,301,000, and total investments decreasing by $34,592,000, or 12.6 percent. |
| | • | Increased competition for deposits resulted in higher rates paid to attract and retain customers. While average deposits increased $14,845,000, or 3.3 percent, during 2005, total deposits from December 31, 2004 to December 31, 2005 declined by $7,818,000, to $458,670,000, primarily due to the decision not to aggressively seek to retain the short-term deposits of a school district. |
| | • | The Federal Reserve Bank Board raised the federal funds rate from 2.25 percent to 4.25 percent during 2005. The yield curve flattened further and inverted at some points along the curve as short-term rates increased more than mid- and long-term interest rates. |
| | • | The shape of the yield curve, as well as the rate competition for loans and deposits, contributed to an 8 basis point decline in the net interest margin to 3.24 percent. |
Non-interest income decreased $1,423,000, or 30.4 percent, to $3,262,000. Absent the impairment write-down discussed above, non-interest income declined by $170,000, or 3.6 percent.
| | • | Fees for services to customers, primarily service charges on deposit accounts, decreased $149,000. This decrease includes a $54,000 decline in service charge income on non-interest bearing business checking accounts, a $32,000 decline from the elimination of a service charge on an interest-bearing checking account product and a $62,000 reduction in collected overdraft charges. |
| | • | Debit card income increased $61,000, or 14.1 percent, as a result of the increased reliance on the card as a means of paying for goods and services by both consumers and businesses. |
| | • | Excluding the impairment write-down, QNB reported a net gain on the sale of investment securities of $526,000 in 2005, compared to net gains of $849,000 in 2004. |
| | • | Non-interest income in 2005 included a $210,000 gain from the liquidation of assets relinquished by a borrower, compared with a $141,000 gain in 2004. |
Non-interest expense increased $259,000, or 2.0 percent, to $13,102,000.
| | • | Salary and benefit expense increased by $151,000. Excluding the impact of severance payments related to the reorganization of the lending department in 2005 and incentive compensation paid in 2004, salary expense increased by $250,000, or 4.5 percent. |
| | • | Net occupancy and furniture and fixture expense increased $100,000, or 4.6 percent, as a result of higher utility costs, building and equipment maintenance costs and real estate taxes. |
| | • | Marketing expense increased $42,000, or 7.5 percent, in 2005 as a result of the decision to increase QNB’s visibility through the use of billboards, television advertising and promotional giveaways. In addition, QNB increased the amount of its donations to not-for-profit organizations, clubs and community events. |
| | • | The effective tax rate was 21.7 percent for 2005, compared to 21.6 percent for 2004. In addition, during 2005, the Bank recorded a valuation allowance of $209,000. |
These items, as well as others, will be explained more thoroughly in the next sections.
Average Balances, Rates, and Interest Income and Expense Summary (Tax-Equivalent Basis)
| | | 2006 | | 2005 | | 2004 | |
| | | Average | | Average | | | | Average | | Average | | | | Average | | Average | | | |
| | | Balance | | Rate | | Interest | | Balance | | Rate | | Interest | | Balance | | Rate | | Interest | |
Assets |
| Federal funds sold | | $ | 6,915 | | | 5.17 | % | $ | 357 | | $ | 5,500 | | | 3.20 | % | $ | 176 | | $ | 6,834 | | | 1.37 | % | $ | 93 | |
| Investment securities: | | | | | | | | | | | | | | | | | | | | | | | | | | | | |
| U.S. Treasury | | | 5,856 | | | 3.95 | | | 231 | | | 6,169 | | | 2.29 | | | 141 | | | 6,536 | | | 1.97 | | | 129 | |
| U.S. Government agencies | | | 31,660 | | | 4.88 | | | 1,544 | | | 35,003 | | | 3.81 | | | 1,334 | | | 35,239 | | | 3.65 | | | 1,286 | |
| State and municipal | | | 43,425 | | | 6.62 | | | 2,874 | | | 52,641 | | | 6.50 | | | 3,423 | | | 51,548 | | | 6.54 | | | 3,369 | |
| Mortgage-backed and CMOs | | | 123,676 | | | 4.32 | | | 5,339 | | | 136,479 | | | 4.20 | | | 5,728 | | | 141,464 | | | 4.25 | | | 6,012 | |
| Other | | | 21,576 | | | 6.31 | | | 1,361 | | | 28,681 | | | 5.73 | | | 1,643 | | | 29,890 | | | 5.33 | | | 1,594 | |
| Total investment securities | | | 226,193 | | | 5.02 | | | 11,349 | | | 258,973 | | | 4.74 | | | 12,269 | | | 264,677 | | | 4.68 | | | 12,390 | |
| | | | | | | | | | | | | | | | | | | | | | | | | | | | | |
| Loans: | | | | | | | | | | | | | | | | | | | | | | | | | | | | |
| Commercial real estate | | | 144,519 | | | 6.58 | | | 9,512 | | | 125,623 | | | 6.20 | | | 7,794 | | | 114,804 | | | 5.88 | | | 6,748 | |
| Residential real estate* | | | 26,364 | | | 5.91 | | | 1,559 | | | 25,372 | | | 5.87 | | | 1,490 | | | 20,820 | | | 6.22 | | | 1,296 | |
| Home equity loans | | | 66,933 | | | 6.36 | | | 4,255 | | | 60,865 | | | 5.94 | | | 3,616 | | | 54,910 | | | 5.71 | | | 3,134 | |
| Commercial and industrial | | | 49,640 | | | 7.17 | | | 3,561 | | | 45,967 | | | 6.26 | | | 2,879 | | | 41,511 | | | 5.02 | | | 2,084 | |
| Indirect lease financing | | | 9,931 | | | 9.16 | | | 910 | | | 2,564 | | | 9.23 | | | 237 | | | — | | | | | | | |
| Consumer loans | | | 5,220 | | | 9.27 | | | 484 | | | 5,321 | | | 8.84 | | | 470 | | | 5,673 | | | 9.32 | | | 529 | |
| Tax-exempt loans | | | 21,114 | | | 5.86 | | | 1,237 | | | 12,839 | | | 5.34 | | | 685 | | | 12,627 | | | 5.23 | | | 661 | |
| Total loans, net of unearned income | | | 323,721 | | | 6.65 | | | 21,518 | | | 278,551 | | | 6.16 | | | 17,171 | | | 250,345 | | | 5.77 | | | 14,452 | |
| Other earning assets | | | 4,612 | | | 4.65 | | | 214 | | | 4,688 | | | 2.81 | | | 132 | | | 4,866 | | | 1.63 | | | 80 | |
| Total earning assets | | | 561,441 | | | 5.96 | | | 33,438 | | | 547,712 | | | 5.43 | | | 29,748 | | | 526,722 | | | 5.13 | | | 27,015 | |
| | | | | | | | | | | | | | | | | | | | | | | | | | | | | |
| Cash and due from banks | | | 15,606 | | | | | | | | | 19,476 | | | | | | | | | 20,074 | | | | | | | |
| Allowance for loan losses | | | (2,549 | ) | | | | | | | | (2,587 | ) | | | | | | | | (2,843 | ) | | | | | | |
| Other assets | | | 20,077 | | | | | | | | | 18,983 | | | | | | | | | 18,629 | | | | | | | |
| Total assets | | $ | 594,575 | | | | | | | | $ | 583,584 | | | | | | | | $ | 562,582 | | | | | | | |
| | | | | | | | | | | | | | | | | | | | | | | | | | | | | |
Liabilities and Shareholders’ Equity |
| | | | | | | | | | | | | | | | | | | | | | | | | | | | | |
| Interest-bearing deposits: | | | | | | | | | | | | | | | | | | | | | | | | | | | | |
| Interest-bearing demand | | $ | 100,973 | | | 2.30 | % | | 2,322 | | $ | 95,487 | | | 1.29 | % | | 1,229 | | $ | 100,684 | | | .68 | % | | 681 | |
| Money market | | | 50,800 | | | 2.92 | | | 1,484 | | | 52,080 | | | 1.76 | | | 917 | | | 44,364 | | | .99 | | | 441 | |
| Savings | | | 48,377 | | | .39 | | | 190 | | | 53,671 | | | .39 | | | 211 | | | 54,613 | | | .39 | | | 215 | |
| Time | | | 163,994 | | | 3.78 | | | 6,202 | | | 161,801 | | | 3.03 | | | 4,906 | | | 156,511 | | | 2.65 | | | 4,153 | |
| Time over $100,000 | | | 47,372 | | | 4.01 | | | 1,900 | | | 45,926 | | | 3.08 | | | 1,415 | | | 40,880 | | | 2.42 | | | 990 | |
| Total interest-bearing deposits | | | 411,516 | | | 2.94 | | | 12,098 | | | 408,965 | | | 2.12 | | | 8,678 | | | 397,052 | | | 1.63 | | | 6,480 | |
| Short-term borrowings | | | 21,473 | | | 3.43 | | | 736 | | | 14,646 | | | 2.21 | | | 323 | | | 11,938 | | | 1.03 | | | 124 | |
| Federal Home Loan Bank advances | | | 54,901 | | | 5.60 | | | 3,072 | | | 55,000 | | | 5.43 | | | 2,987 | | | 55,000 | | | 5.28 | | | 2,902 | |
| Total interest-bearing liabilities | | | 487,890 | | | 3.26 | | | 15,906 | | | 478,611 | | | 2.50 | | | 11,988 | | | 463,990 | | | 2.05 | | | 9,506 | |
| Non-interest bearing deposits | | | 53,696 | | | | | | | | | 55,623 | | | | | | | | | 52,691 | | | | | | | |
| Other liabilities | | | 3,229 | | | | | | | | | 2,770 | | | | | | | | | 2,926 | | | | | | | |
| Shareholders’ equity | | | 49,760 | | | | | | | | | 46,580 | | | | | | | | | 42,975 | | | | | | | |
| Total liabilities and shareholders’ equity | | $ | 594,575 | | | | | | | | $ | 583,584 | | | | | | | | $ | 562,582 | | | | | | | |
| Net interest rate spread | | | | | | 2.70 | % | | | | | | | | 2.93 | % | | | | | | | | 3.08 | % | | | |
| Margin/net interest income | | | | | | 3.12 | % | $ | 17,532 | | | | | | 3.24 | % | $ | 17,760 | | | | | | 3.32 | % | $ | 17,509 | |
| | | | | | | | | | | | | | | | | | | | | | | | | | | | |
Tax-exempt securities and loans were adjusted to a tax-equivalent basis and are based on the marginal Federal corporate tax rate of 34 percent.
Non-accrual loans are included in earning assets.
| * | Includes loans held-for-sale. |
Net Interest Income
The following table presents the adjustment to convert net interest income to net interest income on a fully taxable equivalent basis for the years ended December 31, 2006, 2005 and 2004.
Net Interest Income
| |
| December 31, | | 2006 | | 2005 | | 2004 | |
| Total interest income | | $ | 32,002 | | $ | 28,272 | | $ | 25,571 | |
| Total interest expense | | | 15,906 | | | 11,988 | | | 9,506 | |
| Net interest income | | | 16,096 | | | 16,284 | | �� | 16,065 | |
| Tax equivalent adjustment | | | 1,436 | | | 1,476 | | | 1,444 | |
| Net interest income (fully taxable equivalent) | | $ | 17,532 | | $ | 17,760 | | $ | 17,509 | |
| | | | | | | | | | | |
Net interest income is the primary source of operating income for QNB. Net interest income is interest income, dividends, and fees on earning assets, less interest expense incurred for funding sources. Earning assets primarily include loans, investment securities and federal funds sold. Sources used to fund these assets include deposits, borrowed funds and shareholders’ equity. Net interest income is affected by changes in interest rates, the volume and mix of earning assets and interest-bearing liabilities, and the amount of earning assets funded by non-interest bearing deposits.
| | | |
For purposes of this discussion, interest income and the average yield earned on loans and investment securities are adjusted to a tax-equivalent basis as detailed in the table that appears on page 16. This adjustment to interest income is made for analysis purposes only. Interest income is increased by the amount of savings of federal income taxes, which QNB realizes by investing in certain tax-exempt state and municipal securities and by making loans to certain tax-exempt organizations. In this way, the ultimate economic impact of earnings from various assets can be more easily compared. The net interest rate spread is the difference between average rates received on earning assets and average rates paid on interest-bearing liabilities, while the net interest margin includes interest-free sources of funds.
On a fully tax-equivalent basis, net interest income for 2006 declined $228,000, or 1.3 percent, to $17,532,000. Prior to 2006, the growth in earning assets over the past five years has offset the decline in the net interest margin. In 2006, the 2.5 percent increase in average earning assets could not offset the impact of the 12 basis point decrease in the net interest margin. The interest rate environment over the past two years resulting from both changes in the shape of the yield curve as well as the competitive environment for loans and deposits has negatively impacted net interest margins and earnings growth for many financial institutions, especially those which are heavily dependent on net interest income as their primary source of revenue. | |  |
| | | |
Over the past two years, short-term rates have increased to a much greater degree than mid- and long-term interest rates resulting in an inverted yield curve with short-term rates being higher than mid- and long-term rates. The inverted shape of the yield curve, along with the increased competition for deposits and loans, are two factors which have resulted in funding costs for deposits and borrowed money increasing to a greater degree than the rate earned on loans and investment securities. The structure of QNB’s balance sheet, which is comprised primarily of fixed-rate investments and loans and funding sources with relatively short-term repricing characteristics, also has contributed to the decline in the net interest margin. The continued shift in the balance sheet from lower yielding investment securities to higher yielding loans has helped to offset the decline in the margin resulting from higher funding costs.
The net interest margin decreased to 3.12 percent in 2006 from 3.24 percent in 2005, while the net interest rate spread decreased to 2.70 percent in 2006 from 2.93 percent in 2005.
The interest rate graph above shows the trend in market interest rates for the period 2004-2006.
During 2004, the Federal Reserve Board began tightening monetary policy after reducing rates to 40-year lows. Using a “measured pace” strategy of tightening, the Board raised the federal funds rate five times by 25 basis points, bringing the overnight rate to 2.25 percent at the end of the year. The 125 basis point increase in the federal funds rate was matched by a similar increase in the two-year Treasury bond between December 31, 2003 and December 31, 2004, while the ten-year bond fell by one basis point. During this time period, the yield curve began to flatten. Because deposits and borrowings tend to be priced off the short-end of the curve, while loans and investment securities tend to be priced off the mid- and long- term part of the curve financial institutions, including QNB, began to experience further net interest margin pressure.
The economy in 2005 was strong, with GDP growth of approximately 4.0 percent, steady employment growth and a confident consumer. However, there were several issues, including the impact of rapidly rising oil prices, the devastation caused by several hurricanes, the fear of inflation and a potential housing bubble that caused concern. The flattening of the yield curve continued during the year, including several points of inversion by the end of 2005. The Federal Reserve Board continued its “measured pace” strategy by raising the federal funds rate eight times, or 200 basis points, bringing the overnight rate to 4.25 percent at the end of 2005. As the federal funds rate increased, the increase in other short-term rates continued to outpace the increase in longer-term rates. The rates on the two-year Treasury bond increased by about 130 basis points, to 4.41 percent, while the ten-year rate only increased by 12 basis points, to 4.39 percent.
2006 was a year of unpredictability and an uncertain economic outlook. With a new Chairman in place, the Federal Reserve raised its target rate four more times by the end of June, bringing the federal funds rate to 5.25 percent, its current rate. Oil prices were volatile during the year, but ended 2006 about where they ended 2005. The housing market slowed significantly during 2006, but an increase in activity at the end of the year may be an indication that this sector may recover soon. Slower growth in GDP, along with the gradual easing of inflationary pressures has shifted the market sentiment that the next Federal Reserve move would be an easing of the federal funds rate, not a tightening. However, the timing of any drop in the rate is uncertain. The yield curve inversion which started at the end of 2005 worsened in 2006. While yields on maturities less than six months increased by almost 100 basis points, the yields on the two-year and ten-year Treasuries increased by only 41 basis points and 32 basis points, to close 2006 at 4.82 percent and 4.71 percent, respectively. The current inversion cycle is passing historic averages for duration and nearing historic extremes for slope.
The Rate-Volume Analysis table, as presented on a tax-equivalent basis on page 19, highlights the impact of changing rates and volumes on total interest income and interest expense. Total interest income increased $3,690,000, or 12.4 percent, in 2006, to $33,438,000. The increase in interest income was a result of an increase in average earning assets, the shift in the mix of earning assets from investment securities to loans, as well as the impact of the rate increases discussed above. The increases in interest income attributable to volume and rate were $1,296,000 and $2,394,000, respectively. The yield on earning assets on a tax-equivalent basis was 5.96 percent for 2006, compared to 5.43 percent for 2005. Contributing to the increase in average earning assets and interest income was QNB’s ability, at the end of the second quarter of 2006, to reclassify some of its deposits for reserve calculation purposes. This reclassification enabled QNB to reduce its reserve requirements at the Federal Reserve Bank by approximately $8,500,000. These funds went from a non-earning asset into federal funds sold and investment securities, thereby increasing interest income.
Interest income on federal funds sold increased $181,000 with higher interest rates accounting for $136,000 of the increase. The average yield on federal funds sold increased from 3.20 percent for 2005 to 5.17 percent for 2006.
Interest income on investment securities decreased $920,000 for 2006, as average balances decreased $32,780,000, or 12.7 percent, resulting in a reduction in interest income of $1,678,000. Partially offsetting the impact of lower volumes on interest income was an increase in the average yield on the portfolio. The average yield earned on the portfolio increased 28 basis points, to 5.02 percent, for 2006 contributing an additional $758,000 in interest income. QNB purchased very few securities in the normal course of business over the past two years, a period of increased interest rates, because of the strong growth in loans. Most of the increase in the yield on the portfolio has been the result of either purchase and sale transactions performed by management whereby lower yielding securities were sold at a loss with the proceeds reinvested in higher yielding securities or through the sale, maturity or repayment of lower yielding securities with the proceeds used to fund loan growth. The purpose of the purchase and sale transactions was to increase net interest income in the future as well as to reposition the cash flow from the portfolio. During 2006, QNB sold its holdings of agency perpetual preferred securities that had been impaired in 2005 as well as its holdings of corporate bonds in the automotive sector. These sales had a negative impact on the yield of the portfolio since these bonds had a weighted average yield of 6.04 percent but the sale of these securities removed some credit risk from the portfolio. Management will continue to look at trades that will enhance the structure and yield of the investment portfolio.
Interest income on loans increased $4,347,000, or 25.3 percent, to $21,518,000 while the yield on loans improved 49 basis points, to 6.65 percent. The impact of higher interest rates produced an increase in interest income from loans of $1,415,000, while a 16.2 percent increase in average balances resulted in an increase in interest income of $2,932,000. The portfolio of commercial loans secured by real estate contributed the largest increase with volume related income increasing $1,172,000 and rate related income increasing $546,000. Average loans in this category increased 15.0 percent while the average yield on the portfolio increased 38 basis points, to 6.58 percent. Income from commercial and industrial loans increased $682,000 with volume growth accounting for $230,000 of the increase and rate contributing $452,000. The yield on commercial and industrial loans increased from 6.26 percent in 2005 to 7.17 percent in 2006. The majority of commercial and industrial loans have adjustable-rates or floating-rates indexed to prime, and therefore benefited from the increase in interest rates during 2005 and 2006. The average prime rate for 2006 was 7.96 percent, an increase of 177 basis points from the average for 2005.
Tax-exempt loan income increased $552,000 with an increase in average balances contributing $441,000. The average balance of tax-exempt loans increased $8,275,000 when comparing the two years. A loan to a school district accounted for approximately $5,700,000 of the average balance increase. The yield on tax-exempt loans increased from 5.34 percent for 2005 to 5.86 percent for 2006. The impact of both the origination of new loans at higher rates along with the repricing of existing loans at higher rates contributed to this increase in yield. Income from indirect lease financing receivables increased $673,000 with volume accounting for the entire increase. QNB began purchasing these loans during the second quarter of 2005. Average balances increased from $2,564,000 for 2005 to $9,931,000 for 2006, while the average yield declined from 9.23 percent to 9.16 percent during the same time period.
Rate-Volume Analysis of Changes in Net Interest Income (Tax-Equivalent Basis)
| |
| | | 2006 vs. 2005 | | 2005 vs. 2004 | |
| | | | | | | | | | | | | | |
| | | Change due to | | | | Total | | Change due to | | | | Total | |
| | | Volume | | Rate | | Change | | Volume | | Rate | | Change | |
| Interest income: | | | | | | | | | | | | | |
| Federal funds sold | | $ | 45 | | $ | 136 | | $ | 181 | | $ | (18 | ) | $ | 101 | | $ | 83 | |
| Investment securities available-for-sale: | | | | | | | | | | | | | | | | | | | |
| U.S. Treasury | | | (7 | ) | | 97 | | | 90 | | | (7 | ) | | 19 | | | 12 | |
| U.S. Government agencies | | | (127 | ) | | 337 | | | 210 | | | (9 | ) | | 57 | | | 48 | |
| State and municipal | | | (599 | ) | | 50 | | | (549 | ) | | 72 (18 | ) | | 54 | | | | |
| Mortgage-backed and CMOs | | | (538 | ) | | 149 | | | (389 | ) | | (212 | ) | | (72 | ) | | (284 | ) |
| Other | | | (407 | ) | | 125 | | | (282 | ) | | (65 | ) | | 114 | | | 49 | |
| Loans: | | | | | | | | | | | | | | | | | | | |
| Commercial real estate | | | 1,172 | | | 546 | | | 1,718 | | | 636 | | | 410 | | | 1,046 | |
| Residential real estate | | | 58 | | | 11 | | | 69 | | | 283 | | | (89 | ) | | 194 | |
| Home equity loans | | | 360 | | | 279 | | | 639 | | | 340 | | | 142 | | | 482 | |
| Commercial and industrial | | | 230 | | | 452 | | | 682 | | | 224 | | | 571 | | | 795 | |
| Indirect lease financing | | | 680 | | | (7 | ) | | 673 | | | 237 | | | — | | | 237 | |
| Consumer loans | | | (9 | ) | | 23 | | | 14 | | | (33 | ) | | (26 | ) | | (59 | ) |
| Tax-exempt loans | | | 441 | | | 111 | | | 552 | | | 11 | | | 13 | | | 24 | |
| Other earning assets | | | (3 | ) | | 85 | | | 82 | | | (3 | ) | | 55 | | | 52 | |
| Total interest income | | | 1,296 | | | 2,394 | | | 3,690 | | | 1,456 | | | 1,277 | | | 2,733 | |
| Interest expense: | | | | | | | | | | | | | | | | | | | |
| Interest-bearing demand | | | 70 | | | 1,023 | | | 1,093 | | | (35 | ) | | 583 | | | 548 | |
| Money market | | | (23 | ) | | 590 | | | 567 | | | 77 | | | 399 | | | 476 | |
| Savings | | | (21 | ) | | — | | | (21 | ) | | (4 | ) | | — | | | (4 | ) |
| Time | | | 67 | | | 1,229 | | | 1,296 | | | 140 | | | 613 | | | 753 | |
| Time over $100,000 | | | 44 | | | 441 | | | 485 | | | 122 | | | 303 | | | 425 | |
| Short-term borrowings | | | 151 | | | 262 | | | 413 | | | 28 | | | 171 | | | 199 | |
| Federal Home Loan Bank advances | | | (6 | ) | | 91 | | | 85 | | | — | | | 85 | | | 85 | |
| Total interest expense | | | 282 | | | 3,636 | | | 3,918 | | | 328 | | | 2,154 | | | 2,482 | |
| Net interest income | | $ | 1,014 | | $ | (1,242 | ) | $ | (228 | ) | $ | 1,128 | | $ | (877 | ) | $ | 251 | |
| | | | | | | | | | | | | | | | | | | | |
Income from residential mortgage loans increased $69,000 while income from home equity loans increased $639,000. Residential mortgage origination slowed considerably during 2006 as the housing market softened due to rising interest rates and stabilization of home values. However, home equity loan activity remained strong. Average home equity loans increased $6,068,000, or 10.0 percent, in 2006 while the average rate earned increased from 5.94 percent to 6.36 percent. Home equity loans tend to be less costly to the consumer to originate than mortgage loans. In addition, consumers who had refinanced their mortgages when rates were at historic lows did not want to lose that low rate by refinancing again and opted to borrow using home equity loans. Some of the increase in the yield on home equity loans relates to home equity lines of credit which are indexed to prime. As the prime rate increased many borrowers paid off their floating rate lines with fixed rate home equity loans at lower rates.
While total interest income increased $3,690,000 or 12.4 percent, in 2006, total interest expense increased $3,918,000, or 32.7 percent, to $15,906,000. The impact of higher interest rates contributed $3,636,000 of the total increase in interest expense. The rate paid on total interest-bearing liabilities increased to 3.26 percent in 2006 from 2.50 percent in 2005, while the rate paid on interest-bearing deposit accounts increased to 2.94 percent in 2006 from 2.12 percent in 2005. Interest expense on interest-bearing demand accounts increased $1,093,000 with higher rates accounting for $1,023,000 of that increase. The average rate paid on these accounts increased 101 basis points from 1.29 percent to 2.30 percent. Approximately 45.5 percent of the average balances of interest-bearing demand accounts for 2006 were municipal and school district deposits compared with 38.6 percent in 2005. The rates paid on these accounts are generally indexed to the federal funds rate so the rate paid on these accounts has increased as the federal funds rate has increased over the past two years.
Interest expense on money market accounts increased $567,000, and the rate paid increased from 1.76 percent in 2005 to 2.92 percent in 2006. The increase in the rate paid was primarily the result of the majority of money market balances being in QNB’s Treasury Select product which carries a rate indexed to a percentage of the 91-day Treasury bill rate based on balances in the account. The rate on this product has increased as short-term interest rates have increased. In addition, in response to competition, QNB promoted a 4.00 percent minimum rate on this product for new accounts with balances over $10,000 or for existing accounts with additional deposits of $5,000. This 4.00 percent promotional rate was offered for most of 2006 and was above the calculated rate under the terms of this product. In 2007, the Treasury Select money market account was changed to the Select money market account and the rate on this product will no longer be indexed to the 91-day Treasury bill but will be determined by QNB.
Interest expense on time deposits increased $1,781,000, with the impact of higher rates paid on time deposits contributing $1,670,000 of the increase. The average rate paid on time deposits increased from 3.04 percent in 2005 to 3.83 percent in 2006. Like fixed-rate loans and investment securities, time deposits reprice over time and, therefore, have less of an immediate impact on costs in either a rising or falling rate environment. Unlike loans and investment securities, the maturity and repricing characteristics tend to be shorter. With interest rates increasing over the past two years, customers have opted for shorter maturity time deposits. Approximately 69.3 percent of time deposits at December 31, 2006 will reprice or mature during 2007. This compares to 45.4 percent of time deposits that were scheduled to mature or reprice at December 31, 2005.
As mentioned previously, the competition for deposits and especially time deposits led to significantly higher rates paid on these products. Like other financial institutions, QNB, as a result of consumer demand and the need to retain deposits, offered relatively short maturity time deposits at attractive rates. Most consumers were looking for short maturity time deposits in anticipation of short-term rates continuing to increase. It was very common to see time deposit promotions with maturities less than one year at yields between 5.10 percent and 5.50 percent. Given the short-term nature of QNB’s time deposits and the current rates being offered, both the average rate paid and total interest expense on time deposits will likely increase in 2007.
Interest expense on short-term borrowings increased $413,000 in 2006, to $736,000. Both higher rates and an increase in balances resulted in the increase in interest expense. The average rate paid on short-term borrowings increased from 2.21 percent in 2005 to 3.43 percent in 2006. Average short-term borrowings, mostly repurchase agreements (a sweep product for commercial customers), increased from $14,646,000 in 2005 to $21,473,000 in 2006.
When comparing 2005 to 2004, net interest income on a fully tax-equivalent basis increased $251,000, or 1.4 percent, to $17,760,000. The increase in net interest income was the result of the growth in average deposits and the investment of these deposits into profitable loans. Average earning assets increased 4.0 percent in 2005, while the net interest margin and net interest spread declined by 8 basis points and 15 basis points, respectively. The net interest rate margin decreased to 3.24 percent in 2005 from 3.32 percent in 2004, while the net interest rate spread decreased to 2.93 percent in 2005 from 3.08 percent in 2004.
Total interest income increased $2,733,000, or 10.1 percent, in 2005, to $29,748,000. The increase in interest income was a result of an increase in earning assets and improving yields. The increase in interest income attributable to volume was $1,456,000, while the increase related to improving yields was $1,277,000. The yield on earning assets on a tax-equivalent basis was 5.43 percent for 2005 compared to 5.13 percent for 2004.
Interest income on investment securities decreased $121,000 for 2005, as average balances decreased 2.2 percent. The impact of lower volumes was offset by an increase in the average yield on the portfolio. The average yield earned increased 6 basis points to 4.74 percent for 2005.
Interest income on loans increased by $2,719,000 in 2005, with the yield on loans increasing 39 basis points, to 6.16 percent. The impact of higher interest rates produced an increase in interest income from loans of $1,021,000, while an 11.3 percent increase in average balances resulted in an increase in interest income of $1,698,000. The volume increase in loans was centered primarily in commercial and industrial loans and home equity loans, many of which are indexed to the prime rate.
Total interest expense increased $2,482,000, or 26.1 percent, in 2005 to $11,988,000. The impact of higher interest rates contributed $2,154,000 of the total increase in interest expense. Volume growth resulted in interest expense increasing by $328,000.
The average rate paid on total interest-bearing liabilities increased to 2.50 percent in 2005 from 2.05 percent in 2004. The rate paid on interest-bearing deposit accounts increased to 2.12 percent in 2005 from 1.63 percent in 2004. Higher rates paid on interest-bearing deposits, money market accounts and time deposits increased interest expense by $583,000, $399,000 and $916,000, respectively, in 2005. The average rate paid on these accounts increased 61 basis points, 77 basis points and 43 basis points, respectively.
Management expects 2007 will be another challenging year with respect to net interest income and the net interest margin. The extremely competitive environment for loans and deposits, as well as the inverted yield curve, is expected to continue. These factors combined with QNB’s current interest rate sensitivity position which has funding sources repricing more quickly than earning assets will likely put more pressure on the net interest margin. However, QNB’s anticipated ability to continue to successfully increase loan balances is expected to have a positive impact on the net interest margin and interest income as loans tend to earn a higher yield than investment securities.
Provision For Loan Losses
The provision for loan losses represents management’s determination of the amount necessary to be charged to operations to bring the allowance for loan losses to a level that represents management’s best estimate of the known and inherent losses in the loan portfolio. Actual loan losses, net of recoveries, serve to reduce the allowance. While QNB’s asset quality remains strong, increases in loan charge-offs, non-performing loans and delinquent loans combined with the strong growth in the loan portfolio necessitated an increase in the allowance for loan losses through a charge to the provision for loan losses. In 2006, QNB recorded a provision for loan losses of $345,000, the first provision expense since 1999. Continued strong growth in the portfolio or deterioration in credit quality could result in an increase in the provision in 2007.
Non-Interest Income
QNB, through its core banking business, generates various fees and service charges. Total non-interest income is composed of service charges on deposit accounts, ATM and check card income, income on bank-owned life insurance, mortgage servicing fees, gains or losses on the sale of investment securities, gains on the sale of residential mortgage loans, and other miscellaneous fee income.
Total non-interest income was $3,937,000 in 2006, compared to $3,262,000 in 2005, an increase of 20.7 percent. Excluding the gains and losses on investment securities, loans, and repossessed assets in both years, non-interest income declined $23,000, or .6 percent. Included in securities losses in 2005 was a $1,253,000 other-than-temporary impairment pre-tax loss related to certain Fannie Mae (FNMA) and Freddie Mac (FHLMC) preferred stock issues. In addition, other operating income in 2005 included a $210,000 gain on the liquidation of assets relinquished by a borrower in 2004, $62,000 in life insurance proceeds and a $45,000 sales tax refund, all non-core operating activities.
When comparing 2005 to 2004, non-interest income decreased 30.4 percent, from $4,685,000 to $3,262,000. Adjusting for the same items noted above non-interest income increased $93,000, or 2.6 percent, when comparing 2005 to 2004.
Fees for services to customers, the largest component of non-interest income, are primarily comprised of service charges on deposit accounts. These fees increased $16,000, or .9 percent, during 2006, to $1,867,000. Overdraft income increased $63,000 as a result of an increase in the volume of overdrafts. This additional income helped offset a decline in fee income on business checking accounts and internet bill pay. Fees on business checking accounts declined by $32,000, while internet bill pay income declined by $19,000 when comparing 2006 to 2005. The decline in business checking account fees reflects the impact of a higher earnings credit rate, resulting from the increases in short-term interest rates. These credits are applied against service charges incurred. The decrease in internet bill pay fees reflects a decision by QNB to eliminate the fee it charged retail customers for the use of internet bill pay during the fourth quarter of 2005.
When comparing 2005 to 2004, fees for services to customers decreased $149,000, or 7.5 percent, to $1,851,000 in 2005. Contributing to the decline in fee income in 2005 was a $54,000 reduction in service charge income on non-interest bearing business checking accounts resulting from a higher earnings credit rate as discussed above. Also, negatively impacting service charge income was the elimination of the monthly fee on an interest-bearing checking account product that resulted in the reduction in fee income of approximately $32,000 in 2005. Fees, primarily overdraft related, that were waived or charged-off as uncollectible, increased 28.9 percent and accounted for $65,000 of the total decrease in service charge income between 2004 and 2005.
ATM and debit card income is primarily comprised of income on debit cards, pin-based transactions and ATM surcharge income for the use of QNB’s ATM machines by non-QNB customers. ATM and debit card income was $772,000 for 2006, an increase of $85,000, or 12.4 percent, from the amount recorded in 2005. This followed an increase of $89,000, or 14.9 percent, between 2004 and 2005. Debit card income increased $67,000, or 13.6 percent, to $560,000, in 2006. Debit card income was $493,000 in 2005 and $432,000 in 2004. The increase in debit card income was a result of increased reliance on the card as a means of paying for goods and services by both consumers and business cardholders. An increase in pin-based transactions resulted in additional interchange income of $23,000 when comparing 2006 to 2005. This followed an increase of $34,000 in interchange income between 2004 and 2005. Partially offsetting these positive variances was a reduction in ATM surcharge income of $5,000 between 2005 and 2006 and $8,000 between 2004 and 2005. The proliferation of ATM machines, as well as the ability to get cash back during a pin-based transaction, has likely contributed to the decline in the number of transactions by non-QNB customers at QNB’s ATM machines.
Income on bank-owned life insurance represents the earnings on life insurance policies in which the Bank is the beneficiary. The earnings on these policies were $291,000, $288,000 and $300,000 for 2006, 2005 and 2004, respectively. The insurance carriers reset the rates on these policies annually taking into consideration the interest rate environment as well as mortality costs. The decline in income between 2004 and 2005 reflects the lower interest rate environment at the time of reset. The existing policies have rate floors which minimizes how low the earnings rate can go. Some of these policies are currently at their floor.
When QNB sells its residential mortgages in the secondary market, it retains servicing rights. A normal servicing fee is retained on all loans sold and serviced. QNB recognizes its obligation to service financial assets that are retained in a transfer of assets in the form of a servicing asset. The servicing asset is amortized in proportion to and over the period of net servicing income or loss. Servicing assets are assessed for impairment based on their fair value. Mortgage servicing fees were $98,000 in 2006, compared to $90,000 in 2005 and $112,000 in 2004. Included in mortgage servicing income in 2005 and 2004 were positive fair market value adjustments of $5,000 and $26,000, respectively. Positively impacting mortgage servicing income over the period was a reduction in amortization expense. Amortization expense related to the mortgage servicing asset was $87,000 in 2006, $109,000 in 2005 and $122,000 in 2004. The higher amortization expense in 2005 and 2004 was a result of early payoffs of mortgage loans through refinancing. As mortgage interest rates have increased, refinancing activity has slowed dramatically. The slowdown in mortgage activity has also had a negative impact on the average balance of mortgages sold and serviced as well as the fee income generated from these loans. The average balance of mortgages serviced for others was $73,478,000 for 2006 compared to $77,461,000 and $82,577,000 for 2005 and 2004, respectively. The timing of mortgage payments and delinquencies also impacts the amount of servicing fees recorded. For additional information on intangible assets see Note 8 of the Notes to Consolidated Financial Statements included as Item 8 of this Report.
The fixed-income securities portfolio represents a significant portion of QNB’s earning assets and is also a primary tool in liquidity and asset/liability management. QNB actively manages its fixed-income portfolio in an effort to take advantage of changes in the shape of the yield curve, changes in spread relationships in different sectors and for liquidity purposes, as needed. Management continually reviews strategies that will result in an increase in the yield or improvement in the structure of the investment portfolio.
QNB recorded a net gain on investment securities of $262,000 in 2006. Included in this amount were net gains of $366,000 on the sale of equity securities from the Corp.’s portfolio and net losses of $104,000 from the sale of debt and equity securities at the Bank. During the first quarter of 2006, QNB entered into several liquidity transactions through the sale of investment securities to fund the strong growth in loans. In addition, the Bank sold its preferred stock holdings and recorded a gain of $451,000 on the carrying value of those issues that had previously been impaired and a $300,000 loss on one issue that was not impaired in 2005. During the fourth quarter of 2006, QNB repositioned the fixed-income investment portfolio by selling some lower-yielding securities at a loss of $250,000 and reinvesting those proceeds into higher-yielding investment securities. The purpose of these transactions was to increase interest income in the future and improve the cash flow structure of the investment portfolio, thereby strengthening the balance sheet.
QNB recorded a net loss on investment securities of $727,000 in 2005. Included in this loss was the $1,253,000 write-down of the perpetual preferred stock of FNMA and FHLMC. During 2005, QNB realized net gains of $376,000 on the sale of equity securities. In the fixed-income portfolio, QNB recorded net gains, excluding the impairment loss of $150,000 during 2005.
QNB recorded a net gain on investment securities of $849,000 in 2004. Included in this amount are net gains of $613,000 on the sale of equity securities and $236,000 in net gains from the fixed-income security portfolio.
The net gain on the sale of residential mortgage loans was $64,000, $145,000 and $154,000 in 2006, 2005 and 2004, respectively. Residential mortgage loans to be sold are identified at origination. The net gain on residential mortgage sales is directly related to the volume of mortgages sold and the timing of the sales relative to the interest rate environment. The decline in mortgage gains over the three year period reflects the impact of rising interest rates which has reduced both the volume of origination and sales activity and the amount of gains recorded at the time of sale. Included in the gains on the sale of residential mortgages in 2006, 2005 and 2004 were $31,000, $80,000 and $66,000, respectively, related to the recognition of mortgage servicing assets. Proceeds from the sale of residential mortgages were $4,129,000, $11,004,000 and $9,162,000, respectively, during these same years. The lower amount of gains in 2005 compared with 2004, despite the higher volume sold, reflects the impact of selling into a rising interest rate environment. QNB expects mortgage activity to remain slow in 2007 due to a continued soft residential real estate market.
Other operating income was $583,000, $928,000 and $672,000 in 2006, 2005 and 2004, respectively. When comparing 2006 to 2005 and 2005 to 2004, the non-core items recorded in 2005 and mentioned earlier account for $317,000 of the changes. Also contributing to the decline between 2005 and 2006 was a $35,000 reduction in trust income, a $43,000 reduction in retail brokerage income and a $20,000 reduction in income from QNB’s membership in Laurel Abstract Company LLC, a title insurance company. QNB discontinued offering traditional trust services at the end of 2005. The decline in retail brokerage income primarily relates to sales staffing issues while the decline in title insurance income relates to the slowdown in mortgage activity. Partially offsetting the decline in 2006 was an increase in official check income of $20,000 and an increase of $25,000 in merchant income. The increase in official check income relates to higher short-term interest rates, while the growth in merchant income is a result of an increase in the transaction volume of QNB’s merchant customers.
| | | | | | | | | Change from Prior Year | |
Non-Interest Income Comparison | 2006 | | 2005 | |
| | | 2006 | | 2005 | | 2004 | | Amount | | Percent | | Amount | | Percent | |
| Fees for services to customers | | $ | 1,867 | | $ | 1,851 | | $ | 2,000 | | $ | 16 .9 | % | $ | (149 | ) | | (7.5 | )% | | | |
| ATM and debit card income | | | 772 | | | 687 | | | 598 | | | 85 | | | 12.4 | | | 89 | | | 14.9 | |
| Income on bank-owned life insurance | | | 291 | | | 288 | | | 300 | | | 3 | | | 1.0 | | | (12 | ) | | (4.0 | ) |
| Mortgage servicing fees | | | 98 | | | 90 | | | 112 | | | 8 | | | 8.9 | | | (22 | ) | | (19.6 | ) |
| Net (loss) gain on investment securities | | | 262 | | | (727 | ) | | 849 | | | 989 | | | (136.0 | ) | | (1,576 | ) | | (185.6 | ) |
| Net gain on sale of loans | | | 64 | | | 145 | | | 154 | | | (81 | ) | | (55.9 | ) | | (9 | ) | | (5.8 | ) |
| Other operating income | | | 583 | | | 928 | | | 672 | | | (345 | ) | | (37.2 | ) | | 256 | | | 38.1 | |
| Total | | $ | 3,937 | | $ | 3,262 | | $ | 4,685 | | $ | 675 | | | 20.7 | % | $ | (1,423 | ) | | (30.4 | )% |
Non-Interest Expense
Non-interest expense is comprised of costs related to salaries and employee benefits, net occupancy, furniture and equipment, marketing, third party services and various other operating expenses. Total non-interest expense in 2006 increased $132,000, or 1.0 percent, to $13,234,000, following an increase in non-interest expense of $259,000, or 2.0 percent, between 2004 and 2005. QNB’s overhead efficiency ratio, which represents non-interest expense divided by net operating revenue on a tax-equivalent basis, improved from approximately 62.3 percent in 2005 to 61.6 percent in 2006. The efficiency ratio in 2004 was 57.9 percent. The difficulty in improving this ratio stems not from the ability to control expense growth, but from the difficulty in increasing revenue growth as a result of the pressure on the net interest margin and net interest income.
Salaries and benefits expense is the largest component of non-interest expense. Salaries and benefits expense for 2006 was $7,320,000, an increase of $6,000, or .1 percent, over 2005. Salary expense increased $9,000, or .2 percent, in 2006 to $5,902,000. Included in salary expense in 2006 was $118,000 of stock option expense associated with the adoption of FASB No. 123R and $59,000 in incentive compensation, while in 2005 salary expense included $106,000 of severance costs. There was no incentive compensation paid in 2005. Excluding the impact of the stock option expense and incentive compensation in 2006 and the severance costs in 2005, salary expense decreased $62,000, or 1.1 percent. The number of full-time equivalent employees decreased by four when comparing 2006 to 2005. QNB monitors, through the use of various surveys, the competitive salary information in its markets and makes adjustments where appropriate.
Benefits expense decreased by $3,000, or .2 percent, to $1,418,000 in 2006. Medical and dental costs, net of employee contributions for cost sharing, increased $2,000, or .4 percent, as the general increase in health care costs were offset by a reduction in the number of participants. State unemployment taxes decreased $6,000 when comparing 2006 to 2005.
| | |
Salaries and benefits expense for 2005 was $7,314,000, an increase of $151,000, or 2.1 percent, over 2004. Salary expense increased $146,000, or 2.5 percent, in 2005, to $5,893,000. In addition to the severance costs noted above in 2005, 2004 salary expense included $210,000 of incentive compensation expense. The Bank’s incentive compensation plan provides for the sharing with all employees, excluding senior management, of incremental income above a Board determined level. This plan resulted in a payout of $119,000, or 2.7 percent of eligible salary, in 2004. Senior management has a separate incentive compensation arrangement based on growth in earnings per share. Salary expense, excluding the severance and incentive payments, increased $250,000, or 4.5 percent, when comparing 2005 to 2004. Benefits expense increased by $5,000, or .4 percent, to $1,421,000 in 2005. Medical premiums increased $68,000, or 10.0 percent, as a result of the general increase in medical insurance costs, while costs associated with QNB’s retirement plans increased $18,000, or 4.5 percent. These increases were offset by a decrease in dental premiums of $41,000 due to the Bank’s decision to partially self-insure for dental costs and a $38,000 increase in employee contributions to cost sharing for medical and dental premiums. Net occupancy expense for 2006 was $1,161,000, an increase of $61,000, or 5.5 percent, from the amount reported in 2005. An increase in gas, oil and electric costs resulted in an increase in utility expense of $15,000, or 8.1 percent, in 2006. Repairs and maintenance to existing facilities contributed an additional $20,000 to net occupancy expense in 2006. Also, contributing to the increase in net occupancy was higher costs related to depreciation, taxes, and branch rent expense. Some of these increases were a result of the renovation and opening of the loan center in June 2006. Net occupancy expense for 2005 was $1,100,000, an increase of $87,000, or 8.6 percent, from the amount reported in 2004. An increase in utility costs of $33,000, or 21.7 percent, and building repairs and maintenance costs of $19,000 were the largest contributors to the increase in net occupancy expense in 2005. Also contributing to the increase in net occupancy expense were higher costs related to depreciation, taxes, and rent expense. The addition of a supermarket branch, which opened late June 2004 and the purchase in July of 2004 of a building now used as a loan center, contributed to these increases in net occupancy expense. | | 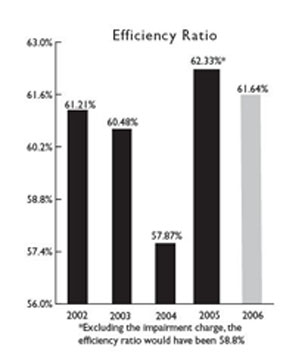 |
Furniture and equipment expense for 2006 was $1,026,000, a decrease of $133,000, or 11.5 percent, from the amount reported in 2005. Depreciation on furniture and equipment and amortization of computer software decreased $69,000 and $91,000, respectively. Hardware and software associated with the Bank’s core computer system acquired in 2000 became fully depreciated in 2005. The rate of decline in depreciation and amortization expense slowed throughout 2006 as some hardware associated with the computer system was replaced during the year and fixed assets associated with the loan center were acquired and put into service. Partially offsetting these savings were higher costs associated with equipment repairs and maintenance contracts.
Marketing expense increased $52,000, or 8.7 percent, in 2006, to $651,000. This followed a $42,000, or 7.5 percent, increase between 2004 and 2005. Advertising expense increased $35,000 between 2005 and 2006 and $20,000 between 2004 and 2005. QNB has made a strategic decision to increase its visibility in the communities it serves through increased use of billboards, television advertising and promotional giveaways to increase both product and brand recognition. In addition, donations increased $21,000 when comparing 2006 and 2005 and $17,000 when comparing 2005 and 2004. QNB contributes to many not-for-profit organizations, clubs and community events in the local communities it serves.
Third party services are comprised of professional services including legal, accounting and auditing, and consulting services, as well as fees paid to outside vendors for support services of day-to-day operations. These support services include correspondent banking services, statement printing and mailing, investment security safekeeping and supply management services. Third party services expense was $724,000 in 2006, compared to $701,000 in 2005 and $680,000 in 2004. The increase in costs between 2005 and 2006 relates to a $35,000 increase in legal expense, resulting principally from special projects. In addition, with the elimination of the fee charged to customers for the use of internet bill pay services, QNB has experienced rapid growth in this service. As a result, the fees paid to the vendor who processes these payments have increased by $15,000. Offsetting these increases was savings of $13,000 related to payments to a third party vendor for trust services. QNB stopped offering trust services at the end of 2005. In addition, costs paid to correspondent banks decreased by $19,000, primarily a result of a higher earnings credit rate used to offset charges.
The increase in third party costs between 2004 and 2005, primarily relates to the use of consultants for entrance into the indirect equipment leasing business and strategic planning, as well as increased internal and external auditing costs stemming from the internal control requirements of the Sarbanes-Oxley Act. The impact of these increases was partially offset by a reduction in expenses to a marketing firm that provided benefits to certain QNB deposit customers. This contract ended in October 2004. These cost savings of $54,000 offset the loss of fee income described in the fees for services to customers.
Telephone, postage and supplies expense increased $49,000, or 10.0 percent, to $537,000 in 2006. This followed a 6.3 percent decline in 2005. When comparing 2006 to 2005, postage expense increased $14,000, or 7.4 percent, reflecting an increase in both the volume of mailings, primarily statements and promotional pieces, as well as the cost per mailing as the U.S. Postal service raised rates effective January 2006. Supplies expense increased $28,000, or 16.8 percent, when comparing the two years. Contributing to this increase were costs for ATM and debit cards and costs related to supplies for the new loan center.
When comparing 2005 to 2004, postage expense increased $23,000 reflecting an increase in the volume of mail. This was offset by lower telephone expense and supplies expense of $37,000 and $17,000, respectively. The reduction in telephone expense primarily relates to refunds of overcharges incurred in late 2004 as well as costs incurred in 2004 related to an additional line and costs associated with the new branch.
State tax expense represents the payment of the Pennsylvania Shares Tax, which is based primarily on the equity of the Bank, Pennsylvania sales and use tax and the Pennsylvania capital stock tax. State tax expense was $453,000, $423,000 and $375,000 for the years 2006, 2005 and 2004, respectively. The Pennsylvania Shares Tax increased $36,000 in each of the three years, reflecting higher equity levels. The Pennsylvania Shares Tax for 2006 was $433,000. The capital stock tax decreased $7,000 when comparing 2006 to 2005 and increased $14,000 when comparing 2005 to 2004.
| | | | | | | | | Change from Prior Year | |
Non-Interest Expense Comparison | 2006 | | 2005 | |
| | 2006 | | 2005 | | 2004 | | Amount | | Percent | | Amount | | Percent | |
| Salaries and employee benefits | | $ | 7,320 | | $ | 7,314 | | $ | 7,163 | | $ | 6 | | | .1 | % | $ | 151 | | | 2.1 | % |
| Net occupancy expense | | | 1,161 | | | 1,100 | | | 1,013 | | | 61 | | | 5.5 | | | 87 | | | 8.6 | |
| Furniture and equipment expense | | | 1,026 | | | 1,159 | | | 1,146 | | | (133 | ) | | (11.5 | ) | | 13 | | | 1.1 | |
| Marketing expense | | | 651 | | | 599 | | | 557 | | | 52 | | | 8.7 | | | 42 | | | 7.5 | |
| Third party services | | | 724 | | | 701 | | | 680 | | | 23 | | | 3.3 | | | 21 | | | 3.1 | |
| Telephone, postage and supplies | | | 537 | | | 488 | | | 521 | | | 49 | | | 10.0 | | | (33 | ) | | (6.3 | ) |
| State taxes | | | 7.1 | | | 453 | | | 423 | | | 375 | | | 30 | | | 48 | | | 12.8 | |
| Other expense | | | 1,362 | | | 1,318 | | | 1,388 | | | 44 | | | 3.3 | | | (70 | ) | | (5.0 | ) |
| Total | | $ | 13,234 | | $ | 13,102 | | $ | 12,843 | | $ | 132 | | | 1.0 | % | $ | 259 | | | 2.0 | % |
Income Taxes
Applicable income taxes and effective tax rates were $1,034,000, or 16.0 percent, for 2006 compared to $1,398,000, or 21.7 percent, for 2005, and $1,704,000, or 21.6 percent, for 2004. The lower effective tax rate in 2006 compared to both 2005 and 2004 was primarily the result of the reversal of the $209,000 valuation allowance, established in 2005. This valuation allowance was initially recorded in connection with the recognition of the impairment of equity security values, while the reversal was the ability to recognize tax benefits due to realized and unrealized capital gains in the equity portfolio. For a more comprehensive analysis of income tax expense and deferred taxes, refer to Note 12 in the Notes to Consolidated Financial Statements.
Financial Condition
Financial service organizations are challenged to demonstrate they can generate sustainable and consistent earnings growth in an increasingly competitive environment. Managing the balance sheet in this extremely competitive business environment, along with the interest rate environment of the past several years, has been a major challenge. The flattening of the yield curve that began in 2004, as the Federal Reserve began to raise short-term interest rates, continued into 2005, with the yield curve inverting at points late in the year. This yield curve inversion continued throughout 2006 as the Federal Reserve raised interest rates four more times through June 2006. After its seventeenth consecutive 25 basis point increase in June, the Federal Reserve held at its target rate of 5.25 percent. As of the end of 2006, the current inversion cycle was passing historical averages for duration and nearing historical extremes for slope. As mentioned earlier, this phenomenon has resulted in funding costs increasing more than the yield on earning assets, thereby reducing the net interest margin. This phenomenon also has resulted in a change in balance sheet structure as deposit customers have opted for higher paying money market accounts and short-term time deposits over longer maturity time deposits and lower costing savings accounts. On the loan side, customers have shifted their preferences to fixed-rate loans over variable- or adjustable-rate loans.
QNB operates in an attractive, but highly competitive, market for financial services. QNB’s “Sincere Interest in Your Success”operating motto is achieved by offering a broad range of high quality financial products and services. QNB has established internal standards of service excellence and trains all employees on those standards so the customer experiences a consistently high level of service at all points of contact with the Bank.
The financial services market in which QNB operates continues to change. In addition to competition from other local community banks and regional and nationwide financial institutions moving into QNB’s market area, other forms of competition have emerged, such as internet banks. The internet has enabled customers to “rate shop” financial institutions throughout the nation. Deposit growth remained a challenge in 2006 as the stock market continued to perform well and the pricing of deposits became more competitive, with many institutions offering high short-term promotional rates. QNB will continue to price its deposits competitively, but attempt to do so in a manner that will minimize the negative impact on the net interest margin. Loan growth has been strong but the price competition for loans has increased as well. The multiple increases in the prime rate over the past two years has resulted in an increased demand for fixed-rate loans over floating- or adjustable-rate loans, thereby minimizing the potential positive impact of the increase in short-term rates.
Total assets at year-end 2006 were $614,539,000, compared with $582,205,000 at December 31, 2005, an increase of $32,334,000, or 5.6 percent. This followed a slight decline during 2005 of .2 percent. Average total assets increased 1.9 percent, or $10,991,000, in 2006 to $594,575,000, and 3.7 percent, or $21,002,000, in 2005. The stronger year-end over year-end growth when comparing 2006 to 2005 versus the average growth rate reflects the amount of funding growth that occurred at the end of 2006. Funding sources, which include deposits and borrowed money, increased 6.4 percent from year-end 2005 to year-end 2006. This followed a decrease of .3 percent from year-end 2004 to year-end 2005. The deposit growth at the end of 2006 was a result of both aggressive deposit promotion in the fourth quarter as well as large temporary funding from business customers. Some of this temporary funding was withdrawn early in 2007. A significant portion of the funding growth in 2006 was in the form of repurchase agreements included in short-term borrowings which represent deposit sweep products for commercial customers. Average funding sources increased 1.4 percent in 2006 and 3.4 percent in 2005.
This growth in deposits and short-term borrowings along with the proceeds from the investment portfolio helped fund the growth in the loan portfolio. Total loans increased $42,147,000 or 14.0 percent during 2006. This followed growth of 12.4 percent and 15.5 percent in 2005 and 2006, respectively. Average total loans increased 16.2 percent in 2006 compared to 11.3 percent in 2005 and 8.6 percent in 2004.
The following discussion will further detail QNB’s financial condition during 2006 and 2005.
Investment Securities and Other Short-Term Investments
Total investment securities at December 31, 2006 and 2005 were $224,839,000 and $239,172,000, respectively. For the same periods, approximately 69.9 percent and 62.8 percent, respectively, of QNB’s investment securities were either U.S. Government, U.S. Government agency debt securities, U.S. Government agency issued mortgage-backed securities or collateralized mortgage obligation securities (CMOs). As of December 31, 2006, QNB held no securities of any one issue or any one issuer (excluding the U.S. Government and its agencies) that were in excess of 10 percent of shareholders’ equity.
As mentioned previously, the proceeds from the investment portfolio sales were primarily used to fund loan growth and deposit withdrawals in 2005 and 2006. The 6.0 percent decrease in the balance of the portfolio between 2005 and 2006 followed a 12.6 percent decrease between 2004 and 2005. Average investment securities decreased $32,780,000, or 12.7 percent, to $226,193,000 in 2006, compared with a $5,704,000, or 2.2 percent, decrease in 2005. The differences in the percentage change when comparing average balances to year-end balances was a function of timing. A significant portion of the loan growth as well as the deposit withdrawals occurred in the third and fourth quarters of 2005 and the first quarter of 2006.
QNB had federal funds sold of $11,664,000 at December 31, 2006. There were no federal funds sold at December 31, 2005. Average federal funds sold increased $1,415,000, or 25.7 percent, to $6,915,000, in 2006, compared to a $1,334,000, or 19.5 percent, decrease in average federal funds sold in 2005. The higher level of federal funds sold in 2006 reflects QNB’s desire to have more liquidity in light of the increase in short-term deposits and repurchase agreements and the potential for loan growth. In addition, with federal funds earning approximately 5.25 percent, there was not much additional benefit from investing in securities.
In light of the fact that QNB’s investment portfolio represents a significant portion of earning assets and interest income, QNB actively manages the portfolio in an attempt to maximize earnings, while considering liquidity needs and interest rate risk. During the first quarter of 2006, QNB entered into several liquidity transactions through the sale of investment securities to fund the strong growth in loans. One such trade involved the sale of $7,000,000 of tax-exempt municipal securities at a yield of 5.53 percent. The proceeds were used to fund a tax-exempt loan to a school district at a yield of 5.61 percent. In addition, to the slight improvement in yield, the average life of the loan is about half the average life of the municipal securities. Also during 2006, QNB sold its preferred stock holdings, including those that were written down as impaired, and its holdings of corporate bonds in the automobile sector, thereby improving the credit quality of the portfolio. During the fourth quarter of 2006, QNB repositioned the fixed-income investment portfolio by selling some lower-yielding securities at a loss of $250,000 and reinvesting those proceeds into higher-yielding investment securities. The purpose of these transactions was to increase interest income in the future and improve the cash flow structure of the investment portfolio, thereby strengthening the balance sheet.
Proceeds from the sale of investments were $46,490,000 in 2006 compared to $45,105,000 and $66,715,000 during 2005 and 2004, respectively. In addition, proceeds from maturities, calls and prepayments of securities were $25,465,000 in 2006, compared with $37,020,000 and $61,145,000, respectively, in 2005 and 2004. These proceeds were used to purchase $57,069,000 in securities during 2006, an increase of 8.8 percent from the $52,442,000 purchased in 2005 and a decline of 56.4 percent from the $130,878,000 purchased in 2004. Approximately $8,500,000 of the purchases in 2006 was a result of QNB’s ability to reclassify some of its deposits for reserve calculation purposes. This reclassification enabled QNB to reduce its reserve requirements at the Federal Reserve Bank and convert a non-earning asset into an investment security, thereby increasing interest income.
As a result of the aforementioned transactions, the composition of the portfolio changed significantly between December 31, 2005 and December 31, 2006. U.S. Government agency securities and mortgage-backed securities increased to 14.8 percent and 30.0 percent, respectively, of the portfolio from 10.0 percent and 24.1 percent, respectively, of the portfolio, while tax-exempt state and municipal securities and CMOs decreased to 18.3 percent and 26.3 percent, respectively, of the portfolio from 22.3 percent and 29.9 percent, respectively, of the portfolio. Other debt, which includes corporate bonds and pooled trust preferred securities, and equity securities decreased to 8.4 percent of the portfolio at December 31, 2006 from 11.2 percent of the portfolio at December 31, 2005.
Investment Portfolio History
| |
| December 31, | | 2006 | | 2005 | | 2004 | |
| Investment Securities Available-for-Sale | | | | | | | |
| U.S. Treasuries | | $ | 4,984 | | $ | 6,002 | | $ | 6,114 | |
| U.S. Government agencies | | | 33,244 | | | 23,824 | | | 46,478 | |
| State and municipal securities | | | 36,121 | | | 47,530 | | | 45,992 | |
| Mortgage-backed securities | | | 67,471 | | | 57,733 | | | 67,510 | |
| Collateralized mortgage obligations (CMOs) | | | 59,033 | | | 71,475 | | | 70,789 | |
| Other debt securities | | | 14,373 | | | 18,252 | | | 21,972 | |
| Equity securities | | | 4,592 | | | 8,459 | | | 8,706 | |
| Total investment securities available-for-sale | | $ | 219,818 | | $ | 233,275 | | $ | 267,561 | |
| Investment Securities Held-to-Maturity | | | | | | | | | | |
| State and municipal securities | | $ | 5,021 | | $ | 5,897 | | $ | 6,203 | |
| Total investment securities held-to-maturity | | $ | 5,021 | | $ | 5,897 | | $ | 6,203 | |
| Total investment securities | | $ | 224,839 | | $ | 239,172 | | $ | 273,764 | |
Investment Portfolio Weighted Average Yields
| |
| | Under | | 1-5 | | 5-10 | | Over 10 | | | |
| December 31, 2006 | | 1 Year | | Years | | Years | | Years | | Total | |
| Investment Securities Available-for-Sale | | | | | | | | | | | |
| U.S. Treasuries: | | | | | | | | | | | |
| Fair value | | $ | 4,484 | | $ | 500 | | | — | | | — | | $ | 4,984 | |
| Weighted average yield | | | 4.66 | % | | 4.63 | % | | — | | | — | | | 4.66 | % |
| U.S. Government agencies: | | | | | | | | | | | | | | | | |
| Fair value | | | — | | $ | 12,972 | | $ | 20,272 | | | — | | $ | 33,244 | |
| Weighted average yield | | | — | | | 5.35 | % | | 5.58 | % | | — | | | 5.49 | % |
| State and municipal securities: | | | | | | | | | | | | | | | | |
| Fair value | | $ | 572 | | $ | 5,447 | | $ | 15,204 | | $ | 14,898 | | $ | 36,121 | |
| Weighted average yield | | | 9.70 | % | | 4.53 | % | | 6.69 | % | | 6.36 | % | | 6.26 | % |
| Mortgage-backed securities: | | | | | | | | | | | | | | | | |
| Fair value | | | — | | $ | 48,732 | | $ | 18,739 | | | — | | $ | 67,471 | |
| Weighted average yield | | | — | | | 4.76 | % | | 5.40 | % | | — | | | 4.94 | % |
| Collateralized mortgage obligations (CMOs): | | | | | | | | | | | | | | | | |
| Fair value | | $ | 5,969 | | $ | 51,984 | | $ | 1,080 | | | — | | $ | 59,033 | |
| Weighted average yield | | | 4.45 | % | | 4.18 | % | | 3.84 | % | | — | | | 4.20 | % |
| Other debt securities: | | | | | | | | | | | | | | | | |
| Fair value | | $ | 3,824 | | $ | 9,518 | | $ | 1,031 | | | — | | $ | 14,373 | |
| Weighted average yield | | | 7.42 | % | | 6.93 | % | | 9.04 | % | | — | | | 7.20 | % |
| Equity securities: | | | | | | | | | | | | | | | | |
| Fair value | | | — | | | — | | | — | | $ | 4,592 | | $ | 4,592 | |
| Weighted average yield | | | — | | | — | | | — | | | 2.45 | % | | 2.45 | % |
| Total fair value | | $ | 14,849 | | $ | 129,153 | | $ | 56,326 | | $ | 19,490 | | $ | 219,818 | |
| Weighted average yield | | | 5.48 | % | | 4.72 | % | | 5.83 | % | | 5.50 | % | | 5.12 | % |
| Investment Securities Held-to-Maturity | | | | | | | | | | | | | | | | |
| State and municipal securities: | | | | | | | | | | | | | | | | |
| Amortized cost | | $ | 636 | | $ | 563 | | $ | 759 | | $ | 3,063 | | $ | 5,021 | |
| Weighted average yield | | | 7.30 | % | | 6.26 | % | | 6.67 | % | | 6.93 | % | | 6.86 | % |
Securities are assigned to categories based on stated contractual maturity except for mortgage-backed securities and CMOs which are based on anticipated payment periods. See interest rate sensitivity section for practical payment and repricing characteristics. Tax-exempt securities were adjusted to a tax-equivalent basis and are based on the marginal federal corporate tax rate of 34 percent and a Tax Equity and Financial Responsibility Act (TEFRA) adjustment of .20 percent. Weighted average yields on investment securities available-for-sale are based on historical cost.
Management anticipates minimal purchases in the investment portfolio during 2007 given the expectation that loan growth will outpace deposit growth, resulting in less funds to invest in securities. Based on projections, QNB estimates that approximately $37,000,000 of investment securities at a book yield of 4.76 percent will be available from cash flow from the portfolio for reinvestment in either loans or securities. Based on current interest rates, reinvestment of these funds should be into higher yielding investment securities or loans.
At December 31, 2006 and 2005, investment securities totaling $75,793,000 and $68,917,000, respectively, were pledged as collateral for repurchase agreements and public deposits. The increase in pledged balances was a result of the increase in repurchase agreement balances.
QNB accounts for its investments by classifying its securities into three categories. Securities that QNB has the positive intent and ability to hold to maturity are classified as held-to-maturity securities and reported at amortized cost. Debt and equity securities that are bought and held principally for the purpose of selling them in the near term are classified as trading securities and reported at fair value, with unrealized gains and losses included in earnings. Debt and equity securities not classified as either held-to-maturity securities or trading securities are classified as available-for-sale securities and reported at fair value, with unrealized gains and losses, net of tax, excluded from earnings and reported as a separate component of shareholders’ equity. Management determines the appropriate classification of securities at the time of purchase. QNB held no trading securities at December 31, 2006 or 2005.
Investments Available-For-Sale
Available-for-sale investment securities include securities that management intends to use as part of its liquidity and asset/liability management strategy. These securities may be sold in response to changes in market interest rates, related changes in the securities prepayment risk or in response to the need for liquidity. At December 31, 2006, the fair value of investment securities available-for-sale was $219,818,000, or $1,235,000 below the amortized cost of $221,053,000. This compared to a fair value of $233,275,000, or $1,912,000 below the amortized cost of $235,187,000, at December 31, 2005. An unrealized holding loss of $815,000 was recorded as a decrease to shareholders’ equity as of December 31, 2006, while an unrealized holding loss of $1,262,000 was recorded as a decrease to shareholders’ equity as of December 31, 2005. The available-for-sale portfolio, excluding equity securities, had a weighted average maturity of approximately 4 years, 1 month at December 31, 2006 and 4 years, 5 months at December 31, 2005. The weighted average tax-equivalent yield was 5.12 percent and 4.87 percent at December 31, 2006 and 2005, respectively.
The weighted average maturity is based on the stated contractual maturity or likely call date of all securities except for mortgage-backed securities and CMOs, which are based on estimated average life. The maturity of the portfolio could be shorter if interest rates would decline and prepayments on mortgage-backed securities and CMOs increase or if more securities are called. However, the estimated average life could be longer if rates were to increase and principal payments on mortgage-backed securities and CMOs would slow or bonds anticipated to be called are not called. The interest rate sensitivity analysis on page 38 reflects the repricing term of the securities portfolio based upon estimated call dates and anticipated cash flows assuming an unchanged, as well as a simulated, interest rate environment.
Investments Held-To-Maturity
Investment securities held-to-maturity are recorded at amortized cost. Included in this portfolio are state and municipal securities. At December 31, 2006 and 2005, the amortized cost of investment securities held-to-maturity was $5,021,000 and $5,897,000, respectively, and the fair value was $5,168,000 and $6,082,000, respectively. The held-to-maturity portfolio had a weighted average maturity of approximately 3 years, 11 months at December 31, 2006, and 3 years, 10 months at December 31, 2005. The weighted average tax-equivalent yield was 6.86 percent and 6.78 percent at December 31, 2006 and 2005, respectively.
Loans
QNB’s primary business is to accept deposits and to make loans to meet the credit needs of the communities it serves. Loans are the most significant component of earning assets. Inherent within the lending function is the evaluation and acceptance of credit risk and interest rate risk, along with the opportunity cost of alternative deployment of funds. QNB manages credit risk associated with its lending activities through portfolio diversification, underwriting policies and procedures and loan monitoring practices.
| | | |
 | | QNB has comprehensive policies and procedures that define and govern commercial loan, retail loan and indirect lease financing originations and the management of risk. All loans are underwritten in a manner that emphasizes the borrowers’ capacity to pay. The measurement of capacity to pay delineates the potential risk of non-payment or default. The higher potential for default determines the need for and amount of collateral required. QNB makes unsecured loans when the capacity to pay is considered substantial. As capacity lessens, collateral is required to provide a secondary source of repayment and to mitigate the risk of loss. Various policies and procedures provide guidance to the lenders on such factors as amount, terms, price, maturity and appropriate collateral levels. Each risk factor is considered critical to ensuring that QNB receives an adequate return for the risk undertaken, and that the risk of loss is minimized. QNB manages the risk associated with commercial loans, which generally have balances larger than retail loans, by having lenders work in tandem with credit analysts while maintaining independence between personnel. In addition, a Bank loan committee and a committee of the Board of Directors review and approve certain loan requests on a weekly basis. At December 31, 2006, there were no concentrations of loans exceeding 10 percent of total loans other than disclosed in the table on page 29. QNB’s commercial lending activity is focused on small businesses within the local community. Commercial and industrial loans represent commercial purpose loans that are either secured by collateral other than real estate or unsecured. Tax-exempt loans to qualified municipalities, school districts, and other not-for-profit entities, not secured by real estate, are also classified as commercial and industrial loans. Real estate commercial loans include commercial purpose loans collateralized at least in part by commercial real estate. These loans may not be for the express purpose of conducting commercial real estate transactions. Real estate residential loans include loans secured by one-to-four family units. These loans include fixed-rate home equity loans, floating rate home equity lines of credit, loans to individuals for residential mortgages, and commercial investment purpose loans. Indirect lease financing receivables represent loans to small businesses that are collateralized by equipment. These loans are originated by a third party and purchased by QNB based on criteria specified by QNB. The criteria include minimum credit scores of the borrower, term of the lease, type and age of equipment financed and geographic area. The geographic area primarily represents states contiguous to Pennsylvania. QNB is not the lessor and does not service these loans. |
Loan Portfolio |
| December 31, | | 2006 | | 2005 | | 2004 | | 2003 | | 2002 | |
| Commercial and industrial | | $ | 72,718 | | $ | 64,812 | | $ | 57,372 | | $ | 47,210 | | $ | 39,722 | |
| Construction | | | 10,503 | | | 7,229 | | | 7,027 | | | 9,056 | | | 7,687 | |
| Real estate-commercial | | | 118,166 | | | 104,793 | | | 98,397 | | | 86,707 | | | 74,125 | |
| Real estate-residential | | | 123,531 | | | 112,920 | | | 99,893 | | | 83,703 | | | 84,907 | |
| Consumer | | | 5,044 | | | 5,080 | | | 5,376 | | | 5,604 | | | 6,513 | |
| Indirect lease financing | | | 13,405 | | | 6,451 | | | — | | | — | | | — | |
| Total loans | | | 343,367 | | | 301,285 | | | 268,065 | | | 232,280 | | | 212,954 | |
| Unearned costs (income) | | | 129 | | | 64 | | | (17 | ) | | (153 | ) | | (263 | ) |
| Total loans, net of unearned costs (income) | | $ | 343,496 | | $ | 301,349 | | $ | 268,048 | | $ | 232,127 | | $ | 212,691 | |
Loan Maturities and Interest Sensitivity |
| | | Under | | 1-5 | | Over | | | |
| December 31, 2006 | | 1 Year | | Years | | 5 Years | | Total | |
| Commercial and industrial | | $ | 2,940 | | $ | 49,103 | | $ | 20,675 | | $ | 72,718 | |
| Construction | | | 5,867 | | | 2,276 | | | 2,360 | | | 10,503 | |
| Real estate-commercial | | | 3,135 | | | 8,797 | | | 106,234 | | | 118,166 | |
| Real estate-residential | | | 9,633 | | | 13,160 | | | 100,738 | | | 123,531 | |
| Consumer | | | 869 | | | 3,869 | | | 306 | | | 5,044 | |
| Indirect lease financing | | | 84 | | | 13,292 | | | 29 | | | 13,405 | |
| Total | | $ | 22,528 | | $ | 90,497 | | $ | 230,342 | | $ | 343,367 | |
Demand loans, loans having no stated schedule of repayment and no stated maturity, are included in under one year.
The following shows the amount of loans due after one year that have fixed, variable or adjustable interest rates at December 31, 2006:
| Loans with fixed predetermined interest rates | | $ | 122,377 | |
| Loans with variable or adjustable interest rates | | $ | 198,462 | |
Substantially all originations of loans to individuals for residential mortgages with maturities of 20 years or greater are sold in the secondary market. At December 31, 2006 and 2005, real estate residential loans held-for-sale were $170,000 and $134,000, respectively. These loans are carried at the lower of aggregate cost or market.
Total loans, excluding loans held-for-sale, at December 31, 2006 were $343,496,000, an increase of $42,147,000, or 14.0 percent, from December 31, 2005. This followed a $33,301,000, or 12.4 percent, increase from December 31, 2004 to December 31, 2005. Average total loans increased 16.2 percent in 2006 and 11.3 percent in 2005. This loan growth was achieved despite the extremely competitive environment for both commercial and consumer loans. A key financial ratio is the loan to deposit ratio. With the strong growth in loans in 2006 this ratio improved to 71.7 percent at December 31, 2006, compared with 65.7 percent, at December 31, 2005. At December 31, 2001, the loan to deposit ratio was 54.7 percent. Despite the improvement in this ratio over the past five years, it remains below the local peer group. Continued loan growth remains one of the primary goals of QNB in 2007.
The Allowance for Loan Loss Allocation table on page 31 shows the percentage composition of the loan portfolio. Despite the significant growth in the loan portfolio, the composition of the portfolio remained relatively unchanged from December 31, 2005. Real estate loans secured by residential properties continued to be the largest sector representing 36.0 percent of the portfolio at December 31, 2006, down slightly from 37.5 percent at December 31, 2005. Real estate loans secured by residential properties increased $10,611,000, or 9.4 percent, to $123,531,000 at December 31, 2006. Included in this increase were home equity loan balances which increased $5,274,000, or 8.3 percent, with fixed-rate term loans increasing $7,974,000 and variable-rate home equity lines declining $2,700,000. Home equity loans, both term loans and lines, have been popular with consumers because they typically have lower origination costs than residential mortgage loans. In addition, rates on fixed-rate home equity loans have increased only marginally because mid-term and longer-term interest rates have not increased significantly and competition for these types of loans remains strong. As the prime rate has increased from 4.00 percent to 8.25 percent, customers have refinanced their variable-rate home equity lines of credit into fixed-rate term loans. Residential mortgage loans increased $579,000, to $27,035,000, at December 31, 2006. With the increase in interest rates over the past two years and the softening of the housing market residential mortgage origination has slowed considerably. The remaining $4,758,000 of growth in this category relates to commercial purpose loans that are secured by residential real estate.
Loans secured by commercial real estate, while still the second largest sector of the portfolio, declined to 34.4 percent of the portfolio at year-end 2006, from 34.8 percent at year-end 2005. Loans secured by commercial real estate increased by $13,373,000, or 12.8 percent, to $118,166,000 at December 31, 2006, following a 6.5 percent increase between December 31, 2004 and 2005. While loans secured by commercial real estate represent a significant portion of the total portfolio, the collateral is diversified including investment properties, manufacturing facilities, office buildings, warehouses and owner occupied facilities.
The commercial and industrial loan category continued to experience strong growth, increasing $7,906,000, or 12.2 percent, to end the year 2006 at $72,718,000. This followed growth of 13.0 percent in 2005. Most of the growth in this category during 2006 can be attributed to a $6,600,000 tax-exempt loan to a school district. Although a certain number of commercial and industrial loans are considered unsecured, the majority are secured by non-real estate collateral such as equipment, vehicles, accounts receivable and inventory.
At December 31, 2006, indirect lease financing receivables represent approximately 3.9 percent of the portfolio compared to 2.1 percent of the portfolio at December 31, 2005. QNB began purchasing these receivables during the second quarter of 2005. Total balances at December 31, 2006 and 2005 were $13,405,000 and $6,451,000, respectively. These loans tend to have slightly higher risk characteristics but generally provide higher returns and have maturities with full payout in three to five years.
Construction loans increased $3,274,000, to $10,503,000, at December 31, 2006 and represented approximately 3.0 percent of the loan portfolio. These loans are to developers and builders for the construction of residential units or commercial buildings or to individuals for construction of their homes. Construction loans are generally made only on projects that have township approval. These loans usually have short maturities and are paid off through a commercial or residential mortgage after construction is complete.
Over the past year the repricing and maturity characteristics of the loan portfolio have changed. Loans that mature or reprice over five years increased from $198,481,000, or 65.9 percent of the portfolio, at December 31, 2005, to $230,342,000, or 67.1 percent of the portfolio, at December 31, 2006. In addition, loans with fixed interest rates due after one year increased to $122,377,000, or 38.1 percent of the portfolio, at December 31, 2006 from $96,676,000, or 34.6 percent of the portfolio, at December 31, 2005. These changes reflect customers’ demand for longer term fixed rate loans given the current interest rate environment. This analysis does not consider cash flow or prepayments of these loans. The interest rate sensitivity analysis on page 38 reflects the anticipated cash flows assuming an unchanged, as well as a simulated, interest rate environment.
Non-Performing Assets
Non-performing assets include accruing loans past due 90 days or more, non-accruing loans, restructured loans, other real estate owned and other repossessed assets. The chart on page 31 shows the history of non-performing assets over the past five years. Total non-performing assets were $466,000 at December 31, 2006, or .08 percent, of total assets which represents an increase from the December 31, 2005 balance of $14,000. Non-performing assets at December 31, 2005 represented .002 percent of total assets. Non-performing assets as a percent of total assets remain at low levels both historically and compared to peer groups.
Non-accrual loans are those on which the accrual of interest has ceased. Commercial loans and indirect financing leases are placed on non-accrual status immediately if, in the opinion of management, collection is doubtful, or when principal or interest is past due 90 days or more and collateral is insufficient to protect principal and interest. Consumer loans are not automatically placed on non-accrual status when principal or interest payments are 90 days past due, but are charged-off when deemed uncollectible or, in most instances, after reaching 120 days past due. Included in the loan portfolio are loans on non-accrual status of $416,000 at December 31, 2006. There were no loans on non-accrual status at December 31, 2005. Included in the balance of non-accrual loans at December 31, 2006, was an indirect financing lease of $290,000 which was subsequently paid off in January 2007 by the originator.
There were no restructured loans as of December 31, 2006 or 2005, as defined in the Financial Accounting Standards Board Statement No. 15, “Accounting by Debtors and Creditors for Troubled Debt Restructurings,” that have not already been included in loans past due 90 days or more or in non-accrual loans. There was no other real estate owned as of December 31, 2006 or 2005. Repossessed assets at December 31, 2006 amounted to $41,000 and included equipment or vehicles related to the lease portfolio. There were no repossessed assets as of December 31, 2005.
Loans not included in past due, non-accrual or restructured categories, but where known information about possible credit problems causes management to be uncertain as to the ability of the borrowers to comply with the present loan repayment terms, totaled $1,609,000 and $2,634,000 at December 31, 2006 and 2005, respectively.
| Non-Performing Assets |
| December 31, | | 2006 | | 2005 | | 2004 | | 2003 | | 2002 | |
| Loans past due 90 days or more not on non-accrual status | | | | | | | | | | | |
| Commercial and industrial | | $ | | | $ | | | $ | | | $ | | | $ | | |
| Construction | | | | | | | | | | | | | | | | |
| Real estate-commercial | | | | | | | | | | | | | | | | |
| Real estate-residential | | | 5 | | | | | | 68 | | | | | | | |
| Consumer | | | 4 | | | 14 | | | 28 | | | 11 | | | 7 | |
| Indirect lease financing | | | | | | | | | | | | | | | | |
| Total loans past due 90 days or more and accruing | | | 9 | | | 14 | | | 96 | | | 11 | | | 7 | |
| | | | | | | | | | | | | | | | | |
| Loans accounted for on a non-accrual basis | | | | | | | | | | | | | | | | |
| Commercial and industrial | | | | | | | | | 372 | | | 392 | | | | |
| Construction | | | | | | | | | | | | | | | | |
| Real estate-commercial | | | 113 | | | | | | | | | 17 | | | | |
| Real estate-residential | | | 13 | | | | | | | | | 409 | | | 650 | |
| Consumer | | | | | | | | | 1 | | | | | | | |
| Indirect lease financing | | | 290 | | | | | | | | | | | | | |
| Total non-accrual loans | | | 416 | | | | | | 373 | | | 818 | | | 650 | |
| | | | | | | | | | | | | | | | | |
| Other real estate owned | | | | | | | | | | | | | | | | |
| Repossessed assets | | | 41 | | | | | | | | | | | | 11 | |
| Total non-performing assets | | $ | 466 | | $ | 14 | | $ | 469 | | $ | 829 | | $ | 668 | |
| Total as a percent of total assets | | | .08 | % | | .002 | % | | .08 | % | | .15 | % | | .13 | % |
Allowance For Loan Losses
The allowance for loan losses represents management’s best estimate of the known and inherent losses in the existing loan portfolio. Management believes that it uses the best information available to make determinations about the adequacy of the allowance and that it has established its existing allowance for loan losses in accordance with U.S. generally accepted accounting principles (GAAP). The determination of an appropriate level of the allowance for loan losses is based upon an analysis of the risks inherent in QNB’s loan portfolio. Management uses various tools to assess the appropriateness of the allowance for loan losses. One tool is a model recommended by the Office of the Comptroller of the Currency, the Bank’s primary regulator. This model considers a number of relevant factors including: historical loan loss experience, the assigned risk rating of the credit, current and projected credit worthiness of the borrower, current value of the underlying collateral, levels of and trends in delinquencies and non-accrual loans, trends in volume and terms of loans, concentrations of credit, and national and local economic trends and conditions. This model is supplemented with another analysis that also incorporates QNB’s portfolio exposure to borrowers with large dollar concentration. Other tools include ratio analysis and peer group analysis.
QNB utilizes a risk weighting system that assigns a risk code to every commercial loan. This risk weighting system is supplemented with a program that encourages account officers to identify potentially deteriorating loan situations. The officer analysis program is used to complement the on-going analysis of the loan portfolio performed during the loan review function. In addition, QNB has a committee that meets quarterly to review the appropriateness of the allowance for loan losses based on the current and projected status of all relevant factors pertaining to the loan portfolio.
Allowance for Loan Loss Allocation |
| December 31, | | 2006 | | 2005 | | 2004 | | 2003 | | 2002 | |
| | | | | Percent | | | | Percent | | | | Percent | | | | Percent | | | | Percent | |
| | | | | Gross | | | | Gross | | | | Gross | | | | Gross | | | | Gross | |
| | | Amount | | Loans | | Amount | | Loans | | Amount | | Loans | | Amount | | Loans | | Amount | | Loans | |
| Balance at end of period applicable to: | | | | | | | | | | | | | | | | | | | | | |
| Commercial and industrial | | $ | 623 | | | 21.2 | % | $ | 695 | | | 21.5 | % | $ | 869 | | | 21.4 | % | $ | 685 | | | 20.3 | % | $ | 523 | | | 18.7 | % |
| Construction | | | 138 | | | 3.0 | | | 108 | | | 2.4 | | | 79 | | | 2.6 | | | 123 | | | 3.9 | | | 103 | | | 3.6 | |
| Real estate-commercial | | | 1,214 | | | 34.4 | | | 1,258 | | | 34.8 | | | 1,228 | | | 36.7 | | | 1,277 | | | 37.3 | | | 1,140 | | | 34.8 | |
| Real estate-residential | | | 378 | | | 36.0 | | | 262 | | | 37.5 | | | 188 | | | 37.3 | | | 256 | | | 36.1 | | | 358 | | | 39.9 | |
| Consumer | | | 61 | | | 1.5 | | | 23 | | | 1.7 | | | 23 | | | 2.0 | | | 21 | | | 2.4 | | | 25 | | | 3.0 | |
| Indirect lease financing | | | 214 | | | 3.9 | | | 29 | | | 2.1 | | | | | | | | | | | | | | | | | | | |
| Unallocated | | | 101 | | | | | | 151 | | | | | | 225 | | | | | | 567 | | | | | | | | | 789 | |
| Total | | $ | 2,729 | | | 100.0 | % | $ | 2,526 | | | 100.0 | % | $ | 2,612 | | | 100.0 | % | $ | 2,929 | | | 100.0 | % | $ | 2,938 | | | 100.0 | % |
Gross loans represent loans before unamortized net loan fees and costs. Percent gross loans lists the percentage of each loan type to total loans.
A loan is considered impaired, based on current information and events, if it is probable that QNB will be unable to collect the scheduled payments of principal or interest when due according to the contractual terms of the loan agreement. The measurement of impaired loans is generally based on the present value of expected future cash flows discounted at the effective interest rate, except that all collateral-dependent loans are measured for impairment based on the fair value of the collateral. At December 31, 2006, the recorded investment in loans for which impairment has been recognized totaled $403,000 of which none required an allowance for loan loss. There were no loans considered impaired at December 31, 2005. The loans that have been identified as impaired are collateral-dependent.
QNB had net loan charge-offs of $142,000 and $86,000 in 2006 and 2005, respectively. Consumer loans accounted for $104,000 of the net charge-offs with overdrawn deposit accounts contributing $56,000 of this total. Other consumer charge-offs related primarily to motorcycle loans and unsecured lines of credit. Indirect lease financing charge-offs were $37,000 for 2006 and relate principally to one borrower. QNB has recovered $3,000 on this loan as the borrower has resumed making payments in 2007.
The allowance for loan losses was $2,729,000 at December 31, 2006, which represents .79 percent of total loans, compared to $2,526,000, or .84 percent of total loans, at December 31, 2005. QNB’s management determined a $345,000 provision for loan losses was appropriate in 2006. During the fourth quarter of 2006, QNB added $240,000 of the $345,000 provision. While QNB’s asset quality remains strong, loan charge-offs, non-performing loans and delinquent loans, which includes loans past due more than 30 days but less than 90 days, increased during the fourth quarter. These factors coupled with the continued growth in loans and the analysis described below resulted in the additional provision for loan losses and an allowance for loan losses that management believes is adequate in relation to the estimate of known and inherent losses in the portfolio. There was no provision for loan losses recorded in 2005. The ratio, at .79 percent was at a level below peers but which QNB believed was adequate based on its analysis.
Allowance for Loan Losses |
| | | 2006 | | 2005 | | 2004 | | 2003 | | 2002 | |
| Allowance for loan losses: | | | | | | | | | | | |
| Balance, January 1 | | $ | 2,526 | | $ | 2,612 | | $ | 2,929 | | $ | 2,938 | | $ | 2,845 | |
| | | | | | | | | | | | | | | | | |
| Charge-offs | | | | | | | | | | | | | | | | |
| Commercial and industrial | | | 5 | | | 7 | | | 353 | | | | | | | |
| Construction | | | | | | | | | | | | | | | | |
| Real estate-commercial | | | | | | | | | 17 | | | | | | | |
| Real estate-residential | | | | | | 6 | | | 10 | | | | | | 6 | |
| Consumer | | | 145 | | | 102 | | | 26 | | | 28 | | | 33 | |
| Indirect lease financing | | | 37 | | | | | | | | | | | | | |
| Total charge-offs | | | 187 | | | 115 | | | 406 | | | 28 | | | 39 | |
| | | | | | | | | | | | | | | | | |
| Recoveries | | | | | | | | | | | | | | | | |
| Commercial and industrial | | | 2 | | | | | | | | | | | | 83 | |
| Construction | | | | | | | | | | | | | | | | |
| Real estate-commercial | | | | | | | | | 17 | | | | | | | |
| Real estate-residential | | | 2 | | | | | | 54 | | | 1 | | | 35 | |
| Consumer | | | 41 | | | 29 | | | 18 | | | 18 | | | 14 | |
| Indirect lease financing | | | | | | | | | | | | | | | - | |
| Total recoveries | | | 45 | | | 29 | | | 89 | | | 19 | | | 132 | |
| Net (charge-offs) recoveries | | | (142 | ) | | (86 | ) | | (317 | ) | | (9 | ) | | 93 | |
| Provision for loan losses | | | 345 | | | | | | | | | | | | | |
| Balance, December 31 | | $ | 2,729 | | $ | 2,526 | | $ | 2,612 | | $ | 2,929 | | $ | 2,938 | |
| Total loans (excluding loans held-for-sale): | | | | | | | | | | | | | | | | |
| Average | | $ | 323,578 | | $ | 278,221 | | $ | 250,042 | | $ | 229,001 | | $ | 207,238 | |
| Year-end | | | 343,496 | | | 301,349 | | | 268,048 | | | 232,127 | | | 212,691 | |
| | | | | | | | | | | | | | | | | |
Ratios: | | | | | | | | | | | | | | | | |
| Net charge-offs (recoveries) to: | | | | | | | | | | | | | | | | |
| Average loans | | | .04 | % | | .03 | % | | .13 | % | | - | % | | (.04)% | |
| Loans at year-end | | | .04 | | | .03 | | | .12 | | | | | | (.04 | ) |
| Allowance for loan losses | | | 5.20 | | | 3.40 | | | 12.14 | | | .31 | | | (3.17 | ) |
| Provision for loan losses | | | 41.16 | | | | | | | | | | | | | |
| | | | | | | | | | | | | | | | | |
| Allowance for loan losses to: | | | | | | | | | | | | | | | | |
| Average loans | | | .84 | % | | .91 | % | | 1.04 | % | | 1.28 | % | | 1.42 | % |
| Loans at year-end | | | .79 | | | .84 | | | .97 | | | 1.26 | | | 1.38 | |
It is possible that management’s estimates of the allowance for loan losses and actual results could differ in the near term, due to conditions beyond QNB’s control. In addition, various regulatory agencies, as an integral part of their examination process, periodically review QNB’s allowance for loan losses. These agencies may require QNB to recognize additions to the allowance based on their judgments using information available to them at the time of their examination.
Deposits
QNB primarily attracts deposits from within its market area by offering various deposit products, including demand deposit accounts, interest-bearing demand accounts, money market accounts, savings accounts and time deposit accounts.
Total deposits increased $20,252,000, or 4.4 percent, to $478,922,000 at December 31, 2006. This compares to a decline of 1.7 percent in 2005. Average deposits increased only $624,000, or .1 percent, when comparing 2006 to 2005. The competition for deposits from local, regional and national financial institutions as well as from internet banks grew stronger in 2006. In addition, customers through the use of information gathered from the internet have become better informed about alternative products and rates offered by financial service providers throughout the nation and are willing to move funds around the country over small differences in rate. Strong performance in the stock market also provides competition for financial resources. Most of the decline in deposits in 2005 was a result of the decision to not aggressively seek to retain the short-term deposits of a school district by paying high short-term rates.
The mix of deposits, continued to be impacted by the reaction of customers to changes in interest rates on various products and by rates paid by the competition. Interest rates on time deposits and money market accounts continued to show the greatest sensitivity, as short-term Treasury rates increased during the first half of 2006. Most customers were looking for the highest rate for the shortest term. In contrast, the interest rates paid on interest-bearing demand accounts and savings accounts did not react as significantly to the increases in market interest rates. These accounts tend to be less interest rate sensitive.
At year-end 2006, non-interest bearing demand accounts declined 10.1 percent to $50,740,000. This decrease compares to growth of 7.3 percent and 4.2 percent at year-end 2005 and 2004, respectively. Average non-interest bearing demand accounts declined $1,927,000 or 3.5 percent to $53,696,000 when comparing 2006 to 2005. These deposits are primarily comprised of business checking accounts and are volatile depending on the timing of deposits and withdrawals. In addition, business customers are migrating to sweep accounts that transfer excess balances not used to cover daily activity to interest bearing accounts. This trend could result in a higher cost of funds as the use of this product increases. Interest-bearing demand accounts declined $3,450,000, or 3.4 percent, to $98,164,000 at December 31, 2006, compared to an increase in interest-bearing demand account of $6,494,000, or 6.8 percent, in 2005. Similar to non-interest bearing demand accounts, the balances in these accounts can be volatile on a daily basis. The volatility in this product is principally a result of the movement of balances by school districts and municipalities. In 2006, the decline in interest-bearing demand accounts was primarily a result of the reduction in balances of a school district. Average interest-bearing demand accounts increased 5.7 percent in 2006 compared with a decline of 5.2 percent in 2005. Once again, these variances are principally the result of swings in balances in the school district and municipal accounts. Money market accounts increased $12,686,000, or 32.4 percent, at December 31, 2006. This compares to a decrease of $21,264,000, or 35.2 percent, in 2005. The growth in 2006 was the result of a 4.00 percent money market promotion. This promotion was used to compete with the other local financial institutions and internet banks offering attractive rates on money market balances. With the higher rate on this product and the ability to immediately access funds, some customers moved money from their other lower paying demand and savings accounts to this money market product. The large decline in balances from 2004 to 2005 was a result of the decision to not aggressively seek to retain the short-term deposits of a school district by paying high short-term rates. Given the shape of the yield curve at the time and the rate that would have been paid on these deposits versus what could have been earned in an investment security, these funds would not have added significant incremental net interest income and would have further eroded the net interest margin. Total savings accounts declined $4,966,000, or 9.9 percent, as some customers sought out the higher yielding money market accounts and short-term time deposits. | | 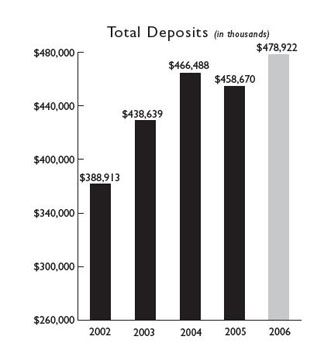 |
Maturity of Time Deposits of $100,000 or More | |
| Year Ended December 31, | | 2006 | | 2005 | | 2004 | |
| Three months or less | | $ | 11,702 | | $ | 6,966 | | $ | 2,134 | |
| Over three months through six months | | | 9,713 | | | 2,721 | | | 2,785 | |
| Over six months through twelve months | | | 16,442 | | | 14,322 | | | 14,117 | |
| Over twelve months | | | 20,318 | | | 26,907 | | | 22,939 | |
| Total | | $ | 58,175 | | $ | 50,916 | | $ | 41,975 | |
Average Deposits by Major Classification |
| | | 2006 | | 2005 | | 2004 | |
| | | Balance | | Rate | | Balance | | Rate | | Balance | | Rate | |
| Non-interest bearing deposits | | $ | 53,696 | | | | | $ | 55,623 | | | | | $ | 52,691 | | | | |
| Interest-bearing demand | | | 100,973 | | | 2.30 | % | | 95,487 | | | 1.29 | % | | 100,684 | | | .68 | % |
| Money market | | | 50,800 | | | 2.92 | | | 52,080 | | | 1.76 | | | 44,364 | | | .99 | |
| Savings | | | 48,377 | | | .39 | | | 53,671 | | | .39 | | | 54,613 | | | .39 | |
| Time | | | 163,994 | | | 3.78 | | | 161,801 | | | 3.03 | | | 156,511 | | | 2.65 | |
| Time deposits of $100,000 or more | | | 47,372 | | | 4.01 | | | 45,926 | | | 3.08 | | | 40,880 | | | 2.42 | |
| Total | | $ | 465,212 | | | 2.60 | % | $ | 464,588 | | | 1.87 | % | $ | 449,743 | | | 1.44 | % |
| | | | | | | | | | | | | | | | | | | | |
Total time deposit accounts increased $21,703,000, or 10.3 percent, to $232,832,000 at December 31, 2006. This growth in total time deposits in 2006 followed an increase of $8,309,000, or 4.1 percent, between December 31, 2004 and December 31, 2005. Average time deposits increased 1.8 percent in 2006 and 7.1 percent in 2005. Most of the growth in time deposits in 2006 occurred in the fourth quarter and in the maturity range of greater than six months through 12 months, which QNB promoted heavily in response to customers’ preferences and competitors’ offerings. Most customers and potential customers were looking for the highest rate for the shortest term because of the belief that short-term interest rates would continue to rise. Continuing to increase time deposit balances will be a challenge in 2007 because of the strong rate competition. Matching or beating competitors’ rates could have a negative impact on the net interest margin.
Attracting and retaining deposits, while not a significant concern in the years 2001 to 2004, has become an issue facing the banking industry. The equity markets continue to perform well, loan demand remains strong and the competition for deposits has become extremely aggressive. To continue to attract and retain deposits, QNB plans to be competitive with respect to rates and to continue to deliver products with terms and features that appeal to customers.
Liquidity
Liquidity represents an institution’s ability to generate cash or otherwise obtain funds at reasonable rates to satisfy commitments to borrowers and demands of depositors. QNB manages its mix of cash, federal funds sold and investment securities in an attempt to match the volatility, seasonality, interest sensitivity and growth trends of its loans and deposits. Liquidity is provided from asset sources through maturities and repayments of loans and investment securities. The portfolio of investment securities available-for-sale and QNB’s policy of selling certain residential mortgage originations in the secondary market also provide sources of liquidity. Additional sources of liquidity are provided by the Bank’s membership in the FHLB and two unsecured federal funds lines granted by correspondent banks totaling $21,000,000. The Bank has a maximum borrowing capacity with the FHLB of approximately $241,946,000. At December 31, 2006, QNB’s outstanding borrowings under the FHLB credit facilities totaled $52,000,000.
Cash and due from banks, federal funds sold, available-for-sale securities and loans held-for-sale totaled $244,091,000 at December 31, 2006 and $254,216,000 at December 31, 2005. These sources should be adequate to meet normal fluctuations in loan demand or deposit withdrawals. During both 2005 and 2006, QNB used its federal funds line of credit and overnight borrowings with the FHLB to temporarily help fund deposit withdrawals and loan growth. In addition, during both the fourth quarter of 2005 and the first quarter of 2006, QNB entered into several investment sales transactions for the purpose of providing liquidity. There were no federal funds purchased at December 31, 2006. Federal funds purchased totaled $1,490,000 at December 31, 2005. Average federal funds sold and overnight borrowings were $1,351,000 and $345,000 for 2006 and 2005, respectively.
Approximately $75,793,000 and $68,917,000 of available-for-sale securities at December 31, 2006 and 2005, respectively, were pledged as collateral for repurchase agreements and deposits of public funds. In addition, under terms of its agreement with the FHLB, QNB maintains otherwise unencumbered qualifying assets (principally 1-4 family residential mortgage loans and U.S. Government and agency notes, bonds, and mortgage-backed securities) in the amount of at least as much as its advances from the FHLB. The increase in pledged amounts relates primarily to the increase in repurchase agreement balances.
Capital Adequacy
A strong capital position is fundamental to support continued growth and profitability and to serve the needs of depositors. QNB’s shareholders’ equity at December 31, 2006 was $50,410,000, or 8.20 percent of total assets, compared to shareholders’ equity of $46,564,000, or 8.00 percent of total assets, at December 31, 2005. At December 31, 2006, shareholders’ equity included a negative adjustment of $815,000 related to the unrealized holding loss, net of taxes, on investment securities available-for-sale, while shareholders’ equity at December 31, 2005 included a negative adjustment of $1,262,000 related to the unrealized holding loss. Without these adjustments, shareholders’ equity to total assets would have been 8.34 percent and 8.21 percent at December 31, 2006 and 2005, respectively. The increase in the ratio is a result of the rate of capital retention and generation exceeding the rate of asset growth. QNB retained 51.6 percent and 52.0 percent of net income in 2006 and 2005, respectively, while generating $421,000 and $112,000 of equity through the issuance of stock. Total assets increased 5.6 percent between December 31, 2005 and December 31, 2006, while shareholders’ equity, excluding the net unrealized holding losses, increased 7.1 percent.
Average shareholders’ equity and average total assets were $49,760,000 and $594,575,000 during 2006, an increase of 6.8 percent and 1.9 percent, respectively, from 2005. The ratio of average total equity to average total assets was 8.37 percent for 2006, compared to 7.98 percent for 2005.
QNB is subject to restrictions on the payment of dividends to its shareholders pursuant to the Pennsylvania Business Corporation Law as amended (the BCL). The BCL operates generally to preclude dividend payments, if the effect thereof would render the QNB insolvent, as defined. As a practical matter, the QNB’s payment of dividends is contingent upon its ability to obtain funding in the form of dividends from the Bank. Payment of dividends to the Coporation by the Bank is subject to the restrictions in the National Bank Act. Generally, the National Bank Act permits the Bank to declare dividends in 2007 of approximately $5,201,000, plus an amount equal to the net profits of the Bank in 2007 up to the date of any such dividend declaration. QNB paid dividends to its shareholders of $.84 per share in 2006, an increase of 7.7 percent from the $.78 per share paid in 2005.
QNB is subject to various regulatory capital requirements as issued by federal regulatory authorities. Regulatory capital is defined in terms of Tier I capital (shareholders’ equity excluding unrealized gains or losses on available-for-sale securities and disallowed intangible assets), Tier II capital which includes the allowance for loan losses and a portion of the unrealized gains on equity securities, and total capital (Tier I plus Tier II). Risk-based capital ratios are expressed as a percentage of risk-weighted assets. Risk-weighted assets are determined by assigning various weights to all assets and off-balance sheet arrangements, such as letters of credit and loan commitments, based on associated risk. Regulators have also adopted minimum Tier I leverage ratio standards, which measure the ratio of Tier I capital to total average assets.
The minimum regulatory capital ratios are 4.00 percent for Tier I, 8.00 percent for total risk-based and 4.00 percent for leverage. Under the requirements, QNB has a Tier I capital ratio of 13.15 percent and 13.04 percent, a total risk-based ratio of 13.91 percent and 13.77 percent, and a leverage ratio of 8.42 percent and 8.15 percent at December 31, 2006 and 2005, respectively. The Federal Deposit Insurance Corporation Improvement Act of 1991 established five capital level designations ranging from “well capitalized” to “critically undercapitalized.” At December 31, 2006 and 2005, QNB met the “well capitalized” criteria, which requires minimum Tier I and total risk-based capital ratios of 6.00 percent and 10.00 percent, respectively, and a leverage ratio of 5.00 percent.
Capital Analysis |
| December 31, | | 2006 | | 2005 | |
Tier I | | | | | |
| Shareholders’ equity | | $ | 50,410 | | $ | 46,564 | |
| Net unrealized securities losses | | | 815 | | | 1,262 | |
| Intangible assets | | | (43 | ) | | (94 | ) |
| Total Tier I risk-based capital | | | 51,182 | | | 47,732 | |
| | | | | | | | |
Tier II | | | | | | | |
| Allowable portion: Allowance for loan losses | | $ | 2,729 | | $ | 2,526 | |
| Unrealized gains on equity securities | | | 222 | | | 126 | |
| Total risk-based capital | | $ | 54,133 | | $ | 50,384 | |
| Risk-weighted assets | | $ | 389,192 | | $ | 365,931 | |
Capital Ratios |
| December 31, | | 2006 | | 2005 | |
| Tier I capital/risk-weighted assets | | | 13.15 | % | | 13.04 | % |
| Total risk-based capital/risk-weighted assets | | | 13.91 | | | 13.77 | |
| Tier I capital/average assets (leverage ratio) | | | 8.42 | | | 8.15 | |
Contractual Obligations, Commitments, and Off-Balance Sheet Arrangements
QNB has various financial obligations, including contractual obligations and commitments, which may require future cash payments.
Contractual Obligations
The following table presents, as of December 31, 2006, significant contractual obligations to third parties by payment date. Further discussion of the nature of each obligation can be found in the Notes to Consolidated Financial Statements.
| | | Under 1 Year | | 1 to 3 years | | 3 to 5 Years | | Over 5 Years | | Total | |
| Time Deposits | | $ | 160,119 | | $ | 62,125 | | $ | 10,558 | | $ | 30 | | $ | 232,832 | |
| Short-term borrowings | | | 30,113 | | | | | | | | | | | | 30,113 | |
| Federal Home Loan Bank advances | | | 2,000 | | | 26,500 | | | 23,500 | | | | | | 52,000 | |
| Operating leases | | | 304 | | | 574 | | | 539 | | | 1,728 | | | 3,145 | |
| Total | | $ | 192,536 | | $ | 89,199 | | $ | 34,597 | | $ | 1,758 | | $ | 318,090 | |
Commitments and Off-Balance Sheet Arrangements
The following table presents, as of December 31, 2006, the amounts and expected maturities of significant commitments. Discussion of the obligations can be found in the Notes to Consolidated Financial Statements
| | | Under 1 Year | | 1 to 3 years | | 3 to 5 Years | | Over 5 Years | | Total | |
| Commitments to extend credit | | | | | | | | | | | |
| Commercial | | $ | 43,642 | | $ | 2,112 | | $ | | | $ | | | $ | 45,754 | |
| Residential real estate | | | 617 | | | | | | | | | | | | 617 | |
| Other | | | | | | | | | | | | 23,555 | | | 23,555 | |
| Standby letters of credit | | | 3,026 | | | 396 | | | | | | | | | 3,422 | |
| Total | | $ | 47,285 | | $ | 2,508 | | $ | | | $ | 23,555 | | $ | 73,348 | |
Commitments to extend credit, including loan commitments, standby letters of credit, and commercial letters of credit do not necessarily represent future cash requirements, as these commitments often expire without being drawn upon.
Recently Issued Accounting Standards
Refer to Note 1 of the Notes to Consolidated Financial Statements for discussion of recently issued accounting standards.
Critical Accounting Policies and Estimates
Discussion and analysis of the financial condition and results of operations are based on the consolidated financial statements of QNB, which are prepared in accordance with GAAP. The preparation of these consolidated financial statements requires QNB to make estimates and judgments that affect the reported amounts of assets, liabilities, revenues and expenses, and related disclosure of contingent assets and liabilities. QNB evaluates estimates on an on-going basis, including those related to the allowance for loan losses, non-accrual loans, other real estate owned, other-than-temporary investment impairments, intangible assets, stock option plans and income taxes. QNB bases its estimates on historical experience and various other factors and assumptions that are believed to be reasonable under the circumstances, the results of which form the basis for making judgments about the carrying values of assets and liabilities that are not readily apparent from other sources. Actual results may differ from these estimates under different assumptions or conditions.
QNB believes the following critical accounting policies affect its more significant judgments and estimates used in preparation of its consolidated financial statements: allowance for loan losses, income taxes and other-than-temporary investment security impairment. Each estimate is discussed below. The financial impact of each estimate is discussed in the applicable sections of Management’s Discussion and Analysis.
Allowance for Loan Losses
QNB considers that the determination of the allowance for loan losses involves a higher degree of judgment and complexity than its other significant accounting policies. The allowance for loan losses is calculated with the objective of maintaining a level believed by management to be sufficient to absorb probable known and inherent losses in the outstanding loan portfolio. The allowance is reduced by actual credit losses and is increased by the provision for loan losses and recoveries of previous losses. The provisions for loan losses are charged to earnings to bring the total allowance for loan losses to a level considered necessary by management.
The allowance for loan losses is based on management’s continuous review and evaluation of the loan portfolio. The level of the allowance is determined by assigning specific reserves to individually identified problem credits and general reserves to all other loans. The portion of the allowance that is allocated to internally criticized and non-accrual loans is determined by estimating the inherent loss on each credit after giving consideration to the value of underlying collateral. The general reserves are based on the composition and risk characteristics of the loan portfolio, including the nature of the loan portfolio, credit concentration trends, historic and anticipated delinquency and loss experience, as well as other qualitative factors such as current economic trends.
Management emphasizes loan quality and close monitoring of potential problem credits. Credit risk identification and review processes are utilized in order to assess and monitor the degree of risk in the loan portfolio. QNB’s lending and loan administration staff are charged with reviewing the loan portfolio and identifying changes in the economy or in a borrower’s circumstances which may affect the ability to repay debt or the value of pledged collateral. A loan classification and review system exists that identifies those loans with a higher than normal risk of uncollectibility. Each commercial loan is assigned a grade based upon an assessment of the borrower’s financial capacity to service the debt and the presence and value of collateral for the loan. An independent loan review group tests risk assessments and evaluates the adequacy of the allowance for loan losses. Management meets monthly to review the credit quality of the loan portfolio and quarterly to review the allowance for loan losses.
In addition, various regulatory agencies, as an integral part of their examination process, periodically review QNB’s allowance for loan losses. Such agencies may require QNB to recognize additions to the allowance based on their judgments about information available to them at the time of their examination.
Management believes that it uses the best information available to make determinations about the adequacy of the allowance and that it has established its existing allowance for loan losses in accordance with GAAP. If circumstances differ substantially from the assumptions used in making determinations, future adjustments to the allowance for loan losses may be necessary and results of operations could be affected. Because future events affecting borrowers and collateral cannot be predicted with certainty, increases to the allowance may be necessary should the quality of any loans deteriorate as a result of the factors discussed above.
Income Taxes
QNB accounts for income taxes under the asset/liability method. Deferred tax assets and liabilities are recognized for the future tax consequences attributable to differences between the financial statement carrying amounts of existing assets and liabilities and their respective tax bases, as well as operating loss and tax credit carryforwards. Deferred tax assets and liabilities are measured using enacted tax rates expected to apply to taxable income in the years in which those temporary differences are expected to be recovered or settled. The effect on deferred tax assets and liabilities of a change in tax rates is recognized in income in the period that includes the enactment date. A valuation allowance is established against deferred tax assets when, in the judgment of management, it is more likely than not that such deferred tax assets will not become available. Because the judgment about the level of future taxable income is dependent to a great extent on matters that may, at least in part, be beyond QNB’s control, it is at least reasonably possible that management’s judgment about the need for a valuation allowance for deferred taxes could change in the near term.
Other-than-Temporary Investment Security Impairment
Securities are evaluated periodically to determine whether a decline in their value is other-than-temporary. Management utilizes criteria such as the magnitude and duration of the decline, in addition to the reasons underlying the decline, to determine whether the loss in value is other-than-temporary. The term “other-than-temporary” is not intended to indicate that the decline is permanent, but indicates that the prospect for a near-term recovery of value is not necessarily favorable, or that there is a lack of evidence to support a realizable value equal to or greater than the carrying value of the investment. Once a decline in value is determined to be other-than-temporary, the value of the security is reduced and a corresponding charge to earnings is recognized.
| ITEM 7A. | QUANTITATIVE AND QUALITATIVE DISCLOSURES ABOUT MARKET RISK |
As a financial institution, QNB is subject to three primary risks.
The Board of Directors has established an Asset Liability Committee (ALCO) to measure, monitor and manage interest rate risk for QNB. QNB’s Asset Liability and Loan Policies have instituted guidelines covering the three primary risks.
For discussion on credit risk refer to the sections on non-performing assets and the allowance for loan losses, Note 5 and Note 6 of the Notes to Consolidated Financial Statements. For discussion on liquidity risk refer to the section on liquidity at page 34 in Item 7 of this Form 10-K filing.
Interest Rate Sensitivity
Since the assets and liabilities of QNB have diverse repricing characteristics that influence net interest income, management analyzes interest sensitivity through the use of gap analysis and simulation models. Interest rate sensitivity management seeks to minimize the effect of interest rate changes on net interest margins and interest rate spreads and to provide growth in net interest income through periods of changing interest rates. The ALCO is responsible for managing interest rate risk and for evaluating the impact of changing interest rate conditions on net interest income.
Gap analysis measures the difference between volumes of rate sensitive assets and liabilities and quantifies these repricing differences for various time intervals. Static gap analysis describes interest rate sensitivity at a point in time. However, it alone does not accurately measure the magnitude of changes in net interest income because changes in interest rates do not impact all categories of assets and liabilities equally or simultaneously. Interest rate sensitivity analysis also involves assumptions on certain categories of assets and deposits. For purposes of interest rate sensitivity analysis, assets and liabilities are stated at their contractual maturity, estimated likely call date, or earliest repricing opportunity. Mortgage-backed securities, CMOs and amortizing loans are scheduled based on their anticipated cash flow. Savings accounts, including passbook, statement savings, money market, and interest-bearing demand accounts, do not have stated maturities or repricing terms and can be withdrawn or repriced at any time. This may impact QNB’s margin if more expensive alternative sources of deposits are required to fund loans or deposit runoff. Management projects the repricing characteristics of these accounts based on historical performance and assumptions that it believes reflect their rate sensitivity. The Treasury Select Indexed Money Market account reprices monthly, based on a percentage of the average of the 91-day Treasury bill.
A positive gap results when the amount of interest rate sensitive assets exceeds interest rate sensitive liabilities. A negative gap results when the amount of interest rate sensitive liabilities exceeds interest rate sensitive assets.
QNB primarily focuses on the management of the one-year interest rate sensitivity gap. At December 31, 2006, interest earning assets scheduled to mature or likely to be called, repriced or repaid in one year were $192,116,000. Interest sensitive liabilities scheduled to mature or reprice within one year were $301,660,000. The one-year cumulative gap, which reflects QNB’s interest sensitivity over a period of time, was a negative $109,544,000 at December 31, 2006. The cumulative one-year gap equals -18.44 percent of total rate sensitive assets. This position compares to a negative gap position of $39,123,000, or -7.04 percent, of total rate sensitive assets, at December 31, 2005. The increase in the negative gap position in the one-year time frame was primarily the result of changes in the repricing and maturity structure of the Bank’s interest sensitive liabilities. The amount of time deposits maturing or repricing in less than one year increased significantly. At December 31, 2006, $161,358,000, or 69.3 percent, of total time deposits were scheduled to reprice or mature in the next twelve months level compared to $95,840,000, or 45.4 percent, of total time deposits at December 31, 2005. In addition, balances in the Treasury Select Money Market account increased by $16,160,000 between December 31, 2005 and December 31, 2006. Both of these events reflect consumers desire to invest in shorter term investments whose rates have increased significantly and which could increase further if market rates continue to increase. Also contributing to the increase in interest sensitive liabilities was a $10,518,000 increase in short-term borrowings, primarily consisting of commercial sweep accounts set up as repurchase agreements. On the asset side, the amount of assets maturing or repricing increased by $12,784,000 from December 31, 2005 to December 31, 2006. This increase was primarily the result of the $11,664,000 increase in federal funds sold. This negative gap position has contributed to the decline in the net interest margin as interest rates have increased on a greater amount of liabilities than earning assets and to a greater magnitude.
QNB also uses a simulation model to assess the impact of changes in interest rates on net interest income. The model reflects management’s assumptions related to asset yields and rates paid on liabilities, deposit sensitivity, and the size, composition and maturity or repricing characteristics of the balance sheet. The assumptions are based on the interest rate environment at period end. Management also evaluates the impact of higher and lower interest rates by simulating the impact on net interest income of changing rates. While management performs rate shocks of 100, 200 and 300 basis points, it believes, given the level of interest rates at December 31, 2006, that it is unlikely that interest rates would decline by 300 basis points. The simulation results can be found in the chart on page 40.
The decline in net interest income in a rising rate environment is consistent with the gap analysis and reflects the fixed-rate nature of the investment and loan portfolio and the increased expense associated with higher costing deposits and short-term borrowings. Also impacting net interest income in a rising rate environment would be the conversion of some of the borrowings from the FHLB from a fixed-rate to a variable-rate tied to LIBOR. If converted, QNB has the option to return the borrowings to the FHLB without penalty. Net interest income increases slightly if rates were to decline by 100 basis points. However, in the 200 basis point down scenario, net interest income declines slightly which indicates the current interest pricing on interest-bearing transaction accounts, regular money market accounts and savings accounts are at their hypothetical floors. Interest rates on these products do not have the ability to decline to the degree that rates on earning assets can. In addition, in a lower rate environment the cash flow from both the loan and investment portfolios would increase and be reinvested at lower rates. These results are inconsistent with the gap analysis and identify some of the weaknesses of gap analysis which does not take into consideration the magnitude of the rate change on different instruments or the timing of the rate change.
Management will continue to look for ways to reduce the impact of rising interest rates on net interest income. One step that has been taken was changing the Treasury Select money market product by removing the automatic index feature and setting the rate at the discretion of QNB’s Management. QNB will also attempt to shorten the repricing characteristics of the loan portfolio and lengthen the maturity of the time deposit portfolio. Both of these will be difficult to achieve if the yield curve stays inverted and the competition continues to offer high rate short-term time deposits and money market deposits and low fixed rate loans.
Actual results may differ from simulated results due to various factors including time, magnitude and frequency of interest rate changes, the relationship or spread between various rates, loan pricing and deposit sensitivity, and asset/liability strategies.
Management believes that the assumptions utilized in evaluating the vulnerability of QNB’s net interest income to changes in interest rates approximate actual experience. However, the interest rate sensitivity of QNB’s assets and liabilities as well as the estimated effect of changes in interest rates on net interest income could vary substantially if different assumptions are used or actual experience differs from the experience on which the assumptions were based.
The nature of QNB’s current operation is such that it is not subject to foreign currency exchange or commodity price risk. Additionally, neither the Corporation nor the Bank owns trading assets. At December 31, 2006, QNB did not have any hedging transactions in place such as interest rate swaps, caps or floors.
The table below summarizes estimated changes in net interest income over the next twelve-month period, under various interest rate scenarios.
Interest Rate Sensitivity |
| | | Within | | 3 to 6 | | 6 months | | 1 to 3 | | 3 to 5 | | After | | | |
December 31, 2006 | | 3 months | | months | | to 1 year | | years | | years | | 5 years | | Total | |
| Assets | | | | | | | | | | | | | | | |
| Interest-bearing balances | | $ | 778 | | $ | | | $ | | | $ | | | $ | | | $ | | | $ | 778 | |
| Federal funds sold | | | 11,664 | | | | | | | | | | | | | | | | | | 11,664 | |
| Investment securities* | | | 13,965 | | | 9,272 | | | 18,356 | | | 73,560 | | | 55,263 | | | 55,658 | | | 226,074 | |
| Non-marketable equity securities | | | 3,375 | | | | | | | | | | | | | | | 90 | | | 3,465 | |
| Loans, including loans held-for-sale | | | 72,970 | | | 15,935 | | | 37,386 | | | 110,200 | | | 72,149 | | | 35,026 | | | 343,666 | |
| Bank-owned life insurance | | | | | | | | | 8,415 | | | | | | | | | | | | 8,415 | |
| Total rate sensitive assets | | | 102,752 | | | 25,207 | | | 64,157 | | | 183,760 | | | 127,412 | | | 90,774 | | $ | 594,062 | |
| Total cumulative assets | | $ | 102,752 | | $ | 127,959 | | $ | 192,116 | | $ | 375,876 | | $ | 503,288 | | $ | 594,062 | | | | |
| Liabilities | | | | | | | | | | | | | | | | | | | | | | |
| Interest-bearing non-maturing deposits | | $ | 108,189 | | $ | | | $ | | | $ | 4,806 | | $ | 11,286 | | $ | 71,069 | | $ | 195,350 | |
| Time deposits less than $100,000 | | | 45,996 | | | 24,790 | | | 52,344 | | | 43,886 | | | 7,641 | | | | | | 174,657 | |
| Time deposits over $100,000 | | | 12,174 | | | 9,713 | | | 16,341 | | | 17,031 | | | 2,916 | | | | | | 58,175 | |
| Short-term borrowings | | | 30,113 | | | | | | | | | | | | | | | | | | 30,113 | |
| Federal Home Loan Bank advances | | | 2,000 | | | | | | | | | 26,500 | | | 23,500 | | | | | | 52,000 | |
| Total rate sensitive liabilities | | | 198,472 | | | 34,503 | | | 68,685 | | | 92,223 | | | 45,343 | | | 71,069 | | $ | 510,295 | |
| Total cumulative liabilities | | $ | 198,472 | | $ | 232,975 | | $ | 301,660 | | $ | 393,883 | | $ | 439,226 | | $ | 510,295 | | | | |
| Gap during period | | $ | (95,720 | ) | $ | (9,296 | ) | $ | (4,528 | ) | $ | 91,537 | | $ | 82,069 | | $ | 19,705 | | $ | 83,767 | |
| Cumulative gap | | $ | (95,720 | ) | $ | (105,016 | ) | $ | (109,544 | ) | $ | (18,007 | ) | $ | 64,062 | | $ | 83,767 | | | | |
| Cumulative gap/rate sensitive assets | | | (16.11 | )% | | (17.68 | )% | | (18.44 | )% | | ( 3.03 | )% | | 10.78 | % | | 14.10 | % | | | |
| Cumulative gap ratio | | | .52 | | | .55 | | | .64 | | | .95 | | | 1.15 | | | 1.16 | | | | |
| | | | | | | | | | | | | | | | | | | | | | | |
| * | Excludes unrealized holding loss on available-for-sale securities of $1,235. |
The table below summarizes estimated changes in net interest income over the next twelve-month period, under various interest rate scenarios.
| |
Change in Interest Rates | | Net Interest Income | | Dollar Change | | Percent Change | |
| December 31, 2006 |
| +300 Basis Points | | $ | 13,700 | | $ | (3,190 | ) | | (18.89 | )% |
| +200 Basis Points | | | 14,715 | | | (2,175 | ) | | (12.88 | ) |
| +100 Basis Points | | | 15,920 | | | (970 | ) | | (5.74 | ) |
| FLAT RATE | | | 16,890 | | | | | | | |
| -100 Basis Points | | | 17,075 | | | 185 | | | 1.10 | |
| -200 Basis Points | | | 16,737 | | | (153 | ) | | (.91 | ) |
| December 31, 2005 |
| +300 Basis Points | | $ | 14,820 | | $ | (1,036 | ) | | (6.53 | )% |
| +200 Basis Points | | | 15,280 | | | (576 | ) | | (3.63 | ) |
| +100 Basis Points | | | 15,738 | | | (118 | ) | | (.74 | ) |
| FLAT RATE | | | 15,856 | | | | | | | |
| -100 Basis Points | | | 15,744 | | | (112 | ) | | (.71 | ) |
| -200 Basis Points | | | 14,634 | | | (1,222 | ) | | (7.71 | ) |
| ITEM 8. | FINANCIAL STATEMENTS AND SUPPLEMENTARY DATA |
The following audited financial statements are set forth in this Annual Report of Form 10-K on the following pages:
| Independent Registered Public Accounting Firm Report | Page 42 |
| Consolidated Balance Sheets | Page 43 |
| Consolidated Statements of Income | Page 44 |
| Consolidated Statements of Shareholders’ Equity | Page 45 |
| Consolidated Statements of Cash Flows | Page 46 |
| Notes to Consolidated Financial Statements | Page 47 |
INDEPENDENT REGISTERED PUBLIC ACCOUNTING FIRM REPORT
The Board of Directors
QNB Corp:
We have audited the consolidated balance sheets of QNB Corp. and subsidiary as of December 31, 2006, and 2005, and the related consolidated statements of income, shareholders’ equity, and cash flows for each of the years in the three-year period ended December 31, 2006. These consolidated financial statements are the responsibility of the Corporation’s management. Our responsibility is to express an opinion on these financial statements based on our audits.
We conducted our audits in accordance with the standards of the Public Company Accounting Oversight Board (United States). Those standards require that we plan and perform the audit to obtain reasonable assurance about whether the financial statements are free of material misstatement. An audit includes examining, on a test basis, evidence supporting the amounts and disclosures in the financial statements. An audit also includes assessing the accounting principles used and significant estimates made by management, as well as evaluating the overall financial statement presentation. We believe that our audits provides a reasonable basis for our opinion.
In our opinion, the consolidated financial statements referred to above present fairly, in all material respects, the financial position of QNB Corp. and subsidiary as of December 31, 2006 and 2005, and the consolidated results of their operations and their cash flows for each of the years in the three-year period ended December 31, 2006, in conformity with U.S. generally accepted accounting principles.
We also have audited, in accordance with the standards of the Public Company Accounting Oversight Board (United States), the effectiveness of QNB Corp.’s internal control over financial reporting as of December 31, 2006, based on criteria established in “Internal Control - Integrated Framework” issued by the Committee of Sponsoring Organizations of the Treadway Commission and our report dated March 7, 2007 expressed an unqualified opinion on management’s assessment of the effectiveness of QNB Corp.’s internal control over financial reporting and an unqualified opinion on the effectiveness of QNB Corp.’s internal control over financial reporting.
Wexford, Pennsylvania
March 7, 2007
CONSOLIDATED BALANCE SHEETS
| (in thousands, except share data) | |
December 31, | | 2006 | | 2005 | |
Assets | | | | | |
| Cash and due from banks | | $ | 12,439 | | $ | 20,807 | |
| Federal funds sold | | | 11,664 | | | | |
| Total cash and cash equivalents | | | 24,103 | | | 20,807 | |
| Investment securities | | | | | | | |
| Available-for-sale (amortized cost $221,053 and $235,187) | | | 219,818 | | | 233,275 | |
| Held-to-maturity (market value $5,168 and $6,082) | | | 5,021 | | | 5,897 | |
| Non-marketable equity securities | | | 3,465 | | | 3,684 | |
| Loans held-for-sale | | | 170 | | | 134 | |
| Total loans, net of unearned costs | | | 343,496 | | | 301,349 | |
| Allowance for loan losses | | | (2,729 | ) | | (2,526 | ) |
| Net loans | | | 340,767 | | | 298,823 | |
| Bank-owned life insurance | | | 8,415 | | | 8,103 | |
| Premises and equipment, net | | | 6,442 | | | 5,400 | |
| Accrued interest receivable | | | 2,874 | | | 2,572 | |
| Other assets | | | 3,464 | | | 3,510 | |
| Total assets | | $ | 614,539 | | $ | 582,205 | |
| | | | | | | | |
Liabilities | | | | | | | |
| Deposits | | | | | | | |
| Demand, non-interest bearing | | $ | 50,740 | | $ | 56,461 | |
| Interest-bearing demand | | | 98,164 | | | 101,614 | |
| Money market | | | 51,856 | | | 39,170 | |
| Savings | | | 45,330 | | | 50,296 | |
| Time | | | 174,657 | | | 160,213 | |
| Time over $100,000 | | | 58,175 | | | 50,916 | |
| Total deposits | | | 478,922 | | | 458,670 | |
| Short-term borrowings | | | 30,113 | | | 19,596 | |
| Federal Home Loan Bank advances | | | 52,000 | | | 55,000 | |
| Accrued interest payable | | | 2,240 | | | 1,512 | |
| Other liabilities | | | 854 | | | 863 | |
| Total liabilities | | | 564,129 | | | 535,641 | |
| | | | | | | | |
Shareholders’ Equity | | | | | | | |
| Common stock, par value $0.625 per share; | | | | | | | |
| authorized 10,000,000 shares; 3,235,284 shares and 3,210,762 shares issued; | | | | | | | |
| 3,128,598 and 3,104,076 shares outstanding | | | 2,022 | | | 2,007 | |
| Surplus | | | 9,707 | | | 9,117 | |
| Retained earnings | | | 40,990 | | | 38,196 | |
| Accumulated other comprehensive loss, net | | | (815 | ) | | (1,262 | ) |
| Treasury stock, at cost; 106,686 shares | | | (1,494 | ) | | (1,494 | ) |
| Total shareholders’ equity | | | 50,410 | | | 46,564 | |
| Total liabilities and shareholders’ equity | | $ | 614,539 | | $ | 582,205 | |
The accompanying notes are an integral part of the consolidated financial statements.
CONSOLIDATED STATEMENTS OF INCOME
| (in thousands, except share data) |
Year Ended December 31, | | 2006 | | 2005 | | 2004 | |
Interest Income | | | | | | | |
| Interest and fees on loans | | $ | 21,097 | | $ | 16,938 | | $ | 14,229 | |
| Interest and dividends on investment securities: | | | | | | | | | | |
| Taxable | | | 8,437 | | | 8,767 | | | 8,945 | |
| Tax-exempt | | | 1,897 | | | 2,259 | | | 2,224 | |
| Interest on federal funds sold | | | 357 | | | 176 | | | 93 | |
| Interest on interest-bearing balances and other interest income | | | 214 | | | 132 | | | 80 | |
| Total interest income | | | 32,002 | | | 28,272 | | | 25,571 | |
Interest Expense | | | | | | | | | | |
| Interest on deposits | | | | | | | | | | |
| Interest-bearing demand | | | 2,322 | | | 1,229 | | | 681 | |
| Money market | | | 1,484 | | | 917 | | | 441 | |
| Savings | | | 190 | | | 211 | | | 215 | |
| Time | | | 6,202 | | | 4,906 | | | 4,153 | |
| Time over $100,000 | | | 1,900 | | | 1,415 | | | 990 | |
| Interest on short-term borrowings | | | 736 | | | 323 | | | 124 | |
| Interest on Federal Home Loan Bank advances | | | 3,072 | | | 2,987 | | | 2,902 | |
| Total interest expense | | | 15,906 | | | 11,988 | | | 9,506 | |
| Net interest income | | | 16,096 | | | 16,284 | | | 16,065 | |
| Provision for loan losses | | | 345 | | | | | | | |
| Net interest income after provision for loan losses | | | 15,751 | | | 16,284 | | | 16,065 | |
Non-Interest Income | | | | | | | | | | |
| Fees for services to customers | | | 1,867 | | | 1,851 | | | 2,000 | |
| ATM and debit card income | | | 772 | | | 687 | | | 598 | |
| Income on bank-owned life insurance | | | 291 | | | 288 | | | 300 | |
| Mortgage servicing fees | | | 98 | | | 90 | | | 112 | |
| Net gain (loss) on investment securities available-for-sale | | | 262 | | | (727 | ) | | 849 | |
| Net gain on sale of loans | | | 64 | | | 145 | | | 154 | |
| Other operating income | | | 583 | | | 928 | | | 672 | |
| Total non-interest income | | | 3,937 | | | 3,262 | | | 4,685 | |
Non-Interest Expense | | | | | | | | | | |
| Salaries and employee benefits | | | 7,320 | | | 7,314 | | | 7,163 | |
| Net occupancy expense | | | 1,161 | | | 1,100 | | | 1,013 | |
| Furniture and equipment expense | | | 1,026 | | | 1,159 | | | 1,146 | |
| Marketing expense | | | 651 | | | 599 | | | 557 | |
| Third party services | | | 724 | | | 701 | | | 680 | |
| Telephone, postage and supplies expense | | | 537 | | | 488 | | | 521 | |
| State taxes | | | 453 | | | 423 | | | 375 | |
| Other expense | | | 1,362 | | | 1,318 | | | 1,388 | |
| Total non-interest expense | | | 13,234 | | | 13,102 | | | 12,843 | |
| Income before income taxes | | | 6,454 | | | 6,444 | | | 7,907 | |
| Provision for income taxes | | | 1,034 | | | 1,398 | | | 1,704 | |
Net Income | | $ | 5,420 | | $ | 5,046 | | $ | 6,203 | |
Earnings Per Share - Basic | | $ | 1.73 | | $ | 1.63 | | $ | 2.00 | |
Earnings Per Share - Diluted | | $ | 1.71 | | $ | 1.59 | | $ | 1.95 | |
The accompanying notes are an integral part of the consolidated financial statements. CONSOLIDATED STATEMENTS OF SHAREHOLDERS’ EQUITY
| |
| | | | | | | Accumulated | | | | | | | | | | | |
| | | | | | | Other | | | | | | | | | | | |
| | | Number | | Comprehensive | | Comprehensive | | Common | | | | Retained | | Treasury | | | |
| (in thousands, except share data) | | of Shares | | Income | | Income (loss) | | Stock | | Surplus | | Earnings | | Stock | | Total | |
| Balance, December 31, 2003 | | | 3,095,379 | | | | | $ | 2,341 | | $ | 2,001 | | $ | 8,933 | | $ | 31,659 | | $ | (1,494 | ) | $ | 43,440 | |
| | | | | | | | | | | | | | | | | | | | | | | | | | |
| Net income | | | | | $ | 6,203 | | | | | | | | | | | | 6,203 | | | | | | 6,203 | |
| Other comprehensive loss, net of tax benefit | | | | | | | | | | | | | | | | | | | | | | | | | |
| Unrealized holding losses on investment securities available-for-sale | | | | | | (1,090 | ) | | | | | | | | | | | | | | | | | | |
| Reclassification adjustment for gains included in net income | | | | | | (560 | ) | | | | | | | | | | | | | | | | | | |
| Other comprehensive loss | | | | | | (1,650 | ) | | (1,650 | ) | | | | | | | | | | | | | | (1,650 | ) |
| | | | | | | | | | | | | | | | | | | | | | | | | | |
| Comprehensive income | | | | | $ | 4,553 | | | | | | | | | | | | | | | | | | | |
| Cash dividends paid ($.74 per share) | | | | | | | | | | | | | | | | | | (2,292 | ) | | | | | (2,292 | ) |
| Stock issue - Employee stock purchase plan | | | 2,679 | | | | | | | | | 2 | | | 72 | | | | | | | | | 74 | |
| Stock issued for options exercised | | | 20 | | | | | | | | | | | | | | | | | | | | | | |
| Balance, December 31, 2004 | | | 3,098,078 | | | | | | 691 | | | 2,003 | | | 9,005 | | | 35,570 | | | (1,494 | ) | | 45,775 | |
| | | | | | | | | | | | | | | | | | | | | | | | | | |
| Net income | | | | | $ | 5,046 | | | | | | | | | | | | 5,046 | | | | | | 5,046 | |
| Other comprehensive loss, net of tax benefit | | | | | | | | | | | | | | | | | | | | | | | | | |
| Unrealized holding losses on investment securities available-for-sale | | | | | | (2,627 | ) | | | | | | | | | | | | | | | | | | |
| Reclassification adjustment for losses included in net income | | | | | | 674 | | | | | | | | | | | | | | | | | | | |
| Other comprehensive loss | | | | | | (1,953 | ) | | (1,953 | ) | | | | | | | | | | | | | | (1,953 | ) |
| Comprehensive income | | | | | $ | 3,093 | | | | | | | | | | | | | | | | | | | |
| Cash dividends paid ($.78 per share) | | | | | | | | | | | | | | | | | | (2,420 | ) | | | | | (2,420 | ) |
| Stock issue - Employee stock purchase plan | | | 2,794 | | | | | | | | | 2 | | | 72 | | | | | | | | | 74 | |
| Stock issued for options exercised | | | 3,204 | | | | | | | | | 2 | | | 36 | | | | | | | | | 38 | |
| Tax benefits from stock plans | | | | | | | | | | | | | | | 4 | | | | | | | | | 4 | |
| Balance, December 31, 2005 | | | 3,104,076 | | | | | | (1,262 | ) | | 2,007 | | | 9,117 | | | 38,196 | | | (1,494 | ) | | 46,564 | |
| | | | | | | | | | | | | | | | | | | | | | | | | | |
| Net income | | | | | $ | 5,420 | | | | | | | | | | | | 5,420 | | | | | | 5,420 | |
| Other comprehensive income, net of taxes | | | | | | | | | | | | | | | | | | | | | | | | | |
| Unrealized holding gains on investment securities available-for-sale | | | | | | 620 | | | | | | | | | | | | | | | | | | | |
| Reclassification adjustment for gains included in net income | | | | | | (173 | ) | | | | | | | | | | | | | | | | | | |
| Other comprehensive income | | | | | | 447 | | | 447 | | | | | | | | | | | | | | | 447 | |
| Comprehensive income | | | | | $ | 5,867 | | | | | | | | | | | | | | | | | | | |
| Cash dividends paid ($.84 per share) | | | | | | | | | | | | | | | | | | (2,626 | ) | | | | | (2,626 | ) |
| Stock issue - Employee stock purchase plan | | | 3,071 | | | | | | | | | 2 | | | 70 | | | | | | | | | 72 | |
| Stock issued for options exercised | | | 21,451 | | | | | | | | | 13 | | | 336 | | | | | | | | | 349 | |
| Tax benefits from stock plans | | | | | | | | | | | | | | | 66 | | | | | | | | | 66 | |
| Stock-based compensation expense | | | | | | | | | | | | | | | 118 | | | | | | | | | 118 | |
| Balance, December 31, 2006 | | | 3,128,598 | | | | | $ | (815 | ) | $ | 2,022 | | $ | 9,707 | | $ | 40,990 | | $ | (1,494 | ) | $ | 50,410 | |
The accompanying notes are an integral part of the consolidated financial statements.
CONSOLIDATED STATEMENTS OF CASH FLOWS
| | | (in thousands) |
Year Ended December 31, | | 2006 | | 2005 | | 2004 | |
Operating Activities | | | | | | | |
| Net income | | $ | 5,420 | | $ | 5,046 | | $ | 6,203 | |
| Adjustments to reconcile net income to net cash provided by operating activities | | | | | | | | | | |
| Depreciation and amortization | | | 744 | | | 890 | | | 907 | |
| Provision for loan losses | | | 345 | | | | | | | |
| Securities gains, net | | | (313 | ) | | (526 | ) | | (849 | ) |
| Impairment write-down of securities | | | 51 | | | 1,253 - | | | | |
| Net gain on sale of repossessed assets | | | | | | (210 | ) | | (141 | ) |
| Proceeds from sale of repossessed assets | | | 9 | | | 210 | | | 1,167 | |
| Net gain on sale of loans | | | (64 | ) | | (145 | ) | | (154 | ) |
| Loss on disposal of premises and equipment | | | 3 | | | 1 | | | 3 | |
| Loss on equity investment in title company | | | | | | | | | 26 | |
| Proceeds from sales of residential mortgages | | | 4,129 | | | 11,004 | | | 9,162 | |
| Originations of residential mortgages held-for-sale | | | (4,148 | ) | | (10,857 | ) | | (8,055 | ) |
| Income on bank-owned life insurance | | | (291 | ) | | (288 | ) | | (300 | ) |
| Life insurance (premiums)/proceeds net | | | (21 | ) | | 91 (21 | ) | | | |
| Stock-based compensation expense | | | 118 | | | | | | | |
| Deferred income tax (benefit) provision | | | (183 | ) | | (81 | ) | | 299 | |
| Net (decrease) increase in income taxes payable | | | | | | (338 | ) | | 282 | |
| Net (increase) decrease in accrued interest receivable | | | (302 | ) | | (41 | ) | | 292 | |
| Net amortization of premiums and discounts | | | 524 | | | 869 | | | 933 | |
| Net increase (decrease) in accrued interest payable | | | 728 | | | 333 | | | (106 | ) |
| Increase in other assets | | | (67 | ) | | (135 | ) | | (67 | ) |
| Decrease in other liabilities | | | (9 | ) | | (551 | ) | | (280 | ) |
| Net cash provided by operating activities | | | 6,673 | | | 6,525 | | | 9,301 | |
Investing Activities | | | | | | | | | | |
| Proceeds from maturities and calls of investment securities | | | | | | | | | | |
| available-for-sale | | | 24,595 | | | 36,720 | | | 55,334 | |
| held-to-maturity | | | 870 | | | 300 | | | 5,811 | |
| Proceeds from sales of investment securities | | | | | | | | | | |
| available-for-sale | | | 46,490 | | | 45,105 | | | 66,715 | |
| Purchase of investment securities | | | | | | | | | | |
| available-for-sale | | | (57,069 | ) | | (52,442 | ) | | (130,878 | ) |
| Proceeds from sales of non-marketable equity securities | | | 1,700 | | | 751 | | | 259 | |
| Purchase of non-marketable equity securities | | | (1,481 | ) | | (488 | ) | | (396 | ) |
| Net increase in loans | | | (42,323 | ) | | (33,294 | ) | | (37,156 | ) |
| Net purchases of premises and equipment | | | (1,789 | ) | | (651 | ) | | (1,460 | ) |
| Net cash used by investing activities | | | (29,007 | ) | | (3,999 | ) | | (41,771 | ) |
Financing Activities | | | | | | | | | | |
| Net (decrease) increase in non-interest bearing deposits | | | (5,721 | ) | | 3,858 | | | 2,135 | |
| Net increase (decrease) in interest-bearing non-maturity deposits | | | 4,270 | | | (19,985 | ) | | 13,036 | |
| Net increase in time deposits | | | 21,703 | | | 8,309 | | | 12,678 | |
| Net increase in short-term borrowings | | | 10,517 | | | 6,222 | | | 2,958 | |
| Repayment of Federal Home Loan Bank advances | | | (3,000 | ) | | | | | | |
| Tax benefit from exercise of stock options | | | 66 | | | — | | | — | |
| Cash dividends paid | | | (2,626 | ) | | (2,420 | ) | | (2,292 | ) |
| Proceeds from issuance of common stock | | | 421 | | | 112 | | | 74 | |
| Net cash provided by (used by) financing activities | | | 25,630 | | | (3,904 | ) | | 28,589 | |
| Increase (decrease) in cash and cash equivalents | | | 3,296 | | | (1,378 | ) | | (3,881 | ) |
| Cash and cash equivalents at beginning of year | | | 20,807 | | | 22,185 | | | 26,066 | |
| Cash and cash equivalents at end of year | | $ | 24,103 | | $ | 20,807 | | $ | 22,185 | |
Supplemental Cash Flow Disclosures | | | | | | | | | | |
| Interest paid | | $ | 15,178 | | $ | 11,655 | | $ | 9,612 | |
| Income taxes paid | | | 1,134 | | | 1,802 | | | 1,042 | |
| Non-Cash Transactions | | | | | | | | | | |
| Change in net unrealized holding gains, net of taxes, on investment securities 447 | | | (1,953 | ) | | (1,650 | ) | | | |
| Transfer of loans to repossessed assets | | | 50 | | | | | | 1,026 | |
The accompanying notes are an integral part of the consolidated financial statements.
NOTES TO CONSOLIDATED FINANCIAL STATEMENTS
Note 1 - Summary of Significant Accounting Policies
Business
QNB Corp. (the Corporation), through its wholly-owned subsidiary, The Quakertown National Bank (the Bank), has been serving the residents and businesses of upper Bucks, southern Lehigh, and northern Montgomery counties in Pennsylvania since 1877. The Bank is a locally managed community bank that provides a full range of commercial, retail banking and retail brokerage services. The Bank encounters vigorous competition for market share in the communities it serves from bank holding companies, other community banks, thrift institutions, credit unions and other non-bank financial organizations such as mutual fund companies, insurance companies and brokerage companies. The Corporation manages its business as a single operating segment.
The Corporation and the Bank are subject to regulations of certain state and federal agencies. These regulatory agencies periodically examine the Corporation and the Bank for adherence to laws and regulations.
The consolidated financial statements include the accounts of the Corporation and its wholly-owned subsidiary, the Bank. The consolidated entity is referred to herein as “QNB”. These statements are prepared in accordance with U.S. generally accepted accounting principles (GAAP) and predominant practices within the banking industry. The preparation of these consolidated financial statements requires QNB to make estimates and judgments that affect the reported amounts of assets, liabilities, revenues and expenses, and related disclosure of contingent assets and liabilities. QNB evaluates estimates on an on-going basis, including those related to the allowance for loan losses, non-accrual loans, other real estate owned, other-than-temporary investment impairments, intangible assets, stock option plans and income taxes. QNB bases its estimates on historical experience and various other factors and assumptions that are believed to be reasonable under the circumstances, the results of which form the basis for making judgments about the carrying values of assets and liabilities that are not readily apparent from other sources. Actual results may differ from these estimates under different assumptions or conditions.
All significant inter-company accounts and transactions have been eliminated in the consolidated financial statements. Tabular information, other than share data, is presented in thousands of dollars.
On September 13, 2006 the Securities and Exchange Commission (SEC) Staff issued Statement of Accounting Bulletin No. 108, Considering the Effects of Prior Year Misstatements when Quantifying Misstatements in Current Year Financial Statements (SAB 108). SAB 108 addresses how errors, built up over time in the balance sheet, should be considered from a materiality perspective and corrected. SAB 108 provides interpretive guidance on how the effects of the carryover or reversal of prior year misstatements should be considered in quantifying a current year misstatement. The SEC Staff believes that companies should quantify errors using both a balance sheet and an income statement approach and evaluate whether either of these approaches results in quantifying a misstatement that, when all relevant quantitative and qualitative factors are considered, is material. SAB 108 also describes the circumstances where it would be appropriate for a registrant to record a one-time cumulative effect adjustment to correct errors existing in prior years that previously had been considered immaterial as well as the required disclosures to investors. During 2006, the Corporation has not identified a situation for which it must apply SAB 108 for 2006, 2005 or 2004.
Investment securities that QNB has the positive intent and ability to hold to maturity are classified as held-to-maturity securities and reported at amortized cost. Debt and equity securities that are bought and held principally for the purpose of selling in the near term are classified as trading securities and reported at fair value, with unrealized gains and losses included in earnings. Debt and equity securities not classified as either held-to-maturity securities or trading securities are classified as available-for-sale securities and reported at fair value, with unrealized gains and losses, net of tax, excluded from earnings and reported as accumulated other comprehensive income or loss, a separate component of shareholders’ equity. Management determines the appropriate classification of securities at the time of purchase.
Available-for-sale securities include securities that management intends to use as part of its asset/liability management strategy and that may be sold in response to changes in market interest rates and related changes in the securities’ prepayment risk or to meet liquidity needs.
Premiums and discounts on debt securities are recognized in interest income using a constant yield method. Gains and losses on sales of investment securities are computed on the specific identification method and included in non-interest income.
NOTES TO CONSOLIDATED FINANCIAL STATEMENTS
Non-marketable Equity Securities
Non-marketable equity securities are comprised of restricted stock of the Federal Home Loan Bank of Pittsburgh (FHLB), the Federal Reserve Bank, and the Atlantic Central Bankers Bank. These restricted securities are carried at cost.
Other-than-Temporary Impairment of Investment Securities
Securities are evaluated periodically to determine whether a decline in their value is other-than-temporary. Management utilizes criteria such as the magnitude and duration of the decline, in addition to the reasons underlying the decline, to determine whether the loss in value is other-than-temporary. The term “other-than-temporary” is not intended to indicate that the decline is permanent, but indicates that the prospects for a near-term recovery of value is not necessarily favorable, or that there is a lack of evidence to support realizable value equal to or greater than carrying value of the investment. Once a decline in value is determined to be other-than-temporary, the value of the security is reduced and a corresponding charge to earnings is recognized.
Loans are stated at the principal amount outstanding, net of deferred loan fees and costs. Interest income is accrued on the principal amount outstanding. Loan origination and commitment fees and related direct costs are deferred and amortized to income over the term of the respective loan and loan commitment period as a yield adjustment.
Loans held-for-sale consist of residential mortgage loans and are carried at the lower of aggregate cost or market value. Gains and losses on residential mortgages held-for-sale are included in non-interest income.
Non-performing assets are comprised of accruing loans past due 90 days or more, non-accrual loans, other real estate owned and repossessed assets. Non-accrual loans are those on which the accrual of interest has ceased. Commercial loans and indirect lease financing loans are placed on non-accrual status immediately if, in the opinion of management, collection is doubtful, or when principal or interest is past due 90 days or more and collateral is insufficient to cover principal and interest. Interest accrued, but not collected at the date a loan is placed on non-accrual status, is reversed and charged against interest income. Subsequent cash receipts are applied either to the outstanding principal or recorded as interest income, depending on management’s assessment of the ultimate collectibility of principal and interest. Loans are returned to an accrual status when the borrower’s ability to make periodic principal and interest payments has returned to normal (i.e. brought current with respect to principal or interest or restructured) and the paying capacity of the borrower and/or the underlying collateral is deemed sufficient to cover principal and interest. Consumer loans are not automatically placed on non-accrual status when principal or interest payments are 90 days past due, but in most instances, are charged-off when deemed uncollectible or after reaching 120 days past due.
Accounting for impairment in the performance of a loan is required when it is probable that all amounts, including both principal and interest, will not be collected in accordance with the loan agreement. Impaired loans are measured based on the present value of expected future cash flows discounted at the loan’s effective interest rate or, at the loan’s observable market price or the fair value of the collateral if the loans are collateral dependent. Impairment criteria are applied to the loan portfolio exclusive of smaller homogeneous loans such as residential mortgage and consumer loans which are evaluated collectively for impairment.
Allowance for Loan Losses
QNB maintains an allowance for loan losses, which is intended to absorb probable known and inherent losses in the outstanding loan portfolio. The allowance is reduced by actual credit losses and is increased by the provision for loan losses and recoveries of previous losses. The provisions for loan losses are charged to earnings to bring the total allowance for loan losses to a level considered necessary by management.
The allowance for loan losses is based on management’s continuing review and evaluation of the loan portfolio. The level of the allowance is determined by assigning specific reserves to individually identified problem credits and general reserves to all other loans. The portion of the allowance that is allocated to internally criticized and non-accrual loans is determined by estimating the inherent loss on each credit after giving consideration to the value of underlying collateral. The general reserves are based on the composition and risk characteristics of the loan portfolio, including the nature of the loan portfolio, credit concentration trends, historic and anticipated delinquency and loss experience, as well as other qualitative factors such as current economic trends.
Management emphasizes loan quality and close monitoring of potential problem credits. Credit risk identification and review processes are utilized in order to assess and monitor the degree of risk in the loan portfolio. QNB’s lending and loan administration staff are charged with reviewing the loan portfolio and identifying changes in the economy or in a borrower’s circumstances which may affect the ability to repay debt or the value of pledged collateral. A loan classification and review system exists that identifies those loans with a higher than normal risk of uncollectibility. Each commercial loan is assigned a grade based upon an assessment of the borrower’s financial capacity to service the debt and the presence and value of collateral for the loan. An independent loan review group tests risk assessments and evaluates the adequacy of the allowance for loan losses. Management meets monthly to review the credit quality of the loan portfolio and quarterly to review the allowance for loan losses.
NOTES TO CONSOLIDATED FINANCIAL STATEMENTS
In addition, various regulatory agencies, as an integral part of their examination process, periodically review QNB’s allowance for loan losses. Such agencies may require QNB to recognize additions to the allowance based on their judgments using information available to them at the time of their examination.
Management believes that it uses the best information available to make determinations about the adequacy of the allowance and that it has established its existing allowance for loan losses in accordance with GAAP. If circumstances differ substantially from the assumptions used in making determinations, future adjustments to the allowance for loan losses may be necessary and results of operations could be affected. Because future events affecting borrowers and collateral cannot be predicted with certainty, there can be no assurance that increases to the allowance will not be necessary should the quality of any loans deteriorate as a result of the factors discussed above.
Transfers and Servicing of Financial Assets
QNB continues to carry servicing assets, relating to mortgage loans it has sold. Such servicing assets are recorded based on the relative fair values of the servicing assets and loans sold at the date of transfer. The servicing asset is amortized in proportion to and over the period of net servicing income. Servicing assets are assessed for impairment based on their disaggregated fair value.
Premises and equipment are stated at cost, less accumulated depreciation and amortization. Depreciation and amortization are calculated principally on an accelerated or straight-line basis over the estimated useful lives of the assets as follows: buildings—10 to 40 years, and equipment—3 to 10 years. Expenditures for maintenance and repairs are charged to operations as incurred. Gains or losses upon disposition are reflected in earnings as realized.
Bank-Owned Life Insurance
The Bank invests in bank-owned life insurance (BOLI) as a source of funding for employee benefit expenses. BOLI involves the purchasing of life insurance by the Bank on a chosen group of employees. The Bank is the owner and beneficiary of the policies. Income from the increase in cash surrender value of the policies is included on the income statement.
At December 31, 2006, QNB sponsored stock-based compensation plans, administered by a committee, under which both qualified and non-qualified stock options may be granted periodically to certain employees. QNB accounted for all awards granted between January 1, 2002 and December 31, 2005 under the “fair value” approach under Financial Accounting Standards Board (FASB) Statement No. 123, Accounting for Stock-Based Compensation. Effective January 1, 2006, QNB adopted FASB Statement No. 123 (revised 2004), Share-Based Payment (FASB No. 123r), using the modified prospective application method. The modified prospective application method applies to new awards, to any outstanding liability awards, and to awards modified, repurchased, or cancelled after January 1, 2006. For all awards granted prior to January 1, 2006, unrecognized compensation cost, on the date of adoption, will be recognized as an expense in future periods. The results for prior periods have not been restated.
The adoption of FASB No. 123r reduced net income by approximately $118,000 for year ended December 31, 2006. The following table illustrates the effect on net income and earnings per share if QNB had applied the fair value recognition provisions to stock-based employee compensation during the period presented. For purposes of this pro forma disclosure, the value of the options is estimated using the Black-Scholes option-pricing model and amortized to expense over the options’ vesting period.
| |
December 31, | | 2005 | | 2004 | |
| | | | | | |
| Net income, as reported | | $ | 5,046 | | $ | 6,203 | |
| Deduct: Total stock-based employee compensation expense determined under fair value based method for all awards, net of related tax effects | | | 101 | | | 95 | |
| Pro forma net income | | $ | 4,945 | | $ | 6,108 | |
| Earnings per share | | | | | | | |
| Basic - as reported | | $ | 1.63 | | $ | 2.00 | |
| Basic - pro forma | | $ | 1.59 | | $ | 1.97 | |
| Diluted - as reported | | $ | 1.59 | | $ | 1.95 | |
| Diluted - pro forma | | $ | 1.56 | | $ | 1.92 | |
NOTES TO CONSOLIDATED FINANCIAL STATEMENTS
The fair value of each option is amortized into compensation expense on a straight-line basis between the grant date for the option and each vesting date. QNB estimated the fair value of stock options on the date of the grant using the Black-Scholes option pricing model. The model requires the use of numerous assumptions, many of which are subjective in nature. The following assumptions were used in the option pricing model in determining the fair value of options granted during the periods presented.
| |
| Year ended December 31, | | 2006 | | 2005 | | 2004 | |
| Risk free interest rate | | | 4.27 | % | | 4.18 | % | | 4.39 | % |
| Dividend yield | | | 3.23 | | | 2.40 | | | 2.20 | |
| Volatility | | | 13.28 | | | 14.05 | | | 13.61 | |
| Expected life | | | 5 yrs. | | | 10 yrs. | | | 10 yrs. | |
The risk-free interest rate was selected based upon yields of U.S. Treasury issues with a term equal to the expected life of the option being valued. Historical information was the primary basis for the selection of the expected dividend yield, expected volatility and expected lives of the options.
The weighted average fair value per share of options granted during 2006, 2005 and 2004 was $3.13, $6.46 and $7.18, respectively.
QNB accounts for income taxes under the asset/liability method. Deferred tax assets and liabilities are recognized for the future tax consequences attributable to differences between the financial statement carrying amounts of existing assets and liabilities and their respective tax bases, as well as operating loss and tax credit carryforwards. Deferred tax assets and liabilities are measured using enacted tax rates expected to apply to taxable income in the years in which those temporary differences are expected to be recovered or settled. The effect on deferred tax assets and liabilities of a change in tax rates is recognized in income in the period that includes the enactment date. A valuation allowance is established against deferred tax assets when, in the judgment of management, it is more likely than not that such deferred tax assets will not become available. Because the judgment about the level of future taxable income is dependent to a great extent on matters that may, at least in part, be beyond QNB’s control, it is at least reasonably possible that management’s judgment about the need for a valuation allowance for deferred taxes could change in the near term.
Basic earnings per share excludes any dilutive effects of options and is computed by dividing net income by the weighted average number of shares outstanding during the period. Diluted earnings per share gives effect to all dilutive potential common shares that were outstanding during the period.
Comprehensive income is defined as the change in equity of a business entity during a period due to transactions and other events and circumstances, excluding those resulting from investments by and distributions to owners. For QNB, the primary component of other comprehensive income is the unrealized holding gains or losses on available-for-sale investment securities.
Recent Accounting Pronouncements
Accounting for Certain Hybrid Instruments
In February 2006, the FASB issued FASB Statement No. 155 (FASB No. 155), Accounting for Certain Hybrid Instruments, as an amendment of FASB Statements No. 133 and 140. FASB No. 155 allows financial instruments that have embedded derivatives to be accounted for as a whole (eliminating the need to bifurcate the derivative from its host) if the holder elects to account for the whole instrument on a fair value basis. This statement is effective for all financial instruments acquired or issued after the beginning of an entity’s first fiscal year that begins after September 15, 2006. The adoption of this standard is not expected to have a material effect on the QNB’s results of operations or financial position.
Accounting for Servicing of Financial Assets
In March 2006, the FASB issued FASB Statement No. 156 (FASB No. 156), Accounting for Servicing of Financial Assets. This Statement, which is an amendment to FASB No. 140, will simplify the accounting for servicing assets and liabilities, such as those common with mortgage securitization activities. Specifically, FASB No. 156 addresses the recognition and measurement of separately recognized servicing assets and liabilities and provides an approach to simplify efforts to obtain hedge-like (offset) accounting. FASB No. 156 also clarifies when an obligation to service financial assets should be separately recognized as a servicing asset or a servicing liability, requires that a separately recognized servicing asset or servicing liability be initially measured at fair value, if practicable, and permits an entity with a separately recognized servicing asset or servicing liability to choose either of the amortization or fair value methods for subsequent measurement. The provisions of FASB No. 156 are effective as of the beginning of the first fiscal year that begins after September 15, 2006. The adoption of this standard is not expected to have a material effect on QNB’s results of operations or financial position.
NOTES TO CONSOLIDATED FINANCIAL STATEMENTS
Fair Value Measurements
In September 2006, the FASB issued FASB Statement No. 157 (FASB No. 157), Fair Value Measurements, which provides enhanced guidance for using fair value to measure assets and liabilities. The standard applies whenever other standards require or permit assets or liabilities to be measured at fair value. The Standard does not expand the use of fair value in any new circumstances. FASB No. 157 is effective for financial statements issued for fiscal years beginning after November 15, 2007 and interim periods within those fiscal years. Early adoption is permitted. The adoption of this standard is not expected to have a material effect on QNB’s results of operations or financial position.
Accounting for Uncertainty in Income Taxes
In June 2006, the FASB issued FASB Interpretation No. 48 (FIN 48), Accounting for Uncertainty in Income Taxes. FIN 48 is an interpretation of FASB No. 109, Accounting for Income Taxes, and it seeks to reduce the diversity in practice associated with certain aspects of measurement and recognition in accounting for income taxes. In addition, FIN 48 requires expanded disclosure with respect to the uncertainty in income taxes and is effective for fiscal years beginning after December 15, 2006. The adoption of this standard is not expected to have a material effect on QNB’s results of operations
Accounting for Deferred Compensation
In September 2006, the FASB reached consensus on the guidance provided by Emerging Issues Task Force Issue 06-4 (EITF 06-4), Accounting for Deferred Compensation and Postretirement Benefit Aspects of Endorsement Split-Dollar Life Insurance Arrangements. The guidance is applicable to endorsement split-dollar life insurance arrangements, whereby the employer owns and controls the insurance policy, that are associated with a postretirement benefit. EITF 06-4 requires that for a split-dollar life insurance arrangement within the scope of the Issue, an employer should recognize a liability for future benefits in accordance with FASB No. 106 (if, in substance, a postretirement benefit plan exists) or Accounting Principles Board Opinion No. 12 (if the arrangement is, in substance, an individual deferred compensation contract) based on the substantive agreement with the employee. EITF 06-4 is effective for fiscal years beginning after December 15, 2007. QNB is currently evaluating the impact the adoption of the standard will have on its results of operations and financial position.
Accounting for Purchases of Life Insurance
In September 2006, the FASB reached consensus on the guidance provided by Emerging Issues Task Force Issue 06-5 (EITF 06-5), Accounting for Purchases of Life Insurance—Determining the Amount That Could Be Realized in Accordance with FASB Technical Bulletin No. 85-4, Accounting for Purchases of Life Insurance. EITF 06-5 states that a policyholder should consider any additional amounts included in the contractual terms of the insurance policy other than the cash surrender value in determining the amount that could be realized under the insurance contract. EITF 06-5 also states that a policyholder should determine the amount that could be realized under the life insurance contract assuming the surrender of an individual-life by individual-life policy (or certificate by certificate in a group policy). EITF 06-5 is effective for fiscal years beginning after December 15, 2006. QNB is currently evaluating the impact the adoption of the standard will have on its results of operations and financial position.
Cash and cash equivalents for purposes of this statement consist of cash on hand, cash items in process of collection, amounts due from banks, interest earning deposits in other financial institutions and federal funds sold.
Note 2 - Earnings Per Share
The following table sets forth the computation of basic and diluted earnings per share:
| |
| | | 2006 | | 2005 | | 2004 | |
| | | | | | | | |
| Numerator for basic and diluted earnings per share - net income | | $ | 5,420 | | $ | 5,046 | | $ | 6,203 | |
| Denominator for basic earnings per share - weighted average shares outstanding | | | 3,124,724 | | | 3,101,754 | | | 3,096,360 | |
| Effect of dilutive securities - employee stock options | | | 51,986 | | | 72,893 | | | 81,792 | |
| Denominator for diluted earnings per share - adjusted weighted average shares outstanding | | | 3,176,710 | | | 3,174,647 | | | 3,178,152 | |
| Earnings per share - basic | | $ | 1.73 | | $ | 1.63 | | $ | 2.00 | |
| Earnings per share - diluted | | | 1.71 | | | 1.59 | | | 1.95 | |
There were 52,300 and 40,000 stock options that were anti-dilutive as of December 31, 2006 and 2005, respectively. These stock options were not included in the above calculation.
NOTES TO CONSOLIDATED FINANCIAL STATEMENTS
Note 3 - Cash And Due From Banks
Included in cash and due from banks are reserves in the form of deposits with the Federal Reserve Bank of $225,000 and $8,807,000 to satisfy federal regulatory requirements as of December 31, 2006 and 2005, respectively.
Note 4 - Investment Securities Available-For-Sale
The amortized cost and estimated fair values of investment securities available-for-sale at December 31, 2006 and 2005 were as follows:
| |
December 31, | | 2006 | | 2005 | |
| | | | | Gross | | Gross | | | | | | Gross | | Gross | | | |
| | | Aggregate | | unrealized | | unrealized | | | | Aggregate | | unrealized | | unrealized | | | |
| | | fair | | holding | | holding | | Amortized | | fair | | holding | | holding | | Amortized | |
| | | value | | gains | | losses | | cost | | value | | gains | | losses | | cost | |
| U.S. Treasury | | $ | 4,984 | | $ | — | | $ | 9 | | $ | 4,993 | | $ | 6,002 | | $ | | | $ | 39 | | $ | 6,041 | |
| U.S. Government agencies | | | 33,244 | | | 96 | | | 91 | | | 33,239 | | | 23,824 | | | 1 | | | 326 | | | 24,149 | |
| State and municipal securities | | | 36,121 | | | 784 | | | 123 | | | 35,460 | | | 47,530 | | | 1,073 | | | 226 | | | 46,683 | |
| Mortgage-backed securities | | | 67,471 | | | 36 | | | 1,227 | | | 68,662 | | | 57,733 | | | 29 | | | 1,241 | | | 58,945 | |
| Collateralized mortgage obligations (CMOs) | | | 59,033 | | | — | | | 1,777 | | | 60,810 | | | 71,475 | | | 6 | | | 2,169 | | | 73,638 | |
| Other debt securities | | | 14,373 | | | 587 | | | 5 | | | 13,791 | | | 18,252 | | | 1,043 | | | 344 | | | 17,553 | |
| Equity securities | | | 4,592 | | | 515 | | | 21 | | | 4,098 | | | 8,459 | | | 744 | | | 463 | | | 8,178 | |
| Total investment securities available-for-sale | | $ | 219,818 | | $ | 2,018 | | $ | 3,253 | | $ | 221,053 | | $ | 233,275 | | $ | 2,896 | | $ | 4,808 | | $ | 235,187 | |
The amortized cost and estimated fair value of securities available-for-sale by contractual maturity at December 31, 2006 are shown in the following table. Expected maturities will differ from contractual maturities because borrowers may have the right to call or prepay obligations with or without call or prepayment penalties. Securities are assigned to categories based on contractual maturity except for mortgage-backed securities and CMOs which are based on the estimated average life of these securities.
| |
| | | Aggregate | | Amortized | |
December 31, 2006 | | fair value | | cost | |
| Due in one year or less | | $ | 14,849 | | $ | 14,884 | |
| Due after one year through five years | | | 129,153 | | | 131,518 | |
| Due after five years through ten years | | | 56,326 | | | 56,009 | |
| Due after ten years | | | 14,898 | | | 14,544 | |
| Equity securities | | | 4,592 | | | 4,098 | |
| Total securities available-for-sale | | $ | 219,818 | | $ | 221,053 | |
Proceeds from sales of investment securities available-for-sale were as follows:
| |
| | | 2006 | | 2005 | | 2004 | |
| Proceeds | | $ | 46,490 | | $ | 45,105 | | $ | 66,715 | |
| Gross gains | | | 1,309 | | | 812 | | | 1,207 | |
| Gross losses | | | 1,047 | | | 1,539 | | | 358 | |
Included in gross losses for 2006, 2005 and 2004 were other-than-temporary impairment charges of $51,000, $1,253,000 and $0, respectively.
Held-To-Maturity
The amortized cost and estimated fair values of investment securities held-to-maturity at December 31, 2006 and 2005 were as follows:
| |
December 31, | | 2006 | | 2005 | |
| | | | | Gross | | Gross | | | | | | Gross | | Gross | | | |
| | | | | unrealized | | unrealized | | Aggregate | | | | unrealized | | unrealized | | Aggregate | |
| | | Amortized | | holding | | holding | | fair | | Amortized | | holding | | holding | | fair | |
| | | cost | | gains | | losses | | value | | cost | | gains | | losses | | value | |
| State and municipal securities | | $ | 5,021 | | $ | 147 | | $ | — | | $ | 5,168 | | $ | 5,897 | | $ | 185 | | $ | | | $ | 6,082 | |
NOTES TO CONSOLIDATED FINANCIAL STATEMENTS
The amortized cost and estimated fair values of securities held-to-maturity by contractual maturity at December 31, 2006, are shown in the following table. Expected maturities will differ from contractual maturities because borrowers may have the right to call or prepay obligations with or without penalties.
| |
| | | Aggregate | | Amortized | |
December 31, 2006 | | fair value | | cost | |
| Due in one year or less | | $ | 639 | | $ | 636 | |
| Due after one year through five years | | | 573 | | | 563 | |
| Due after five years through ten years | | | 786 | | | 759 | |
| Due after ten years | | | 3,170 | | | 3,063 | |
| Total securities held-to-maturity | | $ | 5,168 | | $ | 5,021 | |
There were no sales of investment securities classified as held-to-maturity during 2006, 2005 or 2004.
At December 31, 2006 and 2005, investment securities available-for-sale totaling $75,793,000 and $68,917,000 were pledged as collateral for repurchase agreements and deposits of public funds.
The table below indicates the length of time individual securities have been in a continuous unrealized loss position at December 31, 2006 and 2005:
| |
| | | Less than 12 months | | 12 months or longer | | | | Total | |
| | | Fair | | Unrealized | | Fair | | Unrealized | | Fair | | Unrealized | |
As of December 31, 2006 | | value | | losses | | value | | losses | | value | | losses | |
| U.S. Treasury | | $ | 1,998 | | $ | 2 | | $ | 1,990 | | $ | 7 | | $ | 3,988 | | $ | 9 | |
| U.S. Government agencies | | | 12,966 | | | 28 | | | 5,782 | | | 63 | | | 18,748 | | | 91 | |
| State and municipal securities | | | 683 | | | 1 | | | 4,926 | | | 122 | | | 5,609 | | | 123 | |
| Mortgage-backed securities | | | 17,609 | | | 104 | | | 45,083 | | | 1,123 | | | 62,692 | | | 1,227 | |
| Collateralized mortgage obligations (CMOs) | | | 775 | | | 1 | | | 58,258 | | | 1,776 | | | 59,033 | | | 1,777 | |
| Other debt securities | | | 2,001 | | | 5 | | | — | | | — | | | 2,001 | | | 5 | |
| Equity securities | | | 638 | | | 11 | | | 87 | | | 10 | | | 725 | | | 21 | |
| Total | | $ | 36,670 | | $ | 153 | | $ | 116,126 | | $ | 3,101 | | $ | 152,796 | | $ | 3,253 | |
| |
| | | Less than 12 months | | | | 12 months or longer | | | | | | Total | |
| | | Fair | | Unrealized | | Fair | | Unrealized | | Fair | | Unrealized | |
As of December 31, 2005 | | value | | losses | | value | | losses | | value | | losses | |
| U.S. Treasury | | $ | 2,999 | | $ | 7 | | $ | 3,003 | | $ | 32 | | $ | 6,002 | | $ | 39 | |
| U.S. Government agencies | | | 17,046 | | | 211 | | | 5,777 | | | 115 | | | 22,823 | | | 326 | |
| State and municipal securities | | | 9,317 | | | 57 | | | 4,647 | | | 169 | | | 13,964 | | | 226 | |
| Mortgage-backed securities | | | 43,780 | | | 882 | | | 12,762 | | | 359 | | | 56,542 | | | 1,241 | |
| Collateralized mortgage obligations (CMOs) | | | 27,558 | | | 397 | | | 42,967 | | | 1,772 | | | 70,525 | | | 2,169 | |
| Other debt securities | | | 2,214 | | | 344 | | | | | | | | | 2,214 | | | 344 | |
| Equity securities | | | 1,030 | | | 73 | | | 1,923 | | | 390 | | | 2,953 | | | 463 | |
| Total | | $ | 103,944 | | $ | 1,971 | | $ | 71,079 | | $ | 2,837 | | $ | 175,023 | | $ | 4,808 | |
QNB has 150 securities in an unrealized loss position at December 31, 2006. The unrealized losses in QNB’s investment holdings are related to the dynamic nature of interest rates. One of QNB’s prime objectives with the investment portfolio is to invest excess liquidity that is not needed to fund loans. As a result, QNB adds new investments throughout the year as they become available through deposit inflows or roll-off from loans and securities. The unrealized losses in certain holdings are the result of these being purchased when market interest rates were lower than at year end. As interest rates increase, fixed-rate securities generally fall in market price to reflect the higher market yield. If held to maturity, all of the bonds will mature at par, and QNB will not realize a loss.
NOTES TO CONSOLIDATED FINANCIAL STATEMENTS
Note 5 - Loans
| |
December 31, | | 2006 | | 2005 | |
| Commercial and industrial | | $ | 72,718 | | $ | 64,812 | |
| Construction | | | 10,503 | | | 7,229 | |
| Real estate-commercial | | | 118,166 | | | 104,793 | |
| Real estate-residential | | | 123,531 | | | 112,920 | |
| Consumer | | | 5,044 | | | 5,080 | |
| Indirect lease financing | | | 13,405 | | | 6,451 | |
| Total loans | | | 343,367 | | | 301,285 | |
| Unearned costs | | | 129 | | | 64 | |
| Total loans, net of unearned costs (income) | | $ | 343,496 | | $ | 301,349 | |
Real estate commercial loans include all loans collateralized at least in part by commercial real estate. These loans may not be for the expressed purpose of conducting commercial real estate transactions.
At December 31, 2006, the recorded investment in loans for which impairment has been recognized totaled $403,000 of which none required an allowance for loan loss. At December 31, 2005, there were no loans identified for impairment. Most of the loans identified as impaired are collateral-dependent. For the years ended December 31, 2006, 2005 and 2004, the average recorded investment in impaired loans was approximately $44,000, $11,000 and $507,000, respectively. QNB recognized $13,000, $38,000 and $111,000 of interest income on these loans in 2006, 2005 and 2004, respectively.
At December 31, 2006 there were $416,000 of loans on non-accrual status. There were no non-accrual loans at December 31, 2005. Some of these loans are included in the impaired loan total above. If interest on non-accrual loans had been accrued throughout the period, interest income for the years ended December 31, 2006, 2005 and 2004, would have increased approximately $8,000, $0 and $21,000, respectively. The amount of interest income on these loans that was included in net income in 2006 was $9,000. There was no interest income recognized on non-accrual loans in 2005 or 2004.
QNB generally lends in its trade area which is comprised of Quakertown and the surrounding communities. To a large extent, QNB makes loans collateralized at least in part by real estate. Its lending activities could be affected by changes in the general economy, the regional economy, or real estate values. At December 31, 2006, there were no concentrations of loans exceeding 10 percent of total loans other than disclosed in the table above.
Note 6 - Allowance For Loan Losses
Activity in the allowance for loan losses is shown below:
| |
December 31, | | 2006 | | 2005 | | 2004 | |
| Balance at beginning of year | | $ | 2,526 | | $ | 2,612 | | $ | 2,929 | |
| Charge-offs | | | (187 | ) | | (115 | ) | | (406 | ) |
| Recoveries | | | 45 | | | 29 | | | 89 | |
| Net charge-offs | | | (142 | ) | | (86 | ) | | (317 | ) |
| Provision for loan losses | | | 345 | | | | | | | |
| Balance at end of year | | $ | 2,729 | | $ | 2,526 | | $ | 2,612 | |
NOTES TO CONSOLIDATED FINANCIAL STATEMENTS
Note 7 - Premises And Equipment
Premises and equipment, stated at cost less accumulated depreciation and amortization, are summarized below:
| |
December 31, | | 2006 | | 2005 | |
| Land and buildings | | $ | 6,719 | | $ | 5,812 | |
| Furniture and equipment | | | 8,733 | | | 7,987 | |
| Leasehold improvements | | | 1,655 | | | 1,655 | |
| Book value | | | 17,107 | | | 15,454 | |
| Accumulated depreciation and amortization | | | (10,665 | ) | | (10,054 | ) |
| Net book value | | $ | 6,442 | | $ | 5,400 | |
Depreciation and amortization expense on premises and equipment amounted to $744,000, $890,000 and $907,000 for the years ended December 31, 2006, 2005 and 2004, respectively.
Note 8 - Intangible Assets
As a result of the purchase of deposits in 1997, QNB recorded a deposit premium of $511,000. This premium is being amortized, for book purposes, over ten years and is reviewed annually for impairment. The net deposit premium intangible was $43,000 and $94,000 at December 31, 2006 and 2005, respectively. Amortization expense for core deposit intangibles for each of the years ended December 31, 2006, 2005 and 2004 was $51,000.
The following table reflects the components of mortgage servicing rights as of the periods indicated:
|
Years Ended December 31, | | 2006 | | 2005 | | 2004 | |
| Mortgage servicing rights beginning balance | | $ | 528 | | $ | 552 | | $ | 582 | |
| Mortgage servicing rights capitalized | | | 31 | | | 80 | | | 66 | |
| Mortgage servicing rights amortized | | | (87 | ) | | (109 | ) | | (122 | ) |
| Fair market value adjustments | | | | | | 5 | | | 26 | |
| Mortgage servicing rights ending balance | | $ | 472 | | $ | 528 | | $ | 552 | |
| Mortgage loans serviced for others | | $ | 70,816 | | $ | 77,196 | | $ | 78,904 | |
| Amortization expense of intangible assets for the years ended December 31 | | | 138 | | | 160 | | | 173 | |
The annual estimated amortization expense of intangible assets for each of the five succeeding fiscal years is as follows:
| Estimated annual amortization expense for the year ended December 31, 2007 | | $ | 134 | |
| for the year ended December 31, 2008 | | | 79 | |
| for the year ended December 31, 2009 | | | 65 | |
| for the year ended December 31, 2010 | | | 53 | |
| for the year ended December 31, 2011 | | | 43 | |
Note 9 - Time Deposits
The aggregate amount of time deposits including deposits in denominations of $100,000 or more was $232,832,000 and $211,129,000 at December 31, 2006 and 2005, respectively. The scheduled maturities of time deposits as of December 31, 2006 for the years 2007 through 2011 and thereafter are approximately $160,119,000, $29,093,000, $33,032,000, $8,248,000, $2,310,000 and $30,000, respectively.
NOTES TO CONSOLIDATED FINANCIAL STATEMENTS
Note 10 - Short-Term Borrowings
| |
| | | Securities Sold under | | Other | |
December 31, | | Agreements to Repurchase (a) | | Short-term Borrowings (b) | |
| 2006 | | | | | |
| Balance | | $ | 29,513 | | $ | 600 | |
| Maximum indebtedness at any month end | | | 29,513 | | | 5,061 | |
| Daily average indebtedness outstanding | | | 19,755 | | | 1,718 | |
| Average rate paid for the year | | | 3.29 | % | | 5.02 | % |
| Average rate on period-end borrowings | | | 3.43 | | | 5.04 | |
| 2005 | | | | | | | |
| Balance | | $ | 17,506 | | $ | 2,090 | |
| Maximum indebtedness at any month end | | | 20,287 | | | 2,090 | |
| Daily average indebtedness outstanding | | | 13,959 | | | 687 | |
| Average rate paid for the year | | | 2.13 | % | | 3.80 | % |
| Average rate on period-end borrowings | | | 2.53 | | | 4.14 | |
| | | | | | | | |
| (a) | Securities sold under agreements to repurchase mature within 30 days. The repurchase agreements were collateralized by U.S. Government agency securities, mortgage-backed securities and CMOs with an amortized cost of $29,992,000 and $21,453,000 and a fair value of $29,332,000 and $20,907,000 at December 31, 2006 and 2005, respectively. These securities are held in safekeeping at the Federal Reserve Bank. |
| (b) | Other short-term borrowings include federal funds purchased, overnight borrowings from FHLB and Treasury tax and loan notes. |
The Bank has two unsecured federal funds lines granted by correspondent banks totaling $21,000,000. Federal funds purchased totaled $1,490,000 at December 31, 2005.
Note 11 - FHLB Advances
Under terms of its agreement with the FHLB, QNB maintains otherwise unencumbered qualifying assets (principally 1-4 family residential mortgage loans and U.S. Government and agency notes, bonds, and mortgage-backed securities) in the amount of at least as much as its advances from the FHLB. QNB’s FHLB stock of $3,375,000 and $3,594,000 at December 31, 2006 and 2005, respectively, is also pledged to secure these advances.
QNB has a maximum borrowing capacity with the FHLB of approximately $241,946,000. At December 31, 2006 and 2005, there were $52,000,000 and $55,000,000, respectively, in outstanding advances with a weighted average interest rate of 5.55 percent and 5.47 percent, respectively. Advances are made pursuant to several different credit programs offered by the FHLB. At December 31, 2006, $35,000,000 of these advances are convertible, whereby the FHLB has the option at a predetermined time to convert the fixed interest rate to an adjustable rate tied to LIBOR. QNB then has the option to prepay these advances if the FHLB converts the interest rate.
Outstanding borrowings as of December 31, 2006 mature as follows:
|
| Loans maturing in 2007 with a rate of 5.45% | | $ | 2,000 | |
| Loans maturing in 2009 with rates ranging from 5.05% to 5.97% | | | 26,500 | |
| Loans maturing in 2010 with rates ranging from 5.86% to 6.02% | | | 9,500 | |
| Loans maturing in 2011 with rates ranging from 4.99% to 6.04% | | | 14,000 | |
| Total FHLB advances | | $ | 52,000 | |
NOTES TO CONSOLIDATED FINANCIAL STATEMENTS
Note 12 - Income Taxes
The components of the provision for income taxes are as follows:
| |
Year Ended December 31, | | 2006 | | 2005 | | 2004 | |
| Current federal income taxes | | $ | 1,217 | | $ | 1,479 | | $ | 1,405 | |
| Deferred federal income taxes | | | (183 | ) | | (81 | ) | | 299 | |
| Net provision | | $ | 1,034 | | $ | 1,398 | | $ | 1,704 | |
At December 31, 2006 and 2005, the tax effects of temporary differences that represent the significant portion of deferred tax assets and liabilities are as follows:
| |
Year Ended December 31, | | 2006 | | 2005 | |
Deferred tax assets | | | | | |
| Allowance for loan losses | | $ | 928 | | $ | 750 | |
| Impaired equity securities | | | 52 | | | 384 | |
| Capital loss carryover | | | 77 | | | | |
| Net unrealized holding losses on investment securities available for sale | | | 420 | | | 650 | |
| Deferred compensation | | | 64 | | | 74 | |
| Deposit premium | | | 53 | | | 47 | |
| Other | | | 7 | | | 13 | |
| Total deferred tax assets | | | 1,601 | | | 1,918 | |
| Valuation allowance | | | | | | (209 | ) |
| Net deferred tax assets | | | 1,601 | | | 1,709 | |
| | | | | | | | |
Deferred tax liabilities | | | | | | | |
| Depreciation | | | 32 | | | 60 | |
| Mortgage servicing rights | | | 161 | | | 180 | |
| Other | | | 103 | | | 117 | |
| Total deferred tax liabilities | | | 296 | | | 357 | |
| Net deferred tax asset | | $ | 1,305 | | $ | 1,352 | |
The realizability of deferred tax assets is dependent upon a variety of factors, including the generation of future taxable income, the existence of taxes paid and recoverable, the reversal of deferred tax liabilities and tax planning strategies. A valuation allowance of $209,000 was established during the year ended December 31, 2005 to offset a portion of the tax benefits associated with certain impaired securities that management believed may not be realizable. During 2006, QNB was able to recognize tax benefits due to realized and unrealized capital gains which allowed for the reversal of the entire valuation allowance. Based upon these and other factors, management believes it is more likely than not that QNB will realize the benefits of these remaining deferred tax assets. The net deferred tax asset is included in other assets on the consolidated balance sheet. As of December 31, 2006, QNB has a capital loss carryover of $228,000 that will expire on December 31, 2011, if not utilized.
A reconciliation of the tax provision on income before taxes computed at the statutory rate of 34 percent and the actual tax provision was as follows:
|
Year Ended December 31, | | 2006 | | 2005 | | 2004 | |
| Provision at statutory rate | | $ | 2,194 | | $ | 2,191 | | $ | 2,688 | |
| Tax-exempt interest and dividend income | | | (830 | ) | | (882 | ) | | (879 | ) |
| Bank-owned life insurance | | | (99 | ) | | (98 | ) | | (102 | ) |
| Life insurance proceeds | | | | | | (21 | ) | | | |
| Stock-based compensation expense | | | 40 | | | | | | | |
| Change in valuation allowance | | | (209 | ) | | 209 | | | | |
| Other | | | (62 | ) | | (1 | ) | | (3 | ) |
| Total provision | | $ | 1,034 | | $ | 1,398 | | $ | 1,704 | |
NOTES TO CONSOLIDATED FINANCIAL STATEMENTS
Note 13 - Employee Benefit Plans
The Quakertown National Bank Retirement Savings Plan provides for elective employee contributions up to 20 percent of compensation and a matching company contribution limited to 3 percent. In addition, the plan provides for safe harbor nonelective contributions of 5 percent of total compensation by QNB. For 2006, 2005 and 2004, QNB contributed $145,656, $145,825 and $140,131, respectively, as a matching contribution and $276,789, $275,908 and $259,981, respectively, as a safe harbor contribution to the plan.
QNB’s Employee Stock Purchase Plan (the Plan) offers eligible employees an opportunity to purchase shares of QNB Corp. Common Stock at a 10 percent discount from the lesser of fair market value on the first or last day of each offering period (as defined by the plan). The 2001 Plan expired on June 1, 2006. The 2001 Plan authorized the issuance of 42,000 shares. As of December 31, 2006, 15,399 shares were issued under the 2001 Plan. The 2006 Plan authorizes the issuance of 20,000 shares. As of December 31, 2006, 1,578 shares were issued under the 2006 Plan. The 2006 Plan expires May 31, 2011.
Shares issued pursuant to the Plan were as follows:
| |
Year Ended December 31, | | Shares | | Price per Share | |
| 2006 | | | 3,071 | | | $ 23.40 and $ 23.63 | |
| 2005 | | | 2,794 | | | 24.98 and 27.90 | |
| 2004 | | | 2,679 | | | 27.45 and 27.45 | |
Note 14 - Stock Option Plan
QNB has stock option plans (the Plans) administered by a committee which consists of three or more members of QNB’s Board of Directors. The Plans provide for the granting of either (i) Non-Qualified Stock Options (NQSOs) or (ii) Incentive Stock Options (ISOs). The exercise price of an option, as defined by the Plans, is the fair market value of QNB’s common stock at the date of grant. The Plans provide for the exercise either in cash or in securities of the Corporation or in any combination thereof.
The 1998 Plan authorizes the issuance of 220,500 shares. The time period by which any option is exercisable under the Plan is determined by the Committee but shall not commence before the expiration of six months after the date of grant or continue beyond the expiration of ten years after the date the option is awarded. As of December 31, 2006, there were 225,058 options granted, 9,994 options cancelled, 34,641 options exercised and 180,423 options outstanding under this Plan.
The 2005 Plan authorizes the issuance of 200,000 shares. The terms of the 2005 Plan are identical to the 1998 Plan except the options expire five years after the grant date. As of December 31, 2006, there were 8,900 options granted and outstanding under this Plan.
As of December 31, 2006, there was approximately $91,000 of unrecognized compensation cost related to unvested share-based compensation awards granted. That cost is expected to be recognized over the next two years.
Stock option activity during 2006, 2005 and 2004, was as follows:
| |
| | | | | | | Weighted Average | | | |
| | | | | Weighted | | Remaining | | Aggregate Intrinsic | |
| | | Number of Options | | Average Exercise Price | | Contractual Term (in yrs) | | Value | |
Outstanding at December 31, 2003 | | | 162,412 | | $ | 16.15 | | | 7.29 | | | | |
| Exercised | | | (20 | ) | | | | | 13.09 | | | | |
| Granted | | | 20,000 | | | | | | 33.25 | | | | |
| Outstanding at December 31, 2004 | | | 182,392 | | | 18.03 | | | 6.64 | | | | |
| Exercised | | | (3,918 | ) | | | | | 15.21 | | | | |
| Granted | | | 20,000 | | | 32.35 | | | | | | | |
| Cancelled | | | (5,100 | ) | | | | | 32.79 | | | | |
| Outstanding December 31, 2005 | | | 193,374 19.18 | | | 5.93 | | | | | | | |
| Exercised | | | (21,451 | ) | | | | | 16.27 | | | | |
| Granted | | | 17,400 | | | | | | 26.00 | | | | |
| Outstanding at December 31, 2006 | | | 189,323 | | | 20.14 | | | 4.92 | | $ | 1,279 | |
| Exercisable at December 31, 2006 | | | 137,023 | | $ | 16.16 | | | 4.33 | | $ | 1,279 | |
NOTES TO CONSOLIDATED FINANCIAL STATEMENTS
The cash proceeds, tax benefits and intrinsic value related to total stock options exercised during 2006, 2005 and 2004 are as follows:
| |
| | | 2006 | | 2005 | | 2004 | |
| Proceeds from stock options exercised | | $ | 349 | | $ | 38 | | $ | | |
| Tax benefits related to stock options exercised | | | 66 | | | 4 | | | | |
| Intrinsic value of stock options exercised | | | 196 | | | 64 | | | | |
Note 15 - Related Party Transactions
The following table presents activity in the amounts due from directors, principal officers, and their related interests. All of these transactions were made in the ordinary course of business on substantially the same terms, including interest rates and collateral, as those prevailing at the time for comparable transactions with other persons. Also, they did not involve a more than normal risk of collectibility or present any other unfavorable features.
| |
| Balance, December 31, 2005 | | $ | 3,154 | |
| New loans | | | 3,030 | |
| Repayments | | | 2,394 | |
| Balance, December 31, 2006 | | $ | 3,790 | |
QNB allowed its directors to defer a portion of their compensation. The amount of deferred compensation accrued as of December 31, 2006 and 2005, was $188,000 and $219,000, respectively.
On September 22, 2005, the Bank approved and entered into an agreement with Eugene T. Parzych, Inc. to act as the general contractor for the renovation of its property at 322 W. Broad Street, Quakertown, Pennsylvania to be used as the loan center. The bids for this project were submitted through a formal bidding process and reviewed by the Board of Directors. Mr. Gary S. Parzych is the president of Eugene T. Parzych, Inc. and is also a director of QNB Corp. Management and the Board of Directors of QNB Corp. and the Bank believe this is an arms-length transaction. The total paid to Eugene T. Parzych Inc. during 2006 and 2005, was $1,032,000 and $214,000, respectively.
Note 16 - Commitments And Contingencies
Financial instruments with off-balance-sheet risk:
In the normal course of business there are various legal proceedings, commitments, and contingent liabilities which are not reflected in the financial statements. Management does not anticipate any material losses as a result of these transactions and activities. They include, among other things, commitments to extend credit and standby letters of credit. Outstanding standby letters of credit amounted to $3,422,000 and $5,095,000, and commitments to extend credit and unused lines of credit totaled $69,926,000 and $81,154,000 at December 31, 2006 and 2005, respectively. The maximum exposure to credit loss, which represents the possibility of sustaining a loss due to the failure of the other parties to a financial instrument to perform according to the terms of the contract, is represented by the contractual amount of these instruments. QNB uses the same lending standards and policies in making credit commitments as it does for on-balance sheet instruments. The activity is controlled through credit approvals, control limits, and monitoring procedures.
Commitments to extend credit are agreements to lend to a customer as long as there is no violation of any condition established in the contract. Commitments generally have fixed expiration dates or other termination clauses and may require the payment of a fee. Since many of the commitments are expected to expire without being drawn upon, the total commitment amounts do not necessarily represent future cash requirements. QNB evaluates each customer’s creditworthiness on a case-by-case basis.
Standby letters of credit are conditional commitments issued to guarantee the performance of a customer to a third party. The credit risk and collateral policy involved in issuing letters of credit are essentially the same as those involved in extending loan commitments.
The amount of collateral obtained for letters of credit and commitments to extend credit is based on management’s credit evaluation of the customer. Collateral varies, but may include real estate, accounts receivable, marketable securities, pledged deposits, inventory or equipment.
NOTES TO CONSOLIDATED FINANCIAL STATEMENTS
Other commitments:
QNB has committed to various operating leases for several of their branch and office facilities. Some of these leases include renewal options as well as specific provisions relating to rent increases. The minimum annual rental commitments under these leases outstanding at December 31, 2006 are as follows:
| |
| | | Minimum Lease Payments | |
| 2007 | | $ | 304 | |
| 2008 | | | 297 | |
| 2009 | | | 277 | |
| 2010 | | | 274 | |
| 2011 | | | 265 | |
| Thereafter | | | 1,728 | |
Rent expense under leases for each of the years ended December 31, 2006, 2005 and 2004, was $317,000, $307,000 and $299,000, respectively.
Note 17 - Other Comprehensive Income (Loss)
The tax effects allocated to each component of other comprehensive income are as follows:
| |
| | | Before-Tax Amount | | Tax Expense (Benefit) | | Net-of-Tax Amount | |
Year Ended December 31, 2006 | | | | | | | |
| Unrealized gains on securities | | | | | | | |
| Unrealized holding gains arising during the period | | $ | 939 | | $ | (319 | ) | $ | 620 | |
| Reclassification adjustment for gains included in net income | | | (262 | ) | | 89 | | | (173 | ) |
| Other comprehensive income (loss) | | $ | 677 | | $ | (230 | ) | $ | 447 | |
Year Ended December 31, 2005 | | | | | | | | | | |
| Unrealized losses on securities | | | | | | | | | | |
| Unrealized holding losses arising during the period | | $ | (4,200 | ) | $ | 1,573 | | $ | (2,627 | ) |
| Reclassification adjustment for losses included in net income | | | 727 | | | (53 | ) | | 674 | |
| Other comprehensive income (loss) | | $ | (3,473 | ) | $ | 1,520 | | $ | (1,953 | ) |
Year Ended December 31, 2004 | | | | | | | | | | |
| Unrealized losses on securities | | | | | | | | | | |
| Unrealized holding losses arising during the period | | $ | (1,137 | ) | $ | 47 | | $ | (1,090 | ) |
| Reclassification adjustment for gains included in net income | | | (849 | ) | | 289 | | | (560 | ) |
| Other comprehensive income (loss) | | $ | (1,986 | ) | $ | 336 | | $ | (1,650 | ) |
Note 18 - Disclosures About Fair Value of Financial Instruments
All entities are required to disclose estimated fair values for their financial instruments, whether or not recognized in the balance sheet. For QNB, as for most financial institutions, substantially all of its assets and liabilities are considered financial instruments.
Estimates of fair value are made at a specific point in time, based upon, where available, relevant market prices and information about the financial instrument. Such estimates do not include any premium or discount that could result from offering for sale at one time QNB’s entire holdings of a particular financial instrument. For a substantial portion of QNB’s financial instruments, no quoted market exists. Therefore, estimates of fair value are necessarily based on a number of significant assumptions regarding the amount and timing of estimated future cash flows, which are discounted to reflect varying degrees of risk. Given the uncertainties surrounding these assumptions, the reported fair values may not represent actual values of financial instruments that could have been realized as of year-end or that will be realized in the future. Use of different assumptions or methodologies is likely to result in significantly different fair value estimates.
NOTES TO CONSOLIDATED FINANCIAL STATEMENTS
The estimated fair values and carrying amounts are summarized as follows:
| |
December 31, | | 2006 | | 2005 | |
| | | Carrying Amount | | Estimated Fair Value | | Carrying Amount | | Estimated Fair Value | |
| | | | | | | | | | |
| Financial Assets | | | | | | | | | |
| Cash and due from banks | | $ | 12,439 | | $ | 12,439 | | $ | 20,807 | | $ | 20,807 | |
| Federal funds sold | | | 11,664 | | | 11,664 | | | | | | | |
| Investment securities available-for-sale | | | 219,818 | | | 219,818 | | | 233,275 | | | 233,275 | |
| Investment securities held-to-maturity | | | 5,021 | | | 5,168 | | | 5,897 | | | 6,082 | |
| Non-marketable equity securities | | | 3,465 | | | 3,465 | | | 3,684 | | | 3,684 | |
| Loans held-for-sale | | | 170 | | | 168 | | | 134 | | | 137 | |
| Net loans | | | 340,767 | | | 332,539 | | | 298,823 | | | 293,851 | |
| Bank-owned life insurance | | | 8,415 | | | 8,415 | | | 8,103 | | | 8,103 | |
| Mortgage servicing rights | | | 472 | | | 680 | | | 528 | | | 727 | |
| Accrued interest receivable | | | 2,874 | | | 2,874 | | | 2,572 | | | 2,572 | |
| | | | | | | | | | | | | | |
| Financial Liabilities | | | | | | | | | | | | | |
| Deposits with no stated maturities | | | 246,090 | | | 246,090 | | | 247,541 | | | 247,541 | |
| Deposits with stated maturities | | | 232,832 | | | 231,007 | | | 211,129 | | | 208,024 | |
| Short-term borrowings | | | 30,113 | | | 30,113 | | | 19,596 | | | 19,596 | |
| Federal Home Loan Bank advances | | | 52,000 | | | 52,741 | | | 55,000 | | | 56,441 | |
| Accrued interest payable | | | 2,240 | | | 2,240 | | | 1,512 | | | 1,512 | |
The estimated fair value of QNB’s off-balance sheet financial instruments is as follows:
| |
December 31, | | 2006 | | 2005 | |
| | | Notional Amount | | Estimated Fair Value | | Notional Amount | | Estimated Fair Value | |
| Commitments to extend credit | | $ | 69,926 | | | | | $ | 81,154 | | | | |
| Standby letters of credit | | | 3,422 | | | | | | 5,095 | | | | |
The following methods and assumptions were used to estimate the fair value of each major classification of financial instruments at December 31, 2006 and 2005.
Cash and due from banks, federal funds sold, bank-owned life insurance, accrued interest receivable and accrued interest payable:Current carrying amounts approximate estimated fair value.
Investment securities: Quoted market prices were used to determine fair value.
Non-marketable equity securities: The fair value of stock in Atlantic Central Bankers Bank, the Federal Reserve Bank and the Federal Home Loan Bank is the carrying amount.
Loans and mortgage servicing rights: The fair value for loans and mortgage servicing rights is estimated by discounting contractual cash flows and adjusting for prepayment estimates. Discount rates are based upon rates generally charged for such loans with similar characteristics.
Deposit liabilities: The fair value of deposits with no stated maturity (e.g. demand deposits, interest-bearing demand accounts, money market accounts and savings accounts) are by definition, equal to the amount payable on demand at the reporting date (i.e. their carrying amounts). This approach to estimating fair value excludes the significant benefit that results from the low-cost funding provided by such deposit liabilities, as compared to alternative sources of funding. Deposits with a stated maturity (time deposits) have been valued using the present value of cash flows discounted at rates approximating the current market for similar deposits.
Short-term borrowings and Federal Home Loan Bank advances: Short-term borrowings and advances from the Federal Home Loan Bank have been valued using the present value of cash flows discounted at rates approximating the current market for similar liabilities.
Off-balance-sheet instruments:Off-balance-sheet instruments are primarily comprised of loan commitments which are generally priced at market at the time of funding. Fees on commitments to extend credit and standby letters of credit are deemed to be immaterial and these instruments are expected to be settled at face value or expire unused. It is impractical to assign any fair value to these instruments.
NOTES TO CONSOLIDATED FINANCIAL STATEMENTS
Note 19 - Parent Company Financial Information
Condensed financial statements of QNB Corp. only:
Balance Sheets |
December 31, | | 2006 | | 2005 | |
| | | | | | |
| Assets | | | | | |
| Cash and cash equivalents | | $ | 8 | | $ | 8 | |
| Investment securities available-for-sale | | | 4,592 | | | 4,069 | |
| Investment in subsidiary | | | 45,915 | | | 42,527 | |
| Other assets | | | 11 | | | 49 | |
| Total assets | | $ | 50,526 | | $ | 46,653 | |
| | | | | | | | |
| Liabilities | | | | | | | |
| Other liabilities | | $ | 116 | | $ | 89 | |
| | | | | | | | |
| Shareholders’ equity | | | | | | | |
| Common stock | | | 2,022 | | | 2,007 | |
| Surplus | | | 9,707 | | | 9,117 | |
| Retained earnings | | | 40,990 | | | 38,196 | |
| Accumulated other comprehensive loss, net | | | (815 | ) | | (1,262 | ) |
| Treasury stock | | | (1,494 | ) | | (1,494 | ) |
| Total shareholders’ equity | | | 50,410 | | | 46,564 | |
| Total liabilities and shareholders’ equity | | $ | 50,526 | | $ | 46,653 | |
Statements of Income |
Year Ended December 31, | | 2006 | | 2005 | | 2004 | |
| Dividends from subsidiary | | $ | 2,385 | | $ | 2,691 | | $ | 2,182 | |
| Interest and dividend income | | | 70 | | | 57 | | | 48 | |
| Securities gains | | | 366 | | | 376 | | | 613 | |
| Total income | | | 2,821 | | | 3,124 | | | 2,843 | |
| Expenses | | | 345 | | | 221 | | | 203 | |
| Income before applicable income taxes and equity in undistributed income of subsidiary | | | 2,476 | | | 2,903 | | | 2,640 | |
| Income taxes | | | 55 | | | 59 | | | 144 | |
| Income before equity in undistributed income of subsidiary | | | 2,421 | | | 2,844 | | | 2,496 | |
| Equity in undistributed income of subsidiary | | | 2,999 | | | 2,202 | | | 3,707 | |
| Net income | | $ | 5,420 | | $ | 5,046 | | $ | 6,203 | |
NOTES TO CONSOLIDATED FINANCIAL STATEMENTS
Statements of Cash Flows |
Year Ended December 31, | | 2006 | | 2005 | | 2004 | |
| | | | | | | | |
| Operating Activities | | | | | | | |
| Net income | | $ | 5,420 | | $ | 5,046 | | $ | 6,203 | |
| Adjustments to reconcile net income to net cash provided by operating activities: | | | | | | | | | | |
| Equity in undistributed income from subsidiary | | | (2,999 | ) | | (2,202 | ) | | (3,707 | ) |
| Securities gains, net | | | (366 | ) | | (376 | ) | | (613 | ) |
| Tax benefit from exercise of stock options | | | 66 | | | 4 | | | | |
| Stock-based compensation expense | | | 118 | | | | | | | |
| Decrease (increase) in other assets | | | 38 | | | (37 | ) | | 165 | |
| (Decrease) increase in other liabilities | | | (1 | ) | | (75 | ) | | 71 | |
Deferred income tax provision | | | (2 | ) | | 2 | | | 147 | |
| Net cash provided by operating activities | | | 2,274 | | | 2,362 | | | 2,266 | |
| Investing Activities | | | | | | | | | | |
| Purchase of investment securities | | | (2,672 | ) | | (1,652 | ) | | (1,623 | ) |
| Proceeds from sale of investment securities | | | 2,603 | | | 1,600 | | | 1,555 | |
| Net cash used by operating activities | | | (69 | ) | | (52 | ) | | (68 | ) |
| Financing Activities | | | | | | | | | | |
| Cash dividends paid | | | (2,626 | ) | | (2,420 | ) | | (2,292 | ) |
| Proceeds from issuance of common stock | | | 421 | | | 112 | | | 74 | |
| Net cash used by financing activities | | | (2,205 | ) | | (2,308 | ) | | (2,218 | ) |
| Increase (decrease) in cash and cash equivalents | | | | | | 2 | | | (20 | ) |
| Cash and cash equivalents at beginning of year | | | 8 | | | 6 | | | 26 | |
| Cash and cash equivalents at end of year | | $ | 8 | | $ | 8 | | $ | 6 | |
| Supplemental Cash Flow Disclosure | | | | | | | | | | |
| Non-Cash Transactions | | | | | | | | | | |
| Change in net unrealized holding gains or losses, net of taxes on investment securities | | $ | 58 | | $ | (150 | ) | $ | (207 | ) |
Note 20 - Regulatory Restrictions
Dividends payable by the Corporation and the Bank are subject to various limitations imposed by statutes, regulations and policies adopted by bank regulatory agencies. Under current regulations regarding dividend availability, the Bank may declare dividends in 2007 to the Corporation totaling $5,201,000, plus additional amounts equal to the net profit earned by the Bank for the period from January 1, 2007, through the date of declaration, less dividends previously declared in 2007.
Both the Corporation and the Bank are subject to regulatory capital requirements administered by federal banking agencies. Failure to meet minimum capital requirements can initiate actions by regulators that could have an effect on the financial statements. Under the framework for prompt corrective action, both the Corporation and the Bank must meet capital guidelines that involve quantitative measures of their assets, liabilities, and certain off-balance-sheet items. The capital amounts and classification are also subject to qualitative judgments by the regulators. Management believes, as of December 31, 2006, that the Corporation and the Bank met capital adequacy requirements to which they were subject.
As of the most recent notification, the Federal Reserve Bank and the Comptroller of the Currency considered the Corporation and the Bank to be “well capitalized” under the regulatory framework. There are no conditions or events since that notification that management believes have changed the classification. To be categorized as well capitalized, the Corporation and the Bank must maintain minimum ratios set forth in the table below. The Corporation and the Bank’s actual capital amounts and ratios are presented as follows:
NOTES TO CONSOLIDATED FINANCIAL STATEMENTS
| | | Capital Levels |
| | | Actual | | Adequately Capitalized | | Well Capitalized | |
As of December 31, 2006 | | Amount | | Ratio | | Amount | | Ratio | | Amount | | Ratio | |
Total risk-based capital (to risk weighted assets):1 | | | | | | | | | | | | | |
| Consolidated | | $ | 54,133 | | | 13.91 | % | $ | 31,135 | | | 8.00 | % | $ | 38,919 | | | 10.00 | % |
| Bank | | | 49,742 | | | 12.92 | | | 30,789 | | | 8.00 | | | 38,486 | | | 10.00 | |
Tier I capital (to risk weighted assets):1 | | | | | | | | | | | | | | | | | | | |
| Consolidated | | | 51,182 | | | 13.15 | | | 15,568 | | | 4.00 | | | 23,352 | | | 6.00 | |
| Bank | | | 47,013 | | | 12.22 | | | 15,394 | | | 4.00 | | | 23,092 | | | 6.00 | |
Tier I capital (to average assets):1 | | | | | | | | | | | | | | | | | | | |
| Consolidated | | | 51,182 | | | 8.42 | | | 24,301 | | | 4.00 | | | 30,377 | | | 5.00 | |
| Bank | | | 47,013 | | | 7.79 | | | 24,134 | | | 4.00 | | | 30,167 | | | 5.00 | |
| | | Capital Levels |
| | | Actual | | Adequately Capitalized | | Well Capitalized | |
As of December 31, 2005 | | Amount | | Ratio | | Amount | | Ratio | | Amount | | Ratio | |
Total risk-based capital (to risk weighted assets):1 | | | | | | | | | | | | | |
| Consolidated | | $ | 50,384 | | | 13.77 | % | $ | 29,274 | | | 8.00 | % | $ | 36,593 | | | 10.00 | % |
| Bank | | | 46,406 | | | 12.82 | | | 28,964 | | | 8.00 | | | 36,206 | | | 10.00 | |
Tier I capital (to risk weighted assets):1 | | | | | | | | | | | | | | | | | | | |
| Consolidated | | | 47,732 | | | 13.04 | | | 14,637 | | | 4.00 | | | 21,956 | | | 6.00 | |
| Bank | | | 43,880 | | | 12.12 | | | 14,482 | | | 4.00 | | | 21,723 | | | 6.00 | |
Tier I capital (to average assets):1 | | | | | | | | | | | | | | | | | | | |
| Consolidated | | | 47,732 | | | 8.15 | | | 23,421 | | | 4.00 | | | 29,277 | | | 5.00 | |
| Bank | | | 43,880 | | | 7.54 | | | 23,270 | | | 4.00 | | | 29,088 | | | 5.00 | |
| | | | | | | | | | | | | | | | | | | |
| 1 | As defined by the regulators |
Note 21 - Consolidated Quarterly Financial Data
The unaudited quarterly results of operations for the years ended 2006 and 2005 are in the following table:
| |
| | | Quarters Ended 2006 | | Quarters Ended 2005 | |
| | | March 31 | | June 30 | | Sept. 30 | | Dec. 31 | | March 31 | | June 30 | | Sept. 30 | | Dec. 31 | |
| Interest income | | $ | 7,427 | | $ | 7,828 | | $ | 8,278 | | $ | 8,469 | | $ | 6,759 | | $ | 6,956 | | $ | 7,143 | | $ | 7,414 | |
| Interest expense | | | 3,441 | | | 3,798 | | | 4,238 | | | 4,429 | | | 2,674 | | | 2,845 | | | 3,125 | | | 3,344 | |
| Net interest income | | | 3,986 | | | 4,030 | | | 4,040 | | | 4,040 | | | 4,085 | | | 4,111 | | | 4,018 | | | 4,070 | |
| Provision for loan losses | | | | | | 45 | | | 60 | | | 240 | | | | | | | | | | | | | |
| Non-interest income | | | 1,208 | | | 951 | | | 1,147 | | | 631 | | | 1,669 | | | (172 | ) | | 938 | | | 827 | |
| Non-interest expense | | | 3,236 | | | 3,282 | | | 3,254 | | | 3,462 | | | 3,236 | | | 3,316 | | | 3,140 | | | 3,410 | |
| Income before income taxes | | | 1,958 | | | 1,654 | | | 1,873 | | | 969 | | | 2,518 | | | 623 | | | 1,816 | | | 1,487 | |
| Provision for income taxes | | | 280 | | | 352 | | | 356 | | | 46 | | | 599 | | | 140 | | | 385 | | | 274 | |
| Net Income | | $ | 1,678 | | $ | 1,302 | | $ | 1,517 | | $ | 923 | | $ | 1,919 | | $ | 483 | | $ | 1,431 | | $ | 1,213 | |
| Earnings Per Share - basic | | $ | .54 | | $ | .42 | | $ | .48 | | $ | .30 | | $ | .62 | | $ | .16 | | $ | .46 | | $ | .39 | |
| Earnings Per Share - diluted | | $ | .53 | | $ | .41 | | $ | .48 | | $ | .29 | | $ | .60 | | $ | .15 | | $ | .45 | | $ | .38 | |
| ITEM 9. | CHANGES IN AND DISAGREEMENTS WITH ACCOUNTANTS ON ACCOUNTING AND FINANCIAL DISCLOSURE |
None.
| (a) | Management’s Report on Internal Control Over Financial Reporting |
Management is responsible for the preparation, integrity, and fair presentation of the consolidated financial statements included in this annual report. The consolidated financial statements and notes included in this annual report have been prepared in conformity with U.S. generally accepted accounting principles, and as such, include some amounts that are based on management’s best estimates and judgments.
The Corporation’s management is responsible for establishing and maintaining effective internal control over financial reporting. The system of internal control over financial reporting, as it relates to the financial statements, is evaluated for effectiveness by management and tested for reliability through a program of internal audits and management testing and review. Actions are taken to correct potential deficiencies as they are identified. Any system of internal control, no matter how well designed, has inherent limitations, including the possibility that a control can be circumvented or overridden and misstatements due to error or fraud may occur and not be detected. Also, because of changes in conditions, internal control effectiveness may vary over time. Accordingly, even an effective system of internal control will provide only a reasonable assurance with respect to financial statement preparation.
Management assessed the effectiveness of the Corporation’s internal control over financial reporting as of December 31, 2006. In making this assessment, it used the criteria set forth by the Committee of Sponsoring Organizations of the Treadway Commission (COSO) in Internal Control — Integrated Framework. Based on our assessment, management concluded that, as of December 31, 2006, the Corporation’s internal control over financial reporting is effective and meets the criteria of the Internal Control — Integrated Framework.
The Corporation’s independent registered public accounting firm, S.R. Snodgrass, A.C., has issued an attestation report on management’s assessment of the Corporation’s internal control over financial reporting.
| (b) | Report of Independent Registered Public Accounting Firm |
Board of Directors and Shareholders
QNB Corp.
We have audited management’s assessment, included in the accompanying Report on Management’s Assessment of Internal Control Over Financial Reporting, that QNB Corp. (the Corporation) maintained effective internal control over financial reporting as of December 31, 2006, based on criteria established in “Internal Control—Integrated Framework” issued by the Committee of Sponsoring Organizations of the Treadway Commission (COSO). The Corporation’s management is responsible for maintaining effective internal control over financial reporting and for its assessment of the effectiveness of internal control over financial reporting. Our responsibility is to express an opinion on management’s assessment and an opinion on the effectiveness of the Corporation’s internal control over financial reporting based on our audit.
We conducted our audit in accordance with the standards of the Public Company Accounting Oversight Board (United States). Those standards require that we plan and perform the audit to obtain reasonable assurance about whether effective internal control over financial reporting was maintained in all material respects. Our audit included obtaining an understanding of internal control over financial reporting, evaluating management’s assessment, testing and evaluating the design and operating effectiveness of internal control, and performing such other procedures as we considered necessary in the circumstances. We believe that our audit provides a reasonable basis for our opinion.
A company’s internal control over financial reporting is a process designed to provide reasonable assurance regarding the reliability of financial reporting and the preparation of financial statements for external purposes in accordance with generally accepted accounting principles. A company’s internal control over financial reporting includes those policies and procedures that (1) pertain to the maintenance of records that, in reasonable detail, accurately and fairly reflect the transactions and dispositions of the assets of the company; (2) provide reasonable assurance that transactions are recorded as necessary to permit preparation of financial statements in accordance with generally accepted accounting principles and that receipts and expenditures of the company are being made only in accordance with authorizations of management and directors of the company; and (3) provide reasonable assurance regarding prevention or timely detection of unauthorized acquisition, use, or disposition of the company’s assets that could have a material effect on the financial statements.
Because of its inherent limitations, internal control over financial reporting may not prevent or detect misstatements. Also, projections of any evaluation of effectiveness to future periods are subject to the risk that controls may become inadequate because of changes in conditions, or that the degree of compliance with the policies or procedures may deteriorate.
In our opinion, management’s assessment that QNB Corp. maintained effective internal control over financial reporting as of December 31, 2006, is fairly stated, in all material respects, based on the COSO criteria. Also in our opinion, QNB Corp. maintained, in all material respects, effective internal control over financial reporting as of December 31, 2006, based on the COSO criteria.
We have also audited, in accordance with the standards of the Public Company Accounting Oversight Board (United States), the consolidated balance sheets of QNB Corp. and subsidiary as of December 31, 2006, and the related consolidated statements of income, shareholders’ equity, and cash flows for the years then ended, and our report dated March 7, 2007, expressed an unqualified opinion.
Wexford, Pennsylvania
March 7, 2007
| (c) | Internal Controls and Disclosure Controls and Procedures |
QNB’s principal executive officer and principal financial officer, after evaluating, together with management, the effectiveness of the design and operation of QNB’s disclosure controls and procedures (as defined in Exchange Act Rules 13a-15(e) and 15d-15(e)) as of December 31, 2006, the end of the period covered by this report, have concluded that, as of such date, QNB’s disclosure controls and procedures were adequate and effective to ensure that material information relating to QNB and our consolidated subsidiary would be made known to them by others within those entities.
There were no changes in QNB’s internal control over financial reporting that occurred during the fourth quarter of 2006 that have materially affected, or are reasonably likely to materially affect, QNB’s internal control over financial reporting.
None.
| ITEM 10. | DIRECTORS, EXECUTIVE OFFICERS AND CORPORATE GOVERNANCE |
The information required by Item 10 is incorporated by reference to information appearing in QNB Corp.’s definitive proxy statement to be used in connection with the 2007 Annual Meeting of Shareholders under the captions
| • | “Governance of the Company - Code of Ethics” |
| • | “Section 16(a) Beneficial Ownership Compliance” |
| • | “Meetings and Committees of the Board of Directors of QNB and the Bank” |
| • | “Executive Officers of QNB and/or the Bank” |
The Corporation has adopted a Code of Business Conduct and Ethics applicable to its CEO, CFO and Controller as well as its long-standing Code of Ethics which applies to all directors and employees. The codes are available on the Corporation’s website at www.qnb.com.
The information required by Item 11 is incorporated by reference to the information appearing in QNB Corp.’s definitive proxy statement to be used in connection with the 2007 Annual Meeting of Shareholders under the captions
| • | “Compensation Committee Report” |
| • | “Compensation Discussion and Analysis” |
| • | “Executive Compensation” |
| ITEM 12. | SECURITY OWNERSHIP OF CERTAIN BENEFICIAL OWNERS AND MANAGEMENT AND RELATED STOCKHOLDER MATTERS |
The information required by Item 12 is incorporated by reference to the information appearing in QNB Corp.’s definitive proxy statement to be used in connection with the 2007 Annual Meeting of Shareholders under the captions
| • | “Security Ownership of Certain Beneficial Owners and Management” |
| • | “Equity Compensation Plan Information” |
| ITEM 13. | CERTAIN RELATIONSHIPS AND RELATED PARTY TRANSACTIONS, AND DIRECTOR INDEPENDENCE |
The information required by Item 13 is incorporated by reference to the information appearing in QNB Corp.’s definitive proxy statement to be used in connection with the 2007 Annual Meeting of Shareholders under the captions
| • | “Certain Relationships and Related Party Transactions” |
| • | “Governance of the Company - Director Independence” |
| ITEM 14. | PRINCIPAL ACCOUNTANT FEES AND SERVICES |
The information required by Item 14 is incorporated by reference to the information appearing in QNB Corp.’s definitive proxy statement to be used in connection with the 2007 Annual Meeting of Shareholders under the captions
| • | “Audit Committee Pre-Approval of Audit and Permissible Non-Audit Services of Independent Auditors” |
| • | “Audit Fees, Audit Related Fees, Tax Fees, and All Other Fees” |
| ITEM 15. | EXHIBITS AND FINANCIAL STATEMENT SCHEDULES |
| (a) | 1. Financial Statements |
The following financial statements are included by reference in Part II, Item 8 hereof.
Independent Registered Public Accounting Firm Report
Consolidated Balance Sheets
Consolidated Statements of Income
Consolidated Statements of Cash Flows
Consolidated Statements of Changes in Shareholders’ Equity
Notes to Consolidated Financial Statements
| 2. | Financial Statement Schedules |
The financial statement schedules required by this Item are omitted because the information is either inapplicable, not required or is in the consolidated financial statements as a part of this Report.
| 3. | The following exhibits are incorporated by reference herein or annexed to this Form 10-K: |
| 3(i) | - | Articles of Incorporation of Registrant, as amended. (Incorporated by reference to Exhibit 3(i) of Registrant’s Form DEF 14-A filed with the Commission on April 15, 2005.) |
| | | |
| 3(ii) | - | By-laws of Registrant, as amended. (Incorporated by reference to Exhibit 3(ii) of Registrant’s Form 8-K filed with the Commission on January 23, 2006.) |
| | | |
| 10.1 | - | Employment Agreement between the Registrant and Thomas J. Bisko. (Incorporated by reference to Exhibit 10.1 of Registrant’s Form 10-Q filed with the Commission on November 15, 2004.) |
| | | |
| 10.2 | - | Salary Continuation Agreement between the Registrant and Thomas J. Bisko. (Incorporated by reference to Exhibit 10.2 of Registrant’s Form 10-Q filed with the Commission on November 15, 2004.) |
| | | |
| 10.3 | - | QNB Corp. 1998 Stock Incentive Plan. (Incorporated by reference to Exhibit 4.3 to Registration Statement No. 333-91201 on Form S-8, filed with the Commission on November 18, 1999.) |
| | | |
| 10.4 | - | The Quakertown National Bank Retirement Savings Plan. (Incorporated by reference to Exhibit 10.4 of Registrant’s Form 10-Q filed with the Commission on August 14, 2003.) |
| | | |
| 10.5 | - | Change of Control Agreement between Registrant and Robert C. Werner. (Incorporated by reference to Exhibit 10.5 of Registrant’s Form 10-Q filed with the Commission on November 8, 2005.) |
| | | |
| 10.6 | - | Change of Control Agreement between Registrant and Bret H. Krevolin. (Incorporated by reference to Exhibit 10.6 of Registrant’s Form 10-Q filed with the Commission on November 8, 2005.) |
| | | |
| 10.7 | - | QNB Corp. 2001 Employee Stock Purchase Plan. (Incorporated by reference to Exhibit 99.1 to Registration Statement No. 333- 67588 on Form S-8, filed with the Commission on August 15, 2001). |
| | | |
| 10.8 | - | QNB Corp. 2005 Stock Incentive Plan (Incorporated by referrence to Exhibit 99.1 to Registration Statement No. 333-125998 on Form S-8, filed with the Commission on June 21, 2005). |
| | | |
| 10.9 | - | QNB Corp. 2006 Employee Stock Purchase Plan (Incorporated by reference to Exhibit 99.1 to Registration Statement No. 333-135408 on Form S-8, filed with the Commission on June 28, 2006). |
| 11 | - | Statement re: Computation of Earnings per Share as found on page 50 of Form 10-K, which is included herein. |
| | | |
| 12 | - | Statement re: Computation of Ratios as found on page 12 of Form 10-K, which is included herein. |
| | | |
| 14 | - | Registrant’s Code of Ethics. (Incorporated by reference to Exhibit 14 of Registrant’s Form 10-K filed with the Commission on March 30, 2004.) |
| | | |
| 21 | - | Subsidiaries of the Registrant. |
| | | |
| 23 | - | Consent of S.R. Snodgrass, A.C., Independent Registered Public Accounting Firm |
| | | |
| 31.1 | - | Section 302 Certification of the President and CEO. |
| | | |
| 31.2 | - | Section 302 Certification of the Chief Financial Officer. |
| | | |
| 32.1 | - | Section 906 Certification of the President and CEO. |
| | | |
| 32.2 | - | Section 906 Certification of the Chief Financial Officer. |
SIGNATURES
Pursuant to the requirements of Section 13 or 15(d) of the Securities Exchange Act of 1934, the Registrant has duly caused this report to be signed on its behalf by the undersigned, thereunto duly authorized.
QNB Corp.
March 14, 2007
Thomas J. Bisko
President and Chief Executive Officer
Pursuant to the requirements of the Securities Exchange Act of 1934, this report is signed below by the following persons on behalf of the Registrant and in the capacities and on the dates indicated.
| /s/ Thomas J. Bisko | | President, Chief Executive Officer and Director | | March 14, 2007 |
| Thomas J. Bisko | | | | |
| | | | | |
| /s/ Bret H. Krevolin | | Chief Financial Officer and Principal Financial and Accounting Officer | | March 14, 2007 |
| Bret H. Krevolin | | | | |
| | | | | |
| /s/ Norman L. Baringer | | Director | | March 14, 2007 |
| Norman L. Baringer | | | | |
| | | | | |
| /s/ Kenneth F. Brown, Jr. | | Director | | March 14, 2007 |
| Kenneth F. Brown, Jr. | | | | |
| | | | | |
| /s/ Dennis Helf | | Director, Chairman | | March 14, 2007 |
| Dennis Helf | | | | |
| | | | | |
| /s/ G. Arden Link | | Director | | March 14, 2007 |
| G. Arden Link | | | | |
| | | | | |
| /s/ Charles M. Meredith, III | | Director | | March 14, 2007 |
| Charles M. Meredith, III | | | | |
| | | | | |
| /s/ Anna Mae Papso | | Director | | March 14 2007 |
| Anna Mae Papso | | | | |
| | | | | |
| /s/ Gary S. Parzych | | Director | | March 14, 2007 |
| Gary S. Parzych | | | | |
| | | | | |
| /s/ Henry L. Rosenberger | | Director | | March 14, 2007 |
| Henry L. Rosenberger | | | | |
| | | | | |
| /s/ Edgar L. Stauffer | | Director | | March 14, 2007 |
| Edgar L. Stauffer | | | | |
QNB CORP.
FORM 10-K
FOR YEAR ENDED DECEMBER 31, 2006
EXHIBIT INDEX
| Exhibit | | |
| | | |
| 3(i) | - | Articles of Incorporation of Registrant, as amended. (Incorporated by reference to Exhibit 3(i) of Registrant’s Form DEF 14-A filed with the Commission on April 15, 2005.) |
| | | |
| 3(ii) | - | By-laws of Registrant, as amended. (Incorporated by reference to Exhibit 3(ii) of Registrant’s Form 8-K filed with the Commission on January 23, 2006.) |
| | | |
| 10.1 | - | Employment Agreement between the Registrant and Thomas J. Bisko. (Incorporated by reference to Exhibit 10.1 of Registrant’s Form 10-Q filed with the Commission on November 15, 2004.) |
| | | |
| 10.2 | - | Salary Continuation Agreement between the Registrant and Thomas J. Bisko. (Incorporated by reference to Exhibit 10.2 of Registrant’s Form 10-Q filed with the Commission on November 15, 2004.) |
| | | |
| 10.3 | - | QNB Corp. 1998 Stock Incentive Plan. (Incorporated by reference to Exhibit 4.3 to Registration Statement No. 333-91201 on Form S-8, filed with the Commission on November 18, 1999.) |
| | | |
| 10.4 | - | The Quakertown National Bank Retirement Savings Plan. (Incorporated by reference to Exhibit 10.4 of Registrants Form 10-Q filed with the Commission on August 14, 2003) |
| | | |
| 10.5 | - | Change of Control Agreement between Registrant and Robert C. Werner. (Incorporated by reference to Exhibit 10.5 of Registrant’s Form 10-Q filed with the Commission on November 8, 2005.) |
| | | |
| 10.6 | - | Change of Control Agreement between Registrant and Bret H. Krevolin. (Incorporated by reference to Exhibit 10.6 of Registrant’s Form 10-Q filed with the Commission on November 8, 2005.) |
| | | |
| 10.7 | - | QNB Corp. 2001 Employee Stock Purchase Plan. (Incorporated by reference to Exhibit 99.1 to Registration Statement No. 333-67588 on Form S-8, filed with the Commission on August 15, 2001). |
| | | |
| 10.8 | - | QNB Corp. 2005 Stock Incentive Plan (Incorporated by referrence to Exhibit 99.1 to Registration Statement No. 333-125998 on Form S-8, filed with the Commission on June 21, 2005). |
| | | |
| 10.9 | - | QNB Corp. 2006 Employee Stock Purchase Plan (Incorporated by reference to Exhibit 99.1 to Registration Statement No. 333-135408 on Form S-8, filed with the Commission on June 28, 2006). |
| | | |
| 11 | - | Statement re: Computation of Earnings per Share as found on page 50 of Form 10-K, which is included herein. |
| | | |
| 12 | - | Statement re: Computation of Ratios as found on page 12 of Form 10-K, which is included herein. |
| | | |
| 14 | - | Registrant’s Code of Ethics. (Incorporated by reference to Exhibit 14 of Registrant’s Form 10-K filed with the Commission on March 30, 2004.) |
| | | |
| 21 | - | Subsidiaries of the Registrant. |
| | | |
| 23 | - | Consent of S.R. Snodgrass, A.C., Independent Registered Public Accounting Firm |
| | | |
| 31.1 | - | Section 302 Certification of the President and CEO. |
| | | |
| 31.2 | - | Section 302 Certification of the Chief Financial Officer. |
| | | |
| 32.1 | - | Section 906 Certification of the President and CEO. |
| | | |
| 32.2 | - | Section 906 Certification of the Chief Financial Officer. |

