LYNCH, CHAPPELL & ALSUP
A PROFESSIONAL CORPORATION
ATTORNEYS
THE SUMMIT, SUITE 700
300 NORTH MARIENFELD
MIDLAND, TEXAS 79701
(432) 683-3351
TELECOPIER (432) 683-8346
June 10, 2009
Via Edgar and Federal Express
Securities and Exchange Commission
100 F Street, N.E.
Washington, D.C. 20549-7010
| | |
| Attention: | | Tracey L. McNeil, Division of Corporation Finance |
| | |
| Re: | | Parallel Petroleum Corporation
From 10-K for the Fiscal Year Ended December 31, 2008
Filed February 23, 2009
Response Letter filed May 12, 2009
File No. 000-13305 |
Dear Ladies and Gentlemen:
We write this letter on behalf of Parallel Petroleum Corporation (the “Company”) to respond to the comment letter received from the Staff on May 28, 2009 (the “Comment Letter”), relating to Parallel’s Annual Report on Form 10-K for the fiscal year ended December 31, 2008 (“Parallel’s 10-K”) and to our response letter filed May 12, 2009.
We have numbered each of the responses to correspond to the numbering of the comments in the Comment Letter. For your convenience, we have repeated each comment (in bold type) immediately preceding the corresponding response.
Securities and Exchange Commission
June 10, 2009
Page 2
Form 10-K for the Fiscal Year Ended December 31, 2008
Engineering Comments
Business, page 1
About Our Business and Strategy, page 5
| 1. | | We have reviewed your responses to prior comments one and two, indicating that you intend to refrain from disclosing reserve replacement figures in future filings, rather than provide clarifying disclosure. We understood from your earlier response to comments four and six that you would disclose annual reserve replacement percentages or ratios in future filings because you believed this would be helpful and would serve to clarify your prior disclosure. Tell us if you have concluded that reserve replacement is no longer a meaningful concept for describing your results of operations; and if so how you would address this change in transitioning away from prior disclosure. |
Response No. 1
| | | The Staff’s understanding of the Company’s previous response to comments four and six in the Staff’s March 31, 2009 letter is correct. As the Staff further correctly points out, the Company, in response to comments one and two in the Staff’s April 28, 2009 letter, subsequently proposed to delete all references to reserve replacement ratios and percentages. This reversal in the Company’s response to the Staff’s comments was not the result of a determination by the Company that reserve replacement measures are not a useful internal tool for helping gauge the Company’s drilling success, but instead was the result of the Company’s belief, after having prepared drafts of additional clarifying disclosures, that the additional clarifying disclosures (including descriptions of measures such as relative exploratory, development and property acquisition costs, changes in reserves associated with changes in commodity prices and other factors) seemed to add more confusion than clarity, in comparison to the more traditional disclosures presented in accordance with SFAS No. 69, “Disclosures about Oil and Gas Producing Activities”. Additionally, and as described in the Company’s response to comment two in the Staff’s April 28, 2009 letter, the absolute year-over-year reserve quantities since 2000 will be disclosed, which reveals the trend in the Company’s reserves, along with the reasons for the changes in proved reserves from year to year. These disclosures, while not expressed in ratios or percentages, will provide investors with essentially the same type of information as the ratios and percentages which the Company proposes to omit. Consequently, Parallel believes that removing the reserve replacement ratios and not using the measure in future filings would be the most appropriate course of action. |
Securities and Exchange Commission
June 10, 2009
Page 3
| | | For transition purposes, the Company would note that part of its internal evaluation of success in growing and maintaining reserves is based upon internally prepared reserve measures, without referencing specific percentages or ratios. |
Financial Statements
Supplemental Oil and Natural Gas Reserve Data, page F-45
| 2. | | We have reviewed your response to prior comment three, regarding the delay in producing the secondary reserves from the “second” waterflood project, explaining that the unitization process is still underway. Tell us why you believe that such reserves meet the test of reasonable certainty, given that you have not yet obtained the necessary approvals from the co-owners and royalty owners for the unitization agreement. Please tell us also the incremental reserves associated with this project, indicate your position on materiality, and submit any information that you believe should be considered in support of your reserve determination. |
Response No. 2
| | | The Company believes that it has met the test of reasonable certainty contained in Rule 4-10(a) of Regulation S-X for reserves associated with its Carm-Ann waterflood project because of having established that the reserves exist to a reasonable certainty by performing two separate waterflood studies and the Company intends to complete the waterflood, with or without unitization. |
| | | Reserve Existence- The Company has two studies on its planned Carm-Ann field waterflood, one of which was commissioned by the Company. The two studies were prepared by separate independent reservoir engineering firms, including T. Scott Hickman and Associates (“Hickman”), Midland, Texas, and Bill Cobb and Associates (“Cobb”), Dallas, Texas. The study prepared by Cobb was commissioned by the Company. In each case, the firms utilized volumetric analysis, decline curve analysis and field analogous performance to arrive at anticipated secondary to primary reserve ratios. Cobb, who performed the engineering for the unitization effort, also incorporated reservoir computer modeling. The reports of both firms show secondary to primary ratios in excess of the level at which the Company recognized proved reserves in its December 31, 2008 reserve estimates. Based on the evaluations provided by these respected consulting firms and the extensive secondary recovery experience of the Company’s own technical staff, the Company has a very high level of confidence that the waterflood reserves, as currently reflected in its reserve estimates, will be recovered. |
| | | Waterflood Implementation- There are two avenues by which waterflood implementation |
Securities and Exchange Commission
June 10, 2009
Page 4
| | | may occur. The first would be through unitization whereby royalty and working interests are normalized across a multi-lease project area. The advantages derived from unitization or lease consolidation are simplification of production reporting, revenue distribution and joint interest billing since it results in a single accounting entity. Operational efficiencies are also gained since consolidation of multiple surface fluid handling facilities is permitted. Delays incurred to date have been the result of the complexity and volume of ownership title confirmation work. Despite these delays, the Company believes that unitization will be successful. |
| | | The Company continues to proceed with the process of preparing the properties for waterflood and the unitization process. To date, preparatory work has included the drilling of 33 new wells and 25 well workovers. In addition, reservoir engineering work has been completed, as has mineral and working interest title work. Ownership participation factors have been determined and mineral owner and working interest owner election ballots are scheduled for mailing within the next few weeks. Upon receiving sufficient working interest and mineral interest approval the Company will apply to the Texas Railroad Commission for unitization. The Company anticipates full approval and initiation of water injection before March 1, 2010. As most mineral owners and working interest owners are well aware of the economic advantages of waterflood operations in this area, the Company is highly confident that unitization will be approved. |
| | | Majority working interest ownership, operatorship and control of the Carm-Ann Field assets was acquired by the Company in 2004 expressly for the ultimate purpose of waterflood implementation. If the Company does not achieve unitization, which is not a prerequisite to waterflood, the Company still intends to proceed with the Carm-Ann waterflood on a lease basis, whereby all individual leases in the project area remain as independent operational, reporting and accounting entities. From a technical standpoint, there is no difference in ultimate reserve recovery. However, the disadvantages of this second avenue are the loss of the operational and accounting efficiencies described above. Mineral interest approval is not required under this second avenue. From a regulatory standpoint, the only approvals required from the Texas Railroad Commission will be for individual well injection permits. Accordingly, under commodity pricing and cost levels at December 31, 2008, as well as current pricing and costs, the Company has no reason to believe that the certainty of waterflood implementation is anything other than absolute. |
| | | The following table illustrates the proved undeveloped reserves associated with this project |
Securities and Exchange Commission
June 10, 2009
Page 5
| | | and their relative materiality in comparison to the Company’s total proved reserves as of December 31, 2008: |
| | | | | | | | | | | | | | | | | |
| | | Oil | | Natural Gas | | BOE | | PV 10 Value |
| | | (mbbls) | | (mmcf) | | (mbbls) | | (in thousands) |
| Total Proved Reserves | | | 21,206 | | | | 71,833 | | | | 33,179 | | | $ | 309,607 | |
| | | | | | | | | | | | | | | | | |
| Carm-Ann reserves associated with waterflood | | | 2,191 | | | | 1,198 | | | | 2,391 | | | $ | 10,623 | |
| | | | | | | | | | | | | | | | | |
| Percentage of Proved Reserves | | | 10.3 | % | | | 1.7 | % | | | 7.2 | % | | | 3.4 | % |
| | | For the Staff’s further assistance, a copy of the Cobb waterflood study is enclosed with this letter. |
If any member of the Staff has questions regarding the foregoing, please contact Tommy Ortloff at (432) 683-3351 (main number) or (432) 688-1304 (direct line).
Very truly yours,
/s/ Thomas W. Ortloff
Thomas W. Ortloff
Enclosures
| | |
| cc: | | Tracey L. McNeil (SEC) (via Federal Express)
James Murphy (SEC) (via Federal Express) |
WATERFLOOD UNITIZATION STUDY
OF THE
SAN ANDRES RESERVOIR
LOCATED IN
CARM-ANN FIELD
GAINES COUNTY, TEXAS
PREPARED FOR
PARALLEL PETROLEUM CORPORATION
MARCH 11, 2009
WILLIAM M. COBB & ASSOCIATES, INC.
Worldwide Petroleum Consultants
WILLIAM M. COBB & ASSOCIATES, INC.
Worldwide Petroleum Consultants
| | |
| | | |
| 12770 Coit Road, Suite 907 | | (972) 385-0354 |
| Dallas, Texas 75251 | | Fax: (972) 788-5165 |
| | | E-Mail: office@wmcobb.com |
March 11, 2009
Mr. Jerry W. Nevans
Parallel Petroleum Corporation
1004 N. Big Spring Street, Suite 400
Midland, Texas 79701
| | |
| Re: | | Waterflood Unitization Study
Carm-Ann Field
Gaines County, Texas
|
Dear Mr. Nevans:
At your request, William M. Cobb & Associates, Inc. has performed a waterflood unitization study for certain leases located in Gaines County, Texas. The purpose of the study was to develop an equitable participation formula for sixteen leases such that they might be unitized to maximize remaining primary and secondary (waterflood) oil recovery for the productive San Andres reservoir.
We have performed a detailed geological and engineering study of these leases and propose a two-phase participation formula as presented in Exhibit 1. Phase I honors the remaining primary reserves while Phase II honors secondary, waterflood recovery. The following sections of this report document the methodology and results of our study.
Petrophysical Analysis
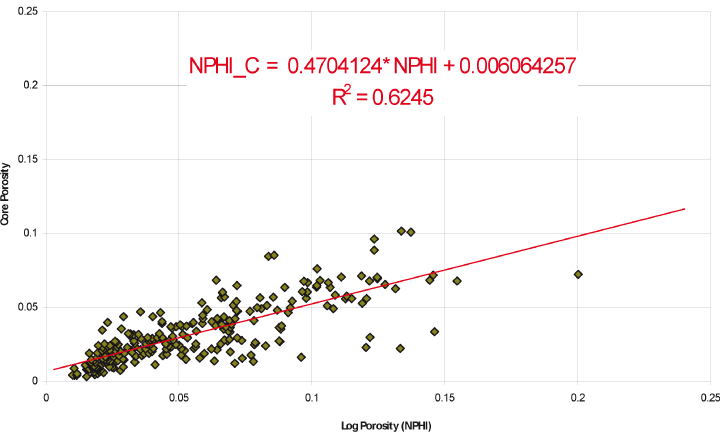
We have analyzed well logs from 60 wells on and near the subject leases, usingPETCOM/POWERLOG analytical software. In the course of this analysis, we integrated extensive core data available from the McConal-Clark #8. This well was also the only well with a modern suite of open-hole logs available for detailed analysis. This key well was used to calibrate core porosity to neutron log porosity throughout the field area. The correlation from neutron log porosity (NPHI) to core porosity (NPHI_C) is illustrated in Exhibit 2 and is as follows:
NPHI_C = (4.704124E+01*NPHI+6.064257E-01)/100)
San Andres net pay was defined as intervals above the lowest known oil of -1,625 feet sub-sea where NPHI_C > 0.03 andVcl< 0.485.Vcl(clay volume) was calculated for each well from theGR (gamma ray) curve utilizing thePETCOMcurve equation. Average porosity in the pay intervals from all the analyzed wells is 4.5 percent.
Mr. Jerry W. Nevans
March 11, 2009
Page 2
Resistivity logs needed to calculate water saturations (Sw) were available for the McConal-Clark #8 well only. Consequently, the water saturation for the entire field is assumed to be 32.4 percent, which is the calculated average water saturation for the pay intervals in the McConal-Clark #8 well. Petrophysical data from the analyzed wells are presented in Exhibit 3.
Geological Mapping
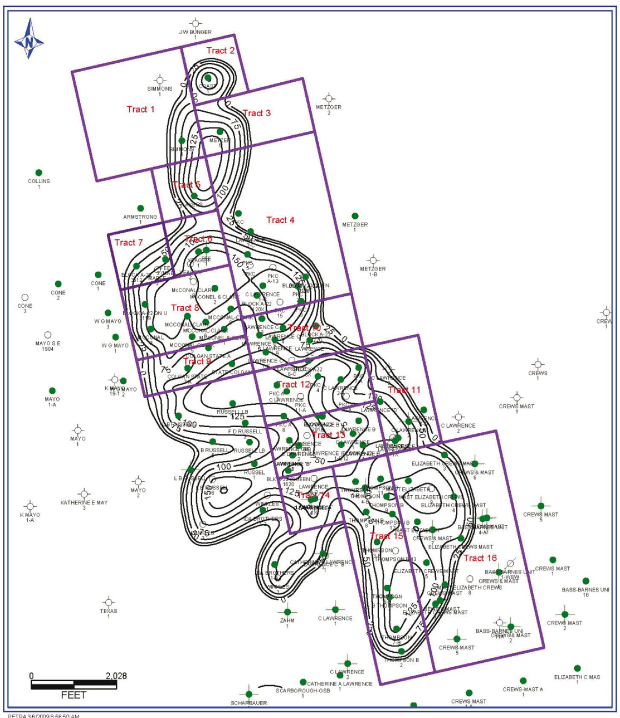
A net pay isopach map was prepared for the study area utilizing the net pay data (in feet) calculated from the detailed petrophysical analyses. This map was constructed usingPETRA geological software and is presented in Exhibit 4. The lease tracts for the proposed Carm-Ann Unit are shown on the isopach map.
Original Oil in Place (OOIP)
Total OOIP for the proposed Carm-Ann unit is 21,475 MSTB. OOIP was calculated for each of the 16 tracts using the net acre-feet from the net pay isopach map and the following constant rock and fluid properties:
Porosity = 4.5%
Swc = 32.4%
Boi = 1.140 RB/STB
The average porosity value is a result of our analysis of well logs from 60 wells. The average water saturation comes from our analysis of the McConal-Clark #8 well as discussed above. The formation volume factor of 1.140 RB/STB was estimated using industry correlations.
Primary Production
Oil production form the San Andres reservoir was established on the subject leases in November, 1979. The San Andres reservoir is encountered at a depth of approximately 4,600 feet and has produced a total of 1,876 MBO as of January 1, 2009.
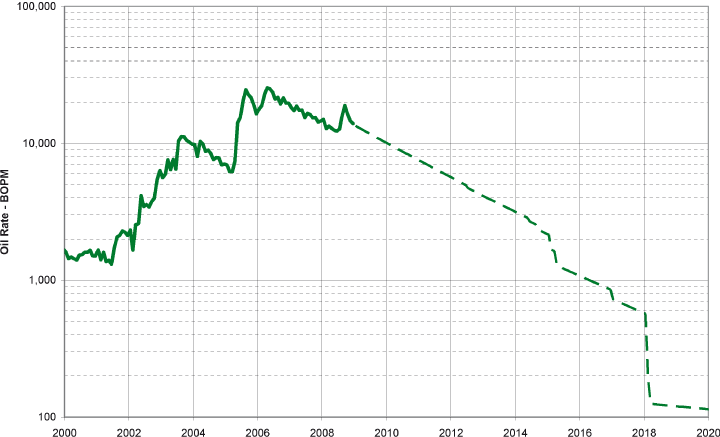
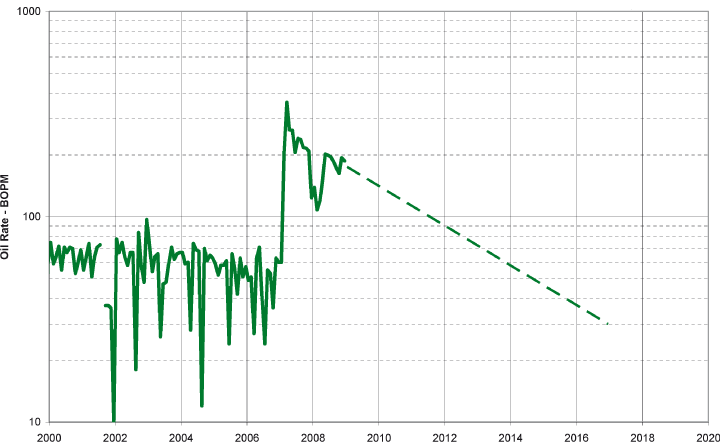
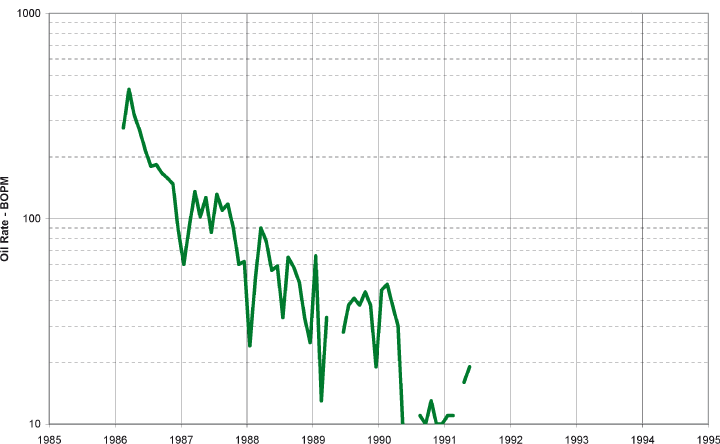
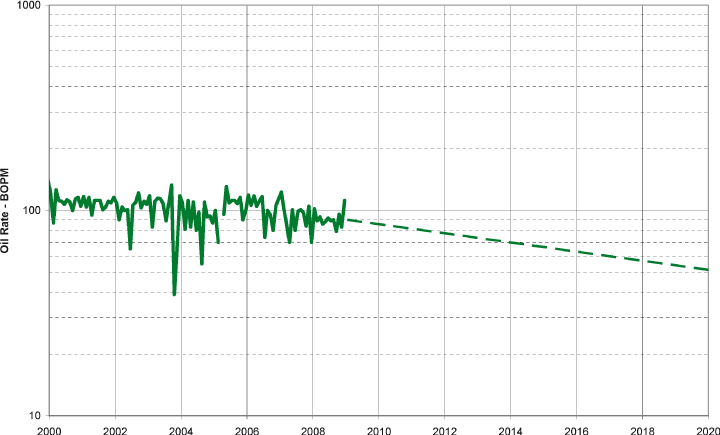
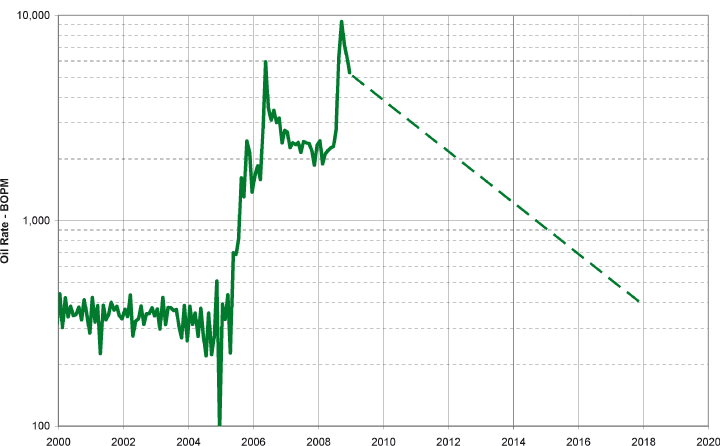
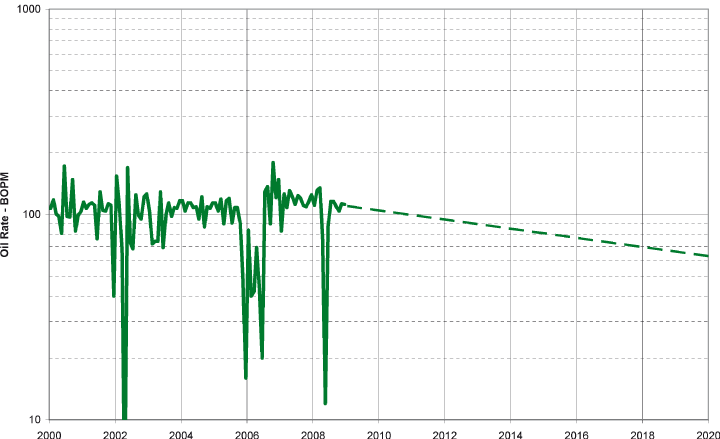
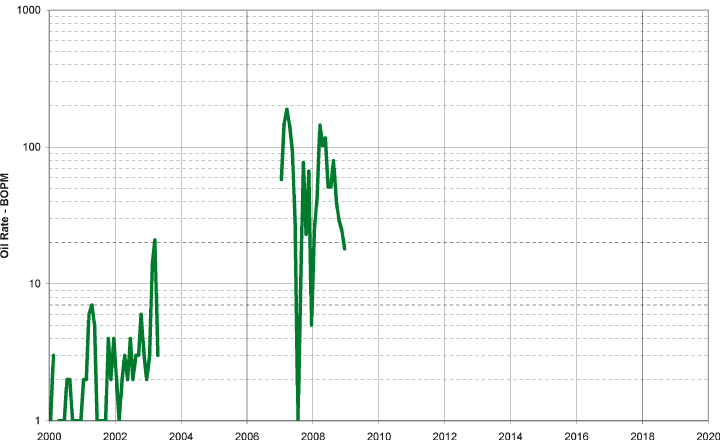
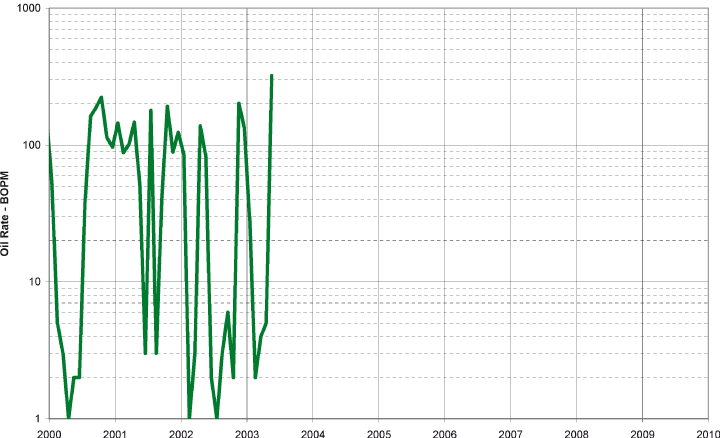
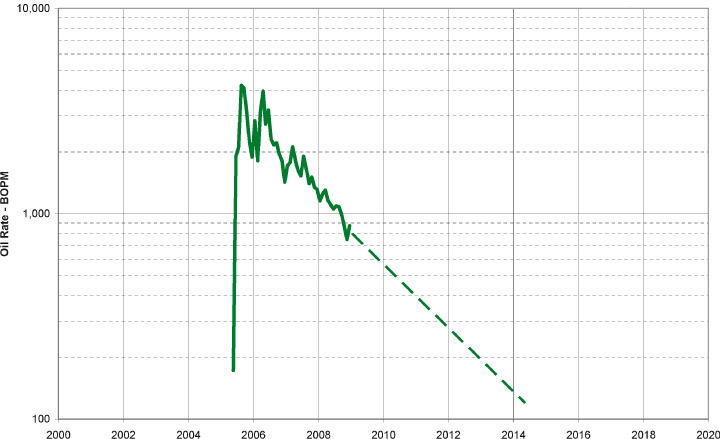
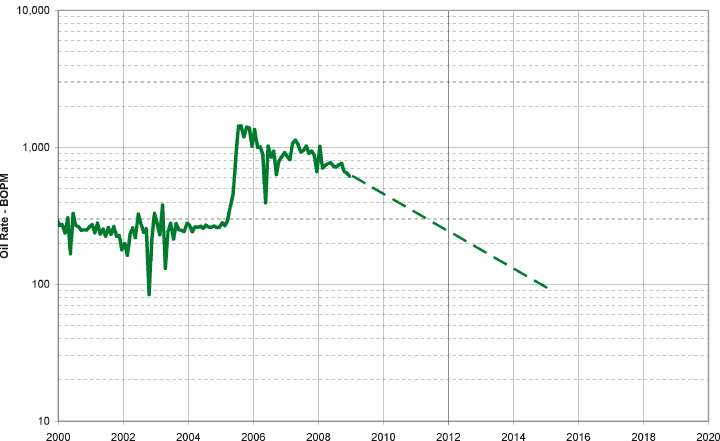
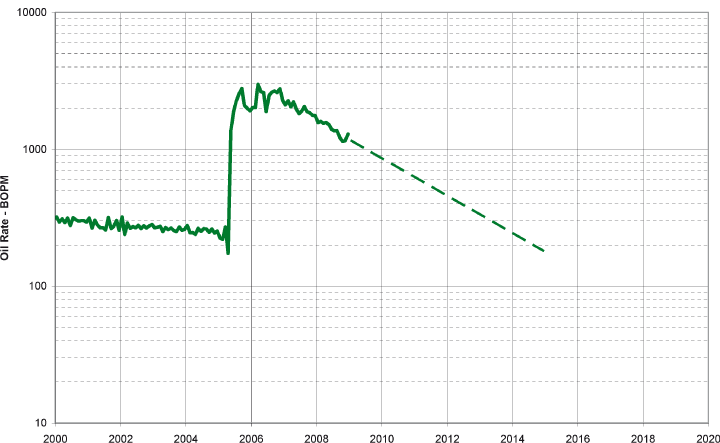
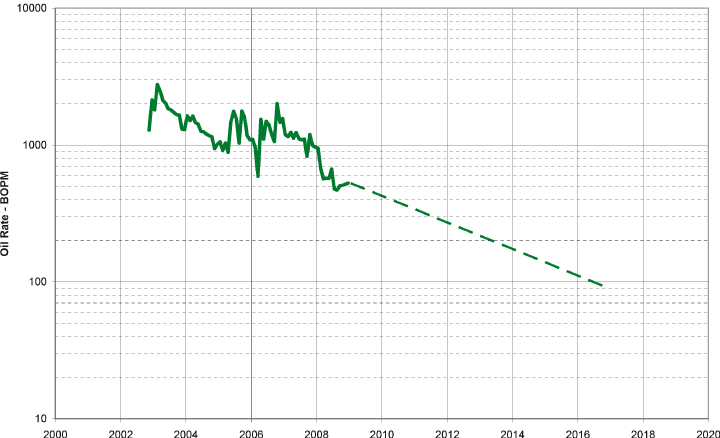
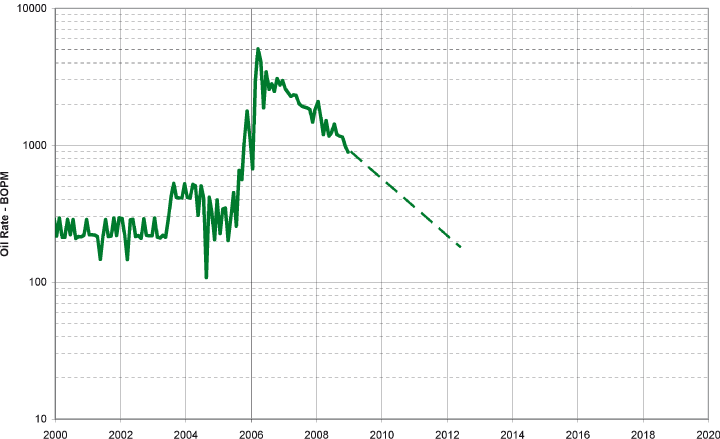
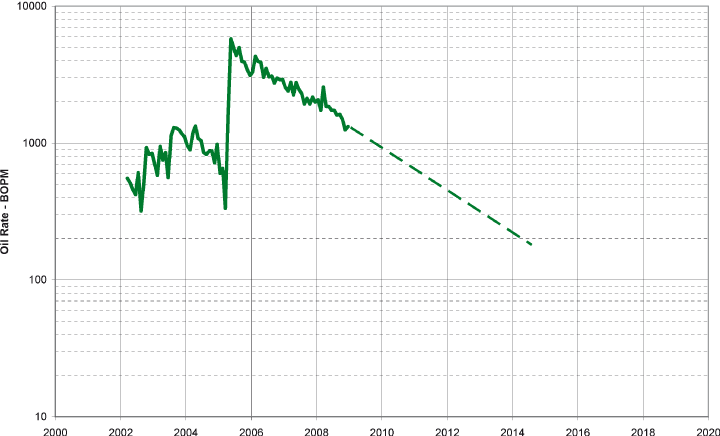
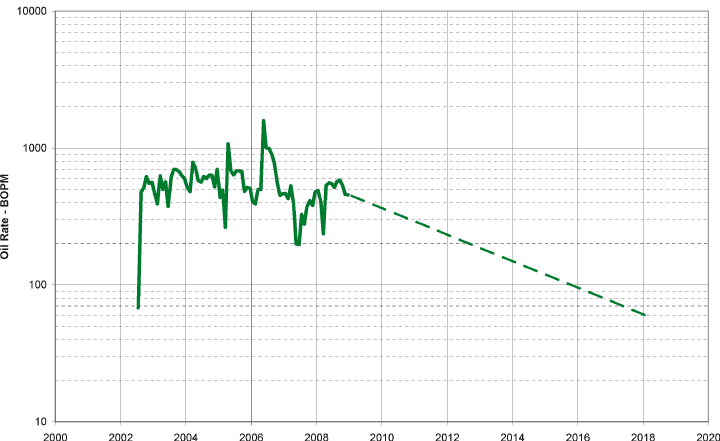
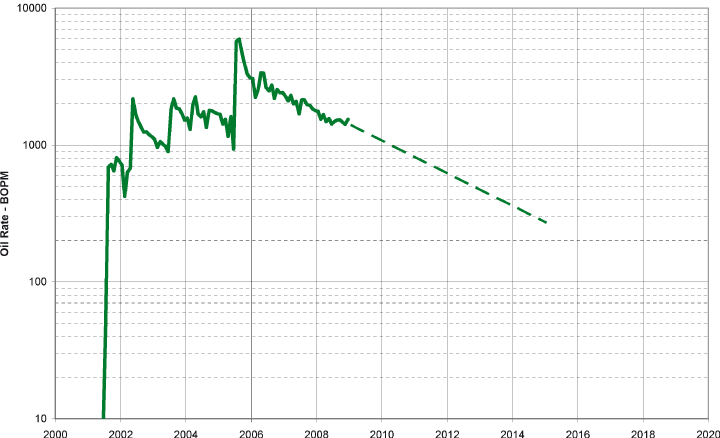
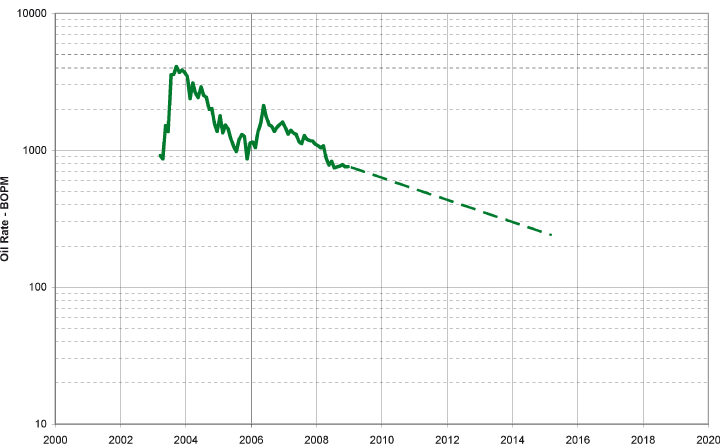
Remaining and ultimate oil production for each tract (lease) was determined by analysis of graphs of producing oil rate versus time (rate/time). Individual tract performance curves are contained in Exhibit 5, which also contains a summary curve for the entire proposed Carm-Ann Unit.
The projected ultimate primary oil recovery volumes result in primary recovery factors ranging from 1.67 percent to 19.85 percent of the individual tract OOIP values, as shown in Exhibit 6. The average primary oil recovery for the entire unit is projected to be 11.06 percent OOIP.
Mr. Jerry W. Nevans
March 11, 2009
Page 3
Waterflood Recovery
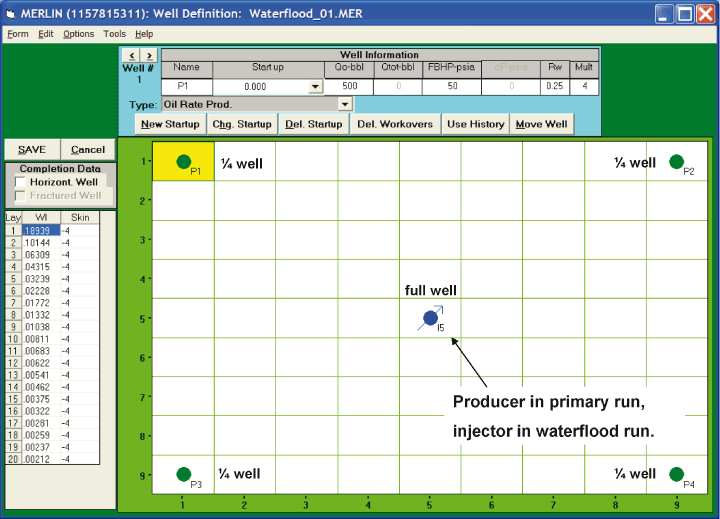
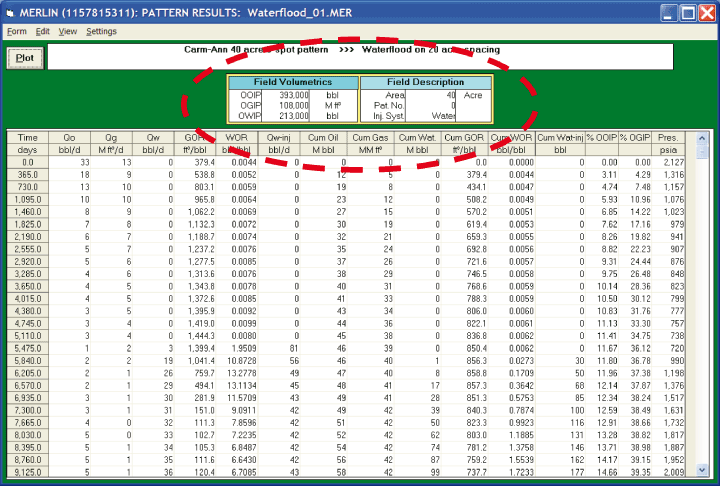
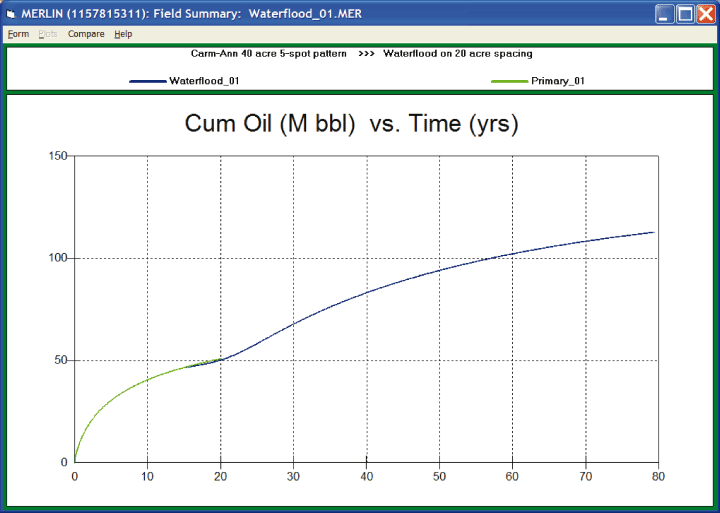
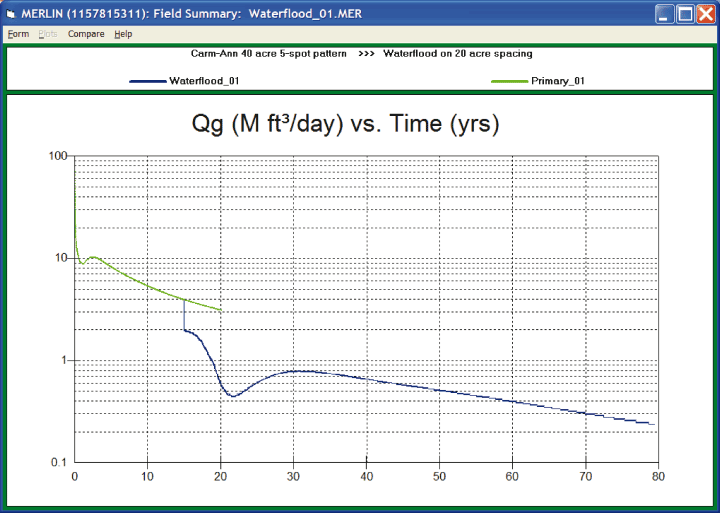
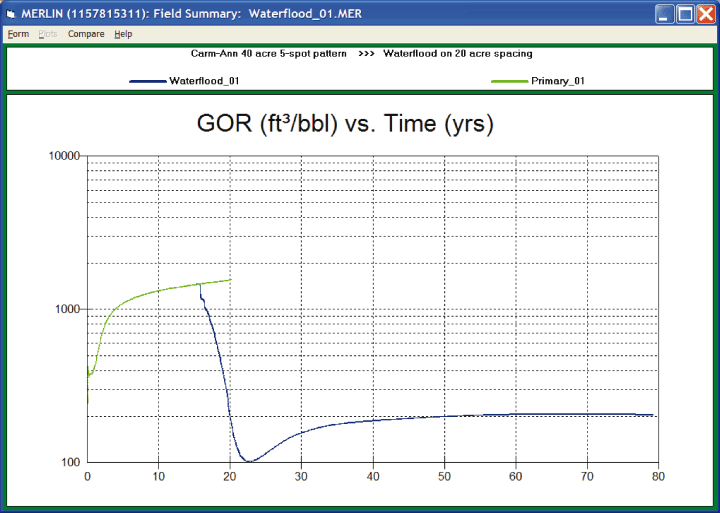
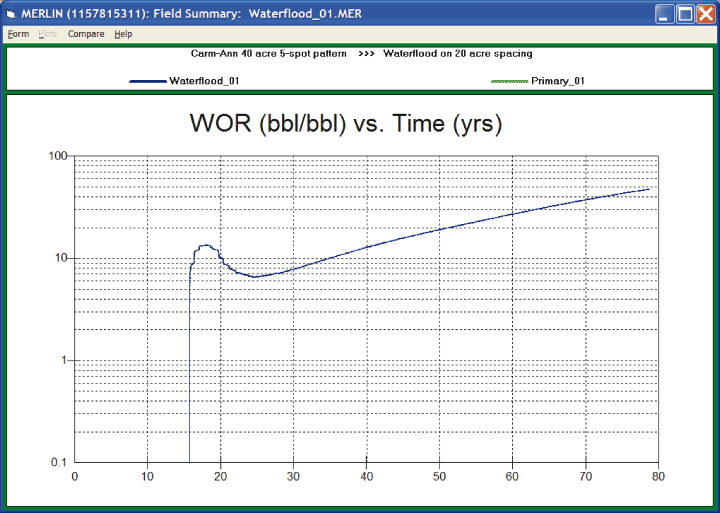
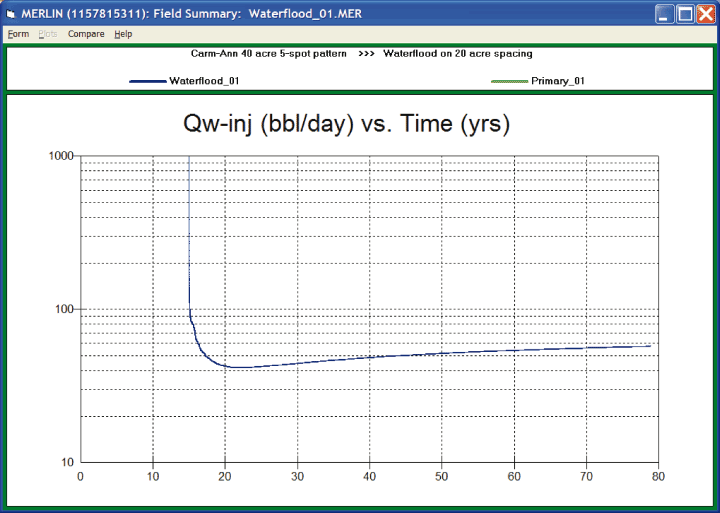
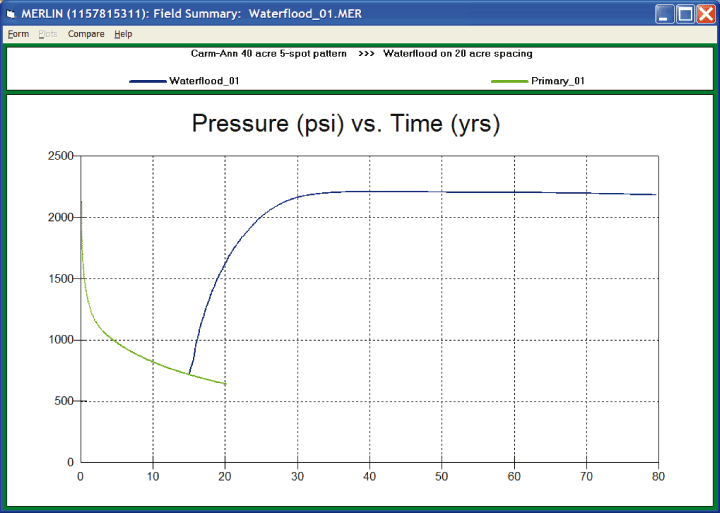
We have prepared a single pattern simulation model to predict primary and secondary recovery for a “typical” San Andres five-spot pattern in the Carm-Ann field. This simulation study is documented in Appendix A of this report.
The single pattern model is 40 acres in size. For both primary and secondary cases, there are two full wells in the model such that effective well spacing is 20 acres per well. In the primary case, both wells are producers for the entire prediction. In the waterflood case, both wells are producers for 15 years, at which time one well is converted to injection.
Primary oil recovery is predicted to be about 13 percent of the model OOIP. This is consistent with the individual lease recovery values from volumetric analysis and decline curve projections.
The pattern model predicts a waterflood ultimate recovery of about 29 percent of the pattern OOIP, which, in our experience, is a reasonable value. Calculated secondary-to-primary ratio (S/P) is 1.24.
We have calculated incremental secondary oil recovery for the individual Carm-Ann tracts using an S/P ratio of 1.20. These calculations are presented in Exhibit 7.
Unitization Parameters
The goal of this report was to develop a fair and equitable participation formula for the 16 leases in the study area while maximizing future primary and secondary oil recovery from the San Andres reservoir. We have developed a two-phase formula designed to honor remaining primary reserves in Phase I and incremental secondary oil recovery in Phase II. This participation formula was shown previously in Exhibit 1.
The Phase I participation formula gives 10 percent credit to the surface acreage in each lease. Another 10 percent credit is given to each tract’s calculated OOIP. Remaining producing oil reserves (PDP) are given 40 percent credit in the Phase I formula, and 2008 oil production, which is an indication of current productivity, is given 40 percent credit. When the total remaining primary oil reserve volume of 500,171 STB is produced Phase I ends and Phase II begins. The reference point for the remaining oil volume is as of January 1, 2009.
The Phase II formula gives 75 percent credit to the calculated incremental secondary oil volume, by lease. The remaining 25 percent credit is given to useable wellbores, which is intended to recognize past capital contributions to the potential waterflood project.
Mr. Jerry W. Nevans
March 11, 2009
Page 4
We appreciate the opportunity to prepare this waterflood unitization study for Parallel Petroleum Corporation. We wish the Carm-Ann San Andres owners every success with this project.
| | | | | |
| | Sincerely,
WILLIAM M. COBB & ASSOCIATES, INC.
| |
| | /s/ Frank J. Marek | |
| | Frank J. Marek, P. E. | |
| | Senior Vice President | |
| | | | | |
| | | |
| | /s/ Brian D. Nicoud | |
| | Brian D. Nicoud, P. G. | |
| | Senior Geological & Petrophysical Advisor | |
| | | | | |
| |  |
| FJM:jf |
Carm-Ann Unit Tract Participation Factors
PHASE I :
| | | | | | | | | | | | | | | | | | | | | | | | | | | |
| | | | | Phase I | | 0.100 | | 0.100 | | 0.400 | | 0.400 | | 1.000 |
| | | | | Tract | | Surface | | OOIP | | Rem. PDP | | 2008 | | | | |
| Tract | | Lease | | Participation | | acres | | STB | | STB | | BBL Oil | | | | |
| | | | | |
| 1 | | Simmons | | | 0.02241348 | | | | 160.0 | | | | 382,609 | | | | 7,798 | | | | 2,019 | | | | | |
| 2 | | Coast | | | 0.00377633 | | | | 40.0 | | | | 291,307 | | | | 0 | | | | 0 | | | | | |
| 3 | | Metzger | | | 0.02135709 | | | | 80.0 | | | | 585,065 | | | | 14,037 | | | | 1,099 | | | | | |
| 4 | | PKC | | | 0.30056428 | | | | 240.0 | | | | 2,400,335 | | | | 196,467 | | | | 50,405 | | | | | |
| 5 | | Akers | | | 0.02301562 | | | | 40.0 | | | | 595,115 | | | | 18,716 | | | | 1,223 | | | | | |
| 6 | | Yeager | | | 0.00622381 | | | | 40.0 | | | | 816,904 | | | | 0 | | | | 0 | | | | | |
| 7 | | Mabee | | | 0.00342063 | | | | 40.0 | | | | 214,920 | | | | 0 | | | | 0 | | | | | |
| 8 | | McConal-Clark | | | 0.06689226 | | | | 120.0 | | | | 2,513,933 | | | | 22,878 | | | | 12,684 | | | | | |
| 9 | | Colgan State “A” | | | 0.04480396 | | | | 53.0 | | | | 996,058 | | | | 20,209 | | | | 8,903 | | | | | |
| 10 | | Lawrence “C” | | | 0.08011829 | | | | 80.0 | | | | 1,336,105 | | | | 37,368 | | | | 16,769 | | | | | |
| 11 | | Lawrence “D” | | | 0.04321040 | | | | 80.0 | | | | 708,407 | | | | 23,393 | | | | 7,005 | | | | | |
| 12 | | PKC “A” | | | 0.06706007 | | | | 80.0 | | | | 2,397,209 | | | | 18,074 | | | | 15,669 | | | | | |
| 13 | | Lawrence “B” | | | 0.09465220 | | | | 80.0 | | | | 2,360,609 | | | | 37,681 | | | | 20,841 | | | | | |
| 14 | | Lawrence “A” | | | 0.03693574 | | | | 40.0 | | | | 852,540 | | | | 20,973 | | | | 5,896 | | | | | |
| 15 | | Thompson “B” | | | 0.10439488 | | | | 160.0 | | | | 2,607,196 | | | | 49,410 | | | | 18,433 | | | | | |
| 16 | | Elizabeth Crews Mast | | | 0.08116096 | | | | 320.0 | | | | 2,416,766 | | | | 33,167 | | | | 10,284 | | | | | |
| | | | | | | | | |
| | | TOTALS | | | 1.00000000 | | | | 1,653.0 | | | | 21,475,079 | | | | 500,171 | | | | 171,230 | | | | | |
| | |
| | | |
| William M. Cobb & Associates, Inc. | | EXHIBIT 1, page 1 |
Carm-Ann Unit Tract Participation Factors
PHASE II :
| | | | | | | | | | | | | | | | | | | | | | | |
| | | | | Phase II | | Primary | | 0.750 | | 0.250 | | 1.000 |
| | | | | Tract | | EUR | | Sec. STB | | Useable | | | | |
| Tract | | Lease | | Participation | | STB | | @ S/P = 1.20 | | Wellbores | | | | |
| | | | | |
| 1 | | Simmons | | | 0.01816158 | | | | 45,891 | | | | 55,069 | | | | 1 | | | | | |
| 2 | | Coast | | | 0.00153624 | | | | 4,867 | | | | 5,840 | | | | 0 | | | | | |
| 3 | | Metzger | | | 0.01945139 | | | | 49,977 | | | | 59,972 | | | | 1 | | | | | |
| 4 | | PKC | | | 0.19816719 | | | | 476,401 | | | | 571,681 | | | | 13 | | | | | |
| 5 | | Akers | | | 0.02621279 | | | | 71,398 | | | | 85,677 | | | | 1 | | | | | |
| 6 | | Yeager | | | 0.01804206 | | | | 45,512 | | | | 54,614 | | | | 1 | | | | | |
| 7 | | Mabee | | | 0.01220153 | | | | 38,656 | | | | 46,387 | | | | 0 | | | | | |
| 8 | | McConal-Clark | | | 0.10569470 | | | | 241,674 | | | | 290,009 | | | | 8 | | | | | |
| 9 | | Colgan State “A” | | | 0.07077167 | | | | 189,271 | | | | 227,125 | | | | 3 | | | | | |
| 10 | | Lawrence “C” | | | 0.10285663 | | | | 255,978 | | | | 307,173 | | | | 6 | | | | | |
| 11 | | Lawrence “D” | | | 0.04768641 | | | | 116,134 | | | | 139,361 | | | | 3 | | | | | |
| 12 | | PKC “A” | | | 0.09008230 | | | | 215,507 | | | | 258,608 | | | | 6 | | | | | |
| 13 | | Lawrence “B” | | | 0.08295329 | | | | 192,921 | | | | 231,506 | | | | 6 | | | | | |
| 14 | | Lawrence “A” | | | 0.02755133 | | | | 63,991 | | | | 76,789 | | | | 2 | | | | | |
| 15 | | Thompson “B” | | | 0.10254452 | | | | 220,046 | | | | 264,056 | | | | 9 | | | | | |
| 16 | | Elizabeth Crews Mast | | | 0.07608637 | | | | 147,871 | | | | 177,445 | | | | 8 | | | | | |
| | | | | | | |
| | | TOTALS | | | 1.00000000 | | | | 2,376,095 | | | | 2,851,314 | | | | 68 | | | | | |
| | |
| | | |
| William M. Cobb & Associates, Inc. | | EXHIBIT 1, page 2 |
Neutron Log Porosity Correlated to Core Porosity
Carm-Ann Field — San Andres Formation
| | |
| | | |
| William M. Cobb & Associates, Inc. | | EXHIBIT 2 |
Carm-Ann Petrophysical Summary — Net Pay Cutoffs: Porosity =/> 0.030 & Vcl </= 0.485
| | | | | | | | | | | | | | | | | | | | | | | | | | | | | | | | | | | | | | | | | | | | | | | | | |
| Well | | API | | | | KB Elevation | | San Andres | | SS LKO | | MD LKO | | Gross Interval | | Net-to-Gross | | Net Pay | | Avg Phi | | Avg Sw | | PhiH | | HPT |
| Name and Number | | Number | | Section | | Feet | | MD Top, Feet | | SS Top, Feet | | Feet | | Feet | | Feet | | Fraction | | Feet | | Fraction | | Fraction | | Feet | | Feet |
| Coast-1 | | 42-165- | | 11 | | | 3221.0 | | | | 4604.0 | | | | -1383.0 | | | | -1625.0 | | | | 4846.0 | | | | 242.0 | | | | 0.53099 | | | | 128.5 | | | | 0.04155 | | | N/A | | | 5.339 | | | N/A |
| Cone #2 | | 42-165-333980000 | | 12 | | | 3233.0 | | | | 4628.0 | | | | -1395.0 | | | | -1625.0 | | | | 4858.0 | | | | 230.0 | | | | 0.23043 | | | | 53.0 | | | | 0.05389 | | | N/A | | | 2.856 | | | N/A |
| Yeager-1 | | 42-165- | | 12 | | | 3228.0 | | | | 4550.0 | | | | -1322.0 | | | | -1625.0 | | | | 4853.0 | | | | 303.0 | | | | 0.47195 | | | | 143.0 | | | | 0.04124 | | | N/A | | | 5.897 | | | N/A |
| Yeager-2 | | 42-165- | | 12 | | | 3216.0 | | | | 4538.0 | | | | -1322.0 | | | | -1625.0 | | | | 4841.0 | | | | 303.0 | | | | 0.51485 | | | | 156.0 | | | | 0.04104 | | | N/A | | | 6.402 | | | N/A |
| Colgan State #A3 | | 42-165-363490000 | | 19 | | | 3213.0 | | | | 4553.0 | | | | -1340.0 | | | | -1625.0 | | | | 4838.0 | | | | 285.0 | | | | 0.30526 | | | | 87.0 | | | | 0.03880 | | | N/A | | | 3.376 | | | N/A |
| L.B. Russell #3 | | 42-165- | | 19 | | | 3211.0 | | | | 4557.0 | | | | -1346.0 | | | | -1625.0 | | | | 4836.0 | | | | 279.0 | | | | 0.55914 | | | | 156.0 | | | | 0.05239 | | | N/A | | | 8.173 | | | N/A |
| McConal-Clark #5 | | 42-165-363220000 | | 19 | | | 3217.0 | | | | 4556.0 | | | | -1339.0 | | | | -1625.0 | | | | 4842.0 | | | | 286.0 | | | | 0.40909 | | | | 117.0 | | | | 0.04359 | | | N/A | | | 5.100 | | | N/A |
| McConal-Clark #6 | | 42-165-363230000 | | 19 | | | 3214.0 | | | | 4548.0 | | | | -1334.0 | | | | -1625.0 | | | | 4839.0 | | | | 291.0 | | | | 0.50859 | | | | 148.0 | | | | 0.04403 | | | N/A | | | 6.516 | | | N/A |
McConal-Clark #8 | | 42-165-363240000 | | 19 | | | 3209.0 | | | | 4546.0 | | | | -1337.0 | | | | -1625.0 | | | | 4834.0 | | | | 288.0 | | | | 0.47743 | | | | 137.5 | | | | 0.04382 | | | 0.32440 | | | 6.025 | | | 4.071 |
| McConal-Clark #9 | | 42-165-364890000 | | 19 | | | 3220.0 | | | | 4537.0 | | | | -1317.0 | | | | -1625.0 | | | | 4845.0 | | | | 308.0 | | | | 0.45455 | | | | 140.0 | | | | 0.04198 | | | N/A | | | 5.877 | | | N/A |
| Russell #2 | | 42-165- | | 19 | | | 3217.0 | | | | 4594.0 | | | | -1377.0 | | | | -1625.0 | | | | 4842.0 | | | | 248.0 | | | | 0.45161 | | | | 112.0 | | | | 0.04462 | | | N/A | | | 4.997 | | | N/A |
| Russell #4 | | 42-165- | | 19 | | | 3217.0 | | | | 4567.0 | | | | -1350.0 | | | | -1625.0 | | | | 4842.0 | | | | 275.0 | | | | 0.22182 | | | | 61.0 | | | | 0.04272 | | | N/A | | | 2.606 | | | N/A |
| Russell #5 | | 42-165-342960000 | | 19 | | | 3211.5 | | | | 4570.0 | | | | -1358.5 | | | | -1625.0 | | | | 4836.5 | | | | 266.5 | | | | 0.19887 | | | | 53.0 | | | | 0.04048 | | | N/A | | | 2.145 | | | N/A |
| Russell #6 | | 42-165-365380000 | | 19 | | | 3214.0 | | | | 4605.0 | | | | -1391.0 | | | | -1625.0 | | | | 4839.0 | | | | 234.0 | | | | 0.67094 | | | | 157.0 | | | | 0.04724 | | | N/A | | | 7.417 | | | N/A |
| Lawrence #B5 | | 42-165-363450000 | | 20 | | | 3198.0 | | | | 4573.0 | | | | -1375.0 | | | | -1625.0 | | | | 4823.0 | | | | 250.0 | | | | 0.72800 | | | | 182.0 | | | | 0.04802 | | | N/A | | | 8.740 | | | N/A |
| Lawrence #B6 | | 42-165-364640000 | | 20 | | | 3201.0 | | | | 4570.5 | | | | -1369.5 | | | | -1625.0 | | | | 4826.0 | | | | 255.5 | | | | 0.52642 | | | | 134.5 | | | | 0.04419 | | | N/A | | | 5.944 | | | N/A |
| Lawrence #C5 | | 42-165-363150000 | | 20 | | | 3199.0 | | | | 4562.5 | | | | -1363.5 | | | | -1625.0 | | | | 4824.0 | | | | 261.5 | | | | 0.49331 | | | | 129.0 | | | | 0.04367 | | | N/A | | | 5.633 | | | N/A |
| Lawrence #C6 | | 42-165-364630000 | | 20 | | | 3199.0 | | | | 4579.5 | | | | -1380.5 | | | | -1625.0 | | | | 4824.0 | | | | 244.5 | | | | 0.46217 | | | | 113.0 | | | | 0.04415 | | | N/A | | | 4.989 | | | N/A |
| PKC #15 | | 42-165-364690000 | | 20 | | | 3203.0 | | | | 4582.5 | | | | -1379.5 | | | | -1625.0 | | | | 4828.0 | | | | 245.5 | | | | 0.64562 | | | | 158.5 | | | | 0.04821 | | | N/A | | | 7.641 | | | N/A |
| PKC #A10 | | 42-165-364670000 | | 20 | | | 3202.0 | | | | 4590.0 | | | | -1388.0 | | | | -1625.0 | | | | 4827.0 | | | | 237.0 | | | | 0.46835 | | | | 111.0 | | | | 0.04526 | | | N/A | | | 5.024 | | | N/A |
| PKC #A11 | | 42-165-364650000 | | 20 | | | 3196.0 | | | | 4569.5 | | | | -1373.5 | | | | -1625.0 | | | | 4821.0 | | | | 251.5 | | | | 0.65805 | | | | 165.5 | | | | 0.04669 | | | N/A | | | 7.727 | | | N/A |
| PKC #A13 | | 42-165-364910000 | | 20 | | | 3207.0 | | | | 4580.5 | | | | -1373.5 | | | | -1625.0 | | | | 4832.0 | | | | 251.5 | | | | 0.57853 | | | | 145.5 | | | | 0.04329 | | | N/A | | | 6.299 | | | N/A |
| | |
| | | |
| William M. Cobb & Associates, Inc. | | EXHIBIT 3, page 1 |
Carm-Ann Petrophysical Summary — Net Pay Cutoffs: Porosity =/> 0.030 & Vcl </= 0.485
| | | | | | | | | | | | | | | | | | | | | | | | | | | | | | | | | | | | | | | | | | | | | |
| Well | | API | | | | KB Elevation | | San Andres | | SS LKO | | MD LKO | | Gross Interval | | Net-to-Gross | | Net Pay | | Avg Phi | | Avg Sw | | PhiH | | HPT |
| Name and Number | | Number | | Section | | Feet | | MD Top, Feet | | SS Top, Feet | | Feet | | Feet | | Feet | | Fraction | | Feet | | Fraction | | Fraction | | Feet | | Feet |
| PKC #A14 | | 42-165-364980000 | | 20 | | | 3212.0 | | | | 4602.0 | | | | -1390.0 | | | | -1625.0 | | | | 4837.0 | | | | 235.0 | | | | 0.57447 | | | | 135.0 | | | 0.04527 | | N/A | | 6.111 | | N/A |
| PKC #A8 | | 42-165-363140000 | | 20 | | | 3200.0 | | | | 4567.0 | | | | -1367.0 | | | | -1625.0 | | | | 4825.0 | | | | 258.0 | | | | 0.48062 | | | | 124.0 | | | 0.04567 | | N/A | | 5.663 | | N/A |
| PKC A-4 | | 42-165- | | 20 | | | 3200.5 | | | | 4560.0 | | | | -1359.5 | | | | -1625.0 | | | | 4825.5 | | | | 265.5 | | | | 0.66290 | | | | 176.0 | | | 0.03970 | | N/A | | 6.987 | | N/A |
| Crews Mast #9 | | 42-165-364680000 | | 21 | | | 3213.0 | | | | 4652.0 | | | | -1439.0 | | | | -1625.0 | | | | 4838.0 | | | | 186.0 | | | | 0.69624 | | | | 129.5 | | | 0.05031 | | N/A | | 6.515 | | N/A |
| Lawrence #A2 | | 42-165-364880000 | | 21 | | | 3195.0 | | | | 4580.0 | | | | -1385.0 | | | | -1625.0 | | | | 4820.0 | | | | 240.0 | | | | 0.54375 | | | | 130.5 | | | 0.04623 | | N/A | | 6.033 | | N/A |
| Thompson #B11 | | 42-165-363190000 | | 21 | | | 3198.0 | | | | 4612.0 | | | | -1414.0 | | | | -1625.0 | | | | 4823.0 | | | | 211.0 | | | | 0.42891 | | | | 90.5 | | | 0.05134 | | N/A | | 4.646 | | N/A |
| Thompson #B12 | | 42-165-363170000 | | 21 | | | 3193.0 | | | | 4625.0 | | | | -1432.0 | | | | -1625.0 | | | | 4818.0 | | | | 193.0 | | | | 0.51554 | | | | 99.5 | | | 0.04811 | | N/A | | 4.787 | | N/A |
| Thompson #B13 | | 42-165-364900000 | | 21 | | | 3196.0 | | | | 4632.5 | | | | -1436.5 | | | | -1625.0 | | | | 4821.0 | | | | 188.5 | | | | 0.48541 | | | | 91.5 | | | 0.04891 | | N/A | | 4.475 | | N/A |
| Thompson B-3 | | 42-165- | | 21 | | | 3200.0 | | | | 4631.0 | | | | -1431.0 | | | | -1625.0 | | | | 4825.0 | | | | 194.0 | | | | 0.48454 | | | | 94.0 | | | 0.04144 | | N/A | | 3.895 | | N/A |
| Thompson B-5 | | 42-165- | | 21 | | | 3199.0 | | | | 4581.0 | | | | -1382.0 | | | | -1625.0 | | | | 4824.0 | | | | 243.0 | | | | 0.49383 | | | | 120.0 | | | 0.04294 | | N/A | | 5.153 | | N/A |
| Thompson B-8 | | 42-165- | | 21 | | | 3195.0 | | | | 4620.0 | | | | -1425.0 | | | | -1625.0 | | | | 4820.0 | | | | 200.0 | | | | 0.48500 | | | | 97.0 | | | 0.04150 | | N/A | | 4.026 | | N/A |
| Winkles-1 | | 42-165- | | 22 | | | 3209.0 | | | | 4592.0 | | | | -1383.0 | | | | -1625.0 | | | | 4834.0 | | | | 242.0 | | | | 0.41322 | | | | 100.0 | | | 0.04249 | | N/A | | 4.249 | | N/A |
| Winkles-2 | | 42-165- | | 22 | | | 3215.0 | | | | 4636.0 | | | | -1421.0 | | | | -1625.0 | | | | 4840.0 | | | | 204.0 | | | | 0.50980 | | | | 104.0 | | | 0.03975 | | N/A | | 4.134 | | N/A |
| Winkles-3 | | 42-165- | | 22 | | | 3217.0 | | | | 4632.0 | | | | -1415.0 | | | | -1625.0 | | | | 4842.0 | | | | 210.0 | | | | 0.52381 | | | | 110.0 | | | 0.04218 | | N/A | | 4.640 | | N/A |
| Metzger #1 | | 42-165- | | 11 | | | 3220.0 | | | | 4592.0 | | | | -1372.0 | | | | -1625.0 | | | | 4845.0 | | | | 253.0 | | | | 0.59289 | | | | 150.0 | | | N/A | | N/A | | N/A | | N/A |
| Collins #1 | | 42-165- | | 12 | | | 3249.0 | | | | 4630.0 | | | | -1381.0 | | | | -1625.0 | | | | 4874.0 | | | | 244.0 | | | | 0.26230 | | | | 64.0 | | | N/A | | N/A | | N/A | | N/A |
| Colgan State “A” #2 | | 42-165- | | 19 | | | 3225.0 | | | | 4566.0 | | | | -1341.0 | | | | -1625.0 | | | | 4850.0 | | | | 284.0 | | | | 0.24296 | | | | 69.0 | | | N/A | | N/A | | N/A | | N/A |
| McConal-Clark-4 | | 42-165- | | 19 | | | 3224.0 | | | | 4574.0 | | | | -1350.0 | | | | -1625.0 | | | | 4849.0 | | | | 275.0 | | | | 0.43636 | | | | 120.0 | | | N/A | | N/A | | N/A | | N/A |
| Lawrence “C” #1-X | | 42-165- | | 20 | | | 3209.0 | | | | 4554.0 | | | | -1345.0 | | | | -1625.0 | | | | 4834.0 | | | | 280.0 | | | | 0.55357 | | | | 155.0 | | | N/A | | N/A | | N/A | | N/A |
| Lawrence “D” #1X | | 42-165- | | 20 | | | 3209.0 | | | | 4625.0 | | | | -1416.0 | | | | -1625.0 | | | | 4834.0 | | | | 209.0 | | | | 0.62201 | | | | 130.0 | | | N/A | | N/A | | N/A | | N/A |
| Lawrence “D” #2 | | 42-165- | | 20 | | | 3208.0 | | | | 4617.0 | | | | -1409.0 | | | | -1625.0 | | | | 4833.0 | | | | 216.0 | | | | 0.50000 | | | | 108.0 | | | N/A | | N/A | | N/A | | N/A |
| Lawrence B-1 | | 42-165- | | 20 | | | 3199.0 | | | | 4568.0 | | | | -1369.0 | | | | -1625.0 | | | | 4824.0 | | | | 256.0 | | | | 0.36328 | | | | 93.0 | | | N/A | | N/A | | N/A | | N/A |
| | |
| | | |
| William M. Cobb & Associates, Inc. | | EXHIBIT 3, page 2 |
Carm-Ann Petrophysical Summary — Net Pay Cutoffs: Porosity =/> 0.030 & Vcl </= 0.485
| | | | | | | | | | | | | | | | | | | | | | | | | | | | | | | | | | | | | | | | | | | | | |
| Well | | API | | | | KB Elevation | | San Andres | | SS LKO | | MD LKO | | Gross Interval | | Net-to-Gross | | Net Pay | | Avg Phi | | Avg Sw | | PhiH | | HPT |
| Name and Number | | Number | | Section | | Feet | | MD Top, Feet | | SS Top, Feet | | Feet | | Feet | | Feet | | Fraction | | Feet | | Fraction | | Fraction | | Feet | | Feet |
| Lawrence B-2 | | 42-165- | | 20 | | | 3200.0 | | | | 4564.0 | | | | -1364.0 | | | | -1625.0 | | | | 4825.0 | | | | 261.0 | | | | 0.54406 | | | | 142.0 | | | N/A | | N/A | | N/A | | N/A |
| Lawrence B-3 | | 42-165- | | 20 | | | 3197.0 | | | | 4578.0 | | | | -1381.0 | | | | -1625.0 | | | | 4822.0 | | | | 244.0 | | | | 0.69262 | | | | 169.0 | | | N/A | | N/A | | N/A | | N/A |
| Lawrence B-4 | | 42-165- | | 20 | | | 3193.0 | | | | 4588.0 | | | | -1395.0 | | | | -1625.0 | | | | 4818.0 | | | | 230.0 | | | | 0.55652 | | | | 128.0 | | | N/A | | N/A | | N/A | | N/A |
| Lawrence C-3 | | 42-165- | | 20 | | | 3202.0 | | | | 4574.0 | | | | -1372.0 | | | | -1625.0 | | | | 4827.0 | | | | 253.0 | | | | 0.56522 | | | | 143.0 | | | N/A | | N/A | | N/A | | N/A |
| Lawrence C-4 | | 42-165- | | 20 | | | 3201.0 | | | | 4580.0 | | | | -1379.0 | | | | -1625.0 | | | | 4826.0 | | | | 246.0 | | | | 0.58943 | | | | 145.0 | | | N/A | | N/A | | N/A | | N/A |
| PKC “A” #3 | | 42-165- | | 20 | | | 3209.0 | | | | 4572.0 | | | | -1363.0 | | | | -1625.0 | | | | 4834.0 | | | | 262.0 | | | #VALUE! | | | NDE | | | N/A | | N/A | | N/A | | N/A |
| PKC #5 | | 42-165- | | 20 | | | 3213.5 | | | | 4574.0 | | | | -1360.5 | | | | -1625.0 | | | | 4838.5 | | | | 264.5 | | | | 0.46125 | | | | 122.0 | | | N/A | | N/A | | N/A | | N/A |
| PKC #9 | | 42-165- | | 20 | | | 3201.0 | | | | 4600.0 | | | | -1399.0 | | | | -1625.0 | | | | 4826.0 | | | | 226.0 | | | | 0.65044 | | | | 147.0 | | | N/A | | N/A | | N/A | | N/A |
| Eliz Crews Mast-1 | | 42-165- | | 21 | | | 3192.0 | | | | 4608.0 | | | | -1416.0 | | | | -1625.0 | | | | 4817.0 | | | | 209.0 | | | | 0.49761 | | | | 104.0 | | | N/A | | N/A | | N/A | | N/A |
| Eliz Crews Mast-2 | | 42-165- | | 21 | | | 3193.0 | | | | 4638.0 | | | | -1445.0 | | | | -1625.0 | | | | 4818.0 | | | | 180.0 | | | | 0.56667 | | | | 102.0 | | | N/A | | N/A | | N/A | | N/A |
| Eliz Crews Mast-3 | | 42-165- | | 21 | | | 3204.0 | | | | 4680.0 | | | | -1476.0 | | | | -1625.0 | | | | 4829.0 | | | | 149.0 | | | | 0.59060 | | | | 88.0 | | | N/A | | N/A | | N/A | | N/A |
| Eliz Crews Mast-4 | | 42-165- | | 21 | | | 3200.0 | | | | 4670.0 | | | | -1470.0 | | | | -1625.0 | | | | 4825.0 | | | | 155.0 | | | | 0.65806 | | | | 102.0 | | | N/A | | N/A | | N/A | | N/A |
| Eliz. Crews Mast #5 | | 42-165-360310000 | | 21 | | | 3199.0 | | | | 4648.0 | | | | -1449.0 | | | | -1625.0 | | | | 4824.0 | | | | 176.0 | | | | 0.63068 | | | | 111.0 | | | N/A | | N/A | | N/A | | N/A |
| Eliz. Crews Mast #6 | | 42-165-361090000 | | 21 | | | 3198.0 | | | | 4666.0 | | | | -1468.0 | | | | -1625.0 | | | | 4823.0 | | | | 157.0 | | | | 0.45860 | | | | 72.0 | | | N/A | | N/A | | N/A | | N/A |
| Thompson “B” #6 | | 42-165-360630000 | | 21 | | | 3201.0 | | | | 4646.0 | | | | -1445.0 | | | | -1625.0 | | | | 4826.0 | | | | 180.0 | | | | 0.67778 | | | | 122.0 | | | N/A | | N/A | | N/A | | N/A |
| Thompson “B” #7 | | 42-165-361460000 | | 21 | | | 3195.0 | | | | 4636.0 | | | | -1441.0 | | | | -1625.0 | | | | 4820.0 | | | | 184.0 | | | | 0.73913 | | | | 136.0 | | | N/A | | N/A | | N/A | | N/A |
| Thompson B-9 | | 42-165- | | 21 | | | 3195.0 | | | | 4618.0 | | | | -1423.0 | | | | -1625.0 | | | | 4820.0 | | | | 202.0 | | | | 0.63366 | | | | 128.0 | | | N/A | | N/A | | N/A | | N/A |
| PKC “A” #7 | | 42-165-359700000 | | | | | 3200.0 | | | | 4630.0 | | | | -1430.0 | | | | -1625.0 | | | | 4825.0 | | | | 195.0 | | | | 0.69231 | | | | 135.0 | | | N/A | | N/A | | N/A | | N/A |
| | | | | | | | | | | | | | | | | | | | | | | | | | | | | | | | | | | | | | | | | | | | | |
Weighted Averages
| | | 3206.9 | | | | 4586.1 | | | | -1376.5 | | | | -1625.0 | | | | | | | | 248.5 | | | | 0.4885 | | | | 121.9 | | | 0.04466 | | 0.32440 | | 5.446 | | 4.071 |
| | |
| | | |
| William M. Cobb & Associates, Inc. | | EXHIBIT 3, page 3 |
EXHIBIT 4
San Andres Net Pay Map
Carm-Ann Field
Gaines County, Texas
William M. Cobb & Associates, Inc.
| | | | | | | |
| | | Proposed Carm-Ann Unit | | Cum. = | | 1,875,924 BBL |
| | | | | Rem. = | | 500,171 BBL |
| | | | | Ult. = | | 2,376,095 BBL |
| | |
| | | |
| William M. Cobb & Associates, Inc. | | EXHIBIT 5, page 1 |
| | | | | | | |
| | | Tract 1 — Simmons | | Cum. = | | 38,093 BBL |
| | | | | Rem. = | | 7,798 BBL |
| | | | | Ult. = | | 45,891 BBL |
| | |
| | | |
| William M. Cobb & Associates, Inc. | | EXHIBIT 5, page 2 |
| | | | | | | |
| | | Tract 2 — Coast | | Cum. = | | 4,867 BBL |
| | | | | Rem. = | | 0 BBL |
| | | | | Ult. = | | 4,867 BBL |
| | |
| | | |
| William M. Cobb & Associates, Inc. | | EXHIBIT 5, page 3 |
| | | | | | | |
| | | Tract 3 — Metzger | | Cum. = | | 35,940 BBL |
| | | | | Rem. = | | 14,037 BBL |
| | | | | Ult. = | | 49,977 BBL |
| | |
| | | |
| William M. Cobb & Associates, Inc. | | EXHIBIT 5, page 4 |
| | | | | | | |
| | | Tract 4 — PKC | | Cum. = | | 279,934 BBL |
| | | | | Rem. = | | 196,467 BBL |
| | | | | Ult. = | | 476,401 BBL |
| | |
| | | |
| William M. Cobb & Associates, Inc. | | EXHIBIT 5, page 5 |
| | | | | | | |
| | | Tract 5 — Akers | | Cum. = | | 52,682 BBL |
| | | | | Rem. = | | 18,716 BBL |
| | | | | Ult. = | | 71,398 BBL |
| | |
| | | |
| William M. Cobb & Associates, Inc. | | EXHIBIT 5, page 6 |
| | | | | | | |
| | | Tract 6 — Yeager | | Cum. = | | 45,512 BBL |
| | | | | Rem. = | | 0 BBL |
| | | | | Ult. = | | 45,512 BBL |
| | |
| | | |
| William M. Cobb & Associates, Inc. | | EXHIBIT 5, page 7 |
| | | | | | | |
| | | Tract 7 — Mabee | | Cum. = | | 38,656 BBL |
| | | | | Rem. = | | 0 BBL |
| | | | | Ult. = | | 38,656 BBL |
| | |
| | | |
| William M. Cobb & Associates, Inc. | | EXHIBIT 5, page 8 |
| | | | | | | |
| | | Tract 8 — McConal-Clark | | Cum. = | | 218,796 BBL |
| | | | | Rem. = | | 22,878 BBL |
| | | | | Ult. = | | 241,674 BBL |
| | |
| | | |
| William M. Cobb & Associates, Inc. | | EXHIBIT 5, page 9 |
| | | | | | | |
| | | Tract 9 — Colgan State ‘A’ | | Cum. = | | 169,062 BBL |
| | | | | Rem. = | | 20,209 BBL |
| | | | | Ult. = | | 189,271 BBL |
| | |
| | | |
| William M. Cobb & Associates, Inc. | | EXHIBIT 5, page 10 |
| | | | | | | |
| | | Tract 10 — Lawrence ‘C’ | | Cum. = | | 218,610 BBL |
| | | | | Rem. = | | 37,368 BBL |
| | | | | Ult. = | | 255,978 BBL |
| | |
| | | |
| William M. Cobb & Associates, Inc. | | EXHIBIT 5, page 11 |
| | | | | | | |
| | | Tract 11 — Lawrence ‘D’ | | Cum. = | | 92,741 BBL |
| | | | | Rem. = | | 23,393 BBL |
| | | | | Ult. = | | 116,134 BBL |
| | |
| | | |
| William M. Cobb & Associates, Inc. | | EXHIBIT 5, page 12 |
| | | | | | | |
| | | Tract 12 — PKC ‘A’ | | Cum. = | | 197,433 BBL |
| | | | | Rem. = | | 18,074 BBL |
| | | | | Ult. = | | 215,507 BBL |
| | |
| | | |
| William M. Cobb & Associates, Inc. | | EXHIBIT 5, page 13 |
| | | | | | | |
| | | Tract 13 — Lawrence ‘B’ | | Cum. = | | 155,240 BBL |
| | | | | Rem. = | | 37,681 BBL |
| | | | | Ult. = | | 192,921 BBL |
| | |
| | | |
| William M. Cobb & Associates, Inc. | | EXHIBIT 5, page 14 |
| | | | | | | |
| | | Tract 14 — Lawrence ‘A’ | | Cum. = | | 43,018 BBL |
| | | | | Rem. = | | 20,973 BBL |
| | | | | Ult. = | | 63,991 BBL |
| | |
| | | |
| William M. Cobb & Associates, Inc. | | EXHIBIT 5, page 15 |
| | | | | | | |
| | | Tract 15 — Thompson ‘B’ | | Cum. = | | 170,636 BBL |
| | | | | Rem. = | | 49,410 BBL |
| | | | | Ult. = | | 220,046 BBL |
| | |
| | | |
| William M. Cobb & Associates, Inc. | | EXHIBIT 5, page 16 |
| | | | | | | |
| | | Tract 16 — Elizabeth Crews Mast | | Cum. = | | 114,704 BBL |
| | | | | Rem. = | | 33,167 BBL |
| | | | | Ult. = | | 147,871 BBL |
| | |
| | | |
| William M. Cobb & Associates, Inc. | | EXHIBIT 5, page 17 |
Carm-Ann Tracts
| | | | | | | | | | | | | | | | | | | | | | | | | | | | | | | | | | | | | | | | | | | | | | | | | |
| | | | | | | Area | | Volume | | OOIP1 | | 2008 | | Tract Oil Recovery from Decline Curve Analysis |
| Tract | | Lease(s) | | Acres | | Acre-Feet | | STB | | BBL Oil | | BOPM 1/09 | | De - %/yr | | Act. Wells | | Rem. STB | | Cum. STB | | EUR STB | | %OOIP |
| |
| | 1 | | | Simmons | | | 160.0 | | | | 1,848.21 | | | | 382,609 | | | | 2,019 | | | | 175 | | | | 20.0 | % | | | 1 | | | | 7,798 | | | | 38,093 | | | | 45,891 | | | | 11.99 | % |
| | 2 | | | Coast | | | 40.0 | | | | 1,407.17 | | | | 291,307 | | | | 0 | | | | 0 | | | | 0.0 | % | | | 0 | | | | 0 | | | | 4,867 | | | | 4,867 | | | | 1.67 | % |
| | 3 | | | Metzger | | | 80.0 | | | | 2,826.18 | | | | 585,065 | | | | 1,099 | | | | 90 | | | | 5.0 | % | | | 1 | | | | 14,037 | | | | 35,940 | | | | 49,977 | | | | 8.54 | % |
| | 4 | | | PKC | | | 240.0 | | | | 11,594.92 | | | | 2,400,335 | | | | 50,405 | | | | 5,100 | | | | 25.0 | % | | | 13 | | | | 196,467 | | | | 279,934 | | | | 476,401 | | | | 19.85 | % |
| | 5 | | | Akers | | | 40.0 | | | | 2,874.73 | | | | 595,115 | | | | 1,223 | | | | 110 | | | | 5.0 | % | | | 1 | | | | 18,716 | | | | 52,682 | | | | 71,398 | | | | 12.00 | % |
| | 6 | | | Yeager | | | 40.0 | | | | 3,946.09 | | | | 816,904 | | | | 0 | | | | 0 | | | | 0.0 | % | | | 1 | | | | 0 | | | | 45,512 | | | | 45,512 | | | | 5.57 | % |
| | 7 | | | Mabee | | | 40.0 | | | | 1,038.18 | | | | 214,920 | | | | 0 | | | | 0 | | | | 0.0 | % | | | 0 | | | | 0 | | | | 38,656 | | | | 38,656 | | | | 17.99 | % |
| | 8 | | | McConal-Clark | | | 120.0 | | | | 12,143.66 | | | | 2,513,933 | | | | 12,684 | | | | 800 | | | | 30.0 | % | | | 4 | | | | 22,878 | | | | 218,796 | | | | 241,674 | | | | 9.61 | % |
| | 9 | | | Colgan State “A” | | | 53.0 | | | | 4,811.50 | | | | 996,058 | | | | 8,903 | | | | 620 | | | | 27.0 | % | | | 3 | | | | 20,209 | | | | 169,062 | | | | 189,271 | | | | 19.00 | % |
| | 10 | | | Lawrence “C” | | | 80.0 | | | | 6,454.11 | | | | 1,336,105 | | | | 16,769 | | | | 1,160 | | | | 27.0 | % | | | 6 | | | | 37,368 | | | | 218,610 | | | | 255,978 | | | | 19.16 | % |
| | 11 | | | Lawrence “D” | | | 80.0 | | | | 3,421.99 | | | | 708,407 | | | | 7,005 | | | | 525 | | | | 20.0 | % | | | 3 | | | | 23,393 | | | | 92,741 | | | | 116,134 | | | | 16.39 | % |
| | 12 | | | PKC “A” | | | 80.0 | | | | 11,579.82 | | | | 2,397,209 | | | | 15,669 | | | | 900 | | | | 38.0 | % | | | 6 | | | | 18,074 | | | | 197,433 | | | | 215,507 | | | | 8.99 | % |
| | 13 | | | Lawrence “B” | | | 80.0 | | | | 11,403.02 | | | | 2,360,609 | | | | 20,841 | | | | 1,300 | | | | 30.0 | % | | | 6 | | | | 37,681 | | | | 155,240 | | | | 192,921 | | | | 8.17 | % |
| | 14 | | | Lawrence “A” | | | 40.0 | | | | 4,118.23 | | | | 852,540 | | | | 5,896 | | | | 450 | | | | 20.0 | % | | | 2 | | | | 20,973 | | | | 43,018 | | | | 63,991 | | | | 7.51 | % |
| | 15 | | | Thompson “B” | | | 160.0 | | | | 12,594.17 | | | | 2,607,196 | | | | 18,433 | | | | 1,400 | | | | 24.0 | % | | | 9 | | | | 49,410 | | | | 170,636 | | | | 220,046 | | | | 8.44 | % |
| | 16 | | | Elizabeth Crews Mast | | | 320.0 | | | | 11,674.29 | | | | 2,416,766 | | | | 10,284 | | | | 755 | | | | 17.0 | % | | | 8 | | | | 33,167 | | | | 114,704 | | | | 147,871 | | | | 6.12 | % |
| | | | | | | |
| | | | | | | | 1,653.0 | | | | 103,736.27 | | | | 21,475,079 | | | | 171,230 | | | | 13,385 | | | | | | | | | | | | 500,171 | | | | 1,875,924 | | | | 2,376,095 | | | | 11.06 | % |
| | | | | |
1parameters: porosity = | | | 0.0450 | |
Swc = | | | 0.3240 | |
Boi (RB/STB) = | | | 1.1400 | |
| | |
| | | |
| William M. Cobb & Associates, Inc. | | EXHIBIT 6 |
Secondary Recovery Potential for Carm-Ann Tracts
| | | | | | | | | | | | | | | | | | | | | | | | | | | | | | | | | |
| | | | | | | | | | | | | | | | | | | | | | | | | | | | | | | S/P = 1.20 |
| | | | | | | Area | | Volume | | OOIP1 | | Primary Recovery from Performance | | Secondary |
| Tract | | Lease(s) | | Acres | | Acre-Feet | | STB | | Rem. STB | | Cum. STB | | EUR STB | | STB |
| |
| | 1 | | | Simmons | | | 160.0 | | | | 1,848.21 | | | | 382,609 | | | | 7,798 | | | | 38,093 | | | | 45,891 | | | | 55,069 | |
| | 2 | | | Coast | | | 40.0 | | | | 1,407.17 | | | | 291,307 | | | | 0 | | | | 4,867 | | | | 4,867 | | | | 5,840 | |
| | 3 | | | Metzger | | | 80.0 | | | | 2,826.18 | | | | 585,065 | | | | 14,037 | | | | 35,940 | | | | 49,977 | | | | 59,972 | |
| | 4 | | | PKC | | | 240.0 | | | | 11,594.92 | | | | 2,400,335 | | | | 196,467 | | | | 279,934 | | | | 476,401 | | | | 571,681 | |
| | 5 | | | Akers | | | 40.0 | | | | 2,874.73 | | | | 595,115 | | | | 18,716 | | | | 52,682 | | | | 71,398 | | | | 85,677 | |
| | 6 | | | Yeager | | | 40.0 | | | | 3,946.09 | | | | 816,904 | | | | 0 | | | | 45,512 | | | | 45,512 | | | | 54,614 | |
| | 7 | | | Mabee | | | 40.0 | | | | 1,038.18 | | | | 214,920 | | | | 0 | | | | 38,656 | | | | 38,656 | | | | 46,387 | |
| | 8 | | | McConal-Clark | | | 120.0 | | | | 12,143.66 | | | | 2,513,933 | | | | 22,878 | | | | 218,796 | | | | 241,674 | | | | 290,009 | |
| | 9 | | | Colgan State “A” | | | 53.0 | | | | 4,811.50 | | | | 996,058 | | | | 20,209 | | | | 169,062 | | | | 189,271 | | | | 227,125 | |
| | 10 | | | Lawrence “C” | | | 80.0 | | | | 6,454.11 | | | | 1,336,105 | | | | 37,368 | | | | 218,610 | | | | 255,978 | | | | 307,173 | |
| | 11 | | | Lawrence “D” | | | 80.0 | | | | 3,421.99 | | | | 708,407 | | | | 23,393 | | | | 92,741 | | | | 116,134 | | | | 139,361 | |
| | 12 | | | PKC “A” | | | 80.0 | | | | 11,579.82 | | | | 2,397,209 | | | | 18,074 | | | | 197,433 | | | | 215,507 | | | | 258,608 | |
| | 13 | | | Lawrence “B” | | | 80.0 | | | | 11,403.02 | | | | 2,360,609 | | | | 37,681 | | | | 155,240 | | | | 192,921 | | | | 231,506 | |
| | 14 | | | Lawrence “A” | | | 40.0 | | | | 4,118.23 | | | | 852,540 | | | | 20,973 | | | | 43,018 | | | | 63,991 | | | | 76,789 | |
| | 15 | | | Thompson “B” | | | 160.0 | | | | 12,594.17 | | | | 2,607,196 | | | | 49,410 | | | | 170,636 | | | | 220,046 | | | | 264,056 | |
| | 16 | | | Elizabeth Crews Mast | | | 320.0 | | | | 11,674.29 | | | | 2,416,766 | | | | 33,167 | | | | 114,704 | | | | 147,871 | | | | 177,445 | |
| | | | | | | |
| | | | | | | | 1,653.0 | | | | 103,736.27 | | | | 21,475,079 | | | | 500,171 | | | | 1,875,924 | | | | 2,376,095 | | | | 2,851,314 | |
| | | | | |
1parameters: porosity = | | | 0.0450 | |
Swc = | | | 0.3240 | |
Boi (RB/STB) = | | | 1.1400 | |
| | |
| | | |
| William M. Cobb & Associates, Inc. | | EXHIBIT 7 |
Carm-Ann San Andres
Single Pattern Model
| | | | |
| | | | | |
| | | William M. Cobb & Associates, Inc. | | APPENDIX A, Page 1 |
Model Description
| • | | Black oil simulation model (Merlin) |
| |
| • | | Single 40 acre pattern |
| |
| | | —Two total wells |
| |
| | | —20 acre spacing |
| |
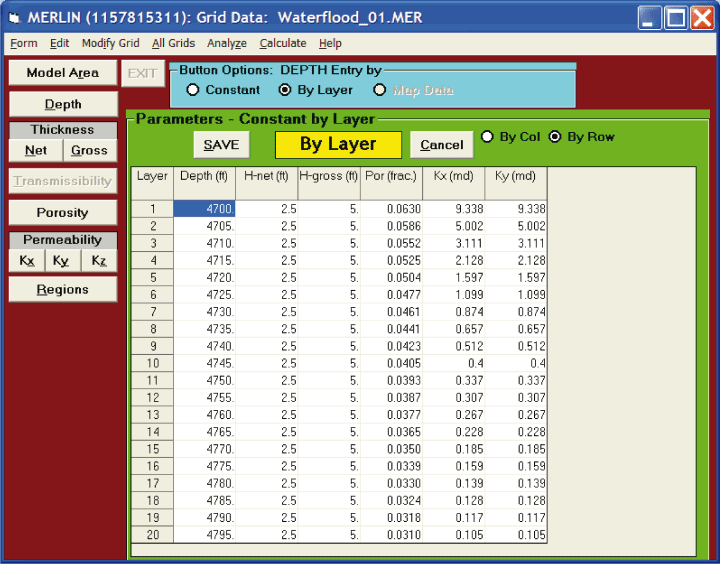
| • | | 20 vertical layers |
| |
| | | —Constant net pay of 2.5 feet per layer |
| |
| | | —Variable porosity and permeability |
| | | | |
| | | | | |
| | | William M. Cobb & Associates, Inc. | | APPENDIX A, Page 2 |
Summary of Results
| • | | Primary recovery = 50.2 MBO or 12.77% OOIP |
| |
| • | | Waterflood recovery = 112.5 MBO or 28.62% OOIP |
| |
| • | | Incremental secondary recovery: |
| |
| | | —62.3 MBO or 15.9% OOIP |
| |
| | | —S/P ratio = 1.24 |
| | | | |
| | | | | |
| | | William M. Cobb & Associates, Inc. | | APPENDIX A, Page 3 |
Carm-Ann Pattern Model
Input Data
| | | | |
| | | | | |
| | | William M. Cobb & Associates, Inc. | | APPENDIX A, Page 4 |
| | | | |
| | | | | |
| | | William M. Cobb & Associates, Inc. | | APPENDIX A, Page 5 |
| 1/4 well1/4 well full well Producer in primary run, injector in waterflood run.1/4 well1/4 well |
| | | | |
| | | | | |
| | | William M. Cobb & Associates, Inc. | | APPENDIX A, Page 6 |
Model Layer Properties
| • | | 20 model layers |
| |
| | | —50’ total net pay |
| |
| | | —2.5’ per layer |
| |
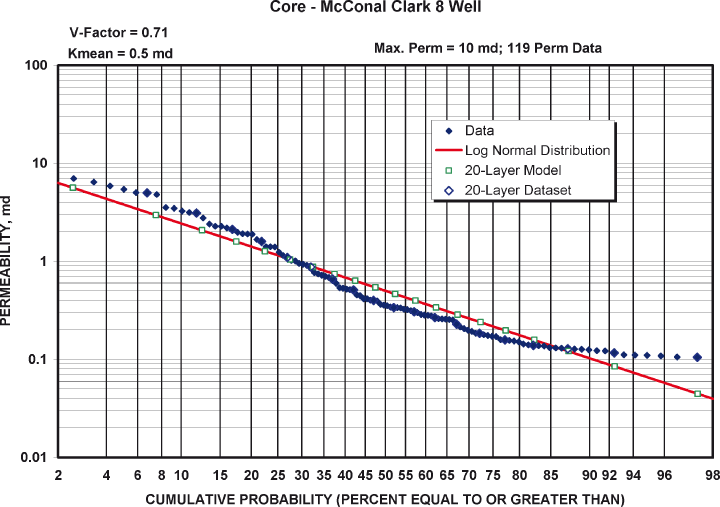
| • | | One core — McConal Clark 8 |
| |
| • | | Layer Perm’s from Dykstra-Parsons graph |
| |
| | | —Air perms |
| |
| | | —Ky = Kx |
| |
| | | —Kz = 0 |
| |
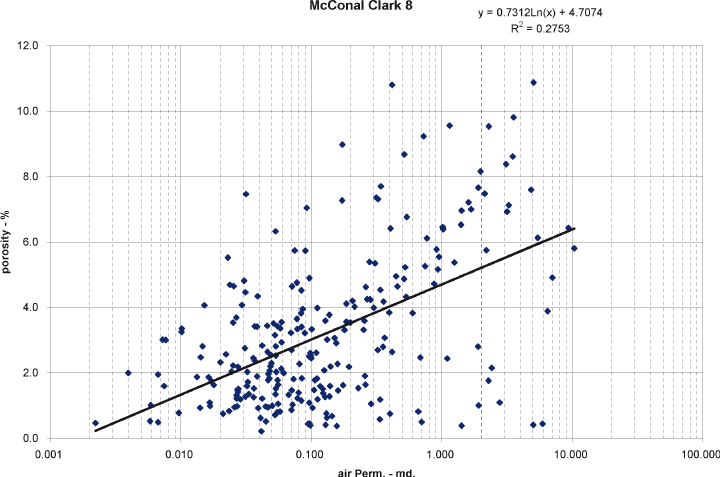
| • | | Layer porosity from Por vs Perm plot |
| | | | |
| | | | | |
| | | William M. Cobb & Associates, Inc. | | APPENDIX A, Page 7 |
| | | | |
| | | | | |
| | | William M. Cobb & Associates, Inc. | | APPENDIX A, Page 8 |
| Core — McConal Clark 8 Well V-Factor = 0.71 Max. Perm = 10 md; 119 Perm Data Kmean = 0.5 md 100 Data Log Normal Distribution 10 20-Layer Model 20-Layer Dataset md PERMEABILITY, 1 0.1 0.01 2 4 6 8 10 15 20 25 30 35 40 45 50 55 60 65 70 75 80 85 90 92 94 96 98 CUMULATIVE PROBABILITY (PERCENT EQUAL TO OR GREATER THAN) |
| | | | |
| | | | | |
| | | William M. Cobb & Associates, Inc. | | APPENDIX A, Page 9 |
| McConal Clark 8 y = 0.7312Ln(x) + 4.7074 R2 = 0.2753 12.0 |
| 0.001 0.010 0.100 1.000 10.000 100.000 |
| | | | |
| | | | | |
| | | William M. Cobb & Associates, Inc. | | APPENDIX A, Page 10 |
| | | | |
| | | | | |
| | | William M. Cobb & Associates, Inc. | | APPENDIX A, Page 11 |
Model PVT Properties
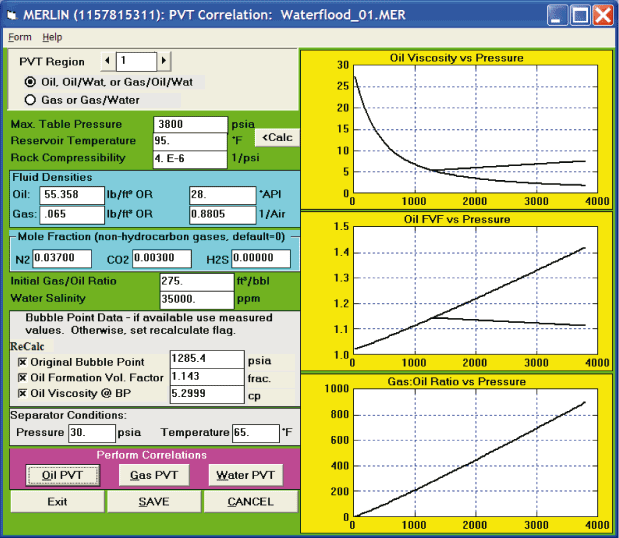
| • | | From industry correlations using |
| |
| | | —Oil gravity = 28oAPI |
| |
| | | —Gas gravity = 0.880 |
| |
| | | —Rsi = 275 scf/STB from early production |
| | | | |
| | | | | |
| | | William M. Cobb & Associates, Inc. | | APPENDIX A, Page 12 |
| | | | |
| | | | | |
| | | William M. Cobb & Associates, Inc. | | APPENDIX A, Page 13 |
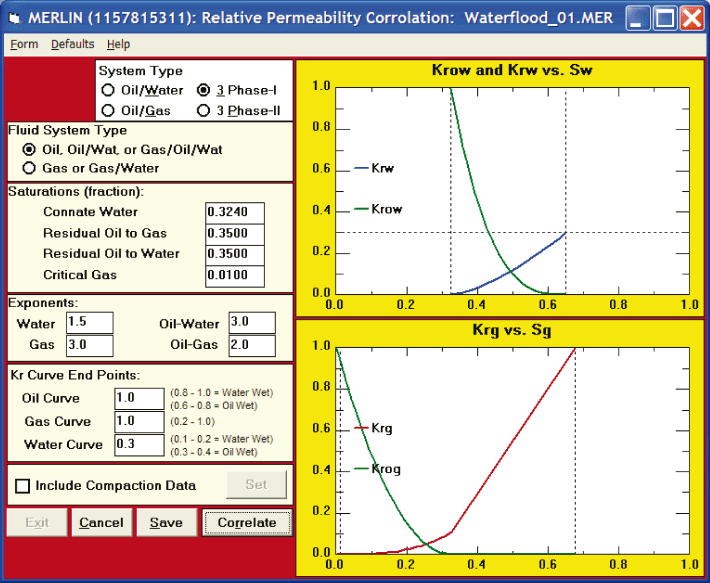
Model Relative Permeability
| • | | Swc = 0.324 from log analysis |
| |
| • | | Kr curves from correlations |
| |
| • | | Gas/Oil curves |
| |
| | | —Tweaked to match general primary oil recovery factor |
| |
| • | | Oil/Water curves |
| |
| | | –Sorw estimated to be 35% |
| | | | |
| | | | | |
| | | William M. Cobb & Associates, Inc. | | APPENDIX A, Page 14 |
| | | | |
| | | | | |
| | | William M. Cobb & Associates, Inc. | | APPENDIX A, Page 15 |
| | | | |
| | | | | |
| | | William M. Cobb & Associates, Inc. | | APPENDIX A, Page 16 |
Carm-Ann Model
Graphical Output
| | | | |
| | | | | |
| | | William M. Cobb & Associates, Inc. | | APPENDIX A, Page 17 |
| | | | |
| | | | | |
| | | William M. Cobb & Associates, Inc. | | APPENDIX A, Page 18 |
| | | | |
| | | | | |
| | | William M. Cobb & Associates, Inc. | | APPENDIX A, Page 19 |
| | | | |
| | | | | |
| | | William M. Cobb & Associates, Inc. | | APPENDIX A, Page 20 |
| | | | |
| | | | | |
| | | William M. Cobb & Associates, Inc. | | APPENDIX A, Page 21 |
| | | | |
| | | | | |
| | | William M. Cobb & Associates, Inc. | | APPENDIX A, Page 22 |
| | | | |
| | | | | |
| | | William M. Cobb & Associates, Inc. | | APPENDIX A, Page 23 |
| | | | |
| | | | | |
| | | William M. Cobb & Associates, Inc. | | APPENDIX A, Page 24 |
| | | | |
| | | | | |
| | | William M. Cobb & Associates, Inc. | | APPENDIX A, Page 25 |
