For Immediate Release
July 20, 2016
For More Information
Trisha Voltz Carlson
SVP, Investor Relations Manager
504.299.5208
trisha.carlson@hancockwhitney.com
Hancock reports second quarter 2016 E.P.S. of $.59
Results reflect continuing improvement in core pre-tax, pre-provision earnings
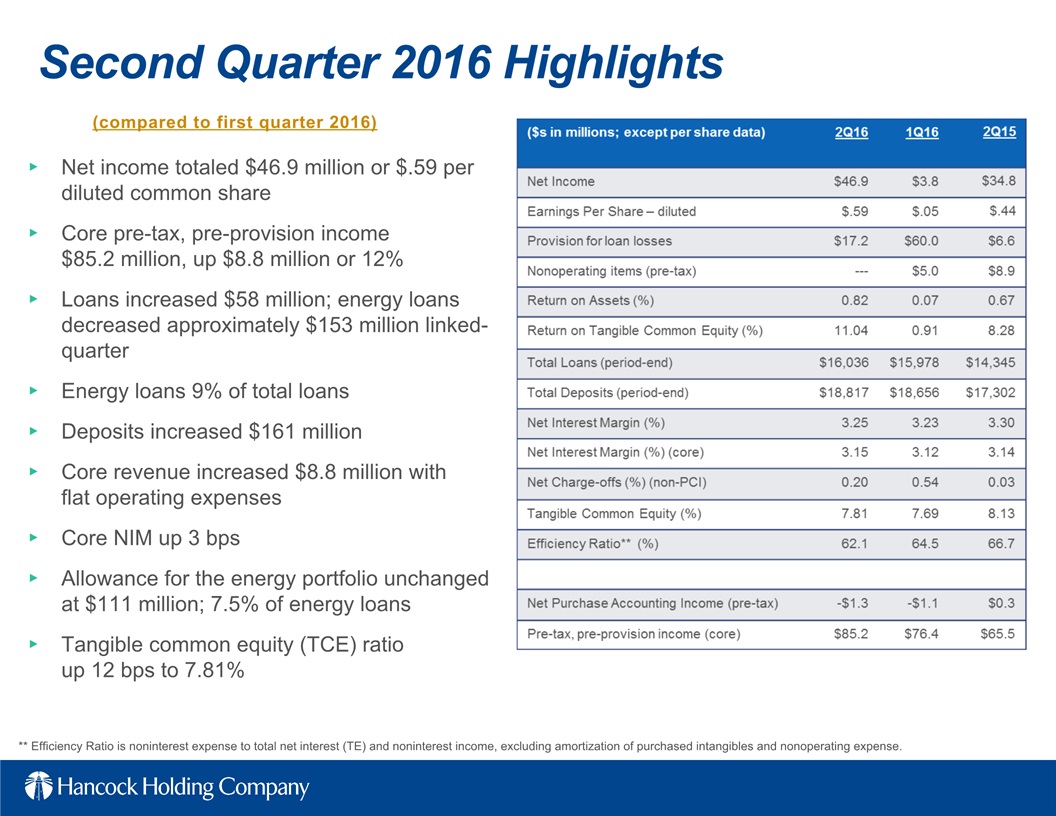
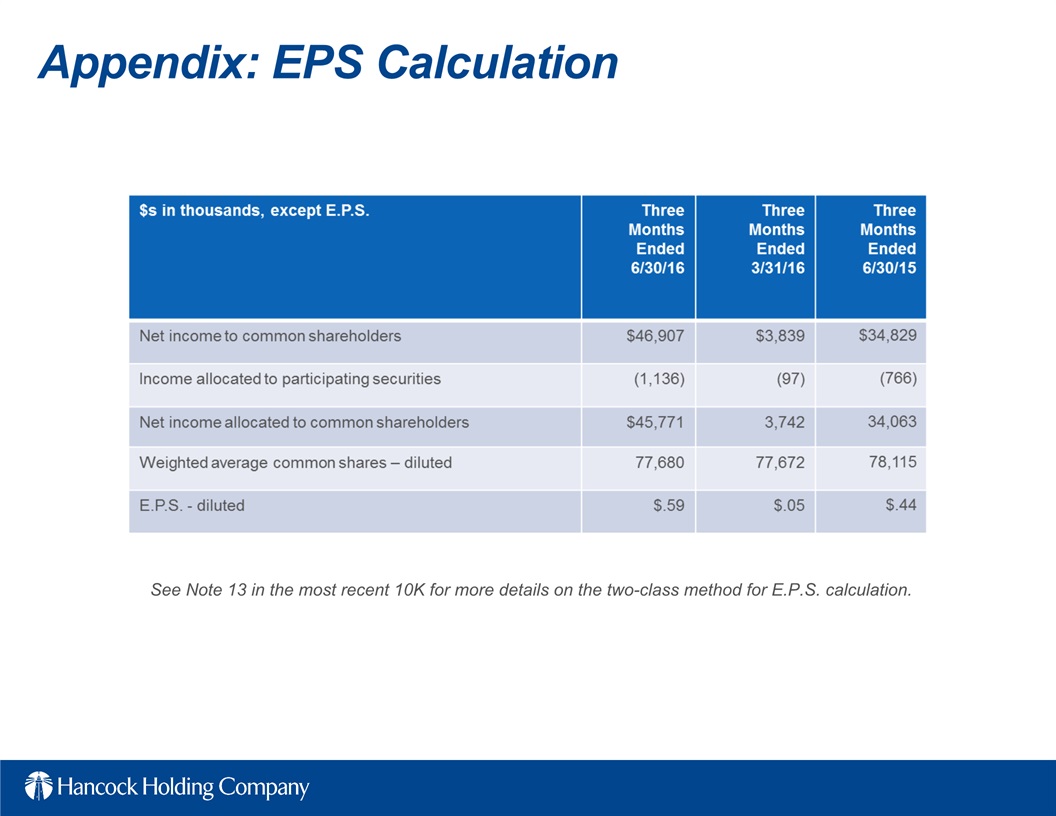
GULFPORT, Miss. (July 20, 2016) — Hancock Holding Company (Nasdaq: HBHC) today announced its financial results for the second quarter of 2016. Net income for the second quarter of 2016 was $46.9 million, or $.59 per diluted common share, compared to $3.8 million, or $.05 in the first quarter of 2016 and $34.8 million, or $.44, in the second quarter of 2015. The linked-quarter increase in earnings reflects improved revenue, a lower level of expenses and a sizeable decrease in the loan loss provision.
Highlights of the company's second quarter 2016 results (compared to first quarter 2016):
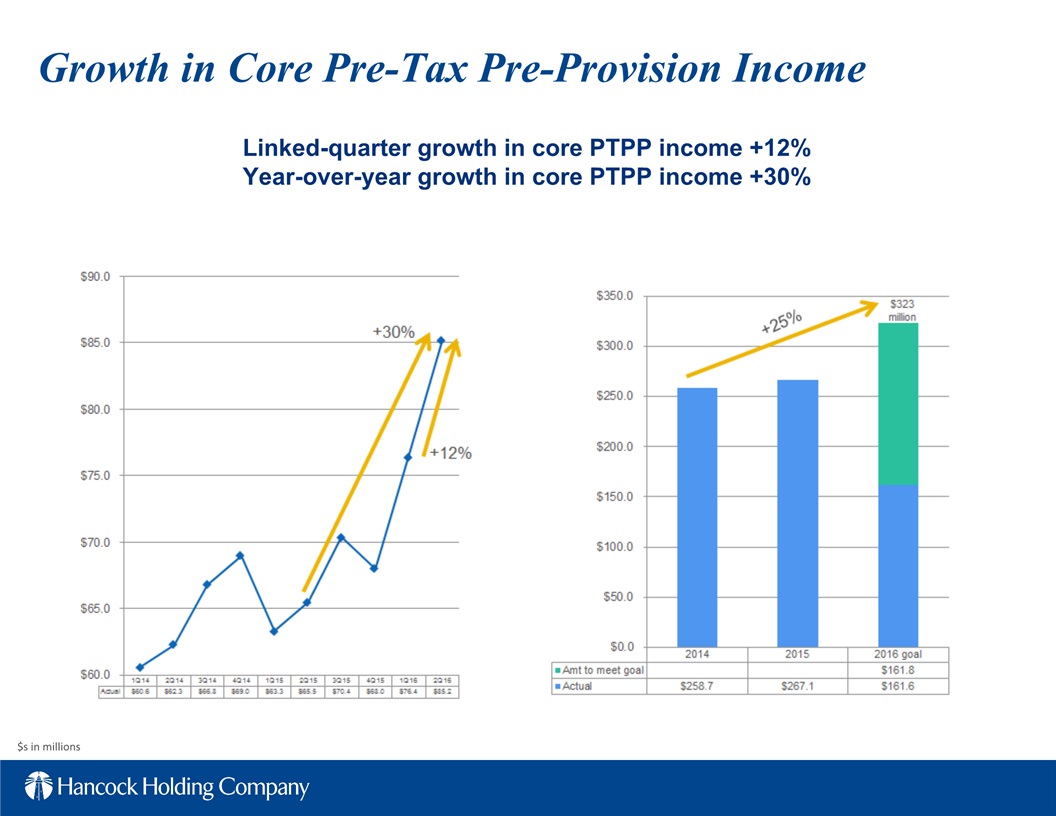
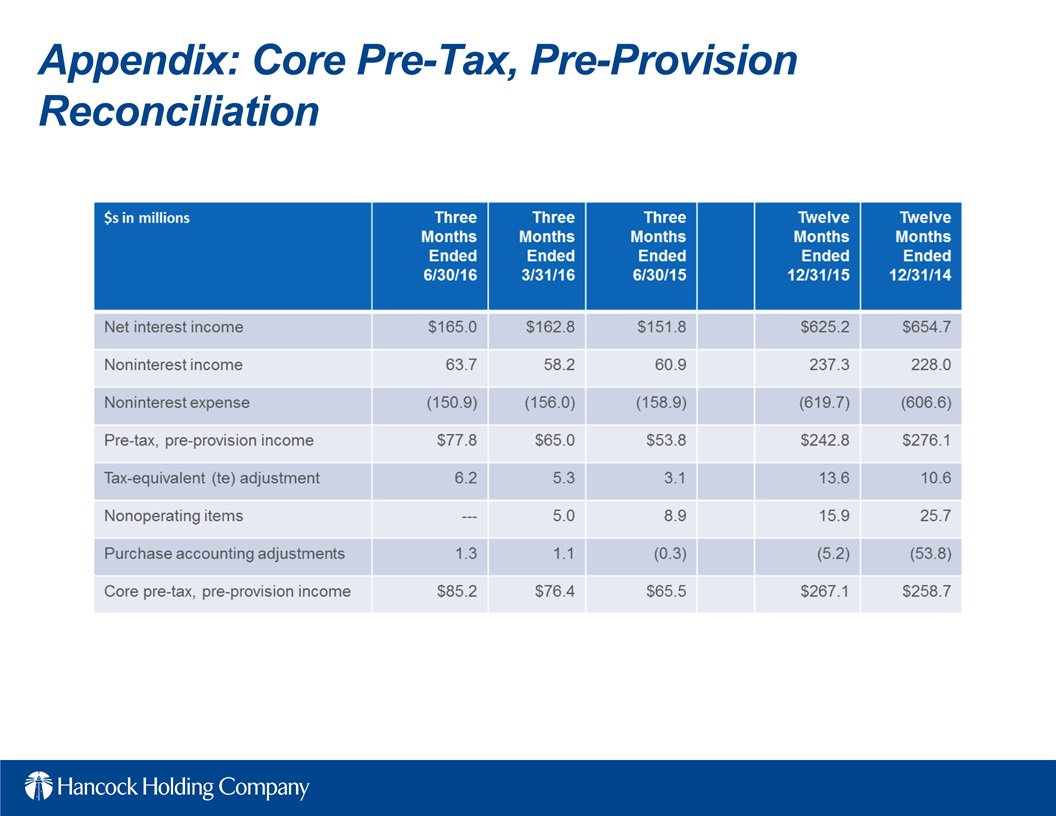
| · | Core pre-tax, pre-provision (core PTPP) income of $85.2 million, up $8.8 million or 12% (up 30% year-over-year) |
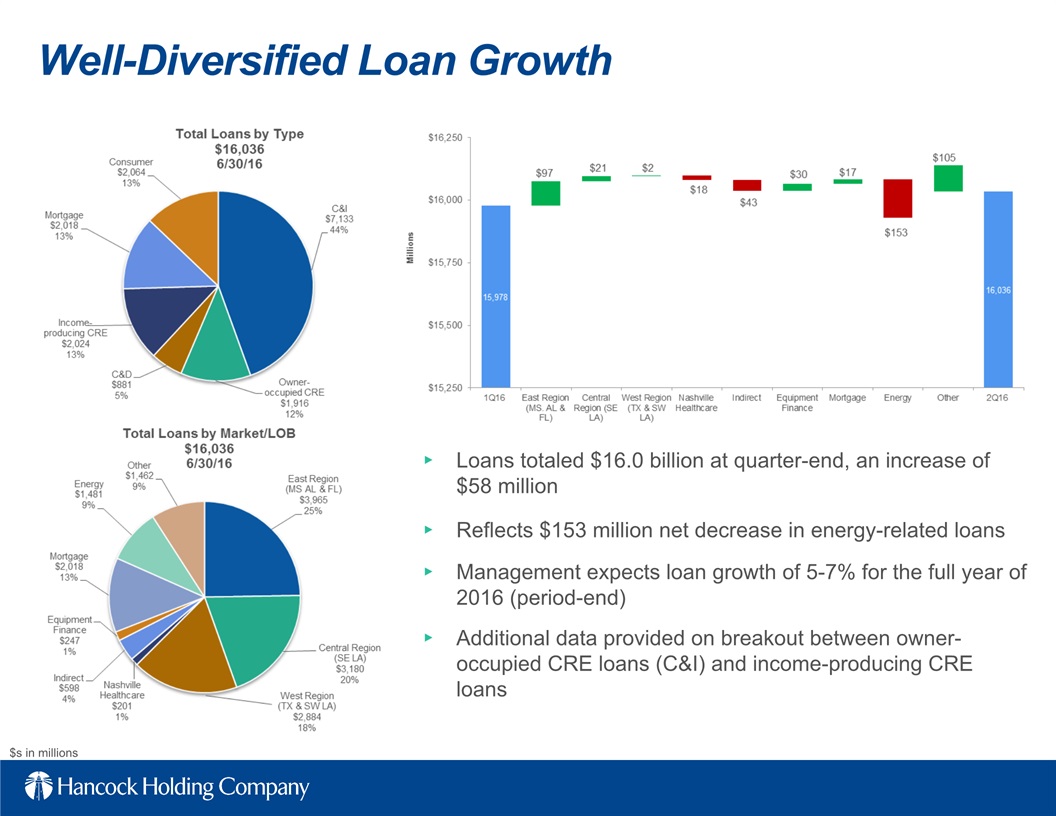
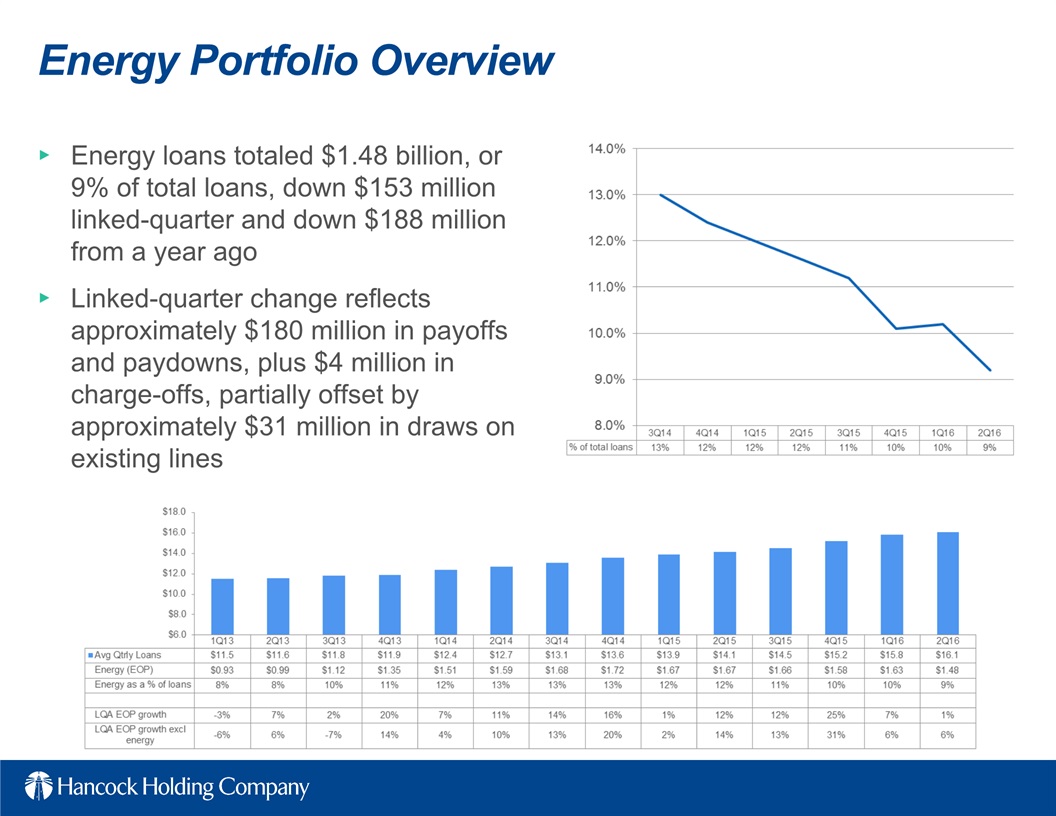
| · | Total loans up $58 million, or 1% linked-quarter annualized (LQA); includes a decrease of approximately $153 million in energy loan outstandings |
| · | Energy loans declined to 9% of total loans |
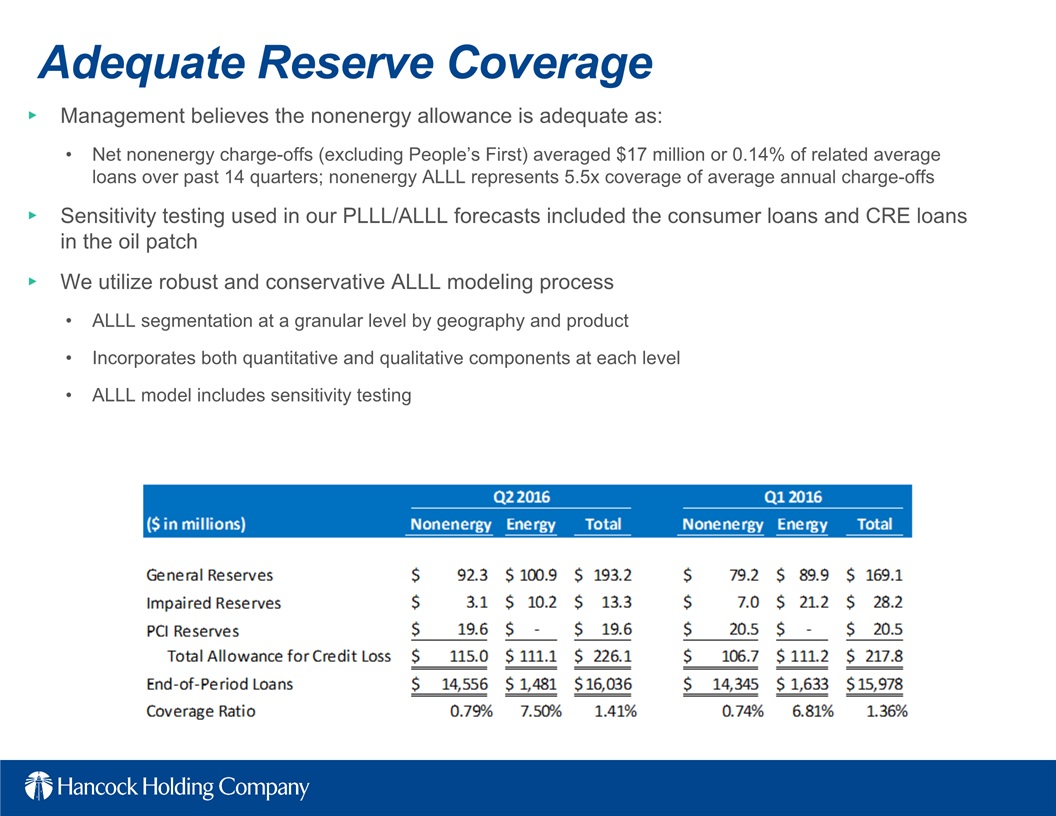
| · | Loan loss provision of $17.2 million, down from $60.0 million |
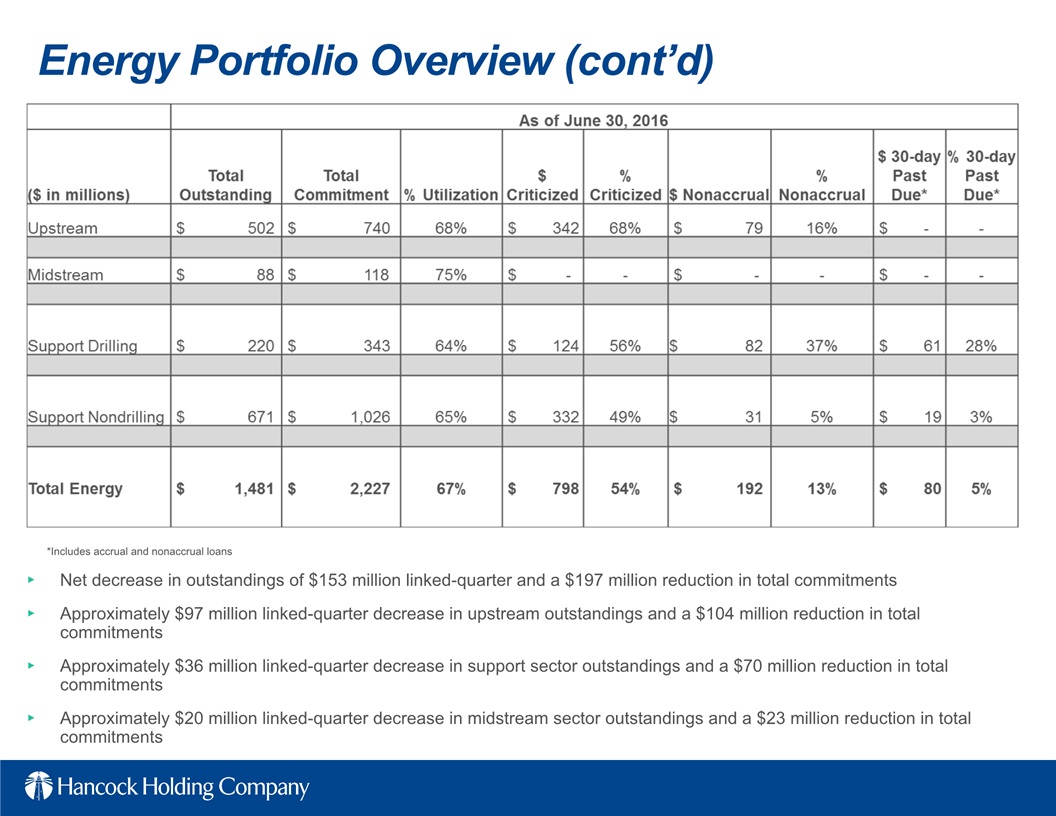
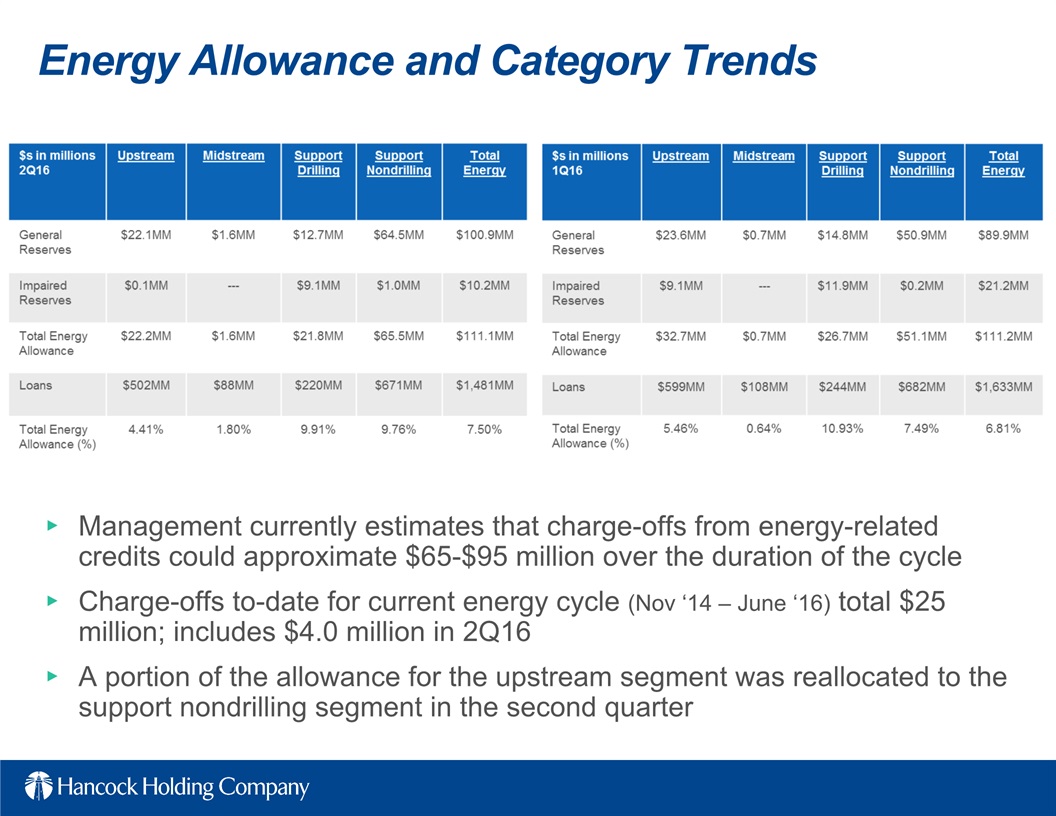
| · | Allowance for the energy portfolio totals $111 million, or 7.5% of energy loans |
| · | Core net interest margin up 3 basis points (bps) |
| · | Noninterest expense down $5.1 million (first quarter expenses included $5.0 million of nonoperating items) |
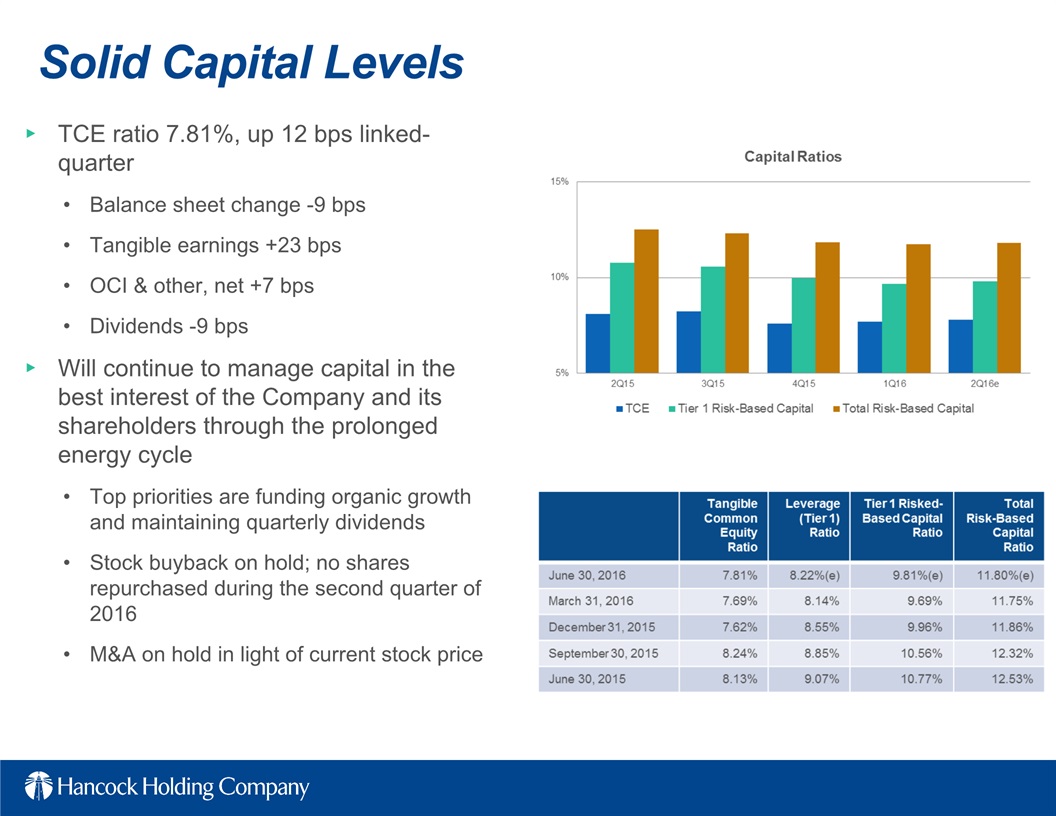
| · | Tangible common equity (TCE) ratio up 12 bps to 7.81% |
Pre-tax, pre-provision earnings (core) were $85.2 million for the second quarter of 2016, compared to $76.4 million in the first quarter of 2016 and $65.5 million in the second quarter of 2015.
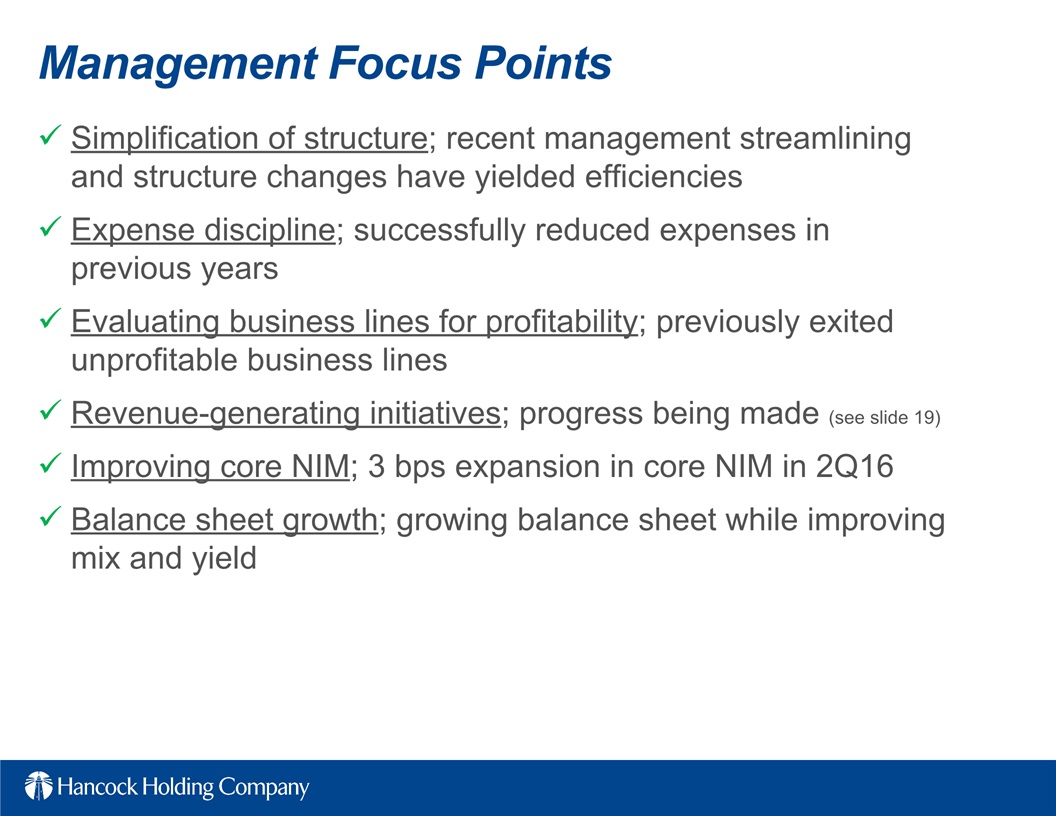
"We are halfway through the year and exactly halfway to meeting our stated goal for 2016's core pre-tax, pre-provision earnings," said President and CEO John M. Hairston. "We are doing so by following basic fundamentals of expense management coupled with revenue growth that includes both margin expansion and improvement in many fee categories. As a result of this progress, we continue to build a stronger, more diversified balance sheet and income statement. I am also pleased to report, that after two consecutive quarters of significant reserve build for our energy portfolio, our provision expense for the quarter decreased to an amount in line with the lower end of our guidance, our reserve coverage of the energy portfolio improved to 7.5% and our energy portfolio as a percent of total loans continued its decline to a single digit percentage. I am extremely proud of all 3,805 members of our team and what they have accomplished, yet we remain focused on improving upon our results for the future."
Loans
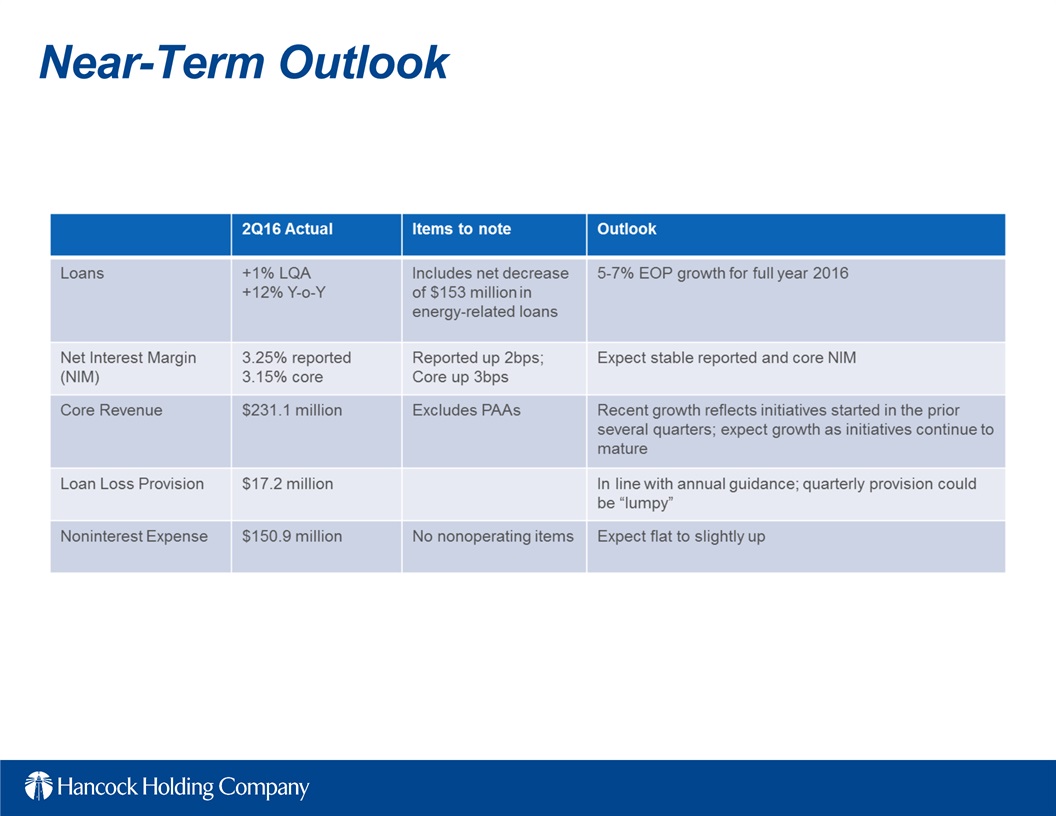
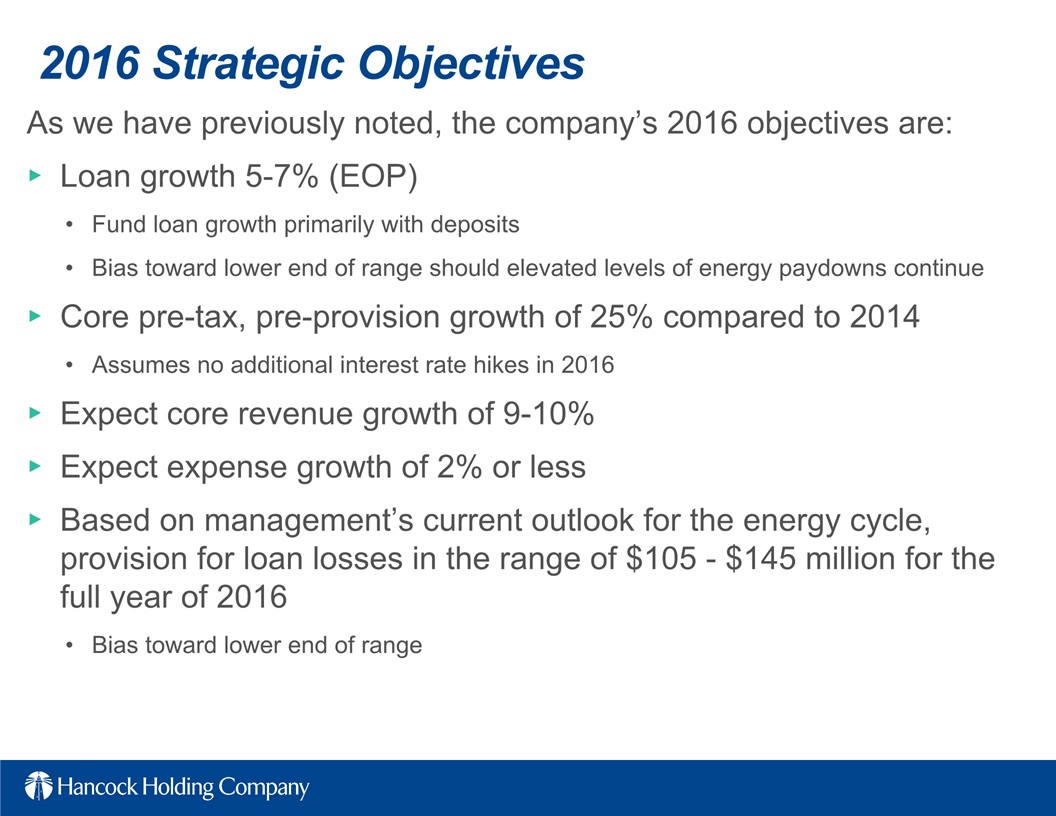
Total loans at June 30, 2016 were $16.0 billion, up approximately $58 million from March 31, 2016. Many regions across the footprint reported net loan growth during the quarter (excluding the impact of energy payoffs and paydowns). Loans to energy-related companies declined approximately $153 million linked-quarter. Excluding the energy portfolio, loans would have increased 6% linked-quarter annualized. Management expects continued growth across the footprint to be partially offset by ongoing payoffs and paydowns in the energy portfolio. This is expected to result in year over year period-end loan growth of 5-7% in 2016.
Average loans totaled $16.1 billion for the second quarter of 2016, up $211 million, or 1%, linked-quarter.
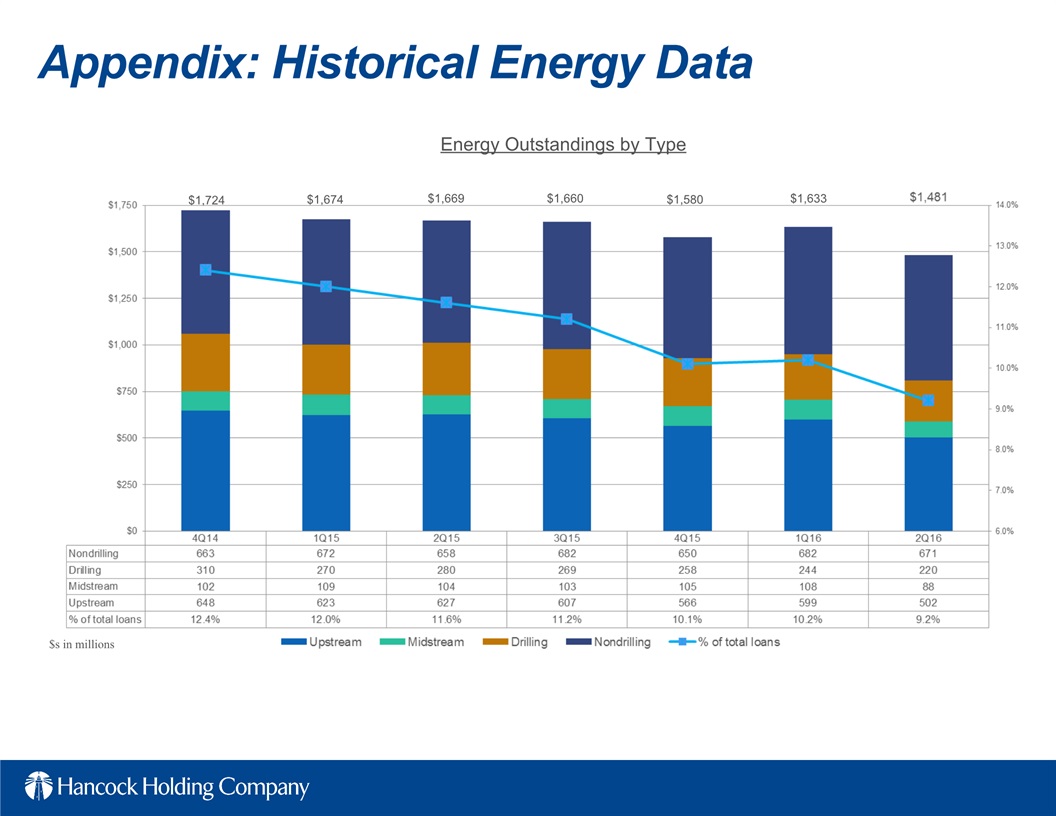
Energy
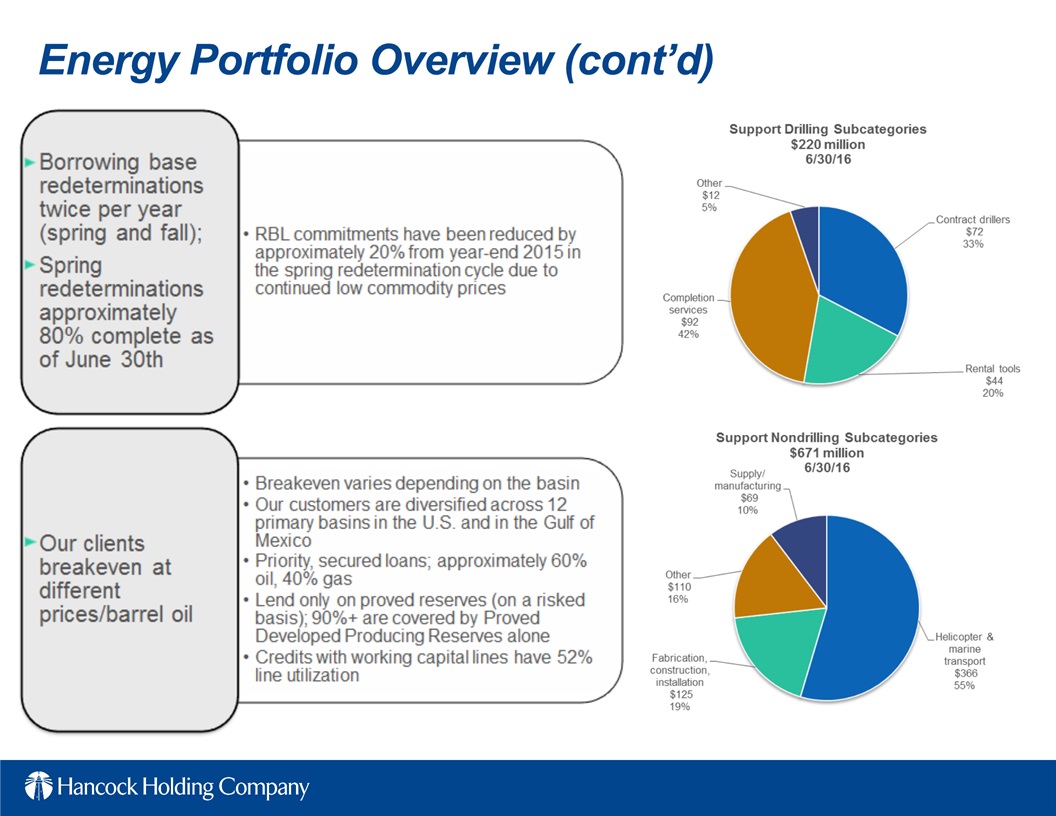
At June 30, 2016, loans to the energy industry totaled $1.48 billion, or 9% of total loans. The energy portfolio decreased approximately $153 million linked-quarter and is comprised of credits to both the E&P and support sectors. Payoffs and paydowns of approximately $180 million, plus charge-offs of $4 million, were partially offset by approximately $31 million of draws on existing lines.
The impact and severity of future risk rating migration, as well as any associated provisions or net charge-offs, will depend on overall oil prices and the duration of the cycle. While we expect additional charge-offs in the portfolio, we continue to believe the impact on the company of the energy cycle will be manageable and our capital will remain solid. Management currently estimates that charge-offs from energy-related credits could approximate $65-$95 million over the duration of the cycle, of which approximately $25 million has been taken to-date.
Additional details of the energy portfolio are included in the presentation slides posted on our Investor Relations website.
Deposits
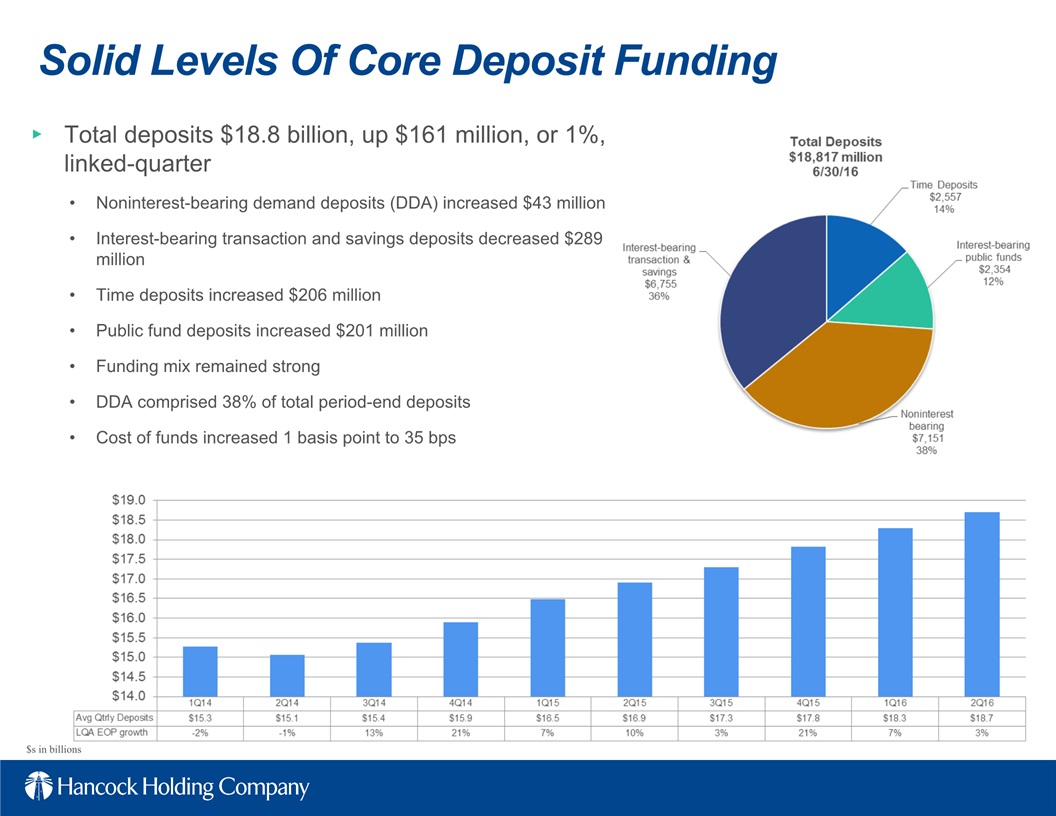
Total deposits at June 30, 2016 were $18.8 billion, up $161 million, or 1%, from March 31, 2016. Average deposits for the second quarter of 2016 were $18.7 billion, up $436 million, or 2%, linked-quarter.
Noninterest-bearing demand deposits (DDAs) totaled $7.2 billion at June 30, 2016, up $43 million from March 31, 2016. DDAs comprised 38% of total period-end deposits at June 30, 2016.
Interest-bearing transaction and savings deposits totaled $6.8 billion at the end of the second quarter of 2016, down $289 million, or 4%, from March 31, 2016. Time deposits of $2.6 billion increased $206 million, or 9%, while interest-bearing public fund deposits increased $201 million, or 9%, to $2.4 billion at June 30, 2016.
Asset Quality
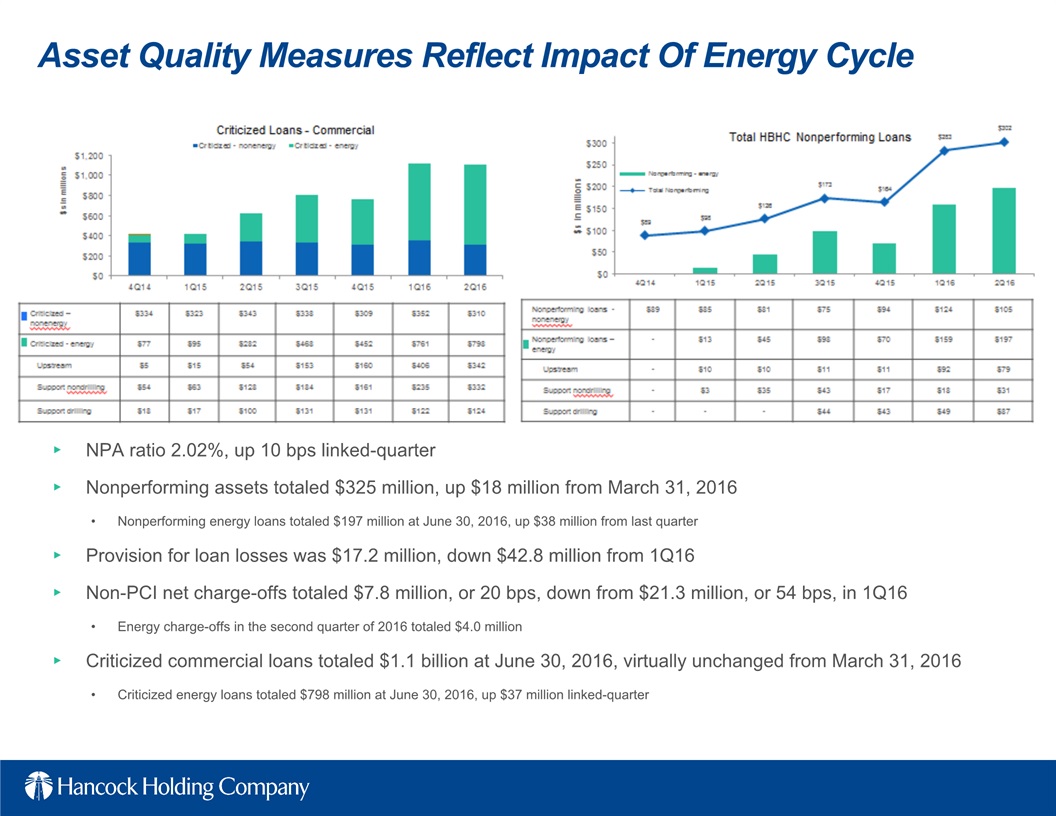
Nonperforming assets (NPAs) totaled $325 million at June 30, 2016, up $18 million from March 31, 2016. During the second quarter of 2016, total nonperforming loans increased approximately $19 million while foreclosed and surplus real estate (ORE) and other foreclosed assets decreased approximately $1 million. The net increase in nonperforming loans was mainly related to the movement of several energy credits, totaling approximately $38 million, during the quarter. Nonperforming assets as a percent of total loans, ORE and other foreclosed assets was 2.02% at June 30, 2016, up 10 bps from March 31, 2016.
The total allowance for loan losses was $226.1 million at June 30, 2016, up $8.3 million from March 31, 2016. The ratio of the allowance for loan losses to period-end loans was 1.41% at June 30, 2016, up from 1.36% at March 31, 2016. The allowance maintained on the non-PCI (purchased credit impaired) portion of the loan portfolio increased $9.2 million linked-quarter, totaling $206.5 million, while the allowance on the FDIC acquired loan portfolio decreased $0.9 million linked-quarter.
Net charge-offs from the non-PCI loan portfolio were $7.8 million, or 0.20% of average total loans on an annualized basis in the second quarter of 2016, down from $21.3 million, or 0.54% of average total loans in the first quarter of 2016. Included in the second quarter's total are $4.0 million in charge-offs related to energy credits.
During the second quarter of 2016, Hancock recorded a total provision for loan losses of $17.2 million, down from $60.0 million in the first quarter of 2016. Based on information currently available, management expects the provision for loan losses could approximate $105 - $145 million for the full year of 2016.
Net Interest Income and Net Interest Margin
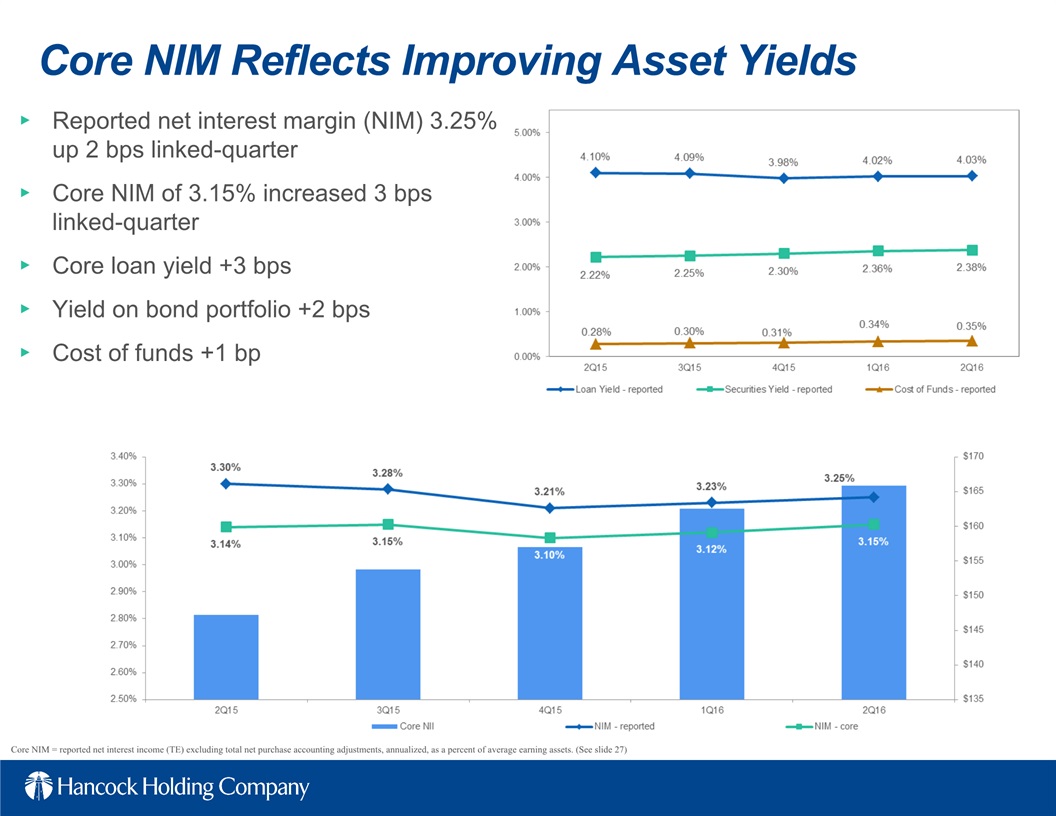
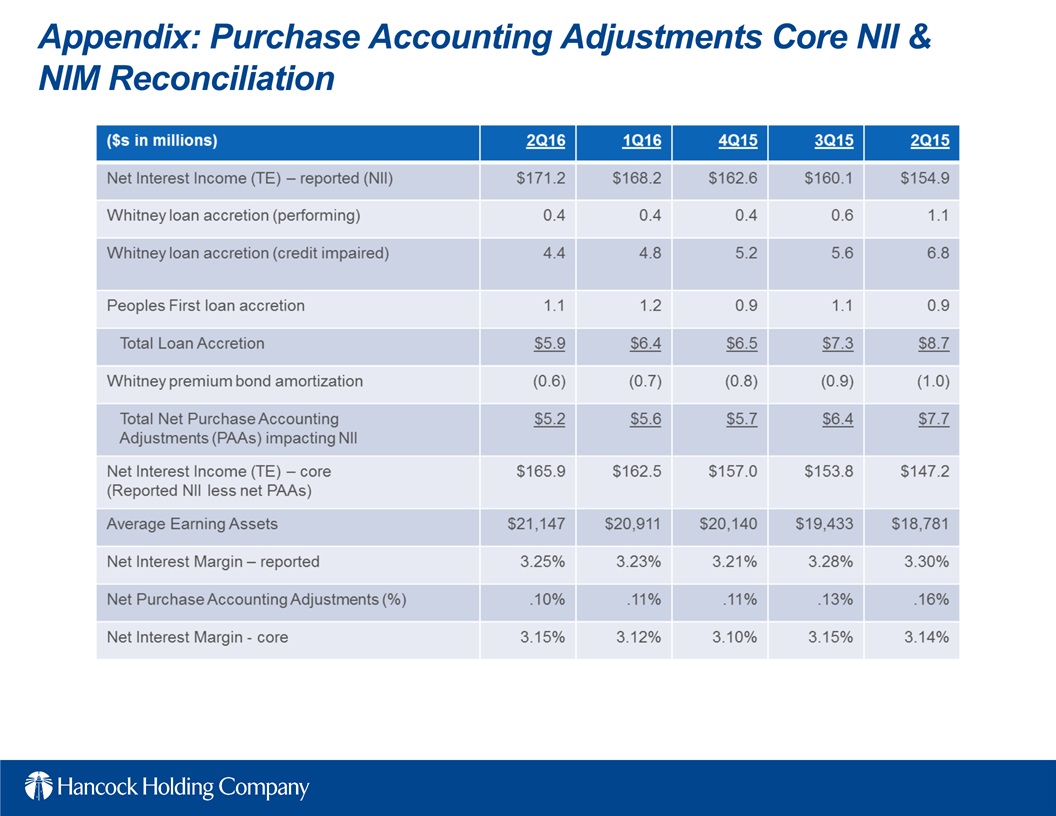
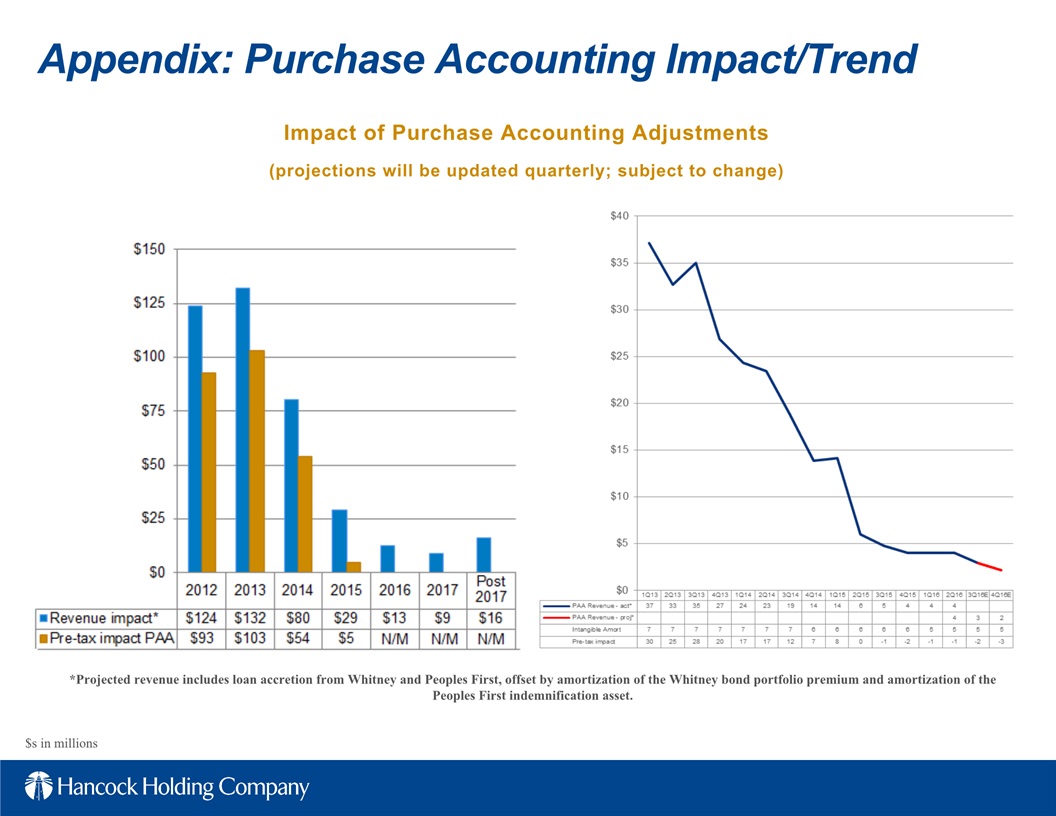
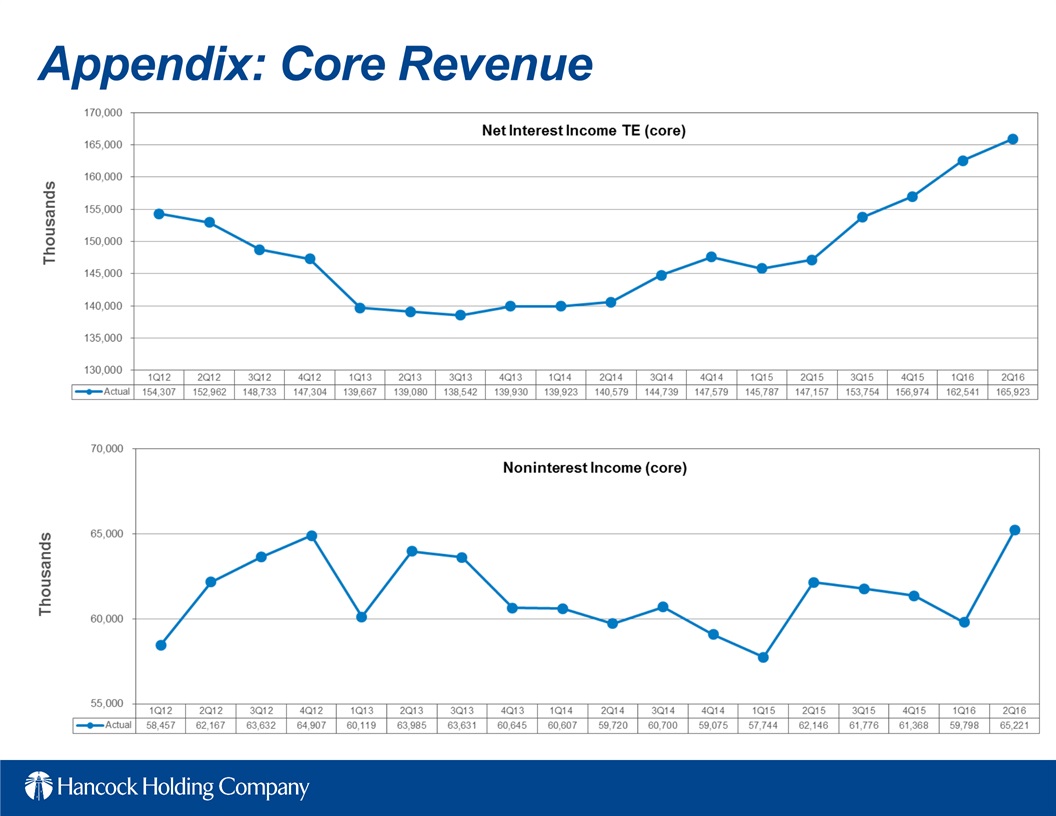
Net interest income (TE) for the second quarter of 2016 was $171.2 million, up $3.0 million from the first quarter of 2016. During the second quarter, the impact on net interest income from purchase accounting adjustments (PAAs) declined $0.4 million to $5.2 million. Excluding the impact from purchase accounting items, core net interest income increased $3.4 million linked-quarter. Average earning assets were $21.1 billion for the second quarter of 2016, up $236 million, or 1%, from the first quarter of 2016.
The reported net interest margin (TE) was 3.25% for the second quarter of 2016, up 2 bps from the first quarter of 2016. The core net interest margin (reported net interest income (TE) excluding total net purchase accounting adjustments, annualized, as a percent of average earning assets) increased 3 bps to 3.15% during the second quarter of 2016. The main drivers of the improvement were an increase in the core loan yield of 3 bps and an increase in the securities portfolio yield of 2 bps. This was slightly offset by an increase in the cost of funds of 1 basis point.
Noninterest Income
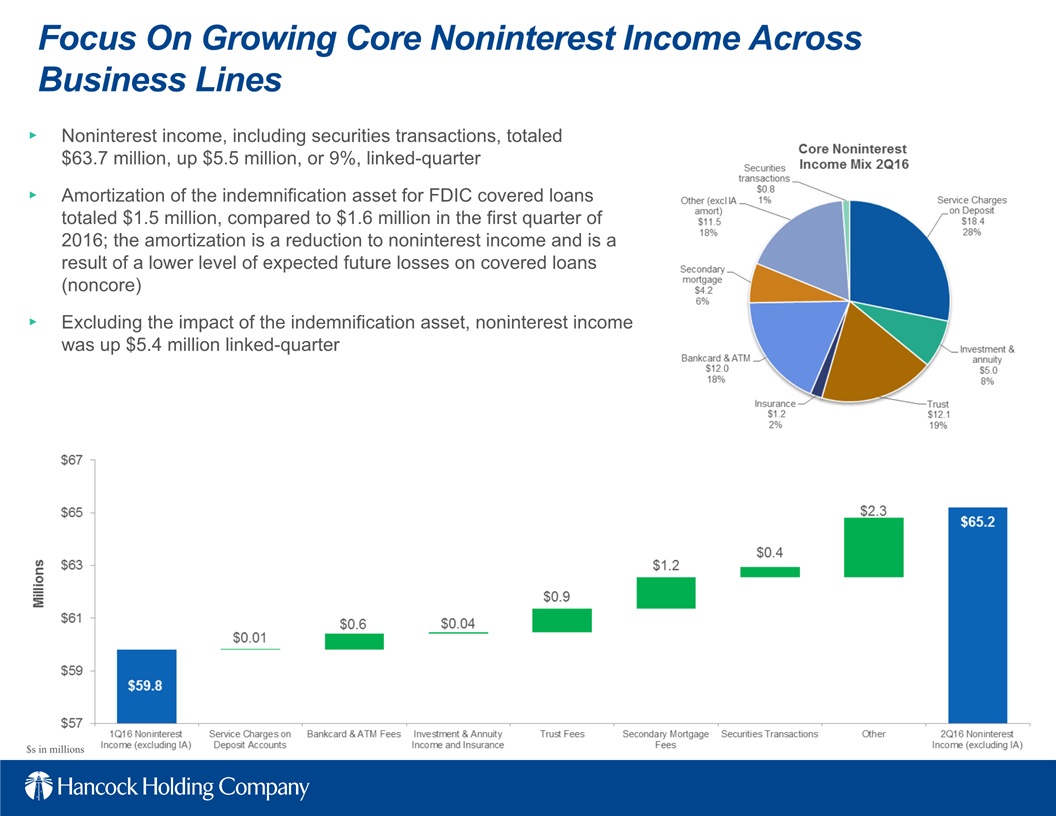
Noninterest income totaled $63.7 million for the second quarter of 2016, up $5.5 million, or 9%, from the first quarter of 2016. Included in the total is amortization of $1.5 million related to the FDIC indemnification asset, compared to amortization of $1.6 million in the first quarter of 2016. Excluding the impact of this item, core noninterest income totaled $65.2 million, up $5.4 million, or 9%, linked-quarter.
Service charges on deposits totaled $18.4 million for the second quarter of 2016, virtually unchanged from the first quarter of 2016. Bank card and ATM fees totaled $12.0 million, up $0.6 million, or 5%, from the first quarter of 2016.
Trust fees totaled $12.1 million, up $0.9 million, or 8% linked-quarter. Second quarter trends typically reflect seasonality related to annual tax season fee income. Investment and annuity income and insurance fees totaled $6.3 million, up slightly linked-quarter.
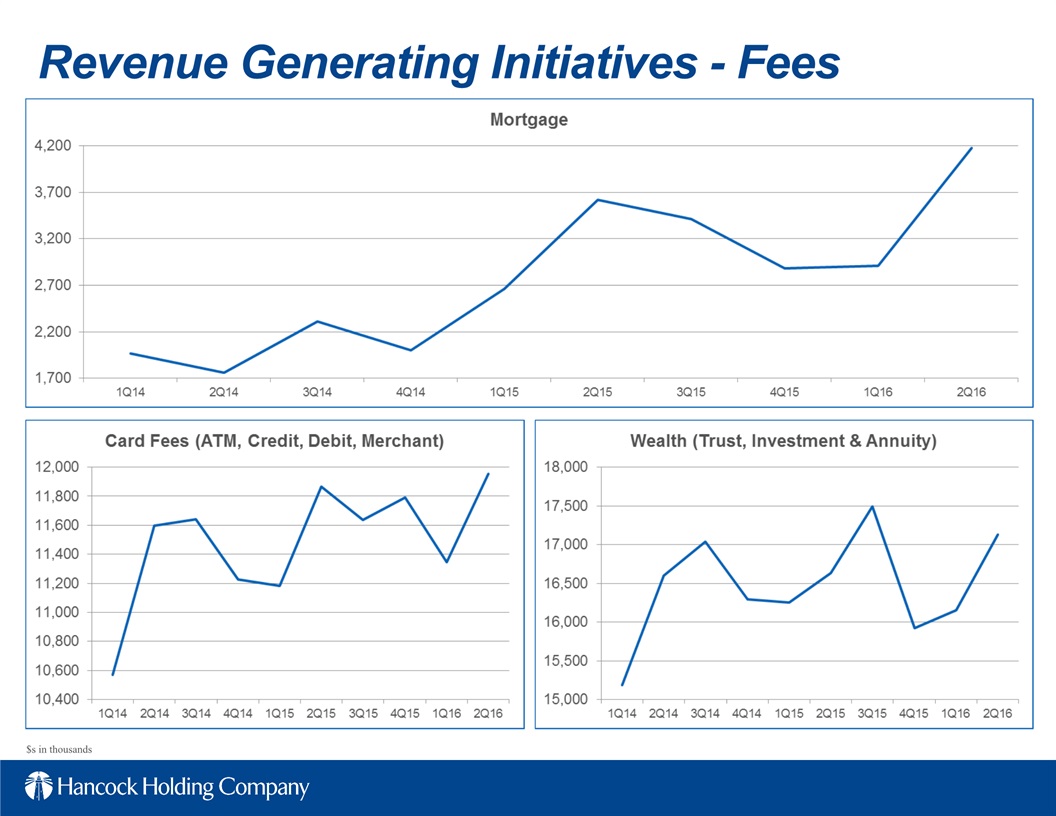
Fees from secondary mortgage operations totaled $4.2 million for the second quarter of 2016, up $1.3 million, or 43% linked quarter.
Other noninterest income (excluding the amortization of the FDIC indemnification asset noted above) totaled $12.3 million, up $2.6 million, or 27%, from the first quarter of 2016. The net increase during the quarter was related to other income sources which are unpredictable as to timing.
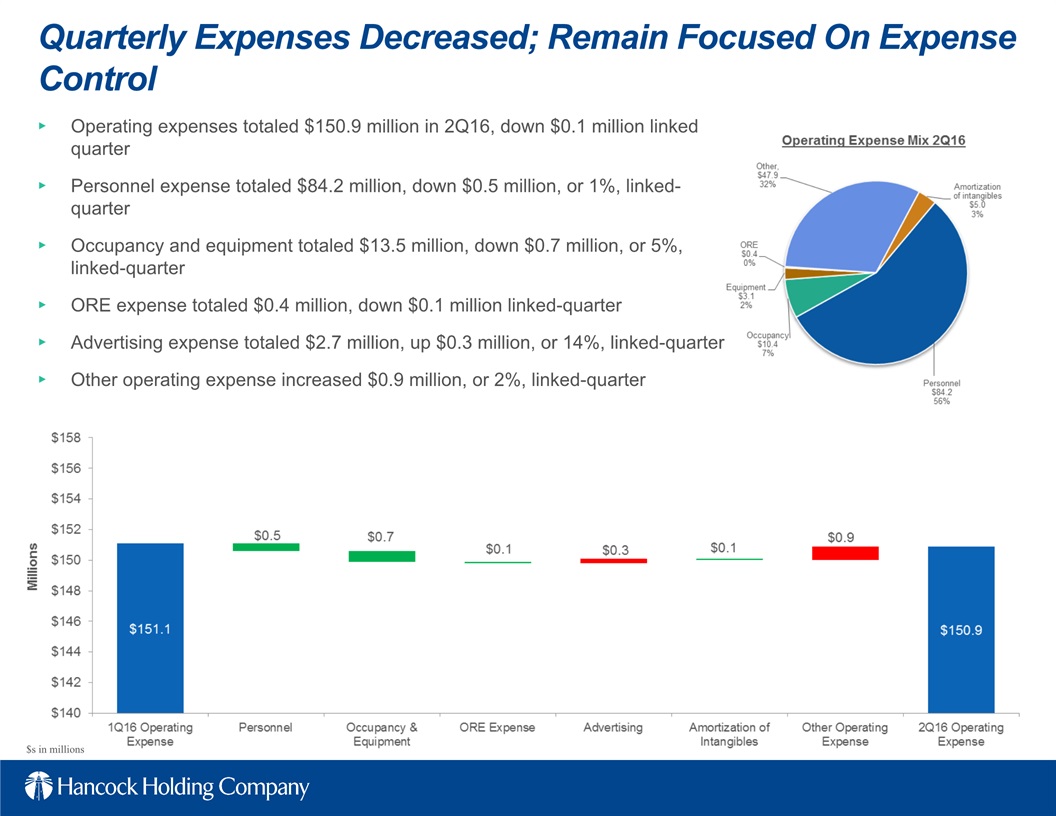
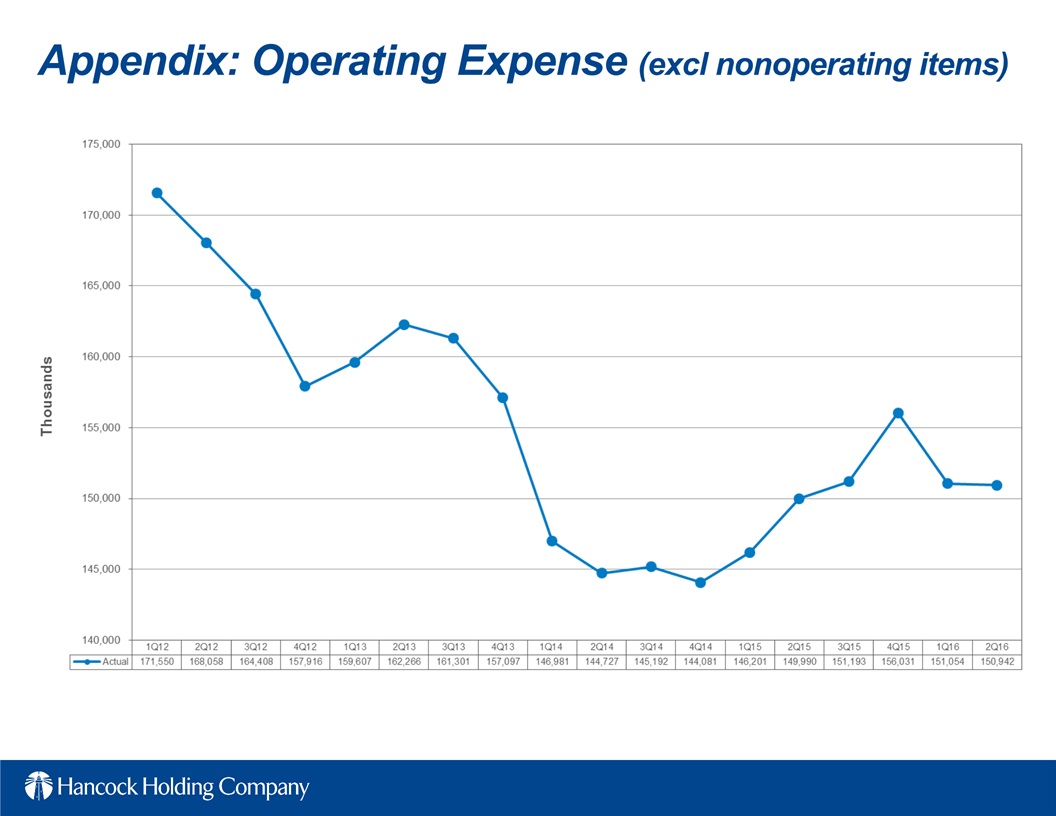
Noninterest Expense & Taxes
Noninterest expense for the second quarter of 2016 totaled $150.9 million, down $5.1 million, or 3%, from the first quarter of 2016. There were $5.0 million of nonoperating expenses in the first quarter of 2016. Excluding nonoperating items from the first quarter, operating expenses remained unchanged linked quarter.
Total personnel expense was $84.2 million in the second quarter of 2016, down $0.5 million, or 1%, from the first quarter of 2016.
Occupancy and equipment expense totaled $13.5 million in the second quarter of 2016, down $0.7 million, or 5%, from the first quarter of 2016.
ORE expense totaled $0.4 million for the second quarter of 2016, down slightly from the first quarter of 2016.
Amortization of intangibles totaled $5.0 million for the second quarter of 2016, down $0.1 million, or 2%, linked-quarter. Other operating expense totaled $47.9 million in the second quarter of 2016, up $1.3 million, or 3%, from the first quarter of 2016.
The effective income tax rate for the second quarter of 2016 was 22.5%. Management expects the effective income tax rate to approximate 22-24% for the remainder of 2016.
The effective
income tax rate continues to be less than the statutory rate of 35% due primarily to tax-exempt income and tax credits.
Capital
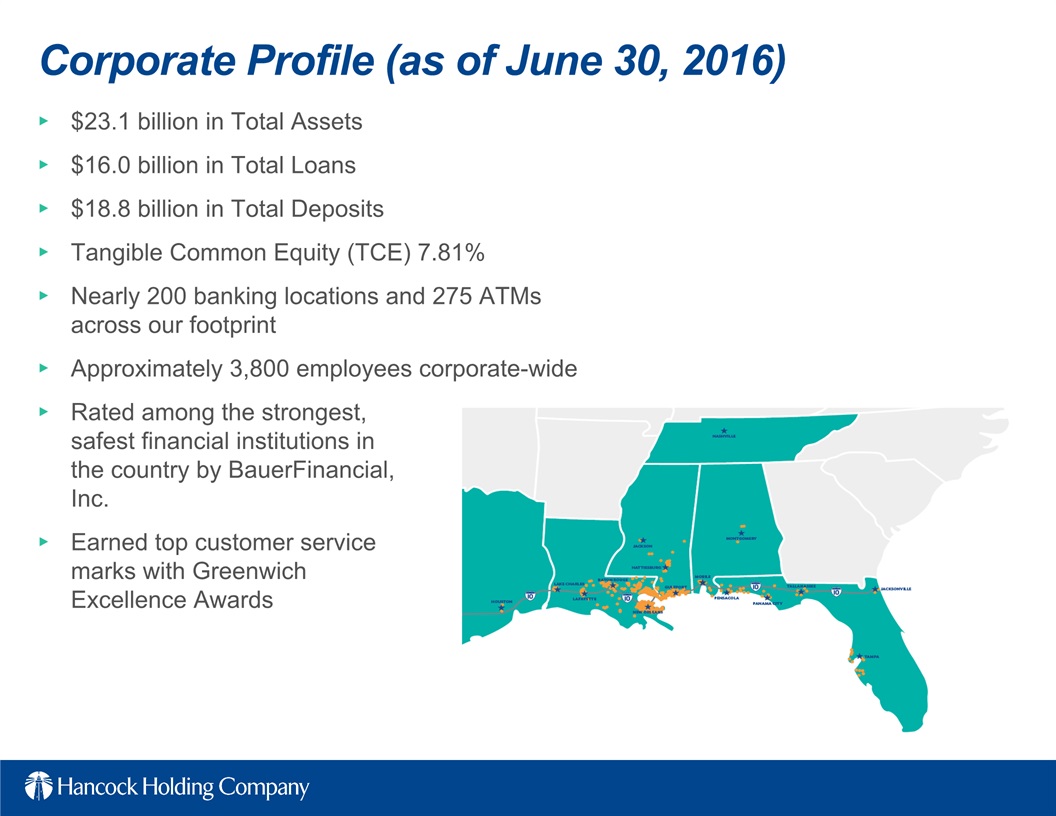
Common shareholders' equity at June 30, 2016 totaled $2.5 billion. The tangible common equity (TCE) ratio was 7.81%, up 12 bps from March 31, 2016. During the fourth quarter of 2015 the company placed its common stock buyback on hold in light of the current energy cycle. No shares were repurchased in the second quarter of 2016. Additional capital ratios are included in the financial tables.
Conference Call and Slide Presentation
Management will host a conference call for analysts and investors at 9:00 a.m. Central Time on Thursday, July 21, 2016 to review the results. A live listen-only webcast of the call will be available under the Investor Relations section of Hancock's website at www.hancockwhitney.com/investors. Additional financial tables and a slide presentation related to second quarter results are also posted as part of the webcast link. To participate in the Q&A portion of the call, dial (877) 564-1219 or (973) 638-3429. An audio archive of the conference call will be available under the Investor Relations section of our website. A replay of the call will also be available through July 28, 2016 by dialing (855) 859-2056 or (404) 537-3406, passcode 38311783.
About Hancock Holding Company
Hancock Holding Company is a financial services company with regional business headquarters and locations across the Gulf South. The company's banking subsidiary provides comprehensive financial products and services through Hancock Bank locations in Mississippi, Alabama, and Florida and Whitney Bank locations in Louisiana and Texas, including traditional, online, and mobile banking; commercial and
small business banking; private banking; trust and investment services; certain insurance services; and mortgage services. More information is available at www.hancockwhitney.com.
Forward-Looking Statements
This news release contains "forward-looking statements" within the meaning of section 27A of the Securities Act of 1933, as amended, and section 21E of the Securities Exchange Act of 1934, as amended, and we intend such forward-looking statements to be covered by the safe harbor provisions therein and are including this statement for purposes of invoking these safe-harbor provisions. Forward-looking statements provide projections of results of operations or of financial condition or state other forward-looking information, such as expectations about future conditions and descriptions of plans and strategies for the future. Forward-looking statements that we may make include, but may not be limited to, comments with respect to future levels of economic activity in our markets, including the impact of volatility of oil and gas prices on our energy portfolio and associated loan loss reserves and possible charge-offs, and the downstream impact on businesses that support the energy sector, especially in the Gulf Coast region, loan growth expectations, deposit trends, credit quality trends, net interest margin trends, future expense levels, success of revenue-generating initiatives, projected tax rates, future profitability, improvements in expense to revenue (efficiency) ratio, purchase accounting impacts such as accretion levels, possible repurchases of shares under stock buyback programs, and the financial impact of regulatory requirements. Hancock's ability to accurately project results, predict the effects of future plans or strategies, or predict market or economic developments is inherently limited. Although Hancock believes that the expectations reflected in its forward-looking statements are based on reasonable assumptions, actual results and performance could differ materially from those set forth in the forward-looking statements. Factors that could cause actual results to differ from those expressed in Hancock's forward-looking statements include, but are not limited to, those risk factors included in Hancock's public filings with the Securities and Exchange Commission, which are available at the SEC's internet site (http://www.sec.gov). You are cautioned not to place undue reliance on these forward-looking statements. Hancock does not intend, and undertakes no obligation, to update or revise any forward-looking statements, whether as a result of differences in actual results, changes in assumptions or changes in other factors affecting such statements, except as required by law.