Exhibit 99.1

For Immediate Release
October 25, 2012
For More Information
Trisha Voltz Carlson
SVP, Investor Relations Manager
504.299.5208
trisha.carlson@hancockbank.com
Hancock reports third quarter 2012 financial results
GULFPORT, Miss. (October 25, 2012) — Hancock Holding Company (Nasdaq: HBHC) today announced financial results for the third quarter of 2012. Operating income for the third quarter of 2012 was $49.8 million or $.58 per diluted common share, compared to $47.0 million, or $.55 in the second quarter of 2012. Operating income was $45.2 million, or $.53, in the third quarter of 2011. Operating income is defined as net income excluding tax-effected merger-related costs and securities transactions gains or losses. In addition, for the third quarter of 2012, operating income excludes the tax-effected expenses associated with the repurchase of a portion of Whitney Bank’s subordinated debt (sub debt). Included in the financial tables is a reconciliation of net income to operating income.
During the second quarter of 2012 the Company initiated a tender offer for up to $75 million of Whitney Bank’s sub debt. A total of $150 million of sub debt was issued by Whitney National Bank in March 2007 at a rate of 5.875%. In July 2012, the tender was consummated, and approximately $52 million of the Whitney sub debt was repurchased. In addition to paying the indebtedness represented by the notes and accrued interest, the Company incurred approximately $5.3 million in costs, including a premium of $5.1 million.
Hancock’s return on average assets, on an operating basis, was 1.07% for the third quarter of 2012, compared to 1.00% in the second quarter of 2012, and 0.92% in the third quarter a year ago.
Net income for the third quarter of 2012 was $47.0 million, or $.55 per diluted common share, compared to $39.3 million, or $.46 in the second quarter of 2012. Net income was $30.4 million, or $.36, in the third quarter of 2011. Pre-tax earnings for the third quarter of 2012 included no merger-related costs. The second quarter of 2012 and third quarter of 2011 included pre-tax merger-related costs of $11.9 million and $22.8 million, respectively.
The Company’s pre-tax, pre-provision profit for the third quarter of 2012 was $78.5 million compared to $75.8 million in the second quarter of 2012 and $73.9 million in the third quarter of 2011. Pre-tax pre-provision profit is total revenue (TE) less non-interest expense and excludes merger-related costs, securities transactions gains or losses and the sub debt redemption expenses. Included in the financial tables is a reconciliation of net income to pre-tax, pre-provision profit.
- 1 -
Hancock reports third quarter 2012 financial results
October 25, 2012
“During the third quarter we continued to make progress on several fronts and generated solid quarterly results,” said Hancock’s President and Chief Executive Officer Carl J. Chaney. “We produced net loan growth of over $350 million, realized additional quarterly cost savings, expanded the net interest margin and improved our operating ROA this quarter, and remain committed to improving upon these overall results and growing our company.”
Highlights & Key Operating Items from Hancock’s Third Quarter Results
Total assets at September 30, 2012, were $18.5 billion, compared to $18.8 billion at June 30, 2012.
Loans
Total loans at September 30, 2012 were $11.4 billion, up $356 million, or 3%, from June 30, 2012. Excluding the FDIC-covered portfolio acquired with People’s First, which declined $32 million during the third quarter, total loans were up $388 million, or approximately 4%, linked-quarter.
The net growth noted above represents a slowdown in the pace of loan payoffs, and more significantly, the impact of both strategic new hires and the completion of the Company’s systems integration process. New loans and refinancings of over $700 million were funded in markets throughout the company’s footprint from both existing and new customers, exceeding regularly scheduled payoffs and paydowns.
The net loan growth was mainly generated in the commercial and industrial (C&I) portfolio, up 9% linked-quarter. The growth reflected activity in Houston, Greater New Orleans, western Louisiana and several Florida markets, with a sizeable portion of the new business generated from customers in the energy sector. As of September 30, 2012 the Company’s energy portfolio totaled $758 million, up $125 million from June 30, 2012.
Hancock’s loan pipeline remains strong, but the market for new loans remains highly competitive. Although management expects continued net loan growth in future quarters, the rate of growth may be below the pace in the current quarter.
For the third quarter of 2012, average total loans were $11.3 billion, an increase of $119 million, compared to the second quarter of 2012.
Deposits
Total deposits at September 30, 2012 were $14.8 billion, down $158 million, or 1%, from June 30, 2012. Average deposits for the third quarter of 2012 were $14.8 billion, down $308 million, or 2%, from the second quarter of 2012.
- 2 -
Hancock reports third quarter 2012 financial results
October 25, 2012
Noninterest-bearing demand deposits (DDAs) totaled $5.2 billion at September 30, 2012, up $111 million, or 2%, compared to June 30, 2012. DDAs comprised 35% of total period-end deposits at September 30, 2012, up slightly from June 30, 2012.
Time deposits (CDs) totaled $2.4 billion at September 30, 2012, down $110 million from June 30, 2012. During the third quarter, approximately $600 million of time deposits matured at an average rate of .54%, of which approximately two-thirds renewed at an average cost of 0.21%.
Interest-bearing public fund deposits were down $158 million linked-quarter reflecting the seasonal nature of these types of deposits. Typically these deposits reflect higher balances around the beginning of the year with subsequent reductions beginning in the summer months.
Asset Quality
The Company’s total allowance for loan losses was $135.6 million at September 30, 2012, compared to $140.8 million at June 30, 2012. The ratio of the allowance for loan losses to period-end loans was 1.19% at September 30, 2012, down from 1.27% at June 30, 2012. Charge-offs against the portion of allowance established for previously-identified impairment of certain pools of FDIC-covered loans reduced the total allowance by $3.5 million. The Company identified no additional impairment on these covered loan pools in the quarterly review as of September 30, 2012 and, as a result, recorded no provision for loan losses on the covered portfolio for the third quarter of 2012.
Hancock recorded a total provision for loan losses for the third quarter of 2012 of $8.1 million, virtually unchanged from $8.0 million in the second quarter of 2012. The provision for non-covered loans increased to $8.1 million in the third quarter of 2012 from $7.0 million in the second quarter of 2012. As noted above, no provision was recorded in the third quarter of 2012 for the FDIC-covered portfolio. The net impact on provision expense from the covered portfolio in the second quarter of 2012 was $1.0 million.
Net charge-offs from the non-covered loan portfolio in the third quarter of 2012 were $9.7 million, or .34% of average total loans on an annualized basis. This compares to net non-covered loan charge-offs of $10.2 million, or .37% of average total loans, for the second quarter of 2012.
The allowance calculated on the portion of the loan portfolio that excludes covered loans and loans acquired at fair value in the Whitney merger totaled $79.7 million, or 1.21% of this portfolio at September 30, 2012 and $81.4 million, or 1.40% at June 30, 2012. This ratio is expected to decline as the proportion of this portfolio representing new business from Whitney’s operations grows, other factors held constant.
- 3 -
Hancock reports third quarter 2012 financial results
October 25, 2012
Non-performing assets (NPAs), which exclude acquired credit-impaired loans from Whitney and People’s First, totaled $298 million at September 30, 2012, up $27 million from $271 million at June 30, 2012. Non-performing assets as a percent of total loans, ORE and foreclosed assets was 2.58% at September 30, 2012, compared to 2.42% at June 30, 2012. The increase in overall NPAs reflects an increase in nonaccrual loans of $22 million, an increase of $13 million in restructured loans, and a decline of $8 million in ORE and foreclosed assets. The increase in nonaccrual loans is mainly related to a small portion of Whitney’s acquired portfolio that was performing at acquisition date and has subsequently moved to nonaccrual. The loans are comprised of smaller dollar residential mortgage and commercial credits, mainly located in Louisiana.
Management continues to work towards reducing the overall level of nonperforming assets and currently has approximately $60 million of its total ORE portfolio under sales contracts that are scheduled to close in the fourth quarter of 2012.
Additional asset quality metrics for the acquired (Whitney), covered (Peoples First) and originated (Hancock legacy plus Whitney non-acquired loans) portfolios are included in the financial tables.
Net Interest Income
Net interest income (TE) for the third quarter of 2012 was $180.1 million, virtually unchanged from the second quarter of 2012. Average earning assets were $15.8 billion in the third quarter of 2012, down $336 million from the second quarter of 2012.
The net interest margin (TE) was 4.54% for the third quarter of 2012, up 6 basis points (bps) from 4.48% in the second quarter of 2012. The core margin (net interest margin excluding total net purchase accounting adjustments) compressed approximately 5bps during the third quarter from a decline in both the yield on the loan and the securities portfolios. The core margin was favorably impacted by a change in the mix of earning assets, a shift in funding sources and a slight decline in funding costs. The decline in funding costs is mainly related to the redemption of the Whitney Bank sub debt.
Whitney’s acquired loan portfolio continued to perform better than expected during the third quarter. As a result, re-projections of expected cash flows from the acquired portfolio led to higher yields realized on this portfolio that favorably impacted both net interest income and the net interest margin and offset the core margin compression.
As earning assets continue to reprice, and with a diminished opportunity to significantly lower funding costs, management expects continued compression on the core margin in the near term. All else equal, compression in the reported margin in the near term is also anticipated.
Non-interest Income
Non-interest income totaled $63.8 million for the third quarter of 2012, up slightly from $63.6 million in the second quarter of 2012. Included in the third quarter was $.9 million from gains on securities transactions. Excluding securities transactions, non-interest income declined slightly from second quarter of 2012.
- 4 -
Hancock reports third quarter 2012 financial results
October 25, 2012
Service charges on deposits totaled $20.8 million for the third quarter of 2012, virtually unchanged from the second quarter of 2012.
Bankcard fees totaled $7.6 million in the third quarter of 2012, down $.5 million from the second quarter. As noted previously, the Durbin interchange restrictions began impacting Hancock Bank on July 1, 2012 and resulted in a loss of bankcard fees of approximately $2.0 million during the third quarter of 2012. This loss of income was partly offset by a $1.4 million increase in merchant fees during the third quarter. The increase in merchant fees is related to the reacquisition of the Company’s merchant business and change in the terms of the servicing agreement. The reacquisition also added approximately $.5 million to amortization of intangibles in the third quarter. The Durbin interchange restrictions negatively impacted the third quarter’s ATMs fees by approximately $.5 million.
Fees from secondary mortgage operations totaled $4.3 million for the third quarter of 2012, up $1.3 million linked-quarter. The increase reflects a higher volume of mortgage production during the third quarter mainly related to refinancing activity.
Fees related to trust, insurance, and investment and annuity lines of business were all down linked-quarter, mainly reflecting the volatility and seasonality of those businesses.
Non-interest Expense & Taxes
Operating expense for the third quarter of 2012 totaled $164.4 million, down $3.6 million from the second quarter of 2012. Operating expense excludes merger-related costs and for the third quarter of 2012, $5.3 million of sub debt repurchase expenses. There were essentially no merger-related costs in the third quarter of 2012, compared to $11.9 million of pre-tax merger costs in the second quarter of 2012.
Total personnel expense was $88.2 million in the third quarter of 2012, a decrease of $1.2 million from the second quarter of 2012. The linked-quarter decrease mainly reflects the staff reductions associated with the core systems conversion and branch consolidations. Linked-quarter declines related to the systems conversion and branch consolidations are also reflected in occupancy, equipment and various categories included in other noninterest expense.
Amortization of intangibles totaled $8.1 million during the third quarter, up from $7.9 million in the second quarter of 2012. The increase is related to the reacquisition of the merchant services business noted above. Amortization of intangibles should approximate $7.8 million in the fourth quarter of 2012.
Operating expense, excluding amortization of intangibles, was $156.3 million for the third quarter of 2012. Management expects additional cost savings will continue to be generated in the fourth quarter of 2012, and is reiterating its operating expense guidance for the fourth quarter of 2012 of $149 million to $153 million, excluding amortization of intangibles.
- 5 -
Hancock reports third quarter 2012 financial results
October 25, 2012
During the third quarter of 2012, the Company announced the closing of several branches as part of its ongoing branch rationalization process. The Company is continuing its review of its current branch network and will announce additional closures, relocations or new branch openings as decisions are approved.
The effective income tax rate for the third quarter of 2012 was 26%, essentially unchanged from the second quarter of 2012. The effective income tax rate continues to be less than the statutory rate of 35%, due primarily to tax-exempt income and tax credits.
Capital
Common shareholders’ equity totaled $2.4 billion at September 30, 2012. The Company remained well-capitalized and improved its tangible common equity ratio to 9.09% at September 30, 2012, up from 8.72% at June 30, 2012. Additional capital ratios are included in the financial tables.
Conference Call and Slide Presentation
Management will host a conference call for analysts and investors at 9:00 a.m. Central Time Friday, October 26, 2012 to review the results. A live listen-only webcast of the call will be available under the Investor Relations section of Hancock’s website atwww.hancockbank.com. A slide presentation related to third quarter results is also posted as part of the webcast link. To participate in the Q&A portion of the call, dial (877) 564-1219 or (973) 638-3429. An audio archive of the conference call will be available under the Investor Relations section of our website. A replay of the call will also be available through November 2, 2012 by dialing (855) 859-2056 or (404) 537-3406, passcode 37314225.
About Hancock Holding Company
Hancock Holding Company, the parent company of Hancock Bank and Whitney Bank, operates a combined total of more than 250 full-service bank branches and over 350 ATMs across a Gulf south corridor comprising South Mississippi; southern and central Alabama; southern Louisiana; the northern, central, and Panhandle regions of Florida; and Houston, Texas. The Hancock Holding Company family of financial services companies also includes Hancock Investment Services, Inc.; Hancock Insurance Agency and Whitney Insurance Agency, Inc.; and corporate trust offices in Gulfport and Jackson, Miss., New Orleans and Baton Rouge, La., and Orlando, Fla.; and Harrison Finance Company. Additional information is available atwww.hancockbank.com andwww.whitneybank.com.
Forward-Looking Statements
This news release contains “forward-looking statements” within the meaning of section 27A of the Securities Act of 1933, as amended, and section 21E of the Securities Exchange Act of 1934, as amended, and we intend such forward-looking statements to be covered by the safe harbor provisions therein and are including this statement for purposes of invoking these safe-harbor provisions. Forward-looking statements provide projections of results of operations or of financial condition or state other forward-looking information, such as expectations about future conditions and descriptions of plans and strategies for the future.
- 6 -
Hancock reports third quarter 2012 financial results
October 25, 2012
Forward-looking statements that we may make include, but may not be limited to, comments with respect to loan growth, deposit trends, credit quality trends, future sales of ORE properties, net interest margin trends, future expense levels and the ability to achieve additional cost savings, projected tax rates, economic conditions in our markets, future profitability, purchase accounting impacts such as accretion levels, the impact of the branch rationalization process, and the financial impact of regulatory requirements.
Hancock’s ability to accurately project results or predict the effects of future plans or strategies is inherently limited. Although Hancock believes that the expectations reflected in its forward-looking statements are based on reasonable assumptions, actual results and performance could differ materially from those set forth in the forward-looking statements. Factors that could cause actual results to differ from those expressed in Hancock’s forward-looking statements include, but are not limited to, those risk factors outlined in Hancock’s public filings with the Securities and Exchange Commission, which are available at the SEC’s internet site (http://www.sec.gov).
You are cautioned not to place undue reliance on these forward-looking statements. Hancock does not intend, and undertakes no obligation, to update or revise any forward-looking statements, whether as a result of differences in actual results, changes in assumptions or changes in other factors affecting such statements, except as required by law.
- 7 -
Hancock Holding Company
Financial Highlights
(amounts in thousands, except per share data and FTE headcount)
(unaudited)
| | | | | | | | | | | | | | | | | | | | |
| | | Three Months Ended | | | Nine Months Ended | |
| | | 9/30/2012 | | | 6/30/2012 | | | 9/30/2011 | | | 9/30/2012 | | | 9/30/2011 | |
Per Common Share Data | | | | | | | | | | | | | | | | | | | | |
| | | | | |
Earnings per share: | | | | | | | | | | | | | | | | | | | | |
Basic | | $ | 0.55 | | | $ | 0.46 | | | $ | 0.36 | | | $ | 1.23 | | | $ | 0.97 | |
Diluted | | $ | 0.55 | | | $ | 0.46 | | | $ | 0.36 | | | $ | 1.22 | | | $ | 0.97 | |
Operating earnings per share: (a) | | | | | | | | | | | | | | | | | | | | |
Basic | | $ | 0.58 | | | $ | 0.55 | | | $ | 0.53 | | | $ | 1.61 | | | $ | 1.48 | |
Diluted | | $ | 0.58 | | | $ | 0.55 | | | $ | 0.53 | | | $ | 1.60 | | | $ | 1.48 | |
Cash dividends per share | | $ | 0.24 | | | $ | 0.24 | | | $ | 0.24 | | | $ | 0.72 | | | $ | 0.72 | |
Book value per share (period-end) | | $ | 28.71 | | | $ | 28.30 | | | $ | 28.65 | | | $ | 28.71 | | | $ | 28.65 | |
Tangible book value per share (period-end) | | $ | 18.97 | | | $ | 18.46 | | | $ | 18.78 | | | $ | 18.97 | | | $ | 18.78 | |
Weighted average number of shares: | | | | | | | | | | | | | | | | | | | | |
Basic | | | 84,777 | | | | 84,751 | | | | 84,699 | | | | 84,757 | | | | 59,149 | |
Diluted | | | 85,632 | | | | 85,500 | | | | 84,985 | | | | 85,525 | | | | 59,442 | |
Period-end number of shares | | | 84,782 | | | | 84,774 | | | | 84,698 | | | | 84,782 | | | | 84,698 | |
Market data: | | | | | | | | | | | | | | | | | | | | |
High sales price | | $ | 33.27 | | | $ | 36.56 | | | $ | 33.25 | | | $ | 36.73 | | | $ | 35.68 | |
Low sales price | | $ | 27.99 | | | $ | 27.96 | | | $ | 25.61 | | | $ | 27.96 | | | $ | 25.61 | |
Period end closing price | | $ | 30.98 | | | $ | 30.44 | | | $ | 26.81 | | | $ | 30.98 | | | $ | 26.81 | |
Trading volume | | | 26,877 | | | | 39,310 | | | | 38,205 | | | | 98,609 | | | | 96,269 | |
| | | | | |
Other Period-end Data | | | | | | | | | | | | | | | | | | | | |
| | | | | |
FTE headcount | | | 4,290 | | | | 4,456 | | | | 4,740 | | | | 4,290 | | | | 4,740 | |
Tangible common equity | | $ | 1,608,285 | | | $ | 1,565,029 | | | $ | 1,590,264 | | | $ | 1,608,285 | | | $ | 1,590,264 | |
Tier I capital | | $ | 1,619,807 | | | $ | 1,581,101 | | | $ | 1,549,153 | | | $ | 1,619,807 | | | $ | 1,549,153 | |
Goodwill | | $ | 628,877 | | | $ | 628,877 | | | $ | 629,688 | | | $ | 628,877 | | | $ | 629,688 | |
Amortizing intangibles | | $ | 197,139 | | | $ | 205,249 | | | $ | 206,424 | | | $ | 197,139 | | | $ | 206,424 | |
| | | | | |
Performance Ratios | | | | | | | | | | | | | | | | | | | | |
| | | | | |
Return on average assets | | | 1.00 | % | | | 0.83 | % | | | 0.62 | % | | | 0.74 | % | | | 0.59 | % |
Return on average assets (operating) (a) | | | 1.07 | % | | | 1.00 | % | | | 0.92 | % | | | 0.97 | % | | | 0.89 | % |
Return on average common equity | | | 7.77 | % | | | 6.62 | % | | | 4.98 | % | | | 5.86 | % | | | 4.85 | % |
Return on average common equity (operating) (a) | | | 8.24 | % | | | 7.93 | % | | | 7.40 | % | | | 7.68 | % | | | 7.40 | % |
Tangible common equity ratio | | | 9.09 | % | | | 8.72 | % | | | 8.56 | % | | | 9.09 | % | | | 8.56 | % |
Earning asset yield (TE) | | | 4.84 | % | | | 4.80 | % | | | 4.82 | % | | | 4.82 | % | | | 4.81 | % |
Total cost of funds | | | 0.30 | % | | | 0.32 | % | | | 0.50 | % | | | 0.34 | % | | | 0.63 | % |
Net interest margin (TE) | | | 4.54 | % | | | 4.48 | % | | | 4.32 | % | | | 4.48 | % | | | 4.18 | % |
Efficiency ratio (b) | | | 64.33 | % | | | 65.67 | % | | | 66.98 | % | | | 65.93 | % | | | 66.81 | % |
Allowance for loan losses as a percent of period-end loans | | | 1.19 | % | | | 1.27 | % | | | 1.06 | % | | | 1.19 | % | | | 1.06 | % |
Allowance for loan losses to non-performing loans + accruing loans 90 days past due | | | 77.81 | % | | | 104.78 | % | | | 107.90 | % | | | 77.81 | % | | | 107.90 | % |
Average loan/deposit ratio | | | 75.85 | % | | | 73.51 | % | | | 72.76 | % | | | 74.14 | % | | | 72.60 | % |
Noninterest income excluding securities transactions as a percent of total revenue (TE) | | | 25.86 | % | | | 26.06 | % | | | 26.49 | % | | | 25.83 | % | | | 29.30 | % |
| (a) | Excludes tax-effected merger related expenses, debt early redemption costs and securities transactions. Management believes that this is a useful financialmeasure because it enables investors to assess ongoing operations. |
| (b) | Efficiency ratio is defined as noninterest expense as a percent of total revenue (TE) before amortization of purchased intangibles, securities transactions, merger related expenses and debt redemption costs. |
- 8 -
Hancock Holding Company
Financial Highlights
(amounts in thousands)
(unaudited)
| | | | | | | | | | | | | | | | | | | | |
| | | Three Months Ended | | | Nine Months Ended | |
| | | 9/30/2012 | | | 6/30/2012 | | | 9/30/2011 | | | 9/30/2012 | | | 9/30/2011 | |
Asset Quality Information | | | | | | | | | | | | | | | | | | | | |
| | | | | |
Non-accrual loans (c) | | $ | 135,499 | | | $ | 113,384 | | | $ | 93,775 | | | $ | 135,499 | | | $ | 93,775 | |
Restructured loans (d) | | | 32,339 | | | | 19,518 | | | | 14,048 | | | | 32,339 | | | | 14,048 | |
| | | | | | | | | | | | | | | | | | | | |
Total non-performing loans | | | 167,838 | | | | 132,902 | | | | 107,823 | | | | 167,838 | | | | 107,823 | |
ORE and foreclosed assets | | | 130,613 | | | | 138,118 | | | | 123,140 | | | | 130,613 | | | | 123,140 | |
| | | | | | | | | | | | | | | | | | | | |
Total non-performing assets | | $ | 298,451 | | | $ | 271,020 | | | $ | 230,963 | | | $ | 298,451 | | | $ | 230,963 | |
| | | | | | | | | | | | | | | | | | | | |
Non-performing assets as a percent of loans, ORE and foreclosed assets | | | 2.58 | % | | | 2.42 | % | | | 2.06 | % | | | 2.58 | % | | | 2.06 | % |
Accruing loans 90 days past due (c) | | $ | 6,423 | | | $ | 1,443 | | | $ | 1,638 | | | $ | 6,423 | | | $ | 1,638 | |
Accruing loans 90 days past due as a percent of loans | | | 0.06 | % | | | 0.01 | % | | | 0.01 | % | | | 0.06 | % | | | 0.01 | % |
Non-performing assets + accruing loans 90 days past due to loans, ORE and foreclosed assets | | | 2.64 | % | | | 2.43 | % | | | 2.07 | % | | | 2.64 | % | | | 2.07 | % |
| | | | | |
Net charge-offs - non-covered | | $ | 9,728 | | | $ | 10,211 | | | $ | 7,825 | | | $ | 26,993 | | | $ | 22,507 | |
Net charge-offs - covered | | | 3,550 | | | | 3,499 | | | | — | | | $ | 22,839 | | | | 375 | |
Net charge-offs - non-covered as a percent of average loans | | | 0.34 | % | | | 0.37 | % | | | 0.28 | % | | | 0.32 | % | | | 0.39 | % |
| | | | | |
Allowance for loan losses | | $ | 135,591 | | | $ | 140,768 | | | $ | 118,113 | | | $ | 135,591 | | | $ | 118,113 | |
Allowance for loan losses as a percent of period-end loans | | | 1.19 | % | | | 1.27 | % | | | 1.06 | % | | | 1.19 | % | | | 1.06 | % |
Allowance for loan losses to non-performing loans + accruing loans 90 days past due | | | 77.81 | % | | | 104.78 | % | | | 107.90 | % | | | 77.81 | % | | | 107.90 | % |
| | | | | |
Provision for loan losses | | $ | 8,101 | | | $ | 8,025 | | | $ | 9,256 | | | $ | 26,141 | | | $ | 27,221 | |
| | | | | |
Allowance for Loan Losses | | | | | | | | | | | | | | | | | | | | |
| | | | | |
Beginning Balance | | $ | 140,768 | | | $ | 142,337 | | | $ | 112,407 | | | $ | 124,881 | | | $ | 81,997 | |
Provision for loan losses before FDIC benefit - covered loans | | | — | | | | 5,146 | | | | 4,500 | | | | 37,025 | | | | 33,448 | |
Benefit attributable to FDIC loss share agreement | | | — | | | | (4,116 | ) | | | (4,275 | ) | | | (34,401 | ) | | | (31,777 | ) |
Provision for loan losses - non-covered loans | | | 8,101 | | | | 6,995 | | | | 9,031 | | | | 23,517 | | | | 25,550 | |
| | | | | | | | | | | | | | | | | | | | |
Net provision for loan losses | | | 8,101 | | | | 8,025 | | | | 9,256 | | | | 26,141 | | | | 27,221 | |
| | | | | | | | | | | | | | | | | | | | |
Increase in indemnification asset | | | — | | | | 4,116 | | | | 4,275 | | | | 34,401 | | | | 31,777 | |
Charge-offs - non-covered | | | 12,211 | | | | 12,711 | | | | 14,530 | | | | 34,588 | | | | 36,227 | |
Charge-offs - covered | | | 3,550 | | | | 3,499 | | | | — | | | | 22,839 | | | | 375 | |
Recoveries - non-covered | | | (2,483 | ) | | | (2,500 | ) | | | (6,705 | ) | | | (7,595 | ) | | | (13,720 | ) |
| | | | | | | | | | | | | | | | | | | | |
Net charge-offs | | | 13,278 | | | | 13,710 | | | | 7,825 | | | | 49,832 | | | | 22,882 | |
| | | | | | | | | | | | | | | | | | | | |
Ending Balance | | $ | 135,591 | | | $ | 140,768 | | | $ | 118,113 | | | $ | 135,591 | | | $ | 118,113 | |
| | | | | | | | | | | | | | | | | | | | |
Net Charge-off Information | | | | | | | | | | | | | | | | | | | | |
| | | | | |
Net charge-offs - non-covered: | | | | | | | | | | | | | | | | | | | | |
Commercial/real estate loans | | $ | 3,905 | | | $ | 5,627 | | | $ | 5,174 | | | $ | 13,811 | | | $ | 15,735 | |
Residential mortgage loans | | | 2,012 | | | | 1,846 | | | | 285 | | | | 4,579 | | | | 730 | |
Consumer loans | | | 3,811 | | | | 2,738 | | | | 2,366 | | | | 8,603 | | | | 6,042 | |
| | | | | | | | | | | | | | | | | | | | |
Total net charge-offs - non-covered | | $ | 9,728 | | | $ | 10,211 | | | $ | 7,825 | | | $ | 26,993 | | | $ | 22,507 | |
| | | | | | | | | | | | | | | | | | | | |
Average loans: | | | | | | | | | | | | | | | | | | | | |
Commercial/real estate loans | | $ | 8,018,634 | | | $ | 7,946,781 | | | $ | 8,141,068 | | | $ | 7,994,444 | | | $ | 5,286,825 | |
Residential mortgage loans | | | 1,573,559 | | | | 1,548,803 | | | | 1,527,915 | | | | 1,557,210 | | | | 1,018,482 | |
Consumer loans | | | 1,667,399 | | | | 1,644,532 | | | | 1,579,745 | | | | 1,646,100 | | | | 1,323,031 | |
| | | | | | | | | | | | | | | | | | | | |
Total average loans | | $ | 11,259,592 | | | $ | 11,140,116 | | | $ | 11,248,728 | | | $ | 11,197,754 | | | $ | 7,628,338 | |
| | | | | | | | | | | | | | | | | | | | |
Net charge-offs - non-covered to average loans: | | | | | | | | | | | | | | | | | | | | |
Commercial/real estate loans | | | 0.19 | % | | | 0.28 | % | | | 0.25 | % | | | 0.23 | % | | | 0.40 | % |
Residential mortgage loans | | | 0.51 | % | | | 0.48 | % | | | 0.07 | % | | | 0.39 | % | | | 0.10 | % |
Consumer loans | | | 0.91 | % | | | 0.67 | % | | | 0.59 | % | | | 0.70 | % | | | 0.61 | % |
| | | | | | | | | | | | | | | | | | | | |
Total net charge-offs - non-covered to average loans | | | 0.34 | % | | | 0.37 | % | | | 0.28 | % | | | 0.32 | % | | | 0.39 | % |
| | | | | | | | | | | | | | | | | | | | |
| (c) | Non-accrual loans and accruing loans past due 90 days or more do not include acquired credit-impaired loans which were written down to fair value upon acquisition and accrete interest income over the remaining life of the loan. |
| (d) | Included in restructured loans are $21.6 million, $9.7 million, and $4.4 million in non-accrual loans at 9/30/12, 6/30/12, and 9/30/11, respectively. Total excludes acquired credit-impaired loans. |
- 9 -
Hancock Holding Company
Financial Highlights
(amounts in thousands)
(unaudited)
| | | | | | | | | | | | | | | | | | | | |
| | | Three Months Ended | | | Nine Months Ended | |
| | | 9/30/2012 | | | 6/30/2012 | | | 9/30/2011 | | | 9/30/2012 | | | 9/30/2011 | |
Income Statement | | | | | | | | | | | | | | | | | | | | |
| | | | | |
Interest income | | $ | 189,205 | | | $ | 190,489 | | | $ | 197,695 | | | $ | 571,410 | | | $ | 395,705 | |
Interest income (TE) | | | 192,071 | | | | 193,323 | | | | 200,835 | | | | 580,060 | | | | 404,676 | |
Interest expense | | | 11,949 | | | | 13,030 | | | | 20,653 | | | | 40,407 | | | | 52,840 | |
| | | | | | | | | | | | | | | | | | | | |
Net interest income (TE) | | | 180,122 | | | | 180,293 | | | | 180,182 | | | | 539,653 | | | | 351,836 | |
Provision for loan losses | | | 8,101 | | | | 8,025 | | | | 9,256 | | | | 26,141 | | | | 27,221 | |
Noninterest income excluding securities transactions | | | 62,842 | | | | 63,552 | | | | 64,937 | | | | 187,888 | | | | 145,834 | |
Securities transactions gains/(losses) | | | 917 | | | | — | | | | 16 | | | | 929 | | | | (71 | ) |
Noninterest expense | | | 169,714 | | | | 179,972 | | | | 194,019 | | | | 555,149 | | | | 388,404 | |
| | | | | | | | | | | | | | | | | | | | |
Income before income taxes | | | 63,200 | | | | 53,014 | | | | 38,720 | | | | 138,530 | | | | 73,003 | |
Income tax expense | | | 16,216 | | | | 13,710 | | | | 8,342 | | | | 33,747 | | | | 15,210 | |
| | | | | | | | | | | | | | | | | | | | |
Net income | | $ | 46,984 | | | $ | 39,304 | | | $ | 30,378 | | | $ | 104,783 | | | $ | 57,793 | |
| | | | | | | | | | | | | | | | | | | | |
Merger-related expenses | | | (38 | ) | | | 11,913 | | | | 22,752 | | | | 45,789 | | | | 46,560 | |
Securities transactions gains/(losses) | | | 917 | | | | — | | | | 16 | | | | 929 | | | | (71 | ) |
Debt early redemption | | | 5,336 | | | | — | | | | — | | | | 5,336 | | | | — | |
Taxes on adjustments | | | 1,533 | | | | 4,170 | | | | 7,958 | | | | 17,569 | | | | 16,321 | |
| | | | | | | | | | | | | | | | | | | | |
Operating income (e) | | $ | 49,832 | | | $ | 47,047 | | | $ | 45,156 | | | $ | 137,410 | | | $ | 88,103 | |
| | | | | | | | | | | | | | | | | | | | |
Difference between interest income and interest income (TE) | | $ | 2,866 | | | $ | 2,834 | | | $ | 3,140 | | | $ | 8,650 | | | $ | 8,971 | |
Provision for loan losses | | | 8,101 | | | | 8,025 | | | | 9,256 | | | | 26,141 | | | | 27,221 | |
Merger-related expenses | | | (38 | ) | | | 11,913 | | | | 22,752 | | | | 45,789 | | | | 46,560 | |
Less securities transactions gains/(losses) | | | 917 | | | | — | | | | 16 | | | | 929 | | | | (71 | ) |
Debt early redemption | | | 5,336 | | | | — | | | | — | | | | 5,336 | | | | — | |
Income tax expense | | | 16,216 | | | | 13,710 | | | | 8,342 | | | | 33,747 | | | | 15,210 | |
| | | | | | | | | | | | | | | | | | | | |
Pre-tax, pre-provision profit (PTPP) (f) | | $ | 78,548 | | | $ | 75,786 | | | $ | 73,852 | | | $ | 223,517 | | | $ | 155,826 | |
| | | | | | | | | | | | | | | | | | | | |
Noninterest Income and Noninterest Expense | | | | | | | | | | | | | | | | | | | | |
| | | | | |
Service charges on deposit accounts | | $ | 20,834 | | | $ | 20,907 | | | $ | 16,858 | | | $ | 58,015 | | | $ | 38,744 | |
Trust fees | | | 7,743 | | | | 7,983 | | | | 7,215 | | | | 24,464 | | | | 16,507 | |
Bank card fees | | | 7,568 | | | | 8,075 | | | | 11,066 | | | | 24,107 | | | | 20,542 | |
Insurance fees | | | 4,045 | | | | 4,581 | | | | 4,356 | | | | 12,103 | | | | 12,234 | |
Investment & annuity fees | | | 4,269 | | | | 4,607 | | | | 4,642 | | | | 13,291 | | | | 11,042 | |
ATM fees | | | 4,301 | | | | 4,843 | | | | 4,127 | | | | 13,479 | | | | 10,148 | |
Secondary mortgage market operations | | | 4,312 | | | | 3,015 | | | | 3,477 | | | | 11,328 | | | | 6,921 | |
Other income | | | 9,770 | | | | 9,541 | | | | 13,196 | | | | 31,101 | | | | 29,696 | |
| | | | | | | | | | | | | | | | | | | | |
Noninterest income excluding securities transactions | | $ | 62,842 | | | $ | 63,552 | | | $ | 64,937 | | | $ | 187,888 | | | $ | 145,834 | |
Securities transactions gains/(losses) | | | 917 | | | | — | | | | 16 | | | | 929 | | | | (71 | ) |
| | | | | | | | | | | | | | | | | | | | |
Total noninterest income including securities transactions | | $ | 63,759 | | | $ | 63,552 | | | $ | 64,953 | | | $ | 188,817 | | | $ | 145,763 | |
| | | | | | | | | | | | | | | | | | | | |
Personnel expense | | $ | 88,176 | | | $ | 89,330 | | | $ | 92,821 | | | $ | 269,376 | | | $ | 184,157 | |
Occupancy expense (net) | | | 13,169 | | | | 13,604 | | | | 13,877 | | | | 41,173 | | | | 28,492 | |
Equipment expense | | | 5,010 | | | | 5,924 | | | | 5,231 | | | | 16,811 | | | | 11,640 | |
Other operating expense | | | 49,951 | | | | 51,279 | | | | 52,241 | | | | 152,328 | | | | 108,223 | |
Amortization of intangibles | | | 8,110 | | | | 7,922 | | | | 7,097 | | | | 24,336 | | | | 9,332 | |
Debt early redemption | | | 5,336 | | | | — | | | | — | | | | 5,336 | | | | — | |
Merger-related expenses | | | (38 | ) | | | 11,913 | | | | 22,752 | | | | 45,789 | | | | 46,560 | |
| | | | | | | | | | | | | | | | | | | | |
Total noninterest expense | | $ | 169,714 | | | $ | 179,972 | | | $ | 194,019 | | | $ | 555,149 | | | $ | 388,404 | |
| | | | | | | | | | | | | | | | | | | | |
| (e) | Net income less tax-effected merger costs, debt early redemption costs, and securities gains/losses. Management believes that this is a useful financial measure because it enables investors to assess ongoing operations. |
| (f) | Pre-tax pre-provision profit (PTPP) is total revenue less noninterest expense, merger items, debt early redemption costs, and securities transactions. Management believes that PTPP profit is a useful financial measure because it enables investors and others to assess the Company’s ability to generate capital to cover credit losses through a credit cycle. |
- 10 -
Hancock Holding Company
Financial Highlights
(amounts in thousands)
(unaudited)
| | | | | | | | | | | | | | | | | | | | |
| | | Three Months Ended | | | Nine Months Ended | |
| | | 9/30/2012 | | | 6/30/2012 | | | 9/30/2011 | | | 9/30/2012 | | | 9/30/2011 | |
Period-end Balance Sheet | | | | | | | | | | | | | | | | | | | | |
| | | | | |
Commercial non-real estate loans | | $ | 4,235,823 | | | $ | 3,890,489 | | | $ | 3,653,336 | | | $ | 4,235,823 | | | $ | 3,653,336 | |
Construction and land development loans | | | 1,044,637 | | | | 1,167,496 | | | | 1,345,761 | | | | 1,044,637 | | | | 1,345,761 | |
Commercial real estate loans | | | 2,907,007 | | | | 2,830,530 | | | | 3,076,150 | | | | 2,907,007 | | | | 3,076,150 | |
Residential mortgage loans | | | 1,561,640 | | | | 1,519,711 | | | | 1,451,506 | | | | 1,561,640 | | | | 1,451,506 | |
Consumer loans | | | 1,685,341 | | | | 1,669,920 | | | | 1,575,516 | | | | 1,685,341 | | | | 1,575,516 | |
| | | | | | | | | | | | | | | | | | | | |
Total loans | | | 11,434,448 | | | | 11,078,146 | | | | 11,102,269 | | | | 11,434,448 | | | | 11,102,269 | |
| | | | | | | | | | | | | | | | | | | | |
Loans held for sale | | | 50,389 | | | | 44,918 | | | | 64,545 | | | | 50,389 | | | | 64,545 | |
Securities | | | 4,053,271 | | | | 4,320,457 | | | | 4,604,835 | | | | 4,053,271 | | | | 4,604,835 | |
Short-term investments | | | 320,057 | | | | 650,470 | | | | 895,235 | | | | 320,057 | | | | 895,235 | |
| | | | | | | | | | | | | | | | | | | | |
Earning assets | | | 15,858,165 | | | | 16,093,991 | | | | 16,666,884 | | | | 15,858,165 | | | | 16,666,884 | |
| | | | | | | | | | | | | | | | | | | | |
Allowance for loan losses | | | (135,591 | ) | | | (140,768 | ) | | | (118,113 | ) | | | (135,591 | ) | | | (118,113 | ) |
Other assets | | | 2,800,472 | | | | 2,825,484 | | | | 2,866,918 | | | | 2,800,472 | | | | 2,866,918 | |
| | | | | | | | | | | | | | | | | | | | |
Total assets | | $ | 18,523,046 | | | $ | 18,778,707 | | | $ | 19,415,689 | | | $ | 18,523,046 | | | $ | 19,415,689 | |
| | | | | | | | | | | | | | | | | | | | |
Noninterest bearing deposits | | $ | 5,151,146 | | | $ | 5,040,484 | | | $ | 5,050,354 | | | $ | 5,151,146 | | | $ | 5,050,354 | |
Interest bearing transaction and savings deposits | | | 5,876,638 | | | | 5,876,843 | | | | 5,580,160 | | | | 5,876,638 | | | | 5,580,160 | |
Interest bearing public fund deposits | | | 1,321,227 | | | | 1,479,378 | | | | 1,361,860 | | | | 1,321,227 | | | | 1,361,860 | |
Time deposits | | | 2,423,940 | | | | 2,534,115 | | | | 3,299,835 | | | | 2,423,940 | | | | 3,299,835 | |
| | | | | | | | | | | | | | | | | | | | |
Total interest bearing deposits | | | 9,621,805 | | | | 9,890,336 | | | | 10,241,855 | | | | 9,621,805 | | | | 10,241,855 | |
| | | | | | | | | | | | | | | | | | | | |
Total deposits | | | 14,772,951 | | | | 14,930,820 | | | | 15,292,209 | | | | 14,772,951 | | | | 15,292,209 | |
Other borrowed funds | | | 1,056,961 | | | | 1,193,021 | | | | 1,278,646 | | | | 1,056,961 | | | | 1,278,646 | |
Other liabilities | | | 258,646 | | | | 255,504 | | | | 418,172 | | | | 258,646 | | | | 418,172 | |
Common shareholders’ equity | | | 2,434,488 | | | | 2,399,362 | | | | 2,426,662 | | | | 2,434,488 | | | | 2,426,662 | |
| | | | | | | | | | | | | | | | | | | | |
Total liabilities & common equity | | $ | 18,523,046 | | | $ | 18,778,707 | | | $ | 19,415,689 | | | $ | 18,523,046 | | | $ | 19,415,689 | |
| | | | | | | | | | | | | | | | | | | | |
Capital Ratios | | | | | | | | | | | | | | | | | | | | |
| | | | | |
Common shareholders’ equity | | $ | 2,434,488 | | | $ | 2,399,362 | | | $ | 2,426,662 | | | $ | 2,434,488 | | | $ | 2,426,662 | |
Tier 1 capital | | | 1,619,807 | | | | 1,581,101 | | | | 1,549,153 | | | | 1,619,807 | | | | 1,549,153 | |
Tangible common equity ratio | | | 9.09 | % | | | 8.72 | % | | | 8.56 | % | | | 9.09 | % | | | 8.56 | % |
Common equity (period-end) as a percent of total assets (period-end) | | | 13.14 | % | | | 12.78 | % | | | 12.50 | % | | | 13.14 | % | | | 12.50 | % |
Leverage (Tier 1) ratio | | | 9.11 | % | | | 8.71 | % | | | 8.28 | % | | | 9.11 | % | | | 8.28 | % |
Tier 1 risk-based capital ratio (g) | | | 12.30 | % | | | 12.18 | % | | | 11.91 | % | | | 12.30 | % | | | 11.91 | % |
Total risk-based capital ratio (g) | | | 13.92 | % | | | 14.20 | % | | | 13.99 | % | | | 13.92 | % | | | 13.99 | % |
| (g) | = estimated for most recent period end |
- 11 -
Hancock Holding Company
Financial Highlights
(amounts in thousands)
(unaudited)
| | | | | | | | | | | | | | | | | | | | |
| | | Three Months Ended | | | Nine Months Ended | |
| | | 9/30/2012 | | | 6/30/2012 | | | 9/30/2011 | | | 9/30/2012 | | | 9/30/2011 | |
Average Balance Sheet | | | | | | | | | | | | | | | | | | | | |
| | | | | |
Commercial non-real estate loans | | $ | 4,056,457 | | | $ | 3,872,026 | | | $ | 3,651,227 | | | $ | 3,903,767 | | | $ | 2,180,869 | |
Construction and land development loans | | | 1,092,181 | | | | 1,235,612 | | | | 1,350,920 | | | | 1,197,915 | | | | 942,571 | |
Commercial real estate loans | | | 2,869,996 | | | | 2,839,143 | | | | 3,138,921 | | | | 2,892,762 | | | | 2,163,385 | |
Residential mortgage loans | | | 1,573,559 | | | | 1,548,803 | | | | 1,527,915 | | | | 1,557,210 | | | | 1,018,482 | |
Consumer loans | | | 1,667,399 | | | | 1,644,532 | | | | 1,579,745 | | | | 1,646,100 | | | | 1,323,031 | |
| | | | | | | | | | | | | | | | | | | | |
Total loans (h) | | | 11,259,592 | | | | 11,140,116 | | | | 11,248,728 | | | | 11,197,754 | | | | 7,628,338 | |
| | | | | | | | | | | | | | | | | | | | |
Securities (i) | | | 4,039,191 | | | | 4,292,686 | | | | 4,358,802 | | | | 4,174,956 | | | | 2,686,787 | |
Short-term investments | | | 531,195 | | | | 733,489 | | | | 983,784 | | | | 705,205 | | | | 919,087 | |
| | | | | | | | | | | | | | | | | | | | |
Earning assets | | | 15,829,978 | | | | 16,166,291 | | | | 16,591,314 | | | | 16,077,915 | | | | 11,234,212 | |
| | | | | | | | | | | | | | | | | | | | |
Allowance for loan losses | | | (140,661 | ) | | | (142,991 | ) | | | (114,304 | ) | | | (136,257 | ) | | | (97,574 | ) |
Other assets | | | 2,909,649 | | | | 2,964,097 | | | | 3,078,674 | | | | 2,983,774 | | | | 2,032,113 | |
| | | | | | | | | | | | | | | | | | | | |
Total assets | | $ | 18,598,966 | | | $ | 18,987,397 | | | $ | 19,555,684 | | | $ | 18,925,432 | | | $ | 13,168,751 | |
| | | | | | | | | | | | | | | | | | | | |
Noninterest bearing deposits | | $ | 5,076,152 | | | $ | 5,149,898 | | | $ | 4,931,083 | | | $ | 5,194,751 | | | $ | 2,782,980 | |
Interest bearing transaction and savings deposits | | | 5,869,281 | | | | 5,881,673 | | | | 5,660,284 | | | | 5,792,586 | | | | 3,603,461 | |
Interest bearing public fund deposits | | | 1,426,405 | | | | 1,517,743 | | | | 1,400,972 | | | | 1,491,514 | | | | 1,304,594 | |
Time deposits | | | 2,473,450 | | | | 2,604,387 | | | | 3,469,365 | | | | 2,624,039 | | | | 2,816,037 | |
| | | | | | | | | | | | | | | | | | | | |
Total interest bearing deposits | | | 9,769,136 | | | | 10,003,803 | | | | 10,530,621 | | | | 9,908,139 | | | | 7,724,092 | |
| | | | | | | | | | | | | | | | | | | | |
Total deposits | | | 14,845,288 | | | | 15,153,701 | | | | 15,461,704 | | | | 15,102,890 | | | | 10,507,072 | |
Other borrowed funds | | | 1,112,304 | | | | 1,212,692 | | | | 1,405,815 | | | | 1,187,340 | | | | 892,741 | |
Other liabilities | | | 236,134 | | | | 233,539 | | | | 268,762 | | | | 245,940 | | | | 177,367 | |
Common shareholders’ equity | | | 2,405,240 | | | | 2,387,465 | | | | 2,419,403 | | | | 2,389,262 | | | | 1,591,571 | |
| | | | | | | | | | | | | | | | | | | | |
Total liabilities & common equity | | $ | 18,598,966 | | | $ | 18,987,397 | | | $ | 19,555,684 | | | $ | 18,925,432 | | | $ | 13,168,751 | |
| | | | | | | | | | | | | | | | | | | | |
| (h) | Includes loans held for sale |
| (i) | Average securities does not include unrealized holding gains/losses on available for sale securities. |
- 12 -
Hancock Holding Company
Financial Highlights
(amounts in thousands)
(unaudited)
| | | | | | | | | | | | |
Supplemental Asset Quality Information (excluding covered assets and acquired loans)j | | 9/30/2012 | | | 6/30/2012 | | | 9/30/2011 | |
Non-accrual loans (k) (l) | | $ | 106,413 | | | $ | 100,067 | | | $ | 58,608 | |
Restructured loans | | | 32,339 | | | | 19,518 | | | | 14,048 | |
| | | | | | | | | | | | |
Total non-performing loans | | | 138,752 | | | | 119,585 | | | | 72,656 | |
ORE and foreclosed assets (m) | | | 91,725 | | | | 93,339 | | | | 99,834 | |
| | | | | | | | | | | | |
Total non-performing assets | | $ | 230,477 | | | $ | 212,924 | | | $ | 172,490 | |
| | | | | | | | | | | | |
Non-performing assets as a percent of loans, ORE and foreclosed assets | | | 3.45 | % | | | 3.61 | % | | | 3.72 | % |
Accruing loans 90 days past due | | $ | 6,423 | | | $ | 1,443 | | | $ | 531 | |
Accruing loans 90 days past due as a percent of loans | | | 0.10 | % | | | 0.02 | % | | | 0.01 | % |
Non-performing assets + accruing loans 90 days past due to loans, ORE and foreclosed assets | | | 3.55 | % | | | 3.63 | % | | | 3.73 | % |
Allowance for loan losses (n) | | $ | 79,749 | | | $ | 81,376 | | | $ | 84,366 | |
Allowance for loan losses as a percent of period-end loans | | | 1.21 | % | | | 1.40 | % | | | 1.86 | % |
Allowance for loan losses to nonperforming loans + accruing loans 90 days past due | | | 54.93 | % | | | 67.24 | % | | | 115.27 | % |
| (j) | Covered and acquired credit impaired loans are considered performing due to the application of the accretion method under acquisition accounting. Acquired loans are recorded at fair value with no allowance brought forward in accordance with acquisition accounting. Certain acquired loans and foreclosed assets are also covered under FDIC loss sharing agreements, which provide considerable protection against credit risk. Due to the protection of loss sharing agreements and impact of acquisition accounting, management has excluded acquired loans and covered assets from this table to provide for improved comparability to prior periods and better perspective into asset quality trends. |
| (k) | Excludes acquired covered loans not accounted for under the accretion method of $6,162, $6,174, and $34,106. |
| (l) | Excludes non-covered acquired performing loans at fair value of $22,924, $7,143, and $1,061. |
| (m) | Excludes covered foreclosed assets of $38,888, $44,779, and $23,306. |
| (n) | Excludes allowance for loan losses recorded on covered acquired loans of $55,842, $59,392, and $33,747. There is no allowance on non-covered impaired loans. |
| | | | | | | | | | | | | | | | |
| | | 6/30/2012 | |
| | | Originated Loans | | | Acquired Loans (o) | | | Covered Loans (p) | | | Total | |
Commercial non-real estate loans | | $ | 1,902,292 | | | $ | 1,948,226 | | | $ | 39,971 | | | $ | 3,890,489 | |
Construction and land development loans | | | 630,997 | | | | 443,057 | | | | 93,442 | | | | 1,167,496 | |
Commercial real estate loans | | | 1,316,772 | | | | 1,450,796 | | | | 62,962 | | | | 2,830,530 | |
Residential mortgage loans | | | 654,149 | | | | 598,199 | | | | 267,363 | | | | 1,519,711 | |
Consumer loans | | | 1,306,648 | | | | 239,276 | | | | 123,996 | | | | 1,669,920 | |
| | | | | | | | | | | | | | | | |
Total loans | | $ | 5,810,858 | | | $ | 4,679,554 | | | $ | 587,734 | | | $ | 11,078,146 | |
| | | | | | | | | | | | | | | | |
Change in loan balance from previous quarter | | $ | 359,851 | | | ($ | 365,928 | ) | | ($ | 46,050 | ) | | ($ | 52,127 | ) |
| | | | | | | | | | | | | | | | |
| |
| | | 9/30/2012 | |
| | | Originated Loans | | | Acquired Loans (o) | | | Covered Loans (p) | | | Total | |
Commercial non-real estate loans | | $ | 2,416,143 | | | $ | 1,797,827 | | | $ | 21,855 | | | $ | 4,235,825 | |
Construction and land development loans | | | 628,067 | | | | 368,476 | | | | 48,094 | | | | 1,044,637 | |
Commercial real estate loans | | | 1,421,526 | | | | 1,378,706 | | | | 106,775 | | | | 2,907,007 | |
Residential mortgage loans | | | 757,471 | | | | 532,551 | | | | 271,618 | | | | 1,561,640 | |
Consumer loans | | | 1,357,987 | | | | 219,962 | | | | 107,390 | | | | 1,685,339 | |
| | | | | | | | | | | | | | | | |
Total loans | | $ | 6,581,194 | | | $ | 4,297,522 | | | $ | 555,732 | | | $ | 11,434,448 | |
| | | | | | | | | | | | | | | | |
Change in loan balance from previous quarter | | $ | 770,336 | | | ($ | 382,032 | ) | | ($ | 32,002 | ) | | $ | 356,302 | |
| | | | | | | | | | | | | | | | |
| (o) | Loans which have been acquired and no allowance brought forward in accordance with acquisition accounting. |
| (p) | Loans which are covered by loss sharing agreements with the FDIC providing considerable protection against credit risk. |
- 13 -
Hancock Holding Company
Average Balance and Net Interest Margin Summary
(amounts in thousands)
(unaudited)
| | | | | | | | | | | | | | | | | | | | | | | | | | | | | | | | | | | | |
| | | Three Months Ended | |
| | | 9/30/2012 | | | 6/30/2012 | | | 9/30/2011 | |
| | | Interest | | | Volume | | | Rate | | | Interest | | | Volume | | | Rate | | | Interest | | | Volume | | | Rate | |
Average Earning Assets | | | | | | | | | | | | | | | | | | | | | | | | | | | | | | | | | | | | |
Commercial & real estate loans (TE) | | $ | 109,069 | | | $ | 8,018,634 | | | | 5.41 | % | | $ | 108,777 | | | $ | 7,946,781 | | | | 5.50 | % | | $ | 113,111 | | | $ | 8,141,068 | | | | 5.51 | % |
Residential mortgage loans | | | 28,533 | | | | 1,573,559 | | | | 7.25 | % | | | 28,709 | | | | 1,548,803 | | | | 7.41 | % | | | 26,166 | | | | 1,527,915 | | | | 6.85 | % |
Consumer loans | | | 29,942 | | | | 1,667,399 | | | | 7.14 | % | | | 28,372 | | | | 1,644,532 | | | | 6.92 | % | | | 28,328 | | | | 1,579,745 | | | | 7.11 | % |
Loan fees & late charges | | | 891 | | | | — | | | | 0.00 | % | | | 1,548 | | | | — | | | | 0.00 | % | | | 886 | | | | — | | | | 0.00 | % |
| | | | | | | | | | | | | | | | | | | | | | | | | | | | | | | | | | | | |
Total loans (TE) | | | 168,435 | | | | 11,259,592 | | | | 5.95 | % | | | 167,406 | | | | 11,140,116 | | | | 6.04 | % | | | 168,491 | | | | 11,248,728 | | | | 5.95 | % |
| | | | | | | | | |
US treasury securities | | | 2 | | | | 150 | | | | 4.64 | % | | | 2 | | | | 150 | | | | 4.66 | % | | | 11 | | | | 10,617 | | | | 0.41 | % |
US agency securities | | | 49 | | | | 18,269 | | | | 1.08 | % | | | 736 | | | | 141,999 | | | | 2.07 | % | | | 1,851 | | | | 362,689 | | | | 2.04 | % |
CMOs | | | 7,820 | | | | 1,663,741 | | | | 1.88 | % | | | 7,983 | | | | 1,578,438 | | | | 2.02 | % | | | 7,129 | | | | 1,089,308 | | | | 2.62 | % |
Mortgage backed securities | | | 12,530 | | | | 2,097,097 | | | | 2.39 | % | | | 13,921 | | | | 2,296,126 | | | | 2.43 | % | | | 19,003 | | | | 2,567,892 | | | | 2.96 | % |
Municipals (TE) | | | 2,864 | | | | 252,771 | | | | 4.53 | % | | | 2,741 | | | | 266,661 | | | | 4.11 | % | | | 3,471 | | | | 306,863 | | | | 4.52 | % |
Other securities | | | 63 | | | | 7,163 | | | | 3.58 | % | | | 65 | | | | 9,312 | | | | 2.79 | % | | | 246 | | | | 21,433 | | | | 4.58 | % |
| | | | | | | | | | | | | | | | | | | | | | | | | | | | | | | | | | | | |
Total securities (TE) (q) | | | 23,328 | | | | 4,039,191 | | | | 2.30 | % | | | 25,448 | | | | 4,292,686 | | | | 2.37 | % | | | 31,711 | | | | 4,358,802 | | | | 2.91 | % |
| | | | | | | | | |
Total short-term investments | | | 308 | | | | 531,195 | | | | 0.23 | % | | | 469 | | | | 733,489 | | | | 0.26 | % | | | 633 | | | | 983,784 | | | | 0.26 | % |
| | | | | | | | | |
Average earning assets yield (TE) | | | 192,071 | | | $ | 15,829,978 | | | | 4.84 | % | | $ | 193,323 | | | $ | 16,166,291 | | | | 4.80 | % | | $ | 200,835 | | | $ | 16,591,314 | | | | 4.82 | % |
| | | | | | | | | |
Interest-bearing Liabilities | | | | | | | | | | | | | | | | | | | | | | | | | | | | | | | | | | | | |
Interest-bearing transaction and savings deposits | | | 1,688 | | | | 5,869,281 | | | | 0.11 | % | | | 1,764 | | | | 5,881,673 | | | | 0.12 | % | | | 2,810 | | | | 5,660,284 | | | | 0.20 | % |
Time deposits | | | 4,829 | | | | 2,473,450 | | | | 0.78 | % | | | 5,018 | | | | 2,604,387 | | | | 0.77 | % | | | 11,209 | | | | 3,469,365 | | | | 1.28 | % |
Public Funds | | | 1,002 | | | | 1,426,405 | | | | 0.28 | % | | | 1,090 | | | | 1,517,743 | | | | 0.29 | % | | | 1,119 | | | | 1,400,972 | | | | 0.32 | % |
| | | | | | | | | | | | | | | | | | | | | | | | | | | | | | | | | | | | |
Total interest bearing deposits | | | 7,519 | | | | 9,769,136 | | | | 0.31 | % | | | 7,872 | | | | 10,003,803 | | | | 0.32 | % | | | 15,138 | | | | 10,530,621 | | | | 0.57 | % |
| | | | | | | | | |
Total borrowings | | | 4,430 | | | | 1,112,304 | | | | 1.58 | % | | | 5,158 | | | | 1,212,692 | | | | 1.71 | % | | | 5,515 | | | | 1,405,815 | | | | 1.56 | % |
| | | | | | | | | |
Total interest bearing liabilities cost | | $ | 11,949 | | | $ | 10,881,440 | | | | 0.44 | % | | $ | 13,030 | | | $ | 11,216,495 | | | | 0.47 | % | | $ | 20,653 | | | $ | 11,936,436 | | | | 0.69 | % |
| | | | | | | | | |
Net interest-free funding sources | | | | | | | 4,948,538 | | | | | | | | | | | | 4,949,796 | | | | | | | | | | | | 4,654,878 | | | | | |
| | | | | | | | | |
Total Cost of Funds | | $ | 11,949 | | | $ | 15,829,978 | | | | 0.30 | % | | $ | 13,030 | | | $ | 16,166,291 | | | | 0.32 | % | | $ | 20,653 | | | $ | 16,591,314 | | | | 0.50 | % |
| | | | | | | | | |
Net Interest Spread (TE) | | $ | 180,122 | | | | | | | | 4.40 | % | | $ | 180,293 | | | | | | | | 4.33 | % | | $ | 180,182 | | | | | | | | 4.13 | % |
| | | | | | | | | |
Net Interest Margin (TE) | | $ | 180,122 | | | $ | 15,829,978 | | | | 4.54 | % | | $ | 180,293 | | | $ | 16,166,291 | | | | 4.48 | % | | $ | 180,182 | | | $ | 16,591,314 | | | | 4.32 | % |
| (q) | Average securities does not include unrealized holding gains/losses on available for sale securities. |
- 14 -
Hancock Holding Company
Average Balance and Net Interest Margin Summary
(amounts in thousands)
(unaudited)
| | | | | | | | | | | | | | | | | | | | | | | | |
| | | Nine Months Ended | |
| | | 9/30/2012 | | | 9/30/2011 | |
| | | Interest | | | Volume | | | Rate | | | Interest | | | Volume | | | Rate | |
Average Earning Assets | | | | | | | | | | | | | | | | | | | | | | | | |
Commercial & real estate loans (TE) | | $ | 330,355 | | | $ | 7,994,444 | | | | 5.52 | % | | $ | 213,504 | | | $ | 5,286,825 | | | | 5.39 | % |
Residential mortgage loans | | | 83,664 | | | | 1,557,210 | | | | 7.16 | % | | | 51,829 | | | | 1,018,482 | | | | 6.79 | % |
Consumer loans | | | 86,876 | | | | 1,646,100 | | | | 7.05 | % | | | 69,130 | | | | 1,323,031 | | | | 6.99 | % |
Loan fees & late charges | | | 3,238 | | | | — | | | | 0.00 | % | | | 1,062 | | | | — | | | | 0.00 | % |
| | | | | | | | | | | | | | | | | | | | | | | | |
Total loans (TE) | | | 504,133 | | | | 11,197,754 | | | | 6.01 | % | | | 335,525 | | | | 7,628,338 | | | | 5.88 | % |
| | | | | | |
US treasury securities | | | 5 | | | | 150 | | | | 4.66 | % | | | 36 | | | | 10,738 | | | | 0.45 | % |
US agency securities | | | 2,047 | | | | 126,123 | | | | 2.16 | % | | | 4,089 | | | | 284,067 | | | | 1.92 | % |
CMOs | | | 22,586 | | | | 1,534,909 | | | | 1.96 | % | | | 13,422 | | | | 615,835 | | | | 2.91 | % |
Mortgage backed securities | | | 40,858 | | | | 2,237,794 | | | | 2.43 | % | | | 40,409 | | | | 1,517,871 | | | | 3.55 | % |
Municipals (TE) | | | 8,872 | | | | 267,793 | | | | 4.42 | % | | | 8,979 | | | | 232,825 | | | | 5.14 | % |
Other securities | | | 255 | | | | 8,187 | | | | 4.15 | % | | | 768 | | | | 25,451 | | | | 4.03 | % |
| | | | | | | | | | | | | | | | | | | | | | | | |
Total securities (TE) (q) | | | 74,623 | | | | 4,174,956 | | | | 2.39 | % | | | 67,703 | | | | 2,686,787 | | | | 3.36 | % |
| | | | | | |
Total short-term investments | | | 1,304 | | | | 705,205 | | | | 0.25 | % | | | 1,448 | | | | 919,087 | | | | 0.21 | % |
| | | | | | |
Average earning assets yield (TE) | | | 580,060 | | | $ | 16,077,915 | | | | 4.82 | % | | $ | 404,676 | | | $ | 11,234,212 | | | | 4.81 | % |
| | | | | | |
Interest-Bearing Liabilities | | | | | | | | | | | | | | | | | | | | | | | | |
Interest-bearing transaction deposits | | $ | 5,634 | | | $ | 5,792,586 | | | | 0.13 | % | | $ | 5,937 | | | $ | 3,603,461 | | | | 0.22 | % |
Time deposits | | | 16,735 | | | | 2,624,039 | | | | 0.85 | % | | | 32,659 | | | | 2,816,037 | | | | 1.55 | % |
Public Funds | | | 3,285 | | | | 1,491,514 | | | | 0.29 | % | | | 4,120 | | | | 1,304,594 | | | | 0.42 | % |
| | | | | | | | | | | | | | | | | | | | | | | | |
Total interest bearing deposits | | $ | 25,654 | | | $ | 9,908,139 | | | | 0.35 | % | | $ | 42,716 | | | $ | 7,724,092 | | | | 0.74 | % |
| | | | | | |
Total borrowings | | | 14,753 | | | | 1,187,340 | | | | 1.66 | % | | | 10,123 | | | | 892,741 | | | | 1.52 | % |
| | | | | | |
Total interest bearing liabilities cost | | $ | 40,407 | | | $ | 11,095,479 | | | | 0.49 | % | | $ | 52,840 | | | $ | 8,616,833 | | | | 0.82 | % |
| | | | | | |
Net interest-free funding sources | | | | | | | 4,982,436 | | | | | | | | | | | | 2,617,379 | | | | | |
| | | | | | |
Total Cost of Funds | | $ | 40,407 | | | $ | 16,077,915 | | | | 0.34 | % | | $ | 52,840 | | | $ | 11,234,212 | | | | 0.63 | % |
| | | | | | |
Net Interest Spread (TE) | | $ | 539,653 | | | | | | | | 4.33 | % | | $ | 351,836 | | | | | | | | 3.99 | % |
| | | | | | |
Net Interest Margin (TE) | | $ | 539,653 | | | $ | 16,077,915 | | | | 4.48 | % | | $ | 351,836 | | | $ | 11,234,212 | | | | 4.18 | % |
| (q) | Average securities does not include unrealized holding gains/losses on available for sale securities. |
- end -
|
Third Quarter 2012 Financial Results October 25, 2012 Third Quarter 2012 Financial Results October 25, 2012 |
|
Forward-Looking Statements Forward-Looking Statements Certain of the statements or information included in this presentation may constitute forward-looking statements. Forward-looking statements include projections of revenue, costs, results of operations or financial condition or statement regarding future market conditions or our potential plans and strategies for the future. Hancock’s ability to accurately project results or predict the effects of future plans or strategies is inherently limited. We believe that the expectations reflected or implied by any forward-looking statements are based on reasonable assumptions, but actual results and performance could differ materially from those set forth in the forward-looking statements. Factors that could cause actual results or outcomes to differ from those expressed in the Company's forward-looking statements include, but are not limited to, those outlined in Hancock's SEC filings, including the “Risk Factors” section of the Company’s 10-K for the year ended December 31, 2011 and form 10-Q for the quarter ended September 30, 2012. Hancock undertakes no obligation to update or revise any forward-looking statements, and you are cautioned not to place undue reliance on such forward-looking statements. 2 |
|
• Operating earnings $50 million or $.58 per diluted common share* Up 5% linked-quarter on a per share basis • Premium and related tender costs on repurchase of a portion of Whitney Bank sub debt totaled $5.3 million, pre-tax • Fundamentals remained solid • Operating ROA 1.07% • Net loans up $356 million linked-quarter, or 3% • Generated additional quarterly cost savings • Reported net interest margin (NIM) expansion • Continued focus on improving overall results and growing the Company Third Quarter 2012 Highlights As of September 30, 2012 3 * A reconciliation of net income to operating income is included in the appendix.. |
|
ROA Guidance of 1.10% to 1.20% Within Reach ROA Guidance of 1.10% ROA Guidance of 1.10% to 1.20% Within Reach to 1.20% Within Reach HBHC/WTNY Proforma HBHC post merger * Whitney acquired June 4, 2011 ** 3Q12 operating ROA also excludes early sub debt redemption costs * Operating ROA (excludes merger costs)*** 4 ** Guidance: 1.10% - 1.20% *** A reconciliation of net income to operating income is included in the appendix.. |
|
Whitney Subordinated Notes Tender Offer • Original issue by Whitney National Bank in March 2007 of $150 million 5.875% notes due 4-1-2017 • Tender offer for up to 50% of the outstanding notes announced June 18, 2012 (expired July 16, 2012) • Repurchased approximately $52 million • In addition to paying the indebtedness represented by the notes and accrued interest, the Company incurred approximately $5.3 million in costs, including a premium of $5.1 million • Annual savings of approximately $3 million through reduced interest costs 5 |
|
Third Quarter 2012 Earnings Summary Third Quarter 2012 Earnings Summary As of September 30, 2012 6 ($s in millions; except per share data) 3Q12 2Q12 change Operating Income* $49.8 $47.0 +6% Operating E.P.S. (diluted)* $.58 $.55 +5% Return on Assets (operating)* 1.07% 1.00% +7bps Merger Costs --- $11.9 n/m Net Income $47.0 $39.3 +20% Earnings Per Share (diluted) $.55 $.46 +20% Pre-Tax, Pre-Provision Income* $78.5 $75.8 +4% Net Interest Margin 4.54% 4.48% +6bps Net Charge-offs non-covered 0.34% 0.37% -3bps Tangible Common Equity 9.09% 8.72% +37bps Efficiency Ratio** 64.33% 65.67% -134bps * A reconciliation of net income to operating income and pre-tax, pre-provision income is included in the appendix. ** Noninterest expense as a percent of total revenue (TE) before amortization of purchased intangibles, securities transactions, sub debt redemption costs and merger expenses. |
|
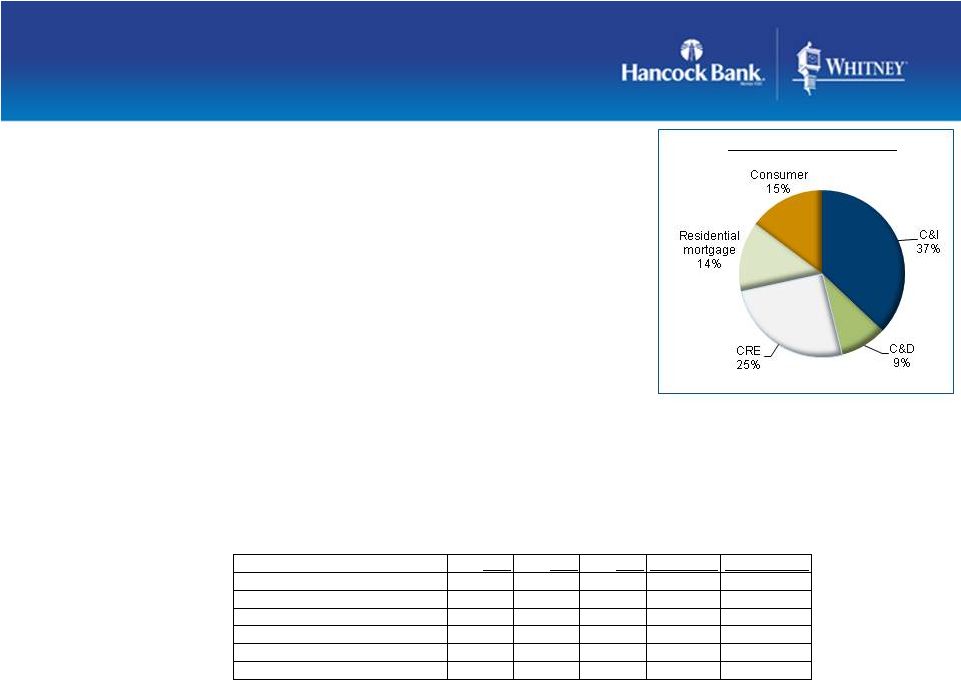
Growth Continues In C&I Portfolio • Total loans $11.4B; up $356 million, or 3% linked-quarter • Compared to the same period last year non-covered loans are up almost $500 million, or 5% • Growth in C&I (+17%), residential mortgage (+11%), consumer loans (+11%) offset by declines in construction (-17%) and commercial real estate (-7%) • Result is a better quality, more diversified portfolio • The loan pipeline remains strong, but the market for new loans remains highly competitive • Although management expects continued net loan growth in future quarters, the rate of growth may be below the pace in the current quarter Period-end balances. As of September 30, 2012 7 $s in millions 3Q12 2Q12 3Q11 % Chg (QTR) % Chg (Annual) Loans (excluding covered portfolio) 10,878.5 $ 10,490.3 $ 10,380.4 $ 3.7% 4.8% Commercial 4,213.9 3,850.5 3,610.3 9.4% 16.7% Construction 996.5 1,074.1 1,197.6 -7.2% -16.8% Real Estate 2,800.2 2,767.5 2,998.1 1.2% -6.6% Residential mortgage 1,290.0 1,252.3 1,156.5 3.0% 11.5% Consumer 1,577.9 1,545.9 1,417.9 2.1% 11.3% Total Loan Mix 9/30/12 |
|
Loans outstanding to oil & gas industry customers totaled $758 million, or approximately 7% of total loans, at September 30, 2012 Balanced portfolio including many long-time relationships Hired new energy lending team in May 2012 Energy portfolio increased $125 million from June 30, 2012 Increase In Energy Lending Related To Recent Strategic Hires As of September 30, 2012 8 Energy Portfolio Mix E&P 31% Transportation 22% Drilling & Pre- drilling 24% Service & Supply 17% Other 6% |
|
Strong Core Deposit Strong Core Deposit Funding Funding • Total deposits $14.8 billion, down 1% linked- quarter • Funding mix remained strong – Shift continued from CDs in to no and low costs deposits – Cost of funds (30bps); down 2bps from 2Q12 – Noninterest bearing demand deposits (DDA) comprised 35% of total period-end deposits – Continued favorable mix • Decline mainly related to the seasonal trends in public funds • Approximately $1.5B in CDs maturing over the next 4 quarters at average rate of .50% Period-end balances. As of September 30, 2012 9 Deposit Mix 9/30/12 |
|
Strong, Stable Net Interest Margin • Net interest margin (NIM) 4.54%, up 6bps linked-quarter – Core margin slightly compressed – Reflects a favorable shift in earning asset mix and funding sources, a decline in funding costs, offset by a decline in the securities portfolio yield and loan portfolio yield – Increase of net purchase accounting adjustments, mainly from the Whitney transaction, positively impacted net interest income and NIM • As earning assets continue to reprice, and with a diminished opportunity to significantly lower funding costs, continued compression on the core margin in the near term is expected • All else equal, compression in the reported margin is also anticipated in the near term As of September 30, 2012 10 4.32% 4.39% 4.43% 4.48% 4.54% 3Q11 4Q11 1Q12 2Q12 3Q12 NIM - reported |
|
Whitney Portfolio Performing Better Than Expected • FAS 91 mark accreted into earnings over the life of the portfolio • Credit impaired mark available for charge-offs; if not needed for charge-offs then accreted into income • Quarterly reviews of accretion levels and portfolio performance will impact reported margin As of September 30, 2012 11 $s in millions Credit Impaired (SOP 03-3) Performing (FAS 91) Total Whitney loan mark at acquisition (as adjusted in 4Q11) $284 $187 $471 Acquired portfolio loan balances at acquisition $818 $6,101 $6,919 Discount at acquisition 34.7% 3.1% 6.8% Remaining Whitney loan mark at 9/30/12 $232 $100 $332 Remaining acquired portfolio loan balances at 9/30/12 $427 $4,201 $4,628 Acquired loan charge-offs from acquisition thru 9/30/12 $21 $5 $26 Discount at 9/30/12 54.2% 2.4% 7.2% |
|
Working To Enhance Fee Growth • Noninterest income totaled $63.8 million, virtually flat linked-quarter • Includes $.9 million of securities gains • Bankcard fees totaled $7.6 million, down $.5 million from 2Q12 • The Durbin interchange restrictions began impacting Hancock Bank on July 1, 2012 • Resulted in a loss of bankcard fees of approximately $2.0 million during 3Q12 • Loss of income was partly offset by a $1.4 million increase in merchant fees • The Durbin interchange restrictions negatively impacted ATMs fees by approximately $.5 million • Fees from secondary mortgage operations totaled $4.3 million, up $1.3 million linked-quarter • Increase reflects a higher volume of mortgage production during the third quarter mainly from refinancing activity As of September 30, 2012 12 |
|
Focused On Improving Efficiency Ratio • Operating expense* totaled $164 million, down $3.6 million from 2Q12 – Amortization of intangibles totaled $8.1 million • Personnel expense decreased $1.2 million, reflecting the reduction in FTE associated with the systems conversion and branch consolidations • Linked-quarter declines related to the systems conversion and branch consolidations are also reflected in occupancy, equipment and various categories included in other noninterest expense • Efficiency ratio 64.33%** – Short term target: 62-63%; – Longer term target: less than 60% As of September 30, 2012 * Excludes merger costs and sub debt early redemption costs ** Noninterest expense as a percent of total revenue (TE) before amortization of purchased intangibles, sub debt redemption costs, securities transactions and merger expenses 13 66.98% 65.39% 67.81% 65.67% 64.33% 62.5% 3Q11 4Q11 1Q12 2Q12 3Q12 Efficiency Ratio ST Target (midpoint) |
|
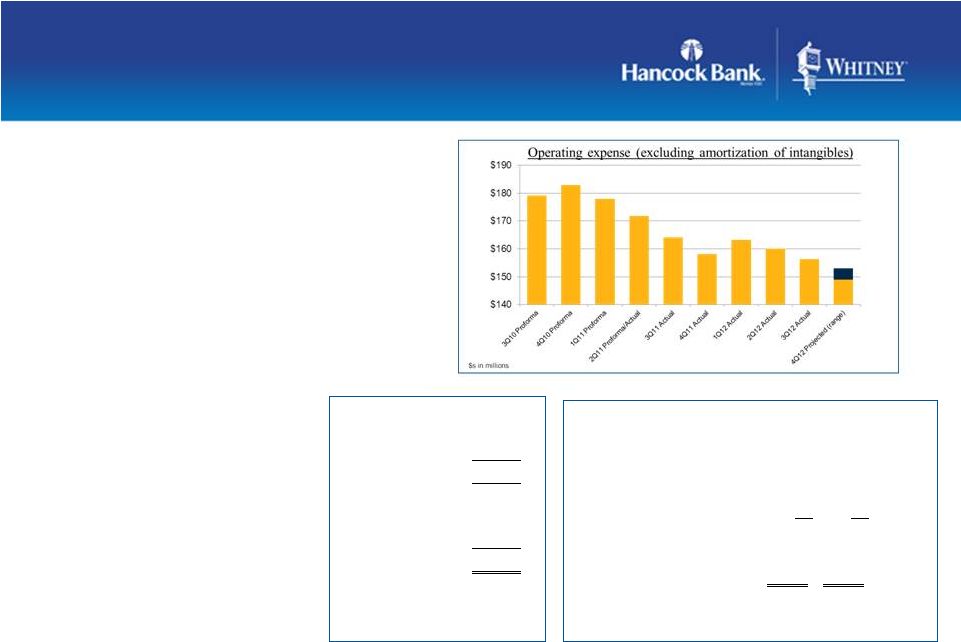
Reiterating Operating Expense Guidance for 4Q12 • Expect total operating expense, excluding amortization of intangibles, of $149MM - $153MM in 4Q12 • *4Q12 guidance includes $134MM of cost savings projected for the Whitney acquisition (or $33.5MM quarterly) • 4Q12 guidance also includes a modest level of normal annual expense growth as well as costs associated with new strategic initiatives As of September 30, 2012 14 ***Base period for determining cost savings (excluding amortization of intangibles) Operating expense excludes merger costs and sub debt early redemption costs $s in millions Legacy Whitney 111.7 $ Legacy Hancock 67.4 Proforma 3Q10*** 179.1 Projected cost saves Quarterly* (33.5) 145.6 $ $s in millions 4Q12 Guidance (range) 149.0 $ 153.0 $ (operating expense excluding amortization of intangibles) Projected 4Q12 7.8 7.8 Amortization of intangibles Projected 4Q12 operating 156.8 $ 160.8 $ expense (range) |
|
• Provision for loan losses was $8.1 million, virtually unchanged from 2Q12 • Net charge-offs totaled $9.7 million, or 0.34%, related to the non-covered portfolio • ALLL/loans 1.21% (excluding the impact of the Whitney acquired loans and FDIC covered loans) • Total nonperforming assets increased $27 million linked-quarter • Nonaccrual loans up $22 million; mainly related to a small portion of Whitney’s acquired portfolio that was performing at acquisition date and has subsequently moved to nonaccrual • Restructured loans up $13 million • ORE and foreclosed assets down $8 million • Approximately $60 million of current ORE properties under sales contracts, scheduled to close in 4Q12 Asset Quality In Line With Previous Quarters’ Range As of September 30, 2012 15 $s in millions Criticized Loans $0 $200 $400 $600 $800 $1,000 $1,200 $1,400 2Q11 3Q11 4Q11 1Q12 2Q12 3Q12 |
|
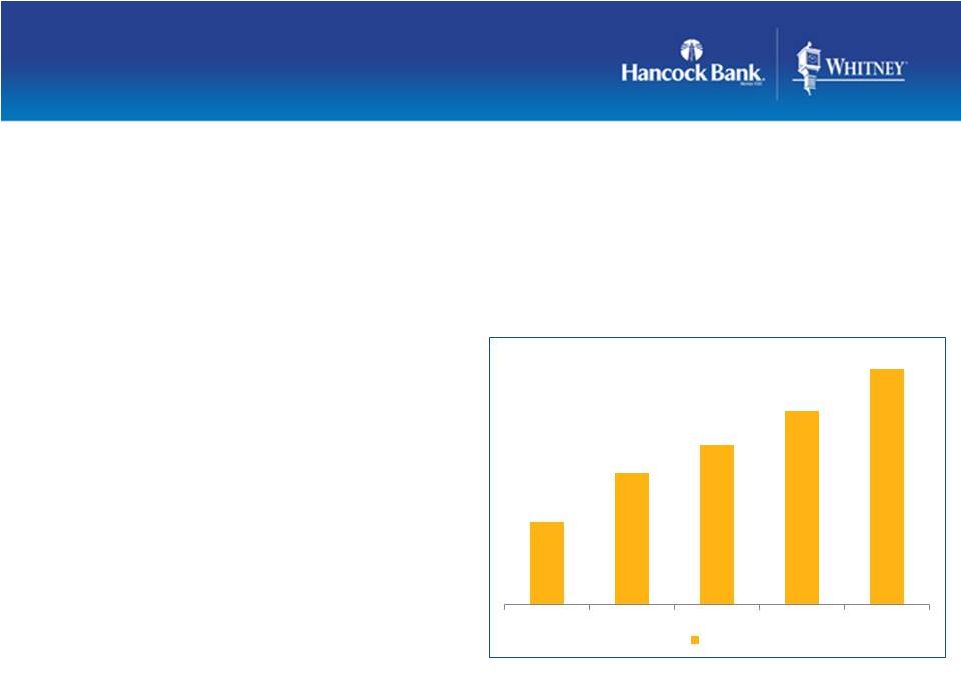
• TCE ratio improved to 9.09%, up 37bps linked-quarter • Expect to build capital in the near term • Will continue to look for opportunities to deploy excess capital and liquidity in the best interest of the Company and its shareholders Well-Capitalized Company As of September 30, 2012 Capital raise Whitney acquisition 16 Tangible Common Equity (TCE) Ratio |
|
Non-GAAP Reconciliation Non-GAAP Reconciliation Reconciliation 18 (a) Net income less tax-effected merger costs, debt early redemption costs, and securities gains/losses. Management believes that this is a useful financial measure because it enables investors to assess ongoing operations. (b) Pre-tax pre-provision profit (PTPP) is total revenue less noninterest expense, merger items, debt early redemption costs, and securities transactions. Management believes that PTPP profit is a useful financial measure because it enables investors and others to assess the Company’s ability to generate capital to cover credit losses through a credit cycle. (amounts in thousands) (unaudited) 9/30/2012 6/30/2012 9/30/2011 9/30/2012 9/30/2011 Income Statement Interest income $189,205 $190,489 $197,695 $571,410 $395,705 Interest income (TE) 192,071 193,323 200,835 580,060 404,676 Interest expense 11,949 13,030 20,653 40,407 52,840 Net interest income (TE) 180,122 180,293 180,182 539,653 351,836 Provision for loan losses 8,101 8,025 9,256 26,141 27,221 Noninterest income excluding securities transactions 62,842 63,552 64,937 187,888 145,834 Securities transactions gains/(losses) 917 - 16 929 (71) Noninterest expense 169,714 179,972 194,019 555,149 388,404 Income before income taxes 63,200 53,014 38,720 138,530 73,003 Income tax expense 16,216 13,710 8,342 33,747 15,210 Net income $46,984 $39,304 $30,378 $104,783 $57,793 Merger-related expenses (38) 11,913 22,752 45,789 46,560 Securities transactions gains/(losses) 917 - 16 929 (71) Debt early redemption 5,336 - - 5,336 - Taxes on adjustments 1,533 4,170 7,958 17,569 16,321 Operating income (a) $49,832 $47,047 $45,156 $137,410 $88,103 Difference between interest income and interest income (TE) $2,866 $2,834 $3,140 $8,650 $8,971 Provision for loan losses 8,101 8,025 9,256 26,141 27,221 Merger-related expenses (38) 11,913 22,752 45,789 46,560 Less securities transactions gains/(losses) 917 - 16 929 (71) Debt early redemption 5,336 - - 5,336 - Income tax expense 16,216 13,710 8,342 33,747 15,210 Pre-tax, pre-provision profit (PTPP) (b) $78,548 $75,786 $73,852 $223,517 $155,826 Three Months Ended Nine Months Ended |
|
Third Quarter 2012 Financial Results October 25, 2012 Third Quarter 2012 Financial Results October 25, 2012 |