Exhibit 99.1

For Immediate Release
October 23, 2014
For More Information
Trisha Voltz Carlson
SVP, Investor Relations Manager
504.299.5208
trisha.carlson@hancockbank.com
Hancock reports third quarter 2014 financial results
Operating E.P.S. flat linked-quarter; core E.P.S. up 6.5%
GULFPORT, Miss. (October 23, 2014) — Hancock Holding Company (Nasdaq: HBHC) today announced its financial results for the third quarter of 2014. Net income for the third quarter of 2014 was $46.6 million, or $.56 per diluted common share, compared to $40.0 million, or $.48 in the second quarter of 2014 and $33.2 million, or $.40 in the third quarter of 2013.
Operating income for the third quarter of 2014 was $49.1 million, or $.59 per diluted common share, compared to $49.6 million, or $.59, in the second quarter of 2014. Operating income was $46.8 million, or $.56, in the third quarter of 2013. We define our operating income as net income excluding tax-effected securities transactions gains or losses and nonoperating expense items. Nonoperating expenses totaled $3.9 million and $12.1 million (pre-tax), in the third and second quarters of 2014, respectively, and $20.9 million (pre-tax) in the third quarter of 2013. Management believes that operating income is a useful measure of financial performance that helps investors compare the company’s fundamental operational performance from period to period. The financial tables include a reconciliation of net income to operating income.
Over the past several quarters we have disclosed our strategic initiatives designed to replace declining levels of purchase accounting income from recent acquisitions with improvement in core income, which the company defines as operating income (defined above) excluding tax-effected purchase accounting adjustments. This effort should improve the overall quality of the Company’s earnings. Management believes that consistent reporting of core income helps investors recognize the pace of management successfully executing its strategic initiatives. Our core income for the third quarter of 2014 was $41.2 million or $.49 per diluted common share, compared to $38.7 million, or $.46 in the second quarter of 2014 and $28.7 million, or $.34, in the third quarter of 2013. The financial tables include a reconciliation of net income to core income.
“The combination of our successful expense reduction initiative and investments in revenue-generating initiatives, along with our emphasis on loan and deposit growth across our footprint, is allowing us to gradually replace declining purchase accounting income with solid core results,” said Hancock’s President and Chief Executive Officer Carl J. Chaney. “Our success in
1
Hancock reports third quarter 2014 financial results
October 23, 2014
growing core revenue this quarter has narrowed the gap between operating and core results, with core E.P.S. growing 6.5% linked-quarter. I am very proud of what we have been able to accomplish so far, and look forward to continuing our success in future quarters.”
Highlights of the company’s third quarter of 2014 results:
| | • | | Net loan growth of $488 million, or 16% linked-quarter annualized; approximately $1.7 billion, or 15%, year-over-year loan growth (each excluding the FDIC-covered portfolio) |
| | • | | Net deposit growth of $491 million, or 13% linked-quarter annualized; completely funding the loan growth in the third quarter |
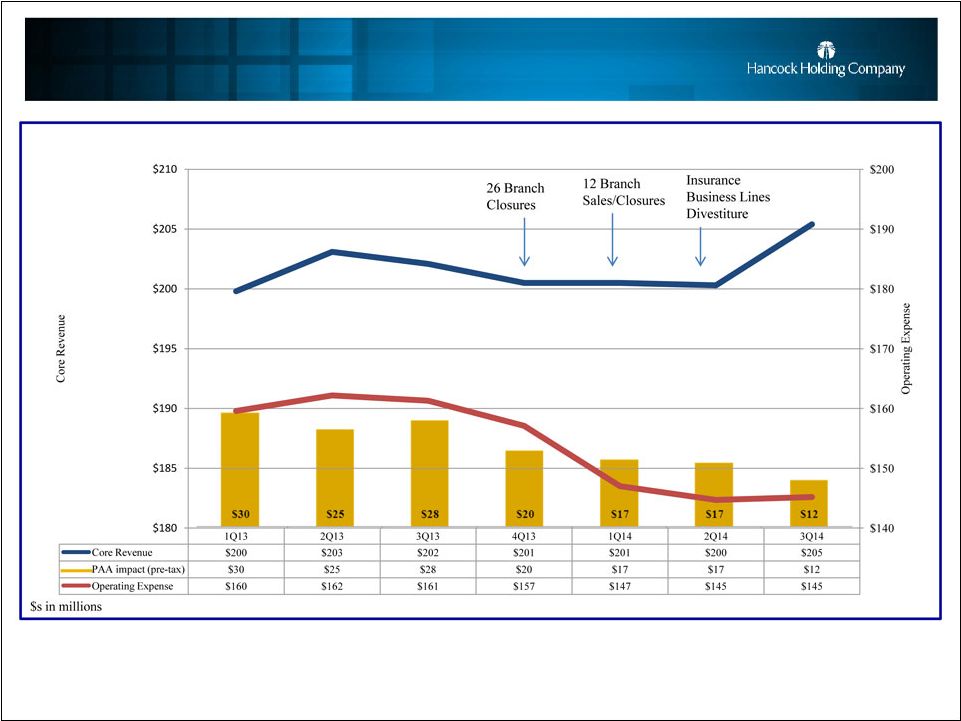
| | • | | An increase of $5 million in core revenue offset a $5 million decline in purchase accounting revenue |
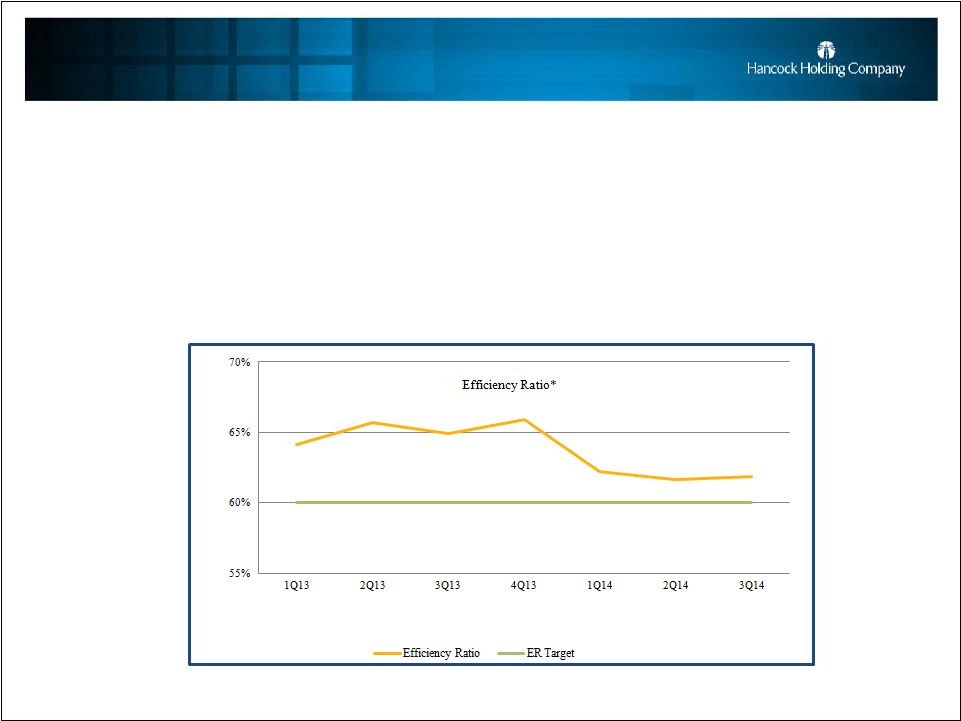
| | • | | Operating expenses remained relatively stable and remain below the targeted expense goal of $147 million for the fourth quarter of 2014 |
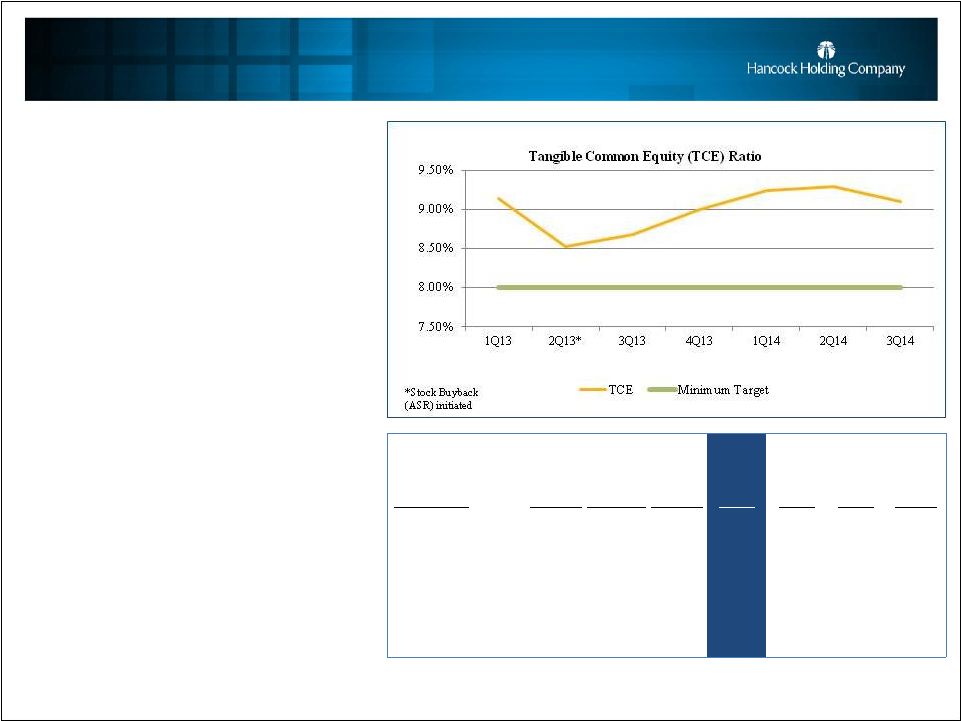
| | • | | Solid capital levels with a tangible common equity (TCE) ratio of 9.10%; approximately $10 million of capital used to repurchase stock during the quarter |
| | • | | Return on average assets (ROA) (operating) of 1.00% down from 1.04%; core ROA up 2bps; total assets grew to $20 billion from second quarter of 2014 |
Loans
Total loans at September 30, 2014 were $13.3 billion, up $465 million from June 30, 2014. Excluding the FDIC-covered portfolio, which declined $23 million during the third quarter of 2014, total loans increased $488 million, or 4% linked-quarter. The growth in deposits, noted in the section below, fully funded the loan growth in the third quarter of 2014.
All markets across the franchise reported net loan growth during the quarter, with south Louisiana, Houston and central Florida generating over half of the increase. Mortgage and indirect lending generated approximately 30% of the quarter’s net loan growth.
Average loans totaled $13.1 billion for the third quarter of 2014, up $421 million, or 3%, from the second quarter of 2014.
Deposits
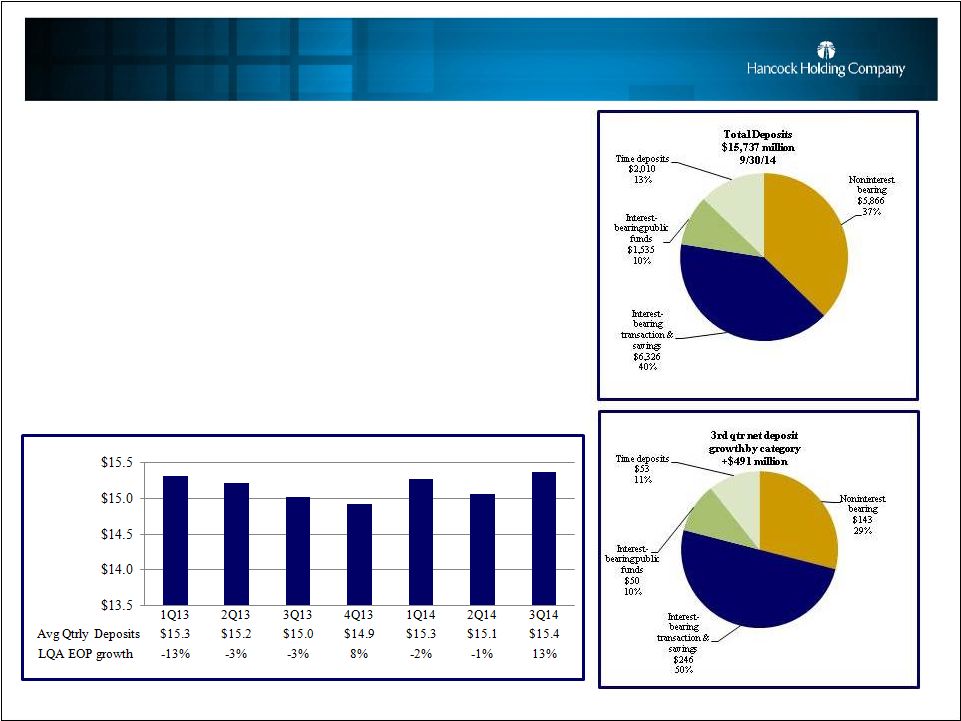
Total deposits at September 30, 2014 were $15.7 billion, up $491 million, or 3%, from June 30, 2014. Average deposits for the third quarter of 2014 were $15.4 billion, up $311 million, or 2%, from the second quarter of 2014. Initiatives were put in place recently with a focus on growing deposits in order to fund the Company’s loan growth. Previously the loan growth had been funded primarily through runoff in the securities portfolio.
Noninterest-bearing demand deposits (DDAs) totaled $5.9 billion at September 30, 2014, up $143 million, or 2.5%, compared to June 30, 2014. DDAs comprised 37% of total period-end deposits at September 30, 2014.
Interest-bearing transaction and savings deposits totaled $6.3 billion at the end of the third quarter of 2014, up $246 million, or 4%, from June 30, 2014. Time deposits (CDs) and interest-bearing public fund deposits totaled $3.5 billion at September 30, 2014, up $103 million, or 3%, from June 30, 2014.
2
Hancock reports third quarter 2014 financial results
October 23, 2014
Asset Quality
Nonperforming assets (NPAs) totaled $147.2 million at September 30, 2014, down $10.3 million from June 30, 2014. During the third quarter of 2014, total nonperforming loans declined $6.7 million, and foreclosed and surplus real estate (ORE) and other foreclosed assets decreased $3.6 million. Nonperforming assets as a percent of total loans, ORE and other foreclosed assets was 1.10% at September 30, 2014, down 12 bps from June 30, 2014.
The total allowance for loan losses was $125.6 million at September 30, 2014, down $3.1 million from June 30, 2014. The ratio of the allowance for loan losses to period-end loans was .94% at September 30, 2014, compared to 1.00% at the end of the second quarter of 2014. The change in the allowance during the third quarter reflects a $3.4 million increase in the allowance maintained on the noncovered portion of the loan portfolio, offset by a $6.5 million reduction in the allowance on covered loans.
Net charge-offs from the noncovered loan portfolio were $6.4 million, or 0.19% of average total loans on an annualized basis in the third quarter of 2014, up from $4.1 million, or 0.13% of average total loans in the second quarter of 2014.
During the third quarter of 2014, Hancock recorded a total provision for loan losses of $9.5 million, up $2.8 million from the second quarter of 2014, primarily related to the noncovered portion of the allowance. The increase in the loan loss provision was primarily related to the growth in loans during the third quarter.
Net Interest Income and Net Interest Margin
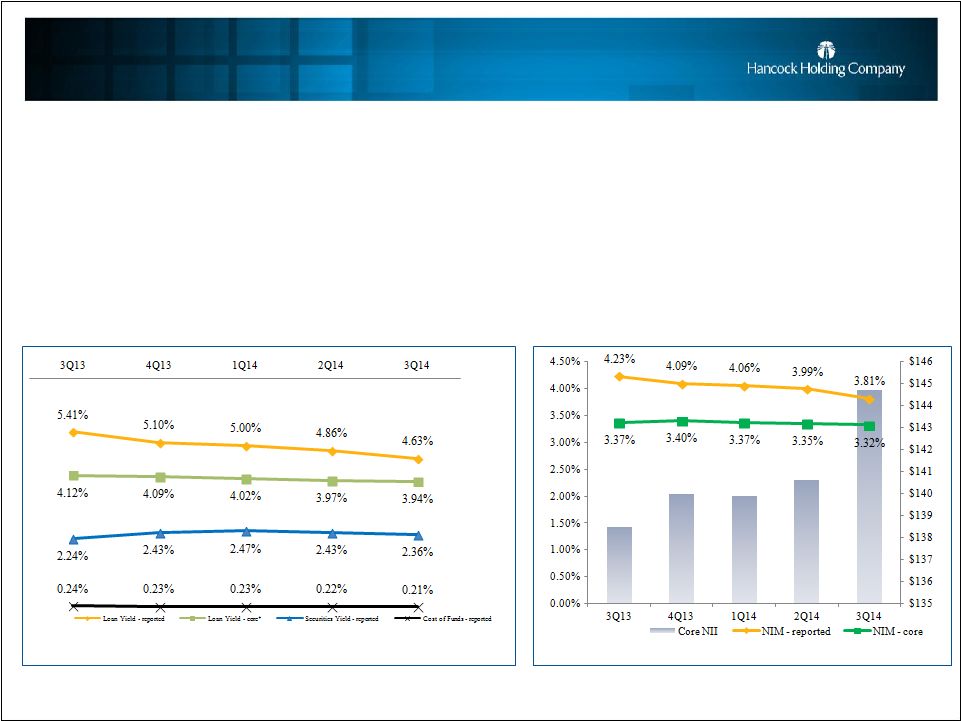
Net interest income (TE) for the third quarter of 2014 was $166.2 million, down $1.1 million from the second quarter of 2014. The impact of purchase accounting items on net interest income was $21.5 million, down $5.2 million linked-quarter. Excluding the impact from purchase accounting items, core net interest income increased $4.1 million linked-quarter. Average earning assets were $17.3 billion for the third quarter of 2014, up $533 million, or 3%, from the second quarter of 2014.
The reported net interest margin (TE) was 3.81% for the third quarter of 2014, down 18 bps from the second quarter of 2014. The core net interest margin (reported net interest income (TE) excluding total net purchase accounting adjustments, annualized, as a percent of average earning assets) declined 3 bps to 3.32% during the third quarter of 2014. Declines in the core loan yield (-3 bps) and securities portfolio yield (-7 bps) were partly offset by an improved earning asset mix and a lower cost of funds (-1 bp).
Noninterest Income
Noninterest income, including securities transactions, totaled $57.9 million for the third quarter of 2014, up $1.5 million, or 3%, from the second quarter of 2014. Included in the total is a reduction of $2.8 million related to the amortization of the indemnification asset, compared to a reduction of $3.3 million in the second quarter of 2014. Excluding the impact of this item, core noninterest income increased by approximately $1.0 million linked-quarter.
3
Hancock reports third quarter 2014 financial results
October 23, 2014
Service charges on deposits totaled $20.0 million for the third quarter of 2014, up $0.7 million, or 4%, from the second quarter of 2014. Bank card and ATM fees totaled $11.6 million, virtually unchanged from the second quarter of 2014.
Investment and annuity fees totaled $5.5 million, up $0.4 million, or 8%, linked-quarter. Trust fees totaled $11.5 million, unchanged from the second quarter of 2014.
Fees from secondary mortgage operations totaled $2.3 million for the third quarter of 2014, up $0.6 million, or 32%, linked-quarter. A slightly higher percentage of the mortgage loans originated during the quarter were sold in the secondary market compared to the second quarter of 2014.
Other noninterest income totaled $7.7 million, down $.9 million, or 10%, from $8.6 million in the second quarter of 2014. The decline reflects the impact from $0.5 million of additional miscellaneous income in the second quarter of 2014.
Noninterest Expense & Taxes
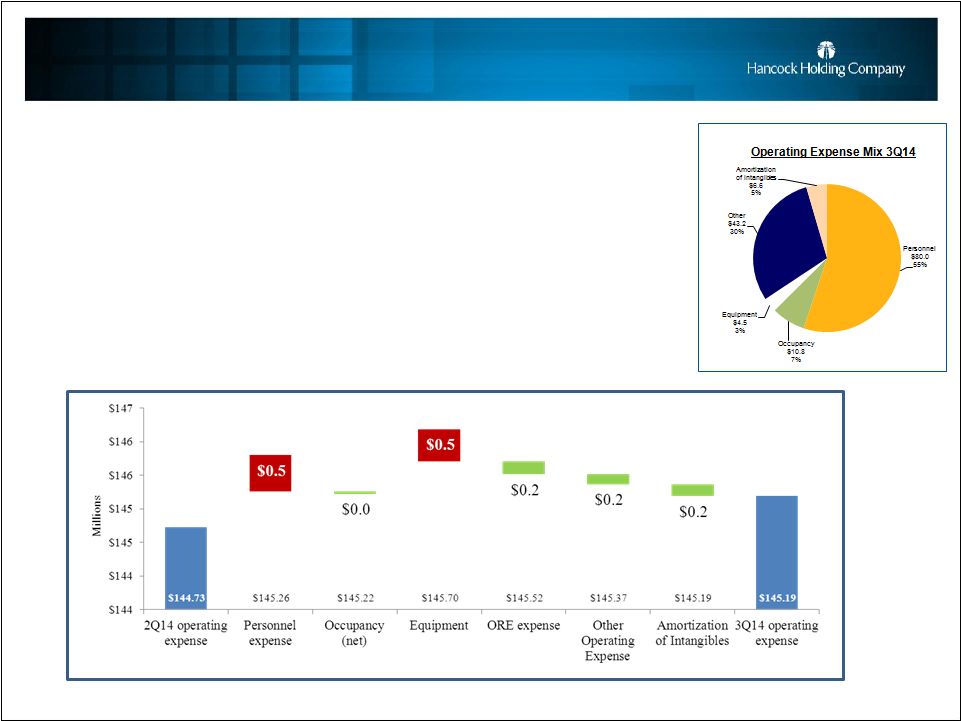
Noninterest expense for the third quarter of 2014 totaled $149.1 million and included $3.9 million of nonoperating expenses. The nonoperating expenses were mainly related to the Company’s ongoing expense and efficiency initiative. Excluding these costs, operating expense totaled $145.2 million in the third quarter of 2014, up $0.5 million, or less than 1%, linked-quarter. (The details of the changes in the noninterest expense categories noted below exclude the impact of nonoperating items.)
Total personnel expense was $80.0 million in the third quarter of 2014, up $0.5 million, or less than 1%, from the second quarter of 2014. Occupancy and equipment expense totaled $15.3 million in the third quarter of 2014, up $0.4 million, or 3%, from the second quarter of 2014.
Net gains on ORE dispositions exceeded ORE expense in the third quarter of 2014 by $104,000, compared to $84,000 of net expense in the second quarter of 2014. Management does not expect this low level of ORE expense to be sustainable in future quarters.
Other operating expense totaled $43.3 million in the third quarter of 2014, virtually unchanged from the second quarter of 2014.
The effective income tax rate for the third quarter of 2014 was 26%, down from 31% in the second quarter of 2014. The second quarter’s higher rate included certain nonoperating items noted last quarter primarily related to the divestiture of selected insurance lines of business. Management expects the effective income tax rate to approximate 27% for the remainder of 2014. The effective income tax rate continues to be less than the statutory rate of 35% due primarily to tax-exempt income and tax credits.
4
Hancock reports third quarter 2014 financial results
October 23, 2014
Capital
Common shareholders’ equity at September 30, 2014 totaled $2.5 billion. The tangible common equity (TCE) ratio was 9.10%, down 19 bps from June 30, 2014. The decline in the TCE ratio reflects organic growth in the balance sheet and the repurchase of common shares during the quarter. Assets totaled $20 billion at September 30, 2014, up $637 million from June 30, 2014. In July of 2014, the Board of Directors authorized a new common stock repurchase program for up to 5%, or approximately 4 million shares, of the Company’s common stock. During the third quarter, the Company repurchased 305,263 shares of its common stock at an average price of $32.65. Shares may be repurchased in the open market or in privately negotiated transactions from time to time, depending upon market conditions and other factors, and in accordance with applicable regulations of the Securities and Exchange Commission. The repurchase authorization will expire December 31, 2015. Additional capital ratios are included in the financial tables.
Conference Call and Slide Presentation
Management will host a conference call for analysts and investors at 9:00 a.m. Central Time on Friday, October 24, 2014 to review the results. A live listen-only webcast of the call will be available under the Investor Relations section of Hancock’s website atwww.hancockbank.com. Additional financial tables and a slide presentation related to third quarter results are also posted as part of the webcast link. To participate in the Q&A portion of the call, dial (877) 564-1219 or (973) 638-3429. An audio archive of the conference call will be available under the Investor Relations section of our website. A replay of the call will also be available through October 31, 2014 by dialing (855) 859-2056 or (404) 537-3406, passcode 13265311.
About Hancock Holding Company
Hancock Holding Company is a financial services company with regional business headquarters and locations throughout a growing Gulf South corridor. The company’s banking subsidiary provides a comprehensive network of full-service financial choices through Hancock Bank locations in Mississippi, Alabama, and Florida and Whitney Bank offices in Louisiana and Texas, including traditional and online banking; commercial and small business banking; energy banking; private banking; trust and investment services; certain insurance services; mortgage services; and consumer financing. More information and online banking are available atwww.hancockbank.com andwww.whitneybank.com.
Forward-Looking Statements
This news release contains “forward-looking statements” within the meaning of section 27A of the Securities Act of 1933, as amended, and section 21E of the Securities Exchange Act of 1934, as amended, and we intend such forward-looking statements to be covered by the safe harbor provisions therein and are including this statement for purposes of invoking these safe-harbor provisions. Forward-looking statements provide projections of results of operations or of financial condition or state other forward-looking information, such as expectations about future conditions and descriptions of plans and strategies for the future.Forward-looking statements that we may make include, but may not be limited to, comments with respect to future levels of economic activity in our markets, loan growth, deposit trends, credit quality trends, net interest margin trends, future expense levels, success of revenue-generating initiatives, projected tax rates, future profitability, improvements in expense to revenue (efficiency) ratio, purchase accounting impacts such as accretion levels, the impact of the branch rationalization process, details of the common stock buyback, possible repurchases of shares under stock buyback programs, and the financial impact of regulatory requirements. Hancock’s ability to accurately project results or predict the effects of future plans or strategies is inherently limited. Although Hancock believes that the expectations reflected in its forward-looking statements are based on reasonable assumptions, actual results and performance could differ materially from those set forth in the forward-looking
5
Hancock reports third quarter 2014 financial results
October 23, 2014
statements. Factors that could cause actual results to differ from those expressed in Hancock’s forward-looking statements include, but are not limited to, those risk factors outlined in Hancock’s public filings with the Securities and Exchange Commission, which are available at the SEC’s internet site (http://www.sec.gov).
You are cautioned not to place undue reliance on these forward-looking statements. Hancock does not intend, and undertakes no obligation, to update or revise any forward-looking statements, whether as a result of differences in actual results, changes in assumptions or changes in other factors affecting such statements, except as required by law.
6
HANCOCK HOLDING COMPANY
FINANCIAL HIGHLIGHTS
(Unaudited)
| | | | | | | | | | | | | | | | | | | | |
| | | Three Months Ended | | | Nine Months Ended | |
(amounts in thousands, except per share data) | | 9/30/2014 | | | 6/30/2014 | | | 9/30/2013 | | | 9/30/2014 | | | 9/30/2013 | |
INCOME STATEMENT DATA | | | | | | | | | | | | | | | | | | | | |
Net interest income | | $ | 163,541 | | | $ | 164,778 | | | $ | 171,530 | | | $ | 493,881 | | | $ | 514,724 | |
Net interest income (TE) (a) | | | 166,230 | | | | 167,332 | | | | 174,112 | | | | 501,759 | | | | 522,675 | |
Provision for loan losses | | | 9,468 | | | | 6,691 | | | | 7,569 | | | | 24,122 | | | | 25,404 | |
Noninterest income excluding securities transactions | | | 57,941 | | | | 56,398 | | | | 63,057 | | | | 171,038 | | | | 187,141 | |
Securities transactions gains | | | — | | | | — | | | | — | | | | — | | | | — | |
Noninterest expense (excluding nonoperating expense items) | | | 145,192 | | | | 144,727 | | | | 161,318 | | | | 436,901 | | | | 483,170 | |
Nonoperating expense items | | | 3,887 | | | | 12,131 | | | | 20,887 | | | | 16,018 | | | | 20,887 | |
Net income | | | 46,553 | | | | 39,962 | | | | 33,202 | | | | 135,630 | | | | 128,640 | |
Operating income (b) | | | 49,079 | | | | 49,575 | | | | 46,779 | | | | 147,769 | | | | 142,217 | |
Core income (c) | | | 41,176 | | | | 38,736 | | | | 28,678 | | | | 117,654 | | | | 88,253 | |
| | | | | | | | | | | | | | | | | | | | �� |
PERIOD-END BALANCE SHEET DATA | | | | | | | | | | | | | | | | | | | | |
Loans | | $ | 13,348,574 | | | $ | 12,884,056 | | | $ | 11,734,472 | | | $ | 13,348,574 | | | $ | 11,734,472 | |
Investment securities | | | 3,913,370 | | | | 3,677,229 | | | | 4,124,202 | | | | 3,913,370 | | | | 4,124,202 | |
Earning assets | | | 17,748,600 | | | | 17,023,990 | | | | 16,339,431 | | | | 17,748,600 | | | | 16,339,431 | |
Total assets | | | 19,985,950 | | | | 19,349,431 | | | | 18,801,846 | | | | 19,985,950 | | | | 18,801,846 | |
Noninterest-bearing deposits | | | 5,866,255 | | | | 5,723,663 | | | | 5,479,696 | | | | 5,866,255 | | | | 5,479,696 | |
Total deposits | | | 15,736,694 | | | | 15,245,227 | | | | 15,054,871 | | | | 15,736,694 | | | | 15,054,871 | |
Common shareholders’ equity | | | 2,509,342 | | | | 2,492,582 | | | | 2,356,442 | | | | 2,509,342 | | | | 2,356,442 | |
| | | | | | | | | | | | | | | | | | | | |
AVERAGE BALANCE SHEET DATA | | | | | | | | | | | | | | | | | | | | |
Loans | | $ | 13,102,108 | | | $ | 12,680,861 | | | $ | 11,805,330 | | | $ | 12,723,409 | | | $ | 11,632,166 | |
Investment securities (d) | | | 3,780,089 | | | | 3,716,563 | | | | 4,135,348 | | | | 3,810,186 | | | | 4,163,436 | |
Earning assets | | | 17,324,444 | | | | 16,791,744 | | | | 16,384,635 | | | | 16,954,320 | | | | 16,467,030 | |
Total assets | | | 19,549,947 | | | | 19,039,264 | | | | 18,796,027 | | | | 19,216,585 | | | | 18,989,197 | |
Noninterest-bearing deposits | | | 5,707,523 | | | | 5,505,735 | | | | 5,415,303 | | | | 5,571,843 | | | | 5,359,325 | |
Total deposits | | | 15,371,209 | | | | 15,060,581 | | | | 15,021,685 | | | | 15,234,018 | | | | 15,180,847 | |
Common shareholders’ equity | | | 2,489,948 | | | | 2,463,385 | | | | 2,338,945 | | | | 2,463,302 | | | | 2,396,941 | |
| | | | | | | | | | | | | | | | | | | | |
COMMON SHARE DATA | | | | | | | | | | | | | | | | | | | | |
Earnings per share - diluted | | $ | 0.56 | | | $ | 0.48 | | | $ | 0.40 | | | $ | 1.62 | | | $ | 1.51 | |
Operating earnings per share - diluted (b) | | | 0.59 | | | | 0.59 | | | | 0.56 | | | | 1.76 | | | | 1.67 | |
Core earnings per share - diluted (c) | | | 0.49 | | | | 0.46 | | | | 0.34 | | | | 1.40 | | | | 1.04 | |
Cash dividends per share | | $ | 0.24 | | | $ | 0.24 | | | $ | 0.24 | | | $ | 0.72 | | | $ | 0.72 | |
Book value per share (period-end) | | $ | 30.76 | | | $ | 30.45 | | | $ | 28.70 | | | $ | 30.76 | | | $ | 28.70 | |
Tangible book value per share (period-end) | | | 21.44 | | | | 21.08 | | | | 19.04 | | | | 21.44 | | | | 19.04 | |
Weighted average number of shares - diluted | | | 81,942 | | | | 82,174 | | | | 82,205 | | | | 82,204 | | | | 83,496 | |
Market data | | | | | | | | | | | | | | | | | | | | |
High sales price | | $ | 36.47 | | | $ | 37.86 | | | $ | 33.85 | | | $ | 38.50 | | | $ | 33.85 | |
Low sales price | | | 31.25 | | | | 32.02 | | | | 29.00 | | | | 31.25 | | | | 25.00 | |
Period-end closing price | | | 32.05 | | | | 35.32 | | | | 31.38 | | | | 32.05 | | | | 31.38 | |
Trading volume | | | 25,553 | | | | 27,432 | | | | 29,711 | | | | 84,239 | | | | 97,779 | |
| | | | | | | | | | | | | | | | | | | | |
PERFORMANCE RATIOS | | | | | | | | | | | | | | | | | | | | |
Return on average assets | | | 0.94 | % | | | 0.84 | % | | | 0.70 | % | | | 0.94 | % | | | 0.91 | % |
Return on average assets (operating) (b) | | | 1.00 | % | | | 1.04 | % | | | 0.99 | % | | | 1.03 | % | | | 1.00 | % |
Return on average common equity | | | 7.42 | % | | | 6.51 | % | | | 5.63 | % | | | 7.36 | % | | | 7.18 | % |
Return on average common equity (operating) (b) | | | 7.82 | % | | | 8.07 | % | | | 7.93 | % | | | 8.02 | % | | | 7.93 | % |
Return on average tangible common equity | | | 10.70 | % | | | 9.47 | % | | | 8.54 | % | | | 10.72 | % | | | 10.80 | % |
Return on average tangible common equity (operating) (b) | | | 11.28 | % | | | 11.75 | % | | | 12.03 | % | | | 11.68 | % | | | 11.94 | % |
Tangible common equity ratio (e) | | | 9.10 | % | | | 9.29 | % | | | 8.68 | % | | | 9.10 | % | | | 8.68 | % |
Net interest margin (TE) (a) | | | 3.81 | % | | | 3.99 | % | | | 4.23 | % | | | 3.95 | % | | | 4.24 | % |
Average loan/deposit ratio | | | 85.24 | % | | | 84.20 | % | | | 78.70 | % | | | 83.52 | % | | | 76.80 | % |
Efficiency ratio (f) | | | 61.84 | % | | | 61.67 | % | | | 64.95 | % | | | 61.91 | % | | | 64.93 | % |
Allowance for loan losses as a percent of period-end loans | | | 0.94 | % | | | 1.00 | % | | | 1.18 | % | | | 0.94 | % | | | 1.18 | % |
Annualized net charge-offs to average loans | | | 0.19 | % | | | 0.13 | % | | | 0.18 | % | | | 0.15 | % | | | 0.22 | % |
Allowance for loan losses to non-performing loans + accruing loans 90 days past due | | | 128.44 | % | | | 126.26 | % | | | 94.69 | % | | | 128.44 | % | | | 94.69 | % |
Noninterest income excluding securities transactions as a percent of total revenue (TE) (a) | | | 25.85 | % | | | 25.21 | % | | | 26.59 | % | | | 25.42 | % | | | 26.36 | % |
| (a) | Tax-equivalent (TE) amounts are calculated using a federal income tax rate of 35%. |
| (b) | Net income less tax-effected securities transactions and nonoperating expense items. Management believes that operating income provides a useful measure of financial performance that helps investors compare the Company’s fundamental operations over time. |
| (c) | Operating income excluding tax-effected purchase accounting adjustments. Management believes that reporting on core income provides a useful measure of financial performance that helps investors determine whether management is successfully executing its strategic initiatives. |
| (d) | Average securities does not include unrealized holding gains/losses on available for sale securities. |
| (e) | The tangible common equity ratio is common shareholders’ equity less intangible assets divided by total assets less intangible assets. |
| (f) | The efficiency ratio is noninterest expense to total net interest (TE) and noninterest income excluding amortization of purchased intangibles, nonoperating expense items, and securities transactions. |
7
HANCOCK HOLDING COMPANY
QUARTERLY HIGHLIGHTS
(Unaudited)
| | | | | | | | | | | | | | | | | | | | |
| | | Three Months Ended | |
(amounts in thousands, except per share data) | | 9/30/2014 | | | 6/30/2014 | | | 3/31/2014 | | | 12/31/2013 | | | 9/30/2013 | |
INCOME STATEMENT DATA | | | | | | | | | | | | | | | | | | | | |
Net interest income | | $ | 163,541 | | | $ | 164,778 | | | $ | 165,562 | | | $ | 166,007 | | | $ | 171,530 | |
Net interest income (TE) (a) | | | 166,230 | | | | 167,332 | | | | 168,198 | | | | 168,466 | | | | 174,112 | |
Provision for loan losses | | | 9,468 | | | | 6,691 | | | | 7,963 | | | | 7,331 | | | | 7,569 | |
Noninterest income excluding securities transactions | | | 57,941 | | | | 56,398 | | | | 56,699 | | | | 58,894 | | | | 63,057 | |
Securities transactions gains | | | — | | | | — | | | | — | | | | 105 | | | | — | |
Noninterest expense (excluding nonoperating expense items) | | | 145,192 | | | | 144,727 | | | | 146,982 | | | | 157,097 | | | | 161,318 | |
Nonoperating expense items | | | 3,887 | | | | 12,131 | | | | — | | | | 17,116 | | | | 20,887 | |
Net income | | | 46,553 | | | | 39,962 | | | | 49,115 | | | | 34,716 | | | | 33,202 | |
Operating income (b) | | | 49,079 | | | | 49,575 | | | | 49,115 | | | | 45,773 | | | | 46,779 | |
Core income (c) | | | 41,176 | | | | 38,736 | | | | 37,742 | | | | 32,847 | | | | 28,678 | |
| | | | | | | | | | | | | | | | | | | | |
PERIOD-END BALANCE SHEET DATA | | | | | | | | | | | | | | | | | | | | |
Loans | | $ | 13,348,574 | | | $ | 12,884,056 | | | $ | 12,527,937 | | | $ | 12,324,817 | | | $ | 11,734,472 | |
Investment securities | | | 3,913,370 | | | | 3,677,229 | | | | 3,797,883 | | | | 4,033,124 | | | | 4,124,202 | |
Earning assets | | | 17,748,600 | | | | 17,023,990 | | | | 16,622,104 | | | | 16,651,295 | | | | 16,339,431 | |
Total assets | | | 19,985,950 | | | | 19,349,431 | | | | 19,004,170 | | | | 19,009,251 | | | | 18,801,846 | |
Noninterest-bearing deposits | | | 5,866,255 | | | | 5,723,663 | | | | 5,613,872 | | | | 5,530,253 | | | | 5,479,696 | |
Total deposits | | | 15,736,694 | | | | 15,245,227 | | | | 15,274,774 | | | | 15,360,516 | | | | 15,054,871 | |
Common shareholders’ equity | | | 2,509,342 | | | | 2,492,582 | | | | 2,462,534 | | | | 2,425,069 | | | | 2,356,442 | |
| | | | | | | | | | | | | | | | | | | | |
AVERAGE BALANCE SHEET DATA | | | | | | | | | | | | | | | | | | | | |
Loans | | $ | 13,102,108 | | | $ | 12,680,861 | | | $ | 12,379,316 | | | $ | 11,903,603 | | | $ | 11,805,330 | |
Investment securities (d) | | | 3,780,089 | | | | 3,716,563 | | | | 3,935,616 | | | | 4,070,657 | | | | 4,135,348 | |
Earning assets | | | 17,324,444 | | | | 16,791,744 | | | | 16,740,353 | | | | 16,376,587 | | | | 16,384,635 | |
Total assets | | | 19,549,947 | | | | 19,039,264 | | | | 19,055,107 | | | | 18,739,091 | | | | 18,796,027 | |
Noninterest-bearing deposits | | | 5,707,523 | | | | 5,505,735 | | | | 5,499,993 | | | | 5,483,918 | | | | 5,415,303 | |
Total deposits | | | 15,371,209 | | | | 15,060,581 | | | | 15,269,143 | | | | 14,915,677 | | | | 15,021,685 | |
Common shareholders’ equity | | | 2,489,948 | | | | 2,463,385 | | | | 2,435,980 | | | | 2,355,768 | | | | 2,338,945 | |
| | | | | | | | | | | | | | | | | | | | |
COMMON SHARE DATA | | | | | | | | | | | | | | | | | | | | |
Earnings per share - diluted | | $ | 0.56 | | | $ | 0.48 | | | $ | 0.58 | | | $ | 0.41 | | | $ | 0.40 | |
Operating earnings per share - diluted (b) | | | 0.59 | | | | 0.59 | | | | 0.58 | | | | 0.55 | | | | 0.56 | |
Core earnings per share - diluted (c) | | | 0.49 | | | | 0.46 | | | | 0.45 | | | | 0.39 | | | | 0.34 | |
Cash dividends per share | | $ | 0.24 | | | $ | 0.24 | | | $ | 0.24 | | | $ | 0.24 | | | $ | 0.24 | |
Book value per share (period-end) | | $ | 30.76 | | | $ | 30.45 | | | $ | 29.93 | | | $ | 29.49 | | | $ | 28.70 | |
Tangible book value per share (period-end) | | | 21.44 | | | | 21.08 | | | | 20.47 | | | | 19.94 | | | | 19.04 | |
Weighted average number of shares - diluted | | | 81,942 | | | | 82,174 | | | | 82,534 | | | | 82,220 | | | | 82,205 | |
Market data | | | | | | | | | | | | | | | | | | | | |
High sales price | | $ | 36.47 | | | $ | 37.86 | | | $ | 38.50 | | | $ | 37.12 | | | $ | 33.85 | |
Low sales price | | | 31.25 | | | | 32.02 | | | | 32.66 | | | | 30.09 | | | | 29.00 | |
Period-end closing price | | | 32.05 | | | | 35.32 | | | | 36.65 | | | | 36.68 | | | | 31.38 | |
Trading volume | | | 25,553 | | | | 27,432 | | | | 31,328 | | | | 27,816 | | | | 29,711 | |
| | | | | | | | | | | | | | | | | | | | |
PERFORMANCE RATIOS | | | | | | | | | | | | | | | | | | | | |
Return on average assets | | | 0.94 | % | | | 0.84 | % | | | 1.05 | % | | | 0.74 | % | | | 0.70 | % |
Return on average assets (operating) (b) | | | 1.00 | % | | | 1.04 | % | | | 1.05 | % | | | 0.97 | % | | | 0.99 | % |
Return on average common equity | | | 7.42 | % | | | 6.51 | % | | | 8.18 | % | | | 5.85 | % | | | 5.63 | % |
Return on average common equity (operating) (b) | | | 7.82 | % | | | 8.07 | % | | | 8.18 | % | | | 7.71 | % | | | 7.93 | % |
Return on average tangible common equity | | | 10.70 | % | | | 9.47 | % | | | 12.04 | % | | | 8.79 | % | | | 8.54 | % |
Return on average tangible common equity (operating) (b) | | | 11.28 | % | | | 11.75 | % | | | 12.04 | % | | | 11.59 | % | | | 12.03 | % |
Tangible common equity ratio (e) | | | 9.10 | % | | | 9.29 | % | | | 9.24 | % | | | 9.00 | % | | | 8.68 | % |
Net interest margin (TE) (a) | | | 3.81 | % | | | 3.99 | % | | | 4.06 | % | | | 4.09 | % | | | 4.23 | % |
Average loan/deposit ratio | | | 85.24 | % | | | 84.20 | % | | | 81.20 | % | | | 79.93 | % | | | 78.70 | % |
Efficiency ratio (f) | | | 61.84 | % | | | 61.67 | % | | | 62.23 | % | | | 65.94 | % | | | 64.95 | % |
Allowance for loan losses as a percent of period-end loans | | | 0.94 | % | | | 1.00 | % | | | 1.02 | % | | | 1.08 | % | | | 1.18 | % |
Annualized net charge-offs to average loans | | | 0.19 | % | | | 0.13 | % | | | 0.13 | % | | | 0.17 | % | | | 0.18 | % |
Allowance for loan losses to non-performing loans + accruing loans 90 days past due | | | 128.44 | % | | | 126.26 | % | | | 112.64 | % | | | 111.97 | % | | | 94.69 | % |
Noninterest income excluding securities transactions as a percent of total revenue (TE) (a) | | | 25.85 | % | | | 25.21 | % | | | 25.21 | % | | | 25.90 | % | | | 26.59 | % |
| (a) | Tax-equivalent (TE) amounts are calculated using a federal income tax rate of 35%. |
| (b) | Net income less tax-effected securities transactions and nonoperating expense items. Management believes that operating income provides a useful measure of financial performance that helps investors compare the Company’s fundamental operations over time. |
| (c) | Operating income excluding tax-effected purchase accounting adjustments. Management believes that reporting on core income provides a useful measure of financial performance that helps investors determine whether management is successfully executing its strategic initiatives. |
| (d) | Average securities does not include unrealized holding gains/losses on available for sale securities. |
| (e) | The tangible common equity ratio is common shareholders’ equity less intangible assets divided by total assets less intangible assets. |
| (f) | The efficiency ratio is noninterest expense to total net interest (TE) and noninterest income excluding amortization of purchased intangibles, nonoperating expense items, and securities transactions. |
8
HANCOCK HOLDING COMPANY
INCOME STATEMENT
(Unaudited)
| | | | | | | | | | | | | | | | | | | | |
| | | Three Months Ended | | | Nine Months Ended | |
(dollars in thousands, except per share data) | | 9/30/2014 | | | 6/30/2014 | | | 9/30/2013 | | | 9/30/2014 | | | 9/30/2013 | |
NET INCOME | | | | | | | | | | | | | | | | |
Interest income | | $ | 172,701 | | | $ | 174,001 | | | $ | 181,639 | | | $ | 521,842 | | | $ | 546,560 | |
Interest income (TE) | | | 175,390 | | | | 176,555 | | | | 184,221 | | | | 529,720 | | | | 554,511 | |
Interest expense | | | 9,160 | | | | 9,223 | | | | 10,109 | | | | 27,961 | | | | 31,836 | |
| | | | | | | | | | | | | | | | | | | | |
Net interest income (TE) | | | 166,230 | | | | 167,332 | | | | 174,112 | | | | 501,759 | | | | 522,675 | |
Provision for loan losses | | | 9,468 | | | | 6,691 | | | | 7,569 | | | | 24,122 | | | | 25,404 | |
Noninterest income excluding securities transactions | | | 57,941 | | | | 56,398 | | | | 63,057 | | | | 171,038 | | | | 187,141 | |
Securities transactions gains | | | — | | | | — | | | | — | | | | — | | | | — | |
Noninterest expense | | | 149,079 | | | | 156,858 | | | | 182,205 | | | | 452,919 | | | | 504,057 | |
| | | | | | | | | | | | | | | | | | | | |
Income before income taxes | | | 62,935 | | | | 57,627 | | | | 44,813 | | | | 187,878 | | | | 172,404 | |
Income tax expense | | | 16,382 | | | | 17,665 | | | | 11,611 | | | | 52,248 | | | | 43,764 | |
| | | | | | | | | | | | | | | | | | | | |
Net income | | $ | 46,553 | | | $ | 39,962 | | | $ | 33,202 | | | $ | 135,630 | | | $ | 128,640 | |
| | | | | | | | | | | | | | | | | | | | |
ADJUSTMENTS FROM NET TO OPERATING INCOME | | | | | | | | | | | | | | | | |
Securities transactions gains | | | — | | | | — | | | | — | | | | — | | | | — | |
Nonoperating expense items | | | | | | | | | | | | | | | | |
Impact of insurance business lines divestiture | | | — | | | | (9,101 | ) | | | — | | | | (9,101 | ) | | | — | |
FDIC settlement | | | — | | | | 10,268 | | | | — | | | | 10,268 | | | | — | |
Expense and efficiency initiatives and other items | | | 3,887 | | | | 7,503 | | | | 20,887 | | | | 11,390 | | | | 20,887 | |
Early debt redemption | | | — | | | | 3,461 | | | | — | | | | 3,461 | | | | — | |
| | | | | | | | | | | | | | | | | | | | |
Total nonoperating expense items | | | 3,887 | | | | 12,131 | | | | 20,887 | | | | 16,018 | | | | 20,887 | |
Taxes on adjustments at marginal tax rate | | | 1,361 | | | | 2,518 | | | | 7,310 | | | | 3,879 | | | | 7,310 | |
| | | | | | | | | | | | | | | | | | | | |
Total adjustments (net of taxes) | | | 2,526 | | | | 9,613 | | | | 13,577 | | | | 12,139 | | | | 13,577 | |
| | | | | | | | | | | | | | | | | | | | |
Operating income (g) | | $ | 49,079 | | | $ | 49,575 | | | $ | 46,779 | | | $ | 147,769 | | | $ | 142,217 | |
| | | | | | | | | | | | | | | | | | | | |
Purchase accounting adjustments (net of taxes) | | | 7,903 | | | | 10,839 | | | | 18,101 | | | | 30,115 | | | | 53,964 | |
| | | | | | | | | | | | | | | | | | | | |
Core income (h) | | $ | 41,176 | | | $ | 38,736 | | | $ | 28,678 | | | $ | 117,654 | | | $ | 88,253 | |
| | | | | | | | | | | | | | | | | | | | |
NONINTEREST INCOME AND NONINTEREST EXPENSE | | | | | | | | | | | | | | | | |
Service charges on deposit accounts | | $ | 20,000 | | | $ | 19,269 | | | $ | 20,519 | | | $ | 57,981 | | | $ | 59,398 | |
Trust fees | | | 11,530 | | | | 11,499 | | | | 9,477 | | | | 33,267 | | | | 27,972 | |
Bank card and ATM fees | | | 11,641 | | | | 11,596 | | | | 12,221 | | | | 33,806 | | | | 34,678 | |
Investment & annuity fees | | | 5,506 | | | | 5,097 | | | | 5,186 | | | | 15,555 | | | | 14,955 | |
Secondary mortgage market operations | | | 2,313 | | | | 1,758 | | | | 2,467 | | | | 6,036 | | | | 10,989 | |
Insurance fees | | | 1,979 | | | | 1,888 | | | | 3,661 | | | | 7,611 | | | | 12,500 | |
Amortization of FDIC loss share receivable | | | (2,760 | ) | | | (3,321 | ) | | | (590 | ) | | | (9,989 | ) | | | (590 | ) |
Other income | | | 7,732 | | | | 8,612 | | | | 10,116 | | | | 26,771 | | | | 27,239 | |
| | | | | | | | | | | | | | | | | | | | |
Noninterest income excluding securities transactions | | | 57,941 | | | | 56,398 | | | | 63,057 | | | | 171,038 | | | | 187,141 | |
Securities transactions gains | | | — | | | | — | | | | — | | | | — | | | | — | |
| | | | | | | | | | | | | | | | | | | | |
Total noninterest income including securities transactions | | $ | 57,941 | | | $ | 56,398 | | | $ | 63,057 | | | $ | 171,038 | | | $ | 187,141 | |
| | | | | | | | | | | | | | | | | | | | |
Personnel expense | | $ | 80,043 | | | $ | 79,506 | | | $ | 86,850 | | | $ | 240,981 | | | $ | 262,372 | |
Occupancy expense (net) | | | 10,798 | | | | 10,840 | | | | 12,369 | | | | 32,905 | | | | 37,099 | |
Equipment expense | | | 4,542 | | | | 4,059 | | | | 5,120 | | | | 12,875 | | | | 15,340 | |
Other real estate owned expense (net) | | | (104 | ) | | | 84 | | | | 2,439 | | | | 1,757 | | | | 6,502 | |
Other operating expense | | | 43,343 | | | | 43,494 | | | | 47,234 | | | | 128,031 | | | | 139,565 | |
Amortization of intangibles | | | 6,570 | | | | 6,744 | | | | 7,306 | | | | 20,352 | | | | 22,292 | |
| | | | | | | | | | | | | | | | | | | | |
Total operating expense | | | 145,192 | | | | 144,727 | | | | 161,318 | | | | 436,901 | | | | 483,170 | |
Nonoperating expense items | | | 3,887 | | | | 12,131 | | | | 20,887 | | | | 16,018 | | | | 20,887 | |
| | | | | | | | | | | | | | | | | | | | |
Total noninterest expense | | $ | 149,079 | | | $ | 156,858 | | | $ | 182,205 | | | $ | 452,919 | | | $ | 504,057 | |
| | | | | | | | | | | | | | | | | | | | |
COMMON SHARE DATA | | | | | | | | | | | | | | | | |
Earnings per share: | | | | | | | | | | | | | | | | |
Basic | | $ | 0.56 | | | $ | 0.48 | | | $ | 0.40 | | | $ | 1.62 | | | $ | 1.51 | |
Diluted | | | 0.56 | | | | 0.48 | | | | 0.40 | | | | 1.62 | | | | 1.51 | |
Operating earnings per share: | | | | | | | | | | | | | | | | |
Basic | | $ | 0.59 | | | $ | 0.59 | | | $ | 0.56 | | | $ | 1.77 | | | $ | 1.67 | |
Diluted | | | 0.59 | | | | 0.59 | | | | 0.56 | | | | 1.76 | | | | 1.67 | |
Core earnings per share: | | | | | | | | | | | | | | | | |
Basic | | $ | 0.49 | | | $ | 0.46 | | | $ | 0.34 | | | | 1.40 | | | $ | 1.04 | |
Diluted | | | 0.49 | | | $ | 0.46 | | | $ | 0.34 | | | | 1.40 | | | $ | 1.04 | |
| (g) | Net income less tax-effected securities transactions and nonoperating expense items. Management believes that operating income provides a useful measure of financial performance that helps investors compare the Company’s fundamental operations over time. |
| (h) | Operating income excluding tax-effected purchase accounting adjustments. Management believes that reporting on core income provides a useful measure of financial performance that helps investors determine whether management is successfully executing its strategic initiatives. |
9
HANCOCK HOLDING COMPANY
INCOME STATEMENT
(Unaudited)
| | | | | | | | | | | | | | | | | | | | |
| | | Three months ended | |
(dollars in thousands) | | 9/30/2014 | | | 6/30/2014 | | | 3/31/2014 | | | 12/31/2013 | | | 9/30/2013 | |
Interest income | | $ | 172,701 | | | $ | 174,001 | | | $ | 175,140 | | | $ | 175,650 | | | $ | 181,639 | |
Interest income (TE) | | | 175,390 | | | | 176,555 | | | | 177,776 | | | | 178,109 | | | | 184,221 | |
Interest expense | | | 9,160 | | | | 9,223 | | | | 9,578 | | | | 9,643 | | | | 10,109 | |
| | | | | | | | | | | | | | | | | | | | |
Net interest income (TE) | | | 166,230 | | | | 167,332 | | | | 168,198 | | | | 168,466 | | | | 174,112 | |
Provision for loan losses | | | 9,468 | | | | 6,691 | | | | 7,963 | | | | 7,331 | | | | 7,569 | |
Noninterest income excluding securities transactions | | | 57,941 | | | | 56,398 | | | | 56,699 | | | | 58,894 | | | | 63,057 | |
Securities transactions gains | | | — | | | | — | | | | — | | | | 105 | | | | — | |
Noninterest expense | | | 149,079 | | | | 156,858 | | | | 146,982 | | | | 174,213 | | | | 182,205 | |
| | | | | | | | | | | | | | | | | | | | |
Income before income taxes | | | 62,935 | | | | 57,627 | | | | 67,316 | | | | 43,462 | | | | 44,813 | |
Income tax expense | | | 16,382 | | | | 17,665 | | | | 18,201 | | | | 8,746 | | | | 11,611 | |
| | | | | | | | | | | | | | | | | | | | |
Net income | | $ | 46,553 | | | $ | 39,962 | | | $ | 49,115 | | | $ | 34,716 | | | $ | 33,202 | |
| | | | | | | | | | | | | | | | | | | | |
ADJUSTMENTS FROM NET TO OPERATING INCOME | | | | | | | | | | | | | | | | |
Securities transactions gains | | | — | | | | — | | | | — | | | | 105 | | | | — | |
Total nonoperating expense items | | | 3,887 | | | | 12,131 | | | | — | | | | 17,116 | | | | 20,887 | |
Taxes on adjustments at marginal tax rate | | | 1,361 | | | | 2,518 | | | | — | | | | 5,954 | | | | 7,310 | |
| | | | | | | | | | | | | | | | | | | | |
Adjustments (net of taxes) | | | 2,526 | | | | 9,613 | | | | — | | | | 11,057 | | | | 13,577 | |
| | | | | | | | | | | | | | | | | | | | |
Operating income (g) | | $ | 49,079 | | | $ | 49,575 | | | $ | 49,115 | | | $ | 45,773 | | | $ | 46,779 | |
| | | | | | | | | | | | | | | | | | | | |
Core income (h) | | $ | 41,176 | | | $ | 38,736 | | | $ | 37,742 | | | $ | 32,847 | | | $ | 28,678 | |
| | | | | | | | | | | | | | | | | | | | |
NONINTEREST INCOME AND NONINTEREST EXPENSE | | | | | | | | | | | | | | | | |
Service charges on deposit accounts | | $ | 20,000 | | | $ | 19,269 | | | $ | 18,712 | | | $ | 19,605 | | | $ | 20,519 | |
Trust fees | | | 11,530 | | | | 11,499 | | | | 10,238 | | | | 10,214 | | | | 9,477 | |
Bank card and ATM fees | | | 11,641 | | | | 11,596 | | | | 10,569 | | | | 11,261 | | | | 12,221 | |
Investment & annuity fees | | | 5,506 | | | | 5,097 | | | | 4,952 | | | | 4,619 | | | | 5,186 | |
Secondary mortgage market operations | | | 2,313 | | | | 1,758 | | | | 1,965 | | | | 1,554 | | | | 2,467 | |
Insurance fees | | | 1,979 | | | | 1,888 | | | | 3,744 | | | | 3,304 | | | | 3,661 | |
Amortization of FDIC loss share receivable | | | (2,760 | ) | | | (3,321 | ) | | | (3,908 | ) | | | (1,649 | ) | | | (590 | ) |
Other income | | | 7,732 | | | | 8,612 | | | | 10,427 | | | | 9,986 | | | | 10,116 | |
| | | | | | | | | | | | | | | | | | | | |
Noninterest income excluding securities transactions | | | 57,941 | | | | 56,398 | | | | 56,699 | | | | 58,894 | | | | 63,057 | |
Securities transactions gains | | | — | | | | — | | | | — | | | | 105 | | | | — | |
| | | | | | | | | | | | | | | | | | | | |
Total noninterest income including securities transactions | | $ | 57,941 | | | $ | 56,398 | | | $ | 56,699 | | | $ | 58,999 | | | $ | 63,057 | |
| | | | | | | | | | | | | | | | | | | | |
| | | | | |
Personnel expense | | $ | 80,043 | | | $ | 79,506 | | | $ | 81,432 | | | $ | 84,912 | | | $ | 86,850 | |
Occupancy expense (net) | | | 10,798 | | | | 10,840 | | | | 11,266 | | | | 11,613 | | | | 12,369 | |
Equipment expense | | | 4,542 | | | | 4,059 | | | | 4,274 | | | | 4,679 | | | | 5,120 | |
Other real estate owned expense (net) | | | (104 | ) | | | 84 | | | | 1,777 | | | | 1,535 | | | | 2,439 | |
Other operating expense | | | 43,343 | | | | 43,494 | | | | 41,195 | | | | 47,180 | | | | 47,234 | |
Amortization of intangibles | | | 6,570 | | | | 6,744 | | | | 7,038 | | | | 7,178 | | | | 7,306 | |
| | | | | | | | | | | | | | | | | | | | |
Total operating expense | | | 145,192 | | | | 144,727 | | | | 146,982 | | | | 157,097 | | | | 161,318 | |
Nonoperating expense items | | | 3,887 | | | | 12,131 | | | | — | | | | 17,116 | | | | 20,887 | |
| | | | | | | | | | | | | | | | | | | | |
Total noninterest expense | | $ | 149,079 | | | $ | 156,858 | | | $ | 146,982 | | | $ | 174,213 | | | $ | 182,205 | |
| | | | | | | | | | | | | | | | | | | | |
| (g) | Net income less tax-effected securities transactions and nonoperating expense items. Management believes that operating income provides a useful measure of financial performance that helps investors compare the Company’s fundamental operations over time. |
| (h) | Operating income excluding tax-effected purchase accounting adjustments. Management believes that reporting on core income provides a useful measure of financial performance that helps investors determine whether management is successfully executing its strategic initiatives. |
10
HANCOCK HOLDING COMPANY
PERIOD-END BALANCE SHEET
(Unaudited)
| | | | | | | | | | | | | | | | | | | | |
| | | Three Months Ended | |
(dollars in thousands) | | 9/30/2014 | | | 6/30/2014 | | | 3/31/2014 | | | 12/31/2013 | | | 9/30/2013 | |
ASSETS | | | | | | | | | | | | | | | | | | | | |
Commercial non-real estate loans | | $ | 5,587,137 | | | $ | 5,393,691 | | | $ | 5,198,029 | | | $ | 5,064,224 | | | $ | 4,625,315 | |
Construction and land development loans | | | 1,095,902 | | | | 1,040,656 | | | | 978,798 | | | | 915,541 | | | | 920,408 | |
Commercial real estate loans | | | 3,100,834 | | | | 3,056,263 | | | | 3,069,316 | | | | 3,042,841 | | | | 2,914,969 | |
Residential mortgage loans | | | 1,858,490 | | | | 1,771,271 | | | | 1,720,307 | | | | 1,720,614 | | | | 1,695,197 | |
Consumer loans | | | 1,706,211 | | | | 1,622,175 | | | | 1,561,487 | | | | 1,581,597 | | | | 1,578,583 | |
| | | | | | | | | | | | | | | | | | | | |
Total loans | | | 13,348,574 | | | | 12,884,056 | | | | 12,527,937 | | | | 12,324,817 | | | | 11,734,472 | |
Loans held for sale | | | 15,098 | | | | 22,017 | | | | 15,911 | | | | 24,515 | | | | 18,444 | |
Securities | | | 3,913,370 | | | | 3,677,229 | | | | 3,797,883 | | | | 4,033,124 | | | | 4,124,202 | |
Short-term investments | | | 471,558 | | | | 440,688 | | | | 280,373 | | | | 268,839 | | | | 462,313 | |
| | | | | | | | | | | | | | | | | | | | |
Earning assets | | | 17,748,600 | | | | 17,023,990 | | | | 16,622,104 | | | | 16,651,295 | | | | 16,339,431 | |
Allowance for loan losses | | | (125,572 | ) | | | (128,672 | ) | | | (128,248 | ) | | | (133,626 | ) | | | (138,223 | ) |
Goodwill | | | 621,193 | | | | 621,193 | | | | 625,675 | | | | 625,675 | | | | 625,675 | |
Other intangible assets, net | | | 139,256 | | | | 145,825 | | | | 152,734 | | | | 159,773 | | | | 167,116 | |
Other assets | | | 1,602,473 | | | | 1,687,095 | | | | 1,731,905 | | | | 1,706,134 | | | | 1,807,847 | |
| | | | | | | | | | | | | | | | | | | | |
Total assets | | $ | 19,985,950 | | | $ | 19,349,431 | | | $ | 19,004,170 | | | $ | 19,009,251 | | | $ | 18,801,846 | |
| | | | | | | | | | | | | | | | | | | | |
LIABILITIES | | | | | | | | | | | | | | | | | | | | |
Noninterest-bearing deposits | | $ | 5,866,255 | | | $ | 5,723,663 | | | $ | 5,613,872 | | | $ | 5,530,253 | | | $ | 5,479,696 | |
Interest-bearing transaction and savings deposits | | | 6,325,671 | | | | 6,079,837 | | | | 6,118,150 | | | | 6,162,959 | | | | 6,008,042 | |
Interest-bearing public fund deposits | | | 1,534,678 | | | | 1,484,188 | | | | 1,451,430 | | | | 1,571,532 | | | | 1,240,336 | |
Time deposits | | | 2,010,090 | | | | 1,957,539 | | | | 2,091,322 | | | | 2,095,772 | | | | 2,326,797 | |
| | | | | | | | | | | | | | | | | | | | |
Total interest-bearing deposits | | | 9,870,439 | | | | 9,521,564 | | | | 9,660,902 | | | | 9,830,263 | | | | 9,575,175 | |
| | | | | | | | | | | | | | | | | | | | |
Total deposits | | | 15,736,694 | | | | 15,245,227 | | | | 15,274,774 | | | | 15,360,516 | | | | 15,054,871 | |
Short-term borrowings | | | 1,171,809 | | | | 1,063,664 | | | | 712,634 | | | | 657,960 | | | | 782,779 | |
Long-term debt | | | 376,452 | | | | 374,991 | | | | 380,001 | | | | 385,826 | | | | 376,664 | |
Other liabilities | | | 191,653 | | | | 172,967 | | | | 174,227 | | | | 179,880 | | | | 231,090 | |
| | | | | | | | | | | | | | | | | | | | |
Total liabilities | | | 17,476,608 | | | | 16,856,849 | | | | 16,541,636 | | | | 16,584,182 | | | | 16,445,404 | |
| | | | | | | | | | | | | | | | | | | | |
COMMON SHAREHOLDERS’ EQUITY | | | | | | | | | | | | | | | | | | | | |
Common stock and capital surplus | | | 1,832,529 | | | | 1,838,931 | | | | 1,837,461 | | | | 1,832,282 | | | | 1,827,551 | |
Retained earnings | | | 703,506 | | | | 676,942 | | | | 657,062 | | | | 628,166 | | | | 613,662 | |
Accumulated other comprehensive income | | | (26,693 | ) | | | (23,291 | ) | | | (31,989 | ) | | | (35,379 | ) | | | (84,771 | ) |
| | | | | | | | | | | | | | | | | | | | |
Total common shareholders’ equity | | | 2,509,342 | | | | 2,492,582 | | | | 2,462,534 | | | | 2,425,069 | | | | 2,356,442 | |
| | | | | | | | | | | | | | | | | | | | |
Total liabilities & shareholders’ equity | | $ | 19,985,950 | | | $ | 19,349,431 | | | $ | 19,004,170 | | | $ | 19,009,251 | | | $ | 18,801,846 | |
| | | | | | | | | | | | | | | | | | | | |
CAPITAL RATIOS | | | | | | | | | | | | | | | | | | | | |
Tangible common equity | | $ | 1,748,828 | | | $ | 1,725,489 | | | $ | 1,684,037 | | | $ | 1,639,524 | | | $ | 1,563,542 | |
Tier 1 capital (i) | | | 1,784,653 | | | | 1,758,178 | | | | 1,725,947 | | | | 1,685,058 | | | | 1,656,497 | |
Common equity (period-end) as a percent of total assets (period-end) | | | 12.56 | % | | | 12.88 | % | | | 12.96 | % | | | 12.76 | % | | | 12.53 | % |
Tangible common equity ratio | | | 9.10 | % | | | 9.29 | % | | | 9.24 | % | | | 9.00 | % | | | 8.68 | % |
Leverage (Tier 1) ratio (i) | | | 9.48 | % | | | 9.61 | % | | | 9.43 | % | | | 9.34 | % | | | 9.10 | % |
Tier 1 risk-based capital ratio (i) | | | 11.68 | % | | | 11.83 | % | | | 11.90 | % | | | 11.76 | % | | | 12.07 | % |
Total risk-based capital ratio (i) | | | 12.76 | % | | | 12.96 | % | | | 13.20 | % | | | 13.11 | % | | | 13.52 | % |
(i) Estimated for most recent period-end.
11
HANCOCK HOLDING COMPANY
AVERAGE BALANCE SHEET
(Unaudited)
| | | | | | | | | | | | | | | | | | | | |
| | | Three Months Ended | | | Nine Months Ended | |
(dollars in thousands) | | 9/30/2014 | | | 6/30/2014 | | | 9/30/2013 | | | 9/30/2014 | | | 9/30/2013 | |
ASSETS | | | | | | | | | | | | | | | | | | | | |
Commercial non-real estate loans | | $ | 5,485,982 | | | $ | 5,298,978 | | | $ | 4,718,931 | | | $ | 5,292,464 | | | $ | 4,556,481 | |
Construction and land development loans | | | 1,070,763 | | | | 1,005,025 | | | | 970,411 | | | | 1,010,136 | | | | 976,702 | |
Commercial real estate loans | | | 3,070,821 | | | | 3,051,193 | | | | 2,891,830 | | | | 3,058,804 | | | | 2,893,923 | |
Residential mortgage loans | | | 1,814,186 | | | | 1,744,313 | | | | 1,653,813 | | | | 1,760,056 | | | | 1,615,694 | |
Consumer loans | | | 1,660,356 | | | | 1,581,352 | | | | 1,570,345 | | | | 1,601,949 | | | | 1,589,366 | |
| | | | | | | | | | | | | | | | | | | | |
Total loans | | | 13,102,108 | | | | 12,680,861 | | | | 11,805,330 | | | | 12,723,409 | | | | 11,632,166 | |
Loans held for sale | | | 16,885 | | | | 14,681 | | | | 16,065 | | | | 16,916 | | | | 27,079 | |
Securities (j) | | | 3,780,089 | | | | 3,716,563 | | | | 4,135,348 | | | | 3,810,186 | | | | 4,163,436 | |
Short-term investments | | | 425,362 | | | | 379,639 | | | | 427,892 | | | | 403,809 | | | | 644,349 | |
| | | | | | | | | | | | | | | | | | | | |
Earning assets | | | 17,324,444 | | | | 16,791,744 | | | | 16,384,635 | | | | 16,954,320 | | | | 16,467,030 | |
Allowance for loan losses | | | (129,734 | ) | | | (126,887 | ) | | | (137,936 | ) | | | (130,412 | ) | | | (137,624 | ) |
Goodwill and other intangible assets | | | 763,652 | | | | 770,294 | | | | 796,300 | | | | 771,728 | | | | 803,676 | |
Other assets | | | 1,591,585 | | | | 1,604,113 | | | | 1,753,028 | | | | 1,620,949 | | | | 1,856,115 | |
| | | | | | | | | | | | | | | | | | | | |
Total assets | | $ | 19,549,947 | | | $ | 19,039,264 | | | $ | 18,796,027 | | | $ | 19,216,585 | | | $ | 18,989,197 | |
| | | | | | | | | | | | | | | | | | | | |
LIABILITIES AND SHAREHOLDERS’ EQUITY | | | | | | | | | | | | | | | | | | | | |
Noninterest-bearing deposits | | $ | 5,707,523 | | | $ | 5,505,735 | | | $ | 5,415,303 | | | $ | 5,571,843 | | | $ | 5,359,325 | |
| | | | | | | | | | | | | | | | | | | | |
Interest-bearing transaction and savings deposits | | | 6,160,911 | | | | 6,078,115 | | | | 5,919,709 | | | | 6,104,039 | | | | 5,955,711 | |
Interest-bearing public fund deposits | | | 1,547,513 | | | | 1,450,312 | | | | 1,302,425 | | | | 1,508,222 | | | | 1,463,750 | |
Time deposits | | | 1,955,262 | | | | 2,026,419 | | | | 2,384,248 | | | | 2,049,914 | | | | 2,402,061 | |
| | | | | | | | | | | | | | | | | | | | |
Total interest-bearing deposits | | | 9,663,686 | | | | 9,554,846 | | | | 9,606,382 | | | | 9,662,175 | | | | 9,821,522 | |
| | | | | | | | | | | | | | | | | | | | |
Total deposits | | | 15,371,209 | | | | 15,060,581 | | | | 15,021,685 | | | | 15,234,018 | | | | 15,180,847 | |
Short-term borrowings | | | 1,139,694 | | | | 957,386 | | | | 820,500 | | | | 962,014 | | | | 791,641 | |
Long-term debt | | | 375,914 | | | | 380,151 | | | | 385,203 | | | | 380,660 | | | | 391,712 | |
Other liabilities | | | 173,182 | | | | 177,761 | | | | 229,694 | | | | 176,591 | | | | 228,056 | |
Common shareholders’ equity | | | 2,489,948 | | | | 2,463,385 | | | | 2,338,945 | | | | 2,463,302 | | | | 2,396,941 | |
| | | | | | | | | | | | | | | | | | | | |
Total liabilities & shareholders’ equity | | $ | 19,549,947 | | | $ | 19,039,264 | | | $ | 18,796,027 | | | $ | 19,216,585 | | | $ | 18,989,197 | |
| | | | | | | | | | | | | | | | | | | | |
| (j) | Average securities does not include unrealized holding gains/losses on available for sale securities. |
12
HANCOCK HOLDING COMPANY
AVERAGE BALANCE AND NET INTEREST MARGIN SUMMARY
(Unaudited)
| | | | | | | | | | | | | | | | | | | | | | | | | | | | | | | | | | | | |
| | | Three Months Ended | |
| | | 9/30/2014 | | | 6/30/2014 | | | 9/30/2013 | |
(dollars in millions) | | Volume | | | Interest | | | Rate | | | Volume | | | Interest | | | Rate | | | Volume | | | Interest | | | Rate | |
AVERAGE EARNING ASSETS | | | | | | | | | | | | | | | | | | | | | | | | | | | | |
Commercial & real estate loans (TE) | | $ | 9,627.6 | | | $ | 108.2 | | | | 4.46 | % | | $ | 9,355.2 | | | $ | 108.2 | | | | 4.64 | % | | $ | 8,581.2 | | | $ | 109.4 | | | | 5.06 | % |
Residential mortgage loans | | | 1,814.2 | | | | 20.0 | | | | 4.41 | % | | | 1,744.3 | | | | 21.0 | | | | 4.83 | % | | | 1,653.8 | | | | 24.8 | | | | 5.99 | % |
Consumer loans | | | 1,660.4 | | | | 24.0 | | | | 5.74 | % | | | 1,581.4 | | | | 23.6 | | | | 5.99 | % | | | 1,570.3 | | | | 25.7 | | | | 6.51 | % |
Loan fees & late charges | | | — | | | | 0.4 | | | | 0.00 | % | | | — | | | | 0.8 | | | | 0.00 | % | | | — | | | | 0.7 | | | | 0.00 | % |
| | | | | | | | | | | | | | | | | | | | | | | | | | | | | | | | | | | | |
Total loans (TE) | | | 13,102.2 | | | | 152.6 | | | | 4.63 | % | | | 12,680.9 | | | | 153.6 | | | | 4.86 | % | | | 11,805.3 | | | | 160.6 | | | | 5.41 | % |
| | | | | | | | | | | | | | | | | | | | | | | | | | | | | | | | | | | | |
Loans held for sale | | | 16.9 | | | | 0.1 | | | | 4.66 | % | | | 14.7 | | | | 0.1 | | | | 4.14 | % | | | 16.1 | | | | 0.2 | | | | 4.38 | % |
| | | | | | | | | | | | | | | | | | | | | | | | | | | | | | | | | | | | |
US Treasury and government agency securities | | | 184.8 | | | | 0.7 | | | | 1.47 | % | | | 0.0 | | | | 0.0 | | | | 0.00 | % | | | 5.6 | | | | 0.0 | | | | 2.34 | % |
CMOs and mortgage backed securities | | | 3,379.2 | | | | 19.2 | | | | 2.27 | % | | | 3,490.9 | | | | 20.1 | | | | 2.30 | % | | | 3,874.1 | | | | 20.3 | | | | 2.10 | % |
Municipals (TE) | | | 203.7 | | | | 2.4 | | | | 4.62 | % | | | 205.8 | | | | 2.4 | | | | 4.63 | % | | | 247.1 | | | | 2.7 | | | | 4.39 | % |
Other securities | | | 12.3 | | | | 0.1 | | | | 2.21 | % | | | 19.8 | | | | 0.1 | | | | 1.19 | % | | | 8.5 | | | | 0.1 | | | | 2.51 | % |
| | | | | | | | | | | | | | | | | | | | | | | | | | | | | | | | | | | | |
Total securities (TE) (j) | | | 3,780.0 | | | | 22.4 | | | | 2.36 | % | | | 3,716.5 | | | | 22.6 | | | | 2.43 | % | | | 4,135.3 | | | | 23.1 | | | | 2.24 | % |
| | | | | | | | | | | | | | | | | | | | | | | | | | | | | | | | | | | | |
Total short-term investments | | | 425.3 | | | | 0.3 | | | | 0.23 | % | | | 379.6 | | | | 0.2 | | | | 0.22 | % | | | 427.9 | | | | 0.3 | | | | 0.23 | % |
| | | | | | | | | | | | | | | | | | | | | | | | | | | | | | | | | | | | |
Average earning assets yield (TE) | | $ | 17,324.4 | | | | 175.4 | | | | 4.02 | % | | $ | 16,791.7 | | | | 176.5 | | | | 4.21 | % | | $ | 16,384.6 | | | | 184.2 | | | | 4.47 | % |
| | | | | | | | | | | | | | | | | | | | | | | | | | | | | | | | | | | | |
INTEREST-BEARING LIABILITIES | | | | | | | | | | | | | | | | | | | | | | | | | | | | |
Interest-bearing transaction and savings deposits | | $ | 6,160.9 | | | | 1.6 | | | | 0.11 | % | | $ | 6,078.1 | | | | 1.5 | | | | 0.10 | % | | $ | 5,919.7 | | | | 1.4 | | | | 0.09 | % |
Time deposits | | | 1,955.3 | | | | 3.1 | | | | 0.64 | % | | | 2,026.4 | | | | 3.0 | | | | 0.60 | % | | | 2,384.3 | | | | 3.7 | | | | 0.61 | % |
Public funds | | | 1,547.5 | | | | 1.1 | | | | 0.27 | % | | | 1,450.3 | | | | 0.7 | | | | 0.21 | % | | | 1,302.4 | | | | 0.7 | | | | 0.23 | % |
| | | | | | | | | | | | | | | | | | | | | | | | | | | | | | | | | | | | |
Total interest-bearing deposits | | | 9,663.7 | | | | 5.8 | | | | 0.24 | % | | | 9,554.8 | | | | 5.2 | | | | 0.22 | % | | | 9,606.4 | | | | 5.8 | | | | 0.24 | % |
| | | | | | | | | | | | | | | | | | | | | | | | | | | | | | | | | | | | |
Short-term borrowings | | | 1,139.7 | | | | 0.2 | | | | 0.08 | % | | | 957.4 | | | | 0.9 | | | | 0.34 | % | | | 820.5 | | | | 1.1 | | | | 0.52 | % |
Long-term debt | | | 375.9 | | | | 3.2 | | | | 3.27 | % | | | 380.2 | | | | 3.1 | | | | 3.32 | % | | | 385.2 | | | | 3.2 | | | | 3.28 | % |
| | | | | | | | | | | | | | | | | | | | | | | | | | | | | | | | | | | | |
Total borrowings | | | 1,515.6 | | | | 3.4 | | | | 0.87 | % | | | 1,337.6 | | | | 4.0 | | | | 1.19 | % | | | 1,205.7 | | | | 4.3 | | | | 1.40 | % |
| | | | | | | | | | | | | | | | | | | | | | | | | | | | | | | | | | | | |
Total interest-bearing liabilities cost | | | 11,179.3 | | | | 9.2 | | | | 0.33 | % | | | 10,892.4 | | | | 9.2 | | | | 0.34 | % | | | 10,812.1 | | | | 10.1 | | | | 0.37 | % |
| | | | | | | | | | | | | | | | | | | | | | | | | | | | | | | | | | | | |
Net interest-free funding sources | | | 6,145.1 | | | | | | | | 5,899.3 | | | | | | | | 5,572.5 | | | | | | | | | |
| | | | | | | | | | | | | | | | | | | | | | | | | | | | | | | | | | | | |
Total cost of funds | | | 17,324.4 | | | | 9.2 | | | | 0.21 | % | | | 16,791.7 | | | | 9.2 | | | | 0.22 | % | | | 16,384.6 | | | | 10.1 | | | | 0.24 | % |
| | | | | | | | | | | | | | | | | | | | | | | | | | | | | | | | | | | | |
Net Interest Spread (TE) | | | | | | $ | 166.2 | | | | 3.69 | % | | | | | | $ | 167.3 | | | | 3.87 | % | | | | | | $ | 174.1 | | | | 4.10 | % |
| | | | | | | | | | | | | | | | | | | | | | | | | | | | | | | | | | | | |
Net Interest Margin (TE) | | $ | 17,324.4 | | | $ | 166.2 | | | | 3.81 | % | | $ | 16,791.7 | | | $ | 167.3 | | | | 3.99 | % | | $ | 16,384.6 | | | $ | 174.1 | | | | 4.23 | % |
| | | | | | | | | | | | | | | | | | | | | | | | | | | | | | | | | | | | |
| (j) | Average securities does not include unrealized holding gains/losses on available for sale securities. |
13
HANCOCK HOLDING COMPANY
AVERAGE BALANCE AND NET INTEREST MARGIN SUMMARY
(Unaudited)
| | | | | | | | | | | | | | | | | | | | | | | | |
| | | Nine Months Ended | |
| | | 9/30/2014 | | | 9/30/2013 | |
(dollars in millions) | | Volume | | | Interest | | | Rate | | | Volume | | | Interest | | | Rate | |
AVERAGE EARNING ASSETS | | | | | | | | | | | | | | | | | | | | | | | | |
Commercial & real estate loans (TE) | | $ | 9,361.4 | | | $ | 324.4 | | | | 4.63 | % | | $ | 8,427.0 | | | $ | 326.0 | | | | 5.17 | % |
Residential mortgage loans | | | 1,760.1 | | | | 62.4 | | | | 4.73 | % | | | 1,615.7 | | | | 77.4 | | | | 6.36 | % |
Consumer loans | | | 1,601.9 | | | | 70.8 | | | | 5.91 | % | | | 1,589.4 | | | | 78.8 | | | | 6.63 | % |
Loan fees & late charges | | | — | | | | 1.9 | | | | 0.00 | % | | | — | | | | 2.5 | | | | 0.00 | % |
| | | | | | | | | | | | | | | | | | | | | | | | |
Total loans (TE) | | | 12,723.4 | | | | 459.5 | | | | 4.82 | % | | | 11,632.1 | | | | 484.7 | | | | 5.56 | % |
| | | | | | | | | | | | | | | | | | | | | | | | |
Loans held for sale | | | 16.9 | | | | 0.5 | | | | 4.29 | % | | | 27.1 | | | | 0.8 | | | | 3.72 | % |
| | | | | | | | | | | | | | | | | | | | | | | | |
US Treasury and government agency securities | | | 93.1 | | | | 1.2 | | | | 1.73 | % | | | 3.8 | | | | 0.1 | | | | 1.81 | % |
CMOs and mortgage backed securities | | | 3,493.5 | | | | 60.5 | | | | 2.31 | % | | | 3,918.9 | | | | 59.6 | | | | 2.03 | % |
Municipals (TE) | | | 208.8 | | | | 7.2 | | | | 4.60 | % | | | 232.5 | | | | 7.9 | | | | 4.53 | % |
Other securities | | | 14.8 | | | | 0.2 | | | | 2.22 | % | | | 8.3 | | | | 0.2 | | | | 2.42 | % |
| | | | | | | | | | | | | | | | | | | | | | | | |
Total securities (TE) (j) | | | 3,810.2 | | | | 69.1 | | | | 2.42 | % | | | 4,163.5 | | | | 67.8 | | | | 2.17 | % |
| | | | | | | | | | | | | | | | | | | | | | | | |
Total short-term investments | | | 403.8 | | | | 0.7 | | | | 0.23 | % | | | 644.3 | | | | 1.2 | | | | 0.24 | % |
| | | | | | | | | | | | | | | | | | | | | | | | |
Average earning assets yield (TE) | | $ | 16,954.3 | | | | 529.8 | | | | 4.17 | % | | $ | 16,467.0 | | | | 554.5 | | | | 4.50 | % |
| | | | | | | | | | | | | | | | | | | | | | | | |
INTEREST-BEARING LIABILITIES | | | | | | | | | | | | | | | | | | | | | | | | |
Interest-bearing transaction and savings deposits | | $ | 6,104.0 | | | | 4.6 | | | | 0.10 | % | | $ | 5,955.7 | | | | 4.6 | | | | 0.10 | % |
Time deposits | | | 2,049.9 | | | | 9.3 | | | | 0.60 | % | | | 2,402.1 | | | | 11.6 | | | | 0.64 | % |
Public funds | | | 1,508.2 | | | | 2.5 | | | | 0.23 | % | | | 1,463.8 | | | | 2.6 | | | | 0.24 | % |
| | | | | | | | | | | | | | | | | | | | | | | | |
Total interest-bearing deposits | | | 9,662.1 | | | | 16.4 | | | | 0.23 | % | | | 9,821.6 | | | | 18.8 | | | | 0.26 | % |
| | | | | | | | | | | | | | | | | | | | | | | | |
Short-term borrowings | | | 962.0 | | | | 2.1 | | | | 0.29 | % | | | 791.6 | | | | 3.4 | | | | 0.58 | % |
Long-term debt | | | 380.7 | | | | 9.4 | | | | 3.31 | % | | | 391.7 | | | | 9.6 | | | | 3.28 | % |
| | | | | | | | | | | | | | | | | | | | | | | | |
Total borrowings | | | 1,342.7 | | | | 11.5 | | | | 1.15 | % | | | 1,183.3 | | | | 13.0 | | | | 1.47 | % |
| | | | | | | | | | | | | | | | | | | | | | | | |
Total interest-bearing liabilities cost | | | 11,004.8 | | | | 27.9 | | | | 0.34 | % | | | 11,004.9 | | | | 31.8 | | | | 0.39 | % |
| | | | | | | | | | | | | | | | | | | | | | | | |
Net interest-free funding sources | | | 5,949.5 | | | | | | | | | | | | 5,462.1 | | | | | | | | | |
| | | | | | | | | | | | | | | | | | | | | | | | |
Total cost of funds | | | 16,954.3 | | | | 27.9 | | | | 0.22 | % | | | 16,467.0 | | | | 31.8 | | | | 0.26 | % |
| | | | | | | | | | | | | | | | | | | | | | | | |
Net Interest Spread (TE) | | | | | | $ | 501.9 | | | | 3.83 | % | | | | | | $ | 522.7 | | | | 4.11 | % |
| | | | | | | | | | | | | | | | | | | | | | | | |
Net Interest Margin (TE) | | $ | 16,954.3 | | | $ | 501.9 | | | | 3.95 | % | | $ | 16,467.0 | | | $ | 522.7 | | | | 4.24 | % |
| | | | | | | | | | | | | | | | | | | | | | | | |
| (j) | Average securities does not include unrealized holding gains/losses on available for sale securities. |
14
HANCOCK HOLDING COMPANY
ASSET QUALITY INFORMATION
(Unaudited)
| | | | | | | | | | | | | | | | | | | | |
| | | Three Months Ended | | | Nine Months Ended | |
(dollars in thousands) | | 9/30/2014 | | | 6/30/2014 | | | 9/30/2013 | | | 9/30/2014 | | | 9/30/2013 | |
Nonaccrual loans (k) | | $ | 83,154 | | | $ | 89,901 | | | $ | 119,749 | | | $ | 83,154 | | | $ | 119,749 | |
Restructured loans - still accruing | | | 7,944 | | | | 7,868 | | | | 10,605 | | | | 7,944 | | | | 10,605 | |
| | | | | | | | | | | | | | | | | | | | |
Total nonperforming loans | | | 91,098 | | | | 97,769 | | | | 130,354 | | | | 91,098 | | | | 130,354 | |
ORE and foreclosed assets | | | 56,081 | | | | 59,732 | | | | 85,560 | | | | 56,081 | | | | 85,560 | |
| | | | | | | | | | | | | | | | | | | | |
Total nonperforming assets | | $ | 147,179 | | | $ | 157,501 | | | $ | 215,914 | | | $ | 147,179 | | | $ | 215,914 | |
| | | | | | | | | | | | | | | | | | | | |
Nonperforming assets as a percent of loans, ORE and foreclosed assets | | | 1.10 | % | | | 1.22 | % | | | 1.83 | % | | | 1.10 | % | | | 1.83 | % |
Accruing loans 90 days past due | | $ | 6,667 | | | $ | 4,142 | | | $ | 15,620 | | | $ | 6,667 | | | $ | 15,620 | |
Accruing loans 90 days past due as a percent of loans | | | 0.05 | % | | | 0.03 | % | | | 0.13 | % | | | 0.05 | % | | | 0.13 | % |
Nonperforming assets + accruing loans 90 days past due to loans, ORE and foreclosed assets | | | 1.15 | % | | | 1.25 | % | | | 1.96 | % | | | 1.15 | % | | | 1.96 | % |
| | | | | | | | | | | | | | | | | | | | |
ALLOWANCE FOR LOAN LOSSES | | | | | | | | | | | | | | | | |
Beginning Balance | | $ | 128,672 | | | $ | 128,248 | | | $ | 137,969 | | | $ | 133,626 | | | $ | 136,171 | |
Net provision for loan losses - covered loans | | | (391 | ) | | | (73 | ) | | | 1,024 | | | | (766 | ) | | | 7,987 | |
Provision for loan losses - noncovered loans | | | 9,859 | | | | 6,764 | | | | 6,545 | | | | 24,888 | | | | 17,417 | |
| | | | | | | | | | | | | | | | | | | | |
Net provision for loan losses | | | 9,468 | | | | 6,691 | | | | 7,569 | | | | 24,122 | | | | 25,404 | |
| | | | | | | | | | | | | | | | | | | | |
(Decrease) increase in FDIC loss share receivable | | | (6,695 | ) | | | (1,022 | ) | | | (1,379 | ) | | | (14,570 | ) | | | 1,497 | |
Net charge-offs - covered | | | (566 | ) | | | 1,181 | | | | 506 | | | | 3,125 | | | | 5,754 | |
Charge-offs - noncovered | | | 8,482 | | | | 7,309 | | | | 8,698 | | | | 23,273 | | | | 31,386 | |
Recoveries - noncovered | | | (2,043 | ) | | | (3,245 | ) | | | (3,268 | ) | | | (8,792 | ) | | | (12,291 | ) |
| | | | | | | | | | | | | | | | | | | | |
Net charge-offs | | | 5,873 | | | | 5,245 | | | | 5,936 | | | | 17,606 | | | | 24,849 | |
| | | | | | | | | | | | | | | | | | | | |
Ending Balance | | $ | 125,572 | | | $ | 128,672 | | | $ | 138,223 | | | $ | 125,572 | | | $ | 138,223 | |
| | | | | | | | | | | | | | | | | | | | |
Allowance for loan losses as a percent of period-end loans | | | 0.94 | % | | | 1.00 | % | | | 1.18 | % | | | 0.94 | % | | | 1.18 | % |
Allowance for loan losses to nonperforming loans + accruing loans 90 days past due | | | 128.44 | % | | | 126.26 | % | | | 94.69 | % | | | 128.44 | % | | | 94.69 | % |
| | | | | | | | | | | | | | | | | | | | |
NET CHARGE-OFF INFORMATION | | | | | | | | | | | | | | | | |
Net charge-offs - noncovered: | | | | | | | | | | | | | | | | |
Commercial/real estate loans | | $ | 2,451 | | | $ | 1,148 | | | $ | 1,267 | | | $ | 4,991 | | | $ | 9,405 | |
Residential mortgage loans | | | 558 | | | | 587 | | | | 541 | | | | 1,292 | | | | 891 | |
Consumer loans | | | 3,430 | | | | 2,329 | | | | 3,622 | | | | 8,198 | | | | 8,799 | |
| | | | | | | | | | | | | | | | | | | | |
Total net charge-offs - noncovered | | $ | 6,439 | | | $ | 4,064 | | | $ | 5,430 | | | $ | 14,481 | | | $ | 19,095 | |
| | | | | | | | | | | | | | | | | | | | |
Net charge-offs - noncovered to average loans: | | | | | | | | | | | | | | | | |
Commercial/real estate loans | | | 0.10 | % | | | 0.05 | % | | | 0.06 | % | | | 0.07 | % | | | 0.15 | % |
Residential mortgage loans | | | 0.12 | % | | | 0.13 | % | | | 0.13 | % | | | 0.10 | % | | | 0.07 | % |
Consumer loans | | | 0.82 | % | | | 0.59 | % | | | 0.92 | % | | | 0.68 | % | | | 0.74 | % |
| | | | | | | | | | | | | | | | | | | | |
Total net charge-offs - noncovered to average loans | | | 0.19 | % | | | 0.13 | % | | | 0.18 | % | | | 0.15 | % | | | 0.22 | % |
| | | | | | | | | | | | | | | | | | | | |
| (k) | Nonaccrual loans and accruing loans past due 90 days or more do not include acquired credit-impaired loans which were written down to fair value upon acquisition and accrete interest income over the remaining life of the loan. Included in nonaccrual loans are $9.9 million, $11.5 million, and $19.1 million at 09/30/14, 06/30/14 and 09/30/13, respectively, in nonaccruing restructured loans. |
15
HANCOCK HOLDING COMPANY
ASSET QUALITY INFORMATION
(Unaudited)
| | | | | | | | | | | | | | | | | | | | |
| | | Three months ended | |
(dollars in thousands) | | 9/30/2014 | | | 6/30/2014 | | | 3/31/2014 | | | 12/31/2013 | | | 9/30/2013 | |
Nonaccrual loans | | $ | 83,154 | | | $ | 89,901 | | | $ | 101,400 | | | $ | 99,711 | | | $ | 119,749 | |
Restructured loans - still accruing | | | 7,944 | | | | 7,868 | | | | 8,459 | | | | 9,247 | | | | 10,605 | |
| | | | | | | | | | | | | | | | | | | | |
Total nonperforming loans | | | 91,098 | | | | 97,769 | | | | 109,859 | | | | 108,958 | | | | 130,354 | |
ORE and foreclosed assets | | | 56,081 | | | | 59,732 | | | | 69,813 | | | | 76,979 | | | | 85,560 | |
| | | | | | | | | | | | | | | | | | | | |
Total nonperforming assets | | $ | 147,179 | | | $ | 157,501 | | | $ | 179,672 | | | $ | 185,937 | | | $ | 215,914 | |
| | | | | | | | | | | | | | | | | | | | |
Nonperforming assets as a percent of loans, ORE and foreclosed assets | | | 1.10 | % | | | 1.22 | % | | | 1.43 | % | | | 1.50 | % | | | 1.83 | % |
Accruing loans 90 days past due | | $ | 6,667 | | | $ | 4,142 | | | $ | 3,998 | | | $ | 10,387 | | | $ | 15,620 | |
Accruing loans 90 days past due as a percent of loans | | | 0.05 | % | | | 0.03 | % | | | 0.03 | % | | | 0.08 | % | | | 0.13 | % |
Nonperforming assets + accruing loans 90 days past due to loans, ORE and foreclosed assets | | | 1.15 | % | | | 1.25 | % | | | 1.46 | % | | | 1.58 | % | | | 1.96 | % |
| | | | | | | | | | | | | | | | | | | | |
Allowance for loan losses | | $ | 125,572 | | | $ | 128,672 | | | $ | 128,248 | | | $ | 133,626 | | | $ | 138,223 | |
Allowance for loan losses as a percent of period-end loans | | | 0.94 | % | | | 1.00 | % | | | 1.02 | % | | | 1.08 | % | | | 1.18 | % |
Allowance for loan losses to nonperforming loans + accruing loans 90 days past due | | | 128.44 | % | | | 126.26 | % | | | 112.64 | % | | | 111.97 | % | | | 94.69 | % |
| | | | | | | | | | | | | | | | | | | | |
Provision for loan losses | | $ | 9,468 | | | $ | 6,691 | | | $ | 7,963 | | | $ | 7,331 | | | $ | 7,569 | |
| | | | | | | | | | | | | | | | | | | | |
NET CHARGE-OFF INFORMATION | | | | | | | | | | | | | | | | |
Net charge-offs - noncovered: | | | | | | | | | | | | | | | | |
Commercial/real estate loans | | $ | 2,451 | | | $ | 1,148 | | | $ | 1,392 | | | $ | 2,183 | | | $ | 1,267 | |
Residential mortgage loans | | | 558 | | | | 587 | | | | 147 | | | | (197 | ) | | | 541 | |
Consumer loans | | | 3,430 | | | | 2,329 | | | | 2,439 | | | | 3,230 | | | | 3,622 | |
| | | | | | | | | | | | | | | | | | | | |
Total net charge-offs - noncovered | | $ | 6,439 | | | $ | 4,064 | | | $ | 3,978 | | | $ | 5,216 | | | $ | 5,430 | |
| | | | | | | | | | | | | | | | | | | | |
Net charge-offs - noncovered to average loans: | | | | | | | | | | | | | | | | |
Commercial/real estate loans | | | 0.10 | % | | | 0.05 | % | | | 0.06 | % | | | 0.10 | % | | | 0.06 | % |
Residential mortgage loans | | | 0.12 | % | | | 0.13 | % | | | 0.03 | % | | | (0.05 | )% | | | 0.13 | % |
Consumer loans | | | 0.82 | % | | | 0.59 | % | | | 0.63 | % | | | 0.81 | % | | | 0.92 | % |
| | | | | | | | | | | | | | | | | | | | |
Total net charge-offs - noncovered to average loans | | | 0.19 | % | | | 0.13 | % | | | 0.13 | % | | | 0.17 | % | | | 0.18 | % |
| | | | | | | | | | | | | | | | | | | | |
AVERAGE LOANS | | | | | | | | | | | | | | | | |
Commercial/real estate loans | | $ | 9,627,566 | | | $ | 9,355,196 | | | $ | 9,095,606 | | | $ | 8,629,013 | | | $ | 8,582,849 | |
Residential mortgage loans | | | 1,814,186 | | | | 1,744,313 | | | | 1,720,640 | | | | 1,701,144 | | | | 1,668,201 | |
Consumer loans | | | 1,660,356 | | | | 1,581,352 | | | | 1,563,070 | | | | 1,573,446 | | | | 1,570,345 | |
| | | | | | | | | | | | | | | | | | | | |
Total average loans | | $ | 13,102,108 | | | $ | 12,680,861 | | | $ | 12,379,316 | | | $ | 11,903,603 | | | $ | 11,821,395 | |
| | | | | | | | | | | | | | | | | | | | |
16
HANCOCK HOLDING COMPANY
SUPPLEMENTAL ASSET QUALITY INFORMATION
(Unaudited)
| | | | | | | | | | | | | | | | |
| | | Originated Loans | | | Acquired Loans (l) | | | Covered Loans (m) | | | Total | |
(dollars in thousands) | | 9/30/2014 | |
Nonaccrual loans (n) | | $ | 68,362 | | | $ | 11,572 | | | $ | 3,220 | | | $ | 83,154 | |
Restructured loans - still accruing | | | 7,944 | | | | — | | | | — | | | | 7,944 | |
| | | | | | | | | | | | | | | | |
Total nonperforming loans | | | 76,306 | | | | 11,572 | | | | 3,220 | | | | 91,098 | |
ORE and foreclosed assets (o) | | | 38,096 | | | | — | | | | 17,985 | | | | 56,081 | |
| | | | | | | | | | | | | | | | |
Total nonperforming assets | | $ | 114,402 | | | $ | 11,572 | | | $ | 21,205 | | | $ | 147,179 | |
| | | | | | | | | | | | | | | | |
Accruing loans 90 days past due | | $ | 5,149 | | | $ | 1,518 | | | | — | | | $ | 6,667 | |
Allowance for loan losses | | $ | 81,822 | | | $ | 9,117 | | | $ | 34,633 | | | $ | 125,572 | |
| |
| | | 6/30/2014 | |
Nonaccrual loans (n) | | $ | 74,533 | | | $ | 12,048 | | | $ | 3,320 | | | $ | 89,901 | |
Restructured loans - still accruing | | | 4,823 | | | | 3,045 | | | | — | | | | 7,868 | |
| | | | | | | | | | | | | | | | |
Total nonperforming loans | | | 79,356 | | | | 15,093 | | | | 3,320 | | | | 97,769 | |
ORE and foreclosed assets (o) | | | 40,158 | | | | — | | | | 19,574 | | | | 59,732 | |
| | | | | | | | | | | | | | | | |
Total nonperforming assets | | $ | 119,514 | | | $ | 15,093 | | | $ | 22,894 | | | $ | 157,501 | |
| | | | | | | | | | | | | | | | |
Accruing loans 90 days past due | | $ | 3,416 | | | $ | 726 | | | | — | | | $ | 4,142 | |
Allowance for loan losses | | $ | 78,573 | | | $ | 8,947 | | | $ | 41,152 | | | $ | 128,672 | |
| | | | |
| | | Originated Loans | | | Acquired Loans (l) | | | Covered Loans (m) | | | Total | |
LOANS OUTSTANDING | | 9/30/2014 | |
Commercial non-real estate loans | | $ | 4,806,740 | | | $ | 769,226 | | | $ | 11,171 | | | $ | 5,587,137 | |
Construction and land development loans | | $ | 974,442 | | | $ | 110,294 | | | $ | 11,166 | | | | 1,095,902 | |
Commercial real estate loans | | $ | 2,245,855 | | | $ | 813,429 | | | $ | 41,550 | | | | 3,100,834 | |
Residential mortgage loans | | $ | 1,635,462 | | | $ | 37,739 | | | $ | 185,289 | | | | 1,858,490 | |
Consumer loans | | $ | 1,623,069 | | | $ | 51,488 | | | $ | 31,654 | | | | 1,706,211 | |
| | | | | | | | | | | | | | | | |
Total loans | | $ | 11,285,568 | | | $ | 1,782,176 | | | $ | 280,830 | | | $ | 13,348,574 | |
| | | | | | | | | | | | | | | | |
Change in loan balance from previous quarter | | $ | 627,116 | | | ($ | 139,603 | ) | | ($ | 22,995 | ) | | $ | 464,518 | |
| | | | | | | | | | | | | | | | |
| |
| | | 6/30/2014 | |
Commercial non-real estate loans | | $ | 4,610,696 | | | $ | 769,159 | | | $ | 13,836 | | | $ | 5,393,691 | |
Construction and land development loans | | | 903,610 | | | | 119,847 | | | | 17,199 | | | | 1,040,656 | |
Commercial real estate loans | | | 2,173,006 | | | | 836,646 | | | | 46,611 | | | | 3,056,263 | |
Residential mortgage loans | | | 1,469,977 | | | | 111,724 | | | | 189,570 | | | | 1,771,271 | |
Consumer loans | | | 1,501,163 | | | | 84,403 | | | | 36,609 | | | | 1,622,175 | |
| | | | | | | | | | | | | | | | |
Total loans | | $ | 10,658,452 | | | $ | 1,921,779 | | | $ | 303,825 | | | $ | 12,884,056 | |
| | | | | | | | | | | | | | | | |
Change in loan balance from previous quarter | | $ | 734,088 | | | ($ | 350,657 | ) | | ($ | 27,312 | ) | | $ | 356,119 | |
| | | | | | | | | | | | | | | | |
| (l) | Loans which have been acquired and no allowance brought forward in accordance with acquisition accounting. |
| (m) | Acquired loans which are covered by loss sharing agreements with the FDIC providing considerable protection against credit risk. |
| (n) | Included in originated nonaccrual loans are $9.9 million and $11.5 million at 09/30/14 and 06/30/14, respectively, in non accruing restructured loans. |
| (o) | ORE received in settlement of acquired loans is no longer subject to purchase accounting guidance and has been included with ORE from originated loans. ORE received in settlement of covered loans remains covered under the FDIC loss share agreements. |
17
|
Third Quarter 2014 Financial Results October 23, 2014 Third Quarter 2014 Financial Results October 23, 2014 |
|
Certain of the statements or information included in this presentation may constitute forward-looking statements. Forward-looking statements include projections of revenue, costs, results of operations or financial condition or statements regarding future market conditions or our potential plans and strategies for the future. Hancock’s ability to accurately project results or predict the effects of future plans or strategies is inherently limited. We believe that the expectations reflected or implied by any forward-looking statements are based on reasonable assumptions, but actual results and performance could differ materially from those set forth in the forward-looking statements. Factors that could cause actual results or outcomes to differ from those expressed in the Company's forward-looking statements include, but are not limited to, those outlined in Hancock's SEC filings, including the “Risk Factors” section of the Company’s 10-K for the year ended December 31, 2013 and form 10-Q for the most recent quarter end. Hancock undertakes no obligation to update or revise any forward-looking statements, and you are cautioned not to place undue reliance on such forward-looking statements. Forward Looking Statement 2 |
|
Hancock Holding Company • $20 billion in Total Assets • $13.3 billion in Total Loans • $15.7 billion in Total Deposits • ROA (operating) 1.00% • ROTCE (operating) 11.28% • NIM 3.81% • Efficiency Ratio 61.84% • TCE 9.10% • Rated among the strongest, safest financial institutions in the country by BauerFinancial, Inc. • Earned top customer service marks with Greenwich Excellence Awards As of September 30, 2014 3 |
|
Third Quarter 2014 Highlights • Operating income $49.1 million or $.59 per diluted common share, flat linked-quarter • Core income $41.2 million or $.49 per diluted common share, up 6.5% linked-quarter • Net loan growth of $488 million, or 16%, linked-quarter annualized; approximately $1.7 billion, or 15%, year-over- year loan growth (each excluding the FDIC-covered portfolio) • Net deposit growth of $491 million, or 13% linked-quarter annualized; completely funding the loan growth in the third quarter • An increase of $5 million in core revenue offset a $5 million decline in purchase accounting revenue • Operating expenses remained relatively stable and below the targeted expense goal for 4Q14 • Solid capital levels with a tangible common equity (TCE) ratio of 9.10%; approximately $10 million of capital used to repurchase stock during the quarter • Return on average assets (ROA) (operating) 1.00% down 4bps; core ROA up 2bps; total assets grew to $20 billion from 2Q14 Operating income is defined as net income excluding tax-effected securities transactions gains or losses and nonoperating expense items. * Core is defined as operating results less purchase accounting adjustments. See table on slide 23. ** Noninterest expense to total revenue (TE) excluding amortization of purchased intangibles, nonoperating expense items, and securities transactions. ($s in millions; except per share data) 3Q14 2Q14 LQ change Operating Income $49.1 $49.6 -1% Earnings Per Share (diluted) - operating $.59 $.59 --- Net Income $46.6 $40.0 +16.5% Earnings Per Share (diluted) $.56 $.48 +16.7% Nonoperating expense items $3.9 $12.1 n/m Return on Assets (operating) (%) 1.00 1.04 -4bps Return on Tangible Common Equity (operating) (%) 11.28 11.75 -47bps Total Loans (excluding covered loans) $13,068 $12,580 +4% Net Interest Margin (%) 3.81 3.99 -18bps Net Interest Margin (%) (core)* 3.32 3.35 -3bps Net Charge-offs (%) (non-covered) 0.19 0.13 +6bps Tangible Common Equity (%) 9.10 9.29 -19bps Efficiency Ratio** (%) 61.84 61.67 +17bps 4 |
|
E.P.S. Improving Trends in Core Results; Narrowing The Gap Between Reported and Core ROA Core is defined as operating results less purchase accounting adjustments (PAA). PAA items include loan accretion from Whitney and Peoples First, offset by amortization of the Whitney bond portfolio premium, amortization of the Peoples First indemnification asset and amortization of intangibles. Operating income is defined as net income excluding tax-effected securities transactions gains or losses and nonoperating expense items. See table on slide 23. 5 |
|
Less Than $8 Million Quarterly Gap Between Operating and Core Net Income Core is defined as operating results less purchase accounting adjustments (PAA). PAA items include loan accretion from Whitney and Peoples First, offset by amortization of the Whitney bond portfolio premium, amortization of the Peoples First indemnification asset and amortization of intangibles. Operating income is defined as net income excluding tax-effected securities transactions gains or losses and nonoperating expense items. See table on slide 23. Replaced $11.5 million of quarterly PAA income with core earnings since 1Q13 (after-tax) 6 |
|
Switch From Expense Reductions To Revenue Growth In Offsetting Declining PAA 7 |
|
Loans Have Grown Steadily Since 1Q13 • Excluding FDIC covered loans, total loans of $13.1 billion were up $488 million, or 16% LQA • All markets across the franchise reported net loan growth during the quarter, with south Louisiana, Houston and central Florida generating approximately half of the increase • Mortgage and indirect lending generated approximately 30% of the quarter’s net loan growth $s in billions; LQA excludes covered loans $s in millions; period-end balances; includes covered loans $s in millions $s in millions 8 |
|
Solid Asset Quality Metrics • Nonperforming assets totaled $147 million, down $10 million from June 30, 2014 – Nonperforming loans declined $6.7 million linked-quarter – ORE and foreclosed assets declined $3.6 million linked-quarter – NPA ratio 1.10%, down from 1.22% linked-quarter • The allowance for loan losses was $125.6 million (.94%) compared to $128.7 million (1.00%) linked-quarter – The allowance maintained on the noncovered portion of the loan portfolio increased $3.4 million linked-quarter, totaling $90.9 million – The allowance on the covered loan portfolio declined $6.5 million linked-quarter • Provision for loan losses was $9.5 million, up from $6.7 million in 2Q14 – The provision for noncovered loans was $9.9 million in the third quarter, compared to $6.8 million in the second quarter • Noncovered net charge-offs totaled $6.4 million, or 0.19%, up from $4.1 million, or 0.13%, in 2Q14 As of September 30, 2014 Nonperforming Asset (NPA) Ratio 9 |
|
Securities Portfolio No Longer Funding Loan Growth • Portfolio totaled $3.9 billion, up $236 million linked-quarter • Yield 2.36% for 3Q14, down 7 bps linked- quarter • Unrealized gain (net) of $22.1 million on AFS • 58% HTM, 42% AFS • Duration 3.89 compared to 4.12 at June 30, 2014 • Balance sheet is asset sensitive over a 2 year period to rising interest rates under various shock scenarios • IRR modeling is based on conservative assumptions – Flat balance sheet – Loan portfolio 54% variable – Modeled lag in deposit rate increases – % DDA attrition for certain increases in rates $s in millions Period-end balances. As of September 30, 2014 10 |
|
Stronger Levels Of Core Deposit Funding • Total deposits $15.7 billion, up $491 million, or 3%, linked-quarter; linked- quarter increase related to: • $143 million increase in noninterest-bearing demand deposits (DDA) • $246 million increase in interest-bearing transaction and savings deposits • $103 million increase in time deposits (CDs) and interest-bearing public fund deposits • Initiatives put in place last quarter to grow deposits for funding loan growth • Funding mix remained strong • DDA comprised 37% of total period-end deposits • Cost of funds decreased 1 basis point to 21 bps $s in millions; period-end balances 11 $s in billions |
|
Relatively Stable Core NIM Core NIM = reported net interest income (TE) excluding total net purchase accounting adjustments, annualized, as a percent of average earning assets. (See slide 22) As of September 30, 2014 • Reported net interest margin (NIM) 3.81%, down 18 bps linked-quarter; $5 million decline in purchase accounting loan accretion • Core NIM declined 3 bps – Decline in core loan yield (-3bps) and decline in the securities portfolio yield (-7bps) impacted NIM – Decline in cost of funds related to debt repurchase in 2Q14 offset by increased cost of deposits – Better earning asset mix and increased loan volume 12 |
|
Sizeable Declines in Purchased Loan Accretion Expected in Future Quarters Impact of Purchase Accounting Adjustments (projections will be updated quarterly; subject to change) $s in millions As of September 30, 2014 *Projected revenue includes loan accretion from Whitney and Peoples First, offset by amortization of the Whitney bond portfolio premium and amortization of the Peoples First indemnification asset. 13 N/M N/M |
|
Core Noninterest Income Increased Linked-Quarter • Noninterest income, including securities transactions, totaled $57.9 million, up $1.5 million linked-quarter – Amortization of the indemnification asset for FDIC covered loans totaled $2.8 million, compared to $3.3 million in the second quarter; the amortization is a reduction to noninterest income and is result of a lower level of expected future losses on covered loans (non-core) • Noninterest income adjusted for the items noted above increased approximately $1.0 million linked-quarter • Service charges on deposits totaled $20.0 million, up $0.7 million, or 4%, from the second quarter • Bank card and ATM fees totaled $11.6 million, virtually unchanged linked- quarter • Trust fees totaled $11.5 million, unchanged from the second quarter – The second quarter is typically impacted by seasonal tax preparation fees • Fees from secondary mortgage operations totaled $2.3 million, up $0.6 million, or 32%, linked-quarter – A slightly higher percentage of the mortgage loans originated during the quarter were sold in the secondary market compared to 2Q14 As of September 30, 2014 14 |
|
Continuing To Manage To A Lower Level Of Operating Expense • Operating expense totaled $145.2 million in 3Q14, virtually unchanged linked-quarter • 3Q14 operating expense excludes $3.9 million of nonoperating expenses mainly related to the ongoing expense and efficiency initiative (CV-5950) • Personnel expense totaled $80.0 million, an increase of $0.5 million linked-quarter • Occupancy and equipment totaled $15.3 million, up $0.4 million linked-quarter • Net gains on ORE dispositions exceeded ORE expense in 3Q14 by $104,000, compared to $84,000 of net expense in 2Q14 – Management does not expect this low level of ORE expense to be sustainable in future quarters • Other operating expense was virtually unchanged linked-quarter As of September 30, 2014; excluding nonoperating expense items 15 $s in millions |
|
Targeted Efficiency Ratio: Below 60% By 2016 • Continuing to manage expenses in the near-term, however expenses may rise over the next couple of quarters as investments in higher-return, revenue-generating lines of business are made • Remain committed to keeping expenses in line with expectations; expect normal annual increases • Expect to incur additional nonoperating expenses through the remainder of the initiative *The efficiency ratio is noninterest expense to total revenue (TE) excluding amortization of purchased intangibles, nonoperating expense items, and securities transactions. 16 |
|
Recent Revenue Initiatives • Continuing to invest in automation that will lead to additional efficiency and improvements in officer productivity – Business model changes in Indirect Lending have led to volumes and yield improvement – Process and credit automation improvements are increasing volumes and yields in consumer direct, consumer finance, and commercial and business banking segment lending • Continuing initiatives designed to add loan volume, improve pricing and enhance loan/earning asset mix – Recently hired a team of 8 non-energy middle market bankers in Houston • Open strategically located Business Financial Centers with additional teams of relationship bankers – Woodlands (Houston) opened – Jacksonville (Florida) opened – 3 additional BFCs in Houston, Texas and Sarasota, Florida scheduled to open in the next few months • Investments in wealth management products and services – Recently hired an executive to lead our private banking initiatives across the footprint • Deposit product enhancements to create additional sales volume and fee income • Investing in payments lines of business – credit cards and treasury management 17 |
|
Solid Capital Levels • TCE ratio 9.10%, down 19 bps linked-quarter related to organic balance sheet growth and common stock buyback • New 5% common stock buyback authorized by the Board of Directors in July 2014 — Approximately 4 million shares — Repurchased 305,263 shares @ an average price of $32.65 (approximately $10 million) in 3Q14 — Authorization effective through 12/31/15 • Will continue to review additional options to deploy excess capital in the best interest of the Company and its shareholders – Organic growth – Stock buyback – M&A – Dividends As of September 30, 2014 Regulatory Well Target Actual (e) Actual Actual Actual Capital Ratios Minimum Capitalized Minimum 9/30/14 6/30/14 3/31/14 12/31/13 Tangible Common n/a n/a 8.00% 9.10% 9.29% 9.24% 9.00% Tier 1 Risk-Based Capital 4.00% 6.00% 8.00% 11.68% 11.83% 11.90% 11.76% Tier 1 Common n/a n/a 8.00% 11.68% 11.83% 11.90% 11.76% Total Risk-Based Capital 8.00% 10.00% 12.00% 12.76% 12.96% 13.20% 13.11% Leverage Ratio 4.00% 5.00% 7.00% 9.48% 9.61% 9.43% 9.34% 18 |
|
Near-Term Outlook 3Q14 Items to note Outlook Loans +16% LQA +15% Y-o-Y Excludes covered portfolio 10-14% LQA EOP growth for 4Q14 8-12% EOP growth for full year 2015 Purchase Accounting Adjustments $12.1 million pre-tax (see slide 23) Includes items impacting revenue and expense $6 million decline in PAA revenue next quarter (see slide 13) Net Interest Margin (NIM) 3.81% reported 3.32% core Reported down 18bps; Core down 3bps Downward pressure on both core and reported margins; increasing core net interest income Noninterest Expense $145.2 million operating $3.9 million of nonoperating costs Slightly higher in the near term as investments are made in revenue-generating initiatives; to remain in line with 4Q14 expense target of $147 million E.P.S. – operating E.P.S. – core $.59 $.49 See calculation on slides 21 and 23 Operating E.P.S. flat to down due to sizeable quarterly decline in purchase accounting revenue; Core E.P.S. up $.02-$.04 in the near-term 19 |
|
Whitney Bank locations Hancock Bank locations Appendix: Operating Under Two Century-Old Brands 20 |
|
Appendix: EPS calculation $s in thousands, except E.P.S. Three Months Ended 9/30/14 Three Months Ended 6/30/14 Three Months Ended 9/30/13 Operating income to common shareholders $49,079 $49,575 $46,779 Income allocated to participating securities (931) (1,016) (891) Operating income allocated to common shareholders $48,148 $48,559 $45,888 Weighted average common shares – diluted 81,942 82,174 82,205 E.P.S. - diluted $.59 $.59 $.56 See Note 7 in the 2Q14 10Q for more details on the two-class method for E.P.S. calculation. 21 |
|
Appendix: Purchase Accounting Adjustments Core NII & NIM Reconciliation ($s in millions) 3Q14 2Q14 1Q14 4Q13 3Q13 Net Interest Income (TE) – reported (NII) $166.2 $167.3 $168.2 $168.5 $174.1 Whitney expected loan accretion (performing) 5.0 5.8 6.7 9.3 10.4 Whitney expected loan accretion (credit impaired) 17.0 19.8 20.8 18.2 15.8 Peoples First expected loan accretion .8 2.5 2.1 2.8 4.3 Excess cash recoveries* --- --- --- --- 7.7 Total Loan Accretion $22.8 $28.1 $29.7 $30.3 $38.3 Whitney premium bond amortization (1.3) (1.4) (1.5) (1.8) (2.8) Whitney and Peoples First CD accretion --- .1 .1 .1 .1 Total Net Purchase Accounting Adjustments (PAAs) impacting NII $21.5 $26.7 $28.3 $28.5 $35.6 Net Interest Income (TE) – core (Reported NII less net PAAs) $144.7 $140.6 $139.9 $140.0 $138.5 Average Earning Assets $17,324 $16,792 $16,740 $16,377 $16,385 Net Interest Margin – reported 3.81% 3.99% 4.06% 4.09% 4.23% Net Purchase Accounting Adjustments (%) .49% .64% .69% .69% .86% Net Interest Margin - core 3.32% 3.35% 3.37% 3.40% 3.37% * Excess cash recoveries include cash collected on certain zero carrying value acquired loan pools above expected amounts. 22 |
|
Appendix: Non-GAAP Reconciliation (Net Income, ROA, E.P.S.) $s in millions Three Months Ended 9/30/14 Three Months Ended 6/30/14 Three Months Ended 9/30/13 Net income $46.6 $40.0 $33.2 Adjustments from net to operating income Securities transactions gains/(losses) - - - Total nonoperating expense items (pre-tax) 3.9 12.1 20.9 Taxes on adjustments at marginal tax rate 1.4 2.5 7.3 Total adjustments (net of taxes) 2.5 9.6 13.6 Operating income $49.1 $49.6 $46.8 Adjustments from operating to core income PAA – Net Interest Margin (see slide 22) 21.5 26.7 35.6 Intangible Amortization (noninterest expense) -6.6 -6.7 -7.1 Accretion on Indemnification Asset (noninterest income) -2.8 -3.3 -0.6 Total Purchase Accounting Adjustments (PAA) (pre-tax) $12.1 $16.7 $27.9 Taxes on adjustments at marginal tax rate 4.2 5.9 9.8 Total PA adjustments (net of taxes) 7.9 10.8 18.1 Core Income (Operating less purchase accounting items) $41.2 $38.7 $28.7 Average Assets $19,550 $19,039 $18,796 ROA (operating) 1.00% 1.04% 0.99% ROA (core) 0.84% 0.82% 0.61% Weighted Average Diluted Shares (thousands) 81,942 82,174 82,205 E.P.S. (operating) $.59 $.59 $.56 E.P.S. (core) $.49 $.46 $.34 23 |
|
Appendix: Additional Loan Data Portfolio increased approximately $113 million versus a comparable 6/30/14 total. Wholesale sector includes $157 million of distribution credits. 24 $s in millions 9/30/2014 6/30/2014 $ change % change LQA 9/30/2013 $ change % change Loans (EOP) 13,349 $ 12,884 $ 465 $ 4% 14% 11,734 $ 1,614 $ 14% Commercial 5,587 5,394 193 4% 14% 4,625 962 21% Construction 1,096 1,041 55 5% 21% 920 175 19% Real Estate 3,101 3,056 45 1% 6% 2,915 186 6% Residential mortgage 1,858 1,771 87 5% 20% 1,695 163 10% Consumer 1,706 1,622 84 5% 21% 1,579 128 8% Covered Loans 281 $ 304 $ (23) $ -8% 392 $ (111) $ -28% Commercial 11 14 (3) -19% 24 (12) -53% Construction 11 17 (6) -35% 23 (12) -51% Real Estate 42 47 (5) -11% 60 (18) -31% Residential mortgage 185 190 (4) -2% 224 (39) -17% Consumer 32 37 (5) -14% 61 (29) -48% Loans excluding covered 13,068 $ 12,580 $ 488 $ 4% 16% 11,343 $ 1,725 $ 15% Commercial 5,576 5,380 196 4% 15% 4,602 974 21% Construction 1,085 1,023 61 6% 24% 897 187 21% Real Estate 3,059 3,010 50 2% 7% 2,855 204 7% Residential mortgage 1,673 1,582 92 6% 23% 1,471 202 14% Consumer 1,675 1,586 89 6% 22% 1,518 157 10% $s in millions |
|
Appendix: Whitney Portfolio Continues Solid Performance • Loan mark on the acquired-performing portfolio accreted into earnings over the life of the portfolio • Credit-impaired loan mark available for charge-offs; if not needed for charge-offs then accreted into income • Quarterly reviews of accretion levels and portfolio performance will impact reported margin $s in millions Credit- Impaired Performing Total Whitney loan mark at acquisition (as adjusted in 4Q11) $284 $187 $471 Acquired portfolio loan balances at acquisition $818 $6,101 $6,919 Discount at acquisition 34.7% 3.1% 6.8% Remaining Whitney loan mark at 9/30/14 $75 $8 $83 Remaining acquired portfolio loan balances at 9/30/14 $133 $1,732 $1,865 Acquired loan charge-offs from acquisition thru 9/30/14 $25 $14 $39 Discount at 9/30/14 56.4% 0.5% 4.5% As of September 30, 2014 25 |
|
Appendix: Peoples First Loan Mark Used For Charge-Offs • FDIC covered loan portfolio • Entire loan mark available for charge-offs; if not needed for charge-offs then accreted into income • Quarterly reviews of accretion levels and portfolio performance will impact reported margin • FDIC loss share receivable totaled $81.9 million at September 30, 2014 $s in millions Credit Impaired Peoples First loan mark at acquisition (12/2009) $509 Charge-offs from acquisition thru 9/30/14 $429 Accretion since acquisition date $90 Remaining loan mark at 9/30/14 $34 Impairment reserve at 9/30/14 $35 Remaining covered portfolio loan balances at 9/30/14 $315 Discount & allowance at 9/30/14 22% As of September 30, 2014 26 |
|
Third Quarter 2014 Financial Results October 23, 2014 Third Quarter 2014 Financial Results October 23, 2014 |