Investor Meetings December 2014 Investor Meetings December 2014 Exhibit 99.1 |
Certain of the statements or information included in this presentation may constitute forward-looking statements. Forward-looking statements include projections of revenue, costs, results of operations or financial condition or statements regarding future market conditions or our potential plans and strategies for the future. Hancock’s ability to accurately project results or predict the effects of future plans or strategies is inherently limited. We believe that the expectations reflected or implied by any forward-looking statements are based on reasonable assumptions, but actual results and performance could differ materially from those set forth in the forward-looking statements. Factors that could cause actual results or outcomes to differ from those expressed in the Company's forward-looking statements include, but are not limited to, those outlined in Hancock's SEC filings, including the “Risk Factors” section of the Company’s 10-K for the year ended December 31, 2013 and form 10-Q for the most recent quarter end. Hancock undertakes no obligation to update or revise any forward-looking statements, and you are cautioned not to place undue reliance on such forward-looking statements. Forward Looking Statement 2 |
Hancock Holding Company • $20 billion in Total Assets • $13.3 billion in Total Loans • $15.7 billion in Total Deposits • ROA (operating) 1.00% • ROTCE (operating) 11.28% • NIM 3.81% • Efficiency Ratio 61.84% • TCE 9.10% • Rated among the strongest, safest financial institutions in the country by BauerFinancial, Inc. • Earned top customer service marks with Greenwich Excellence Awards As of September 30, 2014 3 |
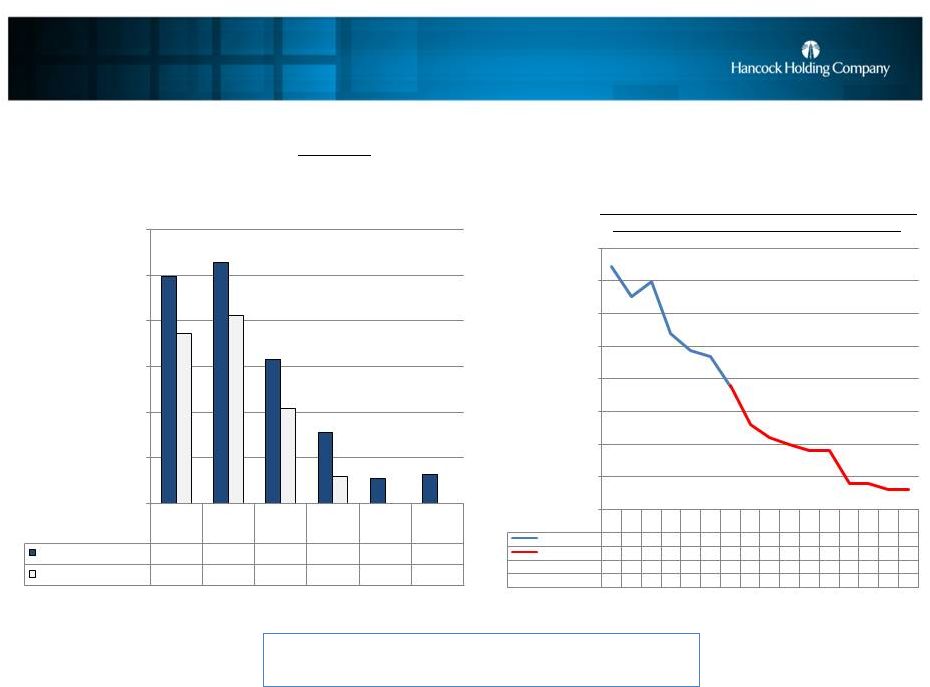
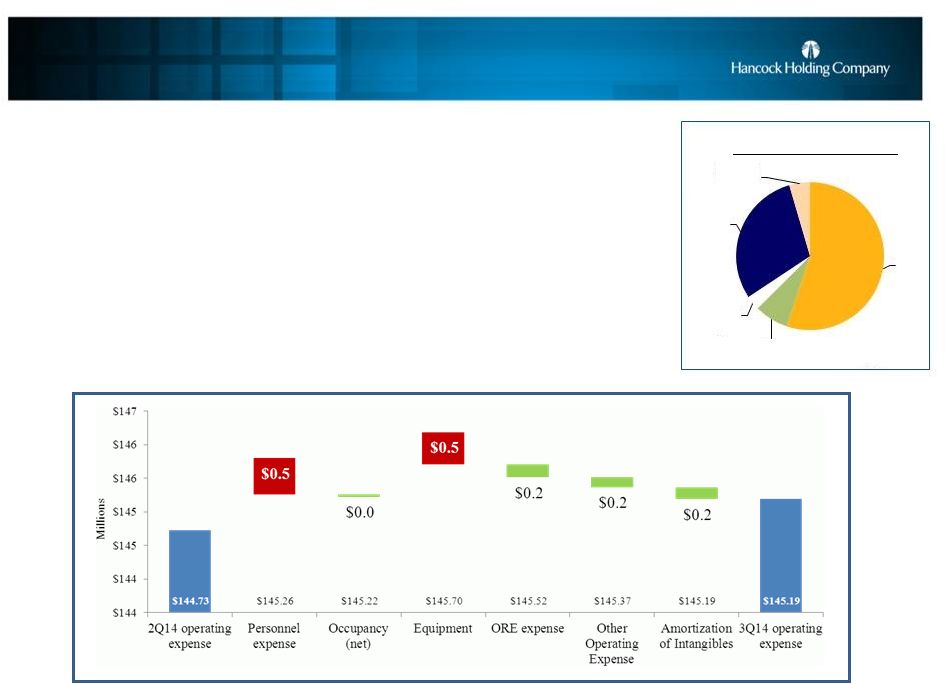
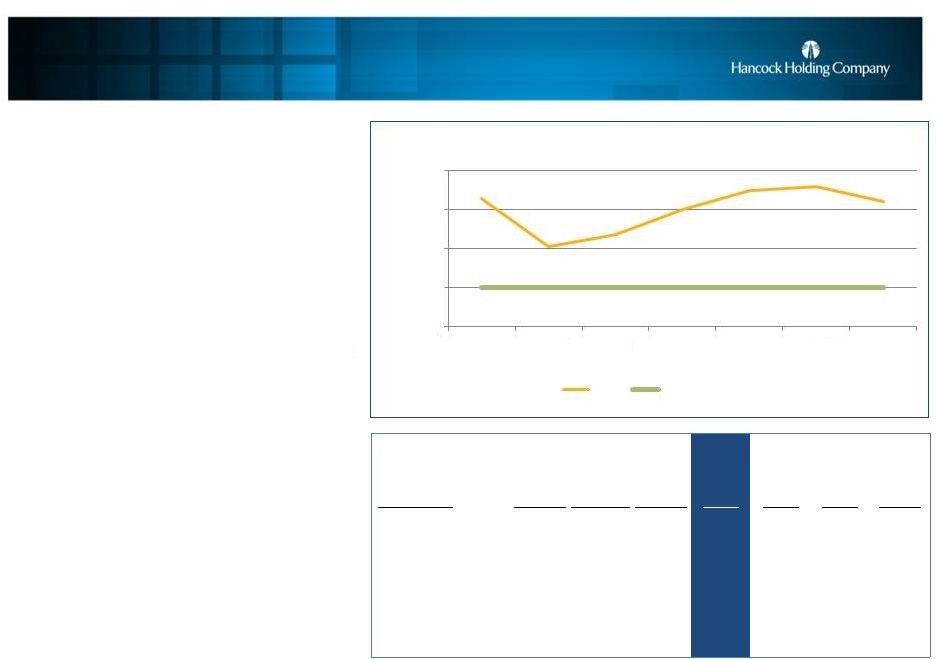
Third Quarter 2014 Highlights • Operating income $49.1 million or $.59 per diluted common share, flat linked-quarter • Core income $41.2 million or $.49 per diluted common share, up 6.5% linked-quarter • Net loan growth of $488 million, or 16%, linked-quarter annualized; approximately $1.7 billion, or 15%, year-over- year loan growth (each excluding the FDIC-covered portfolio) • Net deposit growth of $491 million, or 13% linked-quarter annualized; completely funding the loan growth in the third quarter • An increase of $5 million in core revenue offset a $5 million decline in purchase accounting revenue • Operating expenses remained relatively stable and below the targeted expense goal for 4Q14 • Solid capital levels with a tangible common equity (TCE) ratio of 9.10%; approximately $10 million of capital used to repurchase stock during the quarter • Return on average assets (ROA) (operating) 1.00% down 4bps; core ROA up 2bps; total assets grew to $20 billion from 2Q14 Operating income is defined as net income excluding tax-effected securities transactions gains or losses and nonoperating expense items. * Core is defined as operating results less purchase accounting adjustments. See table on slide 24. ** Noninterest expense to total revenue (TE) excluding amortization of purchased intangibles, nonoperating expense items, and securities transactions. ($s in millions; except per share data) 3Q14 2Q14 LQ change Operating Income $49.1 $49.6 -1% Earnings Per Share (diluted) - operating $.59 $.59 --- Net Income $46.6 $40.0 +16.5% Earnings Per Share (diluted) $.56 $.48 +16.7% Nonoperating expense items $3.9 $12.1 n/m Return on Assets (operating) (%) 1.00 1.04 -4bps Return on Tangible Common Equity (operating) (%) 11.28 11.75 -47bps Total Loans (excluding covered loans) $13,068 $12,580 +4% Net Interest Margin (%) 3.81 3.99 -18bps Net Interest Margin (%) (core)* 3.32 3.35 -3bps Net Charge-offs (%) (non-covered) 0.19 0.13 +6bps Tangible Common Equity (%) 9.10 9.29 -19bps Efficiency Ratio** (%) 61.84 61.67 +17bps 4 |
E.P.S. Improving Trends in Core Results; Narrowing The Gap Between Reported and Core ROA Core is defined as operating results less purchase accounting adjustments (PAA). PAA items include loan accretion from Whitney and Peoples First, offset by amortization of the Whitney bond portfolio premium, amortization of the Peoples First indemnification asset and amortization of intangibles. Operating income is defined as net income excluding tax-effected securities transactions gains or losses and nonoperating expense items. See table on slide 24. 5 0.62% 0.64% 0.61% 0.70% 0.80% 0.82% 0.84% 1.03% 0.99% 0.99% 0.97% 1.05% 1.04% 1.00% 0.41% 0.35% 0.38% 0.27% 0.25% 0.22% 0.16% 0.00% 0.20% 0.40% 0.60% 0.80% 1.00% 1.20% 1Q13 2Q13 3Q13 4Q13 1Q14 2Q14 3Q14 Core ROA Operating ROA "PAA Gap" $0.34 $0.36 $0.34 $0.39 $0.45 $0.46 $0.49 $0.56 $0.55 $0.56 $0.55 $0.58 $0.59 $0.59 $0.22 $0.19 $0.22 $0.16 $0.13 $0.13 $0.10 $0.00 $0.10 $0.20 $0.30 $0.40 $0.50 $0.60 $0.70 1Q13 2Q13 3Q13 4Q13 1Q14 2Q14 3Q14 Core EPS Operating EPS "PAA Gap" |
Less Than $8 Million Quarterly Gap Between Operating and Core Net Income Core is defined as operating results less purchase accounting adjustments (PAA). PAA items include loan accretion from Whitney and Peoples First, offset by amortization of the Whitney bond portfolio premium, amortization of the Peoples First indemnification asset and amortization of intangibles. Operating income is defined as net income excluding tax-effected securities transactions gains or losses and nonoperating expense items. See table on slide 24. Replaced $11.5 million of quarterly PAA income with core earnings since 1Q13 (after-tax) 6 $29.2 $30.3 $28.7 $32.8 $37.7 $38.7 $41.2 $48.6 $46.9 $45.8 $49.1 $49.6 $49.1 $16.6 $18.1 $13.0 $11.4 $10.9 $7.9 $0 $10 $30 $40 $50 1Q13 2Q13 3Q13 4Q13 1Q14 2Q14 3Q14 $46.8 $19.4 $20 Core income Operating income "PAA Gap" |
Switch From Expense Reductions To Revenue Growth In Offsetting Declining PAA Insurance Business Lines Divestiture 26 Branch Closures 12 Branch Sales/Closures $s in millions 7 1Q13 2Q13 3Q13 4Q13 1Q14 2Q14 3Q14 Core Revenue $200 $203 $202 $201 $201 $200 $205 PAA impact (pre-tax) $30 $25 $28 $20 $17 $17 $12 Operating Expense $160 $162 $161 $157 $147 $145 $145 $140 $150 $160 $170 $180 $190 $200 $180 $185 $195 $200 $205 $210 $190 |
Loans Have Grown Steadily Since 1Q13 • Excluding FDIC covered loans, total loans of $13.1 billion were up $488 million, or 16% LQA • All markets across the franchise reported net loan growth during the quarter, with south Louisiana, Houston and central Florida generating approximately half of the increase • Mortgage and indirect lending generated approximately 30% of the quarter’s net loan growth $s in billions; LQA excludes covered loans $s in millions; period-end balances; includes covered loans $s in millions $s in millions 8 1Q13 2Q13 3Q13 4Q13 1Q14 2Q14 3Q14 Avg Qtrly Loans $11.5 $11.6 $11.8 $11.9 $12.4 $12.7 $13.1 LQA EOP growth -2% 9% 3% 22% 8% 13% 16% $11.0 $11.5 $12.0 $12.5 $13.0 $13.5 C&I $5,587 42% C&D $1,096 8% CRE $3,101 23% Mortgage $1,858 14% Consumer $1,706 13% Total Loans $13,349 million 9/30/14 C&I $193 42% C&D $55 12% CRE $45 9% Mortgage $87 19% Consumer $28 6% Indirect $56 12% 3 qtr net loan growth by category +$465 million rd |
Solid Asset Quality Metrics • Nonperforming assets totaled $147 million, down $10 million from June 30, 2014 – Nonperforming loans declined $6.7 million linked-quarter – ORE and foreclosed assets declined $3.6 million linked-quarter – NPA ratio 1.10%, down from 1.22% linked-quarter • The allowance for loan losses was $125.6 million (.94%) compared to $128.7 million (1.00%) linked-quarter – The allowance maintained on the noncovered portion of the loan portfolio increased $3.4 million linked-quarter, totaling $90.9 million – The allowance on the covered loan portfolio declined $6.5 million linked-quarter • Provision for loan losses was $9.5 million, up from $6.7 million in 2Q14 – The provision for noncovered loans was $9.9 million in the third quarter, compared to $6.8 million in the second quarter • Noncovered net charge-offs totaled $6.4 million, or 0.19%, up from $4.1 million, or 0.13%, in 2Q14 As of September 30, 2014 9 Nonperforming Asset (NPA) Ratio 1.98% 1.84% 1.83% 1.50% 1.43% 1.22% 1.10% 1Q13 2Q13 3Q13 4Q13 1Q14 2Q14 3Q14 |
Oil & Gas Portfolio Strong; Monitoring For Signs of Stress • Relationship business dating back to post WWII • Excellent source of no/low cost core deposits • Diversified portfolio with concentration limits for individual categories • High credit quality portfolio with historically low loss rates; disciplined underwriting • Monitoring prices and other industry metrics for signs of stress • E&P portfolio is approximately 60% oil/40% gas • Most of our E&P customers have hedges in place • Service and supply sector company earnings and margins may drop but companies can still be profitable and remain liquid • Majority of credits in the wholesale sector are convenience stores and will be favorably impacted by declining oil prices • Our borrowers typically have low/moderate leverage, strong balance sheets and experienced management • Companies can pull back on discretionary spending, reduce capital expenditures • Low prices can limit loan growth for new bank customers • Companies break even at different prices/barrel oil (Bbl) – Breakeven prices can range from approximately $20 Bbl to their reserve ecomomic limits ($100 Bbl, $200 Bbl) – Breakeven varies depending on the basin – Lower cost basins will remain active; higher cost basins will slow in activity • Current price decks: $75 Bbl base case; $65 Bbl sensitivity case; both under review • Should pricing pressures continue we could see some downgrades, but not expecting significant charge-offs 10 As of September 30, 2014; comments related to recent decline in oil prices. |
Securities Portfolio No Longer Funding Loan Growth • Portfolio totaled $3.9 billion, up $236 million linked-quarter • Yield 2.36% for 3Q14, down 7 bps linked- quarter • Unrealized gain (net) of $22.1 million on AFS • 58% HTM, 42% AFS • Duration 3.89 compared to 4.12 at June 30, 2014 • Balance sheet is asset sensitive over a 2 year period to rising interest rates under various shock scenarios • IRR modeling is based on conservative assumptions – Flat balance sheet – Loan portfolio 54% variable – Modeled lag in deposit rate increases – % DDA attrition for certain increases in rates $s in millions Period-end balances. As of September 30, 2014 11 CMO $1,232 32% MBS $2,145 55% Munis $202 5% U. S. Agencies and other $312 8% Securities Portfolio Mix 9/30/14 |
Stronger Levels Of Core Deposit Funding • Total deposits $15.7 billion, up $491 million, or 3%, linked-quarter; linked- quarter increase related to: • $143 million increase in noninterest-bearing demand deposits (DDA) • $246 million increase in interest-bearing transaction and savings deposits • $103 million increase in time deposits (CDs) and interest-bearing public fund deposits • Initiatives put in place last quarter to grow deposits for funding loan growth • Funding mix remained strong • DDA comprised 37% of total period-end deposits • Cost of funds decreased 1 basis point to 21 bps $s in billions $s in millions; period-end balances 12 1Q13 2Q13 3Q13 4Q13 1Q14 2Q14 3Q14 Avg Qtrly Deposits $15.3 $15.2 $15.0 $14.9 $15.3 $15.1 $15.4 LQA EOP growth -13% 3% 3% 8% 2% 1% 13% $13.5 $14.0 $14.5 $15.0 $15.5 - - - - Noninterest $5,866 37% Interest- bearing savings 40% Interest- bearing public $1,535 10% Time deposits $2,010 13% Total Deposits $15,737 million /30/14 funds Transaction & $6,326 bearing 9 Noninterest $143 29% Interest- bearing transaction & $246 50% Interest- bearing public funds $50 10% Time deposits $53 11% 3rd qtr net deposit growth by category +$491 million bearing savings |
Relatively Stable Core NIM As of September 30, 2014 • Reported net interest margin (NIM) 3.81%, down 18 bps linked-quarter; $5 million decline in purchase accounting loan accretion • Core NIM declined 3 bps – Decline in core loan yield (-3bps) and decline in the securities portfolio yield (-7bps) impacted NIM – Decline in cost of funds related to debt repurchase in 2Q14 offset by increased cost of deposits – Better earning asset mix and increased loan volume 13 5.41% 5.10% 5.00% 4.86% 4.63% 4.12% 4.09% 4.02% 3.97% 3.94% 2.24% 2.43% 2.47% 2.43% 2.36% 0.24% 0.23% 0.23% 0.22% 0.21% 3Q13 4Q13 1Q14 2Q14 3Q14 Loan Yield reported Loan Yield core* Securities Yield reported Cost of Funds - - - - reported $135 $136 $137 $138 $139 $140 $141 $142 $143 $144 $145 $146 0.00% 0.50% 1.00% 1.50% 2.00% 2.50% 3.00% 3.50% 4.00% 4.50% 4.23% 4.09% 4.06% 3.99% 3.81% 3.37% 3.40% 3.37% 3.35% 3.32% 3Q13 4Q13 1Q14 2Q14 3Q14 Core NII NIM - reported NIM - core Core NIM = reported net interest income (TE) excluding total net purchase accounting adjustments, annualized, as a percent of average earning assets. (See slide 23) |
Sizeable Declines in Purchased Loan Accretion Expected in Future Quarters Impact of Purchase Accounting Adjustments (projections will be updated quarterly; subject to change) $s in millions As of September 30, 2014 *Projected revenue includes loan accretion from Whitney and Peoples First, offset by amortization of the Whitney bond portfolio premium and amortization of the Peoples First indemnification asset. 14 N/M N/M N/M N/M N/M N/M 2012 2013 2014 2015 2016 Post 2016 Revenue impact* $124 $132 $79 $39 $14 $16 Pre- tax impact PAA $93 $103 $52 $15 $0 $25 $50 $75 $100 $125 $150 Projected PAA Revenue Reflects Sizeable Quarterly Declines in 4Q14 and 1Q16 Due To Lower Loan Accretion Totals 1Q13 2Q13 3Q13 4Q13 1Q14 2Q14 3Q14 4Q14 1Q15 2Q15 3Q15 E 1Q16 2Q16 3Q16 4Q16 PAA Revenue - E E E E 4Q15 E E E E act* 37 33 35 27 24 23 19 PAA Revenue - Intangible Amort Pre- tax impact proj* 13 11 10 9 9 4 4 3 3 7 7 7 7 7 7 7 6 6 6 6 6 5 5 5 5 30 25 28 20 17 17 12 7 5 4 3 3 -1 1 2 2 - - - $0 $5 $10 $15 $20 $25 $30 $35 $40 |
Core Noninterest Income Increased Linked-Quarter • Noninterest income, including securities transactions, totaled $57.9 million, up $1.5 million linked-quarter • Noninterest income adjusted for the items noted above increased approximately $1.0 million linked-quarter • Service charges on deposits totaled $20.0 million, up $0.7 million, or 4%, from the second quarter • Bank card and ATM fees totaled $11.6 million, virtually unchanged linked- quarter • Trust fees totaled $11.5 million, unchanged from the second quarter – The second quarter is typically impacted by seasonal tax preparation fees • Fees from secondary mortgage operations totaled $2.3 million, up $0.6 million, or 32%, linked-quarter – A slightly higher percentage of the mortgage loans originated during the quarter were sold in the secondary market compared to 2Q14 $s in millions As of September 30, 2014 15 Service Charges on Deposit $20.0 35% Trust $11.5 20% Investment & annuity $5.5 9% Insurance $2.0 3% Bankcard and ATM $11.6 20% Secondary mortgage operations $2.3 4% Other $5.0 9% 0% Fee Mix 3Q14 Amortization of the indemnification asset for FDIC covered loans totaled $2.8 million, compared to $3.3 million in the second quarter; the amortization is a reduction to noninterest income and is result of a lower level of expected future losses on covered loans (non-core) – |
Continuing To Manage To A Lower Level Of Operating Expense • Operating expense totaled $145.2 million in 3Q14, virtually unchanged linked-quarter • 3Q14 operating expense excludes $3.9 million of nonoperating expenses mainly related to the ongoing expense and efficiency initiative (CV-5950) • Personnel expense totaled $80.0 million, an increase of $0.5 million linked-quarter • Occupancy and equipment totaled $15.3 million, up $0.4 million linked-quarter • Net gains on ORE dispositions exceeded ORE expense in 3Q14 by $104,000, compared to $84,000 of net expense in 2Q14 – Management does not expect this low level of ORE expense to be sustainable in future quarters • Other operating expense was virtually unchanged linked-quarter As of September 30, 2014; excluding nonoperating expense items 16 $s in millions Personnel $80.0 55% Occupancy $10.8 7% Equipment $4.5 3% Other $43.2 30% Amortization of intangibles $6.6 5% Operating Expense Mix 3Q14 |
Targeted Efficiency Ratio: Below 60% By 2016 • Continuing to manage expenses in the near-term, however expenses may rise over the next couple of quarters as investments in higher-return, revenue-generating lines of business are made • Remain committed to keeping expenses in line with expectations; expect normal annual increases • Expect to incur additional nonoperating expenses through the remainder of the initiative 17 55% 60% 65% 70% 1Q13 2Q13 3Q13 4Q13 1Q14 2Q14 3Q14 Efficiency Ratio* Efficiency Ratio ER Target *The efficiency ratio is noninterest expense to total revenue (TE) excluding amortization of purchased intangibles, nonoperating expense items, and securities transactions. |
Recent Revenue Initiatives • Continuing to invest in automation that will lead to additional efficiency and improvements in officer productivity – Business model changes in Indirect Lending have led to volumes and yield improvement – Process and credit automation improvements are increasing volumes and yields in consumer direct, consumer finance, and commercial and business banking segment lending • Continuing initiatives designed to add loan volume, improve pricing and enhance loan/earning asset mix – Recently hired a team of 8 non-energy middle market bankers in Houston • Open strategically located Business Financial Centers with additional teams of relationship bankers – Woodlands (Houston) opened – Jacksonville (Florida) opened – 3 additional BFCs in Houston, Texas and Sarasota, Florida scheduled to open in the next few months • Investments in wealth management products and services – Recently hired an executive to lead our private banking initiatives across the footprint • Deposit product enhancements to create additional sales volume and fee income • Investing in payments lines of business – credit cards and treasury management 18 |
Solid Capital Levels • TCE ratio 9.10%, down 19 bps linked-quarter related to organic balance sheet growth and common stock buyback • New 5% common stock buyback authorized by the Board of Directors in July 2014 — Approximately 4 million shares — Repurchased 305,263 shares @ an average price of $32.65 (approximately $10 million) in 3Q14 — Authorization effective through 12/31/15 • Will continue to review additional options to deploy excess capital in the best interest of the Company and its shareholders – Organic growth – Stock buyback – M&A – Dividends *Stock Buyback (ASR) initiated As of September 30, 2014 Regulatory Well Target Actual (e) Actual Actual Actual Capital Ratios Minimum Capitalized Minimum 9/30/14 6/30/14 3/31/14 12/31/13 Tangible Common n/a n/a 8.00% 9.10% 9.29% 9.24% 9.00% Tier 1 Risk-Based Capital 4.00% 6.00% 8.00% 11.68% 11.83% 11.90% 11.76% Tier 1 Common n/a n/a 8.00% 11.68% 11.83% 11.90% 11.76% Total Risk-Based Capital 8.00% 10.00% 12.00% 12.76% 12.96% 13.20% 13.11% Leverage Ratio 4.00% 5.00% 7.00% 9.48% 9.61% 9.43% 9.34% 19 7.50% 8.00% 8.50% 9.00% 9.50% 1Q13 2Q13* 3Q13 4Q13 1Q14 2Q14 3Q14 TCE Minimum Target Tangible Common Equity (TCE) Ratio |
Near-Term Outlook 3Q14 Items to note Outlook Loans +16% LQA +15% Y-o-Y Excludes covered portfolio 10-14% LQA EOP growth for 4Q14 8-12% EOP growth for full year 2015 Purchase Accounting Adjustments $12.1 million pre-tax (see slide 24) Includes items impacting revenue and expense $6 million decline in PAA revenue next quarter (see slide 14) Net Interest Margin (NIM) 3.81% reported 3.32% core Reported down 18bps; Core down 3bps Downward pressure on both core and reported margins; increasing core net interest income Noninterest Expense $145.2 million operating $3.9 million of nonoperating costs Slightly higher in the near term as investments are made in revenue-generating initiatives; to remain in line with 4Q14 expense target of $147 million E.P.S. – operating E.P.S. – core $.59 $.49 See calculation on slides 22 and 24 Operating E.P.S. flat to down due to sizeable quarterly decline in purchase accounting revenue; Core E.P.S. up $.02-$.04 in the near-term 20 |
Appendix: Operating Under Two Century-Old Brands 21 Whitney Bank locations Hancock Bank locations |
Appendix: EPS calculation $s in thousands, except E.P.S. Three Months Ended 9/30/14 Three Months Ended 6/30/14 Three Months Ended 9/30/13 Operating income to common shareholders $49,079 $49,575 $46,779 Income allocated to participating securities (931) (1,016) (891) Operating income allocated to common shareholders $48,148 $48,559 $45,888 Weighted average common shares – diluted 81,942 82,174 82,205 E.P.S. - diluted $.59 $.59 $.56 See Note 7 in the 3Q14 10Q for more details on the two-class method for E.P.S. calculation. 22 |
Appendix: Purchase Accounting Adjustments Core NII & NIM Reconciliation ($s in millions) 3Q14 2Q14 1Q14 4Q13 3Q13 $166.2 $167.3 $168.2 $168.5 $174.1 Whitney expected loan accretion (performing) 5.0 5.8 6.7 9.3 10.4 Whitney expected loan accretion (credit impaired) 17.0 19.8 20.8 18.2 15.8 Peoples First expected loan accretion .8 2.5 2.1 2.8 4.3 Excess cash recoveries* --- --- --- --- 7.7 Total Loan Accretion $22.8 $28.1 $29.7 $30.3 $38.3 Whitney premium bond amortization (1.3) (1.4) (1.5) (1.8) (2.8) Whitney and Peoples First CD accretion --- .1 .1 .1 .1 $21.5 $26.7 $28.3 $28.5 $35.6 $144.7 $139.9 $140.0 $138.5 Average Earning Assets 3.81% 3.99% 4.06% 4.09% 4.23% Net Purchase Accounting Adjustments (%) .49% .64% .69% .69% .86% 3.32% 3.35% 3.37% 3.40% 3.37% * Excess cash recoveries include cash collected on certain zero carrying value acquired loan pools above expected amounts. 23 Net Interest Income (TE) – reported (NII) Total Net Purchase Accounting Adjustments (PAAs) impacting NII Net Interest Income (TE) – core (Reported NII less net PAAs) Net Interest Margin – reported Net Interest Margin - core $17,324 $16,792 $16,740 $16,377 $16,385 $140.6 |
Appendix: Non-GAAP Reconciliation (Net Income, ROA, E.P.S.) $s in millions Three Months Ended 9/30/14 Three Months Ended 6/30/14 Three Months Ended 9/30/13 Net income $46.6 $40.0 $33.2 Adjustments from net to operating income Securities transactions gains/(losses) - - - Total nonoperating expense items (pre-tax) 3.9 12.1 20.9 Taxes on adjustments at marginal tax rate 1.4 2.5 7.3 Total adjustments (net of taxes) 2.5 9.6 13.6 Operating income $49.1 $49.6 $46.8 Adjustments from operating to core income PAA – Net Interest Margin (see slide 23) 21.5 26.7 35.6 Intangible Amortization (noninterest expense) -6.6 -6.7 -7.1 Accretion on Indemnification Asset (noninterest income) -2.8 -3.3 -0.6 Total Purchase Accounting Adjustments (PAA) (pre-tax) $12.1 $16.7 $27.9 Taxes on adjustments at marginal tax rate 4.2 5.9 9.8 Total PA adjustments (net of taxes) 7.9 10.8 18.1 Core Income (Operating less purchase accounting items) $41.2 $38.7 $28.7 Average Assets $19,550 $19,039 $18,796 ROA (operating) 1.00% 1.04% 0.99% ROA (core) 0.84% 0.82% 0.61% Weighted Average Diluted Shares (thousands) 81,942 82,174 82,205 E.P.S. (operating) $.59 $.59 $.56 E.P.S. (core) $.49 $.46 $.34 24 |
Appendix: Additional Loan Data 25 $s in millions Loans (EOP) 13,349 $ 12,884 $ 465 $ 4% 14% 11,734 $ 1,614 $ 14% Commercial 5,587 5,394 193 4% 14% 4,625 962 21% Construction 1,096 1,041 55 5% 21% 920 175 19% Real Estate 3,101 3,056 45 1% 6% 2,915 186 6% Residential mortgage 1,858 1,771 87 5% 20% 1,695 163 10% Consumer 1,706 1,622 84 5% 21% 1,579 128 8% Covered Loans 281 $ 304 $ (23) $ -8% 392 $ (111) $ -28% Commercial 11 14 (3) -19% 24 (12) -53% Construction 11 17 (6) -35% 23 (12) -51% Real Estate 42 47 (5) -11% 60 (18) -31% Residential mortgage 185 190 (4) -2% 224 (39) -17% Consumer 32 37 (5) -14% 61 (29) -48% Loans excluding covered 13,068 $ 12,580 $ 488 $ 4% 16% 11,343 $ 1,725 $ 15% Commercial 5,576 5,380 196 4% 15% 4,602 974 21% Construction 1,085 1,023 61 6% 24% 897 187 21% Real Estate 3,059 3,010 50 2% 7% 2,855 204 7% Residential mortgage 1,673 1,582 92 6% 23% 1,471 202 14% Consumer 1,675 1,586 89 6% 22% 1,518 157 10% 9/30/2014 6/30/2014 $ change % change LQA 9/30/2013 $ change % change |
Appendix: Whitney Portfolio Continues Solid Performance • Loan mark on the acquired-performing portfolio accreted into earnings over the life of the portfolio • Credit-impaired loan mark available for charge-offs; if not needed for charge-offs then accreted into income • Quarterly reviews of accretion levels and portfolio performance will impact reported margin As of September 30, 2014 26 $s in millions Credit- Impaired Performing Total Whitney loan mark at acquisition (as adjusted in 4Q11) $284 $187 $471 Acquired portfolio loan balances at acquisition $818 $6,101 $6,919 Discount at acquisition 34.7% 3.1% 6.8% Remaining Whitney loan mark at 9/30/14 $75 $8 $83 Remaining acquired portfolio loan balances at 9/30/14 $133 $1,732 $1,865 Acquired loan charge-offs from acquisition thru 9/30/14 $25 $14 $39 Discount at 9/30/14 56.4% 0.5% 4.5% |
Appendix: Peoples First Loan Mark Used For Charge-Offs • FDIC covered loan portfolio • Entire loan mark available for charge-offs; if not needed for charge-offs then accreted into income • Quarterly reviews of accretion levels and portfolio performance will impact reported margin • FDIC loss share receivable totaled $81.9 million at September 30, 2014 $s in millions Credit Impaired Peoples First loan mark at acquisition (12/2009) $509 Charge-offs from acquisition thru 9/30/14 $429 Accretion since acquisition date $90 Remaining loan mark at 9/30/14 $34 Impairment reserve at 9/30/14 $35 Remaining covered portfolio loan balances at 9/30/14 $315 Discount & allowance at 9/30/14 22% As of September 30, 2014 27 |
Investor Meetings December 2014 Investor Meetings December 2014 |