Exhibit 99.1

For Immediate Release
July 23, 2015
For More Information
Trisha Voltz Carlson
SVP, Investor Relations Manager
504.299.5208
trisha.carlson@hancockbank.com
Hancock reports second quarter 2015 financial results
Positive results from ongoing initiatives and strategies evident in quarterly results
GULFPORT, Miss. (July 23, 2015) — Hancock Holding Company (Nasdaq: HBHC) today announced its financial results for the second quarter of 2015. Operating income for the second quarter of 2015 was $40.6 million, or $.51 per diluted common share, compared to $44.7 million, or $.55, in the first quarter of 2015. Operating income was $49.6 million, or $.59, in the second quarter of 2014. We define our operating income as net income excluding tax-effected securities transactions gains or losses and nonoperating expense items. Nonoperating expenses totaled $8.9 million (pre-tax) and $7.3 million (pre-tax), in the second and first quarters of 2015, respectively, and $12.1 million (pre-tax) in the second quarter of 2014. Management believes that operating income is one useful measure of our financial performance that helps investors compare the company’s fundamental operational performance from period to period. The financial tables include a reconciliation of net income to operating income.
Net income for the second quarter of 2015 was $34.8 million, or $.44 per diluted common share, compared to $40.2 million, or $.49 in the first quarter of 2015 and $40.0 million, or $.48, in the second quarter of 2014.
“The second quarter operating results reflect efforts over the last several quarters at growing earning assets and core revenue,” said John M. Hairston, President and CEO. “Organic balance sheet growth, increases in both net interest income and fees (excluding the impact of purchase accounting items), continued expense management discipline, solid capital levels and strong credit quality, despite the impact of today’s energy cycle, all reflect the improved quality of our earnings. We remain focused on continuing these efforts, and I look forward to reporting additional progress in future quarters.”
Highlights of the company’s second quarter of 2015 results:
| • | An approximate $7.5 million, or $.06 per share, decline in linked-quarter net purchase accounting income negatively impacted both operating and net results |
| • | Earnings increased $0.8 million, or 2% linked-quarter (excluding the tax-effected impact of net purchase accounting items and nonoperating items) |
1
Hancock reports second quarter 2015 financial results
July 23, 2015
| • | E.P.S. (excluding the tax-effected impact of net purchase accounting items and nonoperating items) increased 4% linked-quarter |
| • | Loans increased $420 million, or 12% linked-quarter annualized (LQA), funded by an increase in deposits of $441 million, or 10% LQA |
| • | Total assets of $21.5 billion; up $814 million or 4% from March 31, 2015 |
| • | Fee income (excluding accretion in indemnification asset) up almost $5 million or 8% from the first quarter of 2015 |
| • | Loan loss provision reflects additional build for the energy portfolio, including the impact of the shared national credit (SNC) review, offset by improvements in other loan portfolio measures |
| • | NIM of 3.30% reflects the expected drop in accretion income linked-quarter, the full quarter impact of the subordinated debt issuance in March 2015 and a drop in the overall yield of the securities portfolio |
| • | Nonoperating expenses totaled approximately $9 million, pre-tax |
Over the past several quarters we have disclosed our focus on strategic initiatives that are designed to replace declining levels of purchase accounting income from acquisitions with improvement in core income, which the company defines as operating income excluding tax-effected purchase accounting adjustments. As of this quarter, the impact to the company’s bottom line from net purchase accounting items has substantially diminished, and core results are now equal to operating results.
Loans
Total loans at June 30, 2015 were $14.3 billion, up $420 million from March 31, 2015. Net loan growth during the quarter was across many markets within the footprint, with additional growth in indirect, mortgage and specialty finance.
At June 30, 2015, loans in the energy segment totaled $1.67 billion, or 12% of total loans. The energy portfolio declined approximately $5 million linked-quarter and is comprised of credits to both the E&P industry and support industries. Additional details of the energy portfolio are included in the presentation slides posted on our Investor Relations website.
Average loans totaled $14.1 billion for the second quarter of 2015, up $270 million, or 2%, linked-quarter.
Deposits
Total deposits at June 30, 2015 were $17.3 billion, up $441 million, or 3%, from March 31, 2015. Average deposits for the second quarter of 2015 were $16.9 billion, up $377 million, or 2%, linked-quarter.
Noninterest-bearing demand deposits (DDAs) totaled $6.2 billion at June 30, 2015, virtually unchanged from March 31, 2015. DDAs comprised 36% of total period-end deposits at June 30, 2015.
2
Hancock reports second quarter 2015 financial results
July 23, 2015
Interest-bearing transaction and savings deposits totaled $7.0 billion at the end of the second quarter of 2015, up $418 million, or 6%, from March 31, 2015. Time deposits of $2.2 billion decreased $90 million, or 4%, while interest-bearing public fund deposits increased $134 million, or 7%, to $2.0 billion at June 30, 2015.
Asset Quality
Nonperforming assets (NPAs) totaled $165 million at June 30, 2015, up $24 million from March 31, 2015. During the second quarter of 2015, total nonperforming loans increased approximately $28 million while foreclosed and surplus real estate (ORE) and other foreclosed assets decreased approximately $4 million. The net increase in nonperforming loans was mainly related to one energy loan (nondrilling support) which was downgraded during the quarter. Nonperforming assets as a percent of total loans, ORE and other foreclosed assets was 1.15% at June 30, 2015, up 14 bps from March 31, 2015.
The total allowance for loan losses was $131 million at June 30, 2015, up $2.7 million from March 31, 2015. The ratio of the allowance for loan losses to period-end loans was 0.91% at June 30, 2015, virtually unchanged from March 31, 2015. The allowance maintained on the non-FDIC acquired portion of the loan portfolio increased $6.3 million linked-quarter, totaling $107 million, and the impaired reserve on the FDIC acquired loan portfolio declined $3.6 million linked-quarter.
Pricing pressures on oil continued during the second quarter and led to additional downward pressure on risk ratings. Based on those changes, plus updates to the qualitative factors related to energy, the reserve for the energy portfolio increased $10.6 million linked-quarter. Management believes that if further risk rating downgrades occur they could lead to additional loan loss provisions but not translate to significant losses. The impact and severity of risk rating migration, associated provision and net charge-offs will depend on overall oil price reduction and the duration of the cycle. Additional details of the energy portfolio are included in the presentation slides posted on our Investor Relations website.
Net charge-offs from the non-FDIC acquired loan portfolio were $1.2 million, or 0.03% of average total loans on an annualized basis in the second quarter of 2015, down from $3.7 million, or 0.11% of average total loans in the first quarter of 2015.
During the second quarter of 2015, Hancock recorded a total provision for loan losses of $6.6 million, up $0.5 million from the first quarter of 2015.
Net Interest Income and Net Interest Margin
Net interest income (TE) for the second quarter of 2015 was $154.9 million, down $6.2 million from the first quarter of 2015. During the second quarter, net interest income from purchase accounting adjustments (PAAs) declined $7.6 million compared to the first quarter of 2015. Excluding the impact from purchase accounting items, core net interest income increased $1.4 million linked-quarter. Average earning assets were $18.8 billion for the second quarter of 2015, up $465 million, or 3%, from the first quarter of 2015.
3
Hancock reports second quarter 2015 financial results
July 23, 2015
The reported net interest margin (TE) was 3.30% for the second quarter of 2015, down 25 bps from the first quarter of 2015. Approximately 18 bps of the decline was related to the decrease in purchase accounting adjustments noted above. The core net interest margin (reported net interest income (TE) excluding total net purchase accounting adjustments, annualized, as a percent of average earning assets) declined 7 bps to 3.14% during the second quarter of 2015. Declines in the core loan yield (-3 bps) and the securities portfolio yield (-13 bps) were the main drivers of the margin compression. A full quarter’s impact from interest on the issuance of $150 million in holding company subordinated debt in early March led to a 4 bps increase in the total cost of funds.
Noninterest Income
Noninterest income, including securities transactions, totaled $60.9 million for the second quarter of 2015, up $4.3 million, or 8%, from the first quarter of 2015. Also included in the total is a reduction of $1.3 million related to the amortization of the FDIC indemnification asset, compared to a reduction of $1.2 million in the first quarter of 2015. Excluding the impact of this item and securities transactions, core noninterest income totaled $62.1 million, up $4.7 million linked-quarter.
Service charges on deposits totaled $17.9 million for the second quarter of 2015, up $0.6 million, or 3%, from the first quarter of 2015. Bank card and ATM fees totaled $11.9 million, up $0.7 million, or 6%, from the first quarter of 2015.
Trust fees totaled $11.8 million, up $0.6 million, or 5%, linked-quarter. The increase was due, in part, to seasonal tax prep fees. Investment and annuity income and insurance fees totaled $7.4 million, up $0.6 million, or 9%, linked-quarter.
Fees from secondary mortgage operations totaled $3.6 million for the second quarter of 2015, up $1 million, or 36%, linked-quarter. During the second quarter, a greater portion of loan production was sold in the secondary market compared to last quarter. Management expects this trend to continue through 2015.
Other noninterest income totaled $9.5 million, up $1.3 million, or 16%, from the first quarter of 2015.
Noninterest Expense & Taxes
Noninterest expense for the second quarter of 2015 totaled $158.9 million and included $8.9 million of nonoperating expenses. Excluding these costs, operating expenses totaled $150.0 million in the second quarter of 2015, up $3.8 million, or 3%, linked-quarter. (The details of the changes in the noninterest expense categories noted below exclude the impact of nonoperating items.)
4
Hancock reports second quarter 2015 financial results
July 23, 2015
Total personnel expense was $82.5 million in the second quarter of 2015, up $2.4 million, or 3%, from the first quarter of 2015. The increase reflects additional incentive pay in the second quarter, partially offset by a seasonal decrease in benefits.
Occupancy and equipment expense totaled $15.8 million in the second quarter of 2015, up $0.7 million, or 5%, from the first quarter of 2015.
ORE expense totaled $0.5 million for the second quarter of 2015, virtually unchanged linked-quarter.
Other operating expense totaled $45.0 million in the second quarter of 2015, up $0.7 million, or 2%, from the first quarter of 2015.
The effective income tax rate for the second quarter 2015 was 26%, virtually unchanged from the first quarter of 2015. Management expects the effective income tax rate to approximate 25-27% in 2015. The effective income tax rate continues to be less than the statutory rate of 35% due primarily to tax-exempt income and tax credits.
Capital
Common shareholders’ equity at June 30, 2015 totaled $2.4 billion. The tangible common equity (TCE) ratio was 8.12%, down 28 bps from March 31, 2015, mainly reflecting the growth in total assets during the quarter.
Additional capital ratios are included in the financial tables.
Conference Call and Slide Presentation
Management will host a conference call for analysts and investors at 9:00 a.m. Central Time on Friday, July 24, 2015 to review the results. A live listen-only webcast of the call will be available under the Investor Relations section of Hancock’s website atwww.hancockbank.com. Additional financial tables and a slide presentation related to second quarter results are also posted as part of the webcast link. To participate in the Q&A portion of the call, dial (877) 564-1219 or (973) 638-3429. An audio archive of the conference call will be available under the Investor Relations section of our website. A replay of the call will also be available through July 31, 2015 by dialing (855) 859-2056 or (404) 537-3406, passcode 77019845.
About Hancock Holding Company
Hancock Holding Company is a financial services company with regional business headquarters and locations throughout a growing Gulf South corridor. The company’s banking subsidiary provides a comprehensive network of full-service financial choices through Hancock Bank locations in Mississippi, Alabama, and Florida and Whitney Bank offices in Louisiana and Texas, including traditional and online banking; commercial and small business banking; energy banking; private banking; trust and investment services; certain insurance services; mortgage services; and consumer financing. More information and online banking are available atwww.hancockbank.com andwww.whitneybank.com.
5
Hancock reports second quarter 2015 financial results
July 23, 2015
Forward-Looking Statements
This news release contains “forward-looking statements” within the meaning of section 27A of the Securities Act of 1933, as amended, and section 21E of the Securities Exchange Act of 1934, as amended, and we intend such forward-looking statements to be covered by the safe harbor provisions therein and are including this statement for purposes of invoking these safe-harbor provisions. Forward-looking statements provide projections of results of operations or of financial condition or state other forward-looking information, such as expectations about future conditions and descriptions of plans and strategies for the future. Forward-looking statements that we may make include, but may not be limited to, comments with respect to future levels of economic activity in our markets, including the impact of volatility of oil and gas prices on our energy portfolio and associated loan loss reserves and the downstream impact on businesses that support the energy sector, especially in the Gulf Coast region, loan growth expectations, deposit trends, credit quality trends, net interest margin trends, future expense levels, success of revenue-generating initiatives, projected tax rates, future profitability, improvements in expense to revenue (efficiency) ratio, purchase accounting impacts such as accretion levels, the impact of the branch rationalization process, possible repurchases of shares under stock buyback programs, and the financial impact of regulatory requirements. Hancock’s ability to accurately project results, predict the effects of future plans or strategies, or predict market or economic developments is inherently limited. Although Hancock believes that the expectations reflected in its forward-looking statements are based on reasonable assumptions, actual results and performance could differ materially from those set forth in the forward-looking statements. Factors that could cause actual results to differ from those expressed in Hancock’s forward-looking statements include, but are not limited to, those risk factors included in Hancock’s public filings with the Securities and Exchange Commission, which are available at the SEC’s internet site(http://www.sec.gov). You are cautioned not to place undue reliance on these forward-looking statements. Hancock does not intend, and undertakes no obligation, to update or revise any forward-looking statements, whether as a result of differences in actual results, changes in assumptions or changes in other factors affecting such statements, except as required by law.
6
HANCOCK HOLDING COMPANY
FINANCIAL HIGHLIGHTS
(Unaudited)
| Three Months Ended | Six Months Ended | |||||||||||||||||||
(amounts in thousands, except per share data) | 6/30/2015 | 3/31/2015 | 6/30/2014 | 6/30/2015 | 6/30/2014 | |||||||||||||||
INCOME STATEMENT DATA | ||||||||||||||||||||
Net interest income | $ | 151,791 | $ | 158,158 | $ | 164,778 | $ | 309,949 | $ | 330,340 | ||||||||||
Net interest income (TE) (a) | 154,879 | 161,114 | 167,332 | 315,993 | 335,530 | |||||||||||||||
Provision for loan losses | 6,608 | 6,154 | 6,691 | 12,762 | 14,654 | |||||||||||||||
Noninterest income excluding securities transactions | 60,874 | 56,213 | 56,398 | 117,087 | 113,097 | |||||||||||||||
Securities transactions gains | — | 333 | — | 333 | — | |||||||||||||||
Noninterest expense (excluding nonoperating items) | 149,990 | 146,201 | 144,727 | 296,191 | 291,709 | |||||||||||||||
Nonoperating items | 8,927 | 7,314 | 12,131 | 16,241 | 12,131 | |||||||||||||||
Net income | 34,829 | 40,159 | 39,962 | 74,988 | 89,077 | |||||||||||||||
Operating income (b) | 40,631 | 44,697 | 49,575 | 85,328 | 98,690 | |||||||||||||||
|
|
|
|
|
|
|
|
|
| |||||||||||
PERIOD-END BALANCE SHEET DATA | ||||||||||||||||||||
Loans | $ | 14,344,752 | $ | 13,924,386 | $ | 12,884,056 | $ | 14,344,752 | $ | 12,884,056 | ||||||||||
Investment securities | 4,445,452 | 4,107,904 | 3,677,229 | 4,445,452 | 3,677,229 | |||||||||||||||
Earning assets | 19,409,963 | 18,568,037 | 17,023,990 | 19,409,963 | 17,023,990 | |||||||||||||||
Total assets | 21,538,405 | 20,724,511 | 19,349,431 | 21,538,405 | 19,349,431 | |||||||||||||||
Noninterest-bearing deposits | 6,180,814 | 6,201,403 | 5,723,663 | 6,180,814 | 5,723,663 | |||||||||||||||
Total deposits | 17,301,788 | 16,860,485 | 15,245,227 | 17,301,788 | 15,245,227 | |||||||||||||||
Common shareholders’ equity | 2,430,040 | 2,425,098 | 2,492,582 | 2,430,040 | 2,492,582 | |||||||||||||||
|
|
|
|
|
|
|
|
|
| |||||||||||
AVERAGE BALANCE SHEET DATA | ||||||||||||||||||||
Loans | $ | 14,138,904 | $ | 13,869,397 | $ | 12,680,861 | $ | 14,004,895 | $ | 12,530,922 | ||||||||||
Investment securities (c) | 4,143,097 | 3,772,997 | 3,716,563 | 3,959,069 | 3,825,484 | |||||||||||||||
Earning assets | 18,780,771 | 18,315,839 | 16,791,744 | 18,549,589 | 16,766,191 | |||||||||||||||
Total assets | 20,875,090 | 20,443,859 | 19,039,264 | 20,660,666 | 19,047,142 | |||||||||||||||
Noninterest-bearing deposits | 6,107,900 | 5,924,196 | 5,505,735 | 6,016,623 | 5,502,878 | |||||||||||||||
Total deposits | 16,862,088 | 16,485,259 | 15,060,581 | 16,674,782 | 15,164,285 | |||||||||||||||
Common shareholders’ equity | 2,430,710 | 2,447,870 | 2,463,385 | 2,439,242 | 2,449,758 | |||||||||||||||
|
|
|
|
|
|
|
|
|
| |||||||||||
COMMON SHARE DATA | ||||||||||||||||||||
Earnings per share - diluted | $ | 0.44 | $ | 0.49 | $ | 0.48 | $ | 0.93 | $ | 1.06 | ||||||||||
Operating earnings per share - diluted (b) | 0.51 | 0.55 | 0.59 | 1.06 | 1.17 | |||||||||||||||
Cash dividends per share | $ | 0.24 | $ | 0.24 | $ | 0.24 | $ | 0.48 | $ | 0.48 | ||||||||||
Book value per share (period-end) | $ | 31.12 | $ | 31.14 | $ | 30.45 | $ | 31.12 | $ | 30.45 | ||||||||||
Tangible book value per share (period-end) | 21.63 | 21.55 | 21.08 | 21.63 | 21.08 | |||||||||||||||
Weighted average number of shares - diluted | 78,115 | 79,661 | 82,174 | 78,881 | 82,348 | |||||||||||||||
Period-end number of shares | 78,094 | 77,886 | 81,860 | 78,094 | 81,860 | |||||||||||||||
Market data | ||||||||||||||||||||
High sales price | $ | 32.98 | $ | 31.13 | $ | 37.86 | $ | 32.98 | $ | 38.50 | ||||||||||
Low sales price | 28.02 | 24.96 | 32.02 | 24.96 | 32.02 | |||||||||||||||
Period-end closing price | 31.91 | 29.86 | 35.32 | 31.91 | 35.32 | |||||||||||||||
Trading volume | 40,162 | 51,866 | 27,432 | 92,029 | 58,760 | |||||||||||||||
|
|
|
|
|
|
|
|
|
| |||||||||||
PERFORMANCE RATIOS | ||||||||||||||||||||
Return on average assets | 0.67 | % | 0.80 | % | 0.84 | % | 0.73 | % | 0.94 | % | ||||||||||
Return on average assets - operating (b) | 0.78 | % | 0.89 | % | 1.04 | % | 0.83 | % | 1.04 | % | ||||||||||
Return on average common equity | 5.75 | % | 6.65 | % | 6.51 | % | 6.20 | % | 7.33 | % | ||||||||||
Return on average common equity - operating (b) | 6.70 | % | 7.41 | % | 8.07 | % | 7.05 | % | 8.12 | % | ||||||||||
Return on average tangible common equity | 8.28 | % | 9.60 | % | 9.47 | % | 8.94 | % | 10.73 | % | ||||||||||
Return on average tangible common equity - operating (b) | 9.66 | % | 10.68 | % | 11.75 | % | 10.17 | % | 11.89 | % | ||||||||||
Tangible common equity ratio (d) | 8.12 | % | 8.40 | % | 9.29 | % | 8.12 | % | 9.29 | % | ||||||||||
Net interest margin (TE) (a) | 3.30 | % | 3.55 | % | 3.99 | % | 3.43 | % | 4.03 | % | ||||||||||
Average loan/deposit ratio | 83.85 | % | 84.13 | % | 84.20 | % | 83.99 | % | 82.63 | % | ||||||||||
Efficiency ratio (e) | 66.67 | % | 64.36 | % | 61.67 | % | 65.51 | % | 61.95 | % | ||||||||||
Allowance for loan losses as a percent of period-end loans | 0.91 | % | 0.92 | % | 1.00 | % | 0.91 | % | 1.00 | % | ||||||||||
Annualized net non-FDIC acquired charge-offs to average loans | 0.03 | % | 0.11 | % | 0.13 | % | 0.07 | % | 0.13 | % | ||||||||||
Allowance for loan losses to non-performing loans + accruing loans 90 days past due | 100.92 | % | 123.14 | % | 126.26 | % | 100.92 | % | 126.26 | % | ||||||||||
Noninterest income excluding securities transactions as a percent of total revenue (TE) (a) | 28.21 | % | 25.87 | % | 25.21 | % | 27.04 | % | 25.21 | % | ||||||||||
FTE Total Headcount | 3,825 | 3,785 | 3,901 | 3,825 | 3,901 | |||||||||||||||
| (a) | Tax-equivalent (TE) amounts are calculated using a federal income tax rate of 35%. |
| (b) | Net income less tax-effected securities transactions and nonoperating items. Management believes that operating income provides a useful measure of financial performance that helps investors compare the Company’s fundamental operations over time. |
| (c) | Average securities does not include unrealized holding gains/losses on available for sale securities. |
| (d) | The tangible common equity ratio is common shareholders’ equity less intangible assets divided by total assets less intangible assets. |
| (e) | The efficiency ratio is noninterest expense to total net interest (TE) and noninterest income, excluding amortization of purchased intangibles, nonoperating items, and securities transactions. |
7
HANCOCK HOLDING COMPANY
QUARTERLY HIGHLIGHTS
(Unaudited)
| Three Months Ended | ||||||||||||||||||||
(amounts in thousands, except per share data) | 6/30/2015 | 3/31/2015 | 12/31/2014 | 9/30/2014 | 6/30/2014 | |||||||||||||||
INCOME STATEMENT DATA | ||||||||||||||||||||
Net interest income | $ | 151,791 | $ | 158,158 | $ | 160,813 | $ | 163,541 | $ | 164,778 | ||||||||||
Net interest income (TE) (a) | 154,879 | 161,114 | 163,581 | 166,230 | 167,332 | |||||||||||||||
Provision for loan losses | 6,608 | 6,154 | 9,718 | 9,468 | 6,691 | |||||||||||||||
Noninterest income excluding securities transactions | 60,874 | 56,213 | 56,961 | 57,941 | 56,398 | |||||||||||||||
Securities transactions gains | — | 333 | — | — | — | |||||||||||||||
Noninterest expense (excluding nonoperating items) | 149,990 | 146,201 | 144,080 | 145,192 | 144,727 | |||||||||||||||
Nonoperating items | 8,927 | 7,314 | 9,667 | 3,887 | 12,131 | |||||||||||||||
Net income | 34,829 | 40,159 | 40,092 | 46,553 | 39,962 | |||||||||||||||
Operating income (b) | 40,631 | 44,697 | 46,376 | 49,079 | 49,575 | |||||||||||||||
|
|
|
|
|
|
|
|
|
| |||||||||||
PERIOD-END BALANCE SHEET DATA | ||||||||||||||||||||
Loans | $ | 14,344,752 | $ | 13,924,386 | $ | 13,895,276 | $ | 13,348,574 | $ | 12,884,056 | ||||||||||
Investment securities | 4,445,452 | 4,107,904 | 3,826,454 | 3,913,370 | 3,677,229 | |||||||||||||||
Earning assets | 19,409,963 | 18,568,037 | 18,544,930 | 17,748,600 | 17,023,990 | |||||||||||||||
Total assets | 21,538,405 | 20,724,511 | 20,747,266 | 19,985,950 | 19,349,431 | |||||||||||||||
Noninterest-bearing deposits | 6,180,814 | 6,201,403 | 5,945,208 | 5,866,255 | 5,723,663 | |||||||||||||||
Total deposits | 17,301,788 | 16,860,485 | 16,572,831 | 15,736,694 | 15,245,227 | |||||||||||||||
Common shareholders’ equity | 2,430,040 | 2,425,098 | 2,472,402 | 2,509,342 | 2,492,582 | |||||||||||||||
|
|
|
|
|
|
|
|
|
| |||||||||||
AVERAGE BALANCE SHEET DATA | ||||||||||||||||||||
Loans | $ | 14,138,904 | $ | 13,869,397 | $ | 13,578,223 | $ | 13,102,108 | $ | 12,680,861 | ||||||||||
Investment securities (c) | 4,143,097 | 3,772,997 | 3,836,123 | 3,780,089 | 3,716,563 | |||||||||||||||
Earning assets | 18,780,771 | 18,315,839 | 17,911,143 | 17,324,444 | 16,791,744 | |||||||||||||||
Total assets | 20,875,090 | 20,443,859 | 20,090,372 | 19,549,947 | 19,039,264 | |||||||||||||||
Noninterest-bearing deposits | 6,107,900 | 5,924,196 | 5,849,356 | 5,707,523 | 5,505,735 | |||||||||||||||
Total deposits | 16,862,088 | 16,485,259 | 15,892,507 | 15,371,209 | 15,060,581 | |||||||||||||||
Common shareholders’ equity | 2,430,710 | 2,447,870 | 2,509,509 | 2,489,948 | 2,463,385 | |||||||||||||||
|
|
|
|
|
|
|
|
|
| |||||||||||
COMMON SHARE DATA | ||||||||||||||||||||
Earnings per share - diluted | $ | 0.44 | $ | 0.49 | $ | 0.48 | $ | 0.56 | $ | 0.48 | ||||||||||
Operating earnings per share - diluted (b) | 0.51 | 0.55 | 0.56 | 0.59 | 0.59 | |||||||||||||||
Cash dividends per share | $ | 0.24 | $ | 0.24 | $ | 0.24 | $ | 0.24 | $ | 0.24 | ||||||||||
Book value per share (period-end) | $ | 31.12 | $ | 31.14 | $ | 30.74 | $ | 30.76 | $ | 30.45 | ||||||||||
Tangible book value per share (period-end) | 21.63 | 21.55 | 21.37 | 21.44 | 21.08 | |||||||||||||||
Weighted average number of shares - diluted | 78,115 | 79,661 | 81,530 | 81,942 | 82,174 | |||||||||||||||
Period-end number of shares | 78,094 | 77,886 | 80,426 | 81,567 | 81,860 | |||||||||||||||
Market data | ||||||||||||||||||||
High sales price | $ | 32.98 | $ | 31.13 | $ | 35.67 | $ | 36.47 | $ | 37.86 | ||||||||||
Low sales price | 28.02 | 24.96 | 28.68 | 31.25 | 32.02 | |||||||||||||||
Period-end closing price | 31.91 | 29.86 | 30.70 | 32.05 | 35.32 | |||||||||||||||
Trading volume | 40,162 | 51,866 | 36,396 | 25,553 | 27,432 | |||||||||||||||
|
|
|
|
|
|
|
|
|
| |||||||||||
PERFORMANCE RATIOS | ||||||||||||||||||||
Return on average assets | 0.67 | % | 0.80 | % | 0.79 | % | 0.94 | % | 0.84 | % | ||||||||||
Return on average assets - operating (b) | 0.78 | % | 0.89 | % | 0.92 | % | 1.00 | % | 1.04 | % | ||||||||||
Return on average common equity | 5.75 | % | 6.65 | % | 6.34 | % | 7.42 | % | 6.51 | % | ||||||||||
Return on average common equity - operating (b) | 6.70 | % | 7.41 | % | 7.33 | % | 7.82 | % | 8.07 | % | ||||||||||
Return on average tangible common equity | 8.28 | % | 9.60 | % | 9.08 | % | 10.70 | % | 9.47 | % | ||||||||||
Return on average tangible common equity - operating (b) | 9.66 | % | 10.68 | % | 10.50 | % | 11.28 | % | 11.75 | % | ||||||||||
Tangible common equity ratio (d) | 8.12 | % | 8.40 | % | 8.59 | % | 9.10 | % | 9.29 | % | ||||||||||
Net interest margin (TE) (a) | 3.30 | % | 3.55 | % | 3.63 | % | 3.81 | % | 3.99 | % | ||||||||||
Average loan/deposit ratio | 83.85 | % | 84.13 | % | 85.44 | % | 85.24 | % | 84.20 | % | ||||||||||
Efficiency ratio (e) | 66.67 | % | 64.36 | % | 62.41 | % | 61.84 | % | 61.67 | % | ||||||||||
Allowance for loan losses as a percent of period-end loans | 0.91 | % | 0.92 | % | 0.93 | % | 0.94 | % | 1.00 | % | ||||||||||
Annualized net non-FDIC acquired charge-offs to average loans | 0.03 | % | 0.11 | % | 0.08 | % | 0.19 | % | 0.13 | % | ||||||||||
Allowance for loan losses to non-performing loans + accruing loans 90 days past due | 100.92 | % | 123.14 | % | 137.96 | % | 128.44 | % | 126.26 | % | ||||||||||
Noninterest income excluding securities transactions as a percent of total revenue (TE) (a) | 28.21 | % | 25.87 | % | 25.83 | % | 25.85 | % | 25.21 | % | ||||||||||
FTE headcount | 3,825 | 3,785 | 3,794 | 3,787 | 3,901 | |||||||||||||||
| (a) | Tax-equivalent (TE) amounts are calculated using a federal income tax rate of 35%. |
| (b) | Net income less tax-effected securities transactions and nonoperating expense items. Management believes that operating income provides a useful measure of financial performance that helps investors compare the Company’s fundamental operations over time. |
| (c) | Average securities does not include unrealized holding gains/losses on available for sale securities. |
| (d) | The tangible common equity ratio is common shareholders’ equity less intangible assets divided by total assets less intangible assets. |
| (e) | The efficiency ratio is noninterest expense to total net interest (TE) and noninterest income, excluding amortization of purchased intangibles, nonoperating expense items, and securities transactions. |
8
HANCOCK HOLDING COMPANY
INCOME STATEMENT
(Unaudited)
| Three Months Ended | Six Months Ended | |||||||||||||||||||
(dollars in thousands, except per share data) | 6/30/2015 | 3/31/2015 | 6/30/2014 | 6/30/2015 | 6/30/2014 | |||||||||||||||
NET INCOME | ||||||||||||||||||||
Interest income | $ | 164,920 | $ | 169,087 | $ | 174,001 | $ | 334,007 | $ | 349,141 | ||||||||||
Interest income (TE) | 168,008 | 172,043 | 176,555 | 340,051 | 354,331 | |||||||||||||||
Interest expense | 13,129 | 10,929 | 9,223 | 24,058 | 18,801 | |||||||||||||||
|
|
|
|
|
|
|
|
|
| |||||||||||
Net interest income (TE) | 154,879 | 161,114 | 167,332 | 315,993 | 335,530 | |||||||||||||||
Provision for loan losses | 6,608 | 6,154 | 6,691 | 12,762 | 14,654 | |||||||||||||||
Noninterest income excluding securities transactions | 60,874 | 56,213 | 56,398 | 117,087 | 113,097 | |||||||||||||||
Securities transactions gains | — | 333 | — | 333 | — | |||||||||||||||
Noninterest expense | 158,917 | 153,515 | 156,858 | 312,432 | 303,840 | |||||||||||||||
|
|
|
|
|
|
|
|
|
| |||||||||||
Income before income taxes | 47,140 | 55,035 | 57,627 | 102,175 | 124,943 | |||||||||||||||
Income tax expense | 12,311 | 14,876 | 17,665 | 27,187 | 35,866 | |||||||||||||||
|
|
|
|
|
|
|
|
|
| |||||||||||
Net income | $ | 34,829 | $ | 40,159 | $ | 39,962 | $ | 74,988 | $ | 89,077 | ||||||||||
|
|
|
|
|
|
|
|
|
| |||||||||||
ADJUSTMENTS FROM NET TO OPERATING INCOME | ||||||||||||||||||||
Securities transactions gains | — | (333 | ) | — | (333 | ) | — | |||||||||||||
Nonoperating items | ||||||||||||||||||||
Impact of insurance business lines divestiture | — | — | (9,101 | ) | — | (9,101 | ) | |||||||||||||
FDIC resolution of denied claims | 1,854 | — | 10,268 | — | 10,268 | |||||||||||||||
Nonoperating expense items | 7,073 | 7,314 | 7,503 | 16,241 | 7,503 | |||||||||||||||
Early debt redemption | — | — | 3,461 | — | 3,461 | |||||||||||||||
|
|
|
|
|
|
|
|
|
| |||||||||||
Total nonoperating items | 8,927 | 7,314 | 12,131 | 16,241 | 12,131 | |||||||||||||||
Taxes on adjustments at marginal tax rate | 3,125 | 2,443 | 2,518 | 5,568 | 2,518 | |||||||||||||||
|
|
|
|
|
|
|
|
|
| |||||||||||
Total adjustments (net of taxes) | 5,802 | 4,538 | 9,613 | 10,340 | 9,613 | |||||||||||||||
|
|
|
|
|
|
|
|
|
| |||||||||||
Operating income (f) | $ | 40,631 | $ | 44,697 | $ | 49,575 | $ | 85,328 | $ | 98,690 | ||||||||||
|
|
|
|
|
|
|
|
|
| |||||||||||
NONINTEREST INCOME AND NONINTEREST EXPENSE | ||||||||||||||||||||
Service charges on deposit accounts | $ | 17,908 | $ | 17,315 | $ | 19,269 | $ | 35,223 | $ | 37,981 | ||||||||||
Trust fees | 11,795 | 11,200 | 11,499 | 22,995 | 21,737 | |||||||||||||||
Bank card and ATM fees | 11,868 | 11,183 | 11,596 | 23,051 | 22,165 | |||||||||||||||
Investment & annuity fees | 4,838 | 5,050 | 5,097 | 9,888 | 10,049 | |||||||||||||||
Secondary mortgage market operations | 3,618 | 2,664 | 1,758 | 6,282 | 3,723 | |||||||||||||||
Insurance commissions and fees | 2,595 | 1,754 | 1,888 | 4,349 | 5,632 | |||||||||||||||
Amortization of FDIC loss share receivable | (1,273 | ) | (1,197 | ) | (3,321 | ) | (2,470 | ) | (7,229 | ) | ||||||||||
Other income | 9,525 | 8,244 | 8,612 | 17,769 | 19,039 | |||||||||||||||
|
|
|
|
|
|
|
|
|
| |||||||||||
Noninterest income excluding securities transactions | 60,874 | 56,213 | 56,398 | 117,087 | 113,097 | |||||||||||||||
Securities transactions gains | — | 333 | — | 333 | — | |||||||||||||||
|
|
|
|
|
|
|
|
|
| |||||||||||
Total noninterest income including securities transactions | $ | 60,874 | $ | 56,546 | $ | 56,398 | $ | 117,420 | $ | 113,097 | ||||||||||
|
|
|
|
|
|
|
|
|
| |||||||||||
Personnel expense | $ | 82,533 | $ | 80,117 | $ | 79,506 | $ | 162,650 | $ | 160,938 | ||||||||||
Net occupancy expense | 11,765 | 11,162 | 10,840 | 22,927 | 22,106 | |||||||||||||||
Equipment expense | 4,079 | 3,933 | 4,059 | 8,012 | 8,333 | |||||||||||||||
Other real estate expense, net | 501 | 456 | 84 | 957 | 1,861 | |||||||||||||||
Other operating expense | 44,964 | 44,215 | 43,494 | 89,179 | 84,689 | |||||||||||||||
Amortization of intangibles | 6,148 | 6,318 | 6,744 | 12,466 | 13,782 | |||||||||||||||
|
|
|
|
|
|
|
|
|
| |||||||||||
Total operating expense | 149,990 | 146,201 | 144,727 | 296,191 | 291,709 | |||||||||||||||
Nonoperating expense items | 8,927 | 7,314 | 12,131 | 16,241 | 12,131 | |||||||||||||||
|
|
|
|
|
|
|
|
|
| |||||||||||
Total noninterest expense | $ | 158,917 | $ | 153,515 | $ | 156,858 | $ | 312,432 | $ | 303,840 | ||||||||||
|
|
|
|
|
|
|
|
|
| |||||||||||
COMMON SHARE DATA | ||||||||||||||||||||
Earnings per share: | ||||||||||||||||||||
Basic | $ | 0.44 | $ | 0.49 | $ | 0.48 | $ | 0.93 | $ | 1.06 | ||||||||||
Diluted | 0.44 | 0.49 | 0.48 | 0.93 | 1.06 | |||||||||||||||
Operating earnings per share: (f) | ||||||||||||||||||||
Basic | $ | 0.51 | $ | 0.55 | $ | 0.59 | $ | 1.06 | $ | 1.18 | ||||||||||
Diluted | 0.51 | 0.55 | 0.59 | 1.06 | 1.17 | |||||||||||||||
| (f) | Net income less tax-effected securities transactions and nonoperating items. Management believes that operating income provides a useful measure of financial performance that helps investors compare the Company’s fundamental operations over time. |
9
HANCOCK HOLDING COMPANY
INCOME STATEMENT
(Unaudited)
| Three months ended | ||||||||||||||||||||
(dollars in thousands) | 6/30/2015 | 3/31/2015 | 12/31/2014 | 9/30/2014 | 6/30/2014 | |||||||||||||||
Interest income | $ | 164,920 | $ | 169,087 | $ | 170,971 | $ | 172,701 | $ | 174,001 | ||||||||||
Interest income (TE) | 168,008 | 172,043 | 173,739 | 175,390 | 176,555 | |||||||||||||||
Interest expense | 13,129 | 10,929 | 10,158 | 9,160 | 9,223 | |||||||||||||||
|
|
|
|
|
|
|
|
|
| |||||||||||
Net interest income (TE) | 154,879 | 161,114 | 163,581 | 166,230 | 167,332 | |||||||||||||||
Provision for loan losses | 6,608 | 6,154 | 9,718 | 9,468 | 6,691 | |||||||||||||||
Noninterest income excluding securities transactions | 60,874 | 56,213 | 56,961 | 57,941 | 56,398 | |||||||||||||||
Securities transactions gains | — | 333 | — | — | — | |||||||||||||||
Noninterest expense | 158,917 | 153,515 | 153,747 | 149,079 | 156,858 | |||||||||||||||
|
|
|
|
|
|
|
|
|
| |||||||||||
Income before income taxes | 47,140 | 55,035 | 54,309 | 62,935 | 57,627 | |||||||||||||||
Income tax expense | 12,311 | 14,876 | 14,217 | 16,382 | 17,665 | |||||||||||||||
|
|
|
|
|
|
|
|
|
| |||||||||||
Net income | $ | 34,829 | $ | 40,159 | $ | 40,092 | $ | 46,553 | $ | 39,962 | ||||||||||
|
|
|
|
|
|
|
|
|
| |||||||||||
ADJUSTMENTS FROM NET TO OPERATING INCOME | ||||||||||||||||||||
Securities transactions gains | — | (333 | ) | — | — | — | ||||||||||||||
Nonoperating expense | 8,927 | 7,314 | 9,667 | 3,887 | 12,131 | |||||||||||||||
|
|
|
|
|
|
|
|
|
| |||||||||||
Total nonoperating items | 8,927 | 6,981 | 9,667 | 3,887 | 12,131 | |||||||||||||||
Taxes on adjustments at marginal tax rate | 3,125 | 2,443 | 3,383 | 1,361 | 2,518 | |||||||||||||||
|
|
|
|
|
|
|
|
|
| |||||||||||
Adjustments (net of taxes) | 5,802 | 4,538 | 6,284 | 2,526 | 9,613 | |||||||||||||||
|
|
|
|
|
|
|
|
|
| |||||||||||
Operating income (f) | $ | 40,631 | $ | 44,697 | $ | 46,376 | $ | 49,079 | $ | 49,575 | ||||||||||
|
|
|
|
|
|
|
|
|
| |||||||||||
NONINTEREST INCOME AND NONINTEREST EXPENSE | ||||||||||||||||||||
Service charges on deposit accounts | $ | 17,908 | $ | 17,315 | $ | 19,025 | $ | 20,000 | $ | 19,269 | ||||||||||
Trust fees | 11,795 | 11,200 | 11,559 | 11,530 | 11,499 | |||||||||||||||
Bank card and ATM fees | 11,868 | 11,183 | 11,225 | 11,641 | 11,596 | |||||||||||||||
Investment & annuity fees | 4,838 | 5,050 | 4,736 | 5,506 | 5,097 | |||||||||||||||
Secondary mortgage market operations | 3,618 | 2,664 | 2,000 | 2,313 | 1,758 | |||||||||||||||
Insurance commissions and fees | 2,595 | 1,754 | 1,862 | 1,979 | 1,888 | |||||||||||||||
Amortization of FDIC loss share receivable | (1,273 | ) | (1,197 | ) | (2,113 | ) | (2,760 | ) | (3,321 | ) | ||||||||||
Other income | 9,525 | 8,244 | 8,667 | 7,732 | 8,612 | |||||||||||||||
|
|
|
|
|
|
|
|
|
| |||||||||||
Noninterest income excluding securities transactions | 60,874 | 56,213 | 56,961 | 57,941 | 56,398 | |||||||||||||||
Securities transactions gains | — | 333 | — | — | — | |||||||||||||||
|
|
|
|
|
|
|
|
|
| |||||||||||
Total noninterest income including securities transactions | $ | 60,874 | $ | 56,546 | $ | 56,961 | $ | 57,941 | $ | 56,398 | ||||||||||
|
|
|
|
|
|
|
|
|
| |||||||||||
Personnel expense | $ | 82,533 | $ | 80,117 | $ | 79,522 | $ | 80,043 | $ | 79,506 | ||||||||||
Net occupancy expense | 11,765 | 11,162 | 10,571 | 10,798 | 10,840 | |||||||||||||||
Equipment expense | 4,079 | 3,933 | 3,986 | 4,542 | 4,059 | |||||||||||||||
Other real estate expense, net | 501 | 456 | 1,001 | (104 | ) | 84 | ||||||||||||||
Other operating expense | 44,964 | 44,215 | 42,555 | 43,343 | 43,494 | |||||||||||||||
Amortization of intangibles | 6,148 | 6,318 | 6,445 | 6,570 | 6,744 | |||||||||||||||
|
|
|
|
|
|
|
|
|
| |||||||||||
Total operating expense | 149,990 | 146,201 | 144,080 | 145,192 | 144,727 | |||||||||||||||
Nonoperating expense items | 8,927 | 7,314 | 9,667 | 3,887 | 12,131 | |||||||||||||||
|
|
|
|
|
|
|
|
|
| |||||||||||
Total noninterest expense | $ | 158,917 | $ | 153,515 | $ | 153,747 | $ | 149,079 | $ | 156,858 | ||||||||||
|
|
|
|
|
|
|
|
|
| |||||||||||
| (f) | Net income less tax-effected securities transactions and nonoperating items. Management believes that operating income provides a useful measure of financial performance that helps investors compare the Company’s fundamental operations over time. |
10
HANCOCK HOLDING COMPANY
PERIOD-END BALANCE SHEET
(Unaudited)
| Three Months Ended | ||||||||||||||||||||
(dollars in thousands) | 6/30/2015 | 3/31/2015 | 12/31/2014 | 9/30/2014 | 6/30/2014 | |||||||||||||||
ASSETS | ||||||||||||||||||||
Commercial non-real estate loans | $ | 6,185,684 | $ | 5,987,084 | $ | 6,044,060 | $ | 5,587,137 | $ | 5,393,691 | ||||||||||
Construction and land development loans | 1,120,947 | 1,113,510 | 1,106,761 | 1,095,902 | 1,040,656 | |||||||||||||||
Commercial real estate loans | 3,212,833 | 3,150,103 | 3,144,048 | 3,100,834 | 3,056,263 | |||||||||||||||
Residential mortgage loans | 1,955,837 | 1,913,885 | 1,894,181 | 1,858,490 | 1,771,271 | |||||||||||||||
Consumer loans | 1,869,451 | 1,759,804 | 1,706,226 | 1,706,211 | 1,622,175 | |||||||||||||||
|
|
|
|
|
|
|
|
|
| |||||||||||
Total loans | 14,344,752 | 13,924,386 | 13,895,276 | �� | 13,348,574 | 12,884,056 | ||||||||||||||
Loans held for sale | 21,304 | 19,950 | 20,252 | 15,098 | 22,017 | |||||||||||||||
Securities | 4,445,452 | 4,107,904 | 3,826,454 | 3,913,370 | 3,677,229 | |||||||||||||||
Short-term investments | 598,455 | 515,797 | 802,948 | 471,558 | 440,688 | |||||||||||||||
|
|
|
|
|
|
|
|
|
| |||||||||||
Earning assets | 19,409,963 | 18,568,037 | 18,544,930 | 17,748,600 | 17,023,990 | |||||||||||||||
Allowance for loan losses | (131,087 | ) | (128,386 | ) | (128,762 | ) | (125,572 | ) | (128,672 | ) | ||||||||||
Goodwill | 621,193 | 621,193 | 621,193 | 621,193 | 621,193 | |||||||||||||||
Other intangible assets, net | 119,256 | 125,404 | 132,810 | 139,256 | 145,825 | |||||||||||||||
Other assets | 1,519,080 | 1,538,263 | 1,577,095 | 1,602,473 | 1,687,095 | |||||||||||||||
|
|
|
|
|
|
|
|
|
| |||||||||||
Total assets | $ | 21,538,405 | $ | 20,724,511 | $ | 20,747,266 | $ | 19,985,950 | $ | 19,349,431 | ||||||||||
|
|
|
|
|
|
|
|
|
| |||||||||||
LIABILITIES | ||||||||||||||||||||
Noninterest-bearing deposits | $ | 6,180,814 | $ | 6,201,403 | $ | 5,945,208 | $ | 5,866,255 | $ | 5,723,663 | ||||||||||
Interest-bearing transaction and savings deposits | 6,994,603 | 6,576,658 | 6,531,628 | 6,325,671 | 6,079,837 | |||||||||||||||
Interest-bearing public fund deposits | 1,962,589 | 1,828,559 | 1,982,616 | 1,534,678 | 1,484,188 | |||||||||||||||
Time deposits | 2,163,782 | 2,253,865 | 2,113,379 | 2,010,090 | 1,957,539 | |||||||||||||||
|
|
|
|
|
|
|
|
|
| |||||||||||
Total interest-bearing deposits | 11,120,974 | 10,659,082 | 10,627,623 | 9,870,439 | 9,521,564 | |||||||||||||||
|
|
|
|
|
|
|
|
|
| |||||||||||
Total deposits | 17,301,788 | 16,860,485 | 16,572,831 | 15,736,694 | 15,245,227 | |||||||||||||||
Short-term borrowings | 1,079,193 | 755,250 | 1,151,573 | 1,171,809 | 1,063,664 | |||||||||||||||
Long-term debt | 507,341 | 516,007 | 374,371 | 376,452 | 374,991 | |||||||||||||||
Other liabilities | 220,043 | 167,671 | 176,089 | 191,653 | 172,967 | |||||||||||||||
|
|
|
|
|
|
|
|
|
| |||||||||||
Total liabilities | 19,108,365 | 18,299,413 | 18,274,864 | 17,476,608 | 16,856,849 | |||||||||||||||
|
|
|
|
|
|
|
|
|
| |||||||||||
COMMON SHAREHOLDERS’ EQUITY | ||||||||||||||||||||
Common stock net of treasury and capital surplus | 1,730,344 | 1,726,736 | 1,798,980 | 1,832,529 | 1,838,931 | |||||||||||||||
Retained earnings | 759,780 | 744,131 | 723,497 | 703,506 | 676,942 | |||||||||||||||
Accumulated other comprehensive income | (60,084 | ) | (45,769 | ) | (50,075 | ) | (26,693 | ) | (23,291 | ) | ||||||||||
|
|
|
|
|
|
|
|
|
| |||||||||||
Total common shareholders’ equity | 2,430,040 | 2,425,098 | 2,472,402 | 2,509,342 | 2,492,582 | |||||||||||||||
|
|
|
|
|
|
|
|
|
| |||||||||||
Total liabilities & shareholders’ equity | $ | 21,538,405 | $ | 20,724,511 | $ | 20,747,266 | $ | 19,985,950 | $ | 19,349,431 | ||||||||||
|
|
|
|
|
|
|
|
|
| |||||||||||
CAPITAL RATIOS | ||||||||||||||||||||
Tangible common equity | $ | 1,689,550 | $ | 1,678,453 | $ | 1,718,343 | $ | 1,748,828 | $ | 1,725,489 | ||||||||||
Tier 1 capital (g) | 1,833,725 | 1,812,010 | 1,777,280 | 1,784,588 | 1,758,178 | |||||||||||||||
Common equity (period-end) as a percent of total assets (period-end) | 11.28 | % | 11.70 | % | 11.92 | % | 12.56 | % | 12.88 | % | ||||||||||
Tangible common equity ratio | 8.12 | % | 8.40 | % | 8.59 | % | 9.10 | % | 9.29 | % | ||||||||||
Leverage (Tier 1) ratio (g) | 9.05 | % | 9.17 | % | 9.17 | % | 9.48 | % | 9.61 | % | ||||||||||
Tier 1 risk-based capital ratio (g) | 10.69 | % | 10.86 | % | 11.23 | % | 11.59 | % | 11.83 | % | ||||||||||
Total risk-based capital ratio (g) | 12.44 | % | 12.77 | % | 12.30 | % | 12.66 | % | 12.96 | % | ||||||||||
| (g) | Estimated for most recent period-end. Regulatory ratios reflect the impact of Basel III capital requirements effective January 1, 2015. |
11
HANCOCK HOLDING COMPANY
AVERAGE BALANCE SHEET
(Unaudited)
| Three Months Ended | Six Months Ended | |||||||||||||||||||
(dollars in thousands) | 6/30/2015 | 3/31/2015 | 6/30/2014 | 6/30/2015 | 6/30/2014 | |||||||||||||||
ASSETS | ||||||||||||||||||||
Commercial non-real estate loans | $ | 6,095,054 | $ | 5,995,687 | $ | 5,298,978 | $ | 6,045,645 | $ | 5,194,102 | ||||||||||
Construction and land development loans | 1,084,540 | 1,121,059 | 1,005,025 | 1,102,699 | 979,320 | |||||||||||||||
Commercial real estate loans | 3,218,914 | 3,118,522 | 3,051,193 | 3,168,996 | 3,052,697 | |||||||||||||||
Residential mortgage loans | 1,930,553 | 1,902,873 | 1,744,313 | 1,916,789 | 1,732,542 | |||||||||||||||
Consumer loans | 1,809,843 | 1,731,256 | 1,581,352 | 1,770,766 | 1,572,261 | |||||||||||||||
|
|
|
|
|
|
|
|
|
| |||||||||||
Total loans | 14,138,904 | 13,869,397 | 12,680,861 | 14,004,895 | 12,530,922 | |||||||||||||||
Loans held for sale | 22,883 | 15,567 | 14,681 | 19,245 | 16,932 | |||||||||||||||
Securities (h) | 4,143,097 | 3,772,997 | 3,716,563 | 3,959,069 | 3,825,484 | |||||||||||||||
Short-term investments | 475,887 | 657,878 | 379,639 | 566,380 | 392,853 | |||||||||||||||
|
|
|
|
|
|
|
|
|
| |||||||||||
Earning assets | 18,780,771 | 18,315,839 | 16,791,744 | 18,549,589 | 16,766,191 | |||||||||||||||
Allowance for loan losses | (130,124 | ) | (130,217 | ) | (126,887 | ) | (130,170 | ) | (130,757 | ) | ||||||||||
Goodwill and other intangible assets | 743,435 | 750,705 | 770,294 | 747,050 | 775,833 | |||||||||||||||
Other assets | 1,481,008 | 1,507,532 | 1,604,113 | 1,494,197 | 1,635,875 | |||||||||||||||
|
|
|
|
|
|
|
|
|
| |||||||||||
Total assets | $ | 20,875,090 | $ | 20,443,859 | $ | 19,039,264 | $ | 20,660,666 | $ | 19,047,142 | ||||||||||
|
|
|
|
|
|
|
|
|
| |||||||||||
LIABILITIES AND SHAREHOLDERS’ EQUITY | ||||||||||||||||||||
Noninterest-bearing deposits | $ | 6,107,900 | $ | 5,924,196 | $ | 5,505,735 | $ | 6,016,623 | $ | 5,502,878 | ||||||||||
|
|
|
|
|
|
|
|
|
| |||||||||||
Interest-bearing transaction and savings deposits | 6,656,911 | 6,506,812 | 6,078,115 | 6,582,277 | 6,075,131 | |||||||||||||||
Interest-bearing public fund deposits | 1,890,364 | 1,815,445 | 1,450,312 | 1,853,111 | 1,488,251 | |||||||||||||||
Time deposits | 2,206,913 | 2,238,806 | 2,026,419 | 2,222,771 | 2,098,025 | |||||||||||||||
|
|
|
|
|
|
|
|
|
| |||||||||||
Total interest-bearing deposits | 10,754,188 | 10,561,063 | 9,554,846 | 10,658,159 | 9,661,407 | |||||||||||||||
|
|
|
|
|
|
|
|
|
| |||||||||||
Total deposits | 16,862,088 | 16,485,259 | 15,060,581 | 16,674,782 | 15,164,285 | |||||||||||||||
Short-term borrowings | 896,014 | 920,436 | 957,386 | 908,158 | 871,701 | |||||||||||||||
Long-term debt | 515,997 | 412,938 | 380,151 | 464,752 | 383,073 | |||||||||||||||
Other liabilities | 170,281 | 177,356 | 177,761 | 173,732 | 178,325 | |||||||||||||||
Common shareholders’ equity | 2,430,710 | 2,447,870 | 2,463,385 | 2,439,242 | 2,449,758 | |||||||||||||||
|
|
|
|
|
|
|
|
|
| |||||||||||
Total liabilities & shareholders’ equity | $ | 20,875,090 | $ | 20,443,859 | $ | 19,039,264 | $ | 20,660,666 | $ | 19,047,142 | ||||||||||
|
|
|
|
|
|
|
|
|
| |||||||||||
| (h) | Average securities does not include unrealized holding gains/losses on available for sale securities. |
12
HANCOCK HOLDING COMPANY
AVERAGE BALANCE AND NET INTEREST MARGIN SUMMARY
(Unaudited)
| Three Months Ended | ||||||||||||||||||||||||||||||||||||
| 6/30/2015 | 3/31/2015 | 6/30/2014 | ||||||||||||||||||||||||||||||||||
(dollars in millions) | Volume | Interest | Rate | Volume | Interest | Rate | Volume | Interest | Rate | |||||||||||||||||||||||||||
AVERAGE EARNING ASSETS | ||||||||||||||||||||||||||||||||||||
Commercial & real estate loans (TE) (j) (k) | $ | 10,398.5 | $ | 101.6 | 3.92 | % | $ | 10,235.2 | $ | 106.8 | 4.23 | % | $ | 9,355.2 | $ | 108.2 | 4.64 | % | ||||||||||||||||||
Residential mortgage loans | 1,930.6 | 19.9 | 4.13 | % | 1,902.9 | 20.4 | 4.30 | % | 1,744.3 | 21.0 | 4.83 | % | ||||||||||||||||||||||||
Consumer loans | 1,809.8 | 23.0 | 5.10 | % | 1,731.3 | 21.9 | 5.13 | % | 1,581.4 | 23.6 | 5.99 | % | ||||||||||||||||||||||||
Loan fees & late charges | — | — | 0.00 | % | — | 0.3 | 0.00 | % | — | 0.8 | 0.00 | % | ||||||||||||||||||||||||
|
|
|
|
|
|
|
|
|
|
|
|
|
|
|
|
|
| |||||||||||||||||||
Total loans (TE) | 14,138.9 | 144.6 | 4.10 | % | 13,869.4 | 149.4 | 4.36 | % | 12,680.9 | 153.6 | 4.86 | % | ||||||||||||||||||||||||
|
|
|
|
|
|
|
|
|
|
|
|
|
|
|
|
|
| |||||||||||||||||||
Loans held for sale | 22.9 | 0.2 | 3.88 | % | 15.6 | 0.1 | 2.45 | % | 14.7 | 0.1 | 4.14 | % | ||||||||||||||||||||||||
|
|
|
|
|
|
|
|
|
|
|
|
|
|
|
|
|
| |||||||||||||||||||
US Treasury and government agency securities | 300.0 | 1.2 | 1.54 | % | 275.0 | 1.1 | 1.58 | % | — | — | 0.00 | % | ||||||||||||||||||||||||
CMOs and mortgage backed securities | 3,641.6 | 19.6 | 2.15 | % | 3,290.5 | 18.6 | 2.26 | % | 3,490.9 | 20.1 | 2.30 | % | ||||||||||||||||||||||||
Municipals (TE) (j) | 195.5 | 2.2 | 4.54 | % | 195.8 | 2.3 | 4.61 | % | 205.8 | 2.4 | 4.63 | % | ||||||||||||||||||||||||
Other securities | 6.0 | 0.0 | 1.61 | % | 11.6 | 0.1 | 4.47 | % | 19.8 | 0.1 | 1.19 | % | ||||||||||||||||||||||||
|
|
|
|
|
|
|
|
|
|
|
|
|
|
|
|
|
| |||||||||||||||||||
Total securities (TE) (i) | 4,143.1 | 23.0 | 2.22 | % | 3,772.9 | 22.1 | 2.35 | % | 3,716.5 | 22.6 | 2.43 | % | ||||||||||||||||||||||||
|
|
|
|
|
|
|
|
|
|
|
|
|
|
|
|
|
| |||||||||||||||||||
Total short-term investments | 475.9 | 0.3 | 0.23 | % | 657.9 | 0.4 | 0.22 | % | 379.6 | 0.2 | 0.22 | % | ||||||||||||||||||||||||
|
|
|
|
|
|
|
|
|
|
|
|
|
|
|
|
|
| |||||||||||||||||||
Average earning assets yield (TE) | $ | 18,780.8 | 168.1 | 3.58 | % | $ | 18,315.8 | 172.0 | 3.79 | % | $ | 16,791.7 | 176.5 | 4.21 | % | |||||||||||||||||||||
|
|
|
|
|
|
|
|
|
|
|
|
|
|
|
|
|
| |||||||||||||||||||
INTEREST-BEARING LIABILITIES | ||||||||||||||||||||||||||||||||||||
Interest-bearing transaction and savings deposits | $ | 6,656.9 | 2.5 | 0.15 | % | $ | 6,506.8 | 2.2 | 0.14 | % | $ | 6,078.1 | 1.5 | 0.10 | % | |||||||||||||||||||||
Time deposits | 2,206.9 | 3.8 | 0.69 | % | 2,238.8 | 3.7 | 0.67 | % | 2,026.4 | 3.0 | 0.60 | % | ||||||||||||||||||||||||
Public funds | 1,890.4 | 1.3 | 0.28 | % | 1,815.4 | 1.2 | 0.27 | % | 1,450.3 | 0.7 | 0.21 | % | ||||||||||||||||||||||||
|
|
|
|
|
|
|
|
|
|
|
|
|
|
|
|
|
| |||||||||||||||||||
Total interest-bearing deposits | 10,754.2 | 7.6 | 0.28 | % | 10,561.0 | 7.1 | 0.27 | % | 9,554.8 | 5.2 | 0.22 | % | ||||||||||||||||||||||||
|
|
|
|
|
|
|
|
|
|
|
|
|
|
|
|
|
| |||||||||||||||||||
Short-term borrowings | 896.0 | 0.2 | 0.08 | % | 920.5 | 0.2 | 0.08 | % | 957.4 | 0.8 | 0.34 | % | ||||||||||||||||||||||||
Long-term debt | 516.0 | 5.3 | 4.14 | % | 412.9 | 3.6 | 3.57 | % | 380.2 | 3.2 | 3.32 | % | ||||||||||||||||||||||||
|
|
|
|
|
|
|
|
|
|
|
|
|
|
|
|
|
| |||||||||||||||||||
Total borrowings | 1,412.0 | 5.5 | 1.56 | % | 1,333.4 | 3.8 | 1.16 | % | 1,337.6 | 4.0 | 1.19 | % | ||||||||||||||||||||||||
|
|
|
|
|
|
|
|
|
|
|
|
|
|
|
|
|
| |||||||||||||||||||
Total interest-bearing liabilities cost | 12,166.2 | 13.1 | 0.43 | % | 11,894.4 | 10.9 | 0.37 | % | 10,892.4 | 9.2 | 0.34 | % | ||||||||||||||||||||||||
|
|
|
|
|
|
|
|
|
|
|
|
|
|
|
|
|
| |||||||||||||||||||
Net interest-free funding sources | 6,614.6 | 6,421.4 | 5,899.3 | |||||||||||||||||||||||||||||||||
|
|
|
|
|
| |||||||||||||||||||||||||||||||
Total cost of funds | 18,780.8 | 13.1 | 0.28 | % | 18,315.8 | 10.9 | 0.24 | % | 16,791.7 | 9.2 | 0.22 | % | ||||||||||||||||||||||||
|
|
|
|
|
|
|
|
|
|
|
|
|
|
|
|
|
| |||||||||||||||||||
Net Interest Spread (TE) | $ | 154.9 | 3.15 | % | $ | 161.1 | 3.42 | % | $ | 167.3 | 3.87 | % | ||||||||||||||||||||||||
|
|
|
|
|
|
|
|
|
|
|
| |||||||||||||||||||||||||
Net Interest Margin (TE) | $ | 18,780.8 | $ | 154.9 | 3.30 | % | $ | 18,315.8 | $ | 161.1 | 3.55 | % | $ | 16,791.7 | $ | 167.3 | 3.99 | % | ||||||||||||||||||
|
|
|
|
|
|
|
|
|
|
|
|
|
|
|
|
|
| |||||||||||||||||||
| (i) | Average securities does not include unrealized holding gains/losses on available for sale securities. |
| (j) | Tax equivalent (te) amounts are calculated using a marginal federal tax rate of 35%. |
| (k) | Includes nonaccrual loans. |
13
HANCOCK HOLDING COMPANY
AVERAGE BALANCE AND NET INTEREST MARGIN SUMMARY
(Unaudited)
| Six Months Ended | ||||||||||||||||||||||||
| 6/30/2015 | 6/30/2014 | |||||||||||||||||||||||
(dollars in millions) | Volume | �� | Interest | Rate | Volume | Interest | Rate | |||||||||||||||||
AVERAGE EARNING ASSETS | ||||||||||||||||||||||||
Commercial & real estate loans (TE) (j) (k) | $ | 10,317.3 | $ | 208.4 | 4.07 | % | $ | 9,226.1 | $ | 216.1 | 4.72 | % | ||||||||||||
Residential mortgage loans | 1,916.8 | 40.4 | 4.21 | % | 1,732.5 | 42.4 | 4.89 | % | ||||||||||||||||
Consumer loans | 1,770.7 | 44.9 | 5.12 | % | 1,572.3 | 46.8 | 6.00 | % | ||||||||||||||||
Loan fees & late charges | — | 0.3 | 0.00 | % | — | 1.4 | 0.00 | % | ||||||||||||||||
|
|
|
|
|
|
|
|
|
|
|
| |||||||||||||
Total loans (TE) | 14,004.8 | 294.0 | 4.23 | % | 12,530.9 | 306.7 | 4.93 | % | ||||||||||||||||
|
|
|
|
|
|
|
|
|
|
|
| |||||||||||||
Loans held for sale | 19.2 | 0.3 | 3.30 | % | 16.9 | 0.3 | 4.10 | % | ||||||||||||||||
|
|
|
|
|
|
|
|
|
|
|
| |||||||||||||
US Treasury and government agency securities | 287.6 | 2.2 | 1.56 | % | 46.5 | 0.5 | 2.26 | % | ||||||||||||||||
CMOs and mortgage backed securities | 3,467.1 | 38.2 | 2.21 | % | 3,551.5 | 41.3 | 2.32 | % | ||||||||||||||||
Municipals (TE) (j) | 195.7 | 4.5 | 4.58 | % | 211.4 | 4.9 | 4.59 | % | ||||||||||||||||
Other securities | 8.8 | 0.2 | 3.51 | % | 16.1 | 0.2 | 2.22 | % | ||||||||||||||||
|
|
|
|
|
|
|
|
|
|
|
| |||||||||||||
Total securities (TE) (i) | 3,959.2 | 45.1 | 2.28 | % | 3,825.5 | 46.9 | 2.45 | % | ||||||||||||||||
|
|
|
|
|
|
|
|
|
|
|
| |||||||||||||
Total short-term investments | 566.4 | 0.7 | 0.22 | % | 392.9 | 0.4 | 0.23 | % | ||||||||||||||||
|
|
|
|
|
|
|
|
|
|
|
| |||||||||||||
Average earning assets yield (TE) | $ | 18,549.6 | 340.1 | 3.69 | % | $ | 16,766.2 | 354.3 | 4.25 | % | ||||||||||||||
|
|
|
|
|
|
|
|
|
|
|
| |||||||||||||
INTEREST-BEARING LIABILITIES | ||||||||||||||||||||||||
Interest-bearing transaction and savings deposits | $ | 6,582.3 | 4.7 | 0.14 | % | $ | 6,075.1 | 3.0 | 0.10 | % | ||||||||||||||
Time deposits | 2,222.8 | 7.5 | 0.68 | % | 2,098.0 | 6.1 | 0.59 | % | ||||||||||||||||
Public funds | 1,853.1 | 2.5 | 0.28 | % | 1,488.3 | 1.5 | 0.20 | % | ||||||||||||||||
|
|
|
|
|
|
|
|
|
|
|
| |||||||||||||
Total interest-bearing deposits | 10,658.2 | 14.7 | 0.28 | % | 9,661.4 | 10.6 | 0.22 | % | ||||||||||||||||
|
|
|
|
|
|
|
|
|
|
|
| |||||||||||||
Short-term borrowings | 908.2 | 0.4 | 0.08 | % | 871.7 | 1.9 | 0.43 | % | ||||||||||||||||
Long-term debt | 464.7 | 9.0 | 3.88 | % | 383.1 | 6.3 | 3.33 | % | ||||||||||||||||
|
|
|
|
|
|
|
|
|
|
|
| |||||||||||||
Total borrowings | 1,372.9 | 9.4 | 1.37 | % | 1,254.8 | 8.2 | 1.32 | % | ||||||||||||||||
|
|
|
|
|
|
|
|
|
|
|
| |||||||||||||
Total interest-bearing liabilities cost | 12,031.1 | 24.1 | 0.40 | % | 10,916.2 | 18.8 | 0.35 | % | ||||||||||||||||
|
|
|
|
|
|
|
|
|
|
|
| |||||||||||||
Net interest-free funding sources | 6,518.5 | 5,850.0 | ||||||||||||||||||||||
|
|
|
| |||||||||||||||||||||
Total cost of funds | 18,549.6 | 24.1 | 0.26 | % | 16,766.2 | 18.8 | 0.22 | % | ||||||||||||||||
|
|
|
|
|
|
|
|
|
|
|
| |||||||||||||
Net Interest Spread (TE) | $ | 316.0 | 3.29 | % | $ | 335.5 | 3.90 | % | ||||||||||||||||
|
|
|
|
|
|
|
| |||||||||||||||||
Net Interest Margin (TE) | $ | 18,549.6 | $ | 316.0 | 3.43 | % | $ | 16,766.2 | $ | 335.5 | 4.03 | % | ||||||||||||
|
|
|
|
|
|
|
|
|
|
|
| |||||||||||||
| (i) | Average securities does not include unrealized holding gains/losses on available for sale securities. |
| (j) | Tax equivalent (te) amounts are calculated using a marginal federal tax rate of 35%. |
| (k) | Includes nonaccrual loans. |
14
HANCOCK HOLDING COMPANY
ASSET QUALITY INFORMATION
(Unaudited)
| Three Months Ended | Six Months Ended | |||||||||||||||||||
(dollars in thousands) | 6/30/2015 | 3/31/2015 | 6/30/2014 | 6/30/2015 | 6/30/2014 | |||||||||||||||
Nonaccrual loans (l) | $ | 118,445 | $ | 90,821 | $ | 89,901 | $ | 118,445 | $ | 89,901 | ||||||||||
Restructured loans - still accruing | 7,966 | 7,564 | 7,868 | 7,966 | 7,868 | |||||||||||||||
|
|
|
|
|
|
|
|
|
| |||||||||||
Total nonperforming loans | 126,411 | 98,385 | 97,769 | 126,411 | 97,769 | |||||||||||||||
ORE and foreclosed assets | 38,630 | 42,956 | 59,732 | 38,630 | 59,732 | |||||||||||||||
|
|
|
|
|
|
|
|
|
| |||||||||||
Total nonperforming assets | $ | 165,041 | $ | 141,341 | $ | 157,501 | $ | 165,041 | $ | 157,501 | ||||||||||
|
|
|
|
|
|
|
|
|
| |||||||||||
Nonperforming assets as a percent of loans, ORE and foreclosed assets | 1.15 | % | 1.01 | % | 1.22 | % | 1.15 | % | 1.22 | % | ||||||||||
Accruing loans 90 days past due | $ | 3,478 | $ | 5,872 | $ | 4,142 | $ | 3,478 | $ | 4,142 | ||||||||||
Accruing loans 90 days past due as a percent of loans | 0.02 | % | 0.04 | % | 0.03 | % | 0.02 | % | 0.03 | % | ||||||||||
Nonperforming assets + accruing loans 90 days past due to loans, ORE and foreclosed assets | 1.17 | % | 1.05 | % | 1.25 | % | 1.17 | % | 1.25 | % | ||||||||||
|
|
|
|
|
|
|
|
|
| |||||||||||
ALLOWANCE FOR LOAN LOSSES | ||||||||||||||||||||
Beginning Balance | $ | 128,386 | $ | 128,762 | $ | 128,248 | $ | 128,762 | $ | 133,626 | ||||||||||
Net provision for loan losses - FDIC acquired loans | (879 | ) | (70 | ) | (73 | ) | (949 | ) | (375 | ) | ||||||||||
Provision for loan losses - non-FDIC acquired loans | 7,487 | 6,224 | 6,764 | 13,711 | 15,029 | |||||||||||||||
|
|
|
|
|
|
|
|
|
| |||||||||||
Net provision for loan losses | 6,608 | 6,154 | 6,691 | 12,762 | 14,654 | |||||||||||||||
|
|
|
|
|
|
|
|
|
| |||||||||||
(Decrease)increase in FDIC loss share receivable | (2,115 | ) | (421 | ) | (1,022 | ) | (2,536 | ) | (7,875 | ) | ||||||||||
Net charge-offs - FDIC acquired | 582 | 2,455 | 1,181 | 3,037 | 3,691 | |||||||||||||||
Charge-offs - non-FDIC acquired | 4,129 | 7,460 | 7,309 | 11,589 | 14,791 | |||||||||||||||
Recoveries - non-FDIC acquired | (2,919 | ) | (3,806 | ) | (3,245 | ) | (6,725 | ) | (6,749 | ) | ||||||||||
|
|
|
|
|
|
|
|
|
| |||||||||||
Net charge-offs | 1,792 | 6,109 | 5,245 | 7,901 | 11,733 | |||||||||||||||
|
|
|
|
|
|
|
|
|
| |||||||||||
Ending Balance | $ | 131,087 | $ | 128,386 | $ | 128,672 | $ | 131,087 | $ | 128,672 | ||||||||||
|
|
|
|
|
|
|
|
|
| |||||||||||
Allowance for loan losses as a percent of period-end loans | 0.91 | % | 0.92 | % | 1.00 | % | 0.91 | % | 1.00 | % | ||||||||||
Allowance for loan losses to nonperforming loans + accruing loans 90 days past due | 100.92 | % | 123.14 | % | 126.26 | % | 100.92 | % | 126.26 | % | ||||||||||
|
|
|
|
|
|
|
|
|
| |||||||||||
NET CHARGE-OFF INFORMATION | ||||||||||||||||||||
Net charge-offs - non-FDIC acquired: | ||||||||||||||||||||
Commercial & real estate loans | ($ | 691 | ) | $ | 474 | $ | 1,148 | ($ | 217 | ) | $ | 2,540 | ||||||||
Residential mortgage loans | (61 | ) | 904 | 587 | 843 | 734 | ||||||||||||||
Consumer loans | 1,962 | 2,276 | 2,329 | 4,238 | 4,768 | |||||||||||||||
|
|
|
|
|
|
|
|
|
| |||||||||||
Total net charge-offs - non-FDIC acquired | $ | 1,210 | $ | 3,654 | $ | 4,064 | $ | 4,864 | $ | 8,042 | ||||||||||
|
|
|
|
|
|
|
|
|
| |||||||||||
Net charge-offs - non-FDIC acquired to average loans: | ||||||||||||||||||||
Commercial & real estate loans | (0.03 | )% | 0.02 | % | 0.05 | % | (0.00 | )% | 0.06 | % | ||||||||||
Residential mortgage loans | (0.01 | )% | 0.19 | % | 0.13 | % | 0.09 | % | 0.09 | % | ||||||||||
Consumer loans | 0.43 | % | 0.53 | % | 0.59 | % | 0.48 | % | 0.61 | % | ||||||||||
|
|
|
|
|
|
|
|
|
| |||||||||||
Total net charge-offs - non-FDIC acquired to average loans | 0.03 | % | 0.11 | % | 0.13 | % | 0.07 | % | 0.13 | % | ||||||||||
|
|
|
|
|
|
|
|
|
| |||||||||||
| (l) | Nonaccrual loans and accruing loans past due 90 days or more do not include acquired credit-impaired loans which were written down to fair value upon acquisition and accrete interest income over the remaining life of the loan. Included in nonaccrual loans are $4.9 million, $5.0 million, and $11.5 million at 6/30/15, 3/31/15 and 6/30/14, respectively, in nonaccruing restructured loans. |
15
HANCOCK HOLDING COMPANY
ASSET QUALITY INFORMATION
(Unaudited)
| Three months ended |
| |||||||||||||||||||
(dollars in thousands) | 6/30/2015 | 3/31/2015 | 12/31/2014 | 9/30/2014 | 6/30/2014 | |||||||||||||||
Nonaccrual loans (l) | $ | 118,445 | $ | 90,821 | $ | 79,537 | $ | 83,154 | $ | 89,901 | ||||||||||
Restructured loans - still accruing | 7,966 | 7,564 | 8,971 | 7,944 | 7,868 | |||||||||||||||
|
|
|
|
|
|
|
|
|
| |||||||||||
Total nonperforming loans | 126,411 | 98,385 | 88,508 | 91,098 | 97,769 | |||||||||||||||
ORE and foreclosed assets | 38,630 | 42,956 | 59,569 | 56,081 | 59,732 | |||||||||||||||
|
|
|
|
|
|
|
|
|
| |||||||||||
Total nonperforming assets | $ | 165,041 | $ | 141,341 | $ | 148,077 | $ | 147,179 | $ | 157,501 | ||||||||||
|
|
|
|
|
|
|
|
|
| |||||||||||
Nonperforming assets as a percent of loans, ORE and foreclosed assets | 1.15 | % | 1.01 | % | 1.06 | % | 1.10 | % | 1.22 | % | ||||||||||
Accruing loans 90 days past due | $ | 3,478 | $ | 5,872 | $ | 4,825 | $ | 6,667 | $ | 4,142 | ||||||||||
Accruing loans 90 days past due as a percent of loans | 0.02 | % | 0.04 | % | 0.03 | % | 0.05 | % | 0.03 | % | ||||||||||
Nonperforming assets + accruing loans 90 days past due to loans, ORE and foreclosed assets | 1.17 | % | 1.05 | % | 1.10 | % | 1.15 | % | 1.25 | % | ||||||||||
|
|
|
|
|
|
|
|
|
| |||||||||||
Allowance for loan losses | $ | 131,087 | $ | 128,386 | $ | 128,762 | $ | 125,572 | $ | 128,672 | ||||||||||
Allowance for loan losses as a percent of period-end loans | 0.91 | % | 0.92 | % | 0.93 | % | 0.94 | % | 1.00 | % | ||||||||||
Allowance for loan losses to nonperforming loans + accruing loans 90 days past due | 100.92 | % | 123.14 | % | 137.96 | % | 128.44 | % | 126.26 | % | ||||||||||
|
|
|
|
|
|
|
|
|
| |||||||||||
Provision for loan losses | $ | 6,608 | $ | 6,154 | $ | 9,718 | $ | 9,468 | $ | 6,691 | ||||||||||
|
|
|
|
|
|
|
|
|
| |||||||||||
NET CHARGE-OFF INFORMATION | ||||||||||||||||||||
Net charge-offs - non-FDIC acquired: | ||||||||||||||||||||
Commercial & real estate loans | ($ | 691 | ) | $ | 474 | $ | 1,446 | $ | 2,451 | $ | 1,148 | |||||||||
Residential mortgage loans | (61 | ) | 904 | 349 | 558 | 587 | ||||||||||||||
Consumer loans | 1,962 | 2,276 | 843 | 3,430 | 2,329 | |||||||||||||||
|
|
|
|
|
|
|
|
|
| |||||||||||
Total net charge-offs - non-FDIC acquired | $ | 1,210 | $ | 3,654 | $ | 2,638 | $ | 6,439 | $ | 4,064 | ||||||||||
|
|
|
|
|
|
|
|
|
| |||||||||||
Net charge-offs - non-FDIC acquired to average loans: | ||||||||||||||||||||
Commercial & real estate loans | (0.03 | )% | 0.02 | % | 0.06 | % | 0.10 | % | 0.05 | % | ||||||||||
Residential mortgage loans | (0.01 | )% | 0.19 | % | 0.07 | % | 0.12 | % | 0.13 | % | ||||||||||
Consumer loans | 0.43 | % | 0.53 | % | 0.19 | % | 0.82 | % | 0.59 | % | ||||||||||
|
|
|
|
|
|
|
|
|
| |||||||||||
Total net charge-offs - non-FDIC acquired to average loans | 0.03 | % | 0.11 | % | 0.08 | % | 0.19 | % | 0.13 | % | ||||||||||
|
|
|
|
|
|
|
|
|
| |||||||||||
AVERAGE LOANS | ||||||||||||||||||||
Commercial & real estate loans | $ | 10,398,508 | $ | 10,235,268 | $ | 9,943,403 | $ | 9,627,566 | $ | 9,355,196 | ||||||||||
Residential mortgage loans | 1,930,553 | 1,902,873 | 1,886,230 | 1,814,186 | 1,744,313 | |||||||||||||||
Consumer loans | 1,809,843 | 1,731,256 | 1,748,590 | 1,660,356 | 1,581,352 | |||||||||||||||
|
|
|
|
|
|
|
|
|
| |||||||||||
Total average loans | $ | 14,138,904 | $ | 13,869,397 | $ | 13,578,223 | $ | 13,102,108 | $ | 12,680,861 | ||||||||||
|
|
|
|
|
|
|
|
|
| |||||||||||
| (l) | Nonaccrual loans and accruing loans past due 90 days or more do not include acquired credit-impaired loans which were written down to fair value upon acquisition and accrete interest income over the remaining life of the loan. Included in nonaccrual loans are $4.9 million, $5.0 million, $7.0 million, $9.9 million, and $11.5 million at 6/30/15, 3/31/15, 12/31/14, 9/30/14, and 6/30/14, respectively, in nonaccruing restructured loans. |
16
HANCOCK HOLDING COMPANY
SUPPLEMENTAL ASSET QUALITY INFORMATION
(Unaudited)
| Originated Loans | Acquired Loans (m) | FDIC Acquired (n) | Total | |||||||||||||
(dollars in thousands) | 6/30/2015 | |||||||||||||||
Nonaccrual loans (o) | $ | 111,455 | $ | 5,401 | $ | 1,589 | $ | 118,445 | ||||||||
Restructured loans - still accruing | 7,966 | — | — | 7,966 | ||||||||||||
|
|
|
|
|
|
|
| |||||||||
Total nonperforming loans | 119,421 | 5,401 | 1,589 | 126,411 | ||||||||||||
ORE and foreclosed assets (p) | 25,768 | — | 12,862 | 38,630 | ||||||||||||
|
|
|
|
|
|
|
| |||||||||
Total nonperforming assets | $ | 145,189 | $ | 5,401 | $ | 14,451 | $ | 165,041 | ||||||||
|
|
|
|
|
|
|
| |||||||||
Accruing loans 90 days past due | $ | 3,478 | — | — | $ | 3,478 | ||||||||||
Allowance for loan losses | $ | 106,811 | $ | 214 | $ | 24,062 | $ | 131,087 | ||||||||
|
|
|
|
|
|
|
| |||||||||
| 3/31/2015 | ||||||||||||||||
Nonaccrual loans (o) | $ | 83,412 | $ | 5,820 | $ | 1,589 | $ | 90,821 | ||||||||
Restructured loans - still accruing | 7,564 | — | — | 7,564 | ||||||||||||
|
|
|
|
|
|
|
| |||||||||
Total nonperforming loans | 90,976 | 5,820 | 1,589 | 98,385 | ||||||||||||
ORE and foreclosed assets (p) | 29,380 | — | 13,576 | 42,956 | ||||||||||||
|
|
|
|
|
|
|
| |||||||||
Total nonperforming assets | $ | 120,356 | $ | 5,820 | $ | 15,165 | $ | 141,341 | ||||||||
|
|
|
|
|
|
|
| |||||||||
Accruing loans 90 days past due | $ | 5,659 | $ | 213 | — | $ | 5,872 | |||||||||
Allowance for loan losses | $ | 100,494 | $ | 254 | $ | 27,638 | $ | 128,386 | ||||||||
|
|
|
|
|
|
|
| |||||||||
| Originated Loans | Acquired Loans (m) | FDIC Acquired (n) | Total | |||||||||||||
| 6/30/2015 | ||||||||||||||||
LOANS OUTSTANDING | ||||||||||||||||
Commercial non-real estate loans | $ | 6,058,998 | $ | 120,020 | $ | 6,666 | $ | 6,185,684 | ||||||||
Construction and land development loans | 1,100,788 | 9,064 | 11,095 | 1,120,947 | ||||||||||||
Commercial real estate loans | 2,591,384 | 598,962 | 22,487 | 3,212,833 | ||||||||||||
Residential mortgage loans | 1,784,730 | 1,554 | 169,553 | 1,955,837 | ||||||||||||
Consumer loans | 1,854,591 | 24 | 14,836 | 1,869,451 | ||||||||||||
|
|
|
|
|
|
|
| |||||||||
Total loans | $ | 13,390,491 | $ | 729,624 | $ | 224,637 | $ | 14,344,752 | ||||||||
|
|
|
|
|
|
|
| |||||||||
Change in loan balance from previous quarter | $ | 469,961 | ($ | 35,700 | ) | ($ | 13,895 | ) | $ | 420,366 | ||||||
|
|
|
|
|
|
|
| |||||||||
| 3/31/2015 | ||||||||||||||||
Commercial non-real estate loans | $ | 5,861,887 | $ | 118,260 | $ | 6,937 | $ | 5,987,084 | ||||||||
Construction and land development loans | 1,087,449 | 14,579 | 11,482 | 1,113,510 | ||||||||||||
Commercial real estate loans | 2,492,351 | 629,975 | 27,777 | 3,150,103 | ||||||||||||
Residential mortgage loans | 1,736,033 | 2,485 | 175,367 | 1,913,885 | ||||||||||||
Consumer loans | 1,742,810 | 25 | 16,969 | 1,759,804 | ||||||||||||
|
|
|
|
|
|
|
| |||||||||
Total loans | $ | 12,920,530 | $ | 765,324 | $ | 238,532 | $ | 13,924,386 | ||||||||
|
|
|
|
|
|
|
| |||||||||
Change in loan balance from previous quarter | $ | 110,331 | ($ | 67,344 | ) | ($ | 13,877 | ) | $ | 29,110 | ||||||
|
|
|
|
|
|
|
| |||||||||
| (m) | Loans which have been acquired and no allowance brought forward in accordance with acquisition accounting. Acquired-performing loans in pools with fully accreted purchase fair value discounts are reported as originated loans. |
| (n) | Loans acquired in an FDIC-assisted transaction. Non-single family loss share agreement expired at 12/31/14. As of 6/30/15, $179.0 million in loans and $3.5 million in ORE remain covered by the FDIC single family loss share agreement, providing considerable protection against credit risk. As of 3/31/15, $186.1 million in loans and $6.0 million in ORE remained covered by the FDIC single family loss share agreement. |
| (o) | Included in originated nonaccrual loans are $4.9 million and $5.0 million at 6/30/15 and 3/31/15, respectively, in nonaccruing restructured loans. |
| (p) | ORE received in settlement of acquired loans is no longer subject to purchase accounting guidance and has been included with ORE from originated loans. ORE received in settlement of covered loans remains covered under the FDIC loss share agreements. |
17
 Second Quarter 2015 Financial Results July 23, 2015 |
 Certain of the statements or information included in this presentation may constitute forward-looking statements. Forward-looking statements include projections of revenue, costs, results of operations or financial condition or statements regarding future market conditions or our potential plans and strategies for the future. Hancock’s ability to accurately project results, predict the effects of future plans or strategies, or predict market or economic developments is inherently limited. We believe that the expectations reflected or implied by any forward-looking statements are based on reasonable assumptions, but actual results and performance could differ materially from those set forth in the forward-looking statements. Factors that could cause actual results or outcomes to differ from those expressed in the Company's forward-looking statements include, but are not limited to, those outlined in Hancock's SEC filings, including the “Risk Factors” section of the Company’s 10-K for the year ended December 31, 2014 and form 10-Q for the most recent quarter end. Hancock undertakes no obligation to update or revise any forward-looking statements, and you are cautioned not to place undue reliance on such forward-looking statements. Forward Looking Statements 2 |
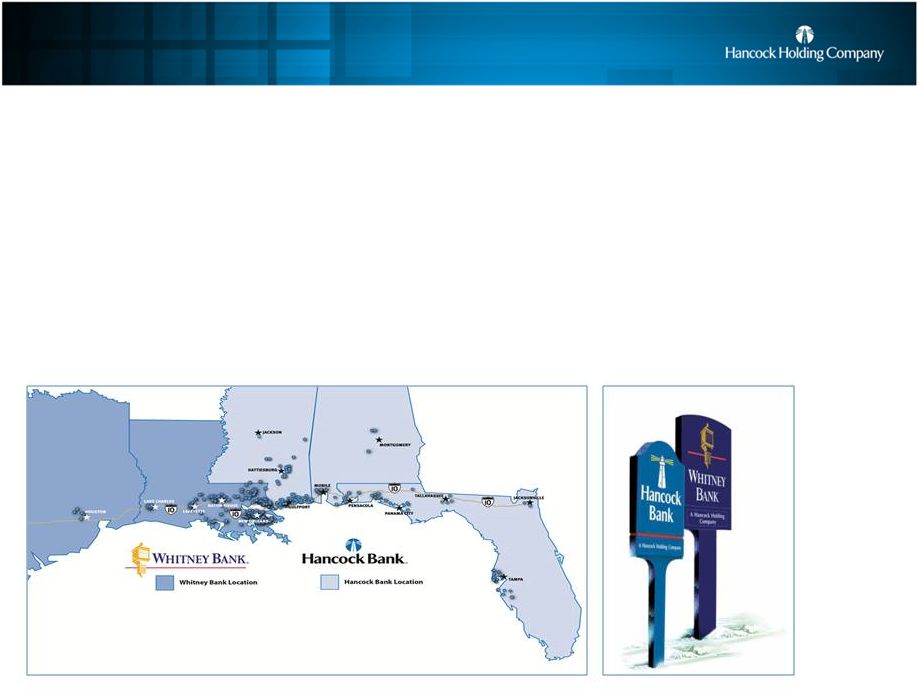 Hancock Holding Company • $21.5 billion in Total Assets • $14.3 billion in Total Loans • $17.3 billion in Total Deposits • Tangible Common Equity (TCE) 8.12% • Nearly 200 banking locations and 275 ATMs across a five-state footprint • Approximately 4,000 employees corporate-wide • Rated among the strongest, safest financial institutions in the country by BauerFinancial, Inc. • Earned top customer service marks with Greenwich Excellence Awards As of June 30, 2015 3 |
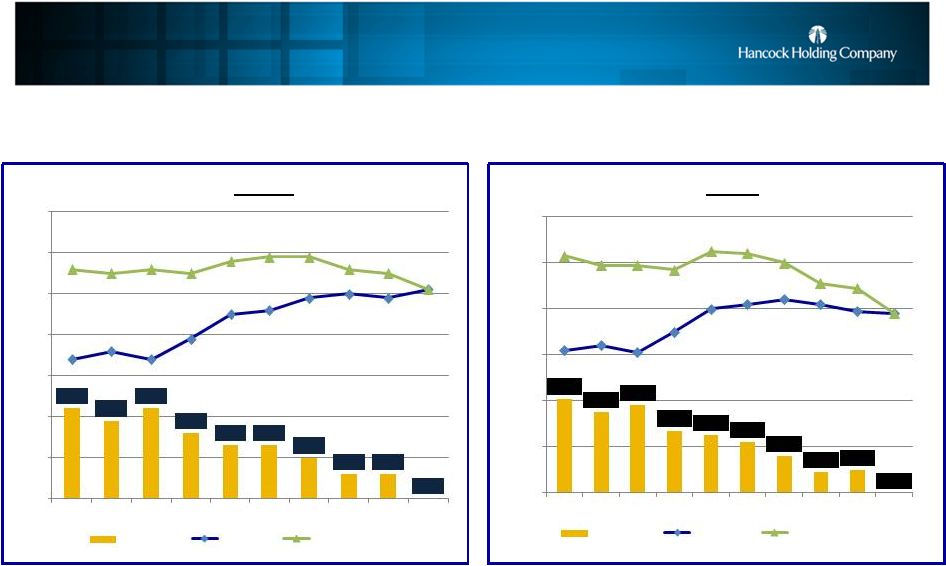 Gap Between Operating and Core Net Income Eliminated 4 E.P.S. ROA $0.22 $0.19 $0.22 $0.16 $0.13 $0.13 $0.10 $0.06 $0.06 $0.00 $0.34 $0.36 $0.34 $0.39 $0.45 $0.46 $0.49 $0.50 $0.49 $0.51 $0.56 $0.55 $0.56 $0.55 $0.58 $0.59 $0.59 $0.56 $0.55 $0.51 $0.00 $0.10 $0.20 $0.30 $0.40 $0.50 $0.60 $0.70 1Q13 2Q13 3Q13 4Q13 1Q14 2Q14 3Q14 4Q14 1Q15 2Q15 We define core income as operating income less purchase accounting adjustments (PAA). PAA items include loan accretion from Whitney and Peoples First, offset by amortization of the Whitney bond portfolio premium, amortization of the Peoples First indemnification asset and amortization of intangibles. Operating income is defined as net income excluding tax-effected securities transactions gains or losses and nonoperating expense items. See table on slide 27. Approximately $7.5 million, or $.06 per share, decline in linked-quarter net purchase accounting income 0.41% 0.35% 0.38% 0.27% 0.25% 0.22% 0.16% 0.10% 0.10% 0.00% 0.62% 0.64% 0.61% 0.70% 0.80% 0.82% 0.84% 0.82% 0.79% 0.78% 1.03% 0.99% 0.99% 0.97% 1.05% 1.04% 1.00% 0.92% 0.89% 0.78% 0.00% 0.20% 0.40% 0.60% 0.80% 1.00% 1.20% 1Q13 2Q13 3Q13 4Q13 1Q14 2Q14 3Q14 4Q14 1Q15 2Q15 "PAA Gap" Core EPS Operating EPS "PAA Gap" Core ROA Operating ROA |
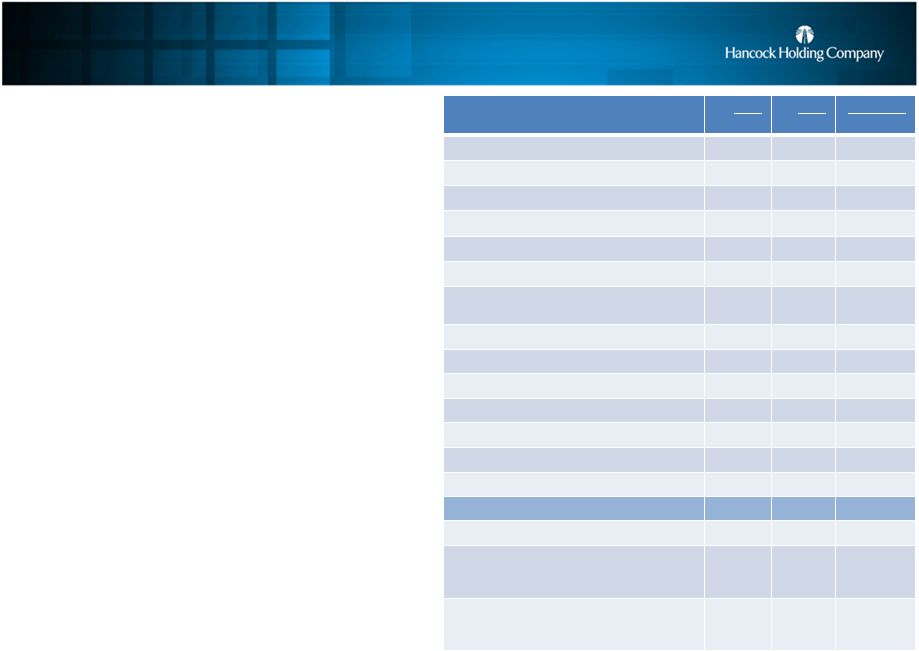 Second Quarter 2015 Highlights • Earnings increased $0.8 million, or 2% linked-quarter (excluding the tax-effected impact of net purchase accounting items and nonoperating items) • E.P.S. (excluding the tax-effected impact of net purchase accounting items and nonoperating items) increased 4% linked-quarter • Approximately $7.5 million, or $.06 per share, decline in linked-quarter net purchase accounting income • Loans increased $420 million, or 12% LQA, funded by an increase in deposits of $441 million, or 10% LQA • Total assets of $21.5 billion; up $814 million or 4% from March 31, 2015 • Fee income (excluding accretion in indemnification asset) up almost $5 million or 8% from 1Q15 • Loan loss provision reflects additional build for energy portfolio, including the impact of the shared national credit (SNC) review, offset by improvements in other loan portfolio measures • NIM of 3.30% reflects the expected drop in accretion income from 1Q15, the full quarter impact of the subordinated debt issuance in March 2015 and a decline in the overall yield of the securities portfolio ($s in millions; except per share data) 2Q15 1Q15 Fav/(unfav) Net Income $34.8 $40.2 (13%) Earnings Per Share $.44 $.49 (11%) Operating Income* $40.6 $44.7 (9%) Operating Earnings Per Share $.51 $.55 (7%) Nonoperating expense items $8.9 $7.3 (22%) Return on Assets (operating) (%) 0.78 0.89 (11bps) Return on Tangible Common Equity (operating) (%) 9.66 10.68 (102ps) Total Loans (period-end) $14,345 $13,924 3% Total Deposits (period-end) $17,302 $16,860 3% Net Interest Margin (%) 3.30 3.55 (25bps) Net Interest Margin (%) (core) 3.14 3.21 (7bps) Net Charge-offs (%) (non-covered) 0.03 0.11 8bps Tangible Common Equity (%) 8.12 8.40 (28bps) Efficiency Ratio** (%) 66.7 64.4 (231bps) Net Purchase Accounting Income (pre-tax) $0.3 $7.8 (96%) Net Income (excluding tax-effected impact of net purchase accounting items and nonoperating items) $40.4 $39.6 2% E.P.S. (excluding tax-effected impact of net purchase accounting items and nonoperating items) $.51 $.49 4% 5 * Operating income is defined as net income excluding tax-effected securities transactions gains or losses and nonoperating expense items. ** Noninterest expense to total revenue (TE) excluding amortization of purchased intangibles, nonoperating expense items, and securities transactions. |
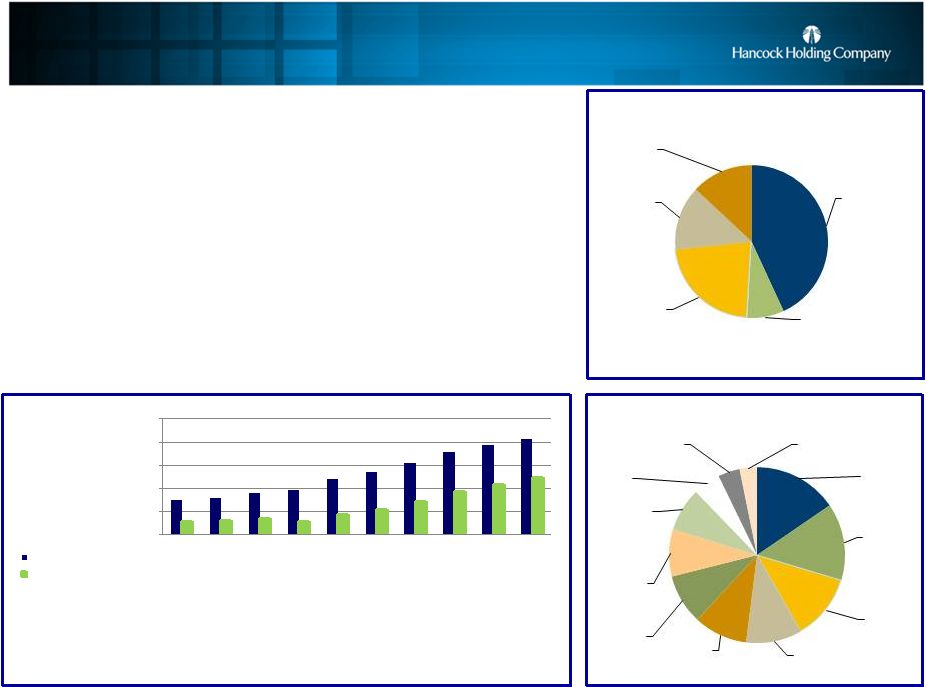 1Q13 2Q13 3Q13 4Q13 1Q14 2Q14 3Q14 4Q14 1Q15 2Q15 Avg Qtrly Loans $11.5 $11.6 $11.8 $11.9 $12.4 $12.7 $13.1 $13.6 $13.9 $14.1 Avg Qtrly Loans less Energy $10.6 $10.6 $10.7 $10.6 $10.9 $11.1 $11.4 $11.9 $12.2 $12.5 Energy (avg) $0.93 $0.99 $1.12 $1.35 $1.51 $1.59 $1.68 $1.72 $1.70 $1.67 energy as a % of loans (avg) 8% 8% 10% 11% 12% 13% 13% 13% 12% 12% LQA EOP growth -3% 7% 2% 20% 7% 11% 14% 16% 1% 12% LQA EOP growth excl energy -6% 6% -7% 14% 4% 10% 13% 20% 2% 14% $10.0 $11.0 $12.0 $13.0 $14.0 $15.0 Well-Diversified Loan Growth • Total EOP loans of $14.3 billion were up $420 million, or 3% linked-quarter (12% LQA) • Energy loans totaled $1.67 billion or 12% of total loans at June 30, 2015, virtually unchanged linked-quarter; no energy portfolio growth expected for the remainder of 2015 due to headwinds from the current cycle • Net loan growth during the quarter was well-diversified by geography and loan type $s in millions 6 $s in billions AL/FL panhandle 16% Greater NO 14% Indirect 12% Texas 10% Specialty Finance 10% Southwest LA 9% Mortgage 9% Greater Baton Rouge 8% Tampa 5% Tallahassee/ Jacksonville 4% Finance Co. 3% Composition of EOP Loan Growth $420 million 2Q15 As of June 30, 2015 C&I $6,186 43% C&D $1,121 8% CRE $3,213 22% Mortgage $1,956 14% Consumer $1,869 13% Total Loans $14,345 6/30/15 |
 Energy Concentration Risk Is Well-Managed • Energy lending has been a core competency for more than 60 years – Disciplined underwriting, long term relationships – Continuing to review credits and stay close to our customers • Pricing pressures on oil have continued and we did see some additional downward pressure on risk ratings this quarter • Management believes that further risk rating downgrades could impact loan loss provisions but should not result in significant losses • Impact and severity will depend on overall oil price reduction and duration of the cycle • 2 nd quarter results include the impact of net downgrades from the shared national credit (SNC) review – $1 billion, or 54%, of SNCs are energy-related 7 As of June 30, 2015 |
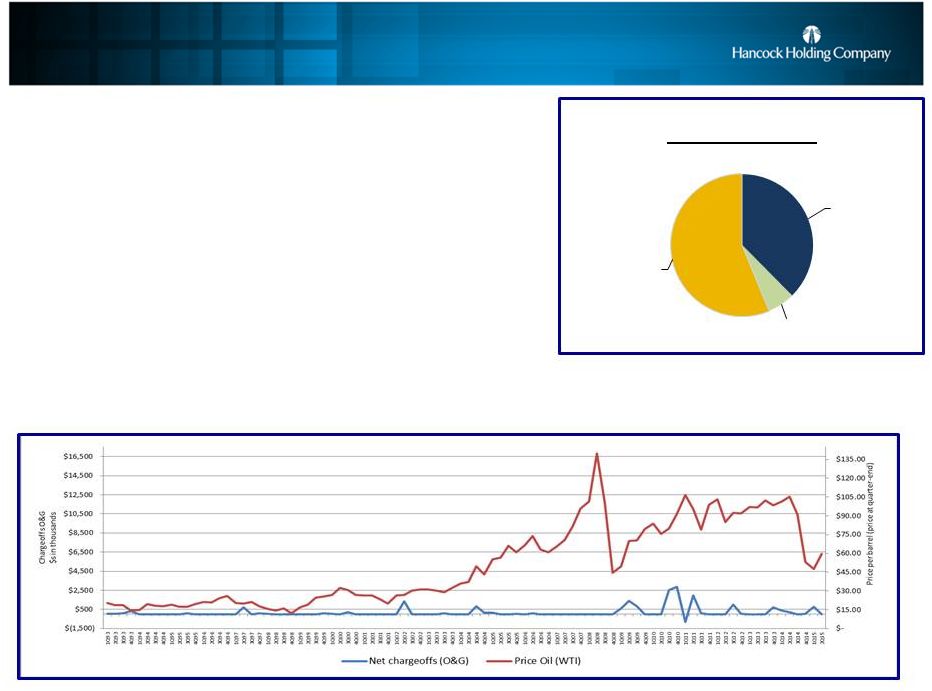 Oil & Gas Portfolio Strong; Continuing To Monitor Credits • Relationship business dating back to post WWII • Our energy customers are an excellent source of no/low cost core deposits • Low prices can limit loan growth for new bank customers • Despite recent risk rating downgrades, the overall credit quality of the energy portfolio remains solid • With experienced management in place, many of our clients have been reacting to the reduction in oil prices by proactively managing expenses, lowering discretionary spending or reducing capital expenditures 8 Upstream (E&P) $627 38% Midstream $104 6% Support Services $938 56% Oil & Gas Portfolio 6/30/15 (outstandings=$1.67B) $s in millions Diversified portfolio with concentration limits for individual categories High credit quality portfolio with historically low loss rates; disciplined underwriting Low level of cumulative losses over previous down cycles As of June 30, 2015 |
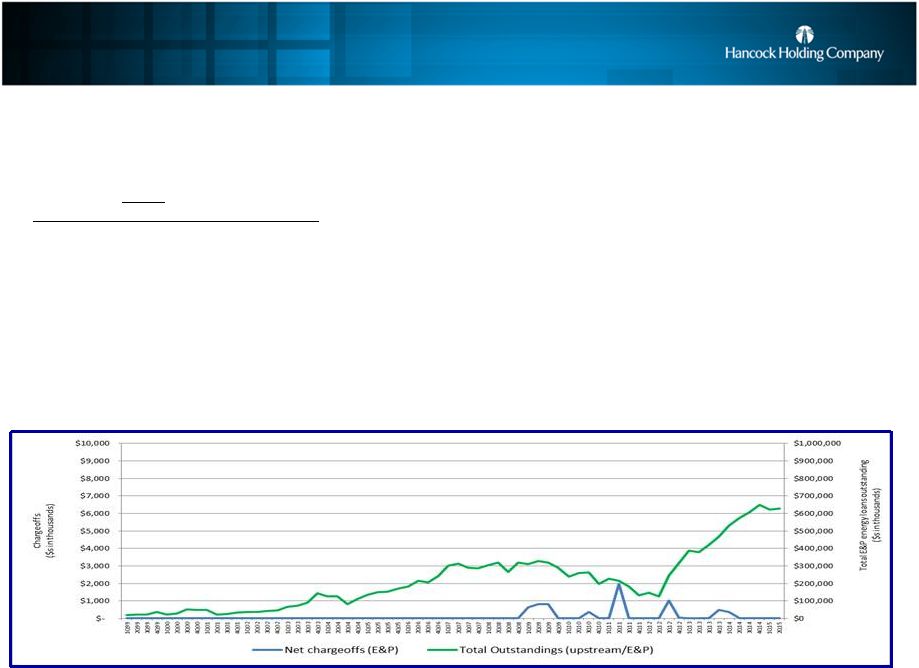 Upstream (E&P) Portfolio Diversified, Profitable • Priority, secured loans; approximately 60% oil, 40% gas • Approximately $4 million linked-quarter increase in E&P outstandings; • Current line utilization is approximately 64% up slightly linked-quarter • Lend only on proved reserves (on a risked basis); 90%+ are covered by Proved Developed Producing Reserves alone • E&P customers have hedges in place; approximately 2/3rds of our clients are hedged with an avg tenor of 1-1.5 years • Our clients breakeven at different prices/barrel oil – Breakeven varies depending on the basin – Our customers are diversified across 12 primary basins in the U.S. and in the Gulf of Mexico – Lower cost basins remain active; activity in higher cost basins has slowed considerably • Borrowing base redeterminations twice per year; all credits were reviewed in 2Q15 and adjustments made to overall commitment levels – RBL commitments reduced approximately 15% on average since the beginning of the year due to lower commodity prices 9 As of June 30, 2015 Low level of cumulative losses over previous down cycles even with growth in outstandings |
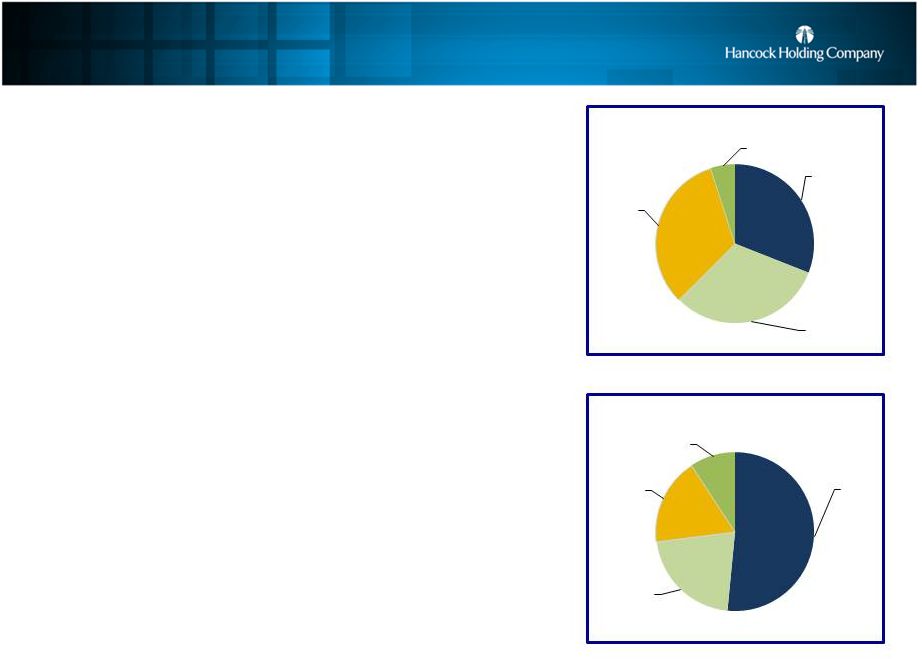 Support Sector Companies Have Weathered Previous Cycles • Many of our clients have operated through previous cycles, including the mid 80s, late 90s and 2008 • Our clients typically have low/moderate leverage, strong balance sheets and experienced management • Most of the support nondrilling companies are based in south Louisiana and Houston, and many are supporting offshore activity • Outstandings virtually unchanged linked-quarter • Current line utilization is approximately 58% • We believe day rates and service sector profitability is being impacted, and that client experience and liquidity will allow our customers to weather the current cycle 10 As of June 30, 2015 Contract drillers 31% Rental tools 32% Completion services 32% Other 5% Support Drilling Subcategories Helicopter & marine transport 52% Fabrication, construction, installation 21% Other 18% Supply/ manufacturing 9% Support Nondrilling Subcategories |
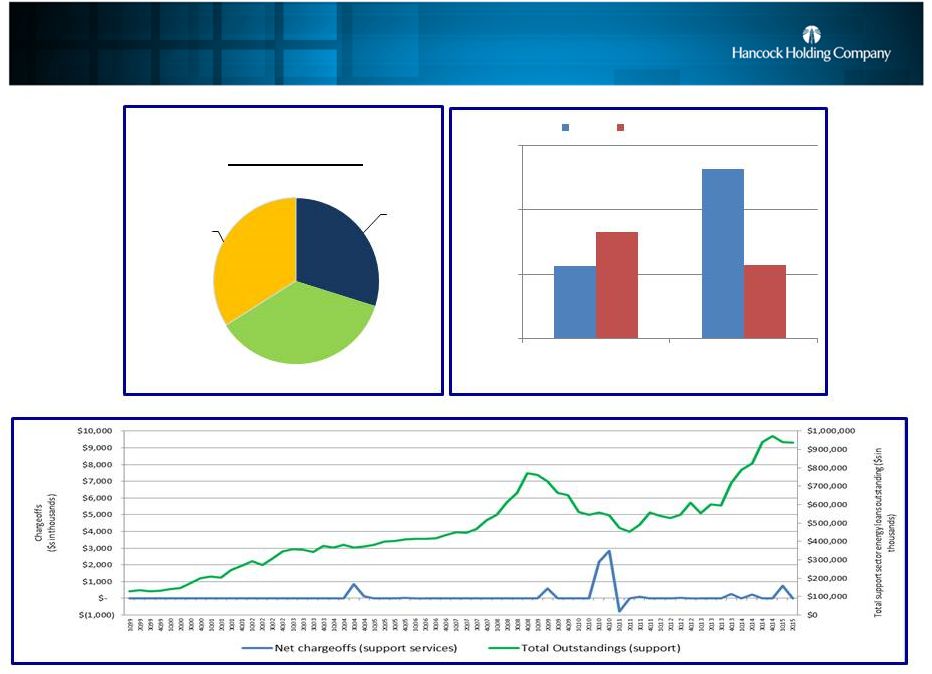 Support Services Portfolio Statistics 11 $s in millions $s in millions Experienced, long-time customers with low level of cumulative losses over previous down cycles $s in millions As of June 30, 2015 Support - drilling $280 30% Support - nondrilling (transportation) $339 36% Support - nondrilling (other) $319 34% Support Sector 6/30/15 (outstandings=$938) $280 $658 $412 $287 $0 $250 $500 $750 Drilling Support Nondrilling Support Loans Deposits 147% of loans 44% of loans |
 Allowance For Loan Losses • The allowance for loan losses was $131.1 million (0.91%) compared to $128.4 million (0.92%) linked-quarter – The allowance maintained on the non-FDIC acquired portion of the loan portfolio increased $6.3 million linked-quarter, totaling $107.0 million, and the impaired reserve on the FDIC acquired loan portfolio declined $3.6 million linked-quarter – Impact of the current energy cycle on the allowance*: • The second quarter’s allowance calculation reflects a build of approximately $11 million in the reserve for the energy portfolio related to updates to risk ratings (including impact of SNC exam) and changes in the qualitative factors related to energy – ALLL for energy credits was 1.91% at June 30, 2015, up from 1.17% at March 31, 2015 • We are disciplined in our underwriting, and while we could continue to see pressure in risk ratings, based on what we know today we expect no significant loss in our energy portfolio • We believe our current reserves are sufficient to cover any losses in the portfolio • Should pricing pressures on oil continue, we could continue to see downward pressure on risk ratings that could lead to additional provision expense in future quarters • Impact and severity will depend on overall oil price reduction and duration of the cycle 12 * Reserve reflects the amount of C&I reserve (loss factors) applied to the energy loans risk ratings. As of June 30, 2015 |
 Potential Impact To Provision From Energy Downgrades (Downward Shock Scenarios are mutually exclusive) 13 Total outstanding at 3-31-15 Total outstanding at 6-30-15 Energy Reserve* 3-31-15 Energy Reserve* 6-30-15 Incremental Provision Scenario 1 Incremental Provision Scenario 2 Incremental Provision Scenario 3 $623MM $627MM Upstream $5.0MM $10.1MM $1.1MM $1.1MM $1.1MM $109MM $104MM Midstream $0.6MM $0.7MM $0.8MM $4.5MM $4.5MM $270MM $280MM Support – Drilling $4.1MM $7.9MM $4.8MM $7.8MM $11.4MM $672MM $658MM Support – Non- drilling $10.3MM $11.9MM $8.0MM $15.3MM $29.3MM Total Incremental Provision --------- --------- $14.7MM $28.7MM $46.3MM $1.674B $1.669B Total Energy Reserve (%) $20.0MM (1.17%) $30.6MM (1.91%) $45.3MM $59.3MM $76.9MM Scenario 1 – all categories = 1 RR downgrade Scenario 2 – Upstream = 1 RR downgrade; all other sectors = 2 RR downgrade Scenario 3 – Upstream = 1 RR downgrade; Midstream = 2 RR downgrade; Support Sectors = 3 RR downgrade Impact and severity will depend on overall oil price reduction and duration of the cycle * Reserve reflects the amount of C&I reserve (loss factors) applied to the energy loans risk ratings. Portfolio Shock Scenarios based on current quarter balances and risk ratings |
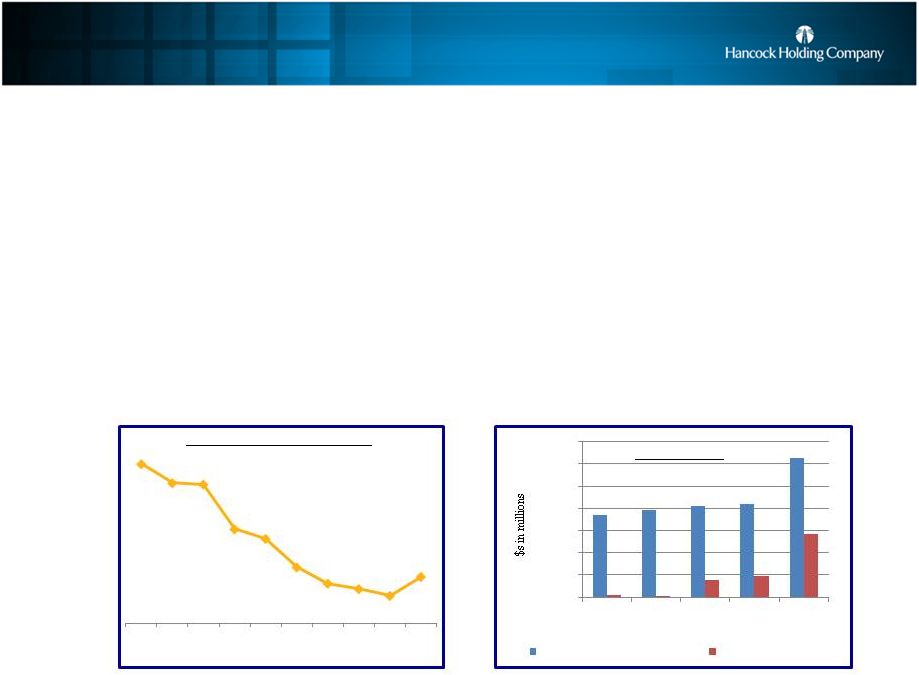 Asset Quality Measures Reflect Impact Of Energy Cycle • NPA ratio 1.15%, up 14 bps linked-quarter – Nonperforming assets totaled $165 million, up $24 million from March 31, 2015 – Nonperforming loans increased approximately $28 million linked-quarter – Mainly related to one energy loan (nondrilling support) which was downgraded during the quarter – ORE and foreclosed assets decreased approximately $4 million linked-quarter; • Provision for loan losses was $6.6 million, up $0.5 million from 1Q15 • Non-FDIC acquired net charge-offs totaled $1.2 million, or 0.03%, down from $3.7 million, or 0.11%, in 1Q15 • Criticized commercial loans totaled $626 million at June 30, 2015, up $207 million from March 31, 2015 1.98% 1.84% 1.83% 1.50% 1.43% 1.22% 1.10% 1.06% 1.01% 1.15% 1Q13 2Q13 3Q13 4Q13 1Q14 2Q14 3Q14 4Q14 1Q15 2Q15 14 As of June 30, 2015 – Increase mainly related to risk rating downgrades within the energy portfolio Nonperforming Asset (NPA) Ratio Criticized Loans $0 $100 $200 $300 $400 $500 $600 $700 2Q14 3Q14 4Q14 1Q15 2Q15 Criticized - Total Commercial Criticized - Energy |
 Securities Portfolio - Leveraging Increased Net Interest Income CMO $1,225 28% MBS $2,701 61% Munis $199 4% U. S. Agencies and other $306 7% Securities Portfolio Mix 6/30/15 • Portfolio totaled $4.4 billion, up $338 million linked-quarter, funded by a similar increase in short-term borrowings – Purchased approximately $500 million of mortgage-backed securities at an average yield of 2.13% – Additional borrowings rate approximately 15 bps – Net spread on leverage = approximately 2.00% • Yield 2.22% - down 13 bps linked-quarter • Unrealized gain (net) of $14.3 million on AFS • 52% HTM, 48% AFS • Duration 3.96 compared to 3.45 at 3-31-15 • Balance sheet is asset sensitive over a 2 year period to rising interest rates under various shock scenarios • IRR modeling is based on conservative assumptions – Flat balance sheet – Loan portfolio 54% variable (with 56% LIBOR-based) – Modeled lag in deposit rate increases – Conservative % DDA attrition for certain increases in rates $s in millions Period-end balances. As of June 30, 2015 15 1.1% 3.4% 5.1% 6.2% 1.3% 3.8% 5.4% 6.2% 0.0% 2.0% 4.0% 6.0% 8.0% 10.0% 12.0% +100 shock +200 shock +300 shock +400 shock Year 1 Year 2 Net Interest Income Scenarios Regulatory Rate Shocks |
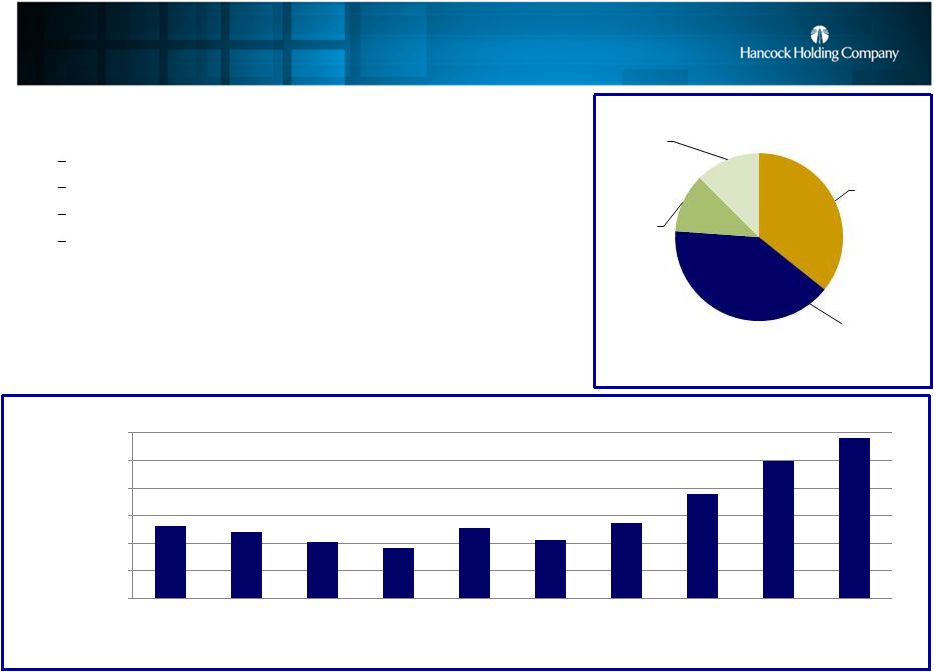 Solid Levels Of Core Deposit Funding Noninterest bearing $6,181 36% Interest- bearing transaction & savings $6,994 40% Interest- bearing public funds $1,963 11% Time deposits $2,164 13% Total Deposits $17,302 6/30/15 • Total deposits $17.3 billion, up $441 million, or 3%, linked-quarter Noninterest-bearing demand deposits (DDA) decreased $21 million $418 million increase in interest-bearing transaction and savings deposits $90 million decrease in time deposits Public fund deposits increased $134 million • Funding mix remained strong • DDA comprised 36% of total period-end deposits • Cost of funds increased 4 basis points to 28 bps related to the full quarter impact of the sub debt issued in 1Q15 1Q13 2Q13 3Q13 4Q13 1Q14 2Q14 3Q14 4Q14 1Q15 2Q15 Avg Qtrly Deposits $15.3 $15.2 $15.0 $14.9 $15.3 $15.1 $15.4 $15.9 $16.5 $16.9 LQA EOP growth -13% -3% -3% 8% -2% -1% 13% 21% 7% 10% $14.0 $14.5 $15.0 $15.5 $16.0 $16.5 $17.0 $s in billions 16 $s in millions |
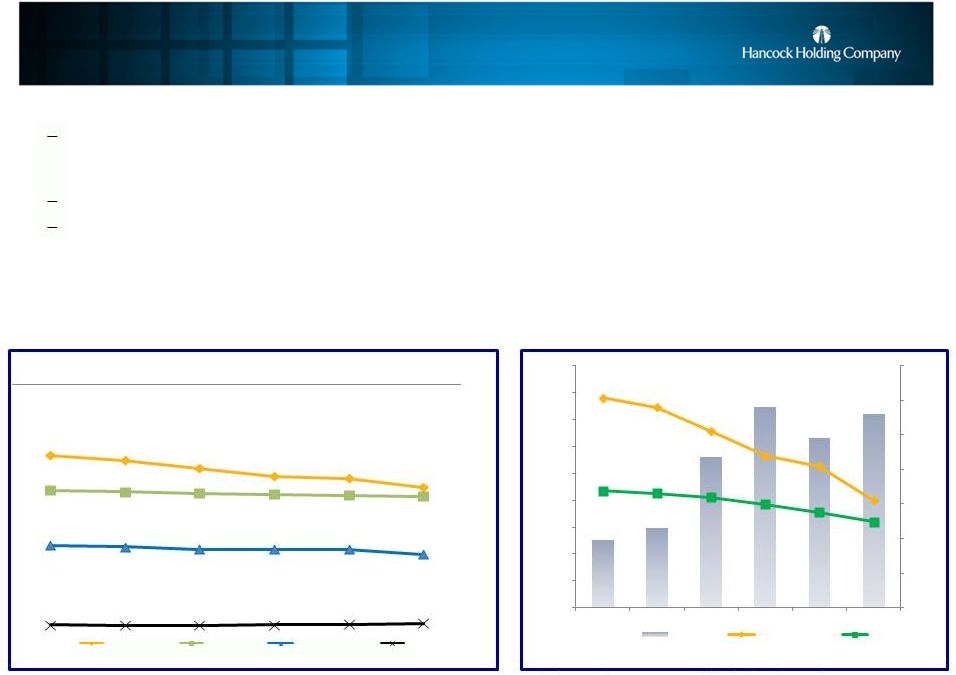 Core NIM Reflects Pressure While Core Loan Yield Stabilizing Core NIM = reported net interest income (TE) excluding total net purchase accounting adjustments, annualized, as a percent of average earning assets. (See slide 26) • Reported net interest margin (NIM) 3.30%, down 25 bps linked-quarter Approximately $8 million decline in purchase accounting adjustments; (-18 bps) • Core NIM of 3.14% declined 7 bps linked-quarter Issued $150 million of holding company subordinated debt March 9, 2015; (-4 bps) Declines in core loan yield (-3 bps) and securities yield (-13 bps) impacted NIM • One additional accrual day impacted net interest income • Projected accretion will still lead to a difference in reported and core NIMs 17 As of June 30, 2015 4.06% 3.99% 3.81% 3.63% 3.55% 3.30% 3.37% 3.35% 3.32% 3.27% 3.21% 3.14% $136 $138 $140 $142 $144 $146 $148 $150 2.50% 2.70% 2.90% 3.10% 3.30% 3.50% 3.70% 3.90% 4.10% 4.30% 1Q14 2Q14 3Q14 4Q14 1Q15 2Q15 Core NII NIM - reported NIM - core 5.00% 4.86% 4.63% 4.41% 4.36% 4.10% 4.02% 3.97% 3.94% 3.91% 3.88% 3.85% 2.47% 2.43% 2.36% 2.36% 2.35% 2.22% 0.23% 0.22% 0.21% 0.23% 0.24% 0.28% 1Q14 2Q14 3Q14 4Q14 1Q15 2Q15 Loan Yield- Reported Loan Yield - Core Securities Yield- Reported Cost of Funds- Reported |
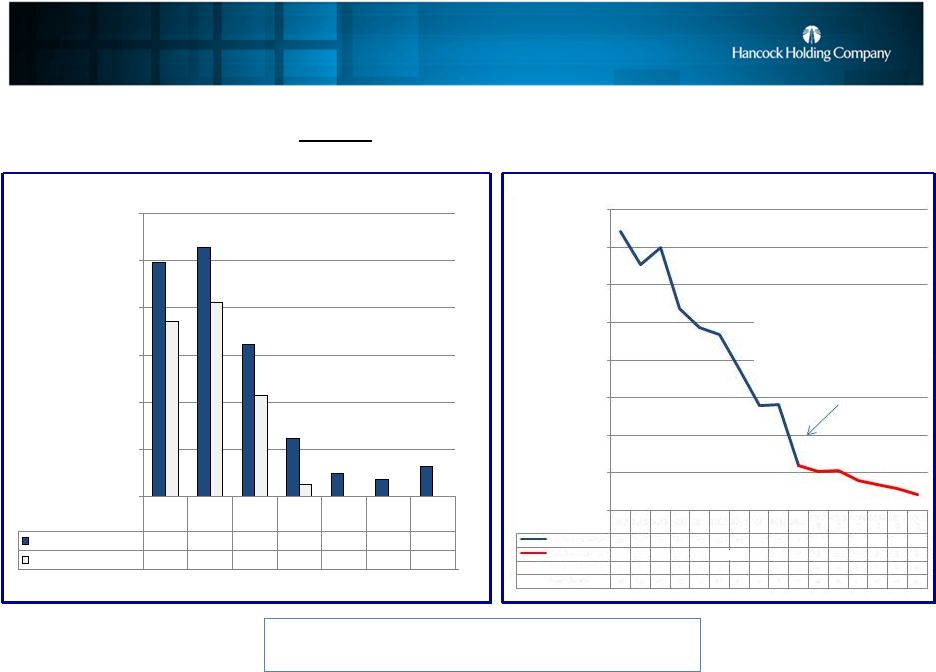 Approximately $8 million decline in net PAA revenue in 2Q15; or $.06 per share Sizeable Decline in Purchase Accounting Impacted 2Q15 Results Impact of Purchase Accounting Adjustments (projections will be updated quarterly; subject to change) $s in millions *Projected revenue includes loan accretion from Whitney and Peoples First, offset by amortization of the Whitney bond portfolio premium and amortization of the Peoples First indemnification asset. 2012 2013 2014 2015 2016 2017 Post 2017 Revenue impact* $124 $132 $80 $31 $13 $9 $16 Pre-tax impact PAA $93 $103 $54 $7 $0 $25 $50 $75 $100 $125 $150 18 N/M N/M As of June 30, 2015 N/M 1Q13 2Q13 3Q13 4Q13 1Q14 2Q14 3Q14 4Q14 1Q15 2Q15 3Q15 E 4Q15 E 1Q16 E 2Q16 E 3Q16 E 4Q16 E PAA Revenue -act* 37 33 35 27 24 23 19 14 14 6 PAA Revenue -proj* 5 5 4 3 3 2 Intangible Amort 7 7 7 7 7 7 7 6 6 6 6 6 5 5 5 5 Pre-tax impact 30 25 28 20 17 17 12 7 8 0 -1 0 -1 -2 -2 -3 $0 $5 $10 $15 $20 $25 $30 $35 $40 |
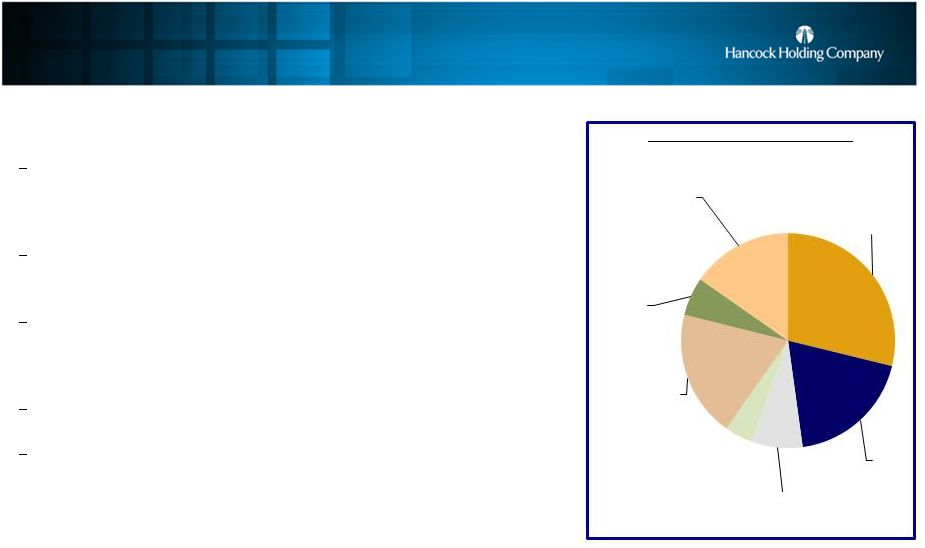 Core Noninterest Income Growth Across Business Lines Service Charges on Deposit $17.9 29% Trust $11.8 19% Investment & annuity $4.8 8% Insurance $2.6 4% Bankcard and ATM $11.9 19% Secondary mortgage operations $3.6 6% Other (excluding IA amort) $9.5 15% • Noninterest income, including securities transactions, totaled $60.9 million, up $4.3 million, or 8%, linked-quarter Amortization of the indemnification asset for FDIC covered loans totaled $1.3 million, compared to $1.2 million in the first quarter; the amortization is a reduction to noninterest income and is a result of a lower level of expected future losses on covered loans (non-core) Service charges on deposits totaled $17.9 million, up $0.6 million, or 3%, from the first quarter, while Bankcard & ATM fees totaled $11.9 million, up $0.7 million, or 6% Within the wealth banking product set, investment & annuity income and insurance fees totaled $7.4 million, up $0.6 million, or 9%, linked-quarter, with trust fees of $11.8 million, up $0.6 million, or 5%, in part related to fees from seasonal tax prep Fees from secondary mortgage operations totaled $3.6 million, up $1 million, or 36%, linked-quarter Other noninterest income (excluding IA amortization) totaled $9.5 million, up $1.3 million, or 16%, linked-quarter $s in millions 19 Core Noninterest Income Mix 2Q15 As of June 30, 2015 |
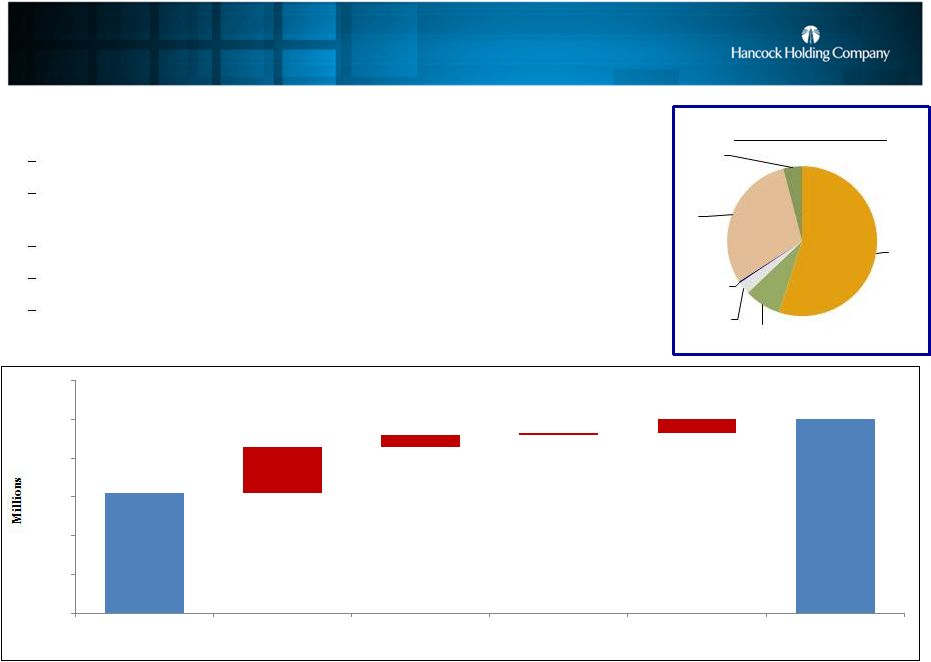 Continuing To Control Operating Expenses • Operating expenses totaled $150.0 million in 2Q15, up $3.8 million, or 3%, linked- quarter Excludes $8.9 million of nonoperating expenses Personnel expense totaled $82.5 million, up $2.4 million, or 3%, linked-quarter; increase in incentive pay in the quarter was partially offset by a seasonal decrease in benefits Occupancy and equipment totaled $15.8 million, up $0.7 million, or 5%, linked-quarter ORE expense totaled $0.5 million for 2Q15, virtually unchanged linked-quarter Other operating expense increased $0.7 million, or 2%, linked-quarter Personnel $82.5 55% Occupancy $11.8 8% Equipment $4.1 3% ORE $0.5 Other $45.0 30% Amortization of intangibles $6.1 4% Operating Expense Mix 2Q15 As of June 30, 2015; excluding nonoperating expense items 20 $s in millions $146.2 $150.0 $2.4 $0.6 $0.1 $0.7 $140 $142 $144 $146 $148 $150 $152 1Q15 Operating Expense Personnel Expense Occupancy Equipment Other Expense 2Q15 Operating Expense |
 Current and Future Revenue Initiatives Quarter Revenue Growth Begins Consumer Lending • Enhanced approval process for consumer loans designed to grow consumer and consumer finance loans through the Bank & Harrison Finance delivery channels 3Q15 Equipment Finance • New equipment finance strategy is gaining immediate momentum through a mix of leasing & lending on equipment 3Q15 Enhanced Prospecting for Business Clients • Leveraging a new source of prospect information with industry-leading customer management tools resulting in more business development opportunities and new clients per banker 4Q15 Loan Pricing Initiative • Leveraging market intelligence to stabilize and enhance commercial loan yields & fees 2Q15 New Business Card Products • New credit and payment card products and rewards programs for businesses further enhances our product offering 3Q15 Deposit Growth Strategy • Market-by-market strategy to grow deposits providing dollar for dollar funding of loan growth 3Q14 Consumer Checking Products • The delivery of enhanced products is the first in a series of initiatives that will deliver a fresh, innovative and competitive consumer banking proposition to clients 3Q15 21 As of June 30, 2015 • Strategic change in branch banking focus from product sales to growth, revenue and profitability • Merchant services technology, product and sales enhancements to retain and grow clients • Deliberate focus on leveraging wealth management expertise through client relationship reviews and Private Banking delivery enhancements • New technology platform to streamline commercial loan processing – enhanced banker efficiencies allows more time for business development • Mortgage banking changes expected to result in increased production, quicker turnaround/closing times, and improved customer and realtor satisfaction |
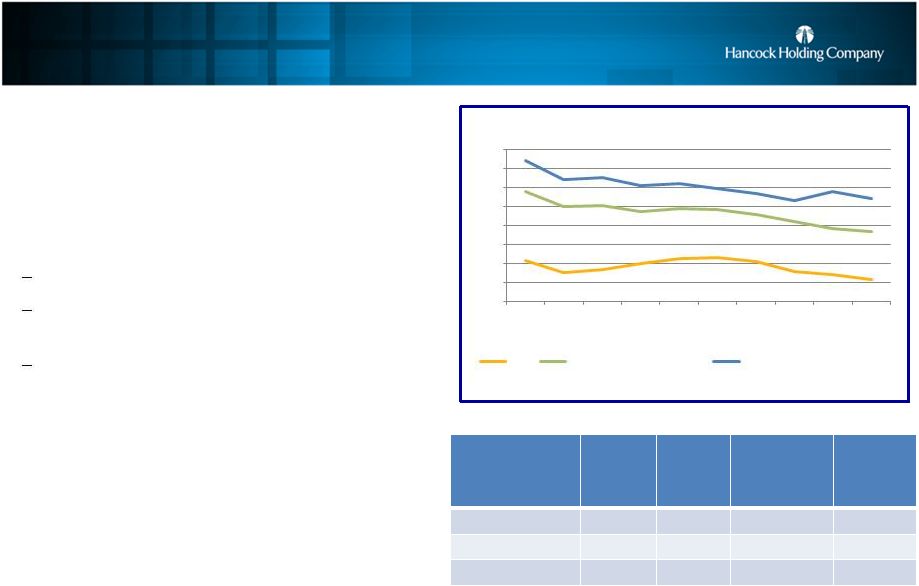 Solid Capital Levels • TCE ratio 8.12%, down 28 bps linked- quarter mainly related to the growth in total assets • Issued $150 million of holding company subordinated debt March 9, 2015 at 5.95% Qualifies as Tier 2 capital Used approximately 1/3 rd for completion of common stock buyback in 1Q15 Remainder to be used for general corporate purposes • Will continue to review additional options to deploy excess capital in the best interest of the Company and its shareholders – Organic growth – M&A – Stock buyback – Dividends 7% 8% 9% 10% 11% 12% 13% 14% 15% 1Q13 2Q13* 3Q13 4Q13 1Q14 2Q14 3Q14 4Q14 1Q15 2Q15e Capital Ratios *Stock Buyback (ASR) initiated 22 As of June 30, 2015 Tangible Common Equity Ratio Leverage (Tier 1) Ratio Tier 1 Risked-Based Capital Ratio Total Risk-Based Capital Ratio June 30, 2015 8.12% 9.05%(e) 10.69%(e) 12.44%(e) March 31, 2015 8.40% 9.17% 10.86% 12.77% December 31, 2014 8.59% 9.17% 11.23% 12.30% TCE Tier 1 Risk-Based Capital Total Risk-Based Capital |
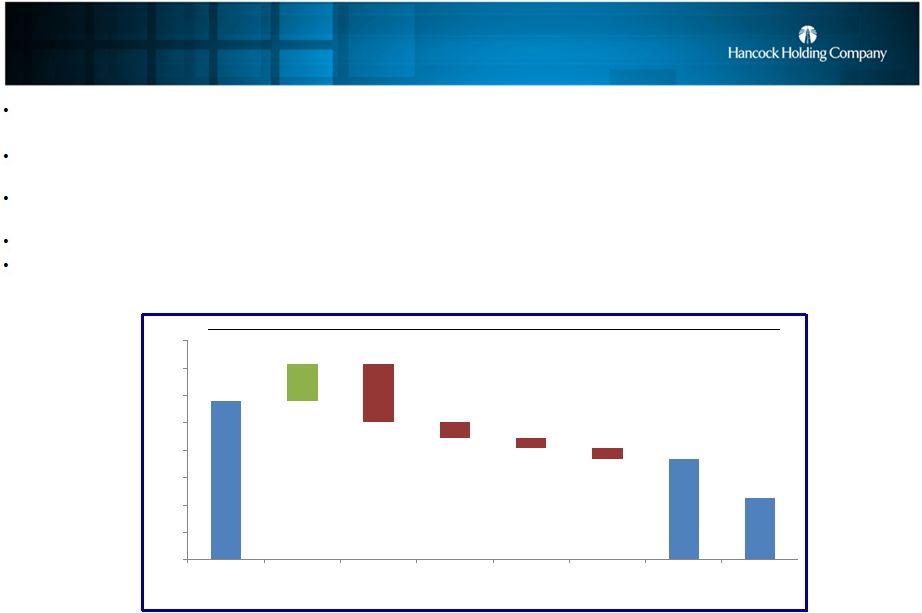 Maintained Strong Capital in Recent Regulatory Stress Test 23 11.6% +2.7% -4.2% -1.2% -0.7% -0.8% 7.4% 4.5% 0% 2% 4% 6% 8% 10% 12% 14% 16% Actual Q3 2014 * PPNR PLLL Dividends RWA Other ** Ending Q4 2016 Regulatory Minimum Drivers of Change in Common Equity Tier 1 (CET1) Capital Ratio Q4 2014 through Q4 2016 under the Supervisory Severely Adverse Scenario Hancock was required to implement the stress testing and disclosure requirements of the Dodd-Frank Wall Street Reform and Consumer Protection Act of 2010 The stress test is defined as a “process to assess the potential impact of certain scenarios on the consolidated earnings, losses and capital of a company over the planning horizon, taking into account its current condition, risks, exposures, strategies, and activities” The company and bank maintained capital levels that exceed regulatory minimums throughout the nine-quarter course of the Severely Adverse scenario Management employed a conservative approach to the stress test in order to ensure sufficient hypothetical stress was applied The stress test and its results do not include either $150 million of Tier 2-qualified sub-debt issued or the repurchase of approximately $75 million of common stock in the first quarter of 2015 * 3Q 2014 CET1 ratio is the Tier 1 Common Equity ratio calculated under Basel I. CET1 calculation under Basel III took effect 1/1/15 ** Other includes all other adjustments, including goodwill, other intangibles, disallowed deferred tax asset and income taxes |
 Near-Term Outlook 2Q15 Items to note Outlook Loans +12% LQA +11% Y-o-Y Limited net paydowns in energy portfolio compared to previous expectations 5-8% EOP growth for full year Based on current trends 2015 loan growth expected at or above top end of current range; could be impacted by future energy paydowns Purchase Accounting Adjustments (PAAs) $0.3 million pre-tax (see slide 27) Includes items impacting revenue and expense Sizeable decline of $7.5 million in 2Q15 PAAs; expected future declines modest (see slide 18) Net Interest Margin (NIM) 3.30% reported 3.14% core Reported down 25bps; Core down 7bps Continued downward pressure on reported and core margin; increasing core net interest income Core Revenue $209.3 million Excludes PAAs Recent growth reflects initiatives started in the prior several quarters; expect growth in 2H15 as initiatives continue to mature Loan Loss Provision $6.6 million Includes $11 million of reserve build related to energy & SNC review Should pricing pressures on oil continue, we could see additional risk rating downgrades and increased provisions; not expecting significant charge-offs Noninterest Expense $150.0 million operating $8.9 million of nonoperating costs Slightly higher in the near term E.P.S. – operating $.51 No difference between operating and core E.P.S. (calculations on slides 25 and 27) Current expectations for 2H15 are in line with current quarterly street estimates 24 As of June 30, 2015 |
 Appendix: EPS calculation $s in thousands, except E.P.S. Operating income to common shareholders $40,631 $44,697 $49,575 Income allocated to participating securities ($894) ($1,040) ($1,016) Operating income allocated to common shareholders $39,737 $43,657 $48,559 Weighted average common shares – diluted 78,115 79,661 82,174 E.P.S. - diluted $.51 $.55 $.59 See Note 8 in the most recent 10Q for more details on the two-class method for E.P.S. calculation. 25 Three Months Ended 6/30/15 Three Months Ended 3/31/15 Three Months Ended 6/30/14 |
 Appendix: Purchase Accounting Adjustments Core NII & NIM Reconciliation ($s in millions) 2Q15 1Q15 4Q14 3Q14 2Q14 Net Interest Income (TE) – reported (NII) $154.9 $161.1 $163.6 $166.2 $167.3 Whitney expected loan accretion (performing) 1.1 1.2 2.7 5.0 5.8 Whitney expected loan accretion (credit impaired) 6.8 11.3 13.8 17.0 19.8 Peoples First expected loan accretion 0.9 1.1 .7 .8 2.5 Excess cash recoveries* --- 2.8 --- --- --- Total Loan Accretion $8.7 $16.4 $17.2 $22.8 $28.1 Whitney premium bond amortization (1.0) (1.0) (1.2) (1.3) (1.4) Whitney and Peoples First CD accretion --- --- --- --- .1 Total Net Purchase Accounting Adjustments (PAAs) impacting NII $7.7 $15.3 $16.0 $21.5 $26.7 Net Interest Income (TE) – core (Reported NII less net PAAs) $147.2 $145.8 $147.6 $144.7 $140.6 Average Earning Assets $18,781 $18,316 $17,911 $17,324 $16,792 Net Interest Margin – reported 3.30% 3.55% 3.63% 3.81% 3.99% Net Purchase Accounting Adjustments (%) .16% .34% .36% .49% .64% Net Interest Margin - core 3.14% 3.21% 3.27% 3.32% 3.35% * Excess cash recoveries include cash collected on certain zero carrying value acquired loan pools above expected amounts. 26 |
 Appendix: Non-GAAP Reconciliation (Net Income, ROA, E.P.S.) $s in millions (except EPS) Net income $34.8 $40.2 $40.0 Adjustments from net to operating income Securities transactions gains - -0.3 - Total nonoperating expense items (pre-tax) 8.9 7.3 12.1 Taxes on adjustments at marginal tax rate 3.1 2.4 2.5 Total adjustments (net of taxes) 5.8 4.5 9.6 Operating income $40.6 $44.7 $49.6 Adjustments from operating to core income PAA – Net Interest Margin (see slide 26) 7.7 15.3 26.7 Intangible Amortization (noninterest expense) -6.1 -6.3 -6.7 Amortization of Indemnification Asset (noninterest income) -1.3 -1.2 -3.3 Total Purchase Accounting Adjustments (PAA) (pre-tax) $0.3 $7.8 $16.7 Taxes on adjustments at marginal tax rate 0.1 2.7 5.8 Total PA adjustments (net of taxes) 0.2 5.1 10.9 Core Income (Operating less purchase accounting items) $40.4 $39.6 $38.7 Average Assets $20,875 $20,444 $19,039 ROA (operating) 0.78% 0.89% 1.04% ROA (core) 0.78% 0.79% 0.82% Weighted Average Diluted Shares (thousands) 78,115 79,661 82,174 E.P.S. (operating) $.51 $.55 $.59 E.P.S. (core) $.51 $.49 $.46 27 Three Months Ended 6/30/15 Three Months Ended 3/31/15 Three Months Ended 6/30/14 |
 Appendix: Whitney Portfolio Continues Solid Performance • Loan mark on the acquired-performing portfolio accreted into earnings over the life of the portfolio • Credit-impaired loan mark available for charge-offs; if not needed for charge-offs then accreted into income • Quarterly reviews of accretion levels and portfolio performance will impact reported margin $s in millions Credit- Impaired Performing Total Whitney loan mark at acquisition (as adjusted in 4Q11) $284 $187 $471 Acquired portfolio loan balances at acquisition $818 $6,101 $6,919 Discount at acquisition 34.7% 3.1% 6.8% Remaining Whitney loan mark at 6/30/15 $43 $4 $47 Remaining acquired portfolio loan balances at 6/30/15 $77 $699 $776 Acquired loan charge-offs from acquisition thru 6/30/15 $24 $14 $38 Discount at 6/30/15 55.1% 0.5% 6.0% 28 As of June 30, 2015 |
 Appendix: Peoples First Loan Mark Used For Charge-Offs • FDIC acquired loan portfolio • Entire loan mark available for charge-offs; if not needed for charge-offs then accreted into income • Quarterly reviews of accretion levels and portfolio performance will impact reported margin • FDIC loss share receivable totaled $35.1 million at June 30, 2015 • Non-single family FDIC loss share agreement expired at December 31, 2014 • $179 million remains covered under FDIC single family loss share agreement $s in millions Credit Impaired Peoples First loan mark at acquisition (12/2009) $509 Charge-offs from acquisition thru 6/30/15 $430 Accretion since acquisition date $93 Remaining loan mark at 6/30/15 $33 Impairment reserve at 6/30/15 $24 Remaining portfolio loan balances at 6/30/15 $261 Discount & allowance at 6/30/15 22% 29 As of June 30, 2015 |
 Second Quarter 2015 Financial Results July 23, 2015 Second Quarter 2015 Financial Results July 23, 2015 |