September 2020 Investor Conferences Reference Slides 9/9/2020 Exhibit 99.1
This presentation contains forward-looking statements within the meaning of section 27A of the Securities Act of 1933, as amended, and section 21E of the Securities Exchange Act of 1934, as amended. Forward-looking statements that we may make include statements regarding our expectations regarding our performance and financial condition, balance sheet and revenue growth, the provision for credit losses, loan growth expectations, management’s predictions about charge-offs for loans, including energy-related credits, the impact of significant decreases in oil and gas prices on our energy portfolio, the impact of the COVID-19 pandemic on the economy and our operations, the adequacy of our enterprise risk management framework, the impact of the MidSouth acquisition or future business combinations on our performance and financial condition, including our ability to successfully integrate the businesses, success of revenue-generating initiatives, the effectiveness of derivative financial instruments and hedging activities to manage risks, projected tax rates, increased cybersecurity risks, including potential business disruptions or financial losses, the adequacy of our internal controls over financial reporting, the financial impact of regulatory requirements and tax reform legislation, the impact of the change in the referenced rate reform, deposit trends, credit quality trends, changes in interest rates, net interest margin trends, future expense levels, future profitability, improvements in expense to revenue (efficiency) ratio, purchase accounting impacts, accretion levels and expected returns. Also, any statement that does not describe historical or current facts is a forward-looking statement. These statements often include the words “believes,” “expects,” “anticipates,” “estimates,” “intends,” “plans,” “forecast,” “goals,” “targets,” “initiatives,” “focus,” “potentially,” “probably,” “projects,” “outlook," or similar expressions or future conditional verbs such as “may,” “will,” “should,” “would,” and “could.” Forward-looking statements are based upon the current beliefs and expectations of management and on information currently available to management. Our statements speak as of the date hereof, and we do not assume any obligation to update these statements or to update the reasons why actual results could differ from those contained in such statements in light of new information or future events. Given the many unknowns and risks being heavily weighted to the downside, our forward-looking statements are subject to the risk that conditions will be substantially different than we are currently expecting. If efforts to contain COVID-19 are unsuccessful and restrictions on movement last into the third quarter or beyond, the recession would be much longer and much more severe. Ineffective fiscal stimulus, or an extended delay in implementing it, are also major downside risks. The deeper the recession is, and the longer it lasts, the more it will damage consumer fundamentals and sentiment. This could both prolong the recession, and/or make any recovery weaker. Similarly, the recession could damage business fundamentals, and an extended global recession due to COVID-19 would weaken the U.S. recovery. As a result, the outbreak and its consequences, including responsive measures to manage it, have had and are likely to continue to have an adverse effect, possibly materially, on our business and financial performance by adversely affecting, possibly materially, the demand and profitability of our products and services, the valuation of assets and our ability to meet the needs of our customers. Forward-looking statements are subject to significant risks and uncertainties. Any forward-looking statement made in this release is subject to the safe harbor protections set forth in the Private Securities Litigation Reform Act of 1995. Investors are cautioned against placing undue reliance on such statements. Actual results may differ materially from those set forth in the forward-looking statements. Additional factors that could cause actual results to differ materially from those described in the forward-looking statements can be found in Part I, “Item 1A. Risk Factors” in our Annual Report on Form 10-K for the year ended December 31, 2019, in Part II, “Item 1A. Risk Factors” in our Quarterly Report on Form 10-Q for the quarter ended June 30, 2020 and in other periodic reports that we file with the SEC. Important cautionary statement about forward-looking statements
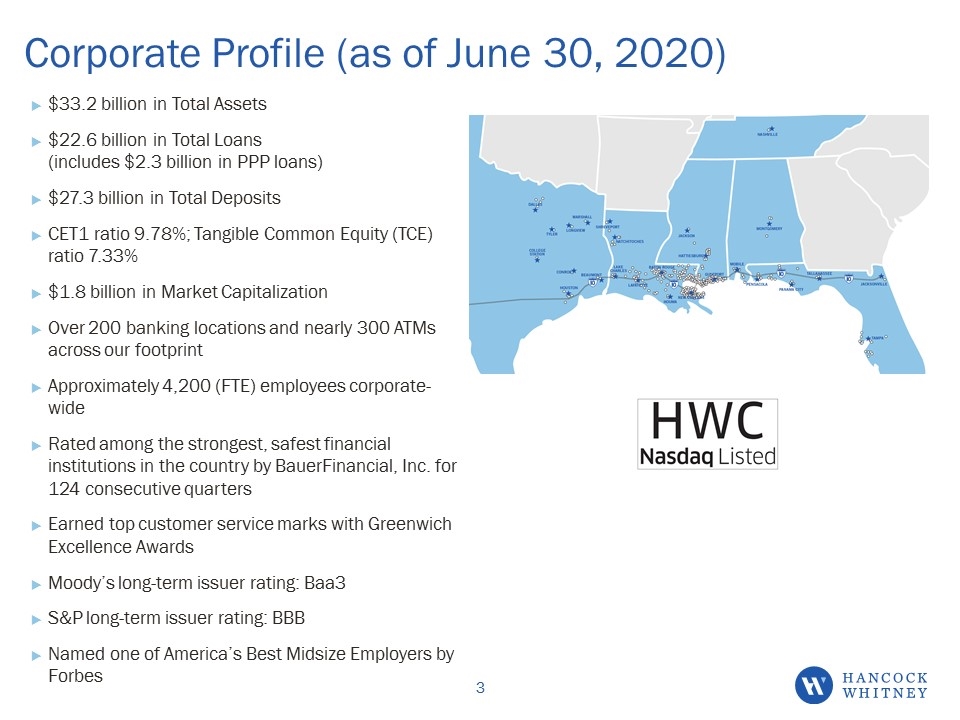
Corporate Profile (as of June 30, 2020) $33.2 billion in Total Assets $22.6 billion in Total Loans (includes $2.3 billion in PPP loans) $27.3 billion in Total Deposits CET1 ratio 9.78%; Tangible Common Equity (TCE) ratio 7.33% $1.8 billion in Market Capitalization Over 200 banking locations and nearly 300 ATMs across our footprint Approximately 4,200 (FTE) employees corporate-wide Rated among the strongest, safest financial institutions in the country by BauerFinancial, Inc. for 124 consecutive quarters Earned top customer service marks with Greenwich Excellence Awards Moody’s long-term issuer rating: Baa3 S&P long-term issuer rating: BBB Named one of America’s Best Midsize Employers by Forbes
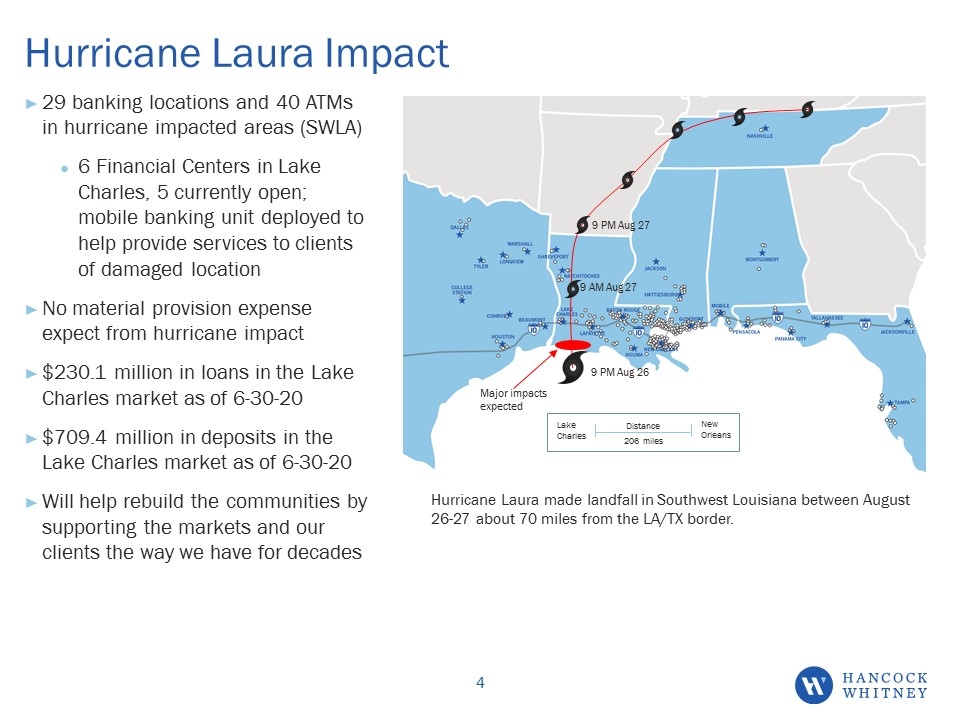
Hurricane Laura Impact Hurricane Laura made landfall in Southwest Louisiana between August 26-27 about 70 miles from the LA/TX border. 29 banking locations and 40 ATMs in hurricane impacted areas (SWLA) 6 Financial Centers in Lake Charles, 5 currently open; mobile banking unit deployed to help provide services to clients of damaged location No material provision expense expect from hurricane impact $230.1 million in loans in the Lake Charles market as of 6-30-20 $709.4 million in deposits in the Lake Charles market as of 6-30-20 Will help rebuild the communities by supporting the markets and our clients the way we have for decades 9 PM Aug 26 9 AM Aug 27 9 PM Aug 27 Major impacts expected Distance 206 miles Lake Charles New Orleans
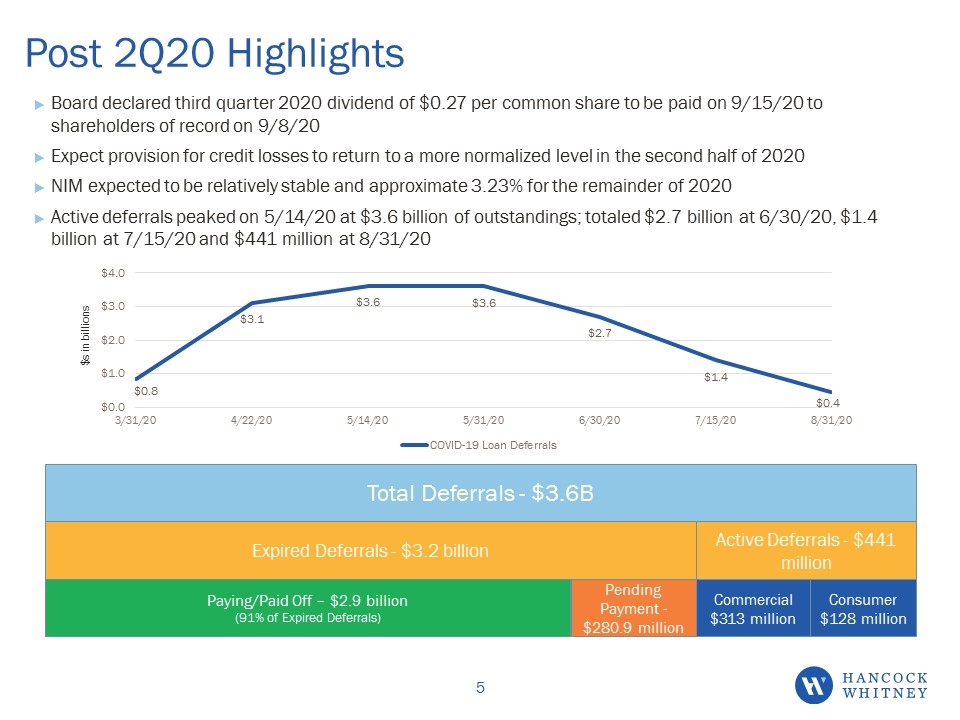
Post 2Q20 Highlights Board declared third quarter 2020 dividend of $0.27 per common share to be paid on 9/15/20 to shareholders of record on 9/8/20 Expect provision for credit losses to return to a more normalized level in the second half of 2020 NIM expected to be relatively stable and approximate 3.23% for the remainder of 2020 Active deferrals peaked on 5/14/20 at $3.6 billion of outstandings; totaled $2.7 billion at 6/30/20, $1.4 billion at 7/15/20 and $441 million at 8/31/20 $s in billions Total Deferrals - $3.6B Expired Deferrals - $3.2 billion Active Deferrals - $441 million Paying/Paid Off – $2.9 billion (91% of Expired Deferrals) Pending Payment - $280.9 million Commercial $313 million Consumer $128 million
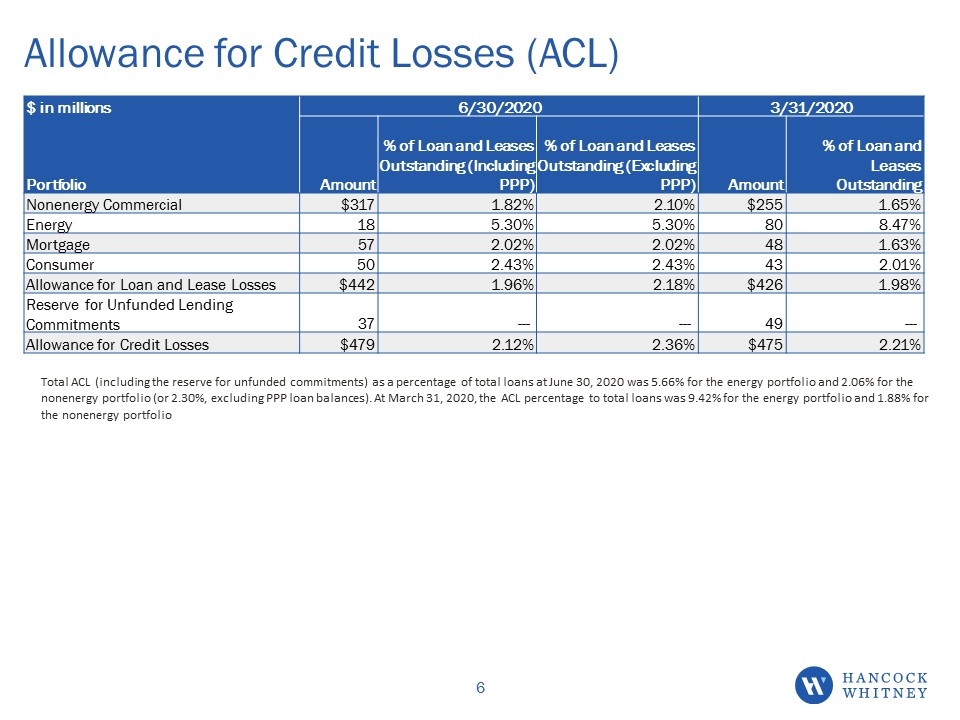
Allowance for Credit Losses (ACL) Total ACL (including the reserve for unfunded commitments) as a percentage of total loans at June 30, 2020 was 5.66% for the energy portfolio and 2.06% for the nonenergy portfolio (or 2.30%, excluding PPP loan balances). At March 31, 2020, the ACL percentage to total loans was 9.42% for the energy portfolio and 1.88% for the nonenergy portfolio $ in millions 6/30/2020 3/31/2020 Portfolio Amount % of Loan and Leases Outstanding (Including PPP) % of Loan and Leases Outstanding (Excluding PPP) Amount % of Loan and Leases Outstanding Nonenergy Commercial $317 1.82% 2.10% $255 1.65% Energy 18 5.30% 5.30% 80 8.47% Mortgage 57 2.02% 2.02% 48 1.63% Consumer 50 2.43% 2.43% 43 2.01% Allowance for Loan and Lease Losses $442 1.96% 2.18% $426 1.98% Reserve for Unfunded Lending Commitments 37 --- --- 49 --- Allowance for Credit Losses $479 2.12% 2.36% $475 2.21%
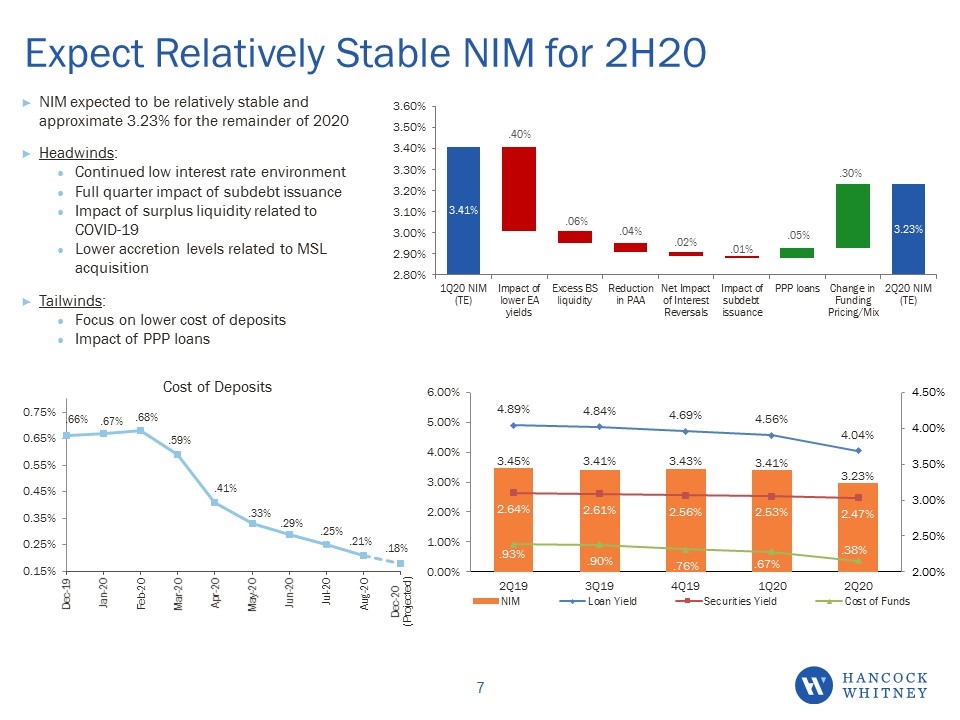
NIM expected to be relatively stable and approximate 3.23% for the remainder of 2020 Headwinds: Continued low interest rate environment Full quarter impact of subdebt issuance Impact of surplus liquidity related to COVID-19 Lower accretion levels related to MSL acquisition Tailwinds: Focus on lower cost of deposits Impact of PPP loans Expect Relatively Stable NIM for 2H20 Cost of Deposits
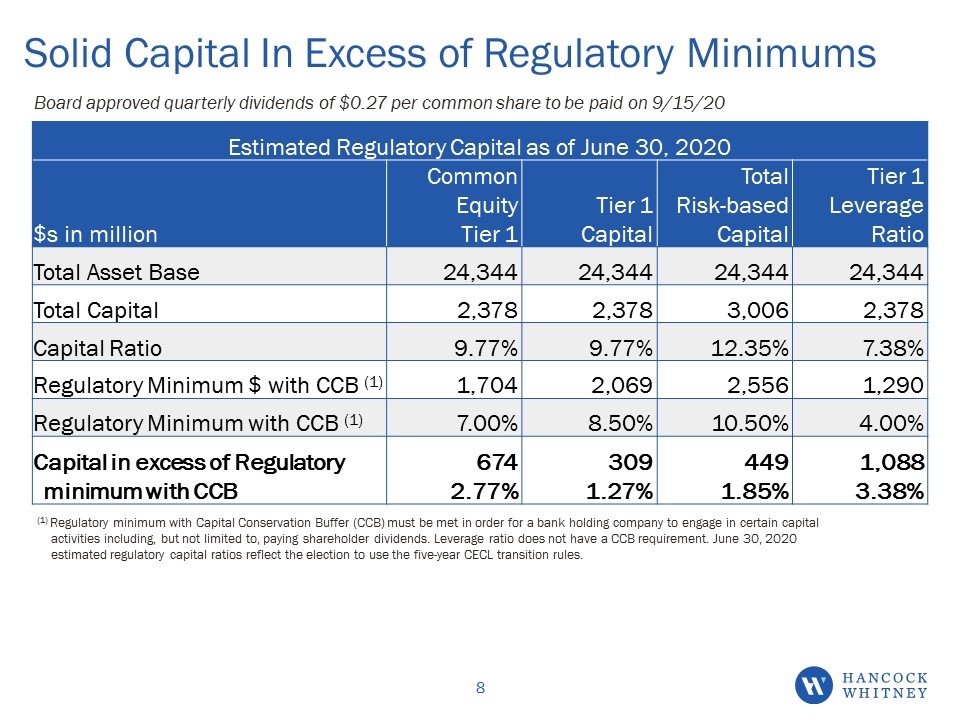
Solid Capital In Excess of Regulatory Minimums (1) Regulatory minimum with Capital Conservation Buffer (CCB) must be met in order for a bank holding company to engage in certain capital activities including, but not limited to, paying shareholder dividends. Leverage ratio does not have a CCB requirement. June 30, 2020 estimated regulatory capital ratios reflect the election to use the five-year CECL transition rules. Board approved quarterly dividends of $0.27 per common share to be paid on 9/15/20 Estimated Regulatory Capital as of June 30, 2020 $s in million Common Equity Tier 1 Tier 1 Capital Total Risk-based Capital Tier 1 Leverage Ratio Total Asset Base 24,344 24,344 24,344 24,344 Total Capital 2,378 2,378 3,006 2,378 Capital Ratio 9.77% 9.77% 12.35% 7.38% Regulatory Minimum $ with CCB (1) 1,704 2,069 2,556 1,290 Regulatory Minimum with CCB (1) 7.00% 8.50% 10.50% 4.00% Capital in excess of Regulatory 674 309 449 1,088 minimum with CCB 2.77% 1.27% 1.85% 3.38%
September 2020 Investor Conferences Reference Slides 9/9/2020


