THIRD QUARTER REPORT − 2013 Dear Fellow Shareholders: I am pleased to share with you the financial results for the third quarter of 2013. We are starting to see the benefits of our major strategic actions to restructure our branch network as well as realizing the impact of the tenuous economic environment. Over the past year, we have been focused on reshaping our branch network. Two of our most visible strategic changes were the purchase of 14 branches in key growth markets and the divestiture of five branches in Franklin County, which was completed on October 4, 2013. This allows us to focus on the growth of the core franchise along the Maine coast and expand our footprint into Maine’s economic corridor along Interstate 95. We have also made strategic investments into our self-service channel and operation systems. We upgraded our ATM network in key markets with self-serve or ‘‘Smart ATMs’’, and introduced the ability to open accounts online through our website. We also executed several significant operational projects to improve our support infrastructure, which will enhance our efficiency while at the same time position us to grow in the future. Due to the fast pace of change during the past year, it is challenging to make comparisons from one time period to another until we reach a ‘‘run-rate’’ of activity. When looking at our trends, over the past several quarters we are pleased with how we are absorbing our new branches and their impact on our organization. For the third quarter of 2013, we reported net income of $6.4 million or $0.83 per diluted share compared to $6.3 million or $0.82, respectively, recorded in the third quarter of 2012. These results reflect the loan growth generated in our expanded markets which will continue to increase as those branches continue to ramp-up to their full potential. The third quarter results also reflect the continued decline in our net interest margin that results from the low interest rate environment which is due, in part, to the government’s intervention in the financial markets. Camden National’s efficiency ratio, which reflects how much expense we incur to earn a dollar of revenue, was at 61.3% during the third quarter of 2013 compared to 55.1% a year ago. This is higher than we typically report and reflects the costs associated with the newly acquired branch network. Credit quality continues to stabilize and show signs of improvement as annualized net charge offs to average loans were 0.20% for the first nine months of 2013 compared to 0.25% reported during the first nine months of 2012. One large loan relationship was placed on non-accrual status during the third quarter which increased our non-performing assets to total assets ratio to 1.24% compared to 1.06% reported a year ago. This is a reminder that our economic recovery remains uneven and not all businesses are recovering equally as well. With our allowance for credit losses at 1.43% at September 30, 2013, we believe we are appropriately reserved for losses within our loan portfolio. The Board of Directors approved a $0.27 dividend for the third quarter and approved a common stock repurchase program. We view both dividends and stock repurchases as important tools to provide shareholder return to our owners. Thank you for your continued support. Sincerely, Gregory A. Dufour President and Chief Executive Officer CamdenNational.com | 800-860-8821

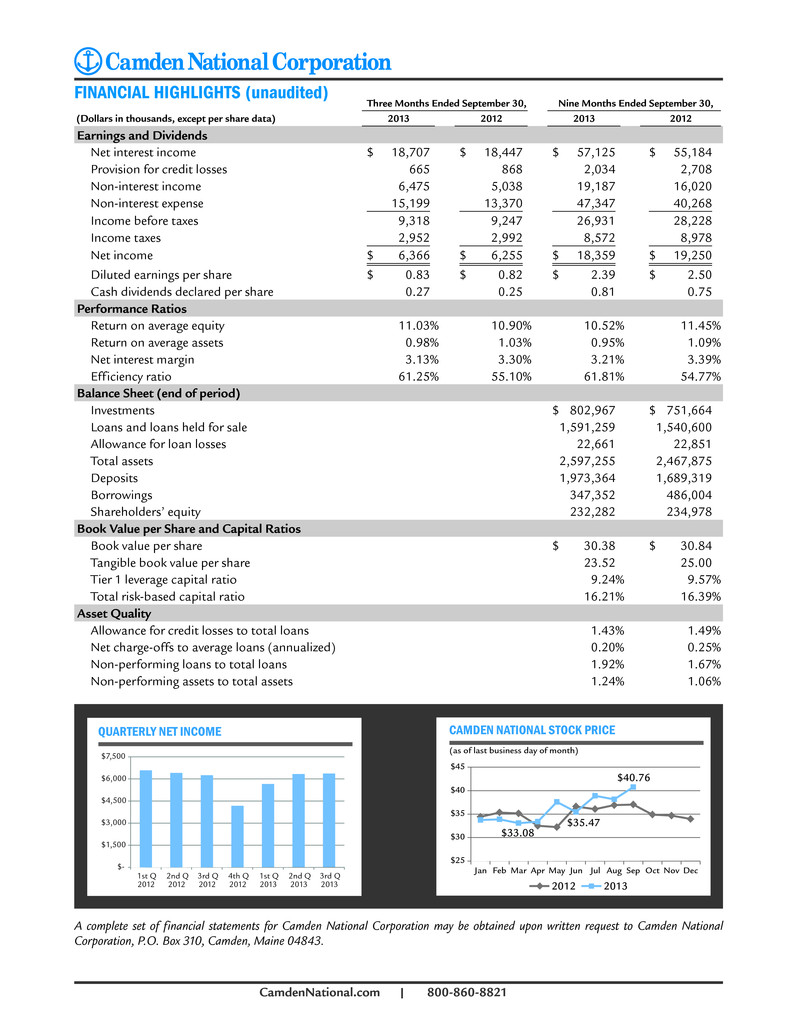
FINANCIAL HIGHLIGHTS (unaudited) Three Months Ended September 30, Nine Months Ended September 30, (Dollars in thousands, except per share data) 2013 2012 2013 2012 Earnings and Dividends Net interest income $ 18,707 $ 18,447 $ 57,125 $ 55,184 Provision for credit losses 665 868 2,034 2,708 Non-interest income 6,475 5,038 19,187 16,020 Non-interest expense 15,199 13,370 47,347 40,268 Income before taxes 9,318 9,247 26,931 28,228 Income taxes 2,952 2,992 8,572 8,978 Net income $ 6,366 $ 6,255 $ 18,359 $ 19,250 Diluted earnings per share $ 0.83 $ 0.82 $ 2.39 $ 2.50 Cash dividends declared per share 0.27 0.25 0.81 0.75 Performance Ratios Return on average equity 11.03% 10.90% 10.52% 11.45% Return on average assets 0.98% 1.03% 0.95% 1.09% Net interest margin 3.13% 3.30% 3.21% 3.39% Efficiency ratio 61.25% 55.10% 61.81% 54.77% Balance Sheet (end of period) Investments $ 802,967 $ 751,664 Loans and loans held for sale 1,591,259 1,540,600 Allowance for loan losses 22,661 22,851 Total assets 2,597,255 2,467,875 Deposits 1,973,364 1,689,319 Borrowings 347,352 486,004 Shareholders’ equity 232,282 234,978 Book Value per Share and Capital Ratios Book value per share $ 30.38 $ 30.84 Tangible book value per share 23.52 25.00 Tier 1 leverage capital ratio 9.24% 9.57% Total risk-based capital ratio 16.21% 16.39% Asset Quality Allowance for credit losses to total loans 1.43% 1.49% Net charge-offs to average loans (annualized) 0.20% 0.25% Non-performing loans to total loans 1.92% 1.67% Non-performing assets to total assets 1.24% 1.06% $- $1,500 $3,000 $4,500 $6,000 $7,500 1st Q 2012 2nd Q 2012 3rd Q 2012 4th Q 2012 1st Q 2013 2nd Q 2013 3rd Q 2013 QUARTERLY NET INCOME CAMDEN NATIONAL STOCK PRICE Jan Feb Mar Apr May Jun Jul Aug Sep Oct Nov Dec $33.08 $35.47 $40.76 $25 $30 $35 $40 $45 (as of last business day of month) 2012 2013 A complete set of financial statements for Camden National Corporation may be obtained upon written request to Camden National Corporation, P.O. Box 310, Camden, Maine 04843. CamdenNational.com | 800-860-8821

